
2008 Canadian Cancer Statistics Questions about Cancer? 1888 939-3333
stat cover 2008:59835cover.qxd
1/29/2008
4:47 PM
Page 1
Canadian Cancer Statistics
Questions about Cancer?
2008
When you want to know more about cancer
call the Canadian Cancer Society's CANCER INFORMATION SERVICE
1888 939-3333
MONDAY TO FRIDAY : 9AM
– 6 PM
www.cancer.ca
PRODUCED BY:
DISTRIBUTED BY:
CANADIAN CANCER SOCIETY,
NATIONAL CANCER INSTITUTE OF CANADA,
STATISTICS CANADA, PROVINCIAL /
TERRITORIAL CANCER REGISTRIES,
113-225
PUBLIC HEALTH AGENCY OF CANADA
Steering Committee Members
Loraine Marrett (Chair), PhD
Division of Preventive Oncology, Cancer Care Ontario, Toronto, Ontario
Dagny Dryer, MD, FRCPC
PEI Cancer Treatment Centre and Cancer Registry, Charlottetown,
Prince Edward Island
Larry Ellison, MSc
Health Statistics Division, Statistics Canada, Ottawa, Ontario
Heather Logan, RN, BScN, MHSc, CHE
Canadian Cancer Society and National Cancer Institute of Canada, Toronto, Ontario
Les Mery, MSc
Centre for Chronic Disease Prevention and Control, Public Health Agency of Canada
Surveillance Action Group, Canadian Partnership Against Cancer, Ottawa, Ontario
Howard Morrison, PhD
Centre for Chronic Disease Prevention and Control, Public Health Agency of Canada,
Ottawa, Ontario
Brent Schacter, MD, FRCPC
Canadian Association of Provincial Cancer Agencies and CancerCare Manitoba,
Winnipeg, Manitoba
Analytic and Statistical Support
Lin Xie, MSc (Statistics), MSc (MIS)
Centre for Chronic Disease Prevention and Control, Public Health Agency of Canada,
Ottawa, Ontario
Robert Semenciw, MSc
Centre for Chronic Disease Prevention and Control, Public Health Agency of Canada,
Ottawa, Ontario
Citation: Material appearing in this report may be reproduced or copied without permission;
however, the following citation to indicate the source must be used:
“Canadian Cancer Society/National Cancer Institute of Canada: Canadian Cancer Statistics
2008, Toronto, Canada, 2008.”
April 2008, ISSN 0835-2976
This report is also available at www.cancer.ca/statistics and www.ncic.cancer.ca
The development of this publication over the years has benefited considerably from the
comments and suggestions of readers. The Steering Committee appreciates and welcomes such
comments. To be included on the distribution mailing list for next year’s publication or offer
ideas on how the report can be improved please complete the Evaluation and Order Form or
email [email protected].
Additional copies may be requested from Divisions of the Canadian Cancer Society or by
calling Cancer Information Service 1 888 939-3333 (see For Further Information).
La version française de cette publication est disponible sur demande.
HIGHLIGHTS
Estimates for Cancer Incidence and Mortality
N
An estimated 166,400 new cases of cancer and 73,800 deaths from cancer will
occur in Canada in 2008.
N
Three types of cancer account for the majority of new cases in each sex: prostate,
lung and colorectal in males and breast, lung and colorectal in females.
N
Lung cancer remains the leading cause of cancer death for both men and women.
N
Overall, colorectal cancer is the second leading cause of death from cancer.
Geographic Patterns of Cancer Occurrence
N
Generally, both incidence and mortality rates are higher in Atlantic Canada and
Quebec and lowest in British Columbia.
N
Incidence rates among both sexes and mortality rates among females are relatively
high in Manitoba.
N
Generally, incidence and mortality rates in Ontario are lower than the national
average.
N
Lung cancer incidence and mortality rates continue to be higher in Quebec
and New Brunswick (with the exception of mortality among females in
New Brunswick) and lower in British Columbia.
Trends in Incidence and Mortality
N
The increased number of new cases of cancer, exclusive of non-melanoma skin
cancers, is primarily due to a growing and aging population.
N
Between 1995 and 2004, incidence rates rose by more than 5% per year for thyroid
cancer in both sexes.
N
Liver cancer in males rose by more than 2% per year in the same time frame.
N
Between 1995 and 2004, incidence rates declined by 2% or more per year for lung
cancer in males (since 1999), stomach and larynx cancers in both sexes and for
females, brain cancer (since 2000) and cervical cancer.
N
Excluding lung cancer, cancer mortality rates have dropped by 20% in women
since 1979.
Age and Sex Distribution of Cancer
N
42% of new cancer cases and 60% of deaths due to cancer occur among those who
are at least 70 years old.
N
30% of new cancer cases and 18% of cancer deaths will occur in young and
middle-aged adults ages 20-59 in their most productive stage of life.
N
Cancer incidence is rising in young women ages 20-39.
N
Mortality is declining for males at all ages and for females under 70. Declines are
most rapid in children and adolescents (ages 0-19).
Canadian Cancer Society/National Cancer Institute of Canada: Canadian Cancer Statistics 2008
1
HIGHLIGHTS
Probability of Developing/Dying from Cancer
N
On the basis of current incidence rates, almost 40% of Canadian women and almost
45% of men will develop cancer during their lifetimes.
N
On the basis of current mortality rates, 24% of women and almost 29% of men, or
approximately 1 out of every 4 Canadians, will die from cancer.
Prevalence
N
In 2004, 2.5% of Canadian men and 2.8% of Canadian women had a diagnosis of
cancer in the previous 15 years.
N
1.0% of the female population are survivors of breast cancer, and 0.8% of the male
population are survivors of prostate cancer, diagnosed within the previous 15 years.
Five-year Relative Cancer Survival
N
Relative survival ratios were highest for thyroid, testicular, prostate cancer, and
melanoma.
N
Relative survival ratios were lowest for pancreatic, esophageal, lung, and liver
cancer.
N
Relative survival for lung cancer tends to decline with increasing age.
Childhood Cancer (Ages 0-14)
N
Approximately 850 Canadian children aged 0-14 develop cancer each year, but due
to the successful treatment of the most common cancers, the number of deaths is
one-sixth the number of cases.
N
While the cancer incidence rate in children has been relatively constant since 1985,
the cancer mortality rate continues to decline.
N
Although childhood cancer is rare, it remains of significant public health
importance.
N
The dramatic improvement in childhood cancer survival has been ascribed to
several factors: better diagnostic procedures, the development of multi-modal
therapies, and the centralization of care and support services.
N
In Canada, nearly 80% of children with cancer are either enrolled in a clinical trial
or treated according to a registered protocol established by a clinical trial.
N
Improving survival in childhood cancer (now at 82%), places increasing need for
long term follow-up of late effects.
2
Canadian Cancer Society/National Cancer Institute of Canada: Canadian Cancer Statistics 2008
ABOUT THIS PUBLICATION
T
his publication, which is part of an annual series that began in 1987, has been
developed by members of the Canadian Cancer Statistics Steering Committee,
supported by the National Cancer Institute of Canada. The Steering Committee is
responsible for developing content, reviewing statistical information, interpreting the
data and writing the text. The Steering Committee includes representatives of the
National Cancer Institute of Canada, the Canadian Cancer Society, Public Health
Agency of Canada (PHAC), Statistics Canada, the Canadian Council of Cancer
Registries, the Canadian Association of Provincial Cancer Agencies, as well as
university-based and provincial/territorial cancer agency researchers. Information
about the purpose, preparation, production and distribution of this publication, which
is possible only because of collaboration amongst the organizations represented on the
Steering Committee, is noted below.
Purpose and intended audiences
The main purpose of this annual publication is to provide detailed information
regarding incidence and mortality of the most common types of cancer by age, sex,
time period and province/territory for health professionals, researchers and policy
makers. These data may stimulate new research and assist decision-making and
priority-setting processes at the individual, community, provincial/territorial and
national levels. This report is also used by educators, the media and members of the
public with an interest in cancer.
Data Sources (for additional information see Appendix II: Methods)
The Canadian Cancer Registry (CCR), National Cancer Incidence Reporting System
(NCIRS) and mortality data files are maintained in Health Statistics Division,
Statistics Canada. A description of these primary data sources and how they are used
follows. Statistics Canada also provides the population counts and estimates and life
tables needed to calculate a number of the measures used in this publication.
Incidence
N
Incidence data collected by provincial and territorial cancer registries are reported
to the CCR, beginning with cases diagnosed in 1992. The CCR is regularly
updated; it is internally linked to track patients with tumours diagnosed in more
than one province/territory, and its records are linked to death certificates, which
reduces duplication to a negligible rate. The CCR evolved from the National
Cancer Incidence Reporting System, which contains incidence data from 1969 to
1991.
N
Cancers included in this report are defined according to the groupings listed in the
Glossary: Cancer Definitions unless otherwise noted.
N
Although every effort is made by the Canadian Council of Cancer Registries and its
Standing Committee on Data Quality to achieve uniformity in defining and
classifying new cases, reporting procedures and completeness still vary across the
country. The standardization of case-finding procedures, including linkage to
provincial/territorial mortality files, has improved the registration of cancer cases
and the data have become more comparable across the country.
N
The following have been excluded from most or all of the tables and figures in this
publication:
Canadian Cancer Society/National Cancer Institute of Canada: Canadian Cancer Statistics 2008
3
ABOUT THIS PUBLICATION
¡
Non-melanoma skin cancers (basal cell and squamous cell carcinomas): Most
provincial/territorial cancer registries do not collect non-melanoma skin cancer
incidence data. Though these cancers are common, they are difficult to register
completely because they are often treated successfully in a doctor’s office and
generally do not require hospitalization. As a result, estimates for the country as
a whole, which are based on data provided by the B.C. Cancer Agency,
CancerCare Manitoba and the Department of Health, New Brunswick, are
shown only in Table 1. A change in the method of estimating the incidence of
non-melanoma skin cancer was introduced in the 2006 publication, so
comparisons with years prior to this change should be made with caution.
¡
Benign tumours and carcinomas in situ (except for in situ carcinomas of the
bladder) are excluded from all counts.
Mortality
N
Cancer mortality statistics are derived from death records maintained by the
provincial/territorial registrars of vital statistics for people residing in that province
or territory at the time of death.
N
Cancer deaths are those attributed to some form of cancer as the underlying cause
of death by the certifying physician.
N
Although procedures for registering and allocating cause of death have been
standardized both nationally and internationally, some lack of specificity and
uniformity is inevitable. The description of the type of cancer provided on the death
certificate is usually less accurate than that obtained by the cancer registries from
hospital and pathology records.
Actual and Estimated Data
It is important to emphasize that the information provided in this publication includes
both actual and estimated data:
N
Incidence data for 2005 were not available from the province of Quebec because
their data were not submitted to the CCR in a timely manner; the corresponding
data from the provinces of Manitoba and Alberta were deemed too provisional for
use in this publication. Incidence data for the period 2006-2008 (as well as 2005
for Quebec, Manitoba and Alberta) are estimated.
N
For 2003 and 2004 Ontario “death certificate only” cases (the only source of
information about the case was a death certificate), numbers were obtained directly
from the Ontario Cancer Registry as these were not available in the CCR for the
June 2007 release. Ontario 2005 actual incidence data as received did not include
death certificate only (DCO) cases. As a result, estimated numbers of DCO cases,
based on 2004 data, were added to actual numbers for purposes of projections.
N
Actual mortality data to 2004 are available for all provinces/territories and are
estimated for the period 2005-2008.
N
Incidence and mortality data for years beyond the last year of actual data, are
estimated by projecting forward, based on long term trends in incidence rates (since
1986 for all cancers except prostate cancer, where the trend from 1991 is used) and
projected populations. This means that a recent major change in long-term trend
may not be reflected in projected rates.
4
Canadian Cancer Society/National Cancer Institute of Canada: Canadian Cancer Statistics 2008
ABOUT THIS PUBLICATION
Review and Analysis
N
The Chronic Disease Surveillance Division, Centre for Chronic Disease Prevention
and Control (CCDPC), PHAC, conducted the data analysis for most of the sections.
Chris Waters provided technical and analytical support. Tables and figures were
updated by Bob McRae.
N
Provincial and territorial cancer registries reviewed the cancer estimates for
incidence and mortality data for their own jurisdictions before publication in this
report (the results of their input are noted in Table A7).
N
The French translation of this publication was reviewed by Michel Beaupré of the
Fichier des tumeurs du Québec and Jean-Marc Daigle of the Institut National de
Santé Publique du Québec.
Special Topic
N
This year’s Special Topic is Childhood Cancer (Ages 0 to 14). Comments on early
drafts were provided by the following external reviewers:
¡
Members of The Council of Canadian Pediatric Hematology/Oncology Directors,
now known as the C17 Council, including Dr. Mark Bernstein, Dr. Paul Grundy,
Dr. Lawrence Jardin, Dr. Rod Rassekh, Dr. Paul Rogers, and Dr. Yvan Samson;
and Dr. Rod Rassekh and Louise Parker PhD.
¡
Ms. Kathy Brodeur-Robb of the C17 Research Network.
N
Ms. Amanda Shaw of the Public Health Agency of Canada, assisted with the
writing of the late effects summary, reviewed this section and provided helpful
comments.
N
For a complete list of previous special topics please refer to Appendix III.
N
Copies of previous years’ special topics are available online (1997 to 2008) or in
hard copy form on request (write to [email protected]).
Production and distribution
The National Cancer Institute of Canada and Canadian Cancer Society supports the
production, printing and distribution of this publication, with charitable funds
collected by the Canadian Cancer Society. Candice Anderson and Monika Dixon
coordinated the process, and provided administrative support from initial planning to
the distribution of the publication.
How to access the contents of this publication
Electronic copies of this publication in English and French and some additional
statistical information not included in this publication are available in PDF format on
the Canadian Cancer Society’s website www.cancer.ca/statistics. PowerPoint versions
of the figures from the 2008 publication are also available at www.cancer.ca/statistics.
This material may be used without permission; please refer to the front of the
publication for proper citation information.
Individuals who require additional information can refer to the section entitled
For Further Information.
Canadian Cancer Society/National Cancer Institute of Canada: Canadian Cancer Statistics 2008
5
TABLE OF CONTENTS
Page
Estimates for Cancer Incidence and Mortality
11
Geographic Patterns of Cancer Occurrence
15
Trends in Incidence and Mortality
22
Age and Sex Distribution of Cancer
43
Probability of Developing/Dying from Cancer
50
Prevalence
53
Five-year Relative Survival
55
Special Topic:
N
Childhood Cancer (Ages 0 to 14)
60
Glossary
75
Appendix I: Actual Data for New Cases and Deaths
79
Appendix II: Methods
86
Appendix III: Previous Special Topics
97
References
98
For Further Information
103
Evaluation and Order Form
107
Tables
1.
Estimated New Cases and Deaths for Cancers by Sex, Canada, 2008
12
2.
Estimated Population, New Cases and Deaths for All Cancers by Sex
and Geographic Region, Canada, 2008
17
Estimated New Cases for the Most Common Cancers by Sex and
Province, Canada, 2008
18
Estimated Age-Standardized Incidence Rates for the Most Common
Cancers by Sex and Province, Canada, 2008
19
Estimated Deaths for the Most Common Cancers by Sex and Province,
Canada, 2008
20
Estimated Age-Standardized Mortality Rates for the Most Common
Cancers by Sex and Province, Canada, 2008
21
Age-Standardized Incidence Rates for Selected Cancers, Males,
Canada, 1979-2008
38
Age-Standardized Mortality Rates for Selected Cancers, Males,
Canada, 1979-2008
39
Age-Standardized Incidence Rates for Selected Cancers, Females,
Canada, 1979-2008
40
3.
4.
5.
6.
7.1
7.2
8.1
Canadian Cancer Society/National Cancer Institute of Canada: Canadian Cancer Statistics 2008
7
TABLE OF CONTENTS
8.2
Age-Standardized Mortality Rates for Selected Cancers, Females,
Canada, 1979-2008
41
Average Annual Percent Change (AAPC) in Age-Standardized Incidence
and Mortality Rates, for Selected Cancers, Canada, 1995-2004
42
Distribution by Age Group and Sex, for All Cancers Combined,
Canada, 2008
45
11.
Distribution by Age Group and Sex, for Selected Cancers, Canada, 2008
46
12.
Lifetime Probability of Developing or Dying from Cancer and
the Probability of Developing Cancer by Age, Canada
51
13.
Estimated Cancer Prevalence by Sex, Canada, 2004
54
14.
Estimated Five-year Relative Survival Ratio (%) (and 95% Confidence
Interval) for the Most Common Cancers by Sex, Canada excluding
Quebec, 2001-2003
57
Estimated Age-Standardized Five-year Relative Survival Ratio (%)
(and 95% Confidence Interval) Both Sexes Combined by Province for
Selected Cancers, 2001-2003
58
Estimated Five-year Relative Survival Ratio (%) (and 95% Confidence
Interval) by Age Group for Selected Cancers, Canada excluding Quebec,
2001-2003
58
New Cases and Deaths and Average Annual Age-Standardized Cancer
Incidence and Mortality Rates by Diagnostic Group, Ages 0-14,
Canada, 2000-2004
66
Age-specific Average Annual Incidence Rates by Diagnostic Group,
Canada, 2000-2004
68
Average Annual Incidence Rates by Sex and Diagnostic Group,
Ages 0-14, Canada, 2000-2004
69
Percentage of Patients with Metastasis Present at Time of Diagnosis
by Cancer, Ages 0-14, Canada, 1995-2000
71
Observed Survival Proportion (OSP) estimates (%) (and 95% Confidence
Intervals (CI)) by Diagnostic Group and Survival Duration, Ages 0-14,
Canada excluding Quebec, 1999-2003
73
22.
Significant Advances in the History of Childhood Cancer Research
74
23.
Pediatric Oncology Centres in Canada
74
9.
10.
15.
16.
17.
18.
19.
20.
21.
8
Canadian Cancer Society/National Cancer Institute of Canada: Canadian Cancer Statistics 2008
TABLE OF CONTENTS
Figures
1.1
1.2
2.1
2.2
3.1
3.2
4.
5.1
5.2
6.1
6.2
7.
8.
9.
10.
11.
12.
Percentage Distribution of Estimated New Cases and Deaths for
Selected Cancers, Males, Canada, 2008
13
Percentage Distribution of Estimated New Cases and Deaths for
Selected Cancers, Females, Canada, 2008
14
New Cases and Age-Standardized Incidence Rates (ASIR) for
All Cancers, Canada, 1979-2008
28
Deaths and Age-Standardized Mortality Rates (ASMR) for All Cancers,
Canada, 1979-2008
29
Trends in New Cases and Deaths, Attributed to Cancer Rate, Population
Growth, and Population Age Distribution, All Cancers, All Ages,
Males, Canada, 1979-2008
30
Trends in New Cases and Deaths, Attributed to Cancer Rate, Population
Growth, and Population Age Distribution, All Cancers, All Ages,
Females, Canada, 1979- 2008
31
Relative Change in Age-Standardized Mortality Rates Including and
Excluding Lung Cancer, Canada, 1979-2008
33
Age-Standardized Incidence Rates (ASIR) for Selected Cancers,
Males, Canada, 1979-2008
34
Age-Standardized Mortality Rates (ASMR) for Selected Cancers,
Males, Canada, 1979-2008
35
Age-Standardized Incidence Rates (ASIR) for Selected Cancers,
Females, Canada, 1979-2008
36
Age-Standardized Mortality Rates (ASMR) for Selected Cancers,
Females, Canada, 1979-2008
37
Age-Specific Incidence and Mortality Rates for All Cancers by Sex,
Canada, 2004
47
Age-Standardized Incidence and Mortality Rates by Age Group,
All Cancers, Canada, 1979-2008
48
Estimated Five-year Relative Survival Ratio (%) for the Most Common
Cancers, Both Sexes Combined, Canada excluding Quebec, 2001-2003
59
Age-Standardized Incidence and Mortality Rates for Selected Cancers
for Children and Youth Ages 0-14, Canada, 1985-2008
67
Median Time Between Consecutive Events to Diagnosis and Initiation of
Treatment by Age Group, Canada, 1995-2000
70
Percent Distribution of Initial Treatment by Cancer Type, Children
Ages 0-14, Canada, 1995-2000
72
Canadian Cancer Society/National Cancer Institute of Canada: Canadian Cancer Statistics 2008
9
TABLE OF CONTENTS
Tables in Appendix I
A1.
Actual Data for New Cases of Cancer, Canada, 2004
80
A2.
Actual Data for Cancer Deaths, Canada, 2004
81
A3.
Actual Data for New Cases for the Most Common Cancers by Sex and
Geographic Region, Most Recent Year, Canada
82
Actual Age-Standardized Incidence Rates for the Most Common Cancers
by Sex and Geographic Region, Most Recent Year, Canada
83
Actual Data for Deaths for the Most Common Cancers by Sex and
Geographic Region, Canada, 2004
84
Actual Age-Standardized Mortality Rates for the Most Common Cancers
by Sex and Geographic Region, Canada, 2004
85
Use of Five-Year Average Method for Projection by Cancer
95
A4.
A5.
A6.
A7.
10
Canadian Cancer Society/National Cancer Institute of Canada: Canadian Cancer Statistics 2008
ESTIMATES FOR CANCER INCIDENCE AND MORTALITY
T
he importance of different types of cancer in Canada in 2008 can be measured in
two ways, as shown in Table 1. Incidence is expressed as the number of new cases
of a given type of cancer diagnosed per year. Mortality is expressed as the number of
deaths attributed to a particular type of cancer during the year.
An estimated 166,400 new cases of cancer and 73,800 deaths from cancer will occur
in Canada in 2008. Men outnumber women for both new cases and deaths, by 9.6%
for incidence and 11% for mortality (Table 1).
A change in this year’s publication is the addition of the estimated number of nonmelanoma skin cancers (basal cell and squamous cell carcinomas) to Table 1. These
cancers comprise 73,000 cases in total and 260 deaths. They have been included in the
table for completeness because they represent the most common form of cancer,
although they account for very few deaths.
Not counting non-melanoma skin cancers, three types of cancer account for at least
55% of new cases in each sex: prostate, lung, and colorectal cancers in males, and
breast, lung, and colorectal cancers in females. Twenty-eight percent of cancer deaths
in men and 26% in women are due to lung cancer alone (Figures 1.1 and 1.2).
In Canadian women, lung cancer will continue as the leading cause of cancer death in
2008, increasing to an estimated 9,200 deaths, compared with the 5,300 deaths
expected for breast cancer. This reflects the rapid increase in lung cancer mortality
rates among women over the past three decades, while age-standardized breast cancer
mortality rates declined slightly. Lung cancer incidence among women also continues
to rise. With an estimated 11,300 new cases, lung cancer is the second leading type of
cancer in women, ahead of the 9,700 new cases expected for colorectal cancer, which
ranks third. Breast cancer continues to lead in incidence among Canadian women;
22,400 new cases represent twice as many new cases as lung cancer.
In Canadian men in 2008, prostate cancer will continue as the leading type of cancer,
with an estimated 24,700 newly diagnosed cases, compared with 12,600 lung cancers.
Prostate cancer estimates are higher than in previous years’ publications because
most provinces have opted to use projections based on modeling rather than
averaging (see Appendix II: Methods for further details). Lung cancer will remain the
leading cause of cancer death in Canadian men in 2008; the estimated 11,000 lung
cancer deaths far exceed the 4,800 deaths due to colorectal cancer, the second leading
cause of cancer death in men. Prostate cancer is third in mortality, causing 4,300
deaths.
Comparisons to previous editions of Canadian Cancer Statistics should be made with
caution because of changes in cancer definitions over the years. In particular, definitions
for kidney and lung cancer as well as leukemia, and multiple myeloma have changed
in this edition (see Appendix II: Methods for further details).
The total number of lung cancer cases (men and women combined) is
similar to the number of either prostate or breast cancer cases; lung
cancer remains by far the leading cause of death from cancer.
Canadian Cancer Society/National Cancer Institute of Canada: Canadian Cancer Statistics 2008
11
ESTIMATES FOR CANCER INCIDENCE AND MORTALITY
Table 1
Estimated New Cases and Deaths for Cancers by Sex, Canada, 2008
New Cases
2008 Estimates
All Cancers
Deaths
2008 Estimates
Total
M
F
Total
M
F
166,400
87,000
79,400
73,800
38,800
35,000
Prostate1
24,700
24,700
–
4,300
4,300
–
Lung*
23,900
12,600
11,300
20,200
11,000
9,200
Breast
22,600
170
22,400
5,400
50
5,300
Colorectal
21,500
11,800
9,700
8,900
4,800
4,100
Non-Hodgkin Lymphoma
7,000
3,800
3,200
3,100
1,700
1,400
Bladder2
6,700
5,100
1,700
1,800
1,250
530
Melanoma
4,600
2,500
2,100
910
560
350
Leukemia*
4,500
2,600
1,850
2,400
1,400
1,000
Kidney*
4,400
2,700
1,750
1,600
1,000
600
Thyroid
4,300
890
3,400
180
65
110
Body of Uterus
4,200
–
4,200
790
–
790
Pancreas
3,800
1,800
1,950
3,700
1,800
1,950
Oral
3,400
2,300
1,100
1,150
760
380
Stomach
2,900
1,850
1,000
1,850
1,150
720
Brain
2,600
1,450
1,100
1,750
1,000
740
Ovary
2,500
–
2,500
1,700
–
1,700
Multiple Myeloma*
2,100
1,150
960
1,350
730
630
Esophagus
1,600
1,200
410
1,750
1,300
430
Liver
1,550
1,200
380
680
520
150
Cervix
1,300
–
1,300
380
–
380
Larynx
1,200
1,000
220
530
440
90
Hodgkin Lymphoma
890
480
410
110
60
50
Testis
890
890
–
30
30
–
All Other Cancers
13,500
7,100
6,400
9,300
4,900
4,400
Non-melanoma Skin
73,000
40,000
33,000
260
160
100
– Not applicable
* Caution is needed if the 2008 estimates are compared to previously published estimates as definitions for
these cancers have changed.
1 Prostate cancer estimates are higher than in previous years’ publications because most provinces have
opted to use projections based on modeling rather than averaging.
2 The substantial increase in incidence of bladder cancer as compared with previous years reflects the decision
to include in situ carcinomas (excluding Ontario) as of the 2006 edition of Canadian Cancer Statistics. See
Table A3 for in situ bladder cancer in Ontario.
Note:
‘All Cancers’ excludes the estimated new cases of non-melanoma skin cancer (basal and squamous)
but includes the estimated 260 deaths with underlying cause of other malignant neoplasms of skin
(ICD-10 code C44). Total of rounded numbers may not equal rounded total number. Please refer to
Appendix II: Methods for further details.
Source: Chronic Disease Surveillance Division, CCDPC, Public Health Agency of Canada
12
Canadian Cancer Society/National Cancer Institute of Canada: Canadian Cancer Statistics 2008
ESTIMATES FOR CANCER INCIDENCE AND MORTALITY
Figure 1.1
Percentage Distribution of Estimated New Cases and Deaths for
Selected Cancers, Males, Canada, 2008
Type of Cancer
Prostate
Lung
Colorectal
Bladder
Non-Hodgkin Lymphoma
Kidney
Leukemia
Melanoma
Oral
Stomach
Pancreas
Brain
Liver
Esophagus
Multiple Myeloma
Larynx
Testis
Thyroid
Hodgkin Lymphoma
All Other Cancers
28.4
14.4
13.5
5.8
4.4
3.1
3.0
2.9
2.6
2.1
2.1
1.7
New Cases
N = 87,000
1.4
1.4
1.3
1.2
1.0
1.0
0.6
8.2
0
Type of Cancer
Lung
Colorectal
Prostate
Pancreas
Non-Hodgkin Lymphoma
Leukemia
Esophagus
Bladder
Stomach
Brain
Kidney
Oral
Multiple Myeloma
Melanoma
Liver
Larynx
Thyroid
Hodgkin Lymphoma
Breast
Testis
All Other Cancers
5
10
15
20
25
30
35
28.4
12.4
11.0
4.6
4.3
3.6
3.4
3.3
2.9
2.6
2.6
2.0
1.9
1.4
1.3
1.1
0.2
0.2
0.1
0.1
Deaths
N = 38,800
12.7
0
5
10
15
20
25
30
35
Percentage
Note:
Incidence figures exclude an estimated 73,000 new cases of non-melanoma skin cancer (basal cell and
squamous cell) among both sexes combined. Mortality figures for ‘All Other Cancers’ include about
260 deaths with underlying cause ‘other malignant neoplasms’ of skin among both sexes combined.
Source: Chronic Disease Surveillance Division, CCDPC, Public Health Agency of Canada
Canadian Cancer Society/National Cancer Institute of Canada: Canadian Cancer Statistics 2008
13
ESTIMATES FOR CANCER INCIDENCE AND MORTALITY
Figure 1.2
Percentage Distribution of Estimated New Cases and Deaths for Selected
Cancers, Females, Canada, 2008
Type of Cancer
Breast
Lung
Colorectal
Body of Uterus
Thyroid
Non-Hodgkin Lymphoma
Ovary
Melanoma
Pancreas
Leukemia
Kidney
Bladder
Cervix
Brain
Oral
Stomach
Multiple Myeloma
Esophagus
Hodgkin Lymphoma
Liver
Larynx
All Other Cancers
28.3
14.3
12.2
5.4
4.3
4.1
3.1
2.7
2.4
2.3
2.2
2.1
1.7
1.4
1.4
1.3
1.2
0.5
0.5
0.5
0.3
New Cases
N = 79,400
8.1
0
Type of Cancer
Lung
Breast
Colorectal
Pancreas
Ovary
Non-Hodgkin Lymphoma
Leukemia
Body of Uterus
Brain
Stomach
Multiple Myeloma
Kidney
Bladder
Esophagus
Oral
Cervix
Melanoma
Liver
Thyroid
Larynx
Hodgkin Lymphoma
All Other Cancers
5
10
15
20
25
30
35
26.3
15.2
11.6
5.6
4.9
4.0
2.9
2.3
2.1
2.1
1.8
1.7
1.5
1.2
1.1
1.1
1.0
0.4
0.3
0.3
0.1
Deaths
N = 35,000
12.5
0
5
10
15
20
25
30
35
Percentage
Note:
Incidence figures exclude an estimated 73,000 new cases of non-melanoma skin cancer (basal cell and
squamous cell) among both sexes combined. Mortality figures for ‘All Other Cancers’ include about
260 deaths with underlying cause ‘other malignant neoplasms’ of skin among both sexes combined.
Source: Chronic Disease Surveillance Division, CCDPC, Public Health Agency of Canada
14
Canadian Cancer Society/National Cancer Institute of Canada: Canadian Cancer Statistics 2008
GEOGRAPHIC PATTERNS OF CANCER OCCURRENCE
T
able 2 presents population projections and estimates of new cases and deaths for
all cancers combined, by sex and province/territory for 2008. Tables 3 and 4
present estimates of the number of new cases and the age-standardized incidence rates
for each of the most common cancers, by sex and province/territory for 2008. The
corresponding estimates of the number of deaths and the age-standardized mortality
rates are presented in Tables 5 and 6. Tables A3 to A6 in Appendix I provide the most
recent actual numbers and corresponding rates.
The use of age-standardization adjusts for differences in age distributions among the
provinces and territories, allowing for interprovincial comparisons. The calculation of
these rates, using the 1991 Canadian population as the standard, is described in the
Glossary, and in more detail in Appendix II: Methods.
Incidence rates for all cancers combined are generally higher in Atlantic Canada and
Quebec, and are lowest in British Columbia (after excluding prostate cancer, which
shows large provincial differences due to diversity in Prostate Specific Antigen (PSA)
screening, and discounting the effects of undercounting in Newfoundland and
Labrador) (Table 4). Overall incidence rates are, however, third highest in Manitoba
among males (excluding prostate cancer) and second highest among females. Lung
cancer incidence rates are highest in Quebec and New Brunswick and lowest among
men in British Columbia and among women in Saskatchewan. The highest colorectal
cancer incidence rates are seen among men in Newfoundland and Labrador and
among women in Prince Edward Island; the lowest are in British Columbia. Breast
cancer incidence rates appear to be reasonably consistent across the country.
Mortality rates for all cancers combined are higher in Atlantic Canada and Quebec,
and are lowest in British Columbia. An exception is seen in Manitoba where the
mortality rate among females is surpassed only by that of Nova Scotia (Table 6).
Among males, the lung cancer mortality rate is highest in Quebec and lowest in
British Columbia; among females the rate is highest in Nova Scotia and lowest in
Saskatchewan. It is interesting to note that while the mortality rate due to lung cancer
in New Brunswick among men is second highest, among women it is second lowest.
Given that female lung cancer incidence rates in Canada are currently highest in New
Brunswick, it is quite likely that there will be an increase in the corresponding
mortality rates in this province in the future. Colorectal cancer mortality rates are
approximately twice as high in Newfoundland and Labrador as they are in British
Columbia.
Interpretation
Canada is one of the few nations in the world with a population-based cancer registry
system that allows cancer patterns to be monitored for the entire Canadian population.
The provincial/territorial and national cancer registries are important resources that
enable the geographic comparison of rates of new cancer cases and deaths. This
results in valuable information that can be used for research, knowledge exchange,
and planning and decision-making at the provincial/territorial level. These data are
therefore of interest to researchers, health care workers, planners and policy-makers.
Interpretation of geographical differences should, however, be approached with
caution since there may be a number of possible alternative explanations.
Canadian Cancer Society/National Cancer Institute of Canada: Canadian Cancer Statistics 2008
15
GEOGRAPHIC PATTERNS OF CANCER OCCURRENCE
True differences in incidence or mortality rates between provinces/territories may be
due to any one of several factors including:
N
variation in the prevalence of cancer risk factors (e.g., higher historic smoking rates
in Quebec and Atlantic Canada are the likely cause of higher rates of lung cancer)
N
variation in early detection of cancer because of different rates of participation in
formal screening programs (e.g., mamographic screening for breast cancer) or in
screening procedures that are not programmatic (e.g., PSA testing for prostate
cancer), or because of differences in availability of diagnostic services
N
variation in access to and quality of treatment
However, in situations where variation in cancer rates and any of these factors agree,
one can not assume that the relationship is causal. Such a determination could only be
made after more detailed studies, involving individual people, are conducted. It is also
important to note that for many cancers there is a long interval between exposure to a
risk factor and the occurrence of disease, and often the information on the prevalence
of risk factors from previous decades is inadequate. Where true differences in cancer
risk and causal associations are demonstrated in subsequent epidemiologic studies,
these findings can be used in planning cancer control programs that aim to reduce the
burden of cancer by targeting unmet needs.
Issues that should be kept in mind when interpreting interprovincial variations:
N
If the cancer is rare, the number of cases occurring annually in a given province/
territory may be so small that estimates may be unreliable and vary considerably
from one year to the next.
N
While the completeness of registration of new cancer cases is generally very good
across the country, there are exceptions. For example, death certificate information
has not been available for registry purposes in Newfoundland and Labrador and
this falsely lowers the number of newly diagnosed cases, mainly among those
cancers with a poor prognosis such as lung and pancreatic cancer (see Appendix II:
Data Sources and Processing). At the time of data collection, cases diagnosed only
through the use of death certificates were not reported to the Canadian Cancer
Registry by the province of Quebec. The degree to which death certificate
information is actively followed back to hospital records also varies in different
provinces/territories and this affects the accuracy of information on incidence data
(e.g., year of diagnosis). In Quebec, because of the registry’s dependence on
hospital data, the numbers of microscopically confirmed prostate, melanoma and
bladder cases have been estimated to be underreported by 32%, 35% and 14%
respectively.1
The large interprovincial differences seen in bladder cancer incidence rates are likely
due to differences in reporting of in situ cases, particularly in Ontario, where they are
not collected.
16
Canadian Cancer Society/National Cancer Institute of Canada: Canadian Cancer Statistics 2008
GEOGRAPHIC PATTERNS OF CANCER OCCURRENCE
Table 2
Estimated Population, New Cases and Deaths for All Cancers by Sex and
Geographic Region, Canada, 2008
Population (in thousands)
2008 Estimates1
Total
CANADA
M
F
33,095 16,386 16,709
New Cases
2008 Estimates2
Total
M
Deaths
2008 Estimates
F
166,400 87,000 79,400
Total
M
F
73,800 38,800 35,000
Newfoundland and
Labrador*
514
252
262
2,500
1,350
1,150
1,350
770
580
Prince Edward
Island
140
68
72
810
450
360
350
190
160
Nova Scotia
943
462
481
5,800
3,200
2,600
2,700
1,400
1,250
New Brunswick
755
372
382
4,300
2,300
2,000
1,950
1,050
890
7,725
3,816
3,909
42,100 21,500 20,500
19,700 10,500
9,300
12,961
6,397
6,563
63,000 32,700 30,300
27,400 14,200 13,100
1,195
594
601
6,100
3,100
3,000
2,800
1,450
1,350
987
490
497
5,000
2,700
2,300
2,400
1,300
1,100
Alberta
3,371
1,701
1,670
15,900
8,600
7,300
5,900
3,100
2,800
British Columbia
4,399
2,179
2,220
20,500 10,800
9,700
9,200
4,800
4,400
Yukon
31
16
15
110
60
50
60
35
25
Northwest Territories
45
23
22
100
50
55
60
30
25
Nunavut
31
16
15
65
35
35
40
20
20
Quebec*
Ontario
Manitoba
Saskatchewan
* An underestimate of the number of cases for some cancers for the years used to generate the 2008 estimates.
1 The 2008 population projections were provided by the Census and Demographics Branch, Statistics Canada.2
2 Figures exclude non-melanoma skin cancer (basal and squamous).
Note:
Total of rounded numbers may not equal rounded total number. Please refer to Appendix II: Methods.
Source: Chronic Disease Surveillance Division, CCDPC, Public Health Agency of Canada
Canada is one of the few nations in the world with a cancer
registry system that allows cancer patterns to be monitored
and compared across the entire population. Such comparisons
can provide valuable information for research, knowledge
exchange, planning and decision-making.
Canadian Cancer Society/National Cancer Institute of Canada: Canadian Cancer Statistics 2008
17
GEOGRAPHIC PATTERNS OF CANCER OCCURRENCE
Table 3
Estimated New Cases for the Most Common Cancers by Sex and
Province, Canada, 2008
Canada1
Males
All Cancers
Prostate
Lung
Colorectal
Bladder**
Non-Hodgkin
Lymphoma
Kidney
Leukemia
Melanoma
Oral
Stomach
Pancreas
Brain
Esophagus
Liver
Multiple Myeloma
Larynx
Females
All Cancers
Breast
Lung
Colorectal
Body of Uterus
Thyroid
Non-Hodgkin
Lymphoma
Ovary
Melanoma
Pancreas
Leukemia
Kidney
Bladder**
Cervix
Oral
Brain
Stomach
NL*
87,000 1,350
24,700
390
12,600
180
11,800
280
5,100
80
PE
NS
New Cases
NB
QC*
ON
MB
SK
AB
BC
450 3,200 2,300 21,500 32,700 3,100 2,700 8,600 10,800
150
900
620 4,400 10,500
680
890 3,100 2,900
65
500
410 4,200 4,100
440
350
950 1,400
55
440
280 3,100 4,300
440
380 1,000 1,450
25
200
150 1,650 1,300
200
170
470
750
3,800
45
15
110
100
880
1,500
150
120
340
540
2,700
2,600
2,500
2,300
1,850
1,800
1,450
1,200
1,200
1,150
1,000
45
20
40
45
50
10
30
15
10
10
25
15
15
15
10
5
10
5
5
–
10
5
110
70
100
85
60
60
45
50
15
30
30
85
60
70
60
50
55
35
35
10
30
30
760
610
320
630
470
540
390
260
310
300
380
920
1,050
1,150
850
700
600
530
450
460
480
330
120
110
70
100
70
75
50
35
35
40
25
85
100
70
55
50
55
35
30
15
30
25
250
300
230
180
150
160
130
110
130
90
60
270
320
420
280
240
250
190
170
190
140
90
79,400 1,150
22,400
360
11,300
130
9,700
200
4,200
65
3,400
40
360 2,600 2,000 20,500 30,300 3,000 2,300 7,300 9,700
95
690
550 5,900 8,500
780
620 2,100 2,700
50
360
340 3,400 4,000
410
290
980 1,400
60
380
240 2,500 3,700
380
300
750 1,200
20
140
95
960 1,700
200
120
400
540
5
55
90
670 1,850
75
55
310
210
3,200
40
10
95
80
770
1,300
120
90
280
420
2,500
2,100
1,950
1,850
1,750
1,700
1,300
1,100
1,100
1,000
25
40
5
15
30
30
20
15
15
25
10
15
10
5
5
10
10
5
5
5
70
95
65
55
75
65
55
35
35
30
60
55
55
40
60
50
35
20
25
25
640
270
540
460
480
540
280
270
300
270
1,000
970
670
720
640
470
500
430
440
380
100
60
75
85
75
65
45
50
40
35
65
60
60
65
50
55
40
30
35
25
180
210
180
190
150
150
180
95
90
95
290
320
270
220
170
250
160
150
130
120
– Fewer than 3 cases
** An underestimate of the number of cases for some cancers for the years used to generate the 2008 estimates.
** Interprovincial variation. Ontario does not currently report in situ bladder cases.
1 Canada totals include provincial and territorial estimates. Territories are not listed separately due to small
numbers.
Note:
Total of rounded numbers may not equal rounded total number. The Canada and provincial totals for
all cancers exclude non-melanoma skin cancer (basal and squamous). Caution is needed if the 2008
estimates are compared to previously published estimates. See Appendix II: Methods for further
details. Please see Appendix I for most current actual data or contact provincial cancer registries for
further information.
Source: Chronic Disease Surveillance Division, CCDPC, Public Health Agency of Canada
18
Canadian Cancer Society/National Cancer Institute of Canada: Canadian Cancer Statistics 2008
GEOGRAPHIC PATTERNS OF CANCER OCCURRENCE
Table 4
Estimated Age-Standardized Incidence Rates for the Most Common
Cancers by Sex and Province, Canada, 2008
Canada1
Males
All Cancers
Prostate
Lung
Colorectal
Bladder**
Non-Hodgkin
Lymphoma
Leukemia
Kidney
Melanoma
Oral
Stomach
Pancreas
Brain
Liver
Multiple Myeloma
Esophagus
Larynx
Females
All Cancers
Breast
Lung
Colorectal
Body of Uterus
Thyroid
Non-Hodgkin
Lymphoma
Ovary
Melanoma
Leukemia
Pancreas
Kidney
Bladder**
Cervix
Brain
Oral
Stomach
Rate per 100,000
NB QC*
ON
NL*
PE
NS
MB
SK
AB
BC
462
129
67
62
27
434
124
54
86
26
536
172
80
65
32
550
149
85
76
35
499
132
89
60
33
479
94
93
68
37
459
145
57
60
19
484
103
66
65
30
466
153
59
64
28
513
183
58
61
29
418
108
52
54
28
20
14
20
20
21
19
21
23
20
20
20
14
14
13
12
10
10
8
6
6
6
5
7
14
13
13
16
3
11
3
4
5
7
19
16
20
9
9
13
7
2
10
8
8
13
19
17
14
10
10
8
3
6
9
5
14
18
14
13
11
12
8
2
6
7
6
14
16
7
13
11
12
9
7
7
6
8
15
13
16
11
10
8
8
6
7
6
5
16
18
11
14
10
11
8
5
6
6
4
17
15
12
9
8
9
6
3
5
5
4
18
14
13
10
9
10
8
7
5
7
4
12
10
16
10
9
9
7
7
5
6
3
361
103
51
41
19
19
313
98
37
52
17
13
369
99
49
59
18
6
388
101
53
52
20
11
366
101
62
41
17
21
371
109
61
42
17
16
362
102
46
41
20
26
383
101
52
45
25
12
342
94
43
40
19
10
379
108
52
38
21
17
322
91
46
37
18
9
15
11
12
14
14
14
16
15
13
15
14
11
10
9
8
8
7
7
6
5
4
7
12
4
2
8
7
7
5
4
7
9
17
7
8
7
7
10
6
5
3
10
15
8
9
11
9
11
5
5
4
12
11
8
10
11
9
8
6
4
4
12
6
8
9
8
9
6
6
5
5
12
12
9
7
8
5
7
6
5
4
13
9
11
8
10
8
7
5
6
4
10
10
10
8
8
7
8
6
5
4
9
12
10
9
8
8
10
5
5
5
9
12
7
8
6
8
6
5
5
4
** An underestimate of the number of cases for some cancers for the years used to generate the 2008 estimates.
** Interprovincial variation. Ontario does not currently report in situ bladder cases.
1 Canada totals include provincial and territorial estimates. Territories are not listed separately due to small
numbers.
Note:
Rates exclude non-melanoma skin cancer (basal and squamous) and are adjusted to the age
distribution of the 1991 Canadian population. Caution is needed if the 2008 estimates are compared
to previously published estimates. See Appendix II: Methods for further details.
Source: Chronic Disease Surveillance Division, CCDPC, Public Health Agency of Canada
Canadian Cancer Society/National Cancer Institute of Canada: Canadian Cancer Statistics 2008
19
GEOGRAPHIC PATTERNS OF CANCER OCCURRENCE
Table 5
Estimated Deaths for the Most Common Cancers by Sex and Province,
Canada, 2008
Males
All Cancers
Lung
Colorectal
Prostate
Pancreas
Non-Hodgkin
Lymphoma
Leukemia
Esophagus
Bladder
Stomach
Brain
Kidney
Oral
Multiple Myeloma
Melanoma
Liver
Larynx
Females
All Cancers
Lung
Breast
Colorectal
Pancreas
Ovary
Non-Hodgkin
Lymphoma
Leukemia
Body of Uterus
Brain
Stomach
Kidney
Bladder
Oral
Cervix
Melanoma
Deaths
NB
QC
Canada1
NL
38,800
11,000
4,800
4,300
1,800
770
230
130
80
30
1,700
15
5
65
50
380
690
65
50
130
220
1,400
1,300
1,250
1,150
1,000
1,000
760
730
560
520
440
20
20
25
35
20
20
15
10
10
5
10
5
5
5
5
–
5
5
5
–
–
–
45
55
45
35
35
40
30
25
20
10
15
25
30
35
25
25
30
20
20
10
5
15
310
250
290
330
300
260
220
180
90
160
160
580
540
490
420
350
350
270
290
280
220
130
55
55
50
35
30
50
30
30
20
15
15
55
40
40
30
25
35
15
25
15
5
10
120
110
95
75
95
95
55
45
45
40
30
190
210
180
130
130
110
100
100
75
60
50
35,000
9,200
5,300
4,100
1,950
1,700
580
150
100
100
25
30
160 1,250
40
360
30
190
25
170
10
70
5
55
890
200
130
100
55
40
1,400
15
10
50
35
340
570
60
50
100
180
1,000
790
740
720
600
530
380
380
350
10
10
10
25
15
10
–
15
5
5
5
5
–
5
–
–
5
–
35
30
25
25
20
15
10
20
15
20
20
20
15
20
15
10
15
10
230
210
210
210
170
130
95
70
60
400
310
260
250
190
210
140
150
160
40
30
25
25
25
15
15
15
10
35
20
20
20
25
10
10
15
10
100
65
65
65
55
45
35
40
30
130
85
95
85
75
75
60
50
50
PE
NS
ON
MB
SK
AB
BC
190 1,400 1,050 10,500 14,200 1,450 1,300 3,100 4,800
60
440
360 3,600 3,600
350
320
780 1,250
25
190
120 1,300 1,750
200
160
360
570
25
140
130
870 1,650
180
230
430
560
5
70
55
460
640
65
60
140
250
9,300 13,100 1,350 1,100 2,800 4,400
2,700 3,300
300
230
760 1,150
1,350 2,000
220
160
430
640
1,100 1,500
160
130
290
470
510
710
70
55
170
270
370
680
75
55
150
240
– Fewer than 3 deaths
1 Canada totals include provincial and territorial estimates. Territories are not listed separately due to small
numbers.
Note:
Total of rounded numbers may not equal rounded total number. Caution is needed if the 2008
estimates are compared to previously published estimates. See Appendix II: Methods.
Source: Chronic Disease Surveillance Division, CCDPC, Public Health Agency of Canada
20
Canadian Cancer Society/National Cancer Institute of Canada: Canadian Cancer Statistics 2008
GEOGRAPHIC PATTERNS OF CANCER OCCURRENCE
Table 6
Estimated Age-Standardized Mortality Rates for the Most Common
Cancers by Sex and Province, Canada, 2008
Males
All Cancers
Lung
Colorectal
Prostate
Pancreas
Non-Hodgkin
Lymphoma
Leukemia
Esophagus
Bladder
Stomach
Brain
Kidney
Oral
Multiple Myeloma
Melanoma
Liver
Larynx
Females
All Cancers
Lung
Breast
Colorectal
Pancreas
Ovary
Non-Hodgkin
Lymphoma
Leukemia
Brain
Body of Uterus
Stomach
Kidney
Bladder
Cervix
Oral
Melanoma
Rate per 100,000
NB
QC
ON
Canada1
NL
PE
NS
209
59
26
24
9
252
75
41
29
10
227
75
31
33
9
245
76
33
25
12
234
79
25
29
11
236
81
29
21
10
9
5
8
11
11
8
7
7
6
5
5
4
4
3
3
2
6
6
9
12
6
7
4
4
2
2
3
8
8
6
8
2
8
5
5
3
1
3
8
9
8
6
6
7
5
4
4
1
3
147
40
22
16
8
7
152
40
27
26
7
9
154
41
27
23
8
6
6
4
4
4
3
3
2
2
2
2
2
3
4
3
7
3
2
4
0
1
MB
SK
AB
BC
200
51
25
23
9
213
53
30
26
9
216
53
26
35
10
191
49
22
28
9
178
46
21
20
9
8
10
10
8
8
8
6
6
7
6
5
6
4
4
2
1
3
7
5
7
7
7
6
5
4
2
4
4
8
7
7
6
5
5
4
4
4
3
2
9
8
7
5
5
8
4
4
3
3
2
9
6
7
5
5
6
3
4
2
1
2
7
7
6
5
5
6
3
3
3
2
2
7
8
7
5
5
4
4
4
3
2
2
169
50
25
21
9
8
151
35
21
16
9
7
155
48
23
17
8
6
145
37
22
16
8
8
155
37
25
17
8
9
145
33
21
15
7
8
143
40
21
14
8
8
134
37
20
13
8
8
7
7
6
6
6
7
7
5
5
4
4
3
1
3
1
3
2
1
5
4
4
3
2
2
3
2
2
3
4
4
2
4
2
3
1
1
4
4
3
3
3
2
1
2
1
4
3
3
3
2
2
2
2
2
5
3
3
2
3
1
2
2
1
5
4
3
3
3
1
2
1
1
5
4
3
3
3
2
2
2
1
4
3
3
2
2
2
2
2
2
1
Canada totals include provincial and territorial estimates. Territories are not listed separately due to small
numbers.
Note:
Rates adjusted to the age distribution of the 1991 Canadian population. Caution is needed if the 2008
estimates are compared to previously published estimates. See Appendix II: Methods for further details.
Source: Chronic Disease Surveillance Division, CCDPC, Public Health Agency of Canada
Canadian Cancer Society/National Cancer Institute of Canada: Canadian Cancer Statistics 2008
21
TRENDS IN INCIDENCE AND MORTALITY
T
rends in incidence and mortality for major types of cancer are assessed by
comparing annual age-standardized rates. The use of age-standardized rates
results in more meaningful comparisons over place and time because it adjusts for
variation in the age distributions of populations across geographic regions and over
time. Rates in this publication have been standardized to the 1991 Canadian
population.
Figures 2.1 and 2.2 present the number of new cases and deaths for Canadian men and
women, together with the corresponding age-standardized rates from 1979 to 2004
and estimates to the year 2008. Figures 3.1 and 3.2 show the relative contribution to
the change in the total number of new cases and deaths that can be attributed to changes
in cancer rates, population size and the aging of the population, while Figure 4 demonstrates the impact of changes in lung cancer mortality rates on overall cancer mortality
trends. Detailed depictions of the trends in annual rates for selected cancers over the
past 30 years are presented in Figures 5.1, 5.2 and 6.1 and 6.2 with the data points
provided in Tables 7.1, 7.2 and 8.1, 8.2. The average annual percent changes in
cancer-specific incidence and mortality rates between 1995 and 2004 are listed in
Table 9.
All Cancers Combined
The cancer mortality rate among men, after reaching a peak in 1988, is declining
slowly as a result of decreases in mortality rates for lung, colorectal and other cancers
(Figure 2.2, Table 7.2). In contrast, the cancer incidence rate rose in the early 1990s
and then declined sharply, following the trend in prostate cancer incidence during this
period. This has had the likely temporary effect of levelling off the gradual decline in
the overall cancer incidence rate due to declining lung cancer incidence. Note that
prostate cancer estimates for 2005 through 2008 are higher than those in previous
years’ of Canadian Cancer Statistics because most provinces have opted to use
projections based on modeling rather than averaging (see Appendix II: Methods
for further details). With the consistent use of this method, the previous gradual
decline in overall cancer incidence in males is expected to continue.
The numbers of new cases and of deaths are important measures of cancer burden on
the Canadian population and health care system. Despite the relative stability in agestandardized rates, the numbers of new cancer cases and deaths continue to rise
steadily as the Canadian population grows and ages (Figure 2.1 and 2.2). In 2008, the
number of new cases is estimated to be 166,400 and the number of deaths to be
73,800. This represents an additional 6,500 new cases and 1,100 deaths in 2008
compared to the estimates for 2007 in last year’s publication. These new cases include
2,400 more prostate cases, 700 more colorectal and 600 more lung cancers than
estimated for 2007.
Figure 3.1 and 3.2 show that the main reasons for the rising numbers of new cases and
deaths from cancer are the growing and aging population. The lowest solid line
represents the total number of cases (or deaths) that would have occurred each year if
only the rates had changed but the population size and age structure had remained as
in 1979. The middle line represents the number of cases (or deaths) that would have
occurred each year if that year’s rates were applied to a population that was the same
size as that year’s population but with the age distribution of 1979. The top line
represents the number of cases (or deaths) that actually occurred and thus reflects the
22
Canadian Cancer Society/National Cancer Institute of Canada: Canadian Cancer Statistics 2008
TRENDS IN INCIDENCE AND MORTALITY
combined impact of rate change, population growth and the aging of the population.
These figures demonstrate that changes in population size and age structure have been
the major determinants of the increasing burden of cancer among Canadians. For as
long as this trend continues, there will be a commensurate annual increase in the
number of new cases and deaths unless a major drop in the risk of developing cancer
occurs. Decreasing mortality from cardiovascular disease as the other major cause of
death contributes to the increasing numbers of patients with cancer.
Figure 4 plots the relative change in age-standardized mortality rates (See definition in
Glossary) from 1979 to 2008 for all cancers and for all cancers excluding lung cancer.
The different pattern between males and females illustrates partly the different state of
the lung cancer problem in the two sexes and partly different mortality trends for other
cancers:
N
In males, the all cancer mortality trend largely reflects the trend in lung cancer
mortality (the two lines are very close through the time period): declining overall
cancer mortality since 1988 is predominantly due to dropping lung cancer rates.
N
In females, however, the lung cancer mortality rate is still increasing. Thus, the “all
cancer” mortality rate that has been essentially stable since 1979 conceals the major
(20%) decline that has occurred for other types of cancer over the 30 year period.
Trends for selected cancers
The cancers included in Figures 5.1, 5.2, 6.1 and 6.2 and Tables 7.1, 7.2, 8.1 and 8.2
are those that are most common (prostate, lung, breast, colorectal, and non-Hodgkin
lymphoma) plus others from Table 9 that exhibit significantly increasing or decreasing
trends in their rates of at least 2% per year over the period 1995-2004.
Of the 23 cancers listed in Table 9, statistically significant differences (increases or
decreases) of 2% or more per year have been observed in the following cancers:
N
N
Incidence:
¡
Increases: liver cancer in males (+2.7%) and thyroid cancer in both sexes
(+5.5% and +10.1%, in males and females respectively).
¡
Decreases: stomach and larynx in both sexes, lung cancer in men (-2.5% per
year since 1999) and for women, brain cancer (-3.6% per year since 2000) and
cervical cancer.
Mortality:
¡
Increases: liver cancer in males (+ 2.2%).
¡
Decreases: Rates have declined for most types of cancer especially:
n
stomach (-3.6%), larynx (-3.2%), prostate (-2.9%), oral (-2.5%), and lung
cancer (-2.1%), as well as Hodgkin lymphoma (-4.2%) and non-Hodgkin
lymphoma (-2.3%) in males; and
n
Hodgkin lymphoma (-3.7%), cervical (-3.3%) and stomach cancer (-3.1%) in
females.
Canadian Cancer Society/National Cancer Institute of Canada: Canadian Cancer Statistics 2008
23
TRENDS IN INCIDENCE AND MORTALITY
Comments about trends for specific cancers follow.
Prostate cancer*
N
Against a backdrop of gradually increasing incidence rates, two peaks are evident:
one in 1993 and another smaller one in 2001, each time followed by a decline.
These peaks are compatible with two waves of intensified screening activity with
the PSA test for early prostate cancer. The first follows the introduction of PSA as
a screening test; the second, which does not appear in the US, may be explained by
the publicity around the then Canadian Minister of Health’s diagnosis with prostate
cancer in early 2001 as a result of serial PSA tests. The first decline was followed
by resumption of the earlier more gradual increase; the second decline is too recent
to know whether the increasing trend will return.
N
Although some of the long-term and apparently ongoing increase in incidence may
be due to more gradual changes in early detection, changes in risk or protective
factors might also be partly responsible. However, little is known about the causes
of prostate cancer.
N
In contrast to incidence, mortality rates rose much more slowly from 1979, and
started to decline in the mid 1990s. Mortality declined significantly by 2.9% per
year between 1995 and 2004 (Table 9), probably due to a combination of earlier
detection and improved treatment.
Lung cancer
N
In males, rising incidence and mortality rates began to level off in the mid-1980s
and have been declining ever since (Table 7.1 and 7.2). Rates have dropped
significantly by 2.5% per year since 1999 for incidence and by 2.1% per year for
mortality over the period 1995-2004.
N
In females, incidence and mortality rates have been increasing since at least 1979,
and continue to do so (by 1.2% per year for both incidence and mortality).
N
Males continue to have higher incidence and mortality rates than females (67 per
100,000 versus 51 per 100,000 and 59 per 100,000 versus 40 per 100,000,
respectively, Tables 4 and 6).
N
These patterns reflect the drop in tobacco consumption that began for males in the
mid 1960’s and much later – in about the mid-1980’s – for females.
Breast cancer
N
Breast cancer incidence rose steadily but gradually between 1979 and 1999 but has
since declined significantly by 1.7% per year.† Much of the increase was probably
due to the gradual uptake of screening mammography that took place during the
1980s and 1990s. This results in identification of cases of breast cancer earlier than
would have occurred without screening. Similar to prostate cancer, screening may
have eventually exhausted the pool of prevalent cancers in the screened population,
*
Note that prostate cancer estimates for 2005 through 2008 are higher than those in previous years of
Canadian Cancer Statistics because most provinces opted to use projections based on modeling rather
than averaging (See Appendix II: Methods).
†
Projected estimates for breast cancer beyond 2004 reflect the long term increasing trend in breast cancer
incidence and are not sensitive to the recent decline.
24
Canadian Cancer Society/National Cancer Institute of Canada: Canadian Cancer Statistics 2008
TRENDS IN INCIDENCE AND MORTALITY
resulting in recent declines, as the incidence rate dropped back closer to prescreening levels. However, changes in risk and protective factors such as changing
patterns of childbearing and hormones likely also have played a role.
N
Female breast cancer mortality rates have been declining since the mid-1980s. The
age-standardized mortality rate has fallen by more than 25% since 1986 from 32 to
23.1 per 100,000 (Table 8.2). The downward trend has accelerated to 1.6% per year
since 1999. This is likely the result of a combination of uptake of mammography
screening, and the use of more effective adjuvant therapies following breast cancer
surgery. The breast cancer death rate is the lowest it has been since 1950. Similar
declines have also occurred in the US, UK and Australia.
Colorectal cancer
N
Trends for colorectal cancer incidence between 1979 and 2004 (the last year of
complete data) are complex. In both sexes, incidence rose (or was relatively stable
in the case of women) between 1979 and 1985, then declined to the mid-1990s
(more strongly in women than in men), then rose through 2000 only to decline
significantly thereafter. Because causes of the recent short-term fluctuations are not
understood, colorectal cancer projections to 2008 are based on long term data
(1986-2004), which is the standard methodology for this publication. They should
be used with caution.
N
Mortality rates continue to decline in both sexes, by 1.7% in females and by 1.3%
per year in males (Table 9), and are likely the result of improvements in treatment,
specifically chemotherapy.
N
Screening for colorectal cancer can reduce both incidence and mortality. Limited
opportunistic screening has already been occurring, which may account for some of
the mortality decline. Several provinces have announced that they are implementing a
population-based colorectal cancer screening program and the others have it under
thorough review.
N
The Canadian Partnership Against Cancer’s Screening Action Group has recently
established a colorectal cancer screening network to provide a national forum to
review, discuss and take action to enhance and improve colorectal cancer screening
in Canada.
Non-Hodgkin lymphoma
N
In both males and females, incidence rates increased approximately 50% between
1978 and the late 1990s. Since that time, they have stabilized.
N
Mortality rates have followed a similar pattern, although a statistically significant
decline of 2.3% per year since 2000 in males is noted. This may reflect recent
improvements in treatment, notably immunotherapy (Rituximab).
N
The observed incidence patterns likely result from a combination of improved
detection and classification of this complex set of diseases, and changes in risk
factors. The clearest risk factor for non-Hodgkin lymphoma is immunosuppression
(which can result from immune disorders, immunosuppessive therapy, or the
human immunodeficiency virus (HIV)). Other factors that increase risk are poorly
understood but may include occupational exposures to pesticides and
organochlorines such as phenoxy herbicides and dioxins.
Canadian Cancer Society/National Cancer Institute of Canada: Canadian Cancer Statistics 2008
25
TRENDS IN INCIDENCE AND MORTALITY
Other types of cancer
N
Melanoma incidence continues to increase in men and women (by 1.8% and 1.0%
per year, respectively). This is likely related to more leisure time spent in the sun
without adequate protection and to improvements in the detection of the disease.
Mortality rates were stable in men but decreased in women (0.8% per year).
N
Incidence rates for kidney cancer increased (by 0.7% and 1.2% per year in male
and females respectively) between 1995 and 2004, although mortality rates
remained stable. Increasing incidence is partly due to improved detection but may
also be related to the rising prevalence of obesity, which is a strong risk factor for
renal cell carcinoma, the major type of kidney cancer.
N
Thyroid cancer incidence is increasing the most rapidly of all cancers (5.5% in
men, and 10.1% per year in females since 1997). Similar increases have been noted
in Europe and parts of the United States. More frequent use of medical imaging
(ultrasound, needle biopsy, and potentially computed tomography and magnetic
resonance imaging) may be improving detection of earlier stage, asymptomatic
cancers more frequently than was possible in the past.3 Mortality rates have
remained stable, most likely because modern treatment is highly effective in the
management of early thyroid cancers.
N
Liver cancer incidence and mortality rates are increasing in males (2.7% and 2.2%
per year, respectively, and both are statistically significant), and in females (by
1.3% and 1.7% per year, respectively, but neither are statistically significant).
N
Cervical cancer incidence and mortality rates have been declining for many
decades, largely due to widespread regular use of Pap test screening whereby
malignant as well as pre-malignant lesions can be detected early and treated.
Recent announcements by some provinces to institute vaccination of school aged
girls with the HPV vaccine will further reduce incidence and mortality over the
longer-term, but will not eliminate cervical cancer. The continuation of Pap
screening is still a necessary and important part of preventive health care.
N
Larynx cancer incidence rates are significantly decreasing for both males and
females (3.6% and 3.4% annually, respectively) while mortality rates for men show
a significant decline of 3.2%. Larynx cancer is associated with tobacco use and
alcohol.
N
Mortality rates are very low for Hodgkin lymphoma, and have declined sharply
between 1995 and 2004 (by 4.2% and 3.7% per year, in males and females
respectively).
N
The incidence of testicular cancer continues to increase at a rate that is now
statistically significant (1.8% per year between 1995 and 2004). Testicular cancer
incidence has been increasing for several decades for reasons which are not well
understood. The decline in testicular cancer mortality continues but is no longer
statistically significant. Because there are few testicular cancer deaths each year,
mortality rates tend to be unstable, which can result in substantial year-to-year
variation.
26
Canadian Cancer Society/National Cancer Institute of Canada: Canadian Cancer Statistics 2008
TRENDS IN INCIDENCE AND MORTALITY
Implications
Figures 2.1 and 2.2 highlight that continuing increases in incidence and deaths from
cancer will place an increasing burden on Canadian society, largely independent of
trends in incidence and mortality rates. This vividly illustrates why cancer prevention
and health promotion programs are so vital.
Current and projected cancer trends in Canada underline the importance of planning
for the increasing number of cancer cases that are presently unavoidable. We must
enhance capacity for adequate prevention, health promotion programs and for
palliation when treatment no longer offers hope of a cure. In addition, we must do a
much better job of primary prevention to reduce the number of cases that are
avoidable.
We must enhance capacity for adequate prevention,
health promotion programs and for palliation when
treatment no longer offers hope of a cure. In addition,
we must do a much better job of primary prevention
to reduce the number of cases that are avoidable.
Canadian Cancer Society/National Cancer Institute of Canada: Canadian Cancer Statistics 2008
27
TRENDS IN INCIDENCE AND MORTALITY
Figure 2.1
New Cases and Age-Standardized Incidence Rates (ASIR) for All
Cancers, Canada, 1979-2008
Males
ASIR (per 100,000)
New Cases (in thousands)
600
90
80
500
70
60
400
50
40
300
Estimated
30
20
200
10
0
100
1979
1983
1988
1993
New Cases
1998
2003
2008
ASIR
Females
New Cases (in thousands)
ASIR (per 100,000)
90
600
80
500
70
60
400
50
40
300
Estimated
30
20
200
10
0
100
1979
1983
1988
1993
New Cases
1998
2003
2008
ASIR
Note:
All cancers exclude non-melanoma skin cancer. Rates are standardized to the 1991 Canadian
population. Actual incidence data are available to 2005 except for Quebec, Manitoba, and Alberta
where 2005 is estimated. Please refer to Appendix II: Methods for further details.
Source: Chronic Disease Surveillance Division, CCDPC, Public Health Agency of Canada
28
Canadian Cancer Society/National Cancer Institute of Canada: Canadian Cancer Statistics 2008
TRENDS IN INCIDENCE AND MORTALITY
Figure 2.2
Deaths and Age-Standardized Mortality Rates (ASMR) for All Cancers,
Canada, 1979-2008
Males
ASMR (per 100,000)
Deaths (in thousands)
80
600
70
500
60
50
400
40
300
30
20
200
Estimated
10
0
100
1979
1983
1988
1993
1998
2003
2008
ASMR
Deaths
Females
Deaths (in thousands)
ASMR (per 100,000)
80
600
70
500
60
50
400
40
300
30
20
Estimated
200
10
0
100
1979
1983
1988
1993
Deaths
1998
2003
2008
ASMR
Note:
Rates are standardized to the 1991 Canadian population. See also the Glossary and Appendix II:
Methods.
Source: Chronic Disease Surveillance Division, CCDPC, Public Health Agency of Canada
Canadian Cancer Society/National Cancer Institute of Canada: Canadian Cancer Statistics 2008
29
TRENDS IN INCIDENCE AND MORTALITY
Figure 3.1
Trends in New Cases and Deaths, Attributed to Cancer Rate, Population
Growth, and Population Age Distribution, All Cancers, All Ages, Males,
Canada, 1979-2008
Incidence
90
Cases (in thousands)
90
80
80
70
70
Age Distribution
60
60
50
50
Population Growth
40
40
Rate Change
30
30
20
20
Estimated
10
10
0
0
1979
1983
1988
1993
1998
2003
2008
Year
Mortality
Deaths (in thousands)
40
40
35
35
30
30
Age Distribution
25
25
Population Growth
20
20
Rate Change
15
15
10
10
Estimated
5
5
0
0
1979
1983
1988
1993
1998
2003
2008
Year
Note:
Incidence figures exclude non-melanoma skin cancer (basal and squamous). Magnitude of area
represents the number of cases/death due to each change. Actual incidence data are available to
2005 except for Quebec, Manitoba and Alberta where 2005 incidence is estimated. Please refer to
Appendix II: Methods for further details. Incidence and mortality each have a different scale.
Source: Chronic Disease Surveillance Division, CCDPC, Public Health Agency of Canada
30
Canadian Cancer Society/National Cancer Institute of Canada: Canadian Cancer Statistics 2008
TRENDS IN INCIDENCE AND MORTALITY
Figure 3.2
Trends in New Cases and Deaths, Attributed to Cancer Rate, Population
Growth, and Population Age Distribution, All Cancers, All Ages, Females,
Canada, 1979-2008
Incidence
90
Cases (in thousands)
90
80
80
70
70
60
60
Age Distribution
50
50
Population Growth
40
40
30
30
Rate Change
20
20
Estimated
10
10
0
0
1979
1983
1988
1993
1998
2003
2008
Year
Mortality
Deaths (in thousands)
40
40
35
35
30
30
25
Age Distribution
25
20
Population Growth
20
15
15
Rate Change
10
10
Estimated
5
5
0
0
1979
1983
1988
1993
1998
2003
2008
Year
Note:
Incidence figures exclude non-melanoma skin cancer (basal and squamous). Magnitude of area
represents the number of cases/death due to each change. Actual incidence data are available to
2005 except for Quebec, Manitoba and Alberta where 2005 incidence is estimated. Please refer to
Appendix II: Methods for further details. Incidence and mortality each have a different scale.
Source: Chronic Disease Surveillance Division, CCDPC, Public Health Agency of Canada
Canadian Cancer Society/National Cancer Institute of Canada: Canadian Cancer Statistics 2008
31
32
Canadian Cancer Society/National Cancer Institute of Canada: Canadian Cancer Statistics 2008
TRENDS IN INCIDENCE AND MORTALITY
Figure 4
Relative Change in Age-Standardized Mortality Rates Including and
Excluding Lung Cancer, Canada, 1979-2008*
Males
1979 = 1.0
1.15
1.15
Estimated
1.10
1.10
1.05
1.05
1.00
1.00
0.95
0.95
0.90
0.90
0.85
0.85
0.80
1979
1983
1988
1993
Excluding lung cancer
1998
0.80
2008
2003
All cancers
Females
1979 = 1.0
1.15
1.15
Estimated
1.10
1.10
1.05
1.05
1.00
1.00
0.95
0.95
0.90
0.90
0.85
0.85
0.80
1979
1983
1988
1993
Excluding lung cancer
1998
2003
0.80
2008
All cancers
* Rates are relative to 1979 (current year divided by 1979 rate).
Note:
Rates are standardized to the age distribution of the 1991 Canadian population. See also the Glossary
and Appendix II: Methods.
Source: Chronic Disease Surveillance Division, CCDPC, Public Health Agency of Canada
Canadian Cancer Society/National Cancer Institute of Canada: Canadian Cancer Statistics 2008
33
TRENDS IN INCIDENCE AND MORTALITY
Figure 5.1
Age-Standardized Incidence Rates (ASIR) for Selected Cancers, Males,
Canada, 1979-2008
ASIR (per 100,000)
140
Estimated
140
Prostate
120
120
Lung
100
100
80
80
Colorectal
60
60
40
40
20
20
0
0
1979
30
1983
1988
1993
1998
2003
2008
ASIR (per 100,000)
30
Estimated
25
25
Stomach
Non-Hodgkin Lymphoma
20
20
15
15
10
10
Larynx
Liver
5
5
Thyroid
0
0
1979
1983
1988
1993
1998
2003
2008
Note:
Rates are standardized to the age distribution of the 1991 Canadian population. See Table 7.1 for
data points. Actual incidence data are available to 2005 except for Quebec, Manitoba and Alberta
where 2005 incidence is estimated. Please refer to Appendix II: Methods for further details. Please
note that each graph has a different scale for the vertical axis because of the wide range.
Source: Chronic Disease Surveillance Division, CCDPC, Public Health Agency of Canada
34
Canadian Cancer Society/National Cancer Institute of Canada: Canadian Cancer Statistics 2008
TRENDS IN INCIDENCE AND MORTALITY
Figure 5.2
Age-Standardized Mortality Rates (ASMR) for Selected Cancers, Males,
Canada, 1979-2008
90
ASMR (per 100,000)
90
Estimated
80
80
Lung
70
70
60
60
50
50
40
40
Colorectal
30
20
30
Prostate
20
10
10
0
0
1979
20
1983
1988
1993
1998
2003
2008
ASMR (per 100,000)
20
Estimated
Stomach
15
15
10
10
Non-Hodgkin Lymphoma
Oral
5
5
Larynx
Liver
Hodgkin Lymphoma
0
0
1979
1983
1988
1993
1998
2003
2008
Note:
Rates are standardized to the age distribution of the 1991 Canadian population. See Table 7.2 for
data points. Please note that each graph has a different scale for the vertical axis because of the wide
range. Testis cancer is excluded because of low mortality rates (an estimated 30 deaths in 2008).
Source: Chronic Disease Surveillance Division, CCDPC, Public Health Agency of Canada
Canadian Cancer Society/National Cancer Institute of Canada: Canadian Cancer Statistics 2008
35
TRENDS IN INCIDENCE AND MORTALITY
Figure 6.1
Age-Standardized Incidence Rates (ASIR) for Selected Cancers,
Females, Canada, 1979-2008
ASIR (per 100,000)
140
Estimated
120
120
100
140
100
Breast*
80
80
60
60
Colorectal
40
40
Lung
20
20
0
0
1979
30
1983
1988
1993
1998
2003
2008
ASIR (per 100,000)
30
Estimated
25
25
20
20
Cervix
15
15
Non-Hodgkin Lymphoma
Thyroid
10
10
Stomach
Brain
5
5
Larynx
0
0
1979
1983
1988
1993
1998
2003
2008
* Projected estimates for breast cancer beyond 2004 reflect the long-term increasing trend in breast cancer
incidence and are not sensitive to recent decline.
Note:
Rates are standardized to the age distribution of the 1991 Canadian population. See Table 8.1 for
data points. Actual incidence data are available to 2005 except for Quebec, Manitoba and Alberta
where 2005 incidence is estimated. Please refer to Appendix II: Methods for further details. Please
note that each graph has a different scale for the vertical axis because of the wide range.
Source: Chronic Disease Surveillance Division, CCDPC, Public Health Agency of Canada
36
Canadian Cancer Society/National Cancer Institute of Canada: Canadian Cancer Statistics 2008
TRENDS IN INCIDENCE AND MORTALITY
Figure 6.2
Age-Standardized Mortality Rates (ASMR) for Selected Cancers,
Females, Canada, 1979-2008
50
ASMR (per 100,000)
50
Estimated
40
40
Lung
30
Breast
30
Colorectal
20
20
10
10
0
0
1979
15
1983
1988
1993
1998
2003
2008
ASMR (per 100,000)
15
Estimated
10
10
Stomach
Non-Hodgkin Lymphoma
5
5
Cervix
Hodgkin Lymphoma
0
0
1979
1983
1988
1993
1998
2003
2008
Note:
Rates are standardized to the age distribution of the 1991 Canadian population. See Table 8.2 for
data points. Please note that each graph has a different scale for the vertical axis because of the wide
range.
Source: Chronic Disease Surveillance Division, CCDPC, Public Health Agency of Canada
Canadian Cancer Society/National Cancer Institute of Canada: Canadian Cancer Statistics 2008
37
TRENDS IN INCIDENCE AND MORTALITY
Table 7.1
Age-Standardized Incidence Rates for Selected† Cancers, Males,
Canada, 1979-2008
Rate per 100,000
Year
All
Prostate
Cancers
Lung
Colorectal
Non-Hodgkin
Thyroid Stomach
Lymphoma
Liver
Larynx
1979
411.1
72.0
83.5
59.2
12.4
1.8
20.8
2.5
9.0
1980
407.1
71.4
82.9
57.9
11.6
1.9
19.0
2.2
9.3
1981
442.9
78.5
90.8
62.6
14.7
1.9
20.5
2.4
8.4
1982
442.0
77.8
92.4
62.7
15.6
1.7
18.7
2.4
8.8
1983
450.3
79.6
95.0
63.9
14.9
2.1
20.4
2.4
9.0
1984
452.0
80.9
96.8
64.8
14.9
2.0
18.4
3.1
8.9
1985
451.9
85.1
93.0
66.2
15.7
1.8
18.0
2.8
8.8
1986
453.9
86.1
96.1
64.7
16.0
2.0
18.0
3.3
8.8
1987
458.8
89.6
94.9
64.7
16.6
2.2
17.4
3.1
8.8
1988
461.2
90.4
95.2
64.6
17.0
2.1
17.0
3.0
8.6
1989
454.0
91.9
93.4
63.1
16.7
2.1
16.8
3.2
8.1
1990
460.4
99.9
92.5
63.0
17.7
2.2
15.8
3.4
7.7
1991
472.0
112.3
90.5
62.9
17.4
2.4
15.6
3.6
8.4
1992
490.1
125.5
90.5
64.2
17.2
2.0
14.6
3.4
8.1
1993
502.8
140.5
91.5
62.0
18.2
2.6
14.3
3.8
7.4
1994
491.0
129.7
86.8
63.2
18.2
2.7
14.1
4.2
7.5
1995
466.8
111.7
84.7
61.6
18.3
2.6
13.3
4.2
7.4
1996
458.4
110.1
82.3
60.7
18.3
2.6
13.6
4.2
7.0
1997
461.4
115.6
79.5
60.3
18.8
2.7
13.1
4.5
6.6
1998
460.5
114.9
80.6
62.5
18.9
2.7
12.6
4.4
6.7
1999
471.3
119.3
79.5
63.4
18.9
3.2
12.6
4.6
6.6
2000
475.8
124.7
77.1
65.5
19.0
3.5
12.3
4.8
5.9
2001
477.8
132.4
75.8
64.1
19.0
3.6
11.8
5.3
6.0
2002
461.7
122.9
73.0
63.4
18.7
4.0
10.9
5.2
5.7
2003
456.9
119.3
70.9
61.1
18.9
3.7
11.6
5.0
5.3
2004
458.9
121.3
70.4
62.3
19.5
3.9
11.2
5.2
5.2
2005**
463.7
123.6
70.7
62.8
19.9
4.5
10.8
5.5
5.5
2006*
462.1
125.8
69.4
62.3
19.9
4.4
10.4
5.8
5.4
2007*
461.9
127.3
68.2
62.3
20.0
4.6
10.1
6.0
5.3
2008*
462.1
129.0
67.1
62.3
20.2
4.8
9.8
6.2
5.2
** Estimated rates
** Estimated for Quebec, Manitoba and Alberta.
*† Five most frequent cancers (both sexes combined) and those cancers in Table 9 with a statistically
significant incidence rate increase or decrease of more than 2% per year.
Note:
Rates exclude non-melanoma skin cancer (basal and squamous) and are standardized to the age
distribution of the 1991 Canadian population. See Appendix II: Methods for further details.
Source: Chronic Disease Surveillance Division, CCDPC, Public Health Agency of Canada
38
Canadian Cancer Society/National Cancer Institute of Canada: Canadian Cancer Statistics 2008
TRENDS IN INCIDENCE AND MORTALITY
Table 7.2
Age-Standardized Mortality Rates for Selected† Cancers, Males, Canada,
1979-2008
Rate per 100,000
Year
Non-Hodgkin
All
Oral Stomach Liver
Prostate Lung Colorectal
Lymphoma
Cancers
Larynx
Hodgkin
Lymphoma
1979
239.4
26.7
71.6
31.8
5.9
6.2
18.0
1.9
3.3
1.2
1980
240.7
25.8
73.9
32.3
7.0
5.5
15.5
1.9
3.7
1.2
1981
239.2
27.1
73.1
32.2
6.9
5.6
15.3
1.5
3.3
1.2
1982
243.5
26.0
77.3
31.9
6.8
6.0
14.6
1.7
3.6
1.1
1983
242.9
26.7
78.4
31.8
7.2
6.1
14.3
1.6
3.4
1.3
1984
247.9
27.4
80.1
32.4
7.0
5.8
13.9
2.3
3.3
1.1
1985
249.0
28.9
77.9
33.4
7.1
6.2
13.0
2.2
3.4
0.9
1986
249.0
29.4
78.8
32.0
7.7
6.2
13.1
2.3
3.5
1.0
1987
248.2
29.4
78.5
32.0
7.1
5.9
12.9
2.3
3.6
0.9
1988
254.8
30.7
81.2
32.4
7.8
5.8
12.8
2.6
3.7
0.8
1989
249.6
29.7
81.0
31.9
7.7
5.9
12.3
2.4
3.2
0.8
1990
246.5
30.1
79.4
30.9
7.9
5.6
11.3
2.0
3.6
0.8
1991
247.2
31.2
78.7
30.4
8.1
6.0
10.3
1.9
3.5
0.7
1992
244.7
31.0
77.5
31.1
8.1
5.4
10.7
2.2
3.3
0.7
1993
242.8
31.1
77.8
29.7
7.7
5.6
9.7
2.3
3.1
0.7
1994
241.8
30.7
75.5
30.3
8.4
5.3
9.8
2.5
3.2
0.6
1995
239.0
31.0
73.2
30.2
8.4
5.1
9.6
2.1
3.1
0.6
1996
236.5
29.0
72.9
29.5
8.4
5.0
9.5
2.2
2.9
0.5
1997
232.3
28.7
70.5
29.0
8.7
5.0
9.0
2.4
2.8
0.6
1998
230.5
28.0
70.2
28.9
8.9
4.7
8.6
2.7
2.7
0.5
1999
229.4
26.9
70.4
28.5
9.2
4.7
8.4
2.7
2.6
0.6
2000
225.4
26.8
64.3
28.5
9.0
3.9
8.1
2.4
2.8
0.5
2001
224.0
26.7
64.6
27.1
9.1
4.6
7.6
2.6
2.7
0.5
2002
219.9
25.0
64.4
27.7
8.5
4.7
7.3
2.6
2.5
0.4
2003
215.0
23.9
62.6
26.8
8.5
4.1
7.3
2.7
2.3
0.4
2004
211.7
23.3
60.6
26.8
8.3
4.1
7.0
2.6
2.1
0.4
2005*
214.7
24.6
61.9
26.7
8.8
4.1
6.7
2.7
2.4
0.4
2006*
212.8
24.3
61.0
26.5
8.9
4.1
6.5
2.7
2.4
0.4
2007*
210.9
23.9
60.1
26.2
8.9
4.0
6.3
2.7
2.4
0.4
2008*
209.0
23.6
59.2
25.9
9.0
3.9
6.1
2.8
2.3
0.3
** Estimated rates
*† Five most frequent cancers (both sexes combined) and those cancers in Table 9 with a statistically
significant mortality rate increase or decrease of more than 2% per year except for testis cancer, which has a
low mortality rate (an estimated 30 deaths in 2008).
Note:
Rates are standardized to the age distribution of the 1991 Canadian population.
Source: Chronic Disease Surveillance Division, CCDPC, Public Health Agency of Canada
Canadian Cancer Society/National Cancer Institute of Canada: Canadian Cancer Statistics 2008
39
TRENDS IN INCIDENCE AND MORTALITY
Table 8.1
Age-Standardized Incidence Rates for Selected† Cancers, Females,
Canada, 1979-2008
Rate per 100,000
Year
All
Lung
Cancers
Breast‡
Non-Hodgkin
Thyroid Stomach Brain
Colorectal
Lymphoma
Cervix Larynx
1979
314.1
20.2
87.3
49.7
9.6
4.7
9.2
5.5
14.2
1.1
1980
305.8
21.6
83.3
47.4
8.8
4.4
8.6
5.9
13.0
1.4
1981
328.3
24.2
86.5
48.6
11.6
4.6
9.8
6.1
13.9
1.3
1982
321.3
25.8
86.0
48.9
11.7
4.5
8.7
5.7
12.3
1.1
1983
333.2
28.2
89.3
50.2
11.5
4.8
8.7
5.9
12.9
1.3
1984
329.9
29.5
90.4
48.9
11.3
4.9
8.1
6.0
12.2
1.4
1985
336.1
30.8
92.2
50.6
11.4
5.3
8.0
6.1
12.3
1.5
1986
325.5
31.5
88.6
48.2
11.3
5.2
8.3
5.7
10.9
1.4
1987
331.4
33.2
91.1
47.6
11.5
5.2
8.0
5.7
10.4
1.5
1988
336.8
34.6
97.8
46.1
11.7
5.1
7.2
6.0
10.2
1.5
1989
330.7
34.9
96.4
45.3
12.2
5.6
7.2
5.7
10.0
1.6
1990
333.9
36.3
96.0
45.7
12.1
5.8
6.9
5.9
10.4
1.4
1991
337.7
37.5
100.1
44.1
12.4
5.9
6.4
5.9
9.6
1.6
1992
343.8
39.7
101.9
44.3
12.5
6.9
6.6
5.6
9.7
1.3
1993
343.3
40.6
99.1
44.3
12.7
7.1
6.3
5.8
9.5
1.3
1994
343.7
39.8
99.0
43.7
13.3
7.6
6.3
6.1
9.4
1.4
1995
342.1
40.8
98.9
42.5
13.1
7.7
6.0
6.0
9.3
1.4
1996
339.9
42.0
98.7
41.1
13.1
7.8
6.0
5.8
9.2
1.3
1997
344.2
42.0
102.1
41.7
13.8
7.9
5.5
6.0
8.7
1.3
1998
351.7
43.7
103.2
43.9
14.0
8.2
5.6
5.9
8.3
1.2
1999
352.5
43.5
105.1
43.3
13.5
9.4
5.3
6.0
8.4
1.2
2000
354.4
45.1
101.5
44.5
13.8
10.4
5.5
5.9
8.4
1.1
2001
349.2
44.5
99.9
43.2
13.3
11.2
5.1
6.0
8.2
1.1
2002
355.1
45.0
101.8
43.1
13.5
13.2
5.2
5.6
8.0
1.1
2003
347.5
44.9
96.1
42.3
13.6
13.6
4.7
5.6
7.8
1.1
2004
349.5
45.5
96.1
42.5
14.3
15.0
4.9
5.1
7.5
1.0
2005**
359.1
47.9
100.7
42.5
14.1
15.9
4.7
5.6
7.2
1.0
2006*
357.9
48.9
101.8
41.7
14.4
16.3
4.5
5.7
7.4
1.0
2007*
359.3
49.8
102.2
41.5
14.5
17.4
4.4
5.7
7.3
1.0
2008*
360.8
50.8
102.5
41.2
14.7
18.7
4.3
5.7
7.1
1.0
** Estimated rates
** Estimated for Quebec, Manitoba and Alberta.
*† Five most frequent cancers (both sexes combined) and those cancers in Table 9 with a statistically
significant incidence rate increase or decrease of more than 2% per year.
*‡ Projected estimates for breast cancer beyond 2004 reflect the long-term increasing trend in breast cancer
incidence and are not sensitive to recent decline.
Note:
Rates exclude non-melanoma skin cancer (basal and squamous) and are standardized to the age
distribution of the 1991 Canadian population.
Source: Chronic Disease Surveillance Division, CCDPC, Public Health Agency of Canada
40
Canadian Cancer Society/National Cancer Institute of Canada: Canadian Cancer Statistics 2008
TRENDS IN INCIDENCE AND MORTALITY
Table 8.2
Age-Standardized Mortality Rates for Selected† Cancers, Females,
Canada, 1979-2008
Rate per 100,000
Year
All
Cancers
Lung
1979
150.2
16.3
29.8
1980
148.5
17.0
29.7
1981
149.0
17.9
1982
149.3
19.5
1983
149.4
1984
Non-Hodgkin
Lymphoma
Stomach
Cervix
Hodgkin
Lymphoma
26.1
4.4
7.2
4.2
0.7
25.3
4.6
6.8
3.7
0.6
30.1
24.4
4.5
7.5
3.9
0.6
29.7
23.5
4.9
6.7
3.9
0.6
19.9
30.4
23.1
4.9
6.5
3.9
0.6
151.9
22.2
30.7
23.8
4.7
5.7
3.5
0.6
1985
154.8
23.7
31.8
23.7
5.0
6.0
3.3
0.5
1986
154.4
23.9
32.0
23.5
5.1
6.1
3.2
0.5
1987
154.0
25.3
31.3
23.0
5.2
5.7
3.0
0.5
1988
155.4
26.9
31.4
22.7
5.0
5.1
3.0
0.5
1989
153.1
27.0
31.2
21.3
5.5
5.5
2.9
0.5
1990
153.1
27.6
31.3
21.3
5.5
5.0
3.0
0.4
1991
153.5
29.5
30.1
20.7
5.7
4.9
2.8
0.5
1992
153.1
29.6
30.4
20.2
5.5
4.9
2.4
0.4
1993
154.8
31.7
29.4
20.3
5.5
4.5
2.6
0.5
1994
155.1
31.9
30.0
19.9
5.7
4.5
2.7
0.3
1995
152.0
31.3
28.7
19.8
5.9
4.6
2.4
0.4
1996
155.2
33.6
28.9
19.7
5.8
4.4
2.6
0.3
1997
150.3
32.6
27.7
18.8
5.8
3.9
2.5
0.3
1998
151.3
34.5
26.4
19.3
6.0
3.8
2.3
0.3
1999
149.8
34.9
25.2
18.6
5.7
4.0
2.4
0.3
2000
149.8
34.4
25.1
18.2
6.1
3.9
2.2
0.3
2001
148.2
34.4
25.0
17.8
5.7
3.4
2.1
0.3
2002
149.3
35.3
24.4
17.7
5.7
3.6
1.9
0.2
2003
148.2
35.4
24.1
17.1
5.5
3.5
1.9
0.2
2004
147.1
36.1
23.1
17.3
5.8
3.3
2.0
0.3
2005*
148.2
38.0
23.5
16.8
5.9
3.2
1.9
0.3
2006*
147.9
38.8
23.1
16.6
5.9
3.1
1.9
0.3
2007*
147.6
39.6
22.7
16.3
6.0
3.0
1.8
0.2
2008*
147.3
40.4
22.3
16.0
6.0
3.0
1.8
0.2
Breast Colorectal
* Estimated rates
† Five most frequent cancers (both sexes combined) and those cancers in Table 9 with a statistically significant
mortality rate increase or decrease of more than 2% per year.
Note:
Rates are standardized to the age distribution of the 1991 Canadian population.
Source: Chronic Disease Surveillance Division, CCDPC, Public Health Agency of Canada
Canadian Cancer Society/National Cancer Institute of Canada: Canadian Cancer Statistics 2008
41
TRENDS IN INCIDENCE AND MORTALITY
Table 9
Average Annual Percent Change (AAPC) in Age-Standardized Incidence
and Mortality Rates for Selected Cancers, Canada, 1995-2004
Incidence 1995-2004
Males
AAPC
Mortality 1995-2004
Females
Changepoint†
AAPC
Males
Changepoint†
0.0
1996
-0.3
Prostate
1.2
1996
–
-2.9**
–
1999
1.2**
-2.1**
1.2**
-2.5**
Breast
–
Colorectal
Non-Hodgkin
Lymphoma
Bladder
-1.3**
AAPC
All Cancers
Lung
2000
AAPC
Females
Changepoint†
-0.4**
-1.7*
1999
–
-1.6**
-1.5*
2000
-1.1*
2000
-1.3**
-1.7**
0.3
1997
0.0
1997
-2.3*
-0.5
-0.3
2000
-0.5
-0.4
0.4
0.5
-0.8*
Melanoma
1.8**
1.0**
Leukemia
0.3
0.1
-0.8*
-1.0
Kidney
0.7**
1.2*
-0.5
-0.8
–
-0.4
-0.5
0.0
Body of Uterus
–
Pancreas
-0.6
Oral
-1.4**
Thyroid
5.5**
0.5*
0.0
1997
0.1
10.1**
Stomach
-2.3**
-2.4**
Brain
-0.9**
-3.6*
Ovary
–
-0.8*
-2.5**
1997
2000
0.7
-3.6**
-3.1**
-1.0**
-0.7
–
-0.3
0.2
0.4
-1.5*
-0.3
0.5
-1.4*
0.3
-0.6
Liver
2.7**
1.3
2.2*
1.7
Cervix
–
-2.1**
–
Larynx
-3.6**
-3.4**
-3.2**
-1.8
-4.2*
-3.7*
Testis
1.8**
0.0
–
-2.4
1996
-1.5
Esophagus
0.1
1999
-0.6
Multiple myeloma
Hodgkin Lymphoma
Changepoint†
-3.3**
–
– Not applicable
** Significant at p=0.05
** Significant at p=0.01
* † Changepoint indicates the baseline year, if the slope of the trend changed after 1995.
Note:
Average Annual Percent Change is calculated assuming a log linear model; incidence rates exclude
non-melanoma skin cancer (basal and squamous). Changepoints were fit to rates from 1986 to 2004.
See Appendix II: Methods for further details.
Source: Chronic Disease Surveillance Division, CCDPC, Public Health Agency of Canada
42
Canadian Cancer Society/National Cancer Institute of Canada: Canadian Cancer Statistics 2008
AGE AND SEX DISTRIBUTION OF CANCER
C
ancer is primarily a disease of older Canadians. The estimates for 2008 shown in
Table 10 indicate that about 71,000 new cases (42%) and 45,000 cancer deaths
(60%) will occur in Canadians aged 70 years or more, while an additional 44,100 new
cases (27%) and 16,200 deaths (22%) will occur in those aged 60-69. In contrast, less
than 1% of new cases and deaths occur prior to age 20. The median age at cancer
diagnosis is between 65 and 69 years of age and at death between 70 and 74 for both
sexes.
It is important to note though, that about 50,000 new cases (30%) and 13,000 deaths
(18%) will occur between ages 20 and 59. These are the most productive years for
employment and raising families. As well, increasing numbers of people over 65
continue to work and made up over 2% of the work force in the 2001 census. 4 Cancer
therefore has an enormous impact on the social fabric and economy of Canada.
Figure 7 displays age-specific rates of cancer incidence and mortality by five-year age
groups for 2004, the most recent year for which complete national data are available.
Cancer incidence and mortality rates increase substantially with age in both sexes.
The age and sex distribution for the most common cancers in Canadians are presented
in Table 11. More than half of all newly diagnosed lung and colorectal cancers will
occur among Canadians aged 70 or more. In contrast, breast cancer occurs primarily in
women between the ages of 50 and 69. Only 28% of breast cancers are diagnosed over
age 69, while 20% occur in women under age 50. It is notable that although half the
new cases of breast cancer are estimated to occur between age 50 and 69, more deaths
from breast cancer will occur in the 80 and older age group, reflecting the benefits of
screening and treatment in middle-aged women.
Prostate cancer will be diagnosed most frequently in men aged 60-69, but more
prostate cancer deaths occur in the 80 and older age group. This pattern likely reflects
the effect of screening in the younger men and the long natural history of the disease
in many.
Trends
Trends in age-standardized incidence and mortality rates for all cancers are shown for
eight age groups in Figure 8. (Note that each age group has a different scale for the
vertical axis because of the wide range in age-specific rates.) Figure 8 demonstrates
the prediction of stable or increasing incidence rates in most of the age groups except
in men over age 69 at which time the rate will continue to drop. Cancer is more
common among males compared to females in youth under 20 and adults over 60.
However there will be more cancer cases and deaths in women between the ages of
20-59. Sex-specific cancers, such as breast and cervical cancer in particular, as well as
lung cancer, melanoma and thyroid cancer in females account for the marked shift in
incidence according to sex in ages 20-59. Breast cancer is the most common cancer
and cancer cause of death in this age group, accounting for 36% of cancer cases and
24% of deaths. The increasing cancer rate in young women 20-39 is particularly
marked and is explained by the increasing incidence of non-Hodgkin lymphoma,
melanoma, thyroid and kidney cancer.5
The incidence rate in men over 69 has been dropping primarily due to the decreasing
rate of lung cancer as a result of decreased tobacco use. Mortality rates have been
dropping for both sexes for ages up to 80. After that, mortality has been increasing in
females, while falling for males.
Canadian Cancer Society/National Cancer Institute of Canada: Canadian Cancer Statistics 2008
43
AGE AND SEX DISTRIBUTION OF CANCER
From 1995-2004, mortality rates have dropped significantly in all 10-year age groups
for men:
N
ages 30-69 by about 2% per year;
N
ages 70-79 and 80 or older by about 1% and 0.4% respectively.
In females, significant declines in mortality are also observed in:
N
ages 0-19 (greater than 3% per year);
N
ages 50-59 and 60-69 by about 1.4% and 0.5% per year, respectively.
Cancer is primarily a disease of older Canadians.
Cancer rates are expected to rise in younger women
aged 20-39. Notable declines in mortality have
occurred in most age groups.
44
Canadian Cancer Society/National Cancer Institute of Canada: Canadian Cancer Statistics 2008
AGE AND SEX DISTRIBUTION OF CANCER
Table 10
Distribution by Age Group and Sex, for All Cancers Combined, Canada,
2008
Age
Group
Population (in thousands)
2008 Estimates
New Cases
2008 Estimates
Deaths
2008 Estimates
Total
M
F
Total
M
F
Total
M
F
0-19
7,730
3,959
3,770
1,300
690
590
180
99
80
20-29
4,535
2,304
2,231
1,900
880
1,050
230
120
100
30-39
4,601
2,318
2,283
4,400
1,550
2,900
690
290
400
40-49
5,286
2,651
2,635
13,300
4,900
8,400
3,100
1,350
1,750
50-59
4,642
2,295
2,347
30,900
15,100
15,700
8,900
4,400
4,500
60-69
3,121
1,520
1,601
44,100
26,000
18,100
16,200
9,000
7,200
70-79
1,953
897
1,057
41,300
23,900
17,400
21,600
12,300
9,200
80+
1,227
443
785
29,300
14,000
15,300
23,000
11,300
11,700
33,095
16,386
16,709
166,400
87,000
79,400
73,800
38,800
35,000
All Ages
Note:
Incidence figures exclude non-melanoma skin cancer (basal and squamous). Total of rounded
numbers may not equal rounded total number. Please refer to Appendix II: Methods for further details.
The 2008 population projections were provided by the Census and Demographics Branch, Statistics
Canada.2
Source: Chronic Disease Surveillance Division, CCDPC, Public Health Agency of Canada
Canadian Cancer Society/National Cancer Institute of Canada: Canadian Cancer Statistics 2008
45
AGE AND SEX DISTRIBUTION OF CANCER
Table 11
Distribution by Age Group and Sex, for Selected Cancers, Canada, 2008
Age
Group
Lung
Total
Colorectal
M
F
Total
M
Prostate
Breast
F
M
F
New Cases
0-19
10
5
5
10
5
5
10
5
20-29
20
10
10
45
25
20
–
75
30-39
110
45
65
220
120
100
10
840
40-49
1,050
390
660
1,100
580
520
680
3,500
50-59
3,500
1,600
1,850
3,300
1,900
1,400
5,100
6,100
60-69
7,000
3,700
3,300
5,400
3,400
2,100
9,700
5,500
70-79
7,700
4,400
3,300
6,200
3,600
2,600
6,300
3,700
80+
All Ages
4,600
2,400
2,200
5,200
2,200
2,900
2,900
2,600
23,900
12,600
11,300
21,500
11,800
9,700
24,700
22,400
–
–
–
5
5
–
–
–
Deaths
0-19
20-29
5
5
5
10
10
5
–
5
30-39
60
25
35
55
25
25
–
100
40-49
710
290
420
290
150
130
10
440
50-59
2,500
1,250
1,250
950
550
400
120
940
60-69
5,400
3,000
2,400
1,800
1,150
640
510
1,050
70-79
6,800
3,900
2,900
2,500
1,500
1,000
1,300
1,100
80+
4,700
2,600
2,200
3,300
1,450
1,850
2,300
1,700
20,200
11,000
9,200
8,900
4,800
4,100
4,300
5,300
All Ages
– Fewer than 3 cases or deaths.
Source: Chronic Disease Surveillance Division, CCDPC, Public Health Agency of Canada
46
Canadian Cancer Society/National Cancer Institute of Canada: Canadian Cancer Statistics 2008
AGE AND SEX DISTRIBUTION OF CANCER
Figure 7
Age-Specific Incidence and Mortality Rates for All Cancers by Sex,
Canada, 2004
Incidence
4,000
Rate (per 100,000)
Males
3,000
2,000
Females
1,000
0
0-4
5-9 10-14 15-19 20-24 25-29 30-34 35-39 40-44 45-49 50-54 55-59 60-64 65-69 70-74 75-79 80-84 85+
Age Group
Mortality
4,000
Rate (per 100,000)
3,000
2,000
Males
1,000
Females
0
0-4
5-9 10-14 15-19 20-24 25-29 30-34 35-39 40-44 45-49 50-54 55-59 60-64 65-69 70-74 75-79 80-84 85+
Age Group
Note:
Incidence rates exclude non-melanoma skin cancer (basal and squamous).
Source: Chronic Disease Surveillance Division, CCDPC, Public Health Agency of Canada
Canadian Cancer Society/National Cancer Institute of Canada: Canadian Cancer Statistics 2008
47
AGE AND SEX DISTRIBUTION OF CANCER
Figure 8
Age-Standardized Incidence and Mortality Rates by Age Group,
All Cancers, Canada, 1979-2008
Age 0-19
Age 20-29
Rate (per 100,000)
50
Rate (per 100,000)
20
Females, Incidence
Males, Incidence
40
15
Males, Incidence
30
Females, Incidence
Estimated
Estimated
10
20
Males, Mortality
5
Males, Mortality
10
Females, Mortality
Females, Mortality
0
1979
1984
1989
1994
1999
2004 2008
0
1979
1984
1989
Age 30-39
150
1999
2004 2008
Age 40-49
Rate (per 100,000)
125
1994
400
Rate (per 100,000)
350
Females, Incidence
Females, Incidence
300
100
Estimated
Males, Incidence
75
250
200
Estimated
Males, Incidence
150
50
Females, Mortality
100
Females, Mortality
25
50
Males, Mortality
0
1979
1984
1989
1994
1999
2004 2008
0
1979
Males, Mortality
1984
1989
1994
1999
2004 2008
Note:
The range of rate scales differ widely between the four age groups. Incidence figures exclude nonmelanoma skin cancer (basal and squamous). Actual incidence data are available to 2005 except
for Quebec, Manitoba and Alberta where 2005 incidence is estimated. Please refer to Appendix II:
Methods for further details.
Source: Chronic Disease Surveillance Division, CCDPC, Public Health Agency of Canada
48
Canadian Cancer Society/National Cancer Institute of Canada: Canadian Cancer Statistics 2008
AGE AND SEX DISTRIBUTION OF CANCER
Figure 8 (continued)
Age-Standardized Incidence and Mortality Rates by Age Group,
All Cancers, Canada, 1979-2008
Age 50-59
800
Age 60-69
Rate (per 100,000)
Rate (per 100,000)
1,900
Females, Incidence
700
Males, Incidence
1,600
600
Males, Incidence
500
Estimated
1,300
Females, Incidence
Estimated
400
Males, Mortality
1,000
300
Males, Mortality
Females, Mortality
700
200
Females, Mortality
100
1979
1984
1989
1994
1999
2004 2008
400
1979
1984
1989
Age 70-79
4,000
3,100
2004 2008
Rate (per 100,000)
Males, Incidence
3,600
Males, Incidence
2,700
3,200
Estimated
2,300
1,900
2,800
1,500
2,000
Females, Incidence
1984
1989
Females, Incidence
1,600
Females, Mortality
1,200
Females, Mortality
300
1979
Estimated
Males, Mortality
2,400
Males, Mortality
700
1999
Age 80+
Rate (per 100,000)
1,100
1994
1994
1999
2004 2008
800
1979
1984
1989
1994
1999
2004 2008
Note:
The range of rate scales differ widely between the four age groups. Incidence figures exclude nonmelanoma skin cancer (basal and squamous). Actual incidence data are available to 2005 except
for Quebec, Manitoba and Alberta where 2005 incidence is estimated. Please refer to Appendix II:
Methods for further details.
Source: Chronic Disease Surveillance Division, CCDPC, Public Health Agency of Canada
Canadian Cancer Society/National Cancer Institute of Canada: Canadian Cancer Statistics 2008
49
PROBABILITY OF DEVELOPING/DYING FROM CANCER
T
able 12 presents the probability of Canadians developing the more common
cancers within specific 10-year age periods, as well as the lifetime probability of
developing or dying from one of these cancers.
Data for the lifetime probability of developing or dying from cancer is presented both
as a percentage and as a ratio. Men have a lifetime probability of about 45% of
developing cancer or 1 in 2.2. This means that nearly one of every two men is
expected to develop cancer during his life. Similarly, women have a nearly 40%
chance of developing cancer in their lifetime, or slightly more than 1 of every 3. One
in 3.5 men and 1 in 4.2 women, or approximately 1 in 4 of all Canadians, will die of
cancer.
During his lifetime, 1 in 7 men will be diagnosed with prostate cancer, the most
common cancer (excluding non-melanoma skin cancer) to afflict men, and 1 in 27 will
die from it. For men, the likelihood of dying from cancer is greatest for lung cancer, at
1 in 13.
During her lifetime, 1 in 9 women is expected to develop breast cancer, the most
common cancer (excluding non-melanoma skin cancer) to afflict women, and 1 in 28
women is expected to die from it. For women, the likelihood of dying from cancer is
greatest for lung cancer, at 1 in 18.
The probability of developing cancer within the next 10 years gives a useful indication
of the short-term risk of cancer. Although the lifetime risk of developing breast cancer
is 11% (1 in 9) and risk increases with age, the chance of a 60-year-old woman
developing breast cancer before age 70 is only 3% (1 in 33); this figure may be more
meaningful than the lifetime probability statistic for a 60-year-old woman contemplating
her risk of breast cancer. Table 12 shows how steeply the risk of developing prostate
cancer rises with age. A man has very little probability of being diagnosed with
prostate cancer by age 50. However, a 70-year-old man has a 6% (1 in 16) chance of
being diagnosed with prostate cancer by age 80; this percentage represents the highest
risk for either men or women of developing a specific cancer in any decade of life.
In contrast to the general increase in risk of developing or dying from cancer with
increasing decade of age, there is a decrease between ages 70-79 and 80-89 for many
cancers. This is due to the increase in the probability of death from other causes at an
advanced age.
Approximately one in four Canadians
will die of cancer, the risk being slightly
greater among men than women.
50
Canadian Cancer Society/National Cancer Institute of Canada: Canadian Cancer Statistics 2008
PROBABILITY OF DEVELOPING/DYING FROM CANCER
Table 12
Lifetime Probability of Developing or Dying from Cancer and the
Probability of Developing Cancer by Age, Canada
Lifetime Probability of
Developing
%
One in:
Probability (%) of Developing Cancer
in next 10 years by age
Dying
%
One in:
30-39
40-49
50-59
60-69
70-79
80-89
Males
All Cancers
44.5
2.2
28.5
3.5
0.7
1.7
6.1
15.1
21.6
20.5
Prostate
13.5
7.4
3.7
26.9
–
0.2
1.7
5.3
6.1
4.8
8.6
11.7
8.0
12.6
–
0.2
0.8
2.5
4.3
3.6
Lung
Colorectal
7.4
13.6
3.7
27.1
0.1
0.2
0.8
2.1
3.3
3.2
Bladder*
3.5
28.3
1.1
95.0
–
0.1
0.3
0.9
1.6
1.8
Non-Hodgkin
Lymphoma
2.2
46.3
1.1
93.4
0.1
0.1
0.3
0.6
0.9
0.8
Leukemia
1.7
59.2
1.1
92.7
–
0.1
0.2
0.4
0.6
0.8
Kidney**
1.5
64.9
0.7
137.5
–
0.1
0.3
0.5
0.6
0.5
Stomach
1.4
72.6
0.9
106.1
–
–
0.1
0.4
0.6
0.6
Oral
1.4
72.8
0.5
197.9
–
0.1
0.3
0.4
0.4
0.4
Melanoma
1.3
74.2
0.4
284.4
0.1
0.1
0.2
0.3
0.5
0.5
Pancreas
1.3
79.6
1.3
74.4
–
–
0.1
0.4
0.5
0.5
Multiple Myeloma
0.8
132.3
0.5
194.3
–
–
0.1
0.2
0.3
0.4
Brain
0.8
132.9
0.6
171.2
–
0.1
0.1
0.2
0.2
0.2
Esophagus
0.7
138.7
0.8
121.5
–
–
0.1
0.2
0.3
0.3
Larynx
0.6
164.7
0.3
357.5
–
–
0.1
0.2
0.3
0.2
Liver
0.6
168.1
0.3
307.3
–
–
0.1
0.2
0.2
0.2
– Value less than 0.05
* The substantial increase in the lifetime probability of developing bladder cancer as compared with previous
years reflects the decision to include in situ carcinomas (excluding Ontario) as of the 2006 edition of
Canadian Cancer Statistics.
** The decrease in the lifetime probability of developing kidney cancer as compared with previous years
reflects the decision to exclude ureter and other and unspecified urinary organs as of the 2008 edition of
Canadian Cancer Statistics.
Note:
The probability of developing cancer is calculated based on age- and sex-specific cancer incidence
(excluding non-melanoma basal cell and squamous cell skin cancer) and mortality rates for Canada
in 2004 and on life tables based on 2002-2004 all cause mortality rates. The probability of dying from
cancer represents the proportion of persons dying from cancer in a cohort subjected to the mortality
conditions prevailing in the population at large in 2004. See Appendix II: Methods for details.
Source: Chronic Disease Surveillance Division, CCDPC, Public Health Agency of Canada
Canadian Cancer Society/National Cancer Institute of Canada: Canadian Cancer Statistics 2008
51
PROBABILITY OF DEVELOPING/DYING FROM CANCER
Table 12 (continued)
Lifetime Probability of Developing or Dying from Cancer and the
Probability of Developing Cancer by Age, Canada
Lifetime Probability of
Developing
%
One in:
Probability (%) of Developing Cancer
in next 10 years by age
Dying
%
One in:
30-39
40-49
50-59
60-69
70-79
80-89
Females
All Cancers
39.3
2.5
24.1
4.2
1.2
3.1
6.1
10.3
13.9
13.9
Breast
11.0
9.1
3.6
28.0
0.4
1.3
2.3
2.9
3.1
2.5
6.4
15.7
3.3
30.6
–
0.2
0.6
1.3
2.4
2.8
Colorectal
Lung
6.2
16.0
5.4
18.4
–
0.2
0.7
1.8
2.5
1.8
Body of Uterus
2.4
42.2
0.6
174.5
–
0.1
0.5
0.8
0.7
0.5
Non-Hodgkin
Lymphoma
1.9
52.2
1.0
103.6
0.1
0.1
0.2
0.4
0.6
0.7
Ovary
1.4
72.2
1.1
87.0
–
0.1
0.2
0.3
0.4
0.4
Pancreas
1.3
74.4
1.5
68.2
–
–
0.1
0.3
0.5
0.6
Thyroid
1.2
81.3
0.1 1,160.0
0.2
0.3
0.2
0.2
0.1
0.1
Leukemia
1.2
83.1
0.7
134.5
–
0.1
0.1
0.2
0.4
0.5
Bladder*
1.2
84.2
0.4
229.6
–
–
0.1
0.2
0.4
0.5
Melanoma
1.1
90.3
0.2
485.7
0.1
0.1
0.2
0.2
0.3
0.3
Kidney**
1.0
98.6
0.4
233.6
–
0.1
0.2
0.2
0.3
0.3
Stomach
0.8
125.7
0.6
165.6
–
–
0.1
0.1
0.3
0.4
Cervix
0.7
149.7
0.2
422.6
0.1
0.1
0.1
0.1
0.1
0.1
Oral
0.7
150.6
0.3
358.3
–
–
0.1
0.1
0.2
0.2
Multiple Myeloma
0.6
161.0
0.4
229.4
–
–
0.1
0.1
0.2
0.3
Brain
0.6
175.1
0.5
220.2
–
–
0.1
0.1
0.2
0.1
– Value less than 0.05
* The substantial increase in the lifetime probability of developing bladder cancer as compared with previous
years reflects the decision to include in situ carcinomas (excluding Ontario) as of the 2006 edition of
Canadian Cancer Statistics.
** The decrease in the lifetime probability of developing kidney cancer as compared with previous years
reflects the decision to exclude ureter and other and unspecified urinary organs as of the 2008 edition of
Canadian Cancer Statistics.
Note:
The probability of developing cancer is calculated based on age- and sex-specific cancer incidence
(excluding non-melanoma basal cell and squamous cell skin cancer) and mortality rates for Canada
in 2004 and on life tables based on 2002-2004 all cause mortality rates. The probability of dying from
cancer represents the proportion of persons dying from cancer in a cohort subjected to the mortality
conditions prevailing in the population at large in 2004. See Appendix II: Methods for details.
Source: Chronic Disease Surveillance Division, CCDPC, Public Health Agency of Canada
52
Canadian Cancer Society/National Cancer Institute of Canada: Canadian Cancer Statistics 2008
PREVALENCE
C
ancer prevalence refers to the total number of people who are living with a
diagnosis of cancer at a certain point in time. Table 13 shows the estimated
number of people who were living with a cancer that was diagnosed in the 15 year
period from 1990 to 2004. Also shown are the percentage of the population
represented by this number and its reciprocal (i.e., the population that gives rise to one
prevalent case). These estimates are based on survival rates from Saskatchewan for the
period 1986 to 2001 (national data were unavailable), applied to the Canadian
incidence data.
The overall estimated 15-year prevalence of cancer in the Canadian population is
2.5% among men and 2.8% among women (Table 13). In the year 2004, there were an
estimated 396,900 male and 456,500 female cancer survivors, for a total of
approximately 853,400 Canadians (2.7% overall). This is a 21% increase from the
corresponding 679,800 figure reported previously for 1998. 6 The growth in the
number of cancer survivors has been the result of increasing numbers of new cases of
cancer and improved survival.
One in 40 Canadian men and 1 in 35 Canadian women had a cancer diagnosis at some
time during the previous 15 years. Among men, the most prevalent type of cancer is
prostate cancer, at 127,200 prevalent cases or 0.8% of the male population, followed
by colorectal (54,800) and lung (18,200) cancers.
Breast cancer is the most prevalent cancer in women (166,000 cases or 1.0% of the
female population), which is also followed by colorectal (54,700 cases) and lung
(20,200) cancers. Prevalence is influenced by incidence rates and the average period
of survival, both of which are age-dependent. Therefore, even though age adjusted
incidence rates and survival rates are higher overall for prostate than breast cancer, the
prevalence of breast cancer is higher than that of prostate cancer because breast cancer
is more common in younger age groups. In the case of lung cancer, survival is poor,
so even though incidence is high, prevalence is relatively low.
In estimating prevalence, it was assumed that survival rates from Saskatchewan were
representative of those for Canada. Although there are alternative estimation methods,
they are limited in their ability to report national prevalence for specific types of
cancer. For example, the Canadian Community Health Survey (CCHS 2005) has selfreported data on personal history of cancer, but not for specific types of cancer. The
CCHS 2005 survey indicated that 5.4% of Canadians reported a personal history of
cancer, which was higher than the prevalence estimate for all Canadians (2.6%). This
may be partly because the CCHS 2005 includes non-melanoma skin cancers, which
are common and associated with very high survival, but which are not included in the
Canadian Cancer Statistics estimates. As well, the CCHS asked about ever having
had cancer, not just about having had cancer in the previous 15 years. There have also
been improvements in survival since 2001 (the last available year for the Saskatchewan
data) which means that the prevalence estimates presented herein are likely to be
too low.
Prevalence is a useful indicator of the burden cancer poses both at the personal level
and at the level of the health care system. Although many individuals who survive
cancer continue to live productive and rewarding lives, the cancer experience is
difficult and presents many physical, emotional and spiritual challenges to patients and
to their families and loved ones. These challenges may persist beyond the point of
physical recovery from the cancer itself, often requiring extensive use of rehabilitation
Canadian Cancer Society/National Cancer Institute of Canada: Canadian Cancer Statistics 2008
53
PREVALENCE
and supportive care resources. A large number of Canadians live with the effects of
cancer, require repeated active treatment and have continuing needs for cancer care
resources and support services. This increased demand and the complexity of
survivors’ health needs must be considered in the planning and development of
interdisciplinary health services.
Table 13
Estimated Cancer Prevalence by Sex, Canada, 2004
Prevalence Count
15 Year
All Cancers
Female Breast
Prostate
Colorectal
Lung
Other Cancers
Prevalence Percentage
of 2004 Population
Prevalence
One in
Total
Males
Females
Total
Males
Females
Total
Males
Females
853,400
396,900
456,500
2.7
2.5
2.8
37
40
35
–
–
166,000
–
–
1.0
–
–
97
–
127,200
–
–
0.8
–
–
125
–
109,500
54,800
54,700
0.3
0.3
0.3
292
289
295
38,400
18,200
20,200
0.1
0.1
0.1
833
870
799
412,300
196,700
215,600
1.3
1.2
1.3
78
81
75
Note:
Survival rates are based on Saskatchewan data from 1986 to 2001 with follow-up to 2002. See
Appendix II: Methods for further details.
Source: Chronic Disease Surveillance Division, CCDPC, Public Health Agency of Canada
54
Canadian Cancer Society/National Cancer Institute of Canada: Canadian Cancer Statistics 2008
FIVE-YEAR RELATIVE SURVIVAL
Why examine cancer survival?
Like incidence and mortality rates, population-based survival is an indicator of the
burden of cancer. Its unique contribution is as a measure of the severity of disease: the
average person diagnosed with a cancer with a poor five-year relative survival ratio
(RSR), such as lung cancer, has a small probability of living until the fifth anniversary
of his/her diagnosis. Examined across cancer types and regions, survival estimates can
be used to establish priority areas for improving prognosis. 7 Examined over time, and
in conjunction with incidence and mortality trends, they represent an important indicator
of progress in cancer control. 8 While a population-based survival estimate is a useful
“average” indicator,9 it does not necessarily reflect a specific person’s chances of
surviving for a given time (e.g., five years) after diagnosis. This is because it is based
on the experiences of a group of people with a heterogeneous mix of disease characteristics. Likewise, the confidence intervals around survival estimates do not represent
the range of possible prognoses for individual patients, but rather statistical variation.
What are the determinants of survival?
The prognosis of a cancer patient may be influenced by host factors (e.g., age, sex,
comorbid conditions, socio-economic status and lifestyle factors), tumour-related
factors (e.g., stage of disease, histological subtype) and system factors related to
cancer control (e.g., availability and quality of early detection, diagnostic and
treatment services). Stage of disease at diagnosis is a very important prognostic
indicator but is not yet available in Canada at a population level.
What is the relative survival ratio? (See Glossary for details)
The relative survival ratio is the preferred measure for assessing the survival of cancer
patients in a population. It is defined as the ratio of the observed survival for a group
of cancer patients to the survival expected for people in the same general population. 10
A five-year relative survival ratio of 80% means that people with that cancer had 80%
of the likelihood of living for 5 years after diagnosis compared to similar people in the
general population. An alternative interpretation is that 20% of people with that cancer
died within 5 years of diagnosis as a direct or indirect result of their cancer, or the risk
factors that predisposed them to develop cancer.
Estimated relative survival ratios
Estimates included here were produced by Statistics Canada specifically for this
publication. Canadian five-year relative survival ratios for the period from 2001 to
2003 are shown in Table 14 and Figure 9. The data are presented for all invasive
cancers combined and for selected cancers in descending order of survival for both
sexes combined.
The five-year RSR for all cancers combined was 62%. This implies that those
diagnosed with cancer from 2001 to 2003 were estimated to be 62% as likely to live
for another five years as will comparable members of the general population. The
corresponding five-year observed survival (i.e., the proportion of patients actually
alive five years after their diagnosis) was 54% (data not shown). Relative survival was
better among women (63%) than men (61%).
Five-year RSRs were highest for thyroid (98%) and testicular (96%) cancer. Among
men, prostate cancer also had a very favourable prognosis (95% RSR) as did
melanoma among women (93% RSR) (Table 14). The lowest RSRs were observed
Canadian Cancer Society/National Cancer Institute of Canada: Canadian Cancer Statistics 2008
55
FIVE-YEAR RELATIVE SURVIVAL
among those diagnosed with pancreatic cancer (6%) followed by cancers of the
esophagus (14%), lung (males 13%, females 18%) and liver (males 17%, females 16%).
For most of the cancers examined, survival was similar or superior among women.
Provincial age-standardized relative survival ratios for prostate, breast, colorectal and
lung cancers (i.e., the most commonly diagnosed cancer types) are provided in Table
15. While there was little provincial variation for breast cancer, age-standardized
RSRs for prostate cancer ranged from a low of 88% in Saskatchewan to a high of 98%
in Nova Scotia. The highest provincial age-standardized RSR for colorectal cancer,
63%, was observed in both British Columbia and in Ontario and the lowest in Prince
Edward Island (56%) and Nova Scotia (59%). The highest provincial age-standardized
RSR for lung cancer was in Manitoba (19%); the lowest occurred in both Alberta and
in Prince Edward Island (13%). In interpreting the RSRs associated with Prince Edward
Island it should be noted that, due to the relatively small number of cases available for
analysis, estimates for this province are less precise than for other provinces.
There are a number of possible explanations for the observed variation between provinces, including differential patterns of use and diffusion of screening and early detection
tests; varying patterns of diagnosis and availability and access to specialized cancer
treatments; or differences in population attributes. Without data on stage of disease at
diagnosis and treatment details, it is difficult to assess which of these might be important.
Five-year relative survival for both breast and prostate cancer was quite favourable for
all age groups examined, though reduced somewhat among those diagnosed at relatively
very young or very old ages (Table 16). The best prognosis for breast cancer was
observed among those diagnosed between the ages of 40 and 79 (88%); for prostate
cancer, men aged 50 to 79 faired best at 96%. It is uncertain whether the underlying
reasons for the poorer survival among those diagnosed with prostate cancer before the
age of 50 are biologically or socially/behaviourally based.11 For lung cancer, relative
survival was highest in the youngest age group, and then generally decreased with
increasing age from 39% among those 20 to 39 years at diagnosis to 9% among those
aged 80 to 99 at diagnosis. With the exception of those in the oldest group, survival
was consistent across age groups for colorectal cancer (64%). Relative survival is
generally poorer among those diagnosed with cancer at an older age because they may
receive less therapy due to the presence of other diseases or conditions which reduce the
body’s ability to tolerate and respond to cancer treatments (referred to as ‘co-morbidity’);
and they may receive less aggressive treatment independently of co-morbidity.12,13
Examination of survival estimates can help to identify
gaps and establish priorities for systemic change to
improve survival. It is critical to expand collection of data
on stage of disease for all newly diagnosed cancer
patients to enhance interpretation of survival differences.
56
Canadian Cancer Society/National Cancer Institute of Canada: Canadian Cancer Statistics 2008
FIVE-YEAR RELATIVE SURVIVAL
Table 14
Estimated Five-year Relative Survival Ratio (%) (and 95% Confidence
Interval) for the Most Common Cancers by Sex, Canada excluding
Quebec*, 2001-2003
Relative Survival Ratio (%) (and 95% confidence interval)
Both Sexes
Males
Females
All Cancers
62 (62-62)
61 (61-61)
63 (62-63)
Thyroid
98 (97-98)
93 (91-95)
99 (98-99)
†
Testis
96 (95-97)
96 (95-97)
–
Prostate
95 (94-95)
95 (94-95)
–
Melanoma
90 (89-91)
87 (86-88)
93 (92-94)
Breast
87 (87-88)
85 (79-91)
87 (87-88)
Body of Uterus
86 (85-87)
–
86 (85-87)
Hodgkin Lymphoma
86 (84-87)
85 (83-88)
86 (83-88)
Bladder (including in situ)**
78 (77-80)
79 (77-80)
76 (74-79)
Cervix
74 (73-76)
–
74 (73-76)
Kidney
66 (65-67)
65 (63-67)
67 (65-69)
Larynx
64 (62-67)
64 (62-67)
64 (59-69)
Oral
63 (62-64)
60 (59-62)
68 (66-70)
Colorectal
62 (62-63)
62 (61-63)
63 (62-63)
Non-Hodgkin Lymphoma
60 (59-61)
58 (57-60)
63 (61-64)
Leukemia
50 (48-51)
50 (48-51)
50 (48-52)
Ovary
40 (39-42)
–
40 (39-42)
Multiple myeloma
34 (32-36)
35 (33-38)
33 (30-35)
Stomach
23 (22-24)
22 (20-23)
26 (24-28)
Brain
23 (21-24)
22 (21-24)
23 (21-25)
Liver
17 (15-19)
17 (15-19)
16 (13-19)
Lung
15 (15-16)
13 (13-14)
18 (18-19)
Esophagus
14 (13-16)
14 (13-16)
14 (11-16)
Pancreas
6
(6-7)
6
(6-7)
6
(5-7)
– Not applicable
* Data from Quebec have been excluded, in part because the method of ascertaining the date of cancer
diagnosis differs from the method used by other registries and because of issues in correctly ascertaining
the vital status of cases.
** Excluding data from Ontario, which does not currently report in situ bladder cases.
† Cancers have been ranked from highest to lowest relative survival.
Note:
The differences in cancer definitions with other sections can be found in Appendix II: Methods.
Source: Health Statistics Division, Statistics Canada
Canadian Cancer Society/National Cancer Institute of Canada: Canadian Cancer Statistics 2008
57
FIVE-YEAR RELATIVE SURVIVAL
Table 15
Estimated Age-Standardized Five-year Relative Survival Ratio (%)
(and 95% Confidence Interval) Both Sexes Combined by Province*
for Selected Cancers, 2001-2003
Canada
P.E.I.**
N.S.
N.B.
Ont.
Man.
Sask.
Alta.
B.C.
Relative Survival Ratio (%) (and 95% confidence interval)
Prostate
Breast
Colorectal
94 (94-95)
87 (87-88)
62 (62-63)
91 (85-96)
85 (80-90)
56 (49-64)
98 (95-100)
85 (83-87)
59 (56-62)
95 (92-97)
87 (85-89)
60 (57-63)
95 (94-95)
87 (87-88)
63 (62-64)
92 (90-94)
88 (86-90)
62 (59-64)
88 (86-90)
88 (86-90)
61 (58-64)
91 (90-92)
87 (86-89)
60 (58-62)
95 (94-96)
87 (87-88)
63 (62-65)
Lung
15 (15-16)
13 (10-18)
15 (14-17)
15 (13-17)
16 (16-17)
19 (17-21)
15 (13-17)
13 (12-14)
14 (13-15)
** Newfoundland and Labrador survival ratios are not shown as they are artefactually high. This is most likely
because cancers were under-reported as the cancer registry did not receive death certificate information
from the vital statistics office. The survival of such cases is generally less favourable.14 Data from Quebec
have been excluded, in part because the method of ascertaining the date of cancer diagnosis differs from
the method used by other registries and because of issues in correctly ascertaining the vital status of
cases.
** All expected survival proportions for P.E.I. were derived from Canadian life tables as stable estimates for
single ages could not be produced for this province because of small population counts. Relative survival
estimates for P.E.I. may be biased to the extent and direction that general population expected survival
differed between this province and Canada as a whole. Data from the territories are included in the national
survival estimates but age-standardized territorial relative survival ratios are not presented because in each
case there were too few cases to calculate reliable age-standardized estimates.
Note:
The differences in cancer definitions with other sections can be found in Appendix II: Methods.
Source: Health Statistics Division, Statistics Canada
Table 16
Estimated Five-year Relative Survival Ratio (%) (and 95% Confidence
Interval) by Age Group for Selected Cancers, Canada excluding Quebec,
2001-2003
Relative Survival Ratio (%) (and 95% confidence interval)
Prostate
20-39
40-49
50-59
60-69
70-79
80-99
–
92 (89-94)
96 (95-97)
97 (97-98)
95 (94-96)
83 (81-86)
Breast
81 (80-83)
88 (87-89)
89 (88-89)
89 (88-90)
88 (87-89)
80 (78-83)
Colorectal
64 (61-68)
65 (63-67)
65 (64-67)
64 (63-65)
63 (62-64)
57 (55-58)
Lung
39 (33-44)
22 (20-24)
19 (18-20)
16 (16-17)
14 (13-14)
9 (8-10)
– Estimates were not available due to the very small number of cases.
Note:
The differences in cancer definitions with other sections are described in Appendix II: Methods.
Source: Health Statistics Division, Statistics Canada
58
Canadian Cancer Society/National Cancer Institute of Canada: Canadian Cancer Statistics 2008
FIVE-YEAR RELATIVE SURVIVAL
Figure 9
Estimated Five-year Relative Survival Ratio (%) for the Most Common
Cancers, Both Sexes Combined, Canada excluding Quebec*, 2001-2003
Thyroid
Testis
Prostate
Melanoma
Breast
Body of Uterus
Hodgkin Lymphoma
Bladder**
Cervix
Kidney
Larynx
Oral
Colorectal
Non-Hodgkin Lymphoma
Leukemia
Ovary
Multiple myeloma
Stomach
Brain
Liver
Lung
Esophagus
Pancreas
0
10
20
30
40
50
60
70
80
90
100
Five-year Relative Survival Ratio (%)
** Data from Quebec have been excluded, in part because the method of ascertaining the date of cancer
diagnosis differs from the method used by other registries and because of issues in correctly ascertaining
the vital status of cases. Please refer to Appendix II: Methods for further details.
** Excluding data from Ontario, which does not currently report in situ bladder cases.
Source: Health Statistics Division, Statistics Canada
Canadian Cancer Society/National Cancer Institute of Canada: Canadian Cancer Statistics 2008
59
SPECIAL TOPIC: CHILDHOOD CANCER (AGES 0 TO 14)
I
n Canada close to 850 children (defined as 0 to 14 years of age*) are diagnosed with
cancer every year, and around 135 die from their disease (Table 17). In Canadian
children over the age of one month, cancer is the leading disease-related cause of
death, second only to avoidable injury in overall mortality.15 While many children
with cancer now have the opportunity for cure, a significant proportion of survivors
experience life-long adverse effects, as a result either of the cancer itself or of its
treatment.16 Included in these effects are cardiopulmonary, endocrine, renal or pulmonary dysfunction, neurocognitive impairments and the development of second cancers.
Although childhood cancers account for a little over half of one percent of all cancers
diagnosed in Canada, they are of significant public health importance. Cancer in
children creates a disproportionate impact on health, economic and social welfare
systems, as a consequence of the loss of young lives. As well, both child and family
are affected by emotional trauma and life-long consequences. Families affected by
childhood cancer must often provide care for other young children in the home while
attempting, at the same time, to navigate their way through the health and social
welfare systems. Parents often work less or stop working altogether, which creates
financial stress. Moreover, the impacts of childhood cancer often continue beyond the
end of treatment, with both the survivors and their families requiring ongoing
emotional, physical and financial support as well as health care.17
Cancers in children differ from those occurring in adults in both their site of origin
and their behaviour.18,19 The majority of cancers in adults are carcinomas which start
in the glands or tissues that line organs such as the breast, lung, prostate or colon. In
children, carcinomas are very rare. Tumours in children have short latency periods,
often grow rapidly and are aggressive, invasive and frequently spread to other parts
of the body. Relative to adults, cancers in children include a higher proportion of
hematopoietic (blood and lymphatic) malignancies, most commonly leukemia. In
order to account for the differences in childhood cancers as compared with those in
adults, a separate classification scheme of diagnostic groupings has been developed. 20
The International Classification of Childhood Cancers comprises 12 major diagnostic
categories, with associated subgroups for additional refinement.
Table 17 presents the number of new cases of childhood cancer with age-standardized
incidence rates, and the number of deaths due to cancer with age-standardized
mortality rates during 2000-2004. For this period, cancer was diagnosed each year in
an average of 850 children aged 0 to 14, and an average of 135 died each year from
their disease. Leukemia accounted for 33% of new cases and 27% of deaths due to
cancer in children, and remains the most common of the childhood cancers. Cancers
of the central nervous system, the second most common group of childhood cancers,
constituted approximately 20% of new cases and 30% of deaths, followed by
lymphomas, which accounted for 12% of new cases and 5% of deaths.
The overall incidence of childhood cancer has remained relatively stable since 1985,
varying from 144 to 159 per 1,000,000 children (Figure 10, all cancers). Estimates of
time trends and tests for changes in the trends for age-standardized incidence and
mortality rates were conducted using changepoint regression analysis (for details on
methods, see Appendix II: Methods). The estimated average annual percent change in
incidence rates between 1985 and 2004 was not statistically significantly different
*
60
Note: While data in this section are based on children 0 to 14 years of age, most pediatric oncology
centres in Canada treat children 0 to 17 years of age.
Canadian Cancer Society/National Cancer Institute of Canada: Canadian Cancer Statistics 2008
SPECIAL TOPIC: CHILDHOOD CANCER (AGES 0 TO 14)
from zero for all cancers combined or for any of the cancers shown in Figure 10.
During the same period, however, there was a dramatic decline in childhood cancer
mortality. Linear trends observed statistically significant decreases in the agestandardized mortality rates for all cancers and each of the selected cancers examined
(p<0.05).
Incidence rates are highest among young children, aged 0 to 4 years (Table 18). Rates
are lower and similar for children aged 5 to 9 and 10 to 14. Lymphoma rates increase
with age, while rates for neuroblastoma peak prior to age one and become very rare
after the age of five. Overall, childhood cancer occurs more commonly in males than
in females. For every newly diagnosed female with cancer, there are 1.2 males
(Table 19). The largest differences by sex are lymphomas (ratio of male to female
new cases, 2.1 to 1) and hepatic tumours (ratio of male to female new cases, 1.4 to 1).
Cancer Control in Children
Cancer control aims not only to prevent and cure cancer, but also to increase both
survival and quality of life after diagnosis. Cancer control is strengthened by
knowledge gained through research, surveillance, and outcome evaluation, which can
then be applied to the development of more effective future strategies and actions.21
Moreover, all activities that together form the continuum of prevention, early
detection, diagnosis, treatment, survivorship, and palliative care are components of
cancer control.
Prevention and Screening
Little is known about what causes childhood cancers, thereby limiting opportunities
for primary prevention. While many studies have examined possible risk factors, few
have been found to be directly related.22 Certain genetic abnormalities and inherited
diseases are associated with a higher risk of childhood cancer (such as Down syndrome).
Chemotherapeutic agents, radiotherapy, or maternal (intra-uterine) exposure to
diethylstilbestrol (DES) or to ionizing radiation are a few of the better-established risk
factors for childhood cancers. However, these risk factors account for only a small
percentage of all cases.
Screening for childhood tumours has also proven ineffective, mainly due to short
latency periods and cancers that are typically aggressive and fast growing. With the
exception of neuroblastoma, no screening methods have been developed to date for
childhood cancer. However, screening for neuroblastoma was determined to be
ineffective after studies found no decline in mortality related to screening.23, 24
Moreover, because infant neuroblastoma often regresses naturally, screening resulted
in both an increased incidence of the disease and unnecessary treatment.
Diagnosis and Treatment
Currently, the most effective methods of cancer control in children are accurate
diagnosis and effective treatment. In Canada, definitive diagnosis and treatment for
children with cancer is available at one of 17 specialized pediatric cancer treatment
centres (Table 23). In general, for Canadian children with cancer, diagnosis and the
start of treatment occur rapidly. During 1995-2000, the median interval between first
presentation to a health care professional and start of treatment was 17 days (Figure 11).
This interval was shortest for children under 1 year of age (median interval of 9 days),
and longest for 10- and 14-year olds where the median interval was 26 days; a pattern
that is consistent with the biology of tumours that predominate in each age group. The
Canadian Cancer Society/National Cancer Institute of Canada: Canadian Cancer Statistics 2008
61
SPECIAL TOPIC: CHILDHOOD CANCER (AGES 0 TO 14)
main factors that affect the time from the onset of symptoms to diagnosis include the
biology of the tumour, the site of occurrence, and the patient’s age.25
Metastasis, the process by which cancer spreads from one part of the body to another
through the bloodstream or lymphatic system, is often an important marker to indicate
disease severity. Excluding non-applicable cases (i.e. cancers which are systematic in
origin, such as leukemia and lymphoma), the proportion of patients with metastatic
disease at diagnosis are shown in Table 20. Metastases were present at diagnosis in
approximately one quarter of all cancer cases. Sympathetic nervous system tumours,
hepatic and renal tumours were most likely to have metastasized before diagnosis
(56, 35 and 31% respectively). The lowest proportion of metastasis was for cases of
retinoblastoma (5%), followed by cancers of the central nervous system (13%); these
findings are consistent with the known biological behaviour of these diseases.
The role of collaborative clinical trials in therapy for children with cancer has been
vital in advancing progress. Randomized clinical trials are studies primarily designed
to compare the effectiveness of different treatments, with the ultimate aim of
increasing survival while minimizing side effects. Clinical trials typically study the
best current standard treatment (based on results of previous clinical trials) and an
experimental treatment that includes some modification or addition to the standard
treatment. The standard treatment of a randomized clinical trial will often also be used
as the basis of treatment for children when a clinical trial is not open, they do not meet
eligibility criteria, or when a family declines to participate in the research. In Canada,
an estimated 80% of children with cancer are either enrolled in a clinical trial or
treated according to the standard treatment developed from clinical trial methodologies
(Figure 12). Percentages vary widely by type of cancer, from 95% of children with
leukemia receiving treatment in a randomized clinical trial or a standardized treatment
protocol to 50% of children with central nervous system neoplasms (since a portion
are treated by surgery alone, such cases do not get enrolled in a clinical trial or
standard treatment protocol).
Late Effects
Progress in the treatment of cancer in children now means that over 82% of children
with cancer survive at least 5 years after diagnosis.26 This has led to an increase in the
number of childhood cancer survivors and the need to monitor survivors of childhood
cancer for late effects of therapy. Based on U.S. data, it is estimated that 1 in 1000
people in the developed world are survivors of childhood cancer. 27 Late effects are
broadly defined as problems that develop after the completion of cancer treatment.
The importance of examining late effects in survivors of childhood cancer relates
primarily to concern for the future wellbeing of survivors. Childhood cancer survivors
are known to be at increased risk of physical, neurocognitive and psychological health
problems, as a result of both their disease and the therapies they have undergone.
Chemotherapy, radiation therapy and surgery can all lead to late effects involving any
organ or system in the body. In general, adverse effects from radiation may not be
apparent for several years. Chemotherapy problems that develop soon after treatment
are often temporary, but some may lead to long-term complications.28 Due to the poor
survival rate of childhood cancer in previous decades, knowledge regarding the longterm effects of treatments on childhood cancer survivors as they age beyond midlife is
largely unknown. As treatments change, new research will be required to monitor
long-term impacts associated with the disease and its treatment.
62
Canadian Cancer Society/National Cancer Institute of Canada: Canadian Cancer Statistics 2008
SPECIAL TOPIC: CHILDHOOD CANCER (AGES 0 TO 14)
Owing to the variable nature of late effects and lack of knowledge, management is
often difficult. The emergence of late effects depends on many factors: age, exposure
to chemotherapy and radiation during treatment (including both the dose and the part
of body that was treated), biological predisposition, and the severity of the original
disease. Some late effects may be identified relatively early and resolved without
consequence; others may not appear until years later and may influence the
progression of other age-related diseases.
An estimated two-thirds of survivors have at least one chronic or late-occurring effect
from their cancer therapy, while up to one-third have a major, serious or life
threatening complication. Endocrine and metabolic complications are the most
prevalent late effects among childhood cancer survivors, followed by sensory
problems, neurocognitive impairment, cardiopulmonary dysfunction, gastrointestinal
disorders and secondary malignant neoplasms.29 Survivors are also found to be at an
increased risk of early death up to 25 years after diagnosis, owing mainly to a relapse
of the primary cancer in the early years following the completion of therapy.30
Survival
Observed survival proportions (OSP) estimated for children (aged 0 to 14 years)
diagnosed from 1999 to 2003 are presented in Table 21. These estimates were derived
using period analysis and exclude data from the province of Quebec (see Appendix II:
Methods). For all childhood cancers combined the five-year OSP was estimated to be
82%. The corresponding one- and three-year survival proportions were 92% and 85%,
respectively. Within specific diagnostic groups, the highest five-year OSPs were
observed for retinoblastoma (99%), renal tumours (92%), lymphomas (89%), and
germ cell tumours (89%) while the lowest were seen in neuroblastoma (70%) and
malignant bone tumours (72%).
Survival for those diagnosed with acute myeloid leukaemia (five-year OSP 67%) was
considerably less than for those diagnosed with a lymphoid leukaemia (five-year OSP
90%). The outlook for those diagnosed with Hodgkin lymphoma (93% five-year OSP)
was better than those diagnosed with non-Hodgkin lymphoma (84% five-year OSP).
Similarly, the five-year prognosis for certain types of brain cancers such as astrocytoma
(87%) was found to be higher than intracranial and intraspinal embryonal tumours (60%).
Thyroid carcinomas (98% five-year OSP) and malignant melanomas (92% five-year OSP),
the two most common subgroups of the other malignant epithelial neoplasms and
malignant melanomas diagnostic group, had better survival than the diagnostic group
as a whole (86%). Similarly, survival for malignant gonadal germ cell tumour cases
(95% five-year OSP) was better than within its diagnostic group as a whole (89%).
Progress in cancer survival among children in Canada over the last decade or longer is
difficult to quantify due to the lack of previously published results. Such information
is, however, available for those aged 0 to 19 years at diagnosis. A 2007 study 26 found
that the most current estimate (1999-2003) of the overall five-year OSP for children
and adolescents in Canada of 82% was 11% higher than the 71% that was reported
previously using cases diagnosed from 1985 to 1988. 31 Among diagnostic groups, the
largest survival increases were observed for hepatic tumours (20%), leukaemias
(15%), and central nervous system neoplasms (14%). There were also substantial
improvements in survival in most subgroups studied. Improvements in five-year OSPs
in the range of 12% to 14% were observed for lymphoid leukaemias, non-Hodgkin
lymphomas, and astrocytomas.
Canadian Cancer Society/National Cancer Institute of Canada: Canadian Cancer Statistics 2008
63
SPECIAL TOPIC: CHILDHOOD CANCER (AGES 0 TO 14)
Tumours of the central nervous system are the leading cause of death due to childhood
cancer (Table 17). These tumours have historically been very difficult to treat due to
their location in vital structures. Chemotherapy has had disappointing results in the
majority of central nervous system tumours, while the use of radiation therapy is
avoided in young children due to the significant risks of intellectual impairments
caused by radiating the developing brain. Other tumour groups that have disappointing
survival rates include metastatic solid tumours such as Ewing’s sarcoma,
rhabdomyosarcoma, osteosarcoma, and neuroblastoma.
Palliative Care
While the majority of children with cancer become long-term survivors, significant
numbers continue to die from the disease. Results from a Canadian study that
examined cases in eight dedicated pediatric palliative care programs in 2002 found
variability in disease referrals, with cancer diagnosis accounting for 22% of all
referrals.32 While care at the end of life is a key component of comprehensive cancer
control for children, knowledge about palliative care in pediatric oncology, as well as
how such care is to be monitored, remains underdeveloped. 33
Progress and Application of Research in Childhood Cancer
Significant progress has been achieved through research in childhood cancers, most
notably in the decline in mortality rates. Understanding the biology of cancers in
children and the overall ability of children to tolerate more intense treatments than
adults are also significant factors in this success. The coordination of successive
cooperative clinical trials across North America since the 1950s is also a fundamental
component in the progress against childhood cancers (see Table 22). Early research,
first supported by the U.S. National Cancer Institute, allowed several hospitals to
cooperate in clinical trials to study new drugs which had been developed to treat acute
leukemia. The success of this early research demonstrated the benefits of a collaborative multi-centre approach, as the organization of cooperative research groups
provided sufficient numbers of cases to conduct clinical trials and achieve results in a
timely fashion.
Advances in treatment through cooperative group clinical trials eventually led to the
identification of chemotherapy drugs that could eliminate leukemia cells from blood
and bone marrow. The achievements of this early cooperative group investigating
leukemia subsequently lead to the development and support of multi-disciplinary teams
for the treatment of solid tumours in children. Other successes came when it was
determined that the combined use of different therapies, such as radiation, surgery and
chemotherapy, could provide successful treatments. After fifty years of cooperative
research groups the treatment of children with cancer using treatment protocols derived
from cooperative, multi-disciplinary clinical trials, has become the standard of care.34
Ongoing research in children has yielded an increased understanding of the basic
biology of cancer, particularly in the role of genetics and tumour suppressor genes.
Studies on children have assisted with advances in treatments (such as chemotherapy),
the development of team management in patient care, and the demonstration of the
significant advantages of multi-centred cooperative clinical research.
Currently, the majority of pediatric clinical trials in North America are operated
through the Children’s Oncology Group (COG). COG represents the largest multicentre trial group for childhood cancer in the world. All 17 Canadian pediatric
64
Canadian Cancer Society/National Cancer Institute of Canada: Canadian Cancer Statistics 2008
SPECIAL TOPIC: CHILDHOOD CANCER (AGES 0 TO 14)
oncology centres belong to COG. As such, each individual pediatric oncology centre
has access to the clinical trials, biology and late- effects studies in order to enroll
patients and gather information on children in these research studies. Efforts to obtain
national data have been through the Canadian Childhood Cancer Surveillance and
Control Program, which aims to monitor trends in diagnosis, treatment, and
outcomes.35
Several years ago, directors of the 17 pediatric cancer centres in Canada formally
established the Council of Canadian Pediatric Hematology/Oncology Directors or
C17 Council through support from the Childhood Cancer Foundation – Candlelighters
Canada. The C17 Council’s aim is to promote excellence in clinical care, education and
research for children and adolescents with cancer and serious disorders of the blood,
as well as to advocate on behalf of such children and their families at the national
level. The research arm of the Council, the C17 Research Network was created in 2004,
and has enabled two to four pan-Canadian studies a year to be funded in order to
undertake multi-disciplinary and multi-centre research projects in pediatric
hematology, oncology and hematopoietic stem cell transplantation.
Although childhood cancer is rare, it remains
of significant public health importance.
Canadian Cancer Society/National Cancer Institute of Canada: Canadian Cancer Statistics 2008
65
SPECIAL TOPIC: CHILDHOOD CANCER (AGES 0 TO 14)
Table 17
New Cases and Deaths and Average Annual Age-Standardized Cancer
Incidence and Mortality Rates by Diagnostic Group, Ages 0-14, Canada,
2000-2004*
Diagnostic Group and
Subgroup
New
cases
ASIR
(per 1,000,000)
per year
Deaths
ASMR
(per 1,000,000)
per year
I. Leukemia
a. Lymphoid
b. Acute myeloid
1,380
1,091
176
49.3
39.0
6.3
184
71
51
6.4
2.4
1.8
III. Central Nervous System
a. Ependymoma
b. Astrocytoma
c. Intracranial & intraspinal
embryonal
828
88
365
28.9
3.2
12.5
201
19
41
6.9
0.7
1.4
207
7.3
57
2.0
II. Lymphoma
a. Hodgkin lymphoma
b. Non-Hodgkin lymphoma
c. Burkitt lymphoma
506
172
155
93
16.9
5.5
5.2
3.1
32
4
10
8
1.1
0.1
0.3
0.3
IV. Neuroblastoma & Other PNC
a. Neuroblastoma
295
292
11.4
11.3
82
82
2.9
2.9
IX. Soft Tissue
a. Rhabdomyosarcoma
262
135
9.0
4.7
45
28
1.5
1.0
VI. Renal Tumours
a. Nephroblastoma
230
214
8.5
7.9
34
27
1.2
0.9
XI. Other Malignant Epithelial
b. Thyroid
d. Malignant Melanoma
184
63
45
6.1
2.0
1.5
9
0
1
0.3
0.0
0.0
183
88
79
6.0
2.8
2.6
47
16
28
1.5
0.5
0.9
X. Germ Cell and Other Gonadal
c. Malignant gonadal germ cell
137
53
4.7
1.8
10
2
0.3
0.1
VIII. Malignant Bone Tumours
a. Osteosarcoma
c. Ewing's sarcoma
V. Retinoblastoma
100
3.9
2
0.1
VII. Hepatic Tumours
68
2.6
12
0.4
XII. Other and unspecified Cancers
57
2.1
9
0.3
4,242
149.8
676
23.3
Total** (5 years)
Average Per Year
848
135
** Rates are age-standardized to the 1991 Canadian population and are expressed per million per year due to
disease rarity. Diagnostic groups are listed according to frequency of occurrence. Cases were classified
according to the third edition of the International Classification of Childhood Cancer.20 Non-malignant
intracranial and intraspinal tumours were excluded. Only selected subgroups within each diagnostic group
are listed. PNC denotes peripheral nervous cell tumours.
** Total includes 12 malignant new cases and 9 deaths which were unclassifiable.
Source: Health Statistics Division, Statistics Canada
66
Canadian Cancer Society/National Cancer Institute of Canada: Canadian Cancer Statistics 2008
SPECIAL TOPIC: CHILDHOOD CANCER (AGES 0 TO 14)
Figure 10
Age-Standardized Incidence and Mortality Rates for Selected Cancers for
Children and Youth Ages 0-14, Canada, 1985-2008
All Cancers
Leukemia
Rate (per 1,000,000)
60
160
140
120
Rate (per 1,000,000)
50
Incidence
40
Incidence
100
Estimated
80
60
30
20
Mortality
Estimated
Mortality
40
10
20
0
0
1985 1987 1990 1993 1996 1999 2002 2005 2008
1985 1987 1990 1993 1996 1999 2002 2005 2008
Central Nervous System
40
Lymphoma
Rate (per 1,000,000)
25
Rate (per 1,000,000)
35
Incidence
20
30
25
15
20
15
Incidence
Estimated
Estimated
10
Mortality
10
5
Mortality
5
0
1985 1987 1990 1993 1996 1999 2002 2005 2008
0
1985 1987 1990 1993 1996 1999 2002 2005 2008
Note:
Cases and deaths were classified according to the groupings found in the Glossary. The range of rate
scales differ widely between the cancers. Incidence figures exclude non-melanoma skin cancer (basal
and squamous). Actual incidence data are available to 2005 except for Quebec, Ontario, Manitoba
and Alberta where 2005 incidence is estimated. Please refer to Appendix II: Methods for further details.
Source: Chronic Disease Surveillance Division, CCDPC, Public Health Agency of Canada
Canadian Cancer Society/National Cancer Institute of Canada: Canadian Cancer Statistics 2008
67
SPECIAL TOPIC: CHILDHOOD CANCER (AGES 0 TO 14)
Table 18
Age-specific Average Annual Incidence Rates by Diagnostic Group,
Canada, 2000-2004*
Diagnostic Group and
Subgroup
All Diagnostic Groups**
I. Leukemias, Myeloproliferative Diseases and
Myelodysplastic Diseases
a. Lymphoid leukaemias
b. Acute myeloid leukaemias
II. Lymphomas and Reticuloendothelial
Neoplasms
a. Hodgkin lymphomas
b. Non-Hodgkin lymphomas (except Burkitt
lymphoma)
c. Burkitt lymphoma
III. CNS and Miscellaneous Intracranial and
Intraspinal Neoplasms
a. Ependymoma
b. Astrocytomas
c. Intracranial and intraspinal embryonal
tumours
IV. Neuroblastoma and Other Peripheral
Nervous Cell Tumours
a. Neuroblastoma
V. Retinoblastoma
VI. Renal Tumours
a. Nephroblastoma and other non-epithelial
renal tumours
VII. Hepatic Tumours
VIII. Malignant Bone Tumours
a. Osteosarcomas
c. Ewing tumour and related sarcomas of bone
IX. Soft-tissue and Other Extraosseous
Sarcomas
a. Rhabdomyosarcomas
X. Germ Cell Tumours, Trophoblastic Tumours,
and Neoplasms of Gonads
c. Malignant gonadal germ cell tumours
XI. Other Malignant Epithelial Neoplasms and
Malignant Melanomas
b. Thyroid carcinomas
d. Malignant melanomas
XII. Other and Unspecified Malignant Neoplasms
Cases per 1,000,000 per year
< 1 year
1-4 years
226.3
213.9
5-9 years 10-14 years
115.0
116.5
48.6
17.4
16.2
90.6
78.5
7.3
39.6
32.7
4.6
25.7
17.7
5.0
7.8
–
11.1
–
14.8
3.0
25.6
13.2
3.0
4.8
4.6
6.7
–
2.0
4.3
3.4
22.2
6.6
6.6
38.5
5.7
13.8
29.4
1.5
13.7
21.7
2.1
11.5
7.2
11.2
8.2
3.3
58.8
58.8
21.9
21.8
3.2
3.1
1.0
1.0
16.8
9.4
0.5
–
16.2
17.8
6.5
1.3
15.6
17.2
6.1
0.7
12.0
5.1
0.7
0.5
–
–
–
2.3
0.9
1.0
4.6
2.0
2.2
11.4
5.9
4.8
12.0
4.2
8.4
6.5
7.5
4.8
10.4
3.2
13.2
–
3.3
1.0
2.6
1.5
6.3
2.6
10.2
–
–
1.8
–
–
4.1
2.0
1.1
10.8
4.0
2.6
6.0
3.0
1.1
1.4
*– Rates based on fewer than five cases were suppressed.
** Cases were classified and itemized according to the third edition of the International Classification of
Childhood Cancer.20 Non-malignant intracranial and intraspinal tumours were excluded. Only selected
subgroups within each diagnostic group are listed. CNS denotes central nervous system.
** All diagnostic groups combined includes 12 malignant new cases which were unclassifiable.
Source: Health Statistics Division, Statistics Canada
68
Canadian Cancer Society/National Cancer Institute of Canada: Canadian Cancer Statistics 2008
SPECIAL TOPIC: CHILDHOOD CANCER (AGES 0 TO 14)
Table 19
Average Annual Incidence Rates by Sex and Diagnostic Group,
Ages 0-14, Canada, 2000-2004*
Diagnostic Group and
Subgroup
Cases
per 1,000,000
per year
Males
Females
All Diagnostic Groups**
156.3
134.8
1.2
51.7
43.0
1.3
42.6
5.2
32.2
6.9
1.4
0.8
23.0
11.5
2.1
6.3
7.6
5.2
5.5
3.0
1.1
1.2
2.7
4.8
III. CNS and Miscellaneous Intracranial and Intraspinal
Neoplasms
a. Ependymoma
b. Astrocytomas
c. Intracranial and intraspinal embryonal tumours
30.4
26.4
1.2
3.4
12.0
8.9
2.6
13.1
5.3
1.4
1.0
1.8
IV. Neuroblastoma and Other Peripheral Nervous Cell
Tumours
a. Neuroblastoma
10.9
9.4
1.2
I. Leukemias, Myeloproliferative Diseases and
Myelodysplastic Diseases
a. Lymphoid leukaemias
b. Acute myeloid leukaemias
II. Lymphomas and Reticuloendothelial Neoplasms
a. Hodgkin lymphomas
b. Non-Hodgkin lymphomas (except Burkitt lymphoma)
c. Burkitt lymphoma
V. Retinoblastoma
VI. Renal Tumours
a. Nephroblastoma and other non-epithelial renal tumours
VII. Hepatic Tumours
VIII. Malignant Bone Tumours
a. Osteosarcomas
c. Ewing tumour and related sarcomas of bone
IX. Soft-tissue and Other Extraosseous Sarcomas
a. Rhabdomyosarcomas
X. Germ Cell Tumours, Trophoblastic Tumours, and
Neoplasms of Gonads
c. Malignant gonadal germ cell tumours
XI. Other Malignant Epithelial Neoplasms and Malignant
Melanomas
b. Thyroid carcinomas
d. Malignant melanomas
XII. Other and Unspecified Malignant Neoplasms
Ratio of
new cases
(male to
female)†
10.7
9.3
1.2
3.5
3.4
1.1
6.8
9.1
0.8
6.2
8.6
0.8
2.7
2.0
1.4
6.0
6.6
0.9
2.8
2.5
3.2
3.0
0.9
0.9
9.6
8.4
1.2
5.0
4.3
1.2
4.4
5.0
0.9
1.1
2.5
0.5
5.2
7.5
0.7
1.1
1.5
3.2
1.6
0.4
1.0
1.7
2.2
0.8
** Cases were classified and itemized according to the third edition of the International Classification of
Childhood Cancer.20 Non-malignant intracranial and intraspinal tumours were excluded. Only selected
subgroups within each diagnostic group are listed. CNS denotes central nervous system.
** All diagnostic groups combined includes 12 malignant new cases which were unclassifiable.
*† Ratio is derived using the number of new cases.
Source: Health Statistics Division, Statistics Canada
Canadian Cancer Society/National Cancer Institute of Canada: Canadian Cancer Statistics 2008
69
SPECIAL TOPIC: CHILDHOOD CANCER (AGES 0 TO 14)
Figure 11
Median Time Between Consecutive Events to Diagnosis and Initiation of
Treatment by Age Group, Canada, 1995-2000
Age Group
0-14
9
4
2
2
7
14
10-14
11
5-9
4
7
1-4
2
<1
0
3
2
3
5
1
1
2
3
2
1
2
10
15
20
25
30
Number of Days
Onset of Initial Complaint to First Health Care Contact
First Health Care Contact to First Assessment By Treating Oncologist/Surgeon
First Assessement by Treating Oncologist/Surgeon to Definitive Diagnosis
Definitive Diagnosis to First Anti-Cancer Treatment
Note:
Cases were classified according to the second edition of the International Classification of Childhood
Cancer.36 Data presented are for consenting patients and patients with information available on each
specific date. Ontario cases were excluded (due to differences in data collection processes) except
for results involving the time from diagnosis to initiation of treatment.
Source: The Canadian Childhood Cancer Surveillance and Control Program, Public Health Agency of Canada
The dramatic improvement in childhood cancer has
been ascribed to several factors: better diagnostic
procedures, the development of multi-modal therapies,
and the centralization of care and support services.
70
Canadian Cancer Society/National Cancer Institute of Canada: Canadian Cancer Statistics 2008
SPECIAL TOPIC: CHILDHOOD CANCER (AGES 0 TO 14)
Table 20
Percentage of Patients with Metastasis Present at Time of Diagnosis
by Cancer*, Ages 0-14, Canada, 1995-2000
Diagnostic Group*
Number of cases
Presence of
metastasis at
diagnosis, %
III. CNS and miscellaneous intracranial and intraspinal
neoplasms
852
12.9
IV. Sympathetic nervous system tumours
315
55.6
V. Retinoblastoma
100
5.0
VI. Renal tumours
280
31.1
65
35.4
173
16.8
IX. Soft-tissue sarcomas
233
27.0
X. Germ cell, trophoblastic and other gonadal neoplasms
138
21.7
XI. Carcinomas and other malignant epithelial neoplasms
69
30.4
XII. Other and unspecified malignant neoplasms
39
28.2
2,264
24.5
VII. Hepatic tumours
VIII. Malignant bone tumours
All Cancers
* Leukemia, lymphomas and reticuloendothelial neoplasms, Langerhans cell histiocytosis and myelodysplastic
syndrome have been excluded.
Note:
Cases were classified according to the second edition of the International Classification of Childhood
Cancer.36 Data excludes the non-consenting cases and cases with missing information. CNS denotes
central nervous system.
Source: The Canadian Childhood Cancer Surveillance and Control Program, Public Health Agency of Canada
Improving survival in childhood cancer
(now at 82%), places increasing need for
long term follow-up of late effects.
Canadian Cancer Society/National Cancer Institute of Canada: Canadian Cancer Statistics 2008
71
SPECIAL TOPIC: CHILDHOOD CANCER (AGES 0 TO 14)
Figure 12
Percent Distribution of Initial Treatment by Cancer Type,
Children Ages 0-14, Canada*, 1995-2000
Cancer Type
Leukemia
Lymphomas and reticuloendothelial neoplasms
CNS and misc. intracranial and intraspinal neoplasms
Sympathetic nervous system tumours
Retinoblastoma
Renal tumours
Hepatic tumours
Malignant bone tumours
Soft-tissue sarcomas
Germ cell, trophoblastic and other gonadal neoplasms
Carcinomas and other malignant epithelial neoplasms
Other and unspecified malignant neoplasms
Other cancer-related diseases
All Cancers
0%
20%
40%
60%
80%
100%
Percentage
Clinical Trial
Protocol
Non-Clinical Trial
Protocol
Individualized
Treatment
No Treatment
Unknown
* Excludes Ontario cases due to differences in data collection.
Note:
Cases were classified according to the second edition of the International Classification of Childhood
Cancer.36 Data excludes non-consenting and cases with missing information. CNS denotes central
nervous system.
Source: The Canadian Childhood Cancer Surveillance and Control Program, Public Health Agency of Canada
In Canada, nearly 80% of children with cancer are
either enrolled in a clinical trial or treated according
to a registered protocol established by a clinical trial.
72
Canadian Cancer Society/National Cancer Institute of Canada: Canadian Cancer Statistics 2008
SPECIAL TOPIC: CHILDHOOD CANCER (AGES 0 TO 14)
Table 21
Observed Survival Proportion (OSP) estimates (%) (and 95% Confidence
Intervals (CI)) by Diagnostic Group and Survival Duration, Ages 0-14,
Canada excluding Quebec, 1999-2003
Diagnostic Group and
Subgroup
1-year
OSP (95% CI)
Survival duration
3-year
OSP (95% CI)
5-year
OSP (95% CI)
All Diagnostic Groups
92 (91-93)
85 (83-85)
82 (81-83)
93 (91-94)
96 (95-97)
79 (71-84)
88 (86-89)
92 (90-94)
69 (61-76)
85 (83-87)
90 (88-91)
67 (59-74)
94 (91-96)
99 (95-100)
89 (86-92)
94 (89-97)
89 (85-92)
93 (88-96)
93 (87-96)
84 (77-90)
84 (77-90)
87 (84-89)
93 (89-95)
78 (75-80)
88 (84-91)
75 (72-78)
87 (82-90)
84 (77-88)
67 (59-73)
60 (52-67)
92 (88-95)
77 (71-82)
70 (64-75)
I. Leukemias, Myeloproliferative Diseases, and
Myelodysplastic Diseases
a. Lymphoid leukaemias
b. Acute myeloid leukaemias
II. Lymphomas and Reticuloendothelial
Neoplasms
a. Hodgkin lymphomas
b. Non-Hodgkin lymphomas (except Burkitt
lymphoma)
III. CNS and Miscellaneous Intracranial and
Intraspinal Neoplasms
b. Astrocytomas
c. Intracranial and intraspinal embryonal
tumours
IV. Neuroblastoma and Other Peripheral
Nervous Cell Tumours
V. Retinoblastoma
VI. Renal Tumours
a. Nephroblastoma and other non-epithelial
renal tumours
VII. Hepatic Tumours
VIII. Malignant Bone Tumours
a. Osteosarcomas
c. Ewing tumour and related sarcomas of bone
IX. Soft-tissue and Other Extraosseous
Sarcomas
a. Rhabdomyosarcomas
X. Germ Cell Tumours, Trophoblastic Tumours,
and Neoplasms of Gonads
c. Malignant gonadal germ cell tumours
XI. Other Malignant Epithelial Neoplasms and
Malignant Melanomas
b. Thyroid carcinomas
d. Malignant melanomas
XII. Other and Unspecified Malignant Neoplasms
100 (. - .)
99 (92-100)
99 (92-100)
97 (94-99)
93 (88-95)
92 (87-95)
98 (95-99)
93 (89-96)
92 (88-95)
81 (69-89)
76 (62-85)
76 (62-85)
93 (88-96)
93 (85-97)
93 (83-97)
78 (71-83)
75 (65-83)
79 (68-87)
72 (65-78)
70 (59-79)
71 (59-81)
94 (90-97)
95 (89-98)
81 (75-86)
82 (73-88)
77 (71-83)
77 (68-84)
94 (87-97)
100 (. - .)
91 (84-95)
98 (85-100)
89 (81-93)
95 (83-99)
94 (88-97)
100 (. - .)
96 (75-99)
89 (82-94)
98 (84-100)
96 (75-99)
86 (79-91)
98 (84-100)
92 (72-98)
94 (84-98)
94 (84-98)
90 (79-96)
* Cases were classified and itemized according to the third edition of the International Classification of
Childhood Cancer20 and include non-malignant intracranial and intraspinal tumours. 26 Observed survival
proportions were derived excluding cases diagnosed in Quebec (see Observed and Realtive Survival in
Appendix II: Methods). Only selected subgroups within each diagnostic group are listed. CNS denotes
central nervous system.
(. - .) = confidence interval is undefined.
Source: Health Statistics Division, Statistics Canada
Canadian Cancer Society/National Cancer Institute of Canada: Canadian Cancer Statistics 2008
73
SPECIAL TOPIC: CHILDHOOD CANCER (AGES 0 TO 14)
Table 22
Significant Advances in the History of Childhood Cancer Research
Event
Implication(s)
Multi-Institution Cooperation in Clinical Trials
(1955)
Formation of the first group of hospitals that agreed
to cooperate in clinical trials of new drugs.
Leukemia Chemotherapy
Introduction of new agents, which were effective in
the treatment of acute leukemia.
Treatment of Solid Tumours in Children
Introduction of other medical disciplines to study
effects of surgery, radiation and pathology on
diagnosis and treatment of solid tumours.
Multi-Disciplinary Team Care
Introduction of multi-modal therapies, conducted
through large-scale multi-centre clinical trials.
Laboratory and Translational Research
Knowledge of how cancer cells are affected by
improved diagnostic evaluation and treatments.
Concept of Total Cure (1980s)
Incorporation of quality of life determinants as an
overall goal for childhood cancer survivors.
Source: CureSearch (Children’s Oncology Group) www.curesearch.org
Table 23
Pediatric Oncology Centres in Canada
Alberta Children’s Hospital, Calgary, AB
www.calgaryhealthregion.ca
Allan Blair Cancer Centre, Regina, SK
www.saskcancer.ca
British Columbia Children’s Hospital, Vancouver, BC
www.bcchildrens.ca
CancerCare Manitoba, Winnipeg, MB
www.cancercare.mb.ca
Children’s Hospital of Eastern Ontario, Ottawa, ON
www.cheo.on.ca
Children’s Hospital of Western Ontario, London, ON
www.chwo.org
Centre Hospitalier Universitaire de Québec, Québec, QC
www.chuq.qc.ca
Centre Hospitalier Universitaire de Sherbrooke,
Sherbrooke, QC
www.chus.qc.ca
Hôpital Sainte-Justine, Montréal, QC
www.chu-sainte-justine.org
IWK Health Centre, Halifax, NS
www.iwk.nshealth.ca
Janeway Children’s Health and Rehabilitation Centre,
St. John’s, NFLD
www.easternhealth.ca
Kingston General Hospital, Kingston, ON
www.kgh.on.ca
McMaster Children’s Hospital, Hamilton, ON
www.mcmasterchildrenshospital.ca
The Hospital for Sick Children, Toronto, ON
www.sickkids.ca
The Montreal Children’s Hospital, Montreal, QC
www.thechildren.com
Saskatoon Cancer Centre, Saskatoon, SK
www.saskatoonhealthregion.ca
Stollery Children’s Hospital, Edmonton, AB
www.stollerykids.com
74
Canadian Cancer Society/National Cancer Institute of Canada: Canadian Cancer Statistics 2008
GLOSSARY
Age
The age of the patient (in completed years) at the time of
diagnosis or death.
ICDO-3
International Classification of Diseases for Oncology, Third
Edition.37
ICD-10
International Statistical Classification of Diseases and Related
Health Problems, Tenth Revision.38
Incidence
The number of new cases of a given type of cancer diagnosed
during the year. The basic unit of reporting is a new case of
cancer rather than an individual patient.
Mortality
The number of deaths attributed to a particular type of cancer
that occurred during the year. Included are deaths of patients
whose cancer was diagnosed in earlier years, people with a
new diagnosis during the year, and patients for whom a
diagnosis of cancer is made only after death.
Observed survival
proportion
The proportion of patients alive after a given length of time
(e.g., five years) since diagnosis.
Province/Territory
For cancer incidence and mortality data, this is the province/
territory of the patient's permanent residence at the time of
diagnosis or death, which may or may not correspond to the
province/territory in which the new case of cancer or the
cancer death was registered.
Relative survival
ratio
The ratio of the observed survival for a group of cancer
patients to the survival that would be expected for members
of the general population, assumed to be practically free of
the cancer of interest, who have the same main factors
affecting patient survival (e.g., sex, age, area of residence) as
the cancer patients. Estimates of the relative survival ratio
greater than 100% are possible and indicate that the observed
survival of the cancer patients is better than that expected
from the general population.
Age-standardized
relative survival
ratio
The all ages survival estimate that would have occurred if the
age distribution of the patient group under study had been the
same as that of the standard population (i.e., all patients who
were diagnosed with that cancer in Canada between 1992 and
2001).
Canadian Cancer Society/National Cancer Institute of Canada: Canadian Cancer Statistics 2008
75
GLOSSARY
Incidence, Mortality and Prevalence Rates
Crude rate
The number of new cases of cancer or cancer deaths during
the year, expressed as a rate per 100,000 persons in the
population.
Age-specific rate
The number of new cases of cancer or cancer deaths during
the year, expressed as a rate per 100,000 persons in a given
age group.
Age-standardized
rate
The number of new cases of cancer or cancer deaths per
100,000 that would have occurred in the standard population
(1991 Canadian population) if the actual age-specific rates
observed in a given population had prevailed in the standard
population.
Index of
age-standardized
rates
The age-standardized rate of the base year, 1979, is set at 1.
Index values for subsequent years are derived by dividing the
age-standardized rate for that year by the 1979 rate.
Prevalence
The proportion of a population that is affected by disease at a
given point in time is referred to as complete prevalence. In
this document our estimate is more accurately described as
limited-duration prevalence, and the duration is 15 years.
By this we mean the prevalence of cases diagnosed within
15 years before the point in time for which the estimate is
calculated. This estimate should always be an underestimate
of complete prevalence, and the magnitude of the underestimate is dependent on cancer site.39
1991 Canadian Population/World Standard Population
The population used to standardize rates had the following age distribution:
Population
Age
Group
0-4
World
Canadian Standard
Population
Age
Group
30-34
World
Canadian Standard
9,240.0
6,000
Population
Age
Group
60-64
World
Canadian Standard
6,946.4
12,000
4,232.6
5-9
6,945.4
10,000
35-39
8,338.8
6,000
65-69
3,857.0
3,000
10-14
6,803.4
9,000
40-44
7,606.3
6,000
70-74
2,965.9
2,000
15-19
6,849.5
9,000
45-49
5,953.6
6,000
75-79
2,212.7
1,000
20-24
7,501.6
8,000
50-54
4,764.9
5,000
80-84
1,359.5
500
25-29
8,994.4
8,000
55-59
4,404.1
4,000
85+
1,023.7
500
TOTAL
4,000
100,000
Source: The Canadian population distribution is based on the final post-censal estimates of the July 1,
1991 Canadian population, adjusted for census undercoverage. The World Standard Population is used
in Cancer Incidence in Five Continents.
76
Canadian Cancer Society/National Cancer Institute of Canada: Canadian Cancer Statistics 2008
GLOSSARY
Cancer Definitions
Cancer data presented in this monograph are classified according to the
following groupings, except where otherwise noted.
Cancer
ICDO-3 Site/Type1 (Incidence)
ICD-10 (Mortality)
Oral
C00-C14
C00-C14
Esophagus
C15
C15
Stomach
C16
C16
Colorectal
C18-C21,C26.0
C18-C21, C26.0
Liver
C22.0
C22.0, C22.2-C22.7
Pancreas
C25
C25
Larynx
C32
C32
Lung
C34
C34
Melanoma
C44 (Type 8720-8790)
C43
Breast
C50
C50
Cervix
C53
C53
Body of Uterus
C54-C55
C54-C55
Ovary
C56.9
C56
Prostate
C61.9
C61
Testis
C62
C62
Bladder (including in situ)
C67
C67
Kidney
C64.9, C65.9
C64-C65
Brain
C70-C72
C70-C72
Thyroid
C73.9
C73
Hodgkin Lymphoma1
Type 9650-9667
C81
Non-Hodgkin Lymphoma1
Type 9590-9596,9670-9719,9727-9729
Type 9823, all sites except C42.0,.1,.4
Type 9827, all sites except C42.0,.1,.4
C82-C85, C96.3
Multiple Myeloma1
Type 9731,9732,9734
C90.0, C90.2
Leukemia1
Type 9733,9742,9800-9801,9805, 9820,
9826,9831-9837,9840,9860-9861, 9863,
9866-9867,9870-9876, 9891,9895-9897,
9910,9920,9930-9931,9940,9945-9946,
9948,9963-9964
Type 9823 and 9827, sites C42.0,.1,.4
C91-C95, C90.1
All Other Cancers
All sites C00-C80, C97 not listed above
All sites C00-C80, C97 not listed
above
All Cancers excluding Lung
C00-C97 excluding C34
C00-C97 excluding C34
All Other and Unspecified
Type 9140, 9740, 9741, 9750-9758,
Cancers (grouping used only 9760-9769, 9950-9962, 9970-9989
in Tables A1 and A2)
C76.0-C76.8 (type 8000-9589)
C80.9 (type 8000-9589)
C42.0-C42.4 (type 8000-9589)
C77.0-C77.9 (type 8000-9589)
C44.0-C44.9 excluding type 8050-8084,
8090-8110, 8720-8790, 9590-9989
C26.1,C44,C46,C76-C80,C88,
C96.0-.2,C96.7-.9,C97
All Cancers
All invasive sites
All invasive sites
1
Histology types 9590-9989 (leukemia, lymphoma and multiple myeloma), 9050-9055 (mesothelioma) are
excluded from other specific organ sites.
Note:
ICDO-3 refers to the Third Edition of the International Classification of Diseases for Oncology.
Figures are for invasive sites including in situ bladder and excluding non-melanoma skin cancer.
Canadian Cancer Society/National Cancer Institute of Canada: Canadian Cancer Statistics 2008
77
78
Canadian Cancer Society/National Cancer Institute of Canada: Canadian Cancer Statistics 2008
APPENDIX I: ACTUAL DATA FOR
NEW CASES AND DEATHS
T
he focus of this publication is current year estimates that are obtained by analyzing
actual data and making short-term projections using statistical techniques (see
Appendix II). For users who require actual data rather than current year estimates, the
Tables in this Appendix provide a summary of actual incidence and mortality statistics
based on the most recently available data for the nation. These data represent the most
recent year in the long series of data used to derive the current year estimates. Tables
A1 and A2 list the actual number of new cases (2004) and deaths (2004) that occurred
in Canada, and specify the ICDO-3 codes used to define each diagnostic group. Given
the reliability of these actual counts, it is possible to examine the frequency of
additional cancer types, and Appendix Tables A1 and A2 list a larger number of
cancer types than the previous Tables. Tables A3 to A6 list actual values for incidence
and mortality counts and rates for major cancer types, by province and territory.
In addition to the explanations and discussion provided earlier in the report, several
other points are helpful to note. As noted in Tables A3-A6, because of the small
populations of the territories, only summaries are given (five-year average) for the
most common cancers. The Appendix Tables also indicate that among provinces/
territories there was some variation in the years for which data were available (as of
August 2007 when these analyses began). Furthermore, the data sources are dynamic
files that are routinely updated as new data become available. Users who require more
current, actual data for Canada may contact the Centre for Chronic Disease Prevention
and Control at the Public Health Agency of Canada, or the Health Statistics Division
at Statistics Canada. The most up-to-date data for individual provinces/territories can
be obtained by contacting the provincial cancer registries (see section For Further
Information).
Canadian Cancer Society/National Cancer Institute of Canada: Canadian Cancer Statistics 2008
79
APPENDIX I: ACTUAL DATA FOR
NEW CASES AND DEATHS
Table A1
Actual Data for New Cases of Cancer, Canada, 2004
Cancer
ICDO-3 Site/Type1
All Cancers
Oral (Buccal Cavity and Pharynx)
All invasive sites
C00-C14
C00
C01-C02
C07-C08
C03-C06
C11
C10
C09,C12-C14
C15-C26,C48
C15
C16
C17
C18,C26.0
C19-C21
C22.0
C23
C25
C22.1,C24,C26.1-.9,C48
C30-C36,C38.1-.9,C39
C32
C34
C30-31,C33,C35-36,C38.1-.9,C39
C40-C41
C38.0,C47,C49
Type 8720-8790
C50
C51-C63
C53
C54
C55
C56
C61
C62
C51-52,C57,C58,C60,C63
C64-C68
C67
C64-C65
C66,C68
C69
C70-C72
C37,C73-C75
C73
C37,C74-C75
Type 9650-9667
See Glossary
Type 9731,9732,9734
See Glossary
Type 9050-9055
See Glossary
Lip
Tongue
Salivary Gland
Mouth
Nasopharynx
Oropharynx
Other and Unspecified
Digestive Organs
Esophagus
Stomach
Small Intestine
Large Intestine
Rectum and Anus
Liver
Gallbladder
Pancreas
Other and Unspecified
Respiratory System
Larynx
Lung
Other and Unspecified
Bone
Soft Tissue (including Heart)
Skin (Melanoma)
Breast
Genital Organs
Cervix
Body of Uterus
Uterus, Part Unspecified
Ovary
Prostate
Testis
Other and Unspecified
Urinary Organs
Bladder
Kidney
Other Urinary
Eye
Brain and Central Nervous System
Endocrine Glands
Thyroid
Other Endocrine
Hodgkin Lymphoma1
Non-Hodgkin Lymphoma1
Multiple Myeloma1
Leukemia1
Mesothelioma1
All Other and Unspecified Cancers
Total
148,183
3,230
362
753
379
638
231
114
753
31,143
1,386
2,971
534
12,845
6,804
1,200
417
3,543
1,443
22,568
1,101
21,136
331
299
884
4,096
19,488
29,538
1,322
3,779
96
2,230
20,443
806
862
10,768
6,370
3,953
445
229
2,218
3,493
3,237
256
891
6,220
1,892
4,137
406
6,683
Males Females
77,513
2,201
267
517
223
381
153
84
576
17,265
1,025
1,899
298
6,426
4,145
906
140
1,753
673
12,983
907
11,872
204
168
463
2,155
153
21,427
–
–
–
–
20,443
806
178
7,456
4,748
2,405
303
127
1,275
797
673
124
500
3,327
1,027
2,400
351
3,438
70,670
1,029
95
236
156
257
78
30
177
13,878
361
1,072
236
6,419
2,659
294
277
1,790
770
9,585
194
9,264
127
131
421
1,941
19,335
8,111
1,322
3,779
96
2,230
–
–
684
3,312
1,622
1,548
142
102
943
2,696
2,564
132
391
2,893
865
1,737
55
3,245
– Not applicable
1
Histology types 9590-9989 (leukemia, lymphoma and multiple myeloma), and 9050-9055 (mesothelioma) are
excluded from other specific organ sites.
Note:
ICDO-3 refers to the Third Edition of the International Classification of Diseases for Oncology. Figures are for
invasive sites including in situ bladder and exclude non-melanoma skin cancer. Further information is
available at: www.phac-aspc.gc.ca/dsol-smed/index.html.
Source: Chronic Disease Surveillance Division, CCDPC, Public Health Agency of Canada
80
Canadian Cancer Society/National Cancer Institute of Canada: Canadian Cancer Statistics 2008
APPENDIX I: ACTUAL DATA FOR
NEW CASES AND DEATHS
Table A2
Actual Data for Cancer Deaths, Canada, 2004
Cancer
ICD-10
All Cancers
Oral (Buccal Cavity and Pharynx)
C00-C97
Lip
Tongue
Salivary Gland
Mouth
Nasopharynx
Oropharynx
Other and Unspecified
Digestive Organs
Esophagus
Stomach
Small Intestine
Large Intestine
Rectum and Anus
Liver
Gallbladder
Pancreas
Other and Unspecified
Respiratory System
Larynx
Lung
Other and Unspecified
Bone
Soft Tissue (including Heart)
Skin (Melanoma)
Breast
Genital Organs
Cervix
Body of Uterus
Uterus, Part Unspecified
Ovary
Prostate
Testis
Other and Unspecified
Urinary Organs
Bladder
Kidney
Other Urinary
Eye
Brain and Central Nervous System
Endocrine Glands
Thyroid
Other Endocrine
Hodgkin Lymphoma
Non-Hodgkin Lymphoma
Multiple Myeloma
Leukemia
Mesothelioma
All Other and Unspecified Cancers
Total
Males
Females
66,947
35,156
31,791
1,067
19
279
90
207
104
85
283
699
13
178
55
112
73
57
211
368
6
101
35
95
31
28
72
C15-C25,C26.0,C26.2-.9,C48
C15
C16
C17
C18,C26.0
C19-C21
C22.0,C22.2-.7
C23
C25
C22.1,C22.9,C24,C26.2-.9,C48
17,883
1,488
1,919
150
6,724
1,677
596
266
3,577
1,486
9,859
1,112
1,163
92
3,449
983
453
99
1,751
757
8,024
376
756
58
3,275
694
143
167
1,826
729
C30-C36,C38.1-.9,C39
C32
C34
C30-31,C33,C35-36,C38.1-.9,C39
18,208
446
17,642
120
10,566
360
10,129
77
7,642
86
7,513
43
C00-C14
C00
C01-C02
C07-C08
C03-C06
C11
C10
C09,C12-C14
C40-C41
127
74
53
C38.0,C47,C49
390
191
199
C43
790
489
301
C50
4,998
34
4,964
C51-C63
C53
C54
C55
C56
C61
C62
C51-52,C57,C58,C60,C63
6,638
388
371
363
1,590
3,685
46
195
3,756
–
–
–
–
3,685
46
25
2,882
388
371
363
1,590
–
–
170
C64-C68
C67
C64-C65
C66,C68
3,207
1,634
1,486
87
2,112
1,131
937
44
1,095
503
549
43
C69
C70-C72
C37,C73-C75
C73
C37,C74-C75
C81
C82-C85,C96.3
27
15
12
1,609
925
684
270
174
96
108
69
39
162
105
57
127
73
54
2,650
1,394
1,256
C90.0, C90.2
1,178
631
547
C91-C95, C90.1
2,262
1,310
952
C45
See Glossary
340
284
56
5,176
2,636
2,540
– Not applicable
Note:
ICD-10 refers to the Tenth Revision of the International Classification of Diseases.
Source: Chronic Disease Surveillance Division, CCDPC, Public Health Agency of Canada
Canadian Cancer Society/National Cancer Institute of Canada: Canadian Cancer Statistics 2008
81
APPENDIX I: ACTUAL DATA FOR
NEW CASES AND DEATHS
Table A3
Actual Data for New Cases for the Most Common Cancers by Sex and
Geographic Region, Most Recent Year1, Canada
Canada
Males
All Cancers
Prostate
Lung
Colorectal
Bladder**
Non-Hodgkin
Lymphoma
Kidney
Leukemia
Oral
Melanoma
Stomach
Pancreas
Brain
Multiple
Myeloma
Esophagus
Liver
NL* PE
NS
NB
New Cases
QC*
ON
MB
SK
AB
BC YT NT NU
77,500 1,250 410 2,800 2,200 19,500 29,500 2,800 2,600 6,800 9,800
20,400
290 110
720
620
4100* 8,500
690
830 2,000 2,600
11,900
180 60
470
340 3,900 3,900
420
350
830 1,350
10,600
240 50
390
280 2,700 4,000
390
370
860 1,350
4,700
70 20
180
140 1,500 1,400
170
140
440
660
50
10
5
5
5
40
10
5
10
–
30
–
10
5
–
3,300
2,400
2,400
2,200
2,200
1,900
1,750
1,300
45
40
20
35
30
55
20
30
20
20
15
15
15
5
10
10
95
110
65
65
80
65
60
55
85
80
55
65
80
55
45
30
760
700
560
560
280
490
520
340
1,300
790
990
870
980
710
570
480
110
130
85
90
70
80
80
35
95
80
90
60
75
50
50
35
300
220
200
160
230
140
140
120
490
220
260
280
350
240
230
160
–
–
–
–
–
–
–
–
–
–
–
5
–
–
–
–
–
–
–
–
–
–
–
–
1,050
1,050
910
5
20
5
10
5
5
30
45
10
30
35
5
220
220
250
430
410
340
40
25
25
30
30
15
100
85
95
130
140
140
–
–
–
–
–
–
–
–
–
45
15
5
5
45
20
5
10
25
5
10
5
–
–
–
–
–
–
–
–
–
–
–
–
–
–
–
–
–
–
–
–
–
–
–
–
–
–
–
–
–
–
–
–
–
–
–
–
–
–
–
Females
All Cancers 70,700 1,100 340 2,500 1,800 18,000 27,500 2,700 2,100 6,100 8,900
Breast
19,300
320 80
660
520 4,900 7,500
720
570 1,750 2,600
Lung
9,300
130 45
350
270 2,700 3,200
380
280
730 1,200
Colorectal
9,100
200 60
370
230 2,400 3,400
350
280
680 1,150
Body of
Uterus
3,900
60 10
130
90
870 1,600
180
110
350
530
Non-Hodgkin
Lymphoma
2,900
25 15
110
85
720 1,200
130
90
220
370
Thyroid
2,600
50
5
70
90
550 1,300
65
55
260
170
Ovary
2,200
20 10
70
55
550
910
100
65
180
310
Melanoma
1,950
35 20
90
50
230
880
55
55
220
310
Pancreas
1,800
10 10
70
50
470
620
70
70
170
220
Leukemia
1,750
10 10
50
30
430
740
55
65
130
180
Bladder**
1,600
35 10
55
50
540
500
65
50
130
200
Kidney
1,550
30 10
70
45
450
580
60
40
140
140
Cervix
1,300
10
5
45
30
280
520
50
35
150
140
Stomach
1,050
25
5
30
25
280
420
40
25
85
120
Oral
1,050
15
5
25
20
240
410
50
20
90
150
Brain
940
20
5
25
25
240
380
35
30
70
110
– Fewer than 3 cases
** An underestimate of the number of cases.
** Inter-provincial variation. Ontario does not report in situ bladder cases. It is estimated including in situ cases for
Ontario would result in 2,200 bladder cancer cases among men and 800 among women.
1
2004 for Canada, Quebec, Ontario, Manitoba, Alberta; 2005 for Newfoundland and Labrador, Prince Edward Island,
Nova Scotia, New Brunswick, Saskatchewan, British Columbia; 2001-2005 average for Yukon, Northwest Territories,
Nunavut.
Note:
Total of rounded numbers may not equal rounded total number and an average is used for the territories.
Numbers exclude cases of non-melanoma skin cancer (basal and squamous). See Appendix II: Methods for
further details.
Source: Chronic Disease Surveillance Division, CCDPC, Public Health Agency of Canada
82
Canadian Cancer Society/National Cancer Institute of Canada: Canadian Cancer Statistics 2008
APPENDIX I: ACTUAL DATA FOR
NEW CASES AND DEATHS
Table A4
Actual Age-Standardized Incidence Rates for the Most Common Cancers
by Sex and Geographic Region, Most Recent Year1, Canada
Canada
Males
All Cancers
Prostate
Lung
Colorectal
Bladder**
Non-Hodgkin
Lymphoma
Leukemia
Kidney
Oral
Melanoma
Stomach
Pancreas
Brain
Multiple
Myeloma
Esophagus
Liver
Females
All Cancers
Breast
Lung
Colorectal
Body of
Uterus
Thyroid
Non-Hodgkin
Lymphoma
Ovary
Melanoma
Leukemia
Pancreas
Kidney
Bladder**
Cervix
Brain
Oral
Stomach
NL*
PE
NS
NB
Rate per 100,000
QC* ON
MB
481 459
100* 133
95
62
66
62
38
22
SK
AB
BC
YT
NT
NU
447
112
68
62
27
457
148
61
65
24
460
138
58
59
31
399
108
54
55
27
409
106
61
61
24
341
76
53
89
–
535
–
251
94
–
459
121
70
62
28
425
96
61
82
26
520
135
77
65
28
511
132
87
71
33
502
144
80
65
33
19
15
14
13
13
11
10
8
16
6
14
12
10
19
7
10
23
22
25
17
15
7
11
16
18
12
20
12
15
12
11
10
20
13
18
15
19
13
10
7
18
15
17
13
7
12
13
8
20
15
12
13
15
11
9
7
18
14
20
14
12
13
13
6
16
16
15
11
13
9
9
6
20
13
14
10
15
10
9
7
20
11
9
11
14
10
9
7
–
–
–
–
–
–
–
–
–
–
–
17
–
–
–
–
–
–
–
–
–
–
–
–
6
6
5
2
8
2
13
7
4
6
8
2
7
7
1
6
5
6
7
6
5
6
4
4
5
5
2
7
6
6
5
6
6
–
–
–
–
–
–
–
–
–
349
96
46
43
321
91
37
55
357
83
51
58
379
102
54
52
355
99
53
42
352
96
52
44
359
98
42
43
358
99
50
43
321
91
44
40
357
101
44
39
318
93
43
38
325
98
30
57
329
118
48
68
622
52
274
119
19
15
17
16
11
9
20
13
18
20
17
13
21
20
25
11
17
10
21
16
19
7
–
–
–
–
–
–
14
11
10
9
8
8
8
8
5
5
5
7
6
12
4
3
9
10
4
7
4
7
13
11
21
12
8
8
9
7
6
3
7
16
11
14
8
10
10
8
9
5
4
4
16
11
10
7
9
9
9
7
6
3
4
14
11
5
9
9
9
10
6
5
5
5
15
12
12
10
8
7
6
8
5
5
5
17
14
7
7
9
8
8
8
5
7
4
14
10
8
10
9
6
7
7
5
4
3
13
11
13
8
9
9
8
9
4
5
5
13
11
12
7
7
5
7
6
4
5
4
–
–
–
–
–
–
–
–
–
–
–
–
–
–
–
–
–
–
–
–
–
–
–
–
–
–
–
–
–
–
–
–
–
– Age-standardized incidence rate is based on less than 3 cases per year.
** An underestimate of the number of cases.
** Interprovincial variation. Ontario does not report in situ bladder cases. It is estimated that including in situ cases for
Ontario would result in a rate per 100,000 of 34 among men and 10 among women.
1
2004 for Canada, Quebec, Ontario, Manitoba, Alberta; 2005 for Newfoundland and Labrador, Prince Edward Island,
Nova Scotia, New Brunswick, Saskatchewan, British Columbia; 2001-2005 average for Yukon, Northwest Territories,
Nunavut.
Note:
Rates exclude non-melanoma skin cancer (basal and squamous) and are adjusted to the age distribution of
the 1991 Canadian population. See Appendix II: Methods for further details.
Source: Chronic Disease Surveillance Division, CCDPC, Public Health Agency of Canada
Canadian Cancer Society/National Cancer Institute of Canada: Canadian Cancer Statistics 2008
83
APPENDIX I: ACTUAL DATA FOR
NEW CASES AND DEATHS
Table A5
Actual Data for Deaths for the Most Common Cancers by Sex and
Geographic Region, Canada, 20041
Canada
NL
PE
Males
All Cancers 35,200 630 180
Lung
10,100 170 55
Colorectal
4,400 130 20
Prostate
3,700 75 30
Pancreas
1,750 25 10
Non-Hodgkin
Lymphoma
1,400 15
5
Leukemia
1,300 15
5
Stomach
1,150 30
5
Bladder
1,150 15
5
Esophagus
1,100 15
5
Kidney
940 20
5
Brain
930 10
5
Oral
700 10
5
Multiple
Myeloma
630 10
5
Melanoma
490
5
–
Liver
450
5
–
Females
All Cancers 31,800 500 160
Lung
7,500 110 35
Breast
5,000 65 25
Colorectal
4,000 100 25
Pancreas
1,850 20
5
Ovary
1,600 20
5
Non-Hodgkin
Lymphoma
1,250 15
5
Leukemia
950
5
5
Stomach
760 30
5
Body of
Uterus
730 10
–
Brain
680
5 10
Kidney
550 15
–
Bladder
500
5
5
Cervix
390 10
5
Oral
370
5
5
Melanoma
300
–
–
NS
NB
1,300 940
400 310
190 110
130 90
65 60
QC
Deaths
ON
9,500 12,800
3,300 3,400
1,150 1,600
730 1,400
460
630
MB
SK
AB
BC YT NT NU
1,400
350
200
180
70
1,200
280
150
220
60
2,700
710
350
330
130
4,400
1,150
510
520
250
25
10
5
–
–
25
5
5
–
–
15
10
–
–
–
60
45
35
40
50
40
30
25
30
20
35
30
30
25
25
10
310
300
330
270
220
260
260
190
560
520
430
420
470
320
330
280
55
50
40
50
40
40
25
30
55
55
40
40
30
35
25
15
110
100
85
85
80
80
85
40
200
190
130
170
170
110
130
95
–
–
–
–
–
–
–
–
–
–
–
–
–
–
–
–
–
–
–
–
–
–
–
–
20
15
10
15
15
5
150
80
120
240
210
180
20
20
10
25
15
5
60
45
45
85
80
70
–
–
–
–
–
–
–
–
–
8,400 11,900
2,200 2,600
1,300 1,950
1,100 1,500
480
650
360
600
1,350
310
230
160
80
85
1,000
230
160
140
45
55
2,500
570
360
300
180
150
4,000
1,050
610
450
250
220
20
5
5
–
–
–
20
5
5
5
–
–
15
5
–
–
–
–
1,150 780
270 190
160 120
150 80
75 50
65 35
45
40
30
35
20
15
340
210
190
480
390
290
65
35
35
45
35
25
90
90
60
150
120
90
–
–
–
–
–
–
–
–
–
30
25
15
15
25
10
15
20
15
20
10
10
5
5
170
180
170
130
70
95
50
300
250
180
220
170
150
140
30
20
25
15
15
10
10
25
15
15
10
10
5
10
60
75
55
30
30
25
25
90
85
60
60
50
55
50
–
–
–
–
–
–
–
–
–
–
–
–
–
–
–
–
–
–
–
–
–
– Fewer than 3 deaths
1
2000-2004 average for Yukon, Northwest Territories, Nunavut
Note:
Total of rounded numbers may not equal rounded total number and an average is used for the territories.
Source: Chronic Disease Surveillance Division, CCDPC, Public Health Agency of Canada
84
Canadian Cancer Society/National Cancer Institute of Canada: Canadian Cancer Statistics 2008
APPENDIX I: ACTUAL DATA FOR
NEW CASES AND DEATHS
Table A6
Actual Age-Standardized Mortality Rates for the Most Common Cancers
by Sex and Geographic Region, Canada, 20041
Males
All Cancers
Lung
Colorectal
Prostate
Pancreas
Non-Hodgkin
Lymphoma
Leukemia
Stomach
Bladder
Esophagus
Kidney
Brain
Oral
Multiple
Myeloma
Melanoma
Liver
Females
All Cancers
Lung
Breast
Colorectal
Pancreas
Ovary
Non-Hodgkin
Lymphoma
Leukemia
Brain
Body of
Uterus
Stomach
Kidney
Bladder
Cervix
Oral
Melanoma
Rate per 100,000
QC
ON
MB
Canada
NL
PE
NS
NB
SK
AB
BC
YT
NT
NU
212
61
27
23
10
230
62
46
30
9
231
70
29
38
9
246
75
35
24
12
228
76
27
22
14
239
82
30
20
11
203
53
26
23
10
218
56
31
28
11
206
49
26
34
10
194
50
25
26
9
185
49
21
22
10
268
104
38
–
–
238
71
55
–
–
326
180
–
–
–
8
8
7
7
7
6
5
4
5
6
10
5
4
8
4
3
5
9
6
6
8
5
6
4
11
9
7
7
9
7
6
4
6
5
9
7
7
6
6
3
8
8
8
7
5
6
6
5
9
8
7
7
7
5
5
4
9
8
6
8
7
6
4
5
9
10
7
6
5
6
5
3
7
7
6
6
6
6
5
2
8
8
6
7
7
5
5
4
–
–
–
–
–
–
–
–
–
–
–
–
–
–
–
–
–
–
–
–
–
–
–
–
4
3
3
3
2
2
6
4
2
4
3
2
3
3
1
4
2
3
4
3
3
3
3
2
4
2
1
4
3
3
4
3
3
–
–
–
–
–
–
–
–
–
147
36
23
17
8
7
146
31
19
29
6
6
158
36
24
23
4
6
163
42
21
20
10
9
138
36
20
13
9
7
154
41
24
18
9
7
145
33
24
17
8
7
159
39
28
16
9
11
138
34
22
17
6
8
143
34
20
16
10
9
138
36
21
14
8
8
180
45
29
–
–
–
196
52
30
31
–
–
437
249
–
–
–
–
6
4
3
4
2
2
7
4
11
6
6
4
6
4
3
6
4
4
6
5
3
7
4
3
6
5
2
5
5
4
5
4
3
–
–
–
–
–
–
–
–
–
3
3
3
2
2
2
1
2
8
4
1
4
1
1
2
3
3
3
4
2
1
4
4
2
2
4
1
3
4
3
3
2
2
1
1
3
3
3
2
1
2
1
4
3
2
2
2
2
2
4
4
3
1
2
1
1
3
3
2
1
2
1
2
3
3
3
2
2
2
1
3
3
2
2
2
2
2
–
–
–
–
–
–
–
–
–
–
–
–
–
–
–
–
–
–
–
–
–
– Age-standardized mortality rate is based on less than 3 cases per year
1
2000-2004 average for Yukon, Northwest Territories, Nunavut
Note:
Rates are adjusted to the age distribution of the 1991 Canadian population.
Source: Chronic Disease Surveillance Division, CCDPC, Public Health Agency of Canada
Canadian Cancer Society/National Cancer Institute of Canada: Canadian Cancer Statistics 2008
85
APPENDIX II: METHODS
Data Sources and Processing
The actual cancer incidence and mortality data used in this report were obtained from
three sources: mortality data files (1950-2004),40 the National Cancer Incidence Reporting
System (NCIRS, 1969-1991) and the Canadian Cancer Registry (CCR, 1992-2005). 41
The Health Statistics Division at Statistics Canada maintains all these databases.
Actual mortality data were available at the Public Health Agency of Canada for all the
provinces and territories for the period 1969 to 2004. Incidence data for 2005 were not
available from the province of Quebec because their data were not submitted to the
CCR in a timely manner; the corresponding data from the provinces of Manitoba and
Alberta were deemed too provisional for use in this publication. For 2003 and 2004
Ontario “death certificate only” cases (the only source of information about the case was
a death certificate), numbers were obtained directly from the Ontario Cancer Registry as
these were not available in the CCR for the June 2007 release. Ontario 2005 actual data
do not include death certificate (DCO) only cases. As a result, estimated numbers of DCO
cases, based on 2004 data, were added to actual numbers for purposes of projections.
Records from each province were extracted and then classified by sex, age group
and selected cancer as defined in the Glossary. Canada totals for selected sites
were then determined as the sum of the 10 provinces and three territories.
It should be noted that the definitions for some cancers have changed over the years.
In this edition, definitions have changed for lung (C33-C34 changed to C34), kidney
(C64-C66, C68 to C64-C65), multiple myeloma (mortality: C90 to C90.0, C90.2) and
leukemia (mortality: C91-C95 to C91-C95, C90.1). In-situ bladder cancers were
included in the bladder and all cancer totals from the 2006 publication (Glossary)
except for Ontario since Ontario does not report in-situ bladder cancer. A history of
these and other changes in definitions over the years is in the chart below. Because of
these changes, any comparisons of these cancers with previous editions of Canadian
Cancer Statistics should be done with caution.
Cancer definition changes since 2004
Cancer
Definition in 2004
Changes since 2004
Bladder (Incidence)
ICDO-3, C67 not including in
situ cancers
2006: C67 including in situ cancers except
for Ontario since Ontario does not report insitu bladder cancer.
Kidney (Incidence
and mortality)
ICDO-3/ICD-10 C64-C66, C68
2008: C64-C65
Leukemia (Mortality)
ICDO-10 C91-C95
2008: C91-C95, C90.1
Lung (Incidence
and mortality)
ICDO-3/ICD-10 C33-C34
2006: C34
2007: C33-C34
2008: C34
Ovary (Incidence
and mortality)
ICDO-3/ICD-10 C56, C57.0C57.4
2006: C56
Multiple Myeloma
(Mortality)
ICD-10 C88, C90
2007: C90
2008: C90.0, C90.2
All other and
unspecified cancers
(Mortality)
ICD-10 C44, C46, C76-C80,
C96.0-C96.2, C96.7-C96.9, C97
2007: C88 added.
Note: Under ICDO-3 cancer incidence for bladder, lung, kidney, and ovary excludes histology types
9590-9989 (leukemia, lymphoma, and multiple myeloma) and histology 9050-9055 (mesothelioma).
86
Canadian Cancer Society/National Cancer Institute of Canada: Canadian Cancer Statistics 2008
APPENDIX II: METHODS
Population figures for Canada, the provinces and the territories were taken from
intercensal estimates for the period 1971 to 200042 and from postcensal estimates for
the period 2001 to 2006 42 and from the Statistics Canada publication, “Population
Projections for Canada, Provinces and Territories” ‘Scenario 3’ population projections
for 2007 to 2008.2 The population estimates from 1971 to 2006 and the population
projections include non-permanent residents as part of the population. In addition,
adjustments are made for net census under-coverage and returning Canadians, and the
reference date for the annual estimates is July 1 instead of June 1. The population
projections incorporate assumptions of natural increase, immigration and internal
migration, which closely reflect the Canadian reality. These assumptions are regularly
updated to take into account the most recent changes.
Incidence and mortality estimates for 2008 were extrapolated from models that were
fitted to a subset of the data described above. The data series were selected so that
they begin in 1986 for both incidence and mortality. This allows consistency between
the mortality and incidence estimates and ensures that the estimates accurately account
for current trends. For mortality estimates, data from 1986 to 2004 were used. For
incidence estimates, data from 1986 to the latest year of available data were used.
Actual incidence and mortality rates for each province/territory, sex, site and year
were computed by dividing the number of cases by the corresponding provincial/
territorial population figures. In previous editions, these rates were computed for the
“under 45” and the “45 and over” age groups separately. In order to study the age
distributions of all cancers and of the leading types of cancer (lung, colorectal,
prostate and breast), age-specific rates were computed for the age groups 0-19, 20-29,
30-39, 40-49, 50-59, 60-69, 70-79, and 80 years and over. Starting with the 2003
edition, rates were computed and analyzed by five-year age groups 0-4, 5-9, 10-14,
up to 80-84, and 85 years of age and older.
Age-standardized incidence and mortality rates for each site were calculated using the
age distribution of the 1991 Canadian population. The World Standard Population 43
was used in publications before 1995. It was replaced because it is much younger than
the 1991 Canadian population. Consequently, estimates of age-standardized rates
before 1995 are not comparable with later estimates.
Commencing with the 2000 edition of Canadian Cancer Statistics, the Northwest
Territories represent a different geographic area than in the past. Its geographic
boundaries were redrawn, reducing the land area representing the Northwest
Territories, and a new territory named Nunavut was incorporated. 44
For all cancers, even those with poor survival such as pancreas and lung, the annual
number of incident cases is expected to be similar to, or larger than, the number of
deaths. However, there are situations in which the number of deaths, either observed
or projected, is larger than the corresponding number of new cases. In the case of
Newfoundland and Labrador, this is caused by the Registry not receiving information
on death certificates that mention cancer. The limitation of not having access to death
certificates is greater for cancers with a poor prognosis. This results in an underestimate
of the number of cases for the years used to generate the estimates. Once the
Newfoundland and Labrador Registry begins receiving information in order to register
these cases the difference will disappear. At the time of data collection, cases
diagnosed only through the use of death certificates were not reported to the Canadian
Canadian Cancer Society/National Cancer Institute of Canada: Canadian Cancer Statistics 2008
87
APPENDIX II: METHODS
Cancer Registry by the province of Quebec. In Quebec, because of the registry’s
dependence on hospital data, the numbers of microscopically confirmed prostate,
melanoma and bladder cases have been estimated to be underreported by 32%, 35%
and 14% respectively.1
Incidence Estimates (New Cases) for 2008
The number of new cases was estimated for each age group, cancer site and sex by
fitting Poisson regression models to the provincial and territorial yearly values. The
assumption underlying Poisson regression is that the annual incidence numbers are
independent Poisson random variables with a mean equal to the product of the
population size for a particular year and the (true) annual incidence rate.
A modification to the projection methodology was implemented for the 2003 edition.
In editions before 2003, for each province/territory, age group, sex and site, a separate
model for crude incidence rates was used, with year as the only independent variable.
The latest projection methodology includes age as a factor with 18 levels, and the
inclusion of trend terms was evaluated by the stepwise selection algorithm available in
S-plus 2000. The predicted numbers of cancer cases in 2008 were calculated by
multiplying the extrapolated crude incidence rates by the demographic projections for
the same year. Since longer data series for some provinces were available, estimates
for Canada were computed as the sum of the estimates for the provinces and
territories.
The estimates for 2008 were also calculated based on a five-year average of the most
recent data. This method produces age-specific rate estimates. The predicted numbers
of new cases were then obtained by multiplying the age-specific rates by the
corresponding projected age-specific population sizes.
The estimates from the Poisson method and five-year average were compared by
calculating an absolute value of the relative difference between the predicted numbers
of cases from the two methods. If there is significant curvature in the incidence trend,
a considerable difference may be observed. For the cancer sites with a relative
difference more than 10%, their estimates were determined through consultation with
the provinces/territories and consideration of the rules below:
N
The Poisson estimate is the default.
N
Using the five-year average for the count estimates is not accepted for stomach,
colorectal, liver, cervix, testis, or thyroid cancers because of strong pre-existing
trends.
N
For territories, the five-year average estimates are used for all cancers combined
because of small sample sizes.
Table A7 lists the cancers for which numbers of new cases in 2008 were estimated by
the five-year average method.
Prostate cancer incidence projection methodology was modified for the 2003 edition,
as the anticipated decline in age-standardized rates from a peak in 1993 was observed
until 1995, at which point a new and increasing trend was established. This
observation in the summary rates does not apply to the age-specific rates. Since 1981,
the age-specific rates for Canada among men under 40 have revealed little change and
shown no trend; among men aged 40-59 a steeply increasing trend started around
1991 and has yet to change course; among men aged 60-74 the rates follow the trends
88
Canadian Cancer Society/National Cancer Institute of Canada: Canadian Cancer Statistics 2008
APPENDIX II: METHODS
in the age-standardized rates from 1991 on; and among men over 75 years of age the
brief spike in rates in the early to mid-1990s was followed by a steep decline to levels
at or below the 1981 levels. Consequently, age-specific rate projections based on a
Poisson regression model fit to data between 1981 and 1989 were abandoned in
favour of Poisson regression models fit to data from 1991 to the most recent year of
incidence data available (2004 for Quebec, Manitoba, Alberta and elsewhere 2005).
This method was applied for all provinces except for Prince Edward Island, New
Brunswick and Saskatchewan where the five-year average method was used. In
previous years, the five-year average method was used to project prostate cancer in
most of the jurisdictions; but the estimates from the Poisson model are now a more
accurate representation of recent trends. Therefore, a disparity in the estimates of
prostate cancer cases and resulting rates may be seen in some provinces compared to
previously published statistics.
The estimates of incidence counts for “all cancers” were computed as the sum of the
estimated prostate cancer cases plus the estimate of “all cancers less prostate” using
the standard linear model (based on data from 1986 onwards). Starting with the 2004
edition, the incidence classification uses ICDO-3 for the data from 1992 onwards.
This results in an additional 1,200 cases per year as compared with the number
obtained previously using the ICD-9 definition in the other cancers category and the
all cancers total.
An additional consequence of implementing the ICDO-3 classification for the 2004
edition is an apparent drop compared with the previous edition of about 100 ovarian
cancer cases to 2,184 cases for Canada in 2000. However, the ICDO-3 classification
no longer considers borderline ovarian cancer as malignant. Based on the ICDO-3
definition for both 1998 and 2000 there were actually about 50 additional ovarian
cancer cases in 2000.
Mortality Estimates (Deaths) for 2008
The number of deaths was estimated for each age group, site and sex using a method
similar to that used for incidence. For each province and territory, a linear model was
used for death rates, with an 18-level age group factor and trend terms selected by a
stepwise algorithm. The estimates for the 2008 were also calculated based on a fiveyear average of the most recent data. The estimates from the Poisson method and fiveyear average were compared by calculating a relative difference in the numbers of
deaths between the two methods. For the cancer sites with a relative difference more
than 10%, their estimates were determined through consultation with the provinces/
territories and consideration of the rules described in the Incidence Estimates section.
Table A7 lists the cancer sites for which the numbers of deaths for 2008 were
estimated by the five-year average method. Mortality numbers by cancer site for
Canada were obtained from the estimates of the provincial and territorial numbers.
In the versions of this booklet published before 2003, mortality due to colorectal
cancer was based on ICD-9 codes 153-154 to be consistent with other publications.
However, this underestimates colorectal cancer mortality by about 10%, because most
deaths registered as ICD-9 code 159.0 (intestine not otherwise specified) are cases of
colorectal cancer. Commencing with the 2003 edition, these cases were included in the
definition of colorectal cancer. As a consequence, mortality figures for colorectal
cancer have increased quite dramatically from those published before this change.
Canadian Cancer Society/National Cancer Institute of Canada: Canadian Cancer Statistics 2008
89
APPENDIX II: METHODS
Estimated Age-Standardized Incidence Rates (ASIRs) and Mortality
Rates (ASMRs) for 2008
Starting with the 2003 edition, projected age-standardized rates were computed
directly from the age-specific rate projections. This change eliminated the need to
employ a separate projection methodology for age-specific and age-standardized rates.
Additionally the new procedure guarantees the definition that age-standardized rates
are a weighted average of the age-specific rates. In editions of this publication before
2003, incidence and mortality rates were generally estimated using weighted least
squares regression, with some exceptions. Weights were taken as the inverse of the
estimated variances of the actual age-standardized rates. Variances were calculated
under the assumption that the age-specific counts used in the computation of the agestandardized rates follow independent Poisson distributions. Regressions were
performed for Canada and each province or territory for each site and sex using a
linear model, with year as the only independent variable.
When the original data show large fluctuations, it has been impossible to obtain from
the model results of satisfactory precision. For this reason and to maintain consistency
between the age-specific and age-standardized estimates, annual age-standardized
incidence rates for 2008 were estimated by actual age-standardized incidence rates
calculated over a five-year period for each of those cases cited in the Incidence
Estimates section and listed in Table A7. Similarly, annual age-standardized mortality
rates for 2008 were estimated by actual age-standardized mortality rates calculated
over a five-year period for each of the areas and site combinations addressed in the
Mortality Estimates section and listed in Table A7.
Prostate cancer incidence projection methodology was modified, starting with the
2003 edition, as the anticipated decline in age-standardized rates from a peak in 1993
was observed until 1995, at which point a new and increasing trend was established.
However, this new trend has not aligned with the level that was projected on the basis
of a linear model fit to the 1981-1989 data. Several options were explored, and we
believe the most accurate projections were obtained by simply computing the agestandardized rate from the projected age-specific counts (discussed earlier) starting
with 1991 data.
Accuracy and Precision of Estimates
The accuracy of an estimate relates to the question of bias: whether or not an estimate
is targeting the value of interest. The precision of an estimate refers to the fact that any
estimate has certain variability to it; one cannot know an estimate exactly, and therefore the estimate serves only to provide insight into the real, unknown value of interest.
The standard error and coefficient of variation as well as the confidence interval are
calculated to evaluate the precision of each estimate. The standard error is an estimate
of the extent to which an estimate will vary, while the coefficient of variation relates
this variation to the actual size of the quantity being estimated. Confidence intervals use
the standard error to create a range of plausible values for the quantity being estimated.
These values are available upon request from the Chronic Disease Surveillance
Division, Centre for Chronic Disease Prevention and Control, Public Health Agency
of Canada. Together, these quality measures assess the precision (or imprecision) of a
particular estimate but not the accuracy of the estimate. Note that any estimates are
subject to error, and the degree of precision depends primarily on the number of
90
Canadian Cancer Society/National Cancer Institute of Canada: Canadian Cancer Statistics 2008
APPENDIX II: METHODS
observed cases and the population size for each site-sex-province combination, whereas
the accuracy is related to the adequacy of the model used in the estimation process.
Estimates of incidence and mortality have been rounded as follows: numbers between
0 and 99 to the nearest 5, numbers between 100 and 999 to the nearest 10, numbers
between 1,000 and 1,999 to the nearest 50 and numbers greater or equal to 2,000 to
the nearest 100. Percentages, age-standardized and age-specific rates were rounded to
the nearest tenth except in Tables 4 and 6 and Appendix Tables A4 and A6, where
space restrictions forced rounding to the nearest whole number. Age- and sex-specific
numbers/rates are combined before rounding, so it is possible that the totals in the
tables do not add up. However, any of these discrepancies must be within the
precision of the rounding units described above.
Average Annual Percent Change (AAPC) in Cancer Incidence and Mortality
The AAPC values were calculated for each site by fitting a model that assumed a
constant rate of change in the ASIRs or ASMRs, that is, a linear model applied to the
ASIRs and ASMRs after logarithmic transformation. The estimated slope resulting
from that fit was then transformed back to represent a percentage increase or decrease.
Changepoint analysis was applied to search for the most recent linear trend using
ASIR or ASMR data points from 1986 to 2004 (for Special Topic: Childhood Cancer,
from 1985 to 2004) for both incidence and mortality rates. A minimum of five data
points were required to identify a new trend, so the latest year that a new trend could
be detected would be starting in 2000. Data from 1995 to 2004 were used for both
incidence and mortality unless the changepoint analysis detected a new trend starting
later than 1995 in which case the latest linear trend was used to estimate the AAPC.
Estimates of Non-Melanoma Skin Cancer for 2008 in Canada
For 2008 non-melanoma skin cancer estimates were the average of estimates obtained
by applying British Columbia, Manitoba and New Brunswick rates to the Canadian
population. The pathology laboratories in British Columbia send all diagnostic reports
of non-melanoma (basal cell and squamous cell) skin cancer to the provincial registry.
It is assumed that non-melanoma skin cancer is under-reported to some extent. The
age- and sex-specific incidence rates in British Columbia for 2003 has been projected
to the current year and applied to the Canadian population estimates to generate a
minimal estimate of the number of cases for Canada as a whole. For Manitoba
summary counts of new basal and squamous cell cases 1986 to 2005 by age group
were provided by the Cancer Registry and rates were projected using linear regression
to 2008. For New Brunswick, summary counts of new basal and squamous cell cases
1989 to 2006 by age group were provided by the Cancer Registry and rates were
projected using linear regression to 2008.
Probability of Developing/Dying from Cancer
Probabilities of developing cancer were calculated according to the age- and sexspecific cancer incidence and mortality rates for Canada in 2004 and life tables based
on 2002-2004 all-cause mortality rates. The methodology used was that of Zdeb 45 and
Seidman et al.46 The life table procedures used assumed that the rate of cancer
incidence for various age groups in a given chronological period will prevail
throughout the future lifetime of a person as he/she advances in age. Since these may
not be the rates that will prevail at the time a given age is attained, the probabilities
should be regarded only as approximations of the actual ones.
Canadian Cancer Society/National Cancer Institute of Canada: Canadian Cancer Statistics 2008
91
APPENDIX II: METHODS
The probability of dying from cancer represents the proportion of people dying from
cancer in a cohort subjected to the mortality conditions prevailing in the population at
large in 2004. The indicator was calculated by determining the proportion of deaths
attributed to specific types of cancer for each sex and age group, multiplying this
proportion by the corresponding number of deaths in the life table and summing the
life table deaths over all sex and age groups to obtain the probability of dying from
each cause.
The Total Number of New Cases or Deaths, Showing the Contribution of
Change in Cancer Risk, Population Growth and Change in Population
Age-Structure
Figures 3.1 and 3.2 display the determinants of increases in incidence and mortality
for males and females respectively. All three series plotted on each graph refer to data
from 1979 as the baseline. The uppermost series is a plot of the annual Canadian
cancer cases/deaths observed or projected. The next to upper most series is an estimate
of the cancer events expected if the age distribution of the 1979 population were held
constant through time. The next to baseline series is an estimate of the expected
number of cases/deaths assuming a population constant in both magnitude and
distribution from 1979 to the current year.
In preparation of a more rigorous presentation of how these series were computed, let
Pi,t represent the sex-specific total population in Canada for year t, where i = M for
males or i = F for females. That is, PF,1979 represents the total 1979 Canadian female
population. Next let ASRi,t denote the all-cancers, sex-specific, age-standardized
incidence/mortality rate with the reference population being the 1979 Canadian
population of the sex corresponding to i, which is either i = M for males or i = F for
females. For example, ASRF,2001 is the age-standardized rate for Canadian females in
the year 2001.
Uppermost series: the annual number of Canadian cancer cases/deaths of sex i for a
given year, say t.
Next to uppermost: total population for year t times the age-standardized rate for year t
or, in symbols, Pi,t ASRi,t.
Next to baseline: total 1979 population times the age-standardized rate for year t or, in
symbols, Pi,1979 ASRi,t.
Baseline: the observed number of Canadian cancer cases/deaths for sex i that occurred
in 1979.
Prevalence
The prevalence of cancer cases in the Canadian population was estimated by cancer
site based on diagnoses within 15 years of the target year. Cancer incidence data were
obtained from the National Cancer Incidence Reporting System (before 1992) and the
Canadian Cancer Registry (1992-2004), and survival data were obtained from the
Information Management Division, Saskatchewan Cancer Agency. For each cancer
site, data were stratified by month of diagnosis, age at diagnosis and sex. Expected
prevalence was then calculated as the product of the age-specific crude survival rate
and the number of incident cases. The stratum-specific estimates were aggregated by
cancer site.
92
Canadian Cancer Society/National Cancer Institute of Canada: Canadian Cancer Statistics 2008
APPENDIX II: METHODS
Survival rates were based on data from the Saskatchewan Cancer Registry. Data were
first stratified by cancer site, sex and age groups 0-34, 35-64 and 65 or older, then
monthly survival was calculated using the life table method as implemented in SAS
version 8.02 (right censoring was adjusted for in the standard way). These estimates
were based on cases diagnosed from the beginning of 1986 to the end of 2001, with
follow-up to the end of 2002.
Annual national cancer incidence counts were stratified by year of diagnosis, cancer
site, sex and age groups 0-1, 2-4, 5-9, 10-14 and so on by five-year age groups to age
85 and older. These data were then uniformly distributed to each month throughout
the year by dividing the number of cases in each stratum by 12. Prevalence for 2004,
allowing a maximum of 15 years of survival, was estimated within each stratum as the
product of the crude survival rate and the corresponding case count. Estimates were
limited to a maximum of 15 year survival, which corresponds closely with lifetime
prevalence, and used survival estimates up to the limit of their reliability.
Relative survival
Cancer cases were classified according to the International Classification of Diseases
for Oncology, Third Edition. 37 Surveillance, Epidemiology, and End Results (SEER)
groups, with mesothelioma and Kaposi sarcoma as separate groupings, were used to
define cancer type.27 There are some differences compared to the cancer definitions in
the Glossary (see reference 26).
Analyses were restricted to first primary tumours only. In order to identify persons in
the CCR who had been diagnosed with cancer prior to 1992, the CCR was linked with
its predecessor, the National Cancer Incidence Reporting System, a fixed, tumouroriented database containing cases diagnosed as far back as 1969. Supplementary
information available on the CCR for the data from the province of Ontario was also
used. Cases diagnosed in the province of Quebec were not included, in part because
the method of ascertaining the date of diagnosis of cancer cases in this province
clearly differed from that of the other provincial cancer registries47 and because of
issues in correctly ascertaining the vital status of cases. Persons whose diagnosis was
established through either death certificate only or autopsy only were excluded.
Follow-up for vital status was determined through record linkage to the Canadian
Mortality Data Base, and from information reported by provincial/territorial cancer
registries.48 For deaths reported by a registry but not confirmed by record linkage with
the national data base, it was assumed that the individual died on the date submitted by
the reporting province/territory. At the time of the analysis, registration of new cases
and follow-up for vital status were complete through 31 December 2003.
Survival analyses were conducted using period analysis. 49 A period analysis is defined
by the survival experience of people in a recent time interval; in this case it was 20012003 for adults and 1999-2003 for children and adolescents. For example, survival
estimates for adults were obtained by left truncation of follow-up for vital status on 1
January 2001 and right censoring on the fifth anniversary of the date of diagnosis or
31 December 2003 – whichever came first. The survival probability during the first
year after diagnosis was estimated from the person-time at risk and events (death or
censoring) of persons diagnosed from 2000 to 2003 only, whose first year after
diagnosis included some part of the period from 2001 to 2003. Similarly, the
conditional probability in the second, third, fourth, and fifth year after diagnosis was
Canadian Cancer Society/National Cancer Institute of Canada: Canadian Cancer Statistics 2008
93
APPENDIX II: METHODS
estimated from the survival experience in 2001-2003 only, of persons diagnosed from
1999 to 2002, 1998 to 2001, 1997 to 2000, and 1996 to 1999, respectively. The
rationale for this approach is analogous to that of the use of period life tables to
estimate current life expectancy.
Period analysis was introduced as a new method in cancer survival analysis in order to
generate more up-to-date estimates of long-term survival than traditional cohort based
methods.49 It has been empirically evaluated favourably in this context.50 Using data
from the CCR, period analysis has previously been employed to predict the long-term
survival of adult cancer cases diagnosed in 2002 13 and childhood and adolescent
cancer cases diagnosed from 1999 to 2003. 26
The survival analyses were based on an algorithm written by Paul Dickman51 with
some minor adaptations. Relative survival ratios were estimated as the ratio of the
observed survival of persons with cancer to the expected survival for the general
population of the same age, sex, province of residence, and time period. Expected
survival proportions were derived, using the Ederer II approach, 52 from sex-specific
complete provincial life tables produced by Statistics Canada. All expected survival
proportions for Prince Edward Island and the territories were derived from Canadian
life tables as stable estimates for single ages could not be produced for these areas
because of small population counts. As relative survival ratios were determined to be
virtually the same as observed survival proportions for those under the age of 20
years, the latter measure was presented for this age group.
Age-specific and all ages (i.e., 15-99) survival estimates provide information on the
actual survival experience, of the patient group. For comparison purposes, agestandardized survival estimates have been provided. Age-standardized estimates were
calculated using the direct method; specifically by weighting age-specific estimates
for a given cancer to the age distribution of persons diagnosed with that cancer from
1992 to 2001. Age-standardized survival estimates are interpretable as the overall
survival estimate that would have occurred, if the age distribution of the patient group
under study had been the same as that of the standard population. Unless they have
been age-standardized to the same population, survival estimates from other sources
should not be compared with those presented in this analysis.
94
Canadian Cancer Society/National Cancer Institute of Canada: Canadian Cancer Statistics 2008
APPENDIX II: METHODS
Table A7
Use of Five-Year Average Method for Projection by Cancer
Cancer
All Cancers
NL
PE
NS
NB
QC
ON
MB
I/M+F
Oral
I/M, M/M
Esophagus
Stomach
Colorectal
Liver
Pancreas
I/M+F
Larynx
Lung
Melanoma
M/M
I/M+F, M/M+F
I/F
M/F
I/F
I/M+F
I/M+F
I/M, M/M
M/M
I/F, M/F
I/M+F
I/M, M/M
Breast
I/F
Cervix
Body of
Uterus
M
Ovary
Prostate
I
I
Testis
Bladder
Kidney
I/M
I/M
I/M+F
M/M
Brain
Thyroid
Hodgkin
Lymphoma
Non-Hodgkin
Lymphoma
Multiple
Myeloma
I/M
Leukemia
I/M
I/M+F
Rules applied:
• Poisson estimate is the default
• Adjustments are not accepted for stomach, colorectal, liver, cervix, testis, or thyroid because of strong preexisting trends
• Adjustments are only considered for cancers with a greater than 10% difference between the Poisson and
five-year average estimates
• For territories, five-year average method is used for all cancers combined because of small numbers
Note: I – Incidence, M (before /) – Mortality, M (after /) – Males, and F – Females
Canadian Cancer Society/National Cancer Institute of Canada: Canadian Cancer Statistics 2008
95
APPENDIX II: METHODS
Table A7 (continued)
Use of Five-Year Average Method for Projection by Cancer
Cancer
SK
AB
BC
All Cancers
YK
NWT
NU
I/M+F, M/M+F
I/M+F, M/M+F
I/M+F, M/M+F
Oral
Esophagus
M/M
Stomach
Colorectal
Liver
Pancreas
Larynx
Lung
I/F
M/M
M/M
I/F, M/F
Melanoma
I/M+F
Breast
Cervix
Body of
Uterus
Ovary
Prostate
I, M
Testis
Bladder
I/F, M/F
Kidney
Brain
Thyroid
Hodgkin
Lymphoma
Non-Hodgkin
Lymphoma
Multiple
Myeloma
I/F
M/M
Leukemia
Rules applied:
• Poisson estimate is the default
• Adjustments are not accepted for stomach, colorectal, liver, cervix, testis, or thyroid because
of strong pre-existing trends
• Adjustments are only considered for cancers with a greater than 10% difference between the
Poisson and five-year average estimates
• For territories, five-year average method is used for all cancers combined because of small
numbers
Note: I – Incidence, M (before /) – Mortality, M (after /) – Males, and F – Females
96
Canadian Cancer Society/National Cancer Institute of Canada: Canadian Cancer Statistics 2008
APPENDIX III: PREVIOUS SPECIAL TOPICS
In past years, other Special Topics included:
N
breast cancer (2007);
N
progress in cancer control: screening (2006);
N
progress in cancer prevention: modifiable risk factors (2005);
N
international variation in cancer incidence, 1993-1997 (2004);
N
economic burden of cancer in Canada, 1998 (2004);
N
non-Hodgkin’s lymphoma (2003);
N
cancer incidence in young adults (2002);
N
survival rates (2002, 1995, 1991-1993);
N
colorectal cancer (2001, 1995);
N
progress in cancer control (2000);
N
relative impact of population growth and aging on cancer incidence in Canada
(1999);
N
cancer surveillance in Canada (1999);
N
international comparisons (1998);
N
10-year review of Canadian cancer statistics (1997);
N
evaluation of the accuracy of estimates (1996);
N
prostate cancer (1996);
N
economic burden of cancer (1996, 1990);
N
prevalence estimates (1995);
N
breast cancer (1993);
N
smoking prevalence and lung cancer (1991);
N
cancer in Aboriginal populations (1991);
N
age-specific trends among women (1990);
N
cancer rates by income level (1990).
Canadian Cancer Society/National Cancer Institute of Canada: Canadian Cancer Statistics 2008
97
REFERENCES
1.
Brisson J, Major D, Pelletier E. Évaluation de l’exhaustivité du fichier des tumeurs
du Québec. Institut national de la santé publique du Québec, 2003.
2.
Statistics Canada. 2005. Population Projections for Canada, Provinces and
Territories. Statistics Canada Catalogue no. 91-520-XIE-2005001. Ottawa: Minister
of Industry. (Available at: http://www.statcan.ca/english/freepub/91-520-XIE/
0010591-520-XIE.htm).
3.
Kent WDT, Hall SF, Isotalo PA et al. Increased incidence of differentiated thyroid
carcinoma and detection of subclinical disease. CMAJ 2007;177:1357-61
4.
Duchesne D. Seniors at work. Perspectives on Labour and Income (Statistics Canada
Catalogue no. 75-001) 2002; 3(5).
5.
Cancer Care Ontario: Cancer in Young Adults in Canada, Toronto, Canada, 2006.
May 2006.
6.
Canadian Cancer Society/National Cancer Institute of Canada: Canadian Cancer
Statistics 2003. Toronto, Canada, 2003.
7.
Du WB, Chia KS, Sankaranarayanan R, Sankila R, Seow A, Lee HP. Population
based survival analysis of colorectal cancer patients in Singapore, 1968-1992. Int J
Cancer 2002;99:460-465.
8.
Dickman PW, Adami HO. Interpreting trends in cancer patient survival. J Int Med
2006; 260:103-117.
9.
Black RJ, Sankaranarayanan R, Parkin DM. Interpretation of population-based
cancer survival data. In Sankaranarayanan R, Black RJ, Parkin DM, Eds. Cancer
survival in developing countries. IARC Scientific Publication no. 145.
Lyon:International Agency for Research on Cancer, 1998.
10.
Ederer F, Axtell LM, Cutler SJ. The relative survival rate: a statistical methodology.
National Cancer Institute monographs 1961; 6:101-121.
11.
Merrill RM, Bird JS. Effect of young age on prostate cancer survival: a populationbased assessment (United States). Cancer Causes Control 2002; 13:435-443.
12.
Brenner H, Arndt V. Recent increase in cancer survival according to age: higher
survival in all age groups but widening age gradient. Cancer Causes Control 2004;
15:903-10.
13.
Ellison LF, Gibbons L. Survival from cancer – up-to-date predictions using period
analysis. Health Reports 2006; 17(2):19-30.
14.
Berrino F, Estève J, Coleman MO. Basic issues in estimating and comparing the
survival of cancer patients. In Berrino F, Dante M, Verdecchia A, et al. Survival of
Cancer Patients in Europe. The Eurocare Study. IARC Scientific Publication no. 132
Lyon: International Agency for Research on Cancer, 1995:1-14
15.
Statistics Canada. Canadian Vital Statistics: Death Database 2003. Custom
tabulation, January, 2007.
16.
Canadian Cancer Society / National Cancer Institute of Canada: Canadian Cancer
Statistics 2004, Toronto, Canada, 2004.
17.
Barr RD, Sala A. Hidden financial costs in the treatment for childhood cancer. J
Pediatr Hematol Oncol 2003;25(11):842-4.
18.
Marsden HB. The classification of childhood tumours. IARC Sci Publ. 1988; (87):916.
98
Canadian Cancer Society/National Cancer Institute of Canada: Canadian Cancer Statistics 2008
REFERENCES
19.
Malkin D, Friend SH, Li FP, Strong LC. Germ-line mutations of the p53 tumorsuppressor gene in children and young adults with second malignant neoplasms. N
Engl J Med 1997, Mar 6, 336(10), 734.
20.
Steliarova-Foucher E, Stiller CA, Lacour B, Kaatsch P. International classification
of childhood cancer, third edition. Cancer 2005, 103, 1457-1467.
21.
National Cancer Institute of Canada (NCIC), Advisory Committee on Cancer
Control (1994) Bridging research to action: a framework and decision-making
process for cancer control. CMAJ, Oct 15, 151(8), 1141-6.
22.
Zahm SH, Devesa SS. Childhood cancer: overview of incidence trends and
environmental carcinogens. Environ Health Perspect 1995; 103 Suppl 6:177-184.
23.
Ross JA, Davies SM. Screening for neuroblastoma: progress and pitfalls. Cancer
Epidemiol Biomarkers Prev 1999, Feb, 8(2), 189-94.
24.
Woods WG, Tuchman M, Robinson LL, Bernstein M, Leclerc JM, Brisson LC,
Brossard J, Hill G, Shuster J, Luepker R, Byrne T, Weitzman S, Bunin G, Lemieux
B. A population-based study of the usefulness of screening for neuroblastoma.
Lancet 1996, Dec 21-28, 348(9043), 1682-7.
25.
Dang-Tan T, Franco EL. Diagnosis Delays in Childhood Cancer : A Review. Cancer
2007; 110:703-13.
26.
Ellison LF, Pogany L, Mery LS. Childhood and adolescent cancer survival: A
period analysis of data from the Canadian Cancer Registry. Eur J Cancer 2007;
43:1967-1975.
27.
Ries LAG, Melbert D, Krapcho M, Mariotto A, Miller BA, Feuer EJ, Clegg L,
Horner MJ, Howlader N, Eisner MP, Reichman M, Edwards BK (eds). SEER
Cancer Statistics Review, 1975-2004, National Cancer Institute. Bethesda, MD,
http://seer.cancer.gov/csr/1975_2004/, based on November 2006 SEER data
submission, posted to the SEER web site, 2007.
28.
Blatt J, Copeland DR, Bleyer WA (1997) Late effects of childhood cancer and its
treatment. In: Pizzo PA and Poplack DG (eds) Principles and practices of pediatric
oncology. Philadelphia, Lippincott-Raven. p. 1303-29.
29.
Sklar CA. Overview of the effects of cancer therapies: the nature, scale and breadth
of the problem. Acta Paediatr Suppl 1999, 88(433), 1-4.
30.
Mertens AC, Yasui Y, Neglia JP, Potter JD, Nesbit ME, Jr., Ruccione K, et al. Late
mortality experienced in five-year survivors of childhood and adolescent cancer: the
childhood cancer survivor study. J Clin Oncol 2001, 19(13), 3163-3172.
31.
Villeneuve PJ, Raman S, Leclerc JM, Huchcroft S, Dryer D, Morrison H. Survival
rates among Canadian children and teenagers with cancer diagnosed between 1985
and 1988. Cancer Prev Control 1998; 2:15-22.
32.
Widger K, Davies D, Drouin DJ, Beaune L, Daoust L, Farran RP, Humbert N,
Nalewajek F, Rattray M, Rugg M, Bishop M. Pediatric patients receiving palliative
care in Canada: results of a multicenter review. Arch Pediatr Adolesc Med. 2007
Jun;161(6):597-602.
33.
Harris MB. Palliative care in children with cancer: which child and when. J Natl
Cancer Inst Monogr 2004, (32), 144-9.
34.
CureSearch (Children’s Oncology Group) [Online]. October 15, 2007. Available at:
http://www.curesearch.org/ [Accessed October 15, 2007]
Canadian Cancer Society/National Cancer Institute of Canada: Canadian Cancer Statistics 2008
99
REFERENCES
35.
Public Health Agency of Canada [Online]. November 15, 2007. Available at: http://
www.phac-aspc.gc.ca/ccdpc-cpcmc/program/cccscp-pcslce/about_e.html [Accessed
November 15, 2007]
36.
Kramarova E, Stiller CA, Ferlay J, Parkin DM, Draper GJ, Michaelis J, Neglia J and
Qureshi S. (1996) International Classification of Childhood Cancer. IARC
Technical Report No 29. International Agency for Research on Cancer, Lyon, 1996.
37.
Fritz A, et al., (eds). International Classification of Diseases for Oncology. Third
Edition. Geneva, World Health Organization, 2000.
38.
World Health Organization. International statistical classification of diseases and
related health problems, 10th revision, volumes 1 to 3. Geneva 1992.
39.
Capocaccia R, De Angelis R. Estimating the completeness of prevalence based on
cancer registry data. Stat Med 1997;16:425-40.
40.
Statistics Canada. 2007. Causes of Death. Statistics Canada Catalogue no. 84-208XIE-2007001. Ottawa. (Available at: http://www.statcan.ca/english/freepub/84-208XIE/84-208-XIE2007001.htm).
41.
Statistics Canada. 2007. Cancer Incidence in Canada. Statistics Canada Catalogue
no. 82-231-XIE-2007001. Ottawa: Minister of Industry. (Available at: http://
www.statcan.ca/english/freepub/82-231-XIE/82-231-XIE2007001.htm).
42.
Statistics Canada. 2007. Demographic Estimates Compendium 2006. Statistics
Canada Catalogue no. 91-213-SCB. Ottawa: Minister of Industry.
43.
Parkin DM, Muir CS, Whelan SL, Gao Y et al. (eds.). Cancer incidence in five
continents, volume VII. Lyon: IARC Scientific Publication No. 143, International
Agency for Research on Cancer, 1997.
44.
Statistics Canada. 1999. Standard Geographical Classification (SGC) 1996 Supplement. Ottawa. (Available at: http://www.statcan.ca/english/Subjects/Standard/
sgc/1996/1996-sgc-supp.htm).
45.
Zdeb MS. The probability of developing cancer. Am J Epidemiol 1977;106:6-16.
46.
Seidman H, Silverberg BS, Bodden A. Probabilities of eventually developing and
dying of cancer. Risk among persons previously undiagnosed with cancer. CA –A
Cancer Journal for Clinicians 1978;28:33-46.
47.
Ellison LF, Gibbons L, and the Canadian Cancer Survival Analysis Group. Five year
relative survival from prostate, breast, colorectal and lung cancer. Health Reports
(Statistics Canada Catalogue no. 82-003) 2001;13(1):23-24.
48.
Statistics Canada. 2006. Canadian Cancer Registry Manual – Death Clearance
Overview. Statistics Canada Catalogue no. 82-225-XIE–2006009. Ottawa, Minister
of Industry. (Available at: http://www.statcan.ca/english/research/82-225-XIE/82225-XIE2006009.htm)
49.
Brenner H, Gefeller O. Deriving more up-to-date estimates of long term patient
survival. J Clin Epidemiol 1997; 50:211-216.
50.
Ellison LF. An empirical evaluation of period survival analysis using data from the
Canadian Cancer Registry. Annals Epidemiol 2006; 16:191-196.
51.
Dickman PW. Population-based cancer survival analysis. (Available at: http://
www.pauldickman.com/teaching/tampere2004/index.php. Accessed August, 2005).
100
Canadian Cancer Society/National Cancer Institute of Canada: Canadian Cancer Statistics 2008
REFERENCES
52.
Ederer F, Heise H. The effect of eliminating deaths from cancer on general
population survival rates, methodological note 11, End Results Evaluation section,
National Cancer Institute, August 1959.
53.
Statistics Canada. 2006. Cancer Survival Statistics. Statistics Canada Catalogue
no.82-226-XIE-2006001. Ottawa: Minister of Industry. (Available at: http://
www.statcan.ca/english/freepub/82-226-XIE/82-226-XIE2006001.htm).
54.
Le ND, Marrett LD, Robson DL, Semenciw RM et al. Canadian cancer incidence
atlas. Ottawa: Minister of Supply and Services Canada. Catalogue H49-6/1-1996,
1995.
55.
Wu XC, McLaughlin CC, Lake A et al. (eds.). Cancer in North America, 20002004. Volume one: Incidence; volume two: Mortality.Springfield, IL: North
American Association of Central Cancer Registries, Inc. May 2007.
56.
Parkin DM, Whelan SL, Ferlay J, Teppo L, Thomas DB. (eds.). Cancer incidence in
five continents, volume VIII. Lyon: IARC Scientific Publication No. 155,
International Agency for Research on Cancer, 2002.
Canadian Cancer Society/National Cancer Institute of Canada: Canadian Cancer Statistics 2008
101
102
Canadian Cancer Society/National Cancer Institute of Canada: Canadian Cancer Statistics 2008
FOR FURTHER INFORMATION
A
dditional information related to this publication can be found in other sources,
including reports from provincial and territorial cancer registries; Cancer Incidence in
Canada,41 Cancer Survival Statistics53 and Health Reports, published by Statistics Canada;
Chronic Diseases in Canada and the Canadian Cancer Incidence Atlas,54 published by
Health Canada/Public Health Agency of Canada; a collaborative monograph entitled
Cancer in North America, 2000-2004,55 published by the North American Association of
Central Cancer Registries; and Cancer Incidence in Five Continents,56 published by the
International Agency for Research on Cancer.
For information regarding cancer research sponsored by the National Cancer Institute of
Canada (NCIC), with funds provided by the Canadian Cancer Society and The Terry Fox
Foundation, contact the NCIC at the address provided on page 106.
For Information from Public Health Agency of Canada:
More detailed information on methodology is available from the Surveillance Division,
Public Health Agency of Canada, 120 Colonnade Road, Ottawa, Ontario, K1A 0K9.
Tel. (613) 952-3335, Fax. (613) 941-2057.
Cancer Surveillance On-Line is an interactive, online tool for easy access to cancer
surveillance data. It allows the user to generate data according to a choice of parameters,
such as cancer site, geographic area and period of time, and a choice of presentation mode,
such as tables, charts and maps. See the Public Health Agency of Canada website noted
below for the website.
For Information from Statistics Canada:
Detailed standard tables are available on the Statistics Canada website listed below.
Custom tabulations are available on a cost recovery basis upon request from the Health
Statistics Division, Statistics Canada, National Enquiries Line: 1-800-263-1136; Health
Statistics Division: (613) 952-5176. Analytical articles appear regularly in Health Reports,
Statistics Canada, Catalogue 82-003, quarterly.
For Information from the Provincial/Territorial Cancer Registries:
Cancer incidence data are supplied to Statistics Canada by provincial/territorial cancer
registries. Detailed information regarding the statistics for each province or territory is
available from the relevant registry. (See pages 104-105 for addresses, telephone/fax
numbers and websites.)
Data contained in this document and additional information is available from:
N
Canadian Cancer Society (CCS)
www.cancer.ca
N
National Cancer Institute of Canada (NCIC)
www.ncic.cancer.ca
N
Public Health Agency of Canada
www.phac-aspc.gc.ca/ (select surveillance)
N
Statistics Canada
www.statcan.ca/cgi-bin/downpub/freepub.cgi (select Health)
N
Canadian Association of Provincial Cancer Agencies (CAPCA)
www.capca.ca
N
Progress Report on Cancer Control in Canada
www.phac-aspc.gc.ca/publicat/prccc-relccc/index.html
Canadian Cancer Society/National Cancer Institute of Canada: Canadian Cancer Statistics 2008
103
FOR FURTHER INFORMATION
CANADIAN COUNCIL OF CANCER REGISTRIES
Federal, Provincial and Territorial Contacts
NEWFOUNDLAND AND
LABRADOR
Ms. Sharon Smith
Director, Cancer Care Program
Eastern Health
Dr. H. Bliss Murphy Cancer Centre
300 Prince Philip Drive
St. John’s, Newfoundland, A1B 3V6
Tel: (709) 777-6521
Fax: (709) 753-0927
www.easternhealth.ca
PRINCE EDWARD ISLAND
Dr. Dagny E. Dryer
Director
PEI Cancer Registry
PEI Cancer Treatment Centre
Riverside Drive
Charlottetown, Prince Edward Island
C1A 8T5
Tel: (902) 894-2167
Fax: (902) 894-2187
NOVA SCOTIA
Ms. Maureen MacIntyre
Director
Surveillance and Epidemiology Unit
Cancer Care Nova Scotia
Bethune Building, Room 571
1278 Tower Road
Halifax, Nova Scotia, B3H 2Y9
Tel: (902) 473-5172
Fax: (902) 473-4425
www.cancercare.ns.ca
104
NEW BRUNSWICK
Dr. S. Eshwar Kumar / Dr. Réjean Savoie
Co-Chief Executive Officers
New Brunswick Cancer Network
New Brunswick Department of Health
Carleton Place
520 King Street
Fredericton, New Brunswick E3B 6G3
Tel: (506) 453-5521
Fax: (506) 453-5522
http://www.gnb.ca/0051/cancer/
index-e.asp
QUEBEC
Monsieur Michel Beaupré
Fichier des tumeurs du Québec
Ministère de la Santé et des Services
sociaux
Direction générale de la santé publique
1075, Chemin Ste-Foy, 11ième étage
Québec, Québec G1S 2M1
Tel: (418) 266-6739
Fax: (418) 266-4609
http://msssa4.msss.gouv.qc.ca/santpub/
tumeurs.nsf/cat?OpenView
ONTARIO
Ms. Kamini Milnes
Director, Informatics
Cancer Care Ontario
620 University Avenue
Toronto, Ontario, M5G 2L7
Tel: (416) 217-1260
Fax: (416) 217-1304
www.cancercare.on.ca
Canadian Cancer Society/National Cancer Institute of Canada: Canadian Cancer Statistics 2008
FOR FURTHER INFORMATION
MANITOBA
Gail Noonan
Manager
Manitoba Cancer Registry
CancerCare Manitoba
675 McDermot Ave., Room ON2114
Winnipeg, Manitoba, R3E 0V9
Tel: (204) 787-2157
Fax: (204) 786-0628
www.cancercare.mb.ca
BRITISH COLUMBIA
Ms. Sharon Tamaro
Scientific Director, BC Cancer Registry
BC Cancer Agency
Cancer Control Research Unit
675 West 10th Avenue
Vancouver, British Columbia, V5Z 1L3
Tel: (604) 675-8070
Fax: (604) 675-8180
www.bccancer.bc.ca
SASKATCHEWAN
Ms. Heather Stuart
Provincial Leader, Cancer Registry
Saskatchewan Cancer Agency
Allan Blair Cancer Centre
4101 Dewdney Avenue
Regina, Saskatchewan, S4T 7T1
Tel: (306) 766-2695
Fax: (306) 766-2179
www.saskcancer.ca
NUNAVUT
Dr. Issac Sobol
Director of Registry
Department of Health and Social Services
Box 1000, Station 1000
Iqaluit, Nunavut, X0A 0H0
Tel: (867) 975-5700
Fax: (867) 975-5780
ALBERTA
Ms. Carol Russell
Provincial Manager
Alberta Cancer Registry
Division of Population Health &
Information
Cross Cancer Institute
11560 University Avenue
Edmonton, AB T6G 1Z2
Tel: (780) 432-8781
Fax: (780) 432-8659
www.cancerboard.ab.ca
YUKON
Ms. Sherri Wright
Director of Insured Health Services
Yukon Cancer Registry
Health Services Branch
Yukon Government
Box 2703 (H-2)
Whitehorse, Yukon, Y1A 2C6
Tel: (867) 667-5202
Fax: (867) 393-6486
NORTHWEST TERRITORIES
Dr. André Corriveau
Chief Medical Health Officer and
Registrar, Disease Registries
Department of Health and Social Services
Government of the N.W.T.
Box 1320, 5022 49 th Street
Centre Square Tower, 6th Floor
Yellowknife, N.W.T., X1A 2L9
Tel: (867) 920-8646
Fax: (867) 873-0442
www.gov.nt.ca
STATISTICS CANADA
Ms. Julie McAuley
Director
Health Statistics Division
Main Building, Room 2200
Tunney’s Pasture
Ottawa, Ontario, K1A 0T6
Tel: (613) 951-8571
Fax: (613) 951-0792
www.statcan.ca
Canadian Cancer Society/National Cancer Institute of Canada: Canadian Cancer Statistics 2008
105
FOR FURTHER INFORMATION
NATIONAL CANCER INSTITUTE OF CANADA &
CANADIAN CANCER SOCIETY
National Office
Canadian Cancer Society &
National Cancer Institute of Canada
10 Alcorn Avenue, Suite 200
Toronto, Ontario M4V 3B1
Tel. (416) 961-7223
Fax. (416) 961-4189
www.cancer.ca
www.ncic.cancer.ca
Newfoundland & Labrador Division
Canadian Cancer Society
Viking Building, 2nd Floor
P.O. Box 8921
136 Crosbie Road
St. John’s, Newfoundland A1B 3R9
Tel. (709) 753-6520
Fax. (709) 753-9314
Prince Edward Island Division
Canadian Cancer Society
1 Rochford Street, Suite #1
Charlottetown, Prince Edward Island
C1A 9L2
Tel. (902) 566-4007
Fax. (902) 628-8281
Nova Scotia Division
Canadian Cancer Society
5826 South Street, Suite 1
Halifax, Nova Scotia B3H 1S6
Tel. (902) 423-6183
Fax. (902) 429-6563
New Brunswick Division
Canadian Cancer Society
133 Prince William Street
P.O. Box 2089
Saint John, New Brunswick E2L 3T5
Tel. (506) 634-6272
Fax. (506) 634-3808
106
Quebec Division
Maison de la Société canadienne du cancer
5151 boul. de l’Assomption
Montréal, Québec H1T 4A9
Tel. (514) 255-5151
Fax. (514) 255-2808
Ontario Division
Canadian Cancer Society
1639 Yonge Street
Toronto, Ontario M4T 2W6
Tel. (416) 488-5400
Fax. (416) 488-2872
Manitoba Division
Canadian Cancer Society
193 Sherbrook Street
Winnipeg, Manitoba R3C 2B7
Tel. (204) 774-7483
Fax. (204) 774-7500
Saskatchewan Division
Canadian Cancer Society
1910 McIntyre Street
Regina, Saskatchewan S4P 2R3
Tel. (306) 790-5822
Fax. (306) 569-2133
Alberta & N.W.T. Division
Canadian Cancer Society
Suite 200, 325 Manning Rd. N.E.
Calgary, Alberta T2E 2P5
Tel. (403) 205-3966
Fax. (403) 205-3979
British Columbia & Yukon Division
Canadian Cancer Society
565 West 10th Avenue
Vancouver, British Columbia V5Z 4J4
Tel. (604) 872-4400
Fax. (604) 879-4533
Canadian Cancer Society/National Cancer Institute of Canada: Canadian Cancer Statistics 2008
EVALUATION AND ORDER FORM
P
lease help us improve this publication. Your feedback on the contents of this
report will be used to prepare future editions. It would be helpful for planning if
you could complete and return this form by August 31, 2008, to:
Canadian Cancer Statistics
Canadian Cancer Society National Office
10 Alcorn Ave., suite 200
Toronto, Ont.
M4V 3B1
However, we will be pleased to receive your completed form at any time. This
evaluation and order form is also available at www.cancer.ca/statistics
1.
Please rate each section of Canadian Cancer Statistics 2008 for its usefulness.
Highlights
Estimates for cancer incidence and mortality
Geographic patterns of cancer occurrence
Trends in incidence and mortality
Age and sex distribution of cancer
Probability of developing/dying from cancer
Prevalence
Five-year relative survival
Not
useful
Somewhat
useful
Very
useful
❏
❏
❏
❏
❏
❏
❏
❏
❏
❏
❏
❏
❏
❏
❏
❏
❏
❏
❏
❏
❏
❏
❏
❏
❏
❏
❏
Special topic
Childhood Cancer (Ages 0 to 14)
2.
Which figures and tables do you find most useful?
________________________________________________________________
________________________________________________________________
________________________________________________________________
3.
Which figures and tables do you find least useful?
________________________________________________________________
________________________________________________________________
________________________________________________________________
Canadian Cancer Society/National Cancer Institute of Canada: Canadian Cancer Statistics 2008
107
EVALUATION AND ORDER FORMS
4.
What special topic would you suggest for future editions?
________________________________________________________________
________________________________________________________________
________________________________________________________________
5.
Do you have any additional suggestions to make this publication more useful
to you?
________________________________________________________________
________________________________________________________________
________________________________________________________________
YES!
Please send me the next edition of this report
(hardcopy of the year 2009 edition). Please Print.
Name:_______________________________________________________
Title:________________________________________________________
Organization: _________________________________________________
Address: _____________________________________________________
City: _________________________ Province:_______________________
Postal Code:________________________________
108
Canadian Cancer Society/National Cancer Institute of Canada: Canadian Cancer Statistics 2008
stat cover 2008:59835cover.qxd
1/29/2008
4:47 PM
Page 1
Canadian Cancer Statistics
Questions about Cancer?
2008
When you want to know more about cancer
call the Canadian Cancer Society's CANCER INFORMATION SERVICE
1888 939-3333
MONDAY TO FRIDAY : 9AM
– 6 PM
www.cancer.ca
PRODUCED BY:
DISTRIBUTED BY:
CANADIAN CANCER SOCIETY,
NATIONAL CANCER INSTITUTE OF CANADA,
STATISTICS CANADA, PROVINCIAL /
TERRITORIAL CANCER REGISTRIES,
113-225
PUBLIC HEALTH AGENCY OF CANADA


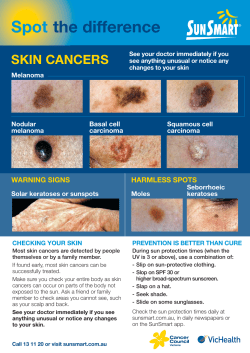

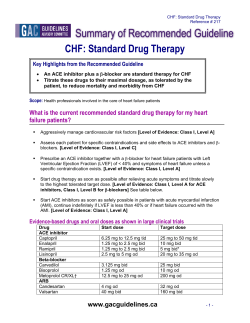


© Copyright 2026