
Magnetic microbubble-mediated ultrasound
Hou et al. BioMedical Engineering OnLine 2015, 14(Suppl 1):S14
http://www.biomedical-engineering-online.com/content/14/S1/S14
RESEARCH
Open Access
Magnetic microbubble-mediated ultrasound-MRI
registration based on robust optical flow model
Mo Hou1,2, Chunxiao Chen3, Dalin Tang1,4, Shouhua Luo1, Fang Yang1, Ning Gu1*
* Correspondence: guning@seu.
edu.cn
1
Jiangsu Key Laboratory for
Biomaterials and Devices, State Key
Laboratory of Bioelectronics,
School of Biological Science and
Medical Engineering, Southeast
University, Nanjing, 210096, China
Abstract
Background: As a dual-modality contrast agent, magnetic microbubbles (MMBs) can
not only improve contrast of ultrasound (US) image, but can also serve as a contrast
agent of magnetic resonance image (MRI). With the help of MMBs, a new registration
method between US image and MRI is presented.
Methods: In this method, MMBs were used in both ultrasound and magnetic
resonance imaging process to enhance the most important information of interest.
In order to reduce the influence of the speckle noise to registration, semi-automatic
segmentations of US image and MRI were carried out by using active contour
model. After that, a robust optical flow model between US image segmentation
(floating image) and MRI segmentation (reference image) was built, and the vector
flow field was estimated by using the Coarse-to-fine Gaussian pyramid and
graduated non-convexity (GNC) schemes.
Results: Qualitative and quantitative analyses of multiple group comparison
experiments showed that registration results using all methods tested in this paper
without MMBs were unsatisfactory. On the contrary, the proposed method combined
with MMBs led to the best registration results.
Conclusion: The proposed algorithm combined with MMBs contends with larger
deformation and performs well not only for local deformation but also for global
deformation. The comparison experiments also demonstrated that ultrasound-MRI
registration using the above-mentioned method might be a promising method for
obtaining more accurate image information.
Background
Compared with other medical imaging modalities, ultrasound imaging has been widely
used in diagnosis and clinical applications owning to its merits of low-cost, real-time,
high safety, and no documented side effects. By using proper contrast agents, the contrast and sensitivity of ultrasound imaging have been greatly improved [1,2]. However,
ultrasound imaging is still limited because of the following reasons. Firstly, ultrasound
is reflected very strongly when passing from tissue to gas, and vice versa. Secondly, the
method is of limited use in diagnosing fractures because ultrasound does not pass well
through bones. Finally, the quality of ultrasound imaging is mediocre when its contrast
is lower than that of MRI or computed tomography (CT) [3,4].
Magnetic resonance imaging is another imaging tool which is non-invasive and capable of providing functional information with high spatial resolution and excellent softtissue contrast [5]. In particular, MRI can provide information about blood flow and
© 2015 Hou et al.; licensee BioMed Central Ltd. This is an Open Access article distributed under the terms of the Creative Commons
Attribution License (http://creativecommons.org/licenses/by/4.0), which permits unrestricted use, distribution, and reproduction in
any medium, provided the original work is properly cited. The Creative Commons Public Domain Dedication waiver (http://
creativecommons.org/publicdomain/zero/1.0/) applies to the data made available in this article, unless otherwise stated.
Hou et al. BioMedical Engineering OnLine 2015, 14(Suppl 1):S14
http://www.biomedical-engineering-online.com/content/14/S1/S14
vessel morphology and identify stenotic arteries for early treatment. Magnetic iron
oxide nanoparticles with superparamagnetic property can be used as a powerful contrast agent for MRI to further increase its brightness and contrast. One shortcoming of
MRI is that it can not provide real-time motion-related images. MRI can be affected
by movement, making it unsuitable for investigating problems such as mouth tumors
because coughing or swallowing can make the images less clear.
To sum up, different imaging modalities have their respective advantages and disadvantages in the spatial resolution, and no single imaging modality possesses all the
advantages satisfying the need of all clinical applications. In many cases, US image and
MRI are complimentary, and both modalities are needed to discern possible pathological
changes in tissue [6]. Therefore, it is extremely desirable to fuse the image information
of different modes. To fuse US and MRI together, US-MRI registration is required. Due
to US image’s strong noise, it is a great challenge to register US image with any other
modality images. Some studies focused on three-dimensional US-MRI registration or
three-dimensional US-CT registration in the field of operation navigation [7-12].
Whether feature-based or voxel-based registration is used, segmentation of multimodality medical images is required. The registration result depends directly on the segmentation results. It is fair to say that US image segmentation is a difficult issue at present.
We have carried out preliminary research on MRI-ultrasound registration based on
dual modality contrast agent, namely MMBs, and have obtained some promising
results [13,14]. Those elementary research results depend on how to select the region
of interest (ROI) to certain extent, while running the registration code is time-consuming, and selecting ROI is a subjective process. To overcome the above limitations, a
more efficient registration algorithm and semi-automatic segmentation of ROIs using
MMBs are presented in this paper. With MMBs, the gray value within regions of interest (ROI) of US image and MRI is enhanced, which is very favorable for the segmentation to be performed. The MMBs discussed in the paper are the dual-modality
contrast agent with both ultrasound and MRI contrast function. Gas filled microbubbles encapsulated with polymer, lipid or surfactant shells can be used as the most
effective contrast agent for ultrasound imaging. Superparamagnetic iron oxide nanoparticles (SPIO) can be used as a powerful contrast agent for MRI. The combination of
microbubbles and SPIOs, MMBs, can be used as the contrast agent for both US imaging and magnetic resonance imaging because the MMBs can overcome the shortcomings of magnetic nanoparticles or microbubbles, respectively. That is, the stability of
microbubbles can be improved by embeding magnetic nanoparticles into the bubble
shells. Moreover, the embedded nanoparticles can be delivered into desired regions
under the guidance of magnetic field and can be released when suitable ultrasound
exposure is chosen. Cai et al focused on the relationship between the MMBs structure
and dual modality imaging, and gave a good overview on magnetic microbubbles for
theranostics, including their preparation, imaging contrast agents (diagnostic) and drug
delivery (therapeutic) [15].
Different from [15], the main contribution of this paper is the introduction of the
above-mentioned dual modality contrast agent to multi-modality medical image registration. Using MMBs with the mean diameter of 3.98 μm prepared as described by
Yang et al [2,6,16], this paper carries out the registration between US image and MRI,
and comes to a conclusion that with the use of MMBs, the proposed algorithm
Page 2 of 15
Hou et al. BioMedical Engineering OnLine 2015, 14(Suppl 1):S14
http://www.biomedical-engineering-online.com/content/14/S1/S14
Page 3 of 15
performs well not only for global deformation but also for local deformation. The
remainder of the paper is organized as follows: the registration method based on
robust optical flow model between US image segmentation and MRI segmentation is
described in Section 2. Section 3 provides several groups of comparison experiments,
and analyzes the experimental results, while Section 4 concludes our paper.
Methods
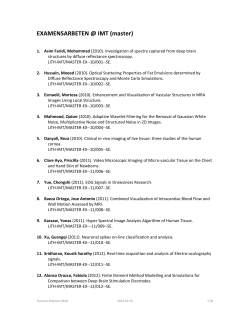
As shown in Figure 1, MMBs were used in both ultrasound and magnetic resonance imaging process. In order to reduce the influence of the speckle noise on registration, semiautomatic segmentations of US image and MRI were carried out by active contour model.
And then, a robust optical flow model between US image segmentation (floating image)
and MRI segmentation (reference image) was built, and the vector flow field was estimated
by the Coarse-to-fine Gaussian pyramid (see Figure 2) and graduated non-convexity
(GNC) schemes. The registration method based on image intensity that directly uses gray
information instead of the extraction feature process is widely concerned and quickly
developed [17]. Image segmentation combined with optical flow algorithm can not only
weaken the influence of noise, but also avoid feature extraction.
Image segmentation with active contour model
Because all US images are confounded by speckle noise, fully automatic segmentation
of US image is currently impossible. Therefore, the focus has been on semi-automatic
techniques, particularly active contour models which can detect objects whose boundaries are not necessarily defined by gradient. Active contour models are used to evolve
a curve, subject to constraints from a given image under a number of external and
internal forces [18-22]. The external forces attract the curve to regions of interest in
the image, whereas the internal forces hold the curve smooth. If initialized close to a
boundary, the curve deforms to “hug” the boundary along its length, providing further
adaptability to noise.
Assuming the evolving curve is defined as C, it will move through the spatial domain
of the given image I0 to minimize the following energy function:
F(c1 , c2 , C) = μ · Length (C) + ν · Area (inside (C)) + λ11
I0 (x, y) − c2 2 dxdy.
+λ22
I0 (x, y) − c1 2 dxdy
inside (C)
(1)
outside (C)
here μ ≥ 0, ν ≥ 0, l11 > 0, and l22 > 0 are fixed parameters, I0(x, y) is image intensity
at pixel location (x, y), and the constants c1, c2 (depending on C) are the averages of I0
inside C and outside C, respectively. The length of the curve, Length (C), and the area
Figure 1 Flow chart of the proposed MRI-US registration system based on MMBs and robust
optical flow model.
Hou et al. BioMedical Engineering OnLine 2015, 14(Suppl 1):S14
http://www.biomedical-engineering-online.com/content/14/S1/S14
Page 4 of 15
Figure 2 Flow chart of Gaussian pyramid algorithm.
of the region inside C, Area (inside (C)), are two regularizing terms. If the constant μ is
larger, then only larger objects are detected, or objects that are grouped together. If it
is small, then smaller objects will be detected. We do not want different objects close
to each other to be interpreted as a single object. This is the reason we decided to set
μ = 0 in Eq. (1). The minimization procedure uses iterative method and differential
calculus. After initializing a curve close to the object boundary, the active contour
model starts deforming to fit the local minimum so as to move towards the desired
boundary and finally settles on it.
Robust optical flow model construction for registration
Let I1, I2 denote the reference and floating images, namely MRI and US image. We
need to determine the optical flow field (u, v) (the horizontal and vertical vectors)
between I1 and I2, which represents the displacement between the above two images.
The classical optical flow objective function in its spatially discrete form is written as
E(u,v) =
{ρD [I1 (i, j) − I2 (i + ui,j , j + vi,j )] + λ[ρS (ui,j − ui+1,j ) + ρS (ui,j − ui,j+1 )
(2)
i,j
+ρS (vi,j − vi+1,j ) + ρS (vi,j − vi,j+1 ) ]}
Where rD and rS are penalty functions, and l is a regularization parameter. Optical
flow method is sensitive to noises because it is on the basis of differential technology,
and some filters (both high-pass and low-pass) are used to reduce this bad effect [23].
After every iteration median filtering the intermediate optical flow field can effectively
denoise the intermediate flow field, prevent gross outliers, and make non-robust methods more robust [24]. When the median filter is used to optimize the objective, it will
lead to lower energies. Especially, the optimization of the classical model, with interleaved median filtering and an auxiliary flow field (u,ˆ
ˆ v) [25,26], approximately minimizes
ˆ vˆ ) =
E(u, v, u,
{ρD [I1 (i, j) − I2 (i + ui,j , j + vi,j )] + λ1 [ρS (ui,j − ui+1,j ) + ρS (ui,j − ui,j+1 )
2 2
+ρS (vi,j − vi+1,j ) + ρS (vi,j − vi,j+1 )]} + λ2 (u − uˆ + v − vˆ )
i,j
+λ3
i,j (i ,j )∈Ni,j
(uˆ i,j − uˆ i ,j + vˆ i,j − vˆ i ,j ) .
(3)
where l1 is a regularization parameter, l2 and l3 are scalar weight, and Ni,j is the set
of neighbor pixels of pixel (i,j). By alternately minimizing (4) and (5), we can optimize
the objective function as in (3):
E(u, v) =
i,j
{ρD [I1 (i, j) − I2 (i + ui,j , j + vi,j )] + λ1 [ρS (ui,j − ui+1,j ) + ρS (ui,j − ui,j+1 )
2 2
+ρS (vi,j − vi+1,j ) + ρS (vi,j − vi,j+1 ) ]} + λ2 (u − uˆ + v − vˆ ) .
(4)
Hou et al. BioMedical Engineering OnLine 2015, 14(Suppl 1):S14
http://www.biomedical-engineering-online.com/content/14/S1/S14
Page 5 of 15
2 2
ˆ v) = λ2 (u − uˆ + v − vˆ ) + λ3
E(u,ˆ
i,j
(uˆ i,j − uˆ i ,j + vˆ i,j − vˆ i ,j ) .
(i ,j )∈Ni,j
(5)
By using the alternating optimization strategy, with (u,ˆ
ˆ v) fixed, we minimize (4) with
regard to (u, v); with (u, v) fixed, we minimize (5) with regard to (u,ˆ
ˆ v)
(k+1)
uˆ i,j
= median (Neighbors
where Data = {ui,j , ui,j ±
Neighbors
(k)
(k)
∪ Data )
λ3
2λ3
, ui,j ±
λ2
λ2
Ni,j λ3
. . . , ui,j ±
},
2λ2
(6)
(k)
’ ’
= { uˆ i ,j } for (i , j ) ∈ Ni,j and uˆ (0) = u .
for vˆ i,j(k+1) , its proof is similar with uˆ i,j(k+1) . Coarse-to-fine Gaussian pyramid and
graduated non-convexity (GNC) schemes are adopted to estimate (u, v) and (u,ˆ
ˆ v)
[24]. A two stage GNC process is adopted and 3 warping steps per pyramid level are
performed. After every warping step, (u, v) are set to be (u,ˆ
ˆ v) . Finally, (u,ˆ
ˆ v) are taken
as the final flow vector field estimate. The framework of Gaussian pyramid algorithm
is shown in Figure 2, and the penalty functions are set according to Sun et al [25].
Results & discussion
Materials and data acquisition
Dual modality contrast agent
MMBs were obtained from Jiangsu Laboratory for Biomaterials and Devices. MMBs
can increase magnetic resonance susceptibility, and negatively enhance T2-weighted
(T2*WI) imaging signal, namely, decrease the gray value of T2*WI imaging. They can
also give strong ultrasound backscattering echo intensity and positively increase the
brightness of US image.
Phantom
Phantom was made from glycerol, agar and water ratio of 3:4:90, and produced by
Jiangsu Laboratory for Biomaterials and Devices, in which a “U” shaped silicone tube
with external diameter of 9 mm and inner diameter of 7 mm is “vertically” sitting in
the agar phantom. Three fatty objects which size is about a diameter of 5 mm were
laid in the tube. When US imaging or magnetic resonance imaging with MMBs was
carried on, a solution (0.1 g/ml) containing MMBs was injected into the silicone tube;
while when US imaging or MRI without MMBs was carried on, purified water was
injected into the silicone tube. Regardless of whatever MMBs is used, fluid in the tube
remains stable during imaging.
Experimental computing platform
Our algorithm implementation is based on the compatible personal computer installed
MATLAB 2008b. In some cases, C++ language compilation system was also needed to
perform some functions, so it is necessary to install VISUAL C++ 6.0 (or VISUAL C+
+ 2000.NET) on the above platform.
The three objects were imaged using the Ultrasonic imaging system of the GE
LOGIQ3 PRO scanner (GE Medical System, USA) with a 4 MHz ultrasound transducer used as a transmitter as well as a receiver. B-mode US images were acquired with
the instrument parameters (Gn 20; E/A 1/2; DR 78; AO 100%). T2*WI imaging of
these objects was carried out with a clinical 0.3 T magnetic resonance imager (AIRIS
II, Hitachi Ltd, JAPAN). Images were aquired with a matrix size of 256 × 256, field of
Hou et al. BioMedical Engineering OnLine 2015, 14(Suppl 1):S14
http://www.biomedical-engineering-online.com/content/14/S1/S14
view of 20 × 20 cm2, repetition time of 400 ms, section thickness of 4 cm, and echo
time of 15 ms. The reasons the usage of 0.3 T magnetic resonance imager was as follows. Firstly, we had carried out multiple group comparison tests of magnetic resonance imaging using 1.0 T or above equipments based on MMBs, and obtained good
imaging result. Secondly, now SIEMENS 0.3 T magnetic resonance imager was still
used widely especially in underdeveloped area because of magnetic resonance imager’s
expensive upgrades.
Figure 3 includes US and MRI images showing the effectiveness of MMBs. I, II and
III in Figures 3(a)~(d) represent the above-mentioned three objects imaging. Without
MMBs the tube boundary can’t be seen, while with MMBs, the tube upper boundary
and three targets can be seen from the B-mode image. Under ultrasonic conditions,
gas imaging shows strong echo whereas liquid imaging has no echo, and MMBs almost
float upward to the three targets and upper boundary of the tube, therefore the echo of
the tube upper boundary and three targets is strong. The phantom surface is hard, and
not easily deformed, and moreover the convex array probe is used, which lead to the
poor contact between the probe and the phantom surface, and further bring lateral
wall echo drop-out.
Compared with Figure 3(a), the brighter objects of ROI can be seen distinctly in
Figure 3(b). This illustrates qualitatively that MMBs can positively enhance the intensity of US. Similarly, the MRIs of the tube without and with MMBs were shown in
Figure 3(c) & (d), respectively. The result indicates that MMBs can significantly reduce
T2*WI signal intensity. Certainly, we can quantitatively measure objects brightness of
US images and MRIs to determine how much MMBs influenced US imaging and magnetic resonance imaging [2].
Semi-segmentation of US images and MRIs
In Figure 4, when l11 and l22 are fixed to 1, and μ is fixed to 0, the segmentation
results were compared with the change of parameter ν. The best segmentation was
achieved when ν is set to 100 without MMBs. In contrast, we obtained the best segmentation when ν is set to 2000 with MMBs.
Figures 5(a)~(d) and 5(a’)~(d’) show iterative segmentation process of US image with
active contour model (l11 = l22 = 1, μ = 0) when ν is set to 100 without MMBs, and
2000 with MMBs, respectively. Compared with Figure 5(d) and Figure 5(d’), Figure 5
(d’) is the better segmentation result. The fundamental reason that the segmentation
results have such a huge difference is the better contrast and brightness of the US
Figure 3 Enhancement imaging based on MMBs. (a) US image without MMBs. (b) US image with
MMBs. (c) MRI without MMBs. (d) MRI with MMBs.
Page 6 of 15
Hou et al. BioMedical Engineering OnLine 2015, 14(Suppl 1):S14
http://www.biomedical-engineering-online.com/content/14/S1/S14
Figure 4 US ROI segmentations by different values of parameter ν (l11 = l22 = 1, μ = 0) with active
contour model. Top: segmentation results without MMBs (a) ν = 100. (b) ν = 300. (c) ν = 500. (d) ν =
2000. Bottom: segmentation results with MMBs (l1 = l2 = 1, μ = 0) (a’) ν = 2000. (b’) ν = 500. (c’) ν = 100.
(d’) ν = 5.
image using MMBs than that not using MMBs, which is beneficial to segmentation of
US image.
In Figure 6, we show how the active contour model works on the MRIs of phantom
without and with MMBs, respectively. In our experiments, we fixed μ = 0, ν = 100 and
l11 = l22 = 1. When MMBs are not used, 50 iterations and MRI segmentation are
Figure 5 Iterative segmentation process of US image with active contour model. Top: results without
MMBs (a) initialization. (b) 20 iterations of US image. (c) 50 iterations of US image. (d) segmentation result.
Bottom: results with MMBs (a’) initialization. (b’) 20 iterations of US image. (c’) 50 iterations of US image.
(d’) segmentation result.
Page 7 of 15
Hou et al. BioMedical Engineering OnLine 2015, 14(Suppl 1):S14
http://www.biomedical-engineering-online.com/content/14/S1/S14
Figure 6 Iterative segmentation process of MRI with active contour model. (a) 50 iterations of MRI
without MMBs. (b) segmentation result of MRI without MMBs. (c) 50 iterations of MRI with MMBs. (d)
segmentation result of MRI with MMBs.
illustrated in Figures 6(a) & (b), respectively. When MMBs are used, 50 iterations and
MRI segmentation are illustrated in Figures 6(c)&(d), respectively. Compared with
Figures 6(b) & 6(d), Figure 6(d) has better contrast and smoother outline, showing
MRI using MMBs is more beneficial to object segmentation. However, the difference
between Figure 5(d) and Figure 5(d’) is far more than that between Figure 6(b) and
Figure 6(d), which shows the improvements of US image segmentation with MMBs is
much better than the improvements of MRI segmentation with MMBs. MMBs have
greater influence on US imaging than on magnetic resonance imaging.
US-MRI registration based on the proposed method
The registration results were compared by changing parameter l2 with/without MMBs
when l1 and l3 are fixed to 5 and 1, respectively, as shown in Figures 7 & 8. According to Figures 7 & 8, the results of root mean square error (RMS), peak signal to noise
ratio (PSNR), correlation coefficient (COR), and mutual information (MI) were quantitatively analyzed and given in Table 1.
When the reference and the floating image (or the registered image), are compared,
the RMS of the pairwise differences of the two images can serve as a measure how far
on average the error is from 0. When RMS is small, the similarity between the two
images is greater.
Peak signal-to-noise ratio, often abbreviated PSNR, is an engineering term for the
ratio between the maximum possible power of a signal and the power of corrupting
noise that affects the fidelity of its representation. This ratio can be used as a quality
measurement between the reference and the registered image. The higher the PSNR,
the better the quality of the registered image.
COR is a mathematical measure of how much one image can expect to be influenced
by changes in another. It is closely related to covariance. If there is no relationship
between the two images the COR is very low.
MI is a fundamental concept in information theory, and a measurement about statistical correlation of two random variables. Consider gray values of two images which
will be registered as two random variables, when the both images achieve the best
registration, MI approaches the maximum. When RMS after registration is smaller
than before registration, and three indices (PSNR, COR and MI) after registration is
larger than before registration, it is called the normal variation, otherwise called abnormal variation in the following discussion.
Page 8 of 15
Hou et al. BioMedical Engineering OnLine 2015, 14(Suppl 1):S14
http://www.biomedical-engineering-online.com/content/14/S1/S14
Figure 7 US-MRI registration (from (c) to (g)) by different values of parameter l2 (l1 = 5, l3 = 1)
without MMBs based on the proposed methods. (a) US image segmentation. (b) MRI segmentation.
(c) (l2 = 1e - 4). (d) (l2 = 1e - 2). (e) (l2 = 1). (f) (l2 = 1e + 2). (g) (l2 = 1e + 4). (h) subtraction result
between (c) and (b). (i) subtraction result between (d) and (b). (j) subtraction result between (e) and (b).
(k) subtraction result between (f) and (b). (l) subtraction result between (g) and (b).
As shown in Table 1 we can achieve a better registration result independent of MMBs
based on the proposed methods when l1, l2 and l3 are set to 5, 1e+2 and 1, respectively.
Figures 9 & 10 demonstrate US-MRI registration using the proposed method (l1 = 5,
l2 = 1e + 2, l3 = 1) without and with MMBs, respectively. As it can be intuitively
observed, Figure 10(f) has obvious advantages over Figure 9(f) from the perspective of
registration. The four evaluation indexes (RMS, PSNR, COR and MI) in Table 2 had
normal variations with and without MMBs, before and after registration, respectively.
In addition, after registration, performance evaluation with the use of MMB had better
improvement than that without MMB. For example, RMS decreases from 0.0843 to
0.0435, PSNR, COR and MI rises up from 21.4505 to 27.1892, from 0.3100 to 0.5303
and from 0.0629 to 0.0803, respectively. To sum up, the qualitative and quantitative
analyses showed that US-MRI registration based on the proposed method is effective.
US-MRI registration based on the other methods
Figures 11 & 12 are US-MRI registration based on several other methods without and
with MMBs, respectively. The other methods included fast Fourier transform (FFT)
Page 9 of 15
Hou et al. BioMedical Engineering OnLine 2015, 14(Suppl 1):S14
http://www.biomedical-engineering-online.com/content/14/S1/S14
Page 10 of 15
Figure 8 US-MRI registration (from (c) to (g)) by different values of parameter l2 (l1 = 5, l3 = 1)
with MMBs based on the proposed methods. (a) US image segmentation. (b) MRI segmentation. (c))
(l2 = 1e - 4). (d) (l2 = 1e - 2). (e) (l2 = 1). (f) (l2 = 1e + 2). (g) (l2 = 1e + 4). (h) subtraction result
between (c) and (b). (i) subtraction result between (d) and (b). (j) subtraction result between (e) and (b).
(k) subtraction result between (f) and (b). (l) subtraction result between (g) and (b).
[27,28], particle swarm optimization (PSO) [29] and mutual information (MMI)
[30,31]. From Table 2 without MMBs, before registration, RMS, PSNR, COR and MI
are 0.1148, 18.7706, 0.2027 and 0.0437, respectively. After registration, for FFT and
Table 1 Comparison of registration results (see Figures 7 & 8) by different values of
parameter l2 (l1 = 5, l3 = 1) based on the proposed method
methods category
without MMBs
with MMBs
performance evaluation
RMS
PSNR
COR
MI
l2 = 1e-4
0.0874
21.1311
0.3145
0.0605
l2 = 1e-2
0.0887
21.0074
0.3060
0.0618
l2 = 1
0.0915
20.7375
0.3111
0.0624
l2 = 1e+2
0.0843
21.4505
0.3100
0.0629
l2 = 1e+4
0.0852
21.3619
0.3075
0.0661
l2 = 1e-4
0.0511
25.7932
0.4004
0.0811
l2 = 1e-2
0.0514
25.7391
0.3995
0.0806
l2 = 1
0.0515
25.7226
0.4090
0.0815
l2 = 1e+2
0.0435
27.1892
0.5303
0.0803
l2 = 1e+4
0.0483
26.2765
0.4545
0.0827
Hou et al. BioMedical Engineering OnLine 2015, 14(Suppl 1):S14
http://www.biomedical-engineering-online.com/content/14/S1/S14
Figure 9 US-MRI registration based on the proposed method without MMBs (l1 = 5, l2 = 1e +2, l3
= 1). (a) US image segmentation. (b) MRI segmentation. (c) subtraction result between (a) and (b). (d)
optical flow field. (e) registered result of (a). (f) subtraction result between (e) and (b). (g) US image. (h)
registered US image.
PSO, the evaluation indexes used in Table 3 were improved, but not much. For MMI,
the increase of RMS (from 0.1148 to 0.1156), the decrease of PSNR (from 18.7706 to
18.7069) and the decrease of COR (from 0.2027 to 0.1494) are all abnormal variation
as shown in Table 3. From Figure 11, it can be seen that the registration results using
Figure 10 US-MRI registration based on the proposed method with MMBs (l1 = 5, l2 = 1e +2, l3 =
1). (a) US image segmentation. (b) MRI segmentation. (c) subtraction result between (a) and (b). (d) optical
flow field. (e) registered result of (a). (f) subtraction result between (e) and (b). (g) US image. (h) registered
US image.
Page 11 of 15
Hou et al. BioMedical Engineering OnLine 2015, 14(Suppl 1):S14
http://www.biomedical-engineering-online.com/content/14/S1/S14
Page 12 of 15
Table 2 Comparison of the registration results (see Figures 9 & 10) based on the
proposed method (l1 = 5, l2 = 1e+2, l3 = 1).
the proposed method
without MMBs
with MMBs
performance evaluation
RMS
PSNR
COR
MI
before registration
0.1148
18.7706
0.2027
0.0437
after registration
0.0843
21.4505
0.3100
0.0629
before registration
0.0657
23.6063
0.1415
0.0398
after registration
0.0435
27.1892
0.5303
0.0803
the other methods are unsatisfactory when MMBs are not used. The quantitative performance evaluated in Table 3 also confirms our intuitive feelings.
In addition, with MMBs and before registration, Table 2 shows RMS, PSNR, COR
and MI are 0.0657, 23.6063, 0.1415 and 0.0398, respectively. After registration, for
FFT, PSO and MMI, the above evaluation indexes are improved.
The above quantitative analyses also indicate that FFT is the best method among the
other three methods, which is in accordance with the above intuitive observation as
Figure 11 US-MRI registration based on the other methods without MMBs. (a) US imge
Segmentation. (b) MRI segmentation. (c) registered result of (a) using FFT. (d) subtraction result between
(c) and (b). (e) registered result of (a) using PSO. (f) subtraction result between (e) and (b). (g) registered
result of (a) using MMI. (h) subtraction result between (g) and (b). (i) US image. (j) registered US image
using FFT. (k) registered US image using PSO. (l) registered US image using MMI.
Hou et al. BioMedical Engineering OnLine 2015, 14(Suppl 1):S14
http://www.biomedical-engineering-online.com/content/14/S1/S14
Page 13 of 15
Figure 12 US-MRI registration based on the other methods with MMBs. (a) US imge segmentation.
(b) MRI segmentation. (c) registered result of (a) using FFT. (d) subtraction result between (c) and (b). (e)
registered result of (a) using PSO. (f) subtraction result between (e) and (b). (g) registered result of (a)
using MMI. (h) subtraction result between (g) and (b). (i) US image. (j) registered US image using FFT. (k)
registered US image using PSO. (l) registered US image using MMI.
shown in Figure 12. It should be noted that the evaluation indexes of the proposed
method with MMBs, namely RMS, PSNR, COR and MI, are 0.0435, 27.1892, 0.5303
and 0.0803, while the evaluation indexes of FFT with MMB are 0.0565, 24.9184, 0.3684
and 0.0736. Clearly, the performance evaluation of the registration results using the
proposed method are superior to the method with FFT. In summary, compared with
Table 3 Comparison of the registration results (see Figures 11 & 12) based on the other
methods.
methods category
without MMBs
with MMBs
performance evaluation
RMS
PSNR
COR
MI
FFT
0.107
19.3786
0.2888
0.0658
PSO
0.1139
18.8351
0.2338
0.0500
MMI
0.1156
18.7069
0.1494
0.0526
FFT
0.0565
24.9184
0.3684
0.0736
PSO
0.0652
23.6767
0.1629
0.0597
MMI
0.0577
24.7385
0.3458
0.0697
Hou et al. BioMedical Engineering OnLine 2015, 14(Suppl 1):S14
http://www.biomedical-engineering-online.com/content/14/S1/S14
the other methods, the proposed method combined with MMB has the best
performance.
Conclusions
In this study, MMBs were introduced as a new dual-modality contrast agent into the
field of medical imaging. We verified that MMBs can increase the contrast of both US
image and MRI, leading to the potential beneficial to registration of US and MR
images. Using the same contrast agent for both US image and MRI would not only
bring convenience to medical professionals, but also reduced health care cost. Qualitative and quantitative analyses of multiple group comparison experiments showed that
registration results using all methods tested in this paper without MMBs were unsatisfactory. On the contrary, the proposed method combined with MMBs led to the best
registration results.
Our algorithm implementation was intensity-based and was independent of the
metric used. Therefore, it can be adapted to different image modalities. At present,
effort to improve algorithms for medical image processing has seen very little progress.
Combining novel nanomaterials with algorithm optimization provides a new approach
for potential gains in imaging processing.
Our results were encouraging. However, they were still at preliminary stage. Further
in vivo studies including toxicological and pathological studies will be necessary before
our methods could be implemented in clinical applications.
Competing interests
Other than the grants listed in the acknowledgement section, the authors declare that they have no other competing
interest.
Authors’ contributions
NG, MH and FY were responsible for the design and overall investigation. MH, CC and SL were responsible for
computational modeling and programming. DT helped to revise the manuscript. All authors 1) have made substantial
contributions to conception and design, or acquisition of data, or analysis and interpretation of data; 2) have been
involved in drafting the manuscript or revising it critically for important intellectual content; and 3) have given final
approval of the version to be published. Each author has participated sufficiently in the work to take public
responsibility for appropriate portions of the content.
Authors’ information
The Southeast University group (Mo Hou, Shouhua Luo, Fang Yang and Ning Gu) has been publishing in preparation
and application of magnetic microbubbles, see website: http://lbmd.seu.edu.cn/research.php
Chen has been doing research in medical image processing, see website: http://cae.nuaa.edu.cn/swyx/webs/teachers/
chencx.htm
Tang has been publishing image-based modeling work in recent years, For more information, please visit Tang’s
website: http://users.wpi.edu/~dtang/.
Acknowledgements
This work was supported by the National Important Science Research Program of China (Nos.2011CB933503,
2013CB733804), the NSFC (Nos. 31000453, 61127002, 61179035 and 61127002), Foundation for the Author of the
National Excellent Doctoral Dissertation of PR China (No. 201259), Research Fund of Young Teachers for the Doctoral
Program of Higher Education of China (No. 20100092120038), and the Open Project Program (KF-GN-201107).
Declarations
Publication of this article was paid with funding from the National Important Science Research Program of China
(Grant No. 2013CB733804).
This article has been published as part of BioMedical Engineering OnLine Volume 14 Supplement 1, 2015:
Cardiovascular Disease and Vulnerable Plaque Biomechanics. The full contents of the supplement are available online
at http://www.biomedical-engineering-online.com/supplements/14/S1
Authors’ details
Jiangsu Key Laboratory for Biomaterials and Devices, State Key Laboratory of Bioelectronics, School of Biological
Science and Medical Engineering, Southeast University, Nanjing, 210096, China. 2School of Computer Science and
Technology, Jiangsu Normal University, Xuzhou, 221000, China. 3College of Automation Engineering, Nanjing
1
Page 14 of 15
Hou et al. BioMedical Engineering OnLine 2015, 14(Suppl 1):S14
http://www.biomedical-engineering-online.com/content/14/S1/S14
University of Aeronautics and Astronautics, 210016, Nanjing, China. 4Mathematical Sciences Department, Worcester
Polytechnic Institute, MA, 01609, USA.
Published: 9 January 2015
References
1. Ke H, Wang J, Dai Z, Jin Y, Qu E, Xing Z, Guo C, Yue X, Liu J: Gold-nanoshelled microcapsules: a theranostic agent for
ultrasound contrast imaging and photo-thermal therapy. Angew Chem Int Ed 2011, 123:3073-7.
2. Yang F, Li L, Li Y, Chen Z, Wu J, Gu N: Superparamagnetic nanoparticle-inclusion microbubbles for ultrasound
contrast agents. Phys Med Biol 2008, 53:6129-41.
3. Park JI, Jagadeensan D, Williams R, Oakden W, Chung S, Stanisz GJ, Kumacheva E: Microbubbles loaded with
nanoparticles: a route to multiple imaging modalities. ACS Nano 2010, 4:6579-86.
4. Kiessling F, Gaetjens J, Palmowski M: Application of molecular ultrasound for imaging integrin expression.
Theranostics 2011, 1:127-34.
5. Liu Z, Lammers T, Ehling J, Fokong S, Bornemann J, Kiessling F, Gätjens J: Iron oxide nanoparticle-containing
microbubble composites as contrast agents for MR and ultrasound dual-modality imaging. Biomaterials 2011,
32:6155-63.
6. Yang F, Li Y, Chen Z, Zhang Y, Wu J, Gu N: Superparamagnetic iron oxide na-noparticle-embedded encapsulated
microbubbles as dual contrast agents of magnetic resonance and ultrasound imaging. Biomaterials 2009,
30:3882-90.
7. Arvanitis CD, Livingstone MS, McDannold N: Combined ultrasound and MR imaging to guide focused ultrasound
therapies in the brain. Phys Med Biol 2013, 58:4749-61.
8. Zhang D, Li Z, Chen K, Xiong J, Zhang X, Wang L: An optical tracker based robot registration and servoing method
for ultrasound guided percutaneous renal access. Biomed Eng Online 2013, 12:47.
9. Hu Y, Ahmed HU, Taylor Z, Allen C, Emberton M, Hawkes D, Barratt D: MR to ultrasound registration for image
-guided prostate interventions. Med Image Anal 2012, 16:687-703.
10. Kuklisova-Murgasova M, Cifor A, Napolitano R, Papageorghiou A, Gerardine Quaghebeur, Rutherford MA, Hajnal JV,
Noble JA, Schnabel JA: Registration of 3D fetal neurosonography and MRI. Med Image Anal 2013, 17:1137-50.
11. Lee JD, Huang CH, Yang ST, Chu YH, Shieh YY, Chen JW, Lin KJ: MRI/SPECT-based diagnosis and CT-guided highintensity focused-ultrasound treatment system in MPTP mouse model of Parkinson’s disease. Med Eng Phys 2013,
35:222-30.
12. Wein W, Roper B, Navab N: Integrating diagnostic B-mode ultrasonography into CT-based radiation treatment
planning. IEEE Trans Med Imaging 2007, 26:866-79.
13. Hou M, Luo S, Yang F, Ruan X, Gu N: MRI-ultrasound registration based on dual modality contrast agent. (in
Chinese). Chin Sci Bull (Chin Ver) 2012, 57:2119-26.
14. Hou M, Luo S, Yang F, Ruan X, Gu N: MRI-ultrasound fusion based on magnetic microbubble contrast agent. (in
Chinese). Sci China Inf Sci (Chin Ver) 2013, 43:1445-59.
15. Cai X, Yang F, Gu N: Applications of Magnetic Microbubbles for Theranostics. Theranostics 2012, 2:103-12.
16. Yang F, Zhang M, He W, Chen P, Cai X, Yang L, Gu N, Wu J: Controlled release of Fe3O4 na-noparticles in
encapsulated microbubbles to tumor cells via sonoporation and associated cellular bioeffects. Small 2011, 7:902-10.
17. Lin X, Qiu T, Nicolier F, Ruan S: The study of active demons algorithm for deformable image registration. Chin J
Biomed Eng 2008, 27:636-40.
18. Kass M, Witkin A, Terzopoulos D: Snakes: active contour models. Int J Comput Vision 1988, 4:321-31.
19. Chan TF, Vese LA: Active Contours Without Edges. IEEE Trans Image Process 2001, 10:266-77.
20. Ge Q, Xiao L, Huang H, Wei Z: An active contour model driven by anisotropic region fitting energy for image
segmentation. Digit Signal Process 2013, 23:238-43.
21. Jiang S, Zhang W, Wang Y, Chen Z: Brain extraction from cerebral MRI volume using a hybrid level set based active
contour neighborhood model. Biomed Eng Online 2013, 12:31.
22. Zheng Q, Dong EQ: Narrow Band Active Contour Model for Local Segmentation of Medical and Texture Images.
Acta Automatica Sin 2013, 39:21-30.
23. Xiong J, Luo Y, Tang G: An Improved Optical Flow Method for Image Registration with Large-scale Movements.
Acta Automatica Sin 2008, 34:760-64.
24. Horn BK, Schunck BG: Determining optical flow. Artif Intel 1981, 17:185-203.
25. Sun D, Roth S, Black MJ: A Quantitative Analysis of Current Practices in Optical Flow Estimation and The Principles
Behind Them. Technical Report 2010, Brown-CS-10-03.
26. Gilboa G, Osher S: nonlocal operators with applications to image processing. Multiscale Model Simul 2008, 7:1005-28.
27. Yang Z, Penczek PA: Cryo-EM image alignment based on nonuniform fast Fourier transform. Ultramicroscopy 2008,
108:959-69.
28. Xie H, Hicks N, Keller GR, Huang H, Kreinovich V: An IDL/ENVI implementation of the FFT-based algorithm for
automatic image registration. Comput Geosci 2003, 29:1045-55.
29. Das A, Bhattacharya M: Affine-based registration of CT and MR modality images of human brain using
multiresolution approaches: comparative study on genetic algorithm and particle swarm optimization. Neural
Comput Appl 2011, 20:223-37.
30. Sandiego CM, Weinzimmer D, Carson RE: Optimization of PET-MR registrations for nonhuman primates using
mutual information measures: A Multi-Transform Method (MTM). NeuroImage 2013, 64:571-81.
31. Gao Z, Gu B, Lin J: Monomodal image registration using mutual information based methods. Image Vision Comput
2008, 26:164-73.
doi:10.1186/1475-925X-14-S1-S14
Cite this article as: Hou et al.: Magnetic microbubble-mediated ultrasound-MRI registration based on robust
optical flow model. BioMedical Engineering OnLine 2015 14(Suppl 1):S14.
Page 15 of 15


© Copyright 2026