
Medicare & Medicaid Research Review 2013: Volume 3, Number 3
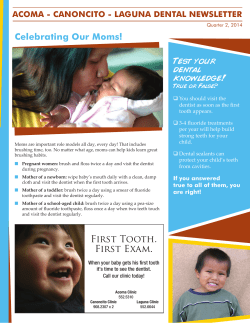
MMRR
2013: Volume 3 (3)
Medicare & Medicaid Research Review
2013: Volume 3, Number 3
A publication of the Centers for Medicare & Medicaid Services,
Office of Information Products and Data Analytics
Increased Use of Dental Services by Children Covered
by Medicaid: 2000–2010
Leighton Ku,¹ Jessica Sharac,¹ Brian Bruen,¹ Megan Thomas,² Laurie Norris²
¹The George Washington University—Department of Health Policy
²Centers for Medicare & Medicaid Services—Center for Medicaid and CHIP Services
Abstract
This report analyzes the use of dental services by children enrolled in Medicaid from federal fiscal years
(FFY) 2000 to 2010. The number and percent of children receiving dental services under Medicaid
climbed continuously over the decade. In FFY 2000, 6.3 million children ages 1 to 20 were reported to
receive some form of dental care (either preventive or treatment); the number more than doubled to 15.4
million by FFY 2010. Part of the increase was because the overall number of children covered by Medicaid
rose by 12 million (50%), but the percentage of children who received dental care climbed appreciably
from 29.3% in FFY 2000 to 46.4% in FFY 2010.
In that same time period, the number of children ages 1 to 20 receiving preventive dental services climbed
from a reported 5.0 million to 13.6 million, while the percentage of children receiving preventive dental
services rose from 23.2% to 40.8%. For children ages 1 to 20 who received dental treatment services, the
reported number rose from 3.3 million in FFY 2000 to 7.6 million in FFY 2010. The percentage of
children who obtained dental treatment services increased from 15.3% to 22.9%. In FFY 2010, about one
sixth of children covered by Medicaid (15.7%) ages 6-14 had a dental sealant placed on a permanent
molar.
While most states have made steady progress in improving children’s access to dental care in Medicaid
over the past decade, there is still substantial variation across states and more remains to be done.
Keywords: Access, Demand, Utilization of Services, Child and Adolescent Health, Dentistry, Dental Care, Medicaid,
Children's Health Insurance Program, CHIP, SCHIP
doi: http://dx.doi.org/10.5600/mmrr.003.03.b01
Ku, L., Sharac, J., Bruen, B., Thomas, M., Norris, L.
E1
MMRR
2013: Volume 3 (3)
Background
In 2007, the tragic death of a 12-year-old Maryland boy, Deamonte Driver, who died from a
brain infection caused by an untreated tooth infection, brought attention to the difficulties
Medicaid-enrolled children could face in accessing dental care (Otto, 2007). It also prompted
lawmakers to include in the Children’s Health Insurance Program Reauthorization Act of 2009
(CHIPRA) a requirement for CHIP programs to cover dental services starting in 2010, a
requirement for the Department of Health and Human Services to provide clients with a Web
site listing dentists who serve Medicaid or CHIP clients, and an order for the Government
Accountability Office to conduct an analysis of the receipt of, and barriers to, dental services
provided to Medicaid-enrolled children (GAO, 2010). The report found that in federal fiscal
year (FFY) 2008, only 36% had received any dental service, 32% had received a preventive dental
service, and 18% had received a dental treatment service. In eight states, 30% or less of
Medicaid-enrolled children had received any dental service. While these percentages represented
progress in that they were higher than the percentages for fiscal year 2001, they still reflected
Medicaid’s failure to adequately ensure children’s access to dental services.
Dental care is a key component of Medicaid’s Early and Periodic Screening, Diagnostic,
and Treatment (EPSDT) benefit. EPSDT does not apply to adult Medicaid beneficiaries, so
dental care is an optional service for that population. Prior research has found that low-income
children have poorer access to dental care and a higher prevalence of dental caries than higherincome children (Shi & Stevens, 2005; Dye, Li, & Beltran-Aguilar, 2012). However, research has
also shown that, when holding constant socioeconomic factors, children covered by Medicaid or
CHIP tend to have similar access to dental care as privately-insured children, and better access
than uninsured children (Dubay & Kenney, 2001; Duderstadt, Hughes, Soobader, & Newacheck,
2006; Perry & Kenney, 2007).
To further bolster access to dental care, the Centers for Medicare & Medicaid Services
(CMS) introduced an Oral Health Strategy in 2011 (CMS, 2011a). The strategy recognizes
multiple barriers to children’s dental care access, such as low reimbursement rates for dental
providers, which results in fewer dentists willing to serve Medicaid beneficiaries. For children on
Medicaid, and their parents/guardians, a lack of knowledge about the importance of dental care
and of benefits available to them under Medicaid, and a difficulty with transportation to dental
appointments represent further barriers to care. The Oral Health Strategy consists of five
components: 1) working with states to develop pediatric oral health action plans; 2)
strengthening technical assistance to states and facilitating state/tribal peer-to-peer learning; 3)
bringing outreach to providers; 4) providing outreach to beneficiaries; and 5) partnering with
other HHS agencies.
Ku, L., Sharac, J., Bruen, B., Thomas, M., Norris, L.
E2
MMRR
2013: Volume 3 (3)
This article reviews the progress that has been made over the past decade (FFYs 2000 to
2010) in improving children’s use of dental care in Medicaid. Major progress has been made,
although further improvements are needed.
Methods and Data
These analyses are based on aggregate data reported annually to the federal government by state
Medicaid agencies using Form CMS-416 for FFYs 2000 to 2010. All data reflect updates posted
on the Medicaid.gov Web site by CMS as of April 11, 2013. The report includes all children
covered by Medicaid, including those whose coverage was supported by CHIP. The form does
not separately report CHIP-funded children and comparable data are not available for separate
state CHIP programs. Typically, state agencies complete these reports depending on analyses of
their Medicaid claims data, based on procedure codes using the Current Dental Terminology
(CDT) system specified in the federal report instructions (CMS, 2011b). In many cases, states
ask Medicaid managed care organizations to compile data based on their administrative records.
They report the unduplicated number of children receiving various dental or oral health care
services paid by Medicaid over the course of the federal fiscal year.
This report focuses on the number of children who received any dental service in the
federal fiscal year, any preventive dental service (e.g., dental cleaning or application of dental
sealants), or any dental treatment service (e.g., filling a cavity). Since the data reported for each
category of service are unduplicated, a child who uses, for example, three preventive dental
services in a year is reported as just one child in the preventive services category. If that same
child also uses a dental treatment service, the child would be counted in the dental treatment
category as well. Our analyses are limited to children between the ages of 1 and 20, since few
children under 1 receive dental care. We report national trend data from FY 2000 to 2010 and
state-specific data for FFY 2010, the most recent year of data fully available. We present
cumulative growth rates over the decade, as well as compounded annual growth rates.
From FFY 2000 to FFY 2009, the format for reporting dental services was consistent, but
the reporting instructions changed in FFY 2010. A particularly important change was that the
universe of children for whom the receipt of dental services was to be reported shifted from all
children, regardless of length of enrollment, to children covered by Medicaid for at least 90
continuous days, recognizing that children may have little opportunity to use services if they are
enrolled for only a brief period. To make the FFY 2010 data consistent with earlier years, we
inflated the dental service numbers reported for the year FFY 2010, by multiplying them by the
ratio of the total number of children eligible for EPSDT benefits during the reporting period, to
the number of children eligible for EPSDT benefits for 90 continuous days. This changes the
count of children served in FFY 2010, but does not alter the percent estimate for that year.
For example, Maryland reported that 64,236 children ages 10 to 14 who were enrolled for
at least 90 continuous days received preventive dental services in FFY 2010. The number of
Ku, L., Sharac, J., Bruen, B., Thomas, M., Norris, L.
E3
MMRR
2013: Volume 3 (3)
children in Maryland in this age range who were eligible for EPSDT benefits for any period of
time during FFY 2010 was 123,601, and the number of those children enrolled for at least 90
continuous days was 118,843—a ratio of 1.04. Multiplying by this ratio, the reported number of
children in this age range receiving preventive dental care produces an estimate of 66,808
children ages 10 to 14 in FFY 2010 who received a preventive dental service. This number is
methodologically more consistent with reports for 2000 to 2009. To make this clear, Exhibit 1
notes that the number of children receiving services in FFY 2010 are adjusted and are not exactly
what states reported. In Exhibit 2, we present state-specific data for FFY 2010; since we are not
making comparisons with prior years, those data are not adjusted.
The CMS-416 reporting instructions made other smaller changes in FFY 2010. They
specified that dental services reported on certain lines should be limited to those provided “by or
under the supervision of a dentist.” As a result, states had to shift services performed by health
care professionals other than dentists or by dental professionals working without a dentist’s
supervision to another category. We made no adjustment for this change even though the
resulting reporting differences should have the effect of slightly lowering FFY 2010 estimates
(even after the adjustment we described) for dental services, compared to earlier years.
Insofar as the CMS-416 data are based on administrative claims, they are not subject to
respondent recall error and they represent the most comprehensive administrative data available
on this topic for Medicaid. Nonetheless, they may be subject to reporting error if dental
procedures are not coded correctly or if the state processing excludes some services paid by
Medicaid or had other problems. For example, certain types of service locations (federally
qualified health centers, rural health clinics and Indian Health Service providers) are not
required to submit procedure codes, so dental procedures they perform may not be captured.
Data for Maine in FFY 2003, FFY 2004, and FFY 2005 were missing; we estimated those data for
use in the trend analysis through interpolation.
Results
National Trends for Children on Medicaid: FFY 2000–2010
Between FFY 2000 and 2010, the total number of children ages 1–20 enrolled in Medicaid grew
from 21.6 to 33.2 million, an increase of 53.7% (Exhibit 1; children covered by Medicaid also
include children covered in Medicaid expansions funded by CHIP). Other analyses have shown
that the growth of publicly-funded insurance coverage for children helped fuel a reduction in the
percent of children who are uninsured, despite the erosion of privately-funded insurance (Choi,
Sommers, & McWilliams, 2011).
Any Dental Services
From FFY 2000 to FFY 2010, the number of children ages 1 to 20 who were reported as receiving
any dental services (diagnostic, preventive, or treatment) in Medicaid more than doubled from
Ku, L., Sharac, J., Bruen, B., Thomas, M., Norris, L.
E4
MMRR
2013: Volume 3 (3)
6.3 million to 15.4 million (Exhibit 1), representing a 144% growth over the decade. While this
level of growth was partly attributable to overall increases in Medicaid enrollment, it also reflects
a major increase in the percentage of enrolled children who used dental care in the reporting
year, rising from 29.3% in FFY 2000 to 46.4% in FFY 2010 (Exhibit 2). The data also suggest that
the increased utilization of dental services was relatively continuous at the national level, steadily
improving from one year to the next.
Exhibit 1. Changes in the Number and Percentage of Children Ages 1–20 Covered by Medicaid and Receiving
Dental Services, FFY 2000–2010
Number of Children Receiving
Percent of Children Receiving
Number of
Children
Preventive
Dental
Any
Preventive
Dental
Ages 1-20
Federal
Any Dental
Dental
Treatment
Dental
Dental
Treatment
Fiscal Year
in EPSDT
Services
Services
Services
Services
Services
Services
2000
21,623,551
6,333,525
5,027,395
3,303,971
29.3%
23.2%
15.3%
2001
22,892,995
6,593,050
5,381,495
3,548,745
28.8%
23.5%
15.5%
2002
24,782,926
7,477,755
6,158,301
4,062,069
30.2%
24.8%
16.4%
2003
26,186,138
8,604,571
7,083,302
4,704,768
32.9%
27.0%
18.0%
2004
27,975,234
9,561,670
7,909,744
5,186,416
34.2%
28.3%
18.5%
2005
28,631,327
10,092,537
8,474,147
5,345,997
35.2%
29.6%
18.7%
2006
29,311,369
10,359,215
8,772,210
5,506,873
35.3%
29.9%
18.8%
2007
29,093,903
10,795,130
9,275,966
5,611,363
37.1%
31.9%
19.3%
2008
29,815,099
11,634,314
10,142,684
5,787,100
39.0%
34.0%
19.4%
2009
31,394,986
13,368,421
11,688,076
6,487,957
42.6%
37.2%
20.7%
2010 (adj.)
33,246,146
15,419,670
13,557,599
7,629,261
46.4%
40.8%
22.9%
Average
annual %
4.4%
9.3%
10.4%
8.7%
growth
Cumulative
% Growth
53.7%
143.5%
169.7%
130.9%
2000-2010
NOTE. Data for FFY 2010 are adjusted because of a change in reporting requirements. See the text for explanation.
SOURCE: FFY 2000-2010 CMS-416 reports, Line 1, (Line 1a and Line 1b for 2010), Lines 12a, 12b, and 12c.
Preventive Dental Services
The results are also positive for data reported about the receipt of preventive dental care. The
number of children ages 1 to 20 receiving at least one preventive dental service under Medicaid
rose from 5.0 million in FFY 2000 to 13.6 million in FFY 2010 (adjusted), a 170% cumulative
increase. The percentage of children who obtained preventive dental care almost doubled from
23.2% in FFY 2000 to 40.8% in FFY 2010 (Exhibit 2).
Dental Treatment Services
Between FFY 2000 and FFY 2010 (adjusted), the number of children ages 1 to 20 who received at
least one dental treatment under Medicaid grew 131%, rising from 3.3 million to 7.6 million.
The percentage of children covered by Medicaid who obtained dental treatment services rose
from 15.3% in FFY 2000 to 22.9% in FFY 2010 (Exhibit 2).
Ku, L., Sharac, J., Bruen, B., Thomas, M., Norris, L.
E5
MMRR
2013: Volume 3 (3)
In sum, while there were appreciable increases in the utilization of pediatric dental
services in Medicaid from FFY 2000–2010, these data indicate that there was particularly strong
growth in the use of preventive dental services for children.
Exhibit 2. Percentage of Children Ages 1–20 Covered by Medicaid Who Received Any Dental Services, Preventive
Dental Services, or Dental Treatment Services FFY 2000–FFY 2010
50%
46.4%
Percent Children Receiving Any Dental Services
40.8%
40%
30%
29.3%
23.2%
20%
23.0%
15.3%
Any dental services
Preventive dental services
Dental treatment services
10%
0%
2000
2001
2002
2003
2004
2005
2006
2007
2008
2009
2010
Source: FFY 2000-2010 CMS-416 reports.
Dental Care for Children on Medicaid Across the States
There is substantial variation in the utilization of dental care from state to state. For example, in
FFY 2010, the percent of children with any preventive dental care ranges almost four-fold across
the states, from 15.1% in one state to 57.6% in another. Exhibit 3 presents state-specific data for
FFY 2010. Since these data are not being reported as trends, they are presented as reported by
states and are not adjusted to be comparable to prior year data. Thus, the universe is for children
ages 1 to 20 enrolled for at least 90 continuous days in the federal fiscal year and the dental
services are those provided by, or under the supervision of, a dentist.
As seen in Exhibit 2, on average, states report that a sizable percentage of Medicaid
children receive dental care, but only 17 of 51 states reached more than half of enrolled children.
The state data parallel the national results in showing that preventive dental care is more
frequently used than dental treatment services. Forty-three states report that 40% or more of
children received any type of dental care in FFY 2010 and 17 states report that 50% or more did
so. Thirty-three states reported that 40% or more of children received preventive dental care and
15 reported that 25% or more received dental treatment services.
Ku, L., Sharac, J., Bruen, B., Thomas, M., Norris, L.
E6
MMRR
2013: Volume 3 (3)
The new reporting requirements established for FFY 2010 may have led to problems for
some states. There are often transitional difficulties when new reporting requirements are
established and it may take time before the problems are resolved. CMS has conducted reviews
to work with states that have anomalous results. Our comparison of FFY 2009 and FFY 2010
data suggests that most state data were consistent across the years.
Use of Dental Sealants for Children on Medicaid
Beginning in FFY 2010, the CMS-416 began reporting additional details about dental care. An
important addition was the annual reporting of the use of dental sealants, as required by
CHIPRA. States must report the unduplicated number of children ages 6 to 14 who have a
dental sealant placed on a permanent molar in the federal fiscal year, regardless of whether a
dentist or non-dentist applied it. The use of dental sealants (a tough plastic coating over the
tooth) is considered one of the most effective methods to prevent dental caries (Beauchamp et
al., 2008). The Healthy People 2020 public health goals for the nation include an objective to
“increase the proportion of children and adolescents who have received dental sealants on their
molar teeth” (DHHS, 2012).
There was a substantial variation in the percent of children receiving sealants reported by
states, ranging from 0% to 57.2% (Exhibit 3). Nationwide, about one-sixth of children, ages 6 to
14 and covered by Medicaid (15.7%), had a dental sealant placed in FFY 2010. Since this was the
first time that states had to report this information, these data should be considered preliminary,
and reporting should improve with time; it seems unlikely that the actual levels varied as widely
as reported.
A reporting problem in this area, in addition to the problems with federally qualified
health centers and other sites described earlier, is that many children receive dental sealants in
broad dental health programs at schools or other community settings. If the care in these broad
programs was not paid by Medicaid, then it will not be reported in the Medicaid claims system,
even if Medicaid-enrolled children were the recipients. Thus, the level of sealants paid by
Medicaid and reported in the CMS-416 is not the same as the incidence of care received by
children covered by Medicaid. Some data reported on dental sealants, such as those in the
Center for Disease Control and Prevention’s National Oral Health Surveillance System, are
prevalence data based on the percentage of children who ever had a dental sealant placed. Since
sealants may last for years, the incidence of dental sealants applied in a year should be less than
the prevalence of children who ever had them placed.
Ku, L., Sharac, J., Bruen, B., Thomas, M., Norris, L.
E7
MMRR
2013: Volume 3 (3)
Exhibit 3. The Number of Children Ages 1–20 Covered by Medicaid and the Percentage Receiving Dental Services
in FFY 2010
Percentage of Children Receiving:
Number of
Dental Sealants
State
Children Ages
Any Dental
Preventive
Dental
(for Children
1-20 in EPSDT
Care
Dental Care
Treatment
Ages 6-14)
Alabama
492,002
52.7%
49.6%
21.4%
26.8%
Alaska
80,121
48.3%
41.2%
27.2%
20.4%
Arizona
731,295
51.1%
45.6%
26.0%
16.8%
Arkansas
361,256
50.0%
46.0%
25.3%
10.2%
California
4,005,732
41.8%
34.2%
22.0%
12.2%
Colorado
358,138
52.0%
46.9%
26.5%
16.9%
Connecticut
286,569
59.9%
54.1%
27.0%
24.1%
Delaware
88,534
44.9%
41.1%
21.2%
20.6%
District of
83,009
47.4%
39.1%
21.8%
11.9%
Columbia
Florida
1,758,401
25.0%
15.1%
8.3%
6.0%
Georgia
1,031,380
49.0%
45.7%
22.4%
12.3%
Hawaii
130,008
52.9%
41.1%
25.0%
8.2%
Idaho
163,146
62.6%
55.3%
35.1%
15.1%
Illinois
1,507,535
50.4%
46.7%
18.8%
21.2%
Indiana
688,158
33.2%
29.3%
14.9%
11.6%
Iowa
260,000
45.0%
39.7%
18.9%
13.2%
Kansas
209,264
45.1%
41.9%
20.4%
23.0%
Kentucky
482,301
48.5%
42.6%
24.6%
57.2%
Louisiana
747,075
46.5%
42.6%
24.6%
10.1%
Maine
123,555
24.5%
19.7%
10.9%
8.6%
Maryland
530,930
52.9%
47.6%
25.0%
20.6%
Massachusetts
512,473
54.0%
50.0%
29.8%
28.6%
Michigan
1,129,494
35.8%
35.0%
15.4%
9.0%
Minnesota
410,006
44.0%
39.6%
19.9%
15.0%
Mississippi
370,081
48.2%
43.2%
22.4%
16.8%
Missouri
602,755
34.1%
30.4%
15.6%
11.6%
Montana
68,884
39.6%
34.5%
21.5%
13.6%
Nebraska
143,664
50.0%
46.2%
22.1%
18.9%
Nevada
191,222
41.4%
36.5%
23.6%
20.5%
New Hampshire
86,347
60.1%
55.6%
25.9%
17.3%
New Jersey
617,282
45.4%
39.7%
24.1%
12.1%
New Mexico
338,259
49.5%
45.5%
48.9%
14.0%
New York
1,914,047
40.4%
37.2%
19.3%
11.1%
North Carolina
985,743
47.7%
43.7%
23.5%
14.6%
North Dakota
42,134
38.5%
30.3%
15.7%
12.6%
Ohio
1,102,254
48.0%
44.0%
20.4%
0.0%
Oklahoma
503,597
51.1%
46.9%
28.3%
9.3%
Oregon
292,572
41.9%
36.0%
20.1%
13.6%
Pennsylvania
1,084,889
41.8%
36.9%
20.3%
13.5%
Rhode Island
100,017
49.0%
42.9%
21.5%
12.6%
Ku, L., Sharac, J., Bruen, B., Thomas, M., Norris, L.
E8
MMRR
2013: Volume 3 (3)
Exhibit 3 (cont.)
State
South Carolina
South Dakota
Tennessee
Texas
Utah
Vermont
Virginia
Washington
West Virginia
Wisconsin
Wyoming
U.S. Total
Number of
Children Ages
1-20 in EPSDT
Percentage of Children Receiving:
Any Dental
Care
Preventive
Dental Care
Dental
Treatment
523,043
77,040
763,634
2,911,715
168,528
57,994
576,017
701,292
194,131
498,473
51,705
55.7%
43.7%
49.0%
66.5%
49.3%
58.8%
49.9%
55.4%
50.0%
25.8%
43.4%
53.0%
39.1%
44.5%
54.7%
48.4%
57.6%
46.0%
51.0%
43.6%
23.0%
43.3%
26.0%
15.6%
24.5%
35.6%
24.3%
24.1%
25.7%
32.1%
49.6%
11.5%
23.7%
Dental Sealants
(for Children
Ages 6-14)
14.6%
9.9%
13.3%
32.3%
0.0%
16.0%
14.6%
18.9%
13.8%
9.5%
14.8%
31,137,701
46.4%
40.8%
23.0%
15.7%
NOTE. All data in this table is for children continuously enrolled for at least 90 days in FFY 2010. They are not adjusted to be comparable with
prior year data and thus differ somewhat from data in Exhibit 1 and Exhibit 3.
SOURCE: FFY 2010 CMS-416 reports, Lines 1b, 12a, 12b, 12c, and 12d.
Discussion
The data in this paper come from Medicaid administrative data reported in the CMS-416 report.
Like other administrative data, the accuracy depends on the quality of the information reported
by state agencies or their managed care contractors over the years. As noted, there was a change
in reporting requirements in 2010, but states may have changed their reporting methods over
the years as well. Nonetheless, these data represent the most accurate source of information
currently available.
Over the past decade, states have made substantial progress in improving children’s
access to dental care in Medicaid. The good news is that there has been steady improvement: the
number of children receiving dental care more than doubled from FFY 2000 to 2010 and the
percentage of children receiving dental care grew from 29.3% to 46.4%. On the other hand, data
from the 2010 Medical Expenditure Panel Survey show that the 53.0% of children with private
insurance aged 1 to 20 were reported as receiving any dental care in the past 12 months (authors’
analysis), suggesting that there is room for improvement in Medicaid utilization. Although
Medicaid always offers pediatric dental coverage, millions of children enrolled in Medicaid do
not receive routine dental care. Federal and state governments have begun to address numerous
barriers to dental care, but they continue to persist as obstacles: there is an inadequate number
and geographic distribution of dentists and other oral health care providers who treat Medicaid
patients; families misunderstand the importance of pediatric dental care, particularly preventive
services; and there are transportation and scheduling problems that make it harder for families
Ku, L., Sharac, J., Bruen, B., Thomas, M., Norris, L.
E9
MMRR
2013: Volume 3 (3)
to take their children for care (CMS, 2011a). CMS has taken several proactive steps to work with
states and other partnering organizations to further improve access to dental care in Medicaid,
including the development of its Oral Health Strategy. These efforts should lead to further
improvements in the utilization of dental services and in reductions to problems caused by a
lack of dental care.
In addition, the enactment of the Affordable Care Act (ACA) means that federal
responsibilities for dental coverage have expanded beyond Medicaid and CHIP. The ACA
creates new health insurance exchanges, and requires most private health plans offered in the
individual and small group markets to offer “Essential Health Benefits.” The Essential Health
Benefits includes ten types of services, including pediatric dental and vision care, based on
benefit designs, such as those offered by CHIP programs or the Federal Dental and Vision
Insurance Program (Center for Consumer Information and Insurance Oversight, 2011). About
one-fifth of privately-insured children lack any dental insurance coverage (Liu et al, 2007). The
expanded availability of pediatric dental coverage under the ACA will assure that many more
privately-insured children will have dental coverage, and children will be able to maintain dental
coverage even as they shift between public and private insurance coverage.
Correspondence
Leighton Ku, Ph.D., M.P.H., The George Washington University School of Public Health and Health Services, 2300
Eye St., NW Washington DC 20037, Tel. (202) 994-4143 Fax (202) 994-1850
Acknowledgment
We appreciate guidance from Marsha Lillie-Blanton of CMS and assistance from Erika Steinmetz of George
Washington University.
Ku, L., Sharac, J., Bruen, B., Thomas, M., Norris, L.
E10
MMRR
2013: Volume 3 (3)
References
Beauchamp, J., Caufield, P.W., Crall, J.J., Donly, K., Feigal, R.,Gooch, B. … American Dental
Association Council on Scientific Affairs. (2008). Evidence-Based Clinical
Recommendations for the Use of Pit-and-Fissure Sealants: A Report of the American
Dental Association Council on Scientific Affairs. The Journal of the American Dental
Association, 139(3), 257–268. PubMed
Center for Consumer Information and Insurance Oversight (2011, December) Essential Health
Benefits Bulletin. Retrieved
from http://cciio.cms.gov/resources/files/Files2/12162011/essential_health_benefits_bulleti
n.pdf
Centers for Medicare and Medicaid Services (CMS),(2011a). Improving Access to and
Utilization of Oral Health Services for Children in Medicaid and CHIP Programs: CMS
Oral Health Strategy. Retrieved from http://www.medicaid.gov/Medicaid-CHIP-ProgramInformation/By-Topics/Quality-of-Care/Downloads/CMS-Oral-Health-Strategy.pdf
Centers for Medicare and Medicaid Services (CMS) (2011b, June 2011). Instructions for Form
CMS-416. Early and Periodic Screening, Diagnosis & Treatment. Retrieved
from http://www.medicaid.gov/Medicaid-CHIP-Program-Information/ByTopics/Benefits/Downloads/CMS-416-instructions.pdf
Choi, M., Sommers, B., & McWilliams, J. (2011). Children's health insurance and access to care
during and after the CHIP expansion period. Journal of Health Care for the Poor and
Underserved, 22(2), 576–589. PubMed
Dubay, L. & Kenney, G. (2001). Health care access and use among low-income children: Who
fares best? Health Affairs, 20(1), 112–121. PubMed
Duderstadt, K. G., Hughes, D. C., Soobader, M. J., & Newacheck, P. W. (2006). The impact of
public insurance expansion on children’s access and use of care. Pediatrics, 118(4), 1676–
1682. PubMed
Dye, B., Li, X., & Beltran-Aguilar, E. (2012, May). Selected Oral Health Indicators in the United
States, 2005–2008. National Center for Health Statistics, CDC. Retrieved
from http://www.cdc.gov/nchs/data/databriefs/db96.pdf
Liu, J., Probst, J. C., & Martin, A. B. (2007). Wang, J. Y., Salinas, C. F.Disparities in dental
insurance coverage and dental care among U.S. children: The National Survey of Children’s
Health. Pediatrics, 119(Suppl 1), S12–S21. PubMed
Otto, M. (February 27, 2007). For want of a dentist. Washington Post. Retrieved
from http://www.washingtonpost.com/wpdyn/content/article/2007/02/27/AR2007022702116.html
Ku, L., Sharac, J., Bruen, B., Thomas, M., Norris, L.
E11
MMRR
2013: Volume 3 (3)
Perry, C. D., & Kenney, G. M. (2007). Preventive care for children in low-income families: How
well do Medicaid and State Children’s Health Insurance Programs
do? Pediatrics, 120(6), e1393–e1401. PubMed
Shi, L., & Stevens, G. D. (2005). Disparities in access to care and satisfaction among U.S.
children: the roles of race/ethnicity and poverty status. Public Health Reports, 120(4), 431–
441. PubMed
U.S. Department of Health and Human Services (DHHS). (2012). Healthy People 2020: Oral
Health. Retrieved
from http://www.healthypeople.gov/2020/topicsobjectives2020/objectiveslist.aspx?topicid=
32
U.S. Government Accountability Office (GAO) (2010, November). Oral health: efforts under
way to improve children’s access to dental services, but sustained attention needed to
address ongoing concerns. Retrieved from http://www.gao.gov/assets/320/312818.pdf
Ku, L., Sharac, J., Bruen, B., Thomas, M., Norris, L.
E12
MMRR 2013 Volume 3, Number 3
Medicare & Medicaid Research Review
2013
Volume 3, Number 3
Mission Statement
Medicare & Medicaid Research Review is a peer-reviewed, online journal reporting data and
research that informs current and future directions of the Medicare, Medicaid, and Children’s
Health Insurance programs. The journal seeks to examine and evaluate health care coverage,
quality and access to care for beneficiaries, and payment for health services.
http://www.cms.gov/MMRR/
U.S. Department of Health & Human Services
Kathleen Sebelius
Secretary
Centers for Medicare & Medicaid Services
Marilyn Tavenner
Administrator
Editor-in-Chief
David M. Bott, Ph.D.
The complete list of Editorial Staff and Editorial Board members
may be found on the MMRR Web site (click link):
MMRR Editorial Staff Page
Contact: [email protected]
Published by the Centers for Medicare & Medicaid Services
All material in the Medicare & Medicaid Research Review is in the public domain
and may be duplicated without permission. Citation to source is requested.
ISSN: 2159-0354
doi: http://dx.doi.org/10.5600/mmrr.003.03.b01
E13


© Copyright 2026