
Metabolic interventions in acute myocardial infarction
Metabolic interventions in acute myocardial infarction Metabolic interventions in acute myocardial infarction The study described in this thesis was supported by a grant of the Netherlands Heart Foundation (99.028). Financial support by the Netherlands Heart Foundation for the publication of this thesis is gratefully acknowledged. The Rijksuniversiteit Groningen is gratefully acknowledged for the support of this thesis. Isala series nummer 52 CIP-GEGEVENS KONINKLIJKE BIOBLIOTHEEK, DEN HAAG van der Horst, J.C.C. Metabolic interventions in acute myocardial infarction. Proefschrift Groningen. Met literatuur-opgave en samenvatting in het Nederlands. ISBN: 90-74991-51-3 © Copyright 2005 J.C.C. van der Horst All rights are reserved. No part of this publication may be reproduced, stored in a retrieval system, or transmitted, in any form or by any means – electronic, mechanical, photocopy, recording, or otherwise – without the prior written permission of the author. Cover Suikerhart, Anneke Bloema, The Factory II, Beilen, The Netherlands Lay-out Rémon Kortman & Iwan van der Horst Printed by Visible Edge BV 2 Metabolic interventions in acute myocardial infarction Proefschrift ter verkrijging van het doctoraat in de Medische Wetenschappen aan de Rijksuniversiteit Groningen op gezag van de Rector Magnificus, dr. F. Zwarts, in het openbaar te verdedigen op maandag 31 januari 2005 om 16.15 uur door Johannes Cornelis Clemens van der Horst geboren op 9 oktober 1971 te Wateringen 3 Metabolic interventions in acute myocardial infarction Promotores Prof. Dr. F. Zijlstra Prof. Dr. R.O.B. Gans Copromotores Dr. H.J.G. Bilo Dr. M.J. de Boer Beoordelingscommissie Prof. Dr. G. van den Berghe Prof. Dr. D.J. van Veldhuisen Prof. Dr. B.W.O. Wolffenbuttel 4 5 Metabolic interventions in acute myocardial infarction Contents Chapter 1 General introduction and aims of the thesis Chapter 2 Results of the Glucose-Insulin-Potassium Study (GIPS) 2.1 9 Glucose-insulin-potassium infusion in patients treated with primary 29 angioplasty for acute myocardial infarction (GIPS): a randomized trial 2.2 The impact of glucose-insulin-potassium infusion in acute myocardial 47 infarction on infarct size and left ventricular ejection fraction 2.3 Preservation of myocardial function by glucose-insulin-potassium 63 infusion as adjunct to primary angioplasty 2.4 Electrocardiographic evidence of reperfusion after glucose-insulin- 67 potassium infusion in patients treated with primary angioplasty for ST segment elevation myocardial infarction 2.5 Glucose and potassium derangements by glucose-insulin-potassium 85 infusion related to 1-year mortality in acute myocardial infarction 2.6 Long-term survival after glucose-insulin-potassium infusion and primary 99 angioplasty in ST segment elevation myocardial infarction: the randomized Glucose Insulin Potassium Study (GIPS) Chapter 3 Glucose-insulin-potassium solutions as adjunctive therapy in 113 myocardial infarction: current evidence and potential mechanisms Chapter 4 4.1 Admission hyperglycemia and outcome in acute myocardial infarction Prognostic value of admission glucose in non-diabetic patients with 125 myocardial infarction 4.2 Hyperglycemia reduces myocardial reperfusion after primary 139 percutaneous coronary intervention for ST elevation myocardial infarction 4.3 Hyperglycemia and no reflow phenomenon in acute myocardial 149 infarction 6 Contents Chapter 5 5.1 Time-averaged hyperglycemia and outcome in critically ill patients Glucose at admission or time-averaged glucose during hospital stay: 153 predict major adverse cardiac events in patients with acute myocardial infarction? 5.2 The hyperglycemic index is a tool to assess glucose control: a 167 retrospective study 5.3 Relationship of baseline glucose and mortality during medical critical 179 illness? Chapter 6 Glucose-insulin-potassium and reperfusion in acute myocardial 183 infarction: rationale and design of the Glucose-Insulin-Potassium Study-2 (GIPS-2) Chapter 7 Summary and future perspectives 199 Chapter 8 Dutch summary 213 List of abbreviations 221 Acknowledgements 223 7 Metabolic interventions in acute myocardial infarction 8 Introduction and aims of thesis Chapter 1 General introduction and aims of the thesis Diagnosis and treatment of ST segment elevation myocardial infarction 9 Metabolic interventions in acute myocardial infarction Introduction Treatment strategies for acute ST segment elevation myocardial infarction (MI) have evolved over the last 25 years. In the 1950s and 1960s, it was debated whether coronary thrombosis was the cause or the consequence of ST segment elevation MI. In the 1960s and 1970s, treatment of ST segment elevation MI patients consisted of bed rest for up to a month. Mortality was reduced with the emergence of Coronary Care Units and treatment of the arrhythmias. Landmark studies by DeWood in the early 1980s showed that occlusion of the coronary artery was the critical event leading to ST segment elevation MI.1 Reperfusion therapy became the cornerstone of acute treatment for ST segment elevation MI. Preferentially, acute coronary reperfusion is nowadays accomplished (1) mechanically by primary percutaneous coronary intervention (PCI), previously called primary transluminal coronary angioplasty (PTCA) with or without stenting or (2) pharmacologically with intravenous fibrinolytic therapy. Recent evidence suggests that apart from improved PCI techniques, adjunctive use of platelet glycoprotein IIb/IIIa receptor blockers and metabolic interventions, such as glucose-insulin-potassium (GIK) infusion may enhance procedural success and improve clinical outcome. Together these developments have stimulated renewed efforts to determine the optimal therapeutic strategy for patients with ST segment elevation MI. Pathophysiology The first papers on the clinical diagnosis of MI date from the early 20th century. Obrastzow and Stracheschenko in 1910 and Herrick in 1912 described the features of a sudden obstruction of a coronary artery.2;3 Myocardial infarction is the consequence of disruption, fissuring or hemorrhage of a vulnerable coronary artery plaque, complicated by various degrees of intraluminal thrombosis, embolization, and subtotal or total obstruction to perfusion. The residual antegrade or collateral flow, and the volume and location of affected myocardium determine the characteristics of the clinical presentation. Patients with complete occlusion may manifest ST segment elevation MI, if the lesion occludes an artery supplying a substantial volume of the myocardium. A similar occlusion in the presence of extensive collaterals may present as MI without ST segment elevation. ST segment elevation MI is diagnosed by the presence of a clinical syndrome of new-onset ischemia with either rest pain or a crescendo pattern of ischemic pain on minimal exertion, and elevated enzymatic markers together with electrocardiographic evidence of acute ischemic injury. The predictive accuracy of ST segment elevation for a final diagnosis of MI is very high. The definition of MI proposed by the European Society of Cardiology (ESC)4, the American 10 Introduction and aims of thesis College of Cardiology (ACC)5, and the American Heart Association (AHA)5 requires a typical clinical syndrome plus a rise and fall in creatine kinase-MB (CK-MB) or tropinin. Predictors of death in patients with myocardial ischemia and infarction A number of prognostic models have been developed in populations of patients with ST segment elevation MI to determine the predictive value of several characteristics to predict outcome.6-9 In the multinational, observational Global Registry of Acute Coronary Events (GRACE) the value of baseline clinical and demographic characteristics on hospital mortality was predicted in an unselected population of patients with acute coronary syndrome.10 Killip class, age, blood pressure, cardiac arrest, positive enzymatic markers, serum creatinine level, ST segment deviation, and heart rate contained most of the prognostic information. Although acute coronary syndromes are usually categorized according to the presence or the absence of ST segment elevation at the time of presentation, this variable did not appear to be important for determining the risk of death after accounting for the presence of ST segment deviation. The risk of major cardiovascular complications and death is dependent on acute and pre-existing risk factors (table 1). Table 1. High risk factors and markers of outcome • Age • Previous cardiovascular disease • ST segment deviation • Rhythm disturbances (bundle branch block, ventricular fibrillation, cardiac arrest) • Signs of heart failure (Killip class ≥2) • Glucose derangement (elevated glycosylated hemoglobin or diabetes mellitus) • Renal dysfunction (raised serum creatinine, raised blood urea nitrogen, reduced • Elevated inflammatory markers (C reactive protein, interleukin-6) • Extent of coronary artery disease on angiography (multi-vessel disease) • Large enzymatic infarct size creatinine clearance, micro-albuminuria) General measures The underlying principles of the treatment of ST segment elevation MI patients are to provide relief of ischemia and pain. In the presence of heart failure or shock, assisted 11 Metabolic interventions in acute myocardial infarction ventilation with positive end expiratory pressures may be required.4;5 Reperfusion of critically ischemic myocardium is crucial in those with acute ST elevation or (new-onset) left-bundle branch block or posterior MI. Hemodynamic support may be necessary in patients with hypotension or cardiogenic shock, i.e., patients with Killip class 4 at admission. If so indicated, this supports intra-aortic balloon pumping to stabilize the patient for PCI. Specific measures may be required to control hypertension so as to reduce myocardial wall stress, and to treat acute heart failure. Reperfusion therapy Early and effective reperfusion therapy is the cornerstone of treatment for acute ST segment elevation MI. Restoration of antegrade flow in the occluded artery can be achieved by PCI and/or fibrinolytic therapy. To evaluate the coronary blood flow in patients with the Thrombolysis in Myocardial Infarction (TIMI) flow is determined. The restoration of TIMI grade 3 flow, i.e., optimal flow, is achieved in approximately 9 out of 10 patients treated with PCI as compared to 5-7 out of 10 patients treated with fibrinolytic therapy.11 Early restoration of antegrade flow is related to diminished enzymatic infarct size, preserved left ventricular function, prevention of recurrent infarction, and short-term as well as long-term survival benefit. Fibrinolytic therapy The first two large-scale, placebo-controlled, randomized trials that compared fibrinolytic therapy with placebo demonstrated dramatic benefits for streptokinase. These two trials showed that streptokinase reduced 30-day mortality rates from 13% to 10.7% (P<0.001)12 and 12% to 9.2% (P<0.001)13. These results also showed the synergistic benefits of antiplatelet agents and fibrinolytic therapy, since 30-day mortality was reduced to a greater extent by the combination of aspirin and streptokinase (13.2% versus 8.0%, P<0.001) than by aspirin alone (11.8% versus 9.4%, P<0.001).12;13 Subsequent long-term data from both trials confirmed that the mortality benefit with streptokinase persisted for at least 10 years. Similar trials with other fibrinolytic agents have shown complementary findings, and a systematic overview of all trials randomizing more than 1000 patients to fibrinolytic therapy or placebo (total N=58600) reported a significant reduction in 30-day mortality with fibrinolytic therapy compared to placebo (11.5% versus 9.6%).14 Prehospital administration of fibrinolytic therapy has been proposed as a means of further reducing time to reperfusion. Several studies have analyzed the potential advantages of prehospital fibrinolytics. A recent meta-analysis (N=6434) that combined data from six randomized trials showed a 17% reduction in mortality with prehospital fibrinolytics versus hospitaladministered fibrinolytic therapy (P=0.03).15 Fibrinolytic therapy is limited by various 12 Introduction and aims of thesis safety and efficacy issues, such as contraindications and intracranial hemorrhage. However, until now the combination of glycoprotein IIb/IIIa receptor blockers or specific anti-thrombin (bivalirudin) and fibrinolytic therapy have not shown to improve survival, and may be associated with increased bleeding. Primary percutaneous coronary intervention Primary percutaneous coronary intervention (PCI) achieves reperfusion through mechanical recanalization of the infarct-related artery rather than through lysis of the coronary thrombus with fibrinolytic therapy. Dotter and Judkins were the first to propose the concept of reperfusion of the coronary artery by a catheter technique.16 In 1977, Grüntzig performed the first percutaneous balloon angioplasty.17 One year later, he and his colleagues reported that over a period of 18 months angioplasty had been used in 50 patients.18 The technique was successful in 32 patients, reducing the stenosis from a mean of 84% to 34%. Percutaneous balloon angioplasty without the use of fibrinolytic therapy for acute MI was first described by Hartzler and colleagues in 1983.19 The first stents were implanted in 1985.20 The number of trials comparing primary PCI with fibrinolytic therapy has been relatively small; however, these trials found an advantage for primary PCI. The first three randomized clinical trials comparing primary PCI with various fibrinolytic regimens were published in 1993. Zijlstra and colleagues found in 142 patients that compared to streptokinase primary PCI was associated with a lower incidence of the combined endpoint of recurrent infarction or angina, death, stroke, reocclusion, and heart failure (19% versus 47% P=0.001).21 Grines and colleagues found that primary PCI resulted in a lower rate of nonfatal reinfarction and death compared to tissue-type plasminogen activator (5.1% versus 12%, P=0.02) with a trend towards reduced overall mortality (2.6% versus 6.5%, P=0.06).22 Gibbons and colleagues investigated in 108 patients the effect on myocardial salvage by technetium-99m-sestamibi and could not detect any improvement with primary PCI when compared to tissue-type plasminogen activator.23 These pioneering trials were too small to determine the magnitude of the impact of mechanical reperfusion on mortality. Subsequently, Weaver and colleagues performed a metaanalysis incorporating data from the 10 available early trials that compared primary PCI with fibrinolytic therapy. Primary PCI was associated with a significantly lower rate of 30day mortality (4.4% versus 6.5%, P=0.02), as well as with a significantly lower rate of the combined end-point of death or nonfatal reinfarction (7.2% versus 11.9%, P<0.001). Furthermore, Zijlstra and colleagues evaluated the 5-year results in patients randomly assigned to primary PCI versus streptokinase and showed a significant reduction in mortality in the primary PCI group (13.4% versus 23.9%, P=0.01).24 13 Metabolic interventions in acute myocardial infarction Current data are available from 23 published randomized controlled trials with 7739 patients.25 Eight trials compared primary PCI to streptokinase (N=1837), and 15 primary PCI with fibrin-specific agents (N=5902). Of the 3867 patients randomly assigned to fibrinolytic therapy, most (76%, N=2939) received a fibrin-specific agent (tissue-type plasminogen activator). Stents were used in twelve and platelet glycoprotein IIb/IIIa receptor blockers in eight trials. The included trials differ in many respects, including patient sample size, type of fibrinolytic therapy, and whether the stents were used with or without platelet glycoprotein IIb/IIIa receptor blockers. Primary PCI was found to be more effective than fibrinolytic therapy in reducing short-term and long-term major adverse clinical events, including death. It was also associated with better clinical outcomes, regardless of the type of fibrinolytic agent used or whether the patient required emergent transfer to another hospital for primary PCI. Thus, primary PCI reduces mortality for patients with ST segment elevation MI even in high-risk patients. In the ‘Should we emergenly revascularize Occluded Coronaries for cardiogenic shocK’ (SHOCK) trial it was observed that at 1 year patients treated with PCI or coronary artery bypass grafting had a lower mortality than patients receiving fibrinolytic therapy (34% versus 47%, P=0.03). Postprocedural TIMI grade 3 flow rates in primary PCI trials have been as high as 73% to 97%, surpassing the 50% to 60% early TIMI grade 3 flow rates demonstrated with fibrinolytic therapy. Infarct-related artery reocclusion is also much less frequent after mechanical recanalization. Complications of PCI include the need for vascular repair and development of acute renal failure (approximately 3%).26;27 Additional treatment To salvage viable myocardium by re-establishing coronary blood flow with the rapid use of reperfusion strategies is an essential first step. However, reperfusion of ischemic myocardium carries with it an inherent risk. Paradoxically, the process of reperfusion itself can result in myocyte death. This phenomenon is termed reperfusion injury. Mitochondria play a key role in determining cell fate during exposure to stress. Their role during ischemia/reperfusion is particularly critical due to the conditions that promote both apoptosis by the mitochondrial pathway and necrosis by irreversible damage to mitochondria in association with mitochondrial permeability transition. Mitochondrial permeability transition is caused by the opening of permeability transition pores in the inner mitochondrial membrane, leading to matrix swelling, outer membrane rupture, release of apoptotic signaling molecules such as cytochrome c from the intermembrane space, and irreversible injury to the mitochondria. During ischemia, factors such as intracellular calcium accumulation, fatty acid accumulation, and reactive oxygen species progressively 14 increase mitochondrial susceptibility to mitochondrial permeability Introduction and aims of thesis transition, increasing the likelihood that mitochondrial permeability transition will occur on reperfusion. Since functional cardiac recovery ultimately depends on mitochondrial recovery, cardioprotection by ischemic and pharmacological preconditioning needs to involve the prevention of mitochondrial permeability transition. Experimental studies in animals suggest that it is possible to limit the amount of myocardial damage during ischemia and the early reperfusion periods. A variety of pharmacological approaches to prevention of injury (including vasodilators, adhesion molecule blockers, and receptor blockers of complement fractions) has been investigated. One of these potential additional treatments is metabolic intervention. 28 dichloroacetate, L-carnitine Drugs such as ranolazine, trimetazidine, and glucose-insulin-potassium (GIK) infusion and glucagon- like peptide29 have mechanisms of action distinct from traditional anti-ischemic drugs.30 These agents work by shifting myocardial energy metabolism away from free fatty acids (FFA) toward glucose as a source of fuel. Since these agents are well tolerated and do not affect heart rate or blood pressure, they conceivably could supplement traditional antiischemic drug therapy with little risk. Glucose-insulin-potassium infusion in myocardial ischemia In the timespan of almost a century, a large amount of experimental evidence has been accumulated that underlines the importance of glucose metabolism during ischemia/reperfusion of the heart. As early as 1912, Goulston suggested that treatment with glucose could be beneficial in several heart diseases.31 The first experimental results on the mechanical effects of insulin and glucose in the isolated heart were made by Visscher and Muller in 1926.32 In 1935, Evans and colleagues showed that in the ischemic myocardium the uptake of glucose is increased.33 Almost 30 years later, Sodi-Pallares and colleagues suggested that metabolic interference during myocardial ischemia with GIK infusion decreased electrocardiographic signs of ischemia.34 They also showed that GIK infusion resulted in a lower occurrence of arrhythmias.34 They attributed this effect mainly to the influx of potassium in ischemic cardiomyocytes.35 In order to further stimulate potassium transport into the cell, insulin was administered.36 Consequently, the rise of intercellular calcium is curtailed by the influx of potassium and so the incidence of arrhythmias is reduced.37-40 However, systemic infusion of insulin stimulates the uptake of glucose in many celltypes41, which may result in hypoglycemic episodes.42 Consequently, it is not possible to administer potassium and insulin in high concentrations without adding glucose. Interventions in the glucose metabolism in the clinical arena, whether or not used to correct acute hyperglycemia, encompass three potentially effective elements: glucose, insulin and potassium. 15 Metabolic interventions in acute myocardial infarction Basic mechanism of GIK protection Ischemia induces many changes in the heart’s metabolism, including shifts from aerobic fatty acid metabolism to anaerobic glycolysis, which provides energy for critical myocardial cellular function (figure 1).43-45 Figure 1. The main changes that occur in peripheral and myocardial metabolism during the development of acute myocardial ischemia. [adapted from Oliver MF. Am J Med 2002;112:305-311] CoA = coenzyme A; FFA = free fatty acid; TG = triglyceride. During most clinical ischemic syndromes, including acute MI, residual or collateral blood flow usually provides at least 10% of the normal level of perfusion to a significant portion of the ischemic myocardium. This small amount of perfusion provides such a level of oxygen delivery that oxidative ATP synthesis from both glucose and free fatty acids greatly exceeds ATP synthesis from anaerobic glycolysis.46;47 Thus, a mixture of aerobic and anaerobic metabolism occurs. With progressively severe ischemia, anaerobic glycolysis becomes a progressively more important source of energy for a limited amount of ATP, which may or may not suffice to support the most essential cellular functions. Glycogen is rapidly mobilized during ischemia, and reduced glycogen concentrations impair force development, calcium release, and contractile function.48 Key intermediates of the Krebs cycle are also depleted, which may impair energy transfer.49 The ischemia-mediated increase in glucose utilization is characterized by enhanced rates of exogenous glucose uptake in vivo, which requires greater rates of transport across the 16 Introduction and aims of thesis plasma membrane.50;51 Of the seven reported members of the facilitative glucose transporter family, GLUT-4 and GLUT-1 are the primary forms expressed in adult mammalian heart muscle.52 During low-flow ischemia the expression of GLUT-4 is doubled.53 Insulin increases the translocation of GLUT-4 via a pathway mediated by phosphatidylinositol 3-kinase (PI3-K). During ischemia and hypoxia GLUT-4 translocation is stimulated through a PI3-K-independent pathway. AMP-activated protein kinase plays a role in the translocation during ischemia.54 Table 2. Mechanisms of GIK infusion during myocardial ischemia62-64 • The yield of moles of ATP per mole of oxygen consumed is 11 percent higher for • Anti FFA effects glucose than for FFA oxidation o Decrease of circulating FFA levels and myocardial FFA uptake o Increased esterification of intracellular FFA by increasing the supply of alpha-glycerophosphate • Increased rate of ATP synthesis via anaerobic glycolysis with consequent beneficial effects o Increased concentrations of phosphocreatine and ATP o Blunting of an increase in inorganic phosphate and ADP concentrations o Increased free energy yield from ATP hydrolysis • Increased myocardial glycogen • Improved sodium and calcium homeostasis • Increased tolerance to rises in intracellular calcium • Replenishment of citric acid cycle intermediates by anaplerosis • Increase of glucose and decrease of FFA oxidation during reperfusion • Activation of cell survival signalling pathways such as Akt Opie proposed the glucose hypothesis: the enhanced uptake and metabolism of glucose delays cellular damage.55;56 Glucose utilization during ischemia prevents the breakdown of glycogen stores and leads to increased net intramyocardial glycogen synthesis, thereby limiting enzymatic infarct size and contracture.47;57 Two studies showed that infusion of GIK in isolated hearts with regional ischemia resulted in decreased infarct size, increased high-energy phosphate levels, and improved ventricular function.58;59 Acute MI patients treated with GIK also showed better stress tolerance and ischemic threshold improvement, analyzed with technetium-99m-tetrofosmin-gated SPECT.60 The improved energetic profile results in improved systolic and diastolic function during ischemia and reperfusion, as well as coronary vasodilatation.47 Also, glucose uptake has been shown to reduce hypoxia-induced apoptosis in cultured neonatal rat cardiac myocytes.61 The 17 Metabolic interventions in acute myocardial infarction observed benefits of GIK infusion have been attributed to a number of mechanisms, which are summarized in table 2 and in part discussed. Glucose The potential positive effects of glucose are based on the fact that glucose is a source of energy for cells.65 The uptake of glucose into the cell is influenced by insulin, although there is also an insulin-independent transport of glucose.66 It has been observed that AMP-activated protein kinase is responsible for activation of glucose uptake and glycolysis during low-flow ischemia.67 During MI, low-flow perfusion of the ischemic area is often present, making the administration glucose useful.48 In an experimental study it was observed that a high glucose concentration stimulated translocation of GLUT-4.68 It was already know that the combination of glucose and insulin is more effective than either one alone in stimulating glycolysis under ischemic conditions.47 Administering glucose can prevent insulin-induced hypoglycemia. When the hypoglycemic episodes persist or when they are severe (<2.7 mmol/L), convulsions, brain damage and even brain death may occur.69 Hypoglycemia is also related to myocardial ischemia.70 It has been shown that the prevention of hypoglycemia can prevent an increase in enzymatic infarct size.71 When hypoglycemia occurs, the contraregulating hormones are activated and result in an increased release of glucose.72 Increased glucose release requires, in particular, an increase in glucagon and adrenaline. During MI the levels of glucagon, adrenaline and aldosteron among others are already elevated. Insulin The potential positive effects of insulin during stress situations are multifarious.73;74 First, insulin is involved in the uptake of glucose in tissues, including the myocardium, mainly through GLUT-4 and partly through GLUT-1.75 However, the exact amount of uptake during ischemia is disputable.76 Besides the stimulation of glucose uptake and the stimulation of glycogen synthesis, insulin is also involved in gene transcription, expression of various metabolic enzymes, the activation of various pathways with mitogenic activity, and even fatty acid uptake. The insulin receptor substrate 1 has an important role in realizing this pleiotrope.77 Both insulin-like growth factor (IGF) 1 and insulin inhibit postischemic apoptosis, energetic failure and damage to cardiac tissue, in vitro and in animals, possibly through reduced oxidative stress.78;79 Insulin increases the bio-availability of IGF1 and suppresses hepatic synthesis of IGF1-binding protein, which binds and limits free-circulating IGF1.80;81 Insulin stimulates protein synthesis in skeletal muscles and inhibits intracellular protein breakdown in cardiac tissue.82-84 The preservation of myocardial cells by inhibiting apoptosis and reduced destruction of proteins could be the reason that contractibility is 18 Introduction and aims of thesis preserved.85 An additional factor is that insulin potentiates ischemic preconditioning; however, this has not been proven irrefutably in clinical trials.86;87 Insulin has an anti-inflammatory effect that is caused by a reduction in oxidative stress.88 First, insulin reduces the pro-inflammatory effects of hyperglycemia. Insulin suppresses the production of tumor necrosis factor α in macrophages, leucocytes and endothelium.89 Furthermore, insulin blocks the upregulation of the endothelial cell adhesion molecule induced by hyperglycemia.90;91 Also, insulin inhibits macrophage-inhibitory factor, and potentiates endothelial nitric oxide synthase and endothelin release.92 In a clinical study it appeared that the oxidative stress that occurs in myocardial ischemia and during reperfusion by primary PCI could not be suppressed by insulin.93 Insulin is shown to influence the adhesion of leucocytes and blood platelets during an acute MI.94 A study with 48 patients with type 2 diabetes mellitus showed that intensive treatment with insulin during an acute ischemic event (i.e., acute MI or unstable angina pectoris) improves the fibrinolytic profile.95 The administration of insulin with the aid of an algorithm led to lower mean blood-glucose values (6.9 mmol/L versus 11.4 mmol/L) and to lower concentrations of tissue plasminogen activator, plasminogen activator inhibitor-1 and fibrinogen. Insulin has vasodilating capacities in blood vessels of muscle tissue.96;97 Vasodilatation during myocardial ischemia has been observed both in patients with and without diabetes mellitus.97-99 This is advantageous, since it opens up the blood vessels in the myocardium, enabling more glucose to reach the cells and preventing the accumulation of metabolites that are toxic and cause mitochondrial damage and alterations in membrane ion channels.98;100 Vasodilatation occurs, among others, by stimulating the production of nitric oxide in the endothelium and by antagonizing endothelin, a potent vasoconstrictor.101;102 Even a small increase in myocardial blood flow can significantly reduce myocardial ischemia.103 Conversely, administering insulin can potentially lead to an adverse reaction.104 It might lead to enhanced polarisability of the cell membrane, stimulation of the sympathetic nervous system, and inhibition of the parasympathic nervous system. In contrast to the above-mentioned results, it was also found that insulin induced oxidative stress.105 The effect of insulin on nuclear factor-κB (NF-κB) remains unclear.88;106 In an experimental setting insulin in high amounts has inhibitory effects on intermediates involved in the activation by platelet-derived growth factor.107 Potassium It appears that hypokaliemia during stress situations is disadvantageous.108;109 Hypokaliemia frequently occurs in trauma patients and has been associated with a worse score on the Glasgow Coma Score (GCS).110 Moreover, hypokaliemia has been associated 19 Metabolic interventions in acute myocardial infarction with muscle necrosis and paralysis. In patients with myocardial ischemia, hypokaliemia increases the risk of ventricular arrhythmias and acute cardiac arrest.111 Restoring the potassium concentration in the cell and in serum may be accompanied by a decrease in the incidence and severity of arrhythmias.112 However, when the effect of GIK infusion on QT-time was analyzed, no effect was found.113 Consequently, administration of potassium in stress situations is mandatory to patients who present with hypokaliemia as well as to patients treated with insulin in order to prevent hypokaliemia. Moreover, hypokaliemia appears to suppress the secretion of insulin, and in this way stimulates a (continued) state of hyperglycemia.114 This thesis This thesis is a new branch on the large tree of studies on optimal therapeutic strategy for and understanding of ST segment elevation MI. In 1989, the Zwolle Myocardial Infarction Study Group performed its first study of comparing PCI with streptokinase. Thereafter studies on the effect of primary PCI, stenting, intra-aortic balloon counterpulsation, prehospital treatment with heparin and glycoprotein IIb/IIIa receptor blockers have been reported. Over the last years more research has been done to investigate the causative mechanisms behind favorable and unfavorable outcome after treatment with primary PCI. Currently, special emphasis is given to the effect of glucose derangements and patients with diabetes mellitus. The concept to add a metabolic intervention to the treatment strategy of primary PCI was formulated in 1997. The purpose of this thesis is to investigate the effect of metabolic interventions and disturbances on the clinical outcome and myocardial function in ST segment elevation MI patients. Therefore, we have investigated whether GIK infusion in adjunction to primary PCI reduces 30-day (Chapter 2.1) and 3-year mortality (Chapter 2.6) in ST segment elevation MI patients. We also investigated the effects of GIK infusion on myocardial infarct size (Chapter 2.2), left ventricular function (Chapters 2.2 and 2.3) and ST segment elevation resolution (Chapter 2.4). Furthermore, we investigated the metabolic derangements induced by GIK infusion, and the impact of metabolic derangements on clinical outcome (Chapter 2.5). With the results of the GIPS we performed a new analysis on all available results of GIK infusion on 30-day mortality (Chapter 3). In the second part of this thesis we report our studies on the relation between hyperglycemia and outcome. Based on a large body of evidence it is known that hyperglycemia at admission is related to mortality. We were able to analyze the effect of admission hyperglycemia on myocardial function (Chapter 4.1). The predictive value of 20 Introduction and aims of thesis admission glucose is not strong and we hypothesized that persistent hyperglycemia in both critically ill patients admitted to a Coronary Care Unit (Chapter 5.1) and an Intensive Care Unit (Chapter 5.2 and 5.3) could be a better determinant for unfavorable outcome. Based on the results found in the above-mentioned studies, we wrote the protocol of the GIPS-2 a multi-center trial on the effect of GIK infusion in ST segment elevation MI patients without signs of heart-failure and eligible for reperfusion therapy (Chapter 6). Finally, this thesis purposes to give future directions for the implementation of metabolic interventions in critically ill patients (Chapter 7). References 1. DeWood MA, Spores J, Notske R et al. Prevalence of total coronary occlusion during the early hours of transmural myocardial infarction. N Engl J Med 1980;303:897-902. 2. Obrastzow WP, Straschesko ND. [Zur kenntnis der thrombose der koranarterien des herzens]. Z Klin Med 1912;71:116-32. 3. Herrick JB. Clinical features of sudden obstruction of the coronary arteries. J Am Med Assoc 1912;59:2015-20. 4. Van de Werf F, Ardissino D, Betriu A et al. Management of acute myocardial infarction in patients presenting with ST segment elevation. The Task Force on the Management of Acute Myocardial Infarction of the European Society of Cardiology. Eur Heart J 2003;24:2866. 5. Ryan TJ, Antman EM, Brooks NH et al. 1999 update: ACC/AHA Guidelines for the Management of Patients With Acute Myocardial Infarction: Executive Summary and Recommendations: A report of the American College of Cardiology/American Heart Association Task Force on Practice Guidelines (Committee on Management of Acute Myocardial Infarction). Circulation 1999;100:1016-30. 6. Lee KL, Woodlief LH, Topol EJ et al. Predictors of 30-day mortality in the era of reperfusion for acute myocardial infarction. Results from an international trial of 41,021 patients. GUSTO-I Investigators. Circulation 1995;91:1659-68. 7. Morrow DA, Antman EM, Charlesworth A et al. TIMI risk score for ST-elevation myocardial infarction: A convenient, bedside, clinical score for risk assessment at presentation: An intravenous nPA for treatment of infarcting myocardium early II trial substudy. Circulation 2000;102:2031-37. 8. Morrow DA, Antman EM, Giugliano RP et al. A simple risk index for rapid initial triage of patients with ST-elevation myocardial infarction: an InTIME II substudy. Lancet 2001;358:1571-75. 9. Krumholz HM, Chen J, Wang Y, Radford MJ, Chen YT, Marciniak TA. Comparing AMI mortality among hospitals in patients 65 years of age and older: evaluating methods of risk adjustment. Circulation 1999;99:2986-92. 10. Eagle KA, Lim MJ, Dabbous OH et al. A validated prediction model for all forms of acute coronary syndrome: estimating the risk of 6-month postdischarge death in an international registry. JAMA 2004;291:2727-33. 21 Metabolic interventions in acute myocardial infarction 11. de Boer MJ, Reiber JH, Suryapranata H, van den Brand MJ, Hoorntje JC, Zijlstra F. Angiographic findings and catheterization laboratory events in patients with primary coronary angioplasty or streptokinase therapy for acute myocardial infarction. Eur Heart J 1995;16:1347-55. 12. Effectiveness of intravenous thrombolytic treatment in acute myocardial infarction. Gruppo Italiano per lo Studio della Streptochinasi nell'Infarto Miocardico (GISSI) Lancet 1986;1:397402. 13. Randomised trial of intravenous streptokinase, oral aspirin, both, or neither among 17,187 cases of suspected acute myocardial infarction: ISIS-2. ISIS-2 (Second International Study of Infarct Survival) Collaborative Group Lancet 1988;2:349-60. 14. Indications for fibrinolytic therapy in suspected acute myocardial infarction: collaborative overview of early mortality and major morbidity results from all randomised trials of more than 1000 patients. Fibrinolytic Therapy Trialists' (FTT) Collaborative Group Lancet 1994;343:311-22. 15. Morrison LJ, Verbeek PR, McDonald AC, Sawadsky BV, Cook DJ. Mortality and prehospital 16. Dotter CT, Judkins MP. Transluminal treatment of arteriosclerotic obstruction. Description 17. Gruntzig A. Transluminal dilatation of coronary-artery stenosis. Lancet 1978;1:263. 18. Gruntzig AR, Senning A, Siegenthaler WE. Nonoperative dilatation of coronary-artery thrombolysis for acute myocardial infarction: A meta-analysis. JAMA 2000;283:2686-92. of a new technic and a preliminary report of its application. Circulation 1964;30:654-70. stenosis: percutaneous transluminal coronary angioplasty. N Engl J Med 1979;301:61-68. 19. Hartzler GO, Rutherford BD, McConahay DR et al. Percutaneous transluminal coronary angioplasty with and without thrombolytic therapy for treatment of acute myocardial infarction. Am Heart J 1983;106:965-73. 20. Sigwart U, Puel J, Mirkovitch V, Joffre F, Kappenberger L. Intravascular stents to prevent 21. Zijlstra F, de Boer MJ, Hoorntje JC, Reiffers S, Reiber JH, Suryapranata H. A comparison of occlusion and restenosis after transluminal angioplasty. N Engl J Med 1987;316:701-6. immediate coronary angioplasty with intravenous streptokinase in acute myocardial infarction. N Engl J Med 1993;328:680-684. 22. Grines CL, Browne KF, Marco J et al. A comparison of immediate angioplasty with thrombolytic therapy for acute myocardial infarction. The Primary Angioplasty in Myocardial Infarction Study Group. N Engl J Med 1993;328:673-79. 23. Gibbons RJ, Holmes DR, Reeder GS, Bailey KR, Hopfenspirger MR, Gersh BJ. Immediate angioplasty compared with the administration of a thrombolytic agent followed by conservative treatment for myocardial infarction. The Mayo Coronary Care Unit and Catheterization Laboratory Groups. N Engl J Med 1993;328:685-91. 24. Zijlstra F, Hoorntje JC, de Boer MJ et al. Long-term benefit of primary angioplasty as compared with thrombolytic therapy for acute myocardial infarction. N Engl J Med 1999;341:1413-19. 25. Keeley EC, Boura JA, Grines CL. Primary angioplasty versus intravenous thrombolytic therapy for acute myocardial infarction: a quantitative review of 23 randomised trials. Lancet 2003;361:13-20. 22 Introduction and aims of thesis 26. Lindsay J, Apple S, Pinnow EE et al. Percutaneous coronary intervention-associated nephropathy foreshadows increased risk of late adverse events in patients with normal baseline serum creatinine. Catheter Cardiovasc Interv 2003;59:338-43. 27. Rihal CS, Textor SC, Grill DE et al. Incidence and prognostic importance of acute renal 28. Wolff AA, Rotmensch HH, Stanley WC, Ferrari R. Metabolic approaches to the treatment of failure after percutaneous coronary intervention. Circulation 2002;105:2259-64. ischemic heart disease: the clinicians' perspective. Heart Fail Rev 2002;7:187-203. 29. Huisamen B, Genade S, Lochner A. Glucagon-like peptide-1 (GLP-1) protects the heart 30. Opie LH. The metabolic vicious cycle in heart failure. Lancet 2004;364:1733-34. 31. Goulston A. West Indian cane sugar in treatment of certain forms of heart diseases. British 32. Visscher MB, Muller EA. The influence of insulin upon the mammalian heart. J Physiol against ischaemia by activating glycoclysis. Cardiovasc J S Afr 2004;15:S15. Medical Journal 1912;2:693-95. 1926;62:341-48. 33. Evans CL, Grande F, Musu FJ. The glucose and lactate consumption of the dog's heart. 34. Sodi-Pallares D, Testelli MR, Fishleder BL et al. Effects of an intravenous infusion of a Quart J Exptl Physiol 1935;24:347-52. potassium-glucose-insulin solution on the electrocardiographic signs of myocardial infarction. A preliminary clinical report. Am J Cardiol 1962;9:166-81. 35. Sodi-Pallares D, Bisteni A, Medrano GA, Testelli MR, de Micheli A. The polarizing treatment of acute myocardial infarction. Possibility of its use in other cardiovascular conditions. Dis Chest 1963;43:424-32. 36. Zierler K, Rogus EM, Scherer RW, Wu FS. Insulin action on membrane potential and 37. Aulbach F, Simm A, Maier S et al. Insulin stimulates the L-type Ca2+ current in rat cardiac 38. Danielson KS, DeWeese JA, Mahoney EB. Evaluation of dextrose, insulin, and potassium glucose uptake: effects of high potassium. Am J Physiol 1985;249:E17-E25. myocytes. Cardiovasc Res 1999;42:113-20. on ventricular irritability in acute myocardial infarction. J Thorac Cardiovasc Surg 1970;60:653-60. 39. Harris AS, Toth LA, Tan EH. Arrhythmic and antiarrhythmic effects of sodium, potassium, and calcium salts and of glucose injected into coronary arteries of infarcted and normal hearts. Circ Res 1958;6:570-579. 40. Schonekess BO, Brindley PG, Lopaschuk GD. Calcium regulation of glycolysis, glucose oxidation, and fatty acid oxidation in the aerobic and ischemic heart. Can J Physiol Pharmacol 1995;73:1632-40. 41. Ferrannini E, Santoro D, Bonadonna R, Natali A, Parodi O, Camici PG. Metabolic and 42. Sands MJ, Jr., McDonough MT, Neubauer SJ, Lemole GM, Spann JF. Hypoglycemia hemodynamic effects of insulin on human hearts. Am J Physiol 1993;264:E308-E315. complicating the use of solution of glucose, insulin and potassium. Chest 1975;67:363-65. 43. Apstein CS. Increased glycolytic substrate protection improves ischemic cardiac 44. Opie LH. Metabolic response during impending myocardial infarction. I. Relevance of dysfunction and reduces injury. Am Heart J 2000;139:S107-S114. studies of glucose and fatty acid metabolism in animals. Circulation 1972;45:483-90. 23 Metabolic interventions in acute myocardial infarction 45. Whitmer JT, Idell-Wenger JA, Rovetto MJ, Neely JR. Control of fatty acid metabolism in 46. Cave AC, Ingwall JS, Friedrich J et al. ATP synthesis during low-flow ischemia: influence of 47. Eberli FR, Weinberg EO, Grice WN, Horowitz GL, Apstein CS. Protective effect of increased ischemic and hypoxic hearts. J Biol Chem 1978;253:4305-9. increased glycolytic substrate. Circulation 2000;101:2090-2096. glycolytic substrate against systolic and diastolic dysfunction and increased coronary resistance from prolonged global underperfusion and reperfusion in isolated rabbit hearts perfused with erythrocyte suspensions. Circ Res 1991;68:466-81. 48. Chin ER, Allen DG. Effects of reduced muscle glycogen concentration on force, Ca2+ release and contractile protein function in intact mouse skeletal muscle. J Physiol 1997;498 ( Pt 1):17-29. 49. Taegtmeyer H, Goodwin GW, Doenst T, Frazier OH. Substrate metabolism as a determinant 50. Schwaiger M, Neese RA, Araujo L et al. Sustained nonoxidative glucose utilization and 51. Guth BD, Wisneski JA, Neese RA et al. Myocardial lactate release during ischemia in swine. for postischemic functional recovery of the heart. Am J Cardiol 1997;80:3A-10A. depletion of glycogen in reperfused canine myocardium. J Am Coll Cardiol 1989;13:745-54. Relation to regional blood flow. Circulation 1990;81:1948-58. 52. Stephens JM, Pilch PF. The metabolic regulation and vesicular transport of GLUT4, the 53. Young LH, Renfu Y, Russell R et al. Low-flow ischemia leads to translocation of canine heart major insulin-responsive glucose transporter. Endocr Rev 1995;16:529-46. GLUT-4 and GLUT-1 glucose transporters to the sarcolemma in vivo. Circulation 1997;95:415-22. 54. Russell RR, III, Bergeron R, Shulman GI, Young LH. Translocation of myocardial GLUT-4 and increased glucose uptake through activation of AMPK by AICAR. Am J Physiol 1999;277:H643-H649. 55. Opie LH. Hypothesis: Glycolytic rates control cell viability in ischemia. J Appl Cardiol 56. Opie LH. The glucose hypothesis: its relation to acute myocardial ischemia. J Mol Cell 57. Owen P, Dennis S, Opie LH. Glucose flux rate regulates onset of ischemic contracture in 58. Heng MK, Norris RM, Singh BN, Barratt-Boyes C. Effects of glucose and glucose-insulin- 1988;3:407-14. Cardiol 1970;1:107-15. globally underperfused rat hearts. Circ Res 1990;66:344-54. potassium on haemodynamics and enzyme release after acute myocardial infarction. Br Heart J 1977;39:748-57. 59. Maroko PR, Libby P, Sobel BE et al. Effect of glucose-insulin-potassium infusion on myocardial infarction following experimental coronary artery occlusion. Circulation 1972;45:1160-1175. 60. Marano L, Bestetti A, Lomuscio A et al. Effects of infusion of glucose-insulin-potassium on myocardial function after a recent myocardial infarction. Acta Cardiol 2000;55:9-15. 61. Malhotra R, Brosius FC, III. Glucose uptake and glycolysis reduce hypoxia-induced apoptosis in cultured neonatal rat cardiac myocytes. J Biol Chem 1999;274:12567-75. 62. Apstein CS, Gravino FN, Haudenschild CC. Determinants of a protective effect of glucose and insulin on the ischemic myocardium. Effects on contractile function, diastolic 24 Introduction and aims of thesis compliance, metabolism, and ultrastructure during ischemia and reperfusion. Circ Res 1983;52:515-26. 63. Apstein CS, Taegtmeyer H. Glucose-insulin-potassium in acute myocardial infarction: the 64. Apstein CS. The benefits of glucose-insulin-potassium for acute myocardial infarction (and 65. Gerich JE. Control of glycaemia. Baillieres Clin Endocrinol Metab 1993;7:551-86. 66. Mizock BA. Alterations in fuel metabolism in critical illness: hyperglycaemia. Best Pract Res 67. Russell RR, III, Li J, Coven DL et al. AMP-activated protein kinase mediates ischemic time has come for a large, prospective trial. Circulation 1997;96:1074-77. some concerns). J Am Coll Cardiol 2003;42:792-95. Clin Endocrinol Metab 2001;15:533-51. glucose uptake and prevents postischemic cardiac dysfunction, apoptosis, and injury. J Clin Invest 2004;114:495-503. 68. Ramasamy R, Payne JA, Whang J, Bergmann SR, Schaefer S. Protection of ischemic myocardium in diabetics by inhibition of electroneutral Na+-K+-2Cl- cotransporter. Am J Physiol Heart Circ Physiol 2001;281:H515-H522. 69. Mitrakou A, Ryan C, Veneman T et al. Hierarchy of glycemic thresholds for counterregulatory hormone secretion, symptoms, and cerebral dysfunction. Am J Physiol 1991;260:E67-E74. 70. Desouza CV, Murthy SN, Diez J et al. Differential effects of peroxisome proliferator activator receptor-alpha and gamma ligands on intimal hyperplasia after balloon catheter-induced vascular injury in Zucker rats. J Cardiovasc Pharmacol Ther 2003;8:297-305. 71. Libby P, Maroko PR, Braunwald E. The effect of hypoglycemia on myocardial ischemic 72. Rizza RA, Cryer PE, Gerich JE. Role of glucagon, catecholamines, and growth hormone in injury during acute experimental coronary artery occlusion. Circulation 1975;51:621-26. human glucose counterregulation. Effects of somatostatin and combined alpha- and betaadrenergic blockade on plasma glucose recovery and glucose flux rates after insulininduced hypoglycemia. J Clin Invest 1979;64:62-71. 73. Das UN. Insulin: an endogenous cardioprotector. Curr Opin Crit Care 2003;9:375-83. 74. Groeneveld AB, Beishuizen A, Visser FC. Insulin: a wonder drug in the critically ill? Crit Care 75. McNulty PH, Jacob R, Deckelbaum LI, Young LH. Effect of hyperinsulinemia on myocardial 2002;6:102-5. amino acid uptake in patients with coronary artery disease. Metabolism 2000;49:1365-69. 76. Liedtke AJ, Hughes HC, Neely JR. Effects of excess glucose and insulin on glycolytic 77. Sun XJ, Wang LM, Zhang Y et al. Role of IRS-2 in insulin and cytokine signalling. Nature 78. Aikawa R, Nawano M, Gu Y et al. Insulin prevents cardiomyocytes from oxidative stress- 79. Jonassen AK, Brar BK, Mjos OD, Sack MN, Latchman DS, Yellon DM. Insulin administered metabolism during experimental myocardial ischemia. Am J Cardiol 1976;38:17-27. 1995;377:173-77. induced apoptosis through activation of PI3 kinase/Akt. Circulation 2000;102:2873-79. at reoxygenation exerts a cardioprotective effect in myocytes by a possible anti-apoptotic mechanism. J Mol Cell Cardiol 2000;32:757-64. 25 Metabolic interventions in acute myocardial infarction 80. Nygren J, Carlsson-Skwirut C, Brismar K, Thorell A, Ljungqvist O, Bang P. Insulin infusion increases levels of free IGF-I and IGFBP-3 proteolytic activity in patients after surgery. Am J Physiol Endocrinol Metab 2001;281:E736-E741. 81. Timmins AC, Cotterill AM, Hughes SC et al. Critical illness is associated with low circulating concentrations of insulin-like growth factors-I and -II, alterations in insulin-like growth factor binding proteins, and induction of an insulin-like growth factor binding protein 3 protease. Crit Care Med 1996;24:1460-1466. 82. Madibally SV, Solomon V, Mitchell RN, Van De WL, Yarmush ML, Toner M. Influence of insulin therapy on burn wound healing in rats. J Surg Res 2003;109:92-100. 83. Solomon V, Madihally S, Mitchell RN, Yarmush M, Toner M. Antiproteolytic action of insulin 84. Young LH, Dahl DM, Rauner D, Barrett EJ. Physiological hyperinsulinemia inhibits 85. Whitlow PL, Rogers WJ, Smith LR et al. Enhancement of left ventricular function by in burn-injured rats. J Surg Res 2002;105:234-42. myocardial protein degradation in vivo in the canine heart. Circ Res 1992;71:393-400. glucose-insulin-potassium infusion in acute myocardial infarction. Am J Cardiol 1982;49:811-20. 86. Kersten JR, Schmeling TJ, Orth KG, Pagel PS, Warltier DC. Acute hyperglycemia abolishes 87. Kersten JR, Montgomery MW, Ghassemi T et al. Diabetes and hyperglycemia impair ischemic preconditioning in vivo. Am J Physiol 1998;275:H721-H725. activation of mitochondrial K(ATP) channels. Am J Physiol Heart Circ Physiol 2001;280:H1744-H1750. 88. Dandona P, Aljada A, Mohanty P et al. Insulin inhibits intranuclear nuclear factor kappaB and stimulates IkappaB in mononuclear cells in obese subjects: evidence for an antiinflammatory effect? J Clin Endocrinol Metab 2001;86:3257-65. 89. Rosenzweig T, Braiman L, Bak A, Alt A, Kuroki T, Sampson SR. Differential effects of tumor necrosis factor-alpha on protein kinase C isoforms alpha and delta mediate inhibition of insulin receptor signaling. Diabetes 2002;51:1921-30. 90. Booth G, Stalker TJ, Lefer AM, Scalia R. Elevated ambient glucose induces acute inflammatory events in the microvasculature: effects of insulin. Am J Physiol Endocrinol Metab 2001;280:E848-E856. 91. Booth G, Stalker TJ, Lefer AM, Scalia R. Mechanisms of amelioration of glucose-induced endothelial dysfunction following inhibition of protein kinase C in vivo. Diabetes 2002;51:1556-64. 92. Kuboki K, Jiang ZY, Takahara N et al. Regulation of endothelial constitutive nitric oxide synthase gene expression in endothelial cells and in vivo : a specific vascular action of insulin. Circulation 2000;101:676-81. 93. Diaz-Araya G, Nettle D, Castro P et al. Oxidative stress after reperfusion with primary coronary angioplasty: lack of effect of glucose-insulin-potassium infusion. Crit Care Med 2002;30:417-21. 94. Bertuglia S, Giusti A, Fedele S, Picano E. Glucose-insulin-potassium treatment in combination with dipyridamole Diabetologia 2001;44:2165-70. 26 inhibits ischaemia-reperfusion-induced damage. Introduction and aims of thesis 95. Melidonis A, Stefanidis A, Tournis S et al. The role of strict metabolic control by insulin infusion on fibrinolytic profile during an acute coronary event in diabetic patients. Clin Cardiol 2000;23:160-164. 96. Legtenberg RJ, Houston RJ, Oeseburg B, Smits P. Physiological insulin concentrations protect against ischemia-induced loss of cardiac function in rats. Comp Biochem Physiol A Mol Integr Physiol 2002;132:161-67. 97. McNulty PH, Pfau S, Deckelbaum LI. Effect of plasma insulin level on myocardial blood flow 98. Rogers WJ, Russell RO, Jr., McDaniel HG, Rackley CE. Acute effects of glucose-insulin- and its mechanism of action. Am J Cardiol 2000;85:161-65. potassium infusion on myocardial substrates, coronary blood flow and oxygen consumption in man. Am J Cardiol 1977;40:421-28. 99. 100. Sundell J, Knuuti J. Insulin and myocardial blood flow. Cardiovasc Res 2003;57:312-19. Nava P, Carbo R, Guarner V. Coronary and femoral arterial contraction with high glucose, insulin, and glucose-insulin-potassium solution: effects of hypoxia. Heart Vessels 2002;16:57-63. 101. Nava P, Collados MT, Masso F, Guarner V. Endothelin mediation of insulin and glucoseinduced changes in vascular contractility. Hypertension 1997;30:825-29. 102. Verma S, Yao L, Stewart DJ, Dumont AS, Anderson TJ, McNeill JH. Endothelin antagonism uncovers insulin-mediated vasorelaxation in vitro and in vivo. Hypertension 2001;37:32833. 103. Apstein CS, Deckelbaum L, Mueller M, Hagopian L, Hood WB, Jr. Graded global ischemia and reperfusion. Cardiac function and lactate metabolism. Circulation 1977;55:864-72. 104. Quinones-Galvan A, Ferrannini E. Metabolic effects of glucose-insulin infusions: myocardium and whole body. Curr Opin Clin Nutr Metab Care 2001;4:157-63. 105. Kashiwagi A, Shinozaki K, Nishio Y et al. Endothelium-specific activation of NAD(P)H 106. Golovchenko I, Goalstone ML, Watson P, Brownlee M, Draznin B. Hyperinsulinemia oxidase in aortas of exogenously hyperinsulinemic rats. Am J Physiol 1999;277:E976-E983. enhances transcriptional activity of nuclear factor-kappaB induced by angiotensin II, hyperglycemia, and advanced glycosylation end products in vascular smooth muscle cells. Circ Res 2000;87:746-52. 107. Goalstone ML, Natarajan R, Standley PR et al. Insulin potentiates platelet-derived growth factor action in vascular smooth muscle cells. Endocrinology 1998;139:4067-72. 108. He FJ, MacGregor GA. Fortnightly review: Beneficial effects of potassium. BMJ 2001;323:497-501. 109. Gennari FJ. Disorders of potassium homeostasis. Hypokalemia and hyperkalemia. Crit Care 110. Beal AL, Scheltema KE, Beilman GJ, Deuser WE. Hypokalemia following trauma. Shock Clin 2002;18:273-88, vi. 2002;18:107-10. 111. Schulman M, Narins RG. Hypokalemia and cardiovascular disease. Am J Cardiol 112. Schwartz AB. Potassium-related cardiac arrhythmias and their treatment. Angiology 1990;65:4E-9E. 1978;29:194-205. 27 Metabolic interventions in acute myocardial infarction 113. Wolk R, Lusawa T, Ceremuzynski L. Effects of glucose-insulin-potassium infusion on QT dispersion in patients with acute myocardial infarction. Ann Noninvasive Electrocardiol 2001;6:50-54. 114. Rowe JW, Tobin JD, Rosa RM, Andres R. Effect of experimental potassium deficiency on glucose and insulin metabolism. Metabolism 1980;29:498-502. 28 GIK and 30-day outcome Chapter 2.1 Glucose-insulin-potassium infusion in patients treated with primary angioplasty for acute myocardial infarction (GIPS): a randomized trial Iwan CC van der Horst, Felix Zijlstra, Arnoud WJ van ‘t Hof, Carine JM Doggen, MenkoJan de Boer, Harry Suryapranata, Jan CA Hoorntje, Jan-Henk E Dambrink, Rijk OB Gans, Henk JG Bilo, on behalf of the Zwolle Myocardial Infarction Study Group Journal of the American College of Cardiology 2003;42:784-91 29 Metabolic interventions in acute myocardial infarction Abstract Background A combined treatment of early and sustained reperfusion of the infarct-related coronary artery and the metabolic modulation with GIK infusion has been proposed to protect the ischemic myocardium. Methods From April 1998 to September 2001, 940 patients with an acute MI and eligible for PCI were randomly assigned, by open-label, to either a continuous GIK infusion for 8-12 hours or no infusion. Results 30-day mortality was 23 of 476 patients (4.8%) receiving GIK compared to 27 of 464 patients (5.8%) in the control group, relative risk 0.82 (95% CI 0.46–1.46). In 856 patients (91.1%) without signs of heart failure (Killip class 1), 30-day mortality was 5 of 426 patients (1.2%) in the GIK group versus 18 of 430 patients (4.2%) in the control group, relative risk 0.28 (0.1–0.75). In 84 patients (8.9%) with signs of heart failure (Killip class ≥2), 30-day mortality was 18 of 50 patients (36%) in the GIK group versus 9 of 34 patients (26.5%) in the control group, relative risk 1.44 (0.65–3.22). Conclusion GIK infusion as adjunctive therapy to PCI in acute MI did not result in a significant mortality reduction in all patients. In the subgroup of 856 patients without signs of heart failure a significant reduction was seen. The effect of GIK infusion in patients with signs of heart failure (Killip class ≥2) at admission is uncertain. 30 GIK and 30-day outcome Introduction Since the early sixties, glucose-insulin-potassium (GIK) infusion has been advocated as therapy in the early hours following acute myocardial infarction (MI).1 A meta-analysis involving nine of these early studies with 1932 patients described that GIK might play an important role in reducing in-hospital mortality after acute MI.2 In four studies in which a high-dose was used a non-significant reduction in mortality from 12% in the control group to 6.5% in the GIK group was observed.3-6 High-dose GIK denotes an infusion of 30 g of glucose, 50 units of insulin, and 80 mmol potassium per liter at a rate of 1.5 mL/kg/hour.7 This dose of GIK suppresses arterial free fatty acid levels and myocardial free fatty acid uptake, and induces a maximal increase in myocardial glucose uptake. Therefore the main effect of the GIK infusion is considered to be the beneficial effect of administration of glucose to the ischemic myocardium.8-10 At present, primary coronary intervention (PCI) is regarded to be the most effective reperfusion treatment of acute MI.11-13 The complementary role of GIK to reperfusion therapy has been proposed.14;15 Therefore, we performed a randomized trial to investigate the value of GIK when combined with PCI for acute MI. Methods Patients All consecutive patients with symptoms consistent with acute MI of >30 minutes duration, presenting within 24 hour after the onset of symptoms and with a ST segment elevation of more than 1 mm (0.1 mV) in two or more contiguous leads on the electrocardiogram, or new onset left bundle branch block, were evaluated for inclusion in this single center study. Both patients presented at our center and patients referred for treatment of highrisk MI, from nine referring hospitals without facilities to perform coronary interventions, were included. Patients were excluded when pre-treated with thrombolysis or when an illness associated with a marked restricted life expectancy was present. Before randomization baseline characteristics were recorded. The research protocol was reviewed and approved by the medical ethics committee at our hospital, and patients were included after informed consent. Protocol After admission patients were randomly assigned, with the use of a computerized randomization program, to either GIK infusion or no infusion. In the GIK group, a continuous infusion of 80 mmol potassium chloride in 500 mL 20% glucose with a rate of 31 Metabolic interventions in acute myocardial infarction 3 mL/kg/hour over an 8-12 hour period in a peripheral venous line was given, as soon as possible. A continuous infusion of short-acting insulin (50 units Actrapid HM [Novo Nordisk, Copenhagen, Denmark] in 50 mL 0.9% sodium chloride was started with the use of a pump (Perfusor-FM, B. Braun, Melsungen, Germany). Baseline insulin-infusion dose and adjustments of the insulin dose, to obtain blood-glucose levels between 7.0 and 11.0 mmol/L, were based on a modified algorithm.16 Glucose levels were based on measurements of whole-blood glucose (Modular System, Roche/Hitachi, Basel, Switzerland). The infusion was continued for 8 to 12 hour period in order to administer at least 1.5 liter and not over 2 liters. The infusion was stopped earlier only if the clinical situation deteriorated due to volume overload. After the infusion was started, all patients went to the catheterization laboratory where both coronary arteries were visualized. PCI was performed with standard techniques if the coronary anatomy was suitable for PCI. Successful reperfusion was defined by TIMI grade 3 blood flow in combination with myocardial blush grades 2 and 3.17;18 Additional standard treatment consisted of nitroglycerin intravenously, and aspirin 500 mg intravenously or 300 mg orally. During PCI 10000 IU heparin was administered as bolus. Low molecular weight heparin was given for 24 hours thereafter. Standard therapies after PCI included aspirin 80 mg, clopidogrel 75 mg, beta-blockers, lipid lowering agents and angiotensin converting enzyme inhibitors or angiotensin II receptor blockers since they are likely to be protective in most patients, were used according to the current international guidelines.19;20 Statistical analysis The primary endpoint of the study was 30-day mortality. Secondary endpoints were recurrent infarction, repeat PCI and the composite incidence of death, recurrent infarction, or repeat PCI. The incidence of death was evaluated in predefined subgroups including age <60 year versus ≥60 year, men versus women, anterior MI versus non-anterior MI, diabetics versus non-diabetics, and Killip class 1 versus Killip class ≥2, successful reperfusion versus no successful reperfusion. Analyses were performed according to the intention-to-treat principle. Relative risks were calculated by dividing the cumulative incidence rate in the GIK group by the cumulative incidence rate in the control group. Differences between group means at baseline were assessed with the two-tailed Student’s 32 GIK and 30-day outcome Table 1. Baseline clinical and demographic characteristics and initial therapies Characteristics Number of patients GIK group Control group 476 464 Age, years (mean±SD) 59.9±11.9 60.8±12.0 Men 351 (73.7) 368 (79.3) Referred patients 201 (42.3) 180 (38.8) Body mass index (mean±SD) 26.7±3.8 27.0±4.0 Previous MI 52 (10.9) 53 (11.4) Previous PCI 22 (4.7) 24 (5.2) Previous CABG 14 (2.9) 12 (2.6) History of stroke 17 (3.6) 15 (3.2) Diabetes mellitus 50 (10.5) 49 (10.6) Hypertension 134 (28.2) 130 (28.0) Dyslipidemia 94 (19.7) 95 (20.5) Currently smoker 225 (47.3) 237 (51.1) Positive family history 195 (41.0) 179 (38.6) Time to admission, min (IQR)* 150 (100-215) 150 (105-234) Door to balloon time, min (IQR) 45 (31-64) 48 (34-69) Killip class 1 426 (89.5) 430 (92.7) Killip class 2 24 (5.0) 14 (3.0) Killip class 3 14 (2.9) 14 (3.0) Killip class 4 12 (2.5) 6 (1.3) Anterior MI 250 (52.9) 224 (49.1) Multi-vessel disease 249 (52.3) 242 (52.2) PCI 436 (91.6) 424 (91.4) Stent** 255 (58.5) 236 (55.7) GP IIb/IIIa receptor blocker** 96 (22.1) 109 (25.7) In-hospital CABG 19 (4.0) 19 (4.1) TIMI 3 flow after PCI 459 (96.4) 435 (93.8) Successful reperfusion‡ 394 (82.8) 384 (82.8) Intra-aortic balloon pump 45 (9.5) 42 (9.1) Mechanical ventilation 12 (2.5) 4 (0.9) Data are number (%) unless otherwise indicated. MI = myocardial infarction. IQR = interquartile range. PCI = percutaneous coronary intervention. CABG = coronary artery bypass grafting. * Time to admission denotes time between onset of symptoms and until admission. † In-hospital CABG = CABG defined as patients treated initially conservative, followed by elective CABG within 7 days. ‡ Successful reperfusion denotes TIMI 3 flow and blush grade 2 or 3. ** Percentage defined as the percentage of the patients that underwent PCI. 33 Metabolic interventions in acute myocardial infarction t-test. Chi-square analysis or Fisher’s exact test was used to test differences between proportions. Survival was calculated by the Kaplan-Meier product-limit method. The Logrank test was used to evaluate differences in survival curves between the two treatment groups. The Cox proportional-hazards regression model was used to calculate relative risks adjusted for differences in baseline characteristics. Statistical significance was considered a two-tailed P-value <0.05. The Statistical Package for the Social Sciences (SPSS Inc., Chicago, IL, USA) version 10.1 was used for all statistical analysis. Figure1. Kaplan-Meier curve of the overall population 100 Survival (%) 90 80 GIK Control 70 60 0 0 5 10 15 20 25 30 Time after randomization (days) Power analysis We postulated that infusion with GIK would induce a risk reduction of 66 percent.14 With an estimated absolute mortality rate of 6% in the control group, a power of 0.80 and an α of 0.05, 820 patients needed to be included in the study. In order to have 820 patients in each major predefined subgroup (patients in Killip class 1, patients without diabetes mellitus, and patients with successful reperfusion), we planned to enrol 940 patients. Interim analysis with regard to safety was planned and performed after inclusion of 240 patients, and the study was continued according to protocol. Enrolment of patients started in April 1998 and ended September 2001. 34 GIK and 30-day outcome Results Study population Of the 940 patients enrolled, 476 patients were randomly assigned to the GIK group and 464 patients to the control group. Table 1 shows clinical and demographic characteristics of the groups. With the exception of gender there were no statistical significant differences between both groups. GIK infusion was started 15 to 20 minutes after admission. Average door to balloon time was 45 minutes in the GIK group and 48 minutes in the control group. After coronary angiography, 860 patients (90.5%) underwent PCI, 38 patients (4.0%) were referred for CABG within 7 days after initial stabilization, and 42 patients (4.5%) were treated conservatively. There were no major differences in bloodglucose levels between the GIK group and the control group at admission (median bloodglucose level 8.5 mmol/L in both groups) and 16 hours after admission. Figure 2. Kaplan-Meier curve of Killip class 1 and Killip class ≥2 patients 100 Survival (%) 90 80 70 60 0 0 10 20 30 Time after randomization (days) GIK - Killip 1 GIK - Killip ≥2 Control - Killip 1 Control - Killip ≥2 30-day mortality Fifty of 940 patients (5.3%) had died at 30 days. Twenty-three of 476 patients (4.8%) in the GIK group versus 27 of 476 patients (5.8%) in the control group, relative risk 0.82 (95% 35 Metabolic interventions in acute myocardial infarction confidence interval 0.46–1.46) (table 2, figure 1). Causes of death are represented in table 5. In 856 of the 940 patients (91.1%) without signs of heart failure (Killip class 1), the mortality rate was 5 of 426 patients (1.2%) in the GIK group versus 18 of 430 patients (4.2%) in the control group, relative risk 0.28 (0.1–0.75) (table 2, table 4, figure 2). In this subgroup of patients a higher number of patients died of heart failure in the control group (0.7% in the GIK group versus 2.8% in the control group) (table 5). In the 84 patients (8.9%) with signs of heart failure (Killip class ≥2), mortality rate was 18 of 50 patients (36%) in the GIK group versus 9 of 34 patients (26.5%) in the control group, relative risk 1.44 (0.65–3.22). In this subgroup of patients 34.0% in the GIK group versus 20.6% in the control group died of heart failure (table 5, figure 2). Table 2. Effect of GIK on 30-day mortality in the overall population and in subgroups Characteristic GIK group Control group RR (95% CI) P-value mortality (%) mortality (%) All patients 23/476 (4.8) 27/464 (5.8) 0.82 (0.46–1.46) 0.50 <60 year 7/235 (3.0) 6/204 (2.9) 1.01 (0.34–3.07) 0.98 ≥60 year 16/241 (6.6) 21/260 (8.1) 0.81 (0.41–1.59) 0.54 Men 9/351 (2.6) 16/368 (4.3) 0.58 (0.25–1.33) 0.19 14/125 (11.2) 11/96 (11.5) 0.98 (0.42–2.26) 0.95 Women Time ≤180 min 9/304 (3.0) 13/288 (4.5) 0.65 (0.27–1.53) 0.32 Time >180 min 14/172 (8.1) 14/176 (8.0) 1.03 (0.47–2.20) 0.94 2/50 (4.0) 6/49 (12.2) 0.30 (0.06–1.56) 0.16 No diabetes mellitus 21/426 (4.9) 21/415 (5.1) 0.97 (0.52–1.81) 1.00 Killip class 1 5/426 (1.2) 18/430 (4.2) 0.27 (0.10–0.74) 0.01 Killip class 2 3/24 (12.5) 2/14 (14.3) 0.86 (0.13–5.87) 0.88 Killip class 3 7/14 (50.0) 4/14 (28.6) 2.50 (0.53–11.93) 0.25 Killip class 4 8/12 (66.7) 3/6 (50.0) 2.00 (0.27–14.78) 0.49 Anterior MI 18/250 (7.2) 19/224 (8.5) 0.84 (0.43–1.64) 0.60 Diabetes mellitus Non-anterior MI 5/226 (2.2) 8/240 (3.3) 0.66 (0.21–2.04) 0.46 Multi-vessel disease 19/249 (7.6) 24/242 (9.9) 0.75 (0.40–1.41) 0.37 Single-vessel disease 4/227 (1.8) 3/222 (1.4) 1.31 (0.29–5.91) 0.73 TIMI 3 flow after PCI 17/459 (3.7) 20/435 (4.6) 0.80 (0.41–1.55) 0.51 No TIMI 3 flow after PCI 6/17 (35.3) 7/29 (24.1) 1.71 (0.46–6.35) 0.51 Successful* 9/394 (2.3) 16/384 (4.2) 0.54 (0.24–1.23) 0.14 No successful 14/82 (17.1) 11/80 (13.8) 1.29 (0.55–3.05) 0.56 Relative risks were determined by dividing the cumulative incidence rates in the GIK group and the control group. RR = relative risk; CI = confidence interval; MI = myocardial infarction; TIMI = Thrombolysis in Myocardial Infarction. * Successful reperfusion denotes TIMI 3 flow and blush grade 2 or 3. 36 GIK and 30-day outcome In 99 patients (10.5%) with a history of diabetes mellitus, 2 of the 50 patients (4.0%) in the GIK group died versus 6 of 49 patients (12.2%) in the control group, relative risk 0.30 (0.06–1.56). Mortality rates in the other predefined subgroups are shown in table 2. Figure 3 shows relative risks and 95% confidence intervals in each subgroup. Recurrent infarction occurred in 11 patients: 4 patients (0.8%) in the GIK group and 7 patients (1.5%) in the control group, relative risk 0.55 (0.16–1.90) (table 4). The composite endpoint was comparable in the GIK group and the control group, relative risk 0.79 (0.50–1.24). In patients without heart failure (Killip class 1) the composite endpoint showed a significant advantage of GIK, relative risk 0.48 (0.27–0.87). Age, gender, previous MI, smoking status, Killip class, anterior MI, and multi-vessel disease were associated with 30-day mortality in the overall population. In multivariate analysis in the overall study age, gender, previous MI, anterior MI, Killip class, and multi-vessel disease remained independent prognostic factors for 30-day mortality. After adjustment for these factors in the overall population, relative risk of mortality with GIK became 0.61 (0.34–1.10, P=0.09). In the group of Killip class 1 patients the beneficial effect of GIK remained significant with an adjusted relative risk of 0.28 (0.10– 0.77, P=0.01). Discussion The 30-day mortality rate was lower in the GIK group (4.8%) compared to the control group (5.8%), but was not statistically significant. In the large predefined subgroup of 856 patients without signs of heart failure (Killip class 1), a significant reduction of mortality was seen (1.2% in the GIK compared to 4.2% in the control group). In the 84 patients with signs of heart failure (Killip class ≥2) we did not observe a significant difference in mortality between the two groups. In the other predefined subgroups, such as patients with successful reperfusion, GIK did not result in a significant beneficial effect (P=0.14, table 2). The definition of several subgroups, particularly with small number of patients, carries the risk of finding significance due to chance alone, i.e. either beneficial or detrimental. Nevertheless, the principal finding of benefit of GIK in patients without signs of heart failure and in particular the relative risk and confidence interval (figure 3) are unlikely caused by chance. Previous studies with GIK The beneficial effect of GIK in acute MI has been suggested by several clinical studies.3;4;6;21-25 The first small study that combined GIK with thrombolysis reported an 37 Metabolic interventions in acute myocardial infarction improved ejection fraction and wall motion.5 In the Estudios Cardiologicos Latinoamerica (ECLA) pilot trial a beneficial effect on in-hospital mortality was observed primarily in the subgroup of patients in which GIK was combined with thrombolysis.14 Figure 3. Relative risk of GIK on 30-day mortality in overall population and in predefined subgroups All patients <60 year ≥ 60 year Men Women Diabetes mellitus No diabetes mellitus Killip class 1 Killip class ≥2 Anterior MI Non-anterior MI Multi-vessel disease Single-vessel disease TIMI 3 flow No TIMI 3 flow Successful No successful 0 1 GIK better 2 Control better 3 However, the Polish-Glucose-Insulin-Potassium (Pol-GIK) trial with 954 patients using lowdose GIK, mortality in the GIK group was even significantly higher than in the control group (8.9% versus 4.8%, P=0.01).26 When compared to the results of the ECLA pilot trial of the subgroup of 252 patients treated with GIK and reperfusion the mortality rate reduction in our study, i.e. 1% in the overall population, was much smaller.14 38 2/214 (0.9) 5/416 (1.2) Single-vessel disease TIMI 3 flow after PCI 2/64 (3.1) No successful reperfusion 6/66 (9.1) 12/364 (3.3)* 5/26 (19) 13/404 (3.2)* 3/211 (1.4) 15/219 (6.8)† 5/224 (2.2) 13/206 (6.3)† 14/387 (3.6)* 4/43 (9.3) 10/166 (6.0) 2/5 (40) 1/12 (5.3) 2/3 (67) 1/21 (4.8) 0/8 (-) 3/16 (19) 1/12 (17) 2/12 (8.3) 1/21 (4.8) 2/3 (67) 1/8 (13) 2/16 (13) 1/6 (17) 2/18 (11) 3/14 (21) 0/10 (-) GIK group 1/4 (25) 1/10 (10) 1/2 (50) 1/12 (8.3) 0/6 (-) 2/8 (25) 1/8 (13) 1/6 (17) 2/13 (15) 0/1 (-) 2/6 (33) 0/8 (-) 1/5 (20) 1/9 (11) 1/9 (11) 1/5 (20) Control group Killip class 2 4/6 (67) 3/8 (38) 1/1 (100) 6/13 (46) 1/4 (25) 6/10 (60) 0/2 (-) 7/12 (58) 7/12 (58) 0/2 (-) 5/9 (56) 2/5 (40) 6/7 (86) 1/7 (14) 4/10 (40) 3/4 (75) GIK group 1/6 (17) 3/8 (38) 0/0 (-) 4/14 (29) 0/3 (-) 4/11 (36) 1/6 (17) 3/8 (38) 3/11 (27) 1/3 (33) 0/2 (-) 4/12 (33) 2/7 (29) 2/7 (29) 3/8 (38) 1/6 (17) Control group Killip class 3 6/7 (86) 2/5 (40) 3/3 (100) 5/9 (56) 1/1 (100) 7/11 (64) 2/4 (50) 6/8 (75) 8/11 (73) 0/1 (-) 5/5 (100) 3/7 (43) 4/5 (80) 4/7 (57.1) 5/8 (63) 3/4 (75) GIK group 3/4 (75) 0/2 (-) 1/1 (100) 2/5 (40) 0/2 (-) 3/4 (75) 1/2 (50) 2/4 (100) 2/4 (50) ½ (50) 2/2 (100) 1/4 (25) 1/1 (100) 2/5 (40) 3/5 (60) 0/1 (-) Control group Killip class 4 and blush grade 2 or 3. MI = myocardial infarction; TIMI = Thrombolysis in Myocardial Infarction. ** Time denotes time to admission. ‡ Successful reperfusion denotes TIMI 3 flow Relative risks were determined by dividing the cumulative incidence rates in the GIK group and the control group. * P-value of RR <0.05; † P-value of RR <0.01. 3/336 (0/8) Successful reperfusion‡ 0/10 (-) 3/212 (1.4) Multi-vessel disease No TIMI 3 flow 2/208 (1.0) 0/44 (-) Diabetes mellitus 3/218 (1.4) 3/150 (2.0) Time >180 min** Non-anterior MI 2/276 (0.7) Time ≤180 min** Anterior MI 8/264 (3.0) 3/107 (2.8) Women 5/382 (1.3) 7/83 (8.4) 2/319 (0.6) Men No diabetes mellitus 14/238 (5.9)* 4/209 (1.9) ≥60 year 11/347 (3.2)* 4/192 (2.1) <60 year Control group GIK group 1/217 (0.5) Subgroup Killip class 1 Table 3. Effect of GIK on 30-day mortality in patients with Killip class 1, 2, 3 and 4 Metabolic interventions in acute myocardial infarction Several facts could explain the difference between both studies. First, all patients in both groups of our study were treated with PCI compared to prior studies which used preferentially thrombolysis or no reperfusion therapy. Secondly, the mortality rate is low, due to the effect of our standard care for patients with acute MI, i.e. the short time from onset of symptoms to treatment, the use of additional therapies, and a high rate of stenting (57.1%). Thirdly, in our study the number of patients with signs of heart failure at admission was much higher than in the ECLA pilot trial. In this subgroup of patients an increased mortality rate was observed in our study. It is harder to reduce the mortality even more in a population with such a low mortality rate. The mortality rate in the control group in the ECLA pilot trial was 15.2%, a percentage that was even higher than the mortality rate of patients in the control group of patients that did not receive reperfusion therapy. GIK in patients with signs of heart failure The effect of GIK infusion in patients with signs of heart failure (Killip class ≥2) is uncertain. In spite of liberal use of intra-aortic balloon pumping (9.3%), more patients in the GIK group needed mechanical ventilation (2.5% in the GIK group versus 0.9% in the control group). Heart failure was an important cause of death in patients admitted with Killip class ≥2, see table 5. Therefore it is a possibility that in some patients the potential positive effects of GIK on metabolism were overruled by a negative effect of the volume load on the hemodynamic state.27-29 For a patient of 80 kg in our study, our infusion rate resulted in the infusion of 1920 ml in 8 hours. Administering such a volume load to patients with an impaired left ventricular function may induce hemodynamic instability, even though the metabolic effect may be beneficial. However, we did not expect this infusion rate to be detrimental since in early studies hemodynamic disturbances, such as pulmonary congestion, dyspnoea, and oedema, occurred in only 1-3% of patients treated with GIK.3 In experimental and clinical studies, the infusion of insulin and glucose did increase the contractile force30-32, although others found that GIK made no differences on hemodynamic parameters.6 Studies with strict glucose regulation In the Diabetes Insulin-Glucose in Acute Myocardial Infarction (DIGAMI) study with 620 patients with an acute MI and diabetes mellitus or glucose at admission >11.0 mmol/L, the combination of insulin-glucose infusion followed by intensive insulin treatment resulted in better glucose regulation in the insulin-glucose group.16 At 1-year follow-up, mortality was lower in the insulin-glucose group, with 18.6% versus 26.1% in the control group (P=0.03).33;34 40 GIK and 30-day outcome It is suggested that GIK is mainly beneficial by the effects of insulin on the myocardium and the whole body.35-37 Results of a study of intensive insulin therapy in critically ill patients to maintain blood glucose between 4.4 mmol/L and 6.1 mmol/L gives direction for future research in which metabolic interventions in acute MI are directed towards strict glucose regulation.38;39 Table 4. Clinical endpoints at 30 days in overall population and Killip class 1 patients GIK Control Overall population N=476 N=464 RR* Adjusted RR* P-value Death 23 (4.8) 27 (5.8) 0.82 (0.46–1.46) 0.61 (0.34–1.10) 0.09 Recurrent MI 4 (0.8) 7 (1.5) 0.56 (0.16–1.90) 0.42 (0.12–1.51) 0.19 Repeat PCI 16 (3.4) 20 (4.3) 0.77 (0.40–1.49) 0.74 (0.38–1.44) 0.37 Composite endpoint 38 (8.0) 46 (9.9) 0.79 (0.50–1.24) 0.68 (0.44–1.05) 0.08 Killip class 1 N=426 N=430 Death 5 (1.2) 18 (4.2) 0.28 (0.10–0.75) 0.28 (0.10–0.77) 0.01 Recurrent MI 3 (0.7) 6 (1.4) 0.50 (0.13–2.02) 0.39 (0.09–1.63) 0.20 Repeat PCI 12 (2.8) 18 (4.2) 0.66 (0.32–1.40) 0.64 (0.30–1.33) 0.23 Composite endpoint 18 (4.2) 36 (8.4) 0.48 (0.27–0.87) 0.47 (0.27–0.83) 0.01 Data are RR and 95% confidence interval. Relative risk adjusted for age, gender, history, Killip class, infarct location, and multi-vessel disease by using Cox proportional hazards regression. In subgroup of Killip class 1 patients RR adjusted for age, gender, history of MI, infarct location and multi-vessel disease. † P-value for adjusted relative risk. ‡ Repeat PCI denotes coronary angioplasty after initially conservative or coronary angioplasty within 30 days. § Composite endpoint denotes the occurrence of death or recurrent infarction or repeat PCI. PCI = percutaneous coronary intervention, RR = relative risk, CI = confidence interval. GIK and time to reperfusion It has been postulated that through reduction in the extent of ischemic myocardial damage and suppression of free fatty acid levels, GIK therapy prevents reperfusion injuries that may occur after successful revascularization.3 Protection of the cell membrane of ischemic cardiac cells may also improve reflow after reperfusion and protect against no reflow phenomenon by reducing cell swelling and microvascular compression. It has been estimated that GIK therapy has the potential to protect ischemic myocardium before reperfusion for 10 hours or even longer.40 Our study offered the opportunity to analyse the effect of GIK in patients with different ischemic time, i.e. time to admission and door to balloon time. We could not find a clear relation between the time delays and the effect of GIK (table 2, table 3). 41 Metabolic interventions in acute myocardial infarction Adverse effects With the possible exception of volume overload in patients with Killip class ≥2 there were no major adverse effects of GIK. Phlebitis did not occur in our study, even though the majority of patients received the infusion via a peripheral venous line. It is most likely that this is due to the short infusion period, maximally 12 hours. In the ECLA pilot trial, 17% did developed mild phlebitis and only 2% developed severe phlebitis after 24 hour of GIK infusion.14 Table 5. Causes of death in GIK group and control group Killip class 1 Number of patients Killip class ≥2 GIK group Control group GIK group Control group 426 430 50 34 Cardiac Myocardial rupture 1 (0.2) 1 (0.2) - 2 (5.9) Recurrent infarction - 1 (0.2) 1 (2.0) - 3 (0.7) 12 (2.8) 17 (34.0) 7 (20.6) - 3 (0.7) - - Non-cardiac 1 (0.2) 1 (0.2) - - All causes 5 (1.2) 18 (4.2) 18 (36.0) 9 (26.5) Heart failure Sudden death Data are number (%). Percentage defined as the percentage of all patients in the subgroup. Study limitations With the observed low mortality rates in the GIK group and control group in the overall population our study could not detect a significant difference in mortality. A more realistic risk reduction for future research may be a risk reduction of 30% in patients with Killip class 1. Therefore, in future studies over 2000 patients have to be included. By including 940 patients in our present study, the number of patients in some of the subgroups, such as in patients with a history of diabetes mellitus, were too small to draw definite conclusions. The subgroups of patients in our study were predefined, but we did not use a method to correct for multiple comparisons to analyze them. The role of GIK in patients with signs of heart failure is unclear and the volume load may be detrimental. A more tailored approach in patients with heart failure at admission seems warranted, such as the admission of glucose 30% or an infusion of no more than 500 ml or a period of infusion of 12 to 24 hours.3 Alternatively, in these patients the GIK infusion should be combined with other measures such as continuous monitoring of hemodynamic parameters.30 Our study had an open-label design, since the need to administer a large volume of fluid, frequent blood-glucose monitoring and adjustments of the insulin dose in the study group is both unethical and unpractical to organize in a placebo-controlled study. 42 GIK and 30-day outcome Conclusion GIK infusion as adjunctive therapy to PCI in acute MI seems promising. In the large subgroup of patients without signs of heart failure (over 90% of all patients) we did find a significant beneficial effect. The favourable results of GIK in patients without signs of heart failure did encourage us to start a large, multi-center, randomized trial to determine the optimal metabolic management in patients with a heart rate <90 beats/min, a systolic blood pressure >100 mmHg, and no third heart sound or pulmonary rales. Alternative regimens for metabolic intervention may be necessary for patients with signs of heart failure. Contributors This study was supported by a generous grant from the Netherlands Heart Foundation (99.028). No other conflicts of interest or financial disclosure. References 1. Sodi-Pallares D, Testelli MR, Fishleder BL et al. Effects of an intravenous infusion of a potassium-glucose-insulin solution on the electrocardiographic signs of myocardial infarction. A preliminary clinical report. Am J Cardiol 1962;9:166-81. 2. Fath-Ordoubadi F, Beatt KJ. Glucose-insulin-potassium therapy for treatment of acute myocardial infarction: an overview of randomized placebo-controlled trials. Circulation 1997;96:1152-56. 3. Heng MK, Norris RM, Singh BN, Barratt-Boyes C. Effects of glucose and glucose-insulinpotassium on haemodynamics and enzyme release after acute myocardial infarction. Br Heart J 1977;39:748-57. 4. Rogers WJ, Stanley AW, Jr., Breinig JB et al. Reduction of hospital mortality rate of acute myocardial infarction with glucose-insulin-potassium infusion. Am Heart J 1976;92:441-54. 5. Satler LF, Green CE, Kent KM, Pallas RS, Pearle DL, Rackley CE. Metabolic support during coronary reperfusion. Am Heart J 1987;114:54-58. 6. Stanley AW, Jr., Prather JW. Glucose-insulin-potassium, patient mortality and the acute myocardial infarction: results from a prospective randomised study. Circulation 1978;57:61. 7. Rackley CE, Russell RO, Jr., Rogers WJ, Mantle JA, McDaniel HG, Papapietro SE. Clinical experience with glucose-insulin-potassium therapy in acute myocardial infarction. Am Heart J 1981;102:1038-49. 8. Apstein CS, Gravino FN, Haudenschild CC. Determinants of a protective effect of glucose and insulin on the ischemic myocardium. Effects on contractile function, diastolic compliance, metabolism, and ultrastructure during ischemia and reperfusion. Circ Res 1983;52:515-26. 9. Cave AC, Ingwall JS, Friedrich J et al. ATP synthesis during low-flow ischemia: influence of increased glycolytic substrate. Circulation 2000;101:2090-2096. 43 Metabolic interventions in acute myocardial infarction 10. Oliver MF, Opie LH. Effects of glucose and fatty acids on myocardial ischaemia and 11. Grines CL, Browne KF, Marco J et al. A comparison of immediate angioplasty with arrhythmias. Lancet 1994;343:155-58. thrombolytic therapy for acute myocardial infarction. The Primary Angioplasty in Myocardial Infarction Study Group. N Engl J Med 1993;328:673-79. 12. Zijlstra F, de Boer MJ, Hoorntje JC, Reiffers S, Reiber JH, Suryapranata H. A comparison of immediate coronary angioplasty with intravenous streptokinase in acute myocardial infarction. N Engl J Med 1993;328:680-684. 13. Zijlstra F, Hoorntje JC, de Boer MJ et al. Long-term benefit of primary angioplasty as compared with thrombolytic therapy for acute myocardial infarction. N Engl J Med 1999;341:1413-19. 14. Diaz R, Paolasso EA, Piegas LS et al. Metabolic modulation of acute myocardial infarction. The ECLA (Estudios Cardiologicos Latinoamerica) Collaborative Group. Circulation 1998;98:2227-34. 15. Vanoverschelde JL, Janier MF, Bakke JE, Marshall DR, Bergmann SR. Rate of glycolysis during ischemia determines extent of ischemic injury and functional recovery after reperfusion. Am J Physiol 1994;267:H1785-H1794. 16. Malmberg KA, Efendic S, Ryden LE. Feasibility of insulin-glucose infusion in diabetic patients with acute myocardial infarction. A report from the multicenter trial: DIGAMI. Diabetes Care 1994;17:1007-14. 17. The Thrombolysis in Myocardial Infarction (TIMI) trial. Phase I findings. TIMI Study Group N 18. van 't Hof AW, Liem A, Suryapranata H, Hoorntje JC, de Boer MJ, Zijlstra F. Angiographic Engl J Med 1985;312:932-36. assessment of myocardial reperfusion in patients treated with primary angioplasty for acute myocardial infarction: myocardial blush grade. Zwolle Myocardial Infarction Study Group. Circulation 1998;97:2302-6. 19. Ryan TJ, Antman EM, Brooks NH et al. 1999 update: ACC/AHA Guidelines for the Management of Patients With Acute Myocardial Infarction: Executive Summary and Recommendations: A report of the American College of Cardiology/American Heart Association Task Force on Practice Guidelines (Committee on Management of Acute Myocardial Infarction). Circulation 1999;100:1016-30. 20. Van de Werf F, Ardissino D, Betriu A et al. Management of acute myocardial infarction in patients presenting with ST segment elevation. The Task Force on the Management of Acute Myocardial Infarction of the European Society of Cardiology. Eur Heart J 2003;24:28-66. 21. Hjermann I. A controlled study of peroral glucose, insulin and potassium treatment in 22. Medical Research Council Working Party on the Treatment of Myocardial Infarction. myocardial infarction. Acta Med Scand 1971;190:213-18. Potassium, glucose, and insulin treatment for acute myocardial infarction. Lancet 1968;2:1355-60. 23. Mittra B. Potassium, glucose, and insulin in treatment of myocardial infarction. Lancet 24. Pentecost BL, Mayne NM, Lamb P. Controlled trial of intravenous glucose, potassium, and 1965;2:607-9. insulin in acute myocardial infarction. Lancet 1968;1:946-48. 44 GIK and 30-day outcome 25. Pilcher J, Etishamudin M, Exon P, Moore J. Potassium, glucose and insulin in myocardial 26. Ceremuzynski L, Budaj A, Czepiel A et al. Low-dose glucose-insulin-potassium is ineffective in infarction. Lancet 1967;1:1109. acute myocardial infarction: results of a randomized multicenter Pol-GIK trial. Cardiovasc Drugs Ther 1999;13:191-200. 27. Crexells C, Chatterjee K, Forrester JS, Dikshit K, Swan HJ. Optimal level of filling pressure in the left side of the heart in acute myocardial infarction. N Engl J Med 1973;289:1263-66. 28. Sjostrand F, Edsberg L, Hahn RG. Volume kinetics of glucose solutions given by intravenous 29. Wildenthal K, Mierzwiak DS, Mitchell JH. Acute effects of increased serum osmolality on left 30. Mantle JA, Rogers WJ, Smith LR et al. Clinical effects of glucose-insulin-potassium on left infusion. Br J Anaesth 2001;87:834-43. ventricular performance. Am J Physiol 1969;216:898-904. ventricular function in acute myocardial infarction: results from a randomized clinical trial. Am Heart J 1981;102:313-24. 31. Sasso FC, Carbonara O, Cozzolino D et al. Effects of insulin-glucose infusion on left ventricular function at rest and during dynamic exercise in healthy subjects and noninsulin dependent diabetic patients: a radionuclide ventriculographic study. J Am Coll Cardiol 2000;36:219-26. 32. Whitlow PL, Rogers WJ, Smith LR et al. Enhancement of left ventricular function by glucose- 33. Malmberg K, Ryden L, Efendic S et al. Randomized trial of insulin-glucose infusion followed insulin-potassium infusion in acute myocardial infarction. Am J Cardiol 1982;49:811-20. by subcutaneous insulin treatment in diabetic patients with acute myocardial infarction (DIGAMI study): effects on mortality at 1 year. J Am Coll Cardiol 1995;26:57-65. 34. Malmberg K. Prospective randomised study of intensive insulin treatment on long term survival after acute myocardial infarction in patients with diabetes mellitus. DIGAMI (Diabetes Mellitus, Insulin Glucose Infusion in Acute Myocardial Infarction) Study Group. BMJ 1997;314:1512-15. 35. Das UN. Insulin: an endogenous cardioprotector. Curr Opin Crit Care 2003;9:375-83. 36. Groeneveld AB, Beishuizen A, Visser FC. Insulin: a wonder drug in the critically ill? Crit Care 37. McNulty PH. Glucose and insulin management in the post-MI setting. Curr Diab Rep 38. van den Berghe G, Wouters P, Weekers F et al. Intensive insulin therapy in the critically ill 39. van den Berghe G, Wouters PJ, Bouillon R et al. Outcome benefit of intensive insulin therapy 2002;6:102-5. 2002;2:37-44. patients. N Engl J Med 2001;345:1359-67. in the critically ill: Insulin dose versus glycemic control. Crit Care Med 2003;31:359-66. 40. Eberli FR, Weinberg EO, Grice WN, Horowitz GL, Apstein CS. Protective effect of increased glycolytic substrate against systolic and diastolic dysfunction and increased coronary resistance from prolonged global underperfusion and reperfusion in isolated rabbit hearts perfused with erythrocyte suspensions. Circ Res 1991;68:466-81. 45 Metabolic interventions in acute myocardial infarction 46 GIK and myocardial function Chapter 2.2 The impact of glucose-insulin-potassium infusion in acute myocardial infarction on infarct size and left ventricular ejection fraction Iwan CC van der Horst, Jan Paul Ottervanger, Arnoud WJ van ‘t Hof, Stoffer Reiffers, Kor Miedema, Jan CA Hoorntje, Jan-Henk E Dambrink, AT Marcel Gosselink, Maarten WN Nijsten, Harry Suryapranata, Menko-Jan de Boer, Felix Zijlstra Submitted 47 Metabolic interventions in acute myocardial infarction Abstract Background Favorable clinical outcomes have been observed with glucose-insulin-potassium infusion (GIK) in acute myocardial infarction (MI). The mechanisms of this beneficial effect have not been delineated clearly. GIK has metabolic, anti-inflammatory and profibrinolytic effects and it may preserve the ischemic myocardium. We aimed to assess the effect of GIK infusion on infarct size and left ventricular function, as part of a randomized controlled trial. Methods 940 patients treated with primary percutaneous coronary intervention (PCI) for acute MI were randomized to GIK infusion or no infusion. Endpoints were the creatine kinase MBfraction (CK-MB) and left ventricular ejection fraction (LVEF). CK-MB levels were determined at 0, 2, 4, 6, 24, 48, 72 and 96 hour after admission and the LVEF before discharge. Results There was no difference in the time course or magnitude of CK-MB release between the 2 groups: peak CK-MB level was 249±228 IU/L in the GIK group versus 240±200 IU/L in the control group (NS). The mean LVEF was 43.7±11.0 % in the GIK group versus 42.4±11.7% in the control group (P=0.12). A LVEF ≤30% was observed in 18% in the controls and in 12% in the GIK group (P=0.01). Conclusion Treatment with GIK preserves myocardial function as determined by LVEF. No effect was observed on the pattern or magnitude of enzyme release. 48 GIK and myocardial function Introduction Glucose-insulin-potassium (GIK) infusion in acute myocardial infarction (MI) has been suggested to be of clinical benefit.1-4 Both animal studies and early studies in patients investigating the influence of GIK on infarct size have shown conflicting results.5-14 Experimental studies on the effect of GIK on preservation of left ventricular function, as determined by hemodynamic parameters, demonstrated a beneficial effect.15;16 Furthermore, in a small study in patients with acute MI treated with thrombolysis there was a significant improvement in left ventricular function over a 10 day period 17. Recently, a small randomized trial has suggested a beneficial effect of the addition of GIK to primary PCI in 37 patients.18 Unfortunately, two large studies of GIK in the era of reperfusion did not report detailed information on the effects of GIK on myocardial function.1;17;19 The Polish-Glucose-Insulin-Potassium (Pol-GIK) trial with 954 patients using low-dose GIK, found no difference between median creatine kinase (CK) levels (920 IU/L in GIK patients versus 925 IU/L in controls).19 Recently, in the Reevaluation of Intensified Venous Metabolic Support for Acute Infarct size Limitation (REVIVAL) trial with 312 MI patients the combination of GIK and primary PCI had no effect on myocardial salvage.20 In the Glucose-Insulin-Potassium Study (GIPS) with GIK infusion as adjunctive therapy to primary PCI in acute MI the 30-day mortality was not significantly reduced in the overall population.4 In the predefined subgroup of patients without heart-failure at admission mortality was 1.2% in GIK patients versus 4.2% in controls (P=0.01). In this study we were able to determine the effect of GIK on cumulative enzyme release and left ventricular ejection fraction. Methods Study population Outline of the study and 30-day clinical follow-up have been reported 4. All consecutive patients with symptoms consistent with acute MI of >30 minutes duration, presenting within 24 hours after the onset of symptoms and with ST segment elevation of more than 1 mm (0.1 mV) in two or more contiguous leads on the electrocardiogram were evaluated for inclusion in this study. Patients were excluded when pre-treated with thrombolysis or when an illness associated with a marked restricted life expectancy was present. Before randomization, age, gender, history of coronary artery bypass grafting (CABG), previous PCI, stroke and MI, existence of diabetes mellitus, smoking status, heart rate, arterial pressure, body mass index, Killip class, electrocardiographic site of infarction, time of onset of symptoms, time of hospital admission in both referring hospital and in our hospital were recorded. The research protocol was reviewed and approved by the 49 Metabolic interventions in acute myocardial infarction medical ethics committee of our hospital, and patients were included after informed consent. Treatment protocol Patients were randomly assigned to either GIK infusion or no infusion. Assignments to the treatment groups were made with the use of a computerized randomization program. In the GIK group, a continuous infusion of 80 mmol potassium chloride in 500 mL 20% glucose with a rate of 3 mL/kg/hour in a peripheral venous line was given. A continuous infusion of short-acting insulin (50 units Actrapid HM-Novo Nordisk, Copenhagen, Denmark) in 50 mL 0.9% sodium chloride was also started with the use of a pump (Perfusor-FM, B. Braun, Melsungen, Germany). Baseline insulin-infusion dose and hourly adjustments of the insulin dose were based on an algorithm, to obtain blood-glucose levels between 7.0 and 11.0 mmol/L, based on measurements of whole-blood glucose concentration. The infusion was started as soon as possible after randomization. All patients went to the catheterization laboratory as soon as possible after admission and randomization. At the laboratory both coronary arteries were visualized. PCI was performed with standard techniques if the coronary anatomy was suitable for angioplasty. Additional treatment consisted of unfractionated intravenous heparin, nitroglycerin and aspirin. After sheath removal, low-molecular-weight heparin was given for 24 hours. Before discharge additional pharmacological treatment consisting of aspirin, clopidogrel, coumarins, beta-blockers, angiotensin-converting enzyme inhibitors, and statins were initiated according to the guidelines of the American College of Cardiology/American Heart Association.20 Enrollment of patients started in April 1998 and ended September 2001. Measurements Enzymatic infarct size was estimated by serial measurements of CK-MB fraction. The first measurement was taken as soon as possible after admission. Thereafter frequent CKdeterminations were performed according to a schedule that called for 4 to 8 measurements in the first 96 hours. To accommodate the problem in practice that exact predefined times for blood sampling were not always followed, the actual times of sampling, expressed as minutes after the moment of randomization were recorded. To allow optimal comparison of the time courses of CK-MB levels and to best approximate the area under the CK-MB curves we developed an algorithm. The algorithm estimated the time course of CK-MB for each patient before calculating means for patient groups. According to the known kinetics of CK-MB that with a rapid rise and a much slower decrease the following characteristic time points with accompanying time intervals with defined: 0 hr (interval from 60 min before to 45 min after randomization); 2 hr (45min to 3 50 GIK and myocardial function hr); 4 hr (3hr to 5 hr); 6 hr (5hr to 12hr); 24hr (12hr to 36hr); 48hr (36hr to 60hr); 72hr (60hr to 84hr) and 96hr (84hr to 108hr). Per patient the algorithm interpolated the CK-MB levels based on the precise times the measurements were performed. Next it determined for each of the predefined intervals if an actual measurement had been performed in that interval. If no measurement was available for a particular interval a ‘not available’ value was generated for that interval. Accordingly inappropriately interpolated values were avoided. If one or more measurements were available for an interval, the CK-MB value for the time point with the corresponding interval was calculated from the area under the interpolated curve was divided by the duration of that interval. CK-MB was determined enzymatically on a Hitachi 717 automatic analyzer according to the International Federation of Clinical Chemistry (IFCC) recommendation at 30 degrees Celsius. A peak CKMB above the 75% percentile (i.e. the highest quartile) was defined as high enzyme release. Time to peak CK-MB was determined. Left ventricular ejection fraction (LVEF) was measured before discharge by radionuclide ventriculography or by echocardiography. Radionuclide ventriculography was performed with the multiple gated equilibrium method following the labeling of red blood cells of the patient with technetium-99m-pertechnate. A General Electric 300 gamma camera with a low-energy all-purpose parallel-hole collimator was used. Global ejection fraction was calculated by a General Electric Star View computer using the fully automatic PAGE program. Two-dimensional echocardiography was performed by observers who were unaware of the randomization outcome and clinical data. A LVEF ≤30% was defined as a poor left ventricular function. Statistical analysis All analyses were by intention to treat. Endpoints were pattern and magnitude of CK-MB release, peak CK-MB, high enzymatic enzyme release, defined as a peak enzyme release in the highest quartile; mean LVEF, and a LVEF lower than or equal to 30%. To allow comparison of the patterns of CK-MB release, the CK-MB values at 0, 2, 4, 6, 24, 48, 72 and 96 hour after admission were calculated for each individual patient with linear interpolation. Differences between group means were assessed with the two-tailed Student’s t-test. Chi-square analysis was used to test differences between proportions. The Cox proportional-hazards regression model was used to calculate relative risks adjusted for differences in baseline characteristics. To predict the independent association between treatment with GIK and a peak CK-MB release above the highest quartile or LVEF ≤30%, a multivariate logistic regression analysis was performed. Statistical significance was considered a two-tailed P-value <0.05. The Statistical Package for the Social Sciences (SPSS Inc., Chicago, IL, USA) version 11.5 was used for all statistical analysis. 51 Metabolic interventions in acute myocardial infarction Table 1. Baseline clinical and demographic characteristics and initial therapies Characteristics Number of patients GIK group Control group 476 464 Age, years (mean±SD) 59.9±11.9 60.8±12.0 Men 351 (73.7) 368 (79.3) Referred patients 201 (42.3) 180 (38.8) Body mass index 26.7±3.8 27.0±4.0 Previous MI 52 (10.9) 53 (11.4) Previous PCI 22 (4.7) 24 (5.2) Previous CABG 14 (2.9) 12 (2.6) History of stroke 17 (3.6) 15 (3.2) Diabetes mellitus 50 (10.5) 49 (10.6) Hypertension 134 (28.2) 130 (28.0) Dyslipidemia 94 (19.7) 95 (20.5) Currently smoker 225 (47.3) 237 (51.1) Positive family history 195 (41.0) 179 (38.6) Time to admission, min (IQR)* 150 (100-215) 150 (105-234) Door to balloon time, min (IQR) 45 (31-64) 48 (34-69) Killip class 1 426 (89.5) 430 (92.7) Killip class 2 24 (5.0) 14 (3.0) Killip class 3 14 (2.9) 14 (3.0) Killip class 4 12 (2.5) 6 (1.3) Anterior MI 250 (52.9) 224 (49.1) Multi-vessel disease 249 (52.3) 242 (52.2) PCI 436 (91.6) 424 (91.4) Stent** 255 (58.5) 236 (55.7) GP IIb/IIIa receptor blocker** 96 (22.1) 109 (25.7) In-hospital CABG 19 (4.0) 19 (4.1) TIMI 3 flow after PCI 459 (96.4) 435 (93.8) Successful reperfusion‡ 394 (82.8) 384 (82.8) Intra-aortic balloon pump 45 (9.5) 42 (9.1) Mechanical ventilation 12 (2.5) 4 (0.9) Data are number (%) unless otherwise indicated. MI = myocardial infarction. IQR = interquartile range. PCI = percutaneous coronary intervention. CABG = coronary artery bypass grafting. * Time to admission denotes time between onset of symptoms and until admission. † In-hospital CABG = CABG defined as patients treated initially conservative, followed by elective CABG within 7 days. ‡ Successful reperfusion denotes TIMI 3 flow and blush grade 2 or 3. ** Percentage defined as the percentage of the patients that underwent PCI. 52 GIK and myocardial function Results Study population Of the 940 patients who underwent randomization, 476 were assigned to receive GIK infusion. There were no differences in the baseline characteristics of the two treatment groups (table 1). The mean time between onset of symptoms and admission was 150 minutes, and 75% of the patients were admitted within 225 min. The interquartile range (IQR) in the GIK group was 100 to 215 minutes and in the control group 105 to 234 minutes. After coronary angiography, 860 patients (90.5%) underwent PCI, 38 patients (4%) were referred for CABG within 7 days, and 42 patients (4.5%) were treated conservatively. 30-day mortality was 4.8% in the GIK patients and 5.8% in the control patients.4 Table 2. Comparison of patients with a peak CK-MB release beneath the highest quartile and patients with a CK-MB release above the highest quartile Characteristic High enzyme release Low enzyme release 232 708 59±12 61±12 0.17 Men 179 (77) 540 (76) 0.86 Hypertension 64 (28) 200 (28) 0.87 Previous MI 24 (10) 81 (11) 0.72 Diabetes mellitus 28 (12) 71 (10) 0.39 Killip class 1 192 (83) 664 (94) <0.001 Anterior MI 161 (69) 313 (44) <0.001 TIMI flow 0 before PCI 189 (82) 377 (53) <0.001 TIMI flow 3 after PCI 219 (94) 675 (95) 0.6 GIK treatment 121 (52) 355 (50) 0.6 Number of patients Age, years (mean±SD) P-value Data are number (%) unless otherwise indicated. MI = myocardial infarction. TIMI = Thrombolysis in Myocardial Infarction. PCI = percutaneous coronary intervention. Enzyme release Data on the effect of GIK on enzymatic infarct size (CK-MB) were completely available in 923 patients (98%), 470 patients treated with GIK and 462 control patients. Of each patient at least a single measurement was available. A mean of 6.9 CK-MB determinations were available per patient. As indicated in figure 1, there was no difference in pattern or magnitude of the CK-MB release between the two groups. 53 Metabolic interventions in acute myocardial infarction Mean peak CK-MB±SD was 249±228 IU/L in the GIK group versus 240±200 IU/L in the control group (NS). In GIK patients the median time to peak CK-MB was 450 minutes (IQR 300-733) compared to 468 minutes (IQR 285-738) in the control patients (NS). High enzyme release (i.e. peak CK-MB >349 IU/L) was found in 111 patients (24%) in the GIK group versus 121 patients (25%) in the control group (P=0.6). Differences between patients with a peak CK-MB release beneath 349 IU/L and above 349 IU/L are represented in table 2. Characteristic related with high enzyme release were Killip class ≥2, anterior MI, and TIMI 0 flow before PCI. Table 3. Comparison of patients with a low left ventricular ejection fraction (LVEF ≤30%) with those with preserved left ventricular ejection fraction (LVEF >30%) Characteristic Low LVEF Preserved LVEF 125 698 Age, years (mean±SD) 63±12 59±12 0.008 Men 98 (78) 537 (77) 0.7 Hypertension 43 (34) 182 (26) 0.05 Previous MI 18 (14) 63 (9) 0.06 Diabetes mellitus 29 (23) 57 (8) 0.008 Killip class 1 109 (87) 660 (95) 0.002 Anterior MI 115 (92) 291 (42) <0.001 TIMI 0 before PCI 40 (32) 291 (42) 0.04 TIMI 3 after PCI 114 (91) 677 (97) 0.002 GIK treatment 51 (41) 368 (53) 0.01 Number of patients P-value Data are number (%) unless otherwise indicated. MI = myocardial infarction. TIMI = Thrombolysis in Myocardial Infarction. PCI = percutaneous coronary intervention. Left ventricular ejection fraction LVEF measurements were available in 419 patients (88%) treated with GIK and in 404 patients (87%) of the controls. Mean time between admission and LVEF measurement was 2.65 days in the GIK group and 2.5 days in the control group (IQR 2 days in both groups). The mean LVEF was 43.7±11.0% in the GIK group versus 42.4±11.7% in the control group (P=0.12). Of the 823 patients with a measured LVEF before discharge a total of 125 (15%) had an ejection fraction lower than or equal to 30%. Differences between patients with LVEF ≤30% and those with a higher LVEF are summarized in table 3. Treatment with GIK was associated with a lower frequency of a LVEF ≤30% (51 patients (12%) compared to 74 patients (18%), P=0.01). Other important characteristics associated with LVEF ≤30% were age, diabetes mellitus, Killip class, infarct location and TIMI flow 54 GIK and myocardial function after PCI. To identify independent predictors of a low left ventricular ejection fraction (LVEF ≤30%) all variables associated with LVEF ≤30% in univariate analysis were used in multivariate analysis, see table 3. After adjustment, patients treated with GIK had a RR of 0.53 (95% confidence interval 0.35–0.81, P=0.01) for a LVEF ≤30% compared to controls. In patients with Killip class 1 at admission the mean LVEF was 44.1±10.9 % in the GIK group versus 42.8±11.5% in the control group (P=0.12). In patients randomized to GIK a LVEF ≤30% was less often observed (45 patients (12%) versus 65 patients (17%), P=0.03). The mean peak CK-MB ± SD was 463±318 IU/L in patients with LVEF ≤30% versus 215±166 IU/L in patients with LVEF >30% (P<0.001). Figure 1. CK-MB release after admission in the GIK group and control group 250 CK-MB (IU/L) 200 GIK group Control group 150 100 50 0 0 20 40 60 80 100 Time after admission (hours) CK-MB release after admission in the GIK group (unbroken line) and control group (dashed line). Mean are indicated for 0, 2, 4, 6, 24, 48, 72 and 96 hours. At no time point a significant difference was observed. Discussion In this study, additional treatment with GIK in patients treated with primary PCI for acute myocardial infarction did not decrease enzymatic infarct size but preserved left ventricular function. Since these results are based on an intention to treat analysis of a randomized controlled trial of the effects of GIK, we may have underestimated the effect on preservation of myocardial function. In the control group more patients died, and these 55 Metabolic interventions in acute myocardial infarction patients had a high enzyme release and probably as well a severely impaired LVEF. Nevertheless, our data make a clinically relevant impact of GIK on enzyme release unlikely, and at the same time show an important reduction in the number of patients with a LVEF ≤30%. A LVEF ≤30% exposes these patients to a high risk for the development of heart failure during follow-up, even after successful PCI.21 We also found a relation between high enzyme release and poor left ventricular function. Possibly the relation between GIK and poor LVEF is related to a selection bias of this sub-analysis. On the other hand it can be hypothesized that GIK mediates effects on LVEF, as measured after 2 to 4 days after admission unrelated to enzymatic infarct size. In our previous study on the effect of GIK on 30-day mortality we found a beneficial effect of GIK on outcome in patients without signs of heart-failure at admission. Patients with Killip class 1 had no smaller enzymatic infarct size in this analysis. However, the curve of CK-MB over the first 96 hours after admission in GIK patients lies below the curve of controls. Mean LVEF is larger in patients treated with GIK compared to control patients, albeit not significant (P=0.12). Even as in the overall population the number of patients with LVEF ≤30% is smaller in Killip class 1 patients. Figure 2. CK-MB release after admission in the GIK group and control group of Killip class 1 patients 250 CK-MB (IU/L) 200 GIK group Control group 150 100 50 0 0 20 40 60 80 100 Time after ademission (hours) CK-MB release after admission in the GIK group (unbroken line) and control group (dashed line). Mean are indicated for 0, 2, 4, 6, 24, 48, 72 and 96 hours. At no time point a significant difference was observed. 56 GIK and myocardial function Previous clinical studies with GIK Several studies have reported enzymatic infarct size in patients treated with GIK, mainly in patients without reperfusion therapy.12;14 Clinical studies in the era of reperfusion did provide sparse information.1;19 In line with our results the Pol-GIK trial showed that the median and maximal CK and maximal glutamic oxaloacetic transaminase did not differ significantly between GIK and control patients.19 However, the Pol-GIK trial used low-dose GIK and included patients with a lower risk, i.e. no patients with signs of congestion were included. One study of 32 MI patients treated with thrombolysis found that infusion of GIK to obtain glucose regulation with insulin resulted in a shorter time to peak CK and a smaller total enzyme release.6 In line with our results on enzyme release the REVIVAL trial found no effect of GIK treatment on the myocardial salvage index measured with technetium-99m-sestamibi scintigraphy 6 to 8 hours after admission and after 7 to 14 days (0.50 versus 0.48, P=0.96). GIK consisted of 1000 mL glucose 20% with 40 IU of insulin and 64 mmol potassium chloride at a rate of 1.8 mL/hour for 24 hours. Only in the predefined subgroup of patients with diabetes mellitus a significant difference in salvage index was found (mean difference 0.19, 95% confidence interval 0.01-0.37). In a trial of 37 patients treated with primary PCI a beneficial effect of GIK on myocardial function was observed.18 The increase of the LVEF from baseline to 3 months was 12.5% in the GIK group (P=0.002) versus 6.1% in the placebo group (NS). However, this may also have been the result of a combination of small numbers of patients together with profound changes in the LVEF in the 3-6 months after PCI for acute myocardial infarction.22 In patients with diabetes mellitus and without myocardial ischemia infusion of insulin and glucose did increase the contractile force, i.e. rest LVEF and LVEF during dynamic exercise measured with radionuclide ventriculography.23 Animal studies Several studies with animals have assessed the effects of GIK on infarct size in myocardial infarction, but show conflicting results.5;9;11 A study with pigs showed that hearts treated with GIK had significantly less tissue acidosis, higher wall motion scores, and the less tissue necrosis.16 Similar results were obtained in a study with rats, in which not only the administration of GIK before induction of ischemia but also during acute ischemia seemed beneficial for myocardial function.10 A recent study in diabetic sheep found that GIK improved left ventricular contractility as determined by stroke work efficiency.24 Mechanisms of action We found a relationship between higher enzymatic infarct size and low LVEF. Since we observed only an effect of GIK on LVEF the preservation of the left ventricular function could not be declared by a reduction of myocardial necrosis. The potential mechanisms of 57 Metabolic interventions in acute myocardial infarction the beneficial effects of GIK include metabolic effects, direct hemodynamic effects, improvement of coronary flow and catecholamine mediated effects. The main effect of the GIK infusion is supposed to be the beneficial effect of delivery of glucose to the ischemic myocardium resulting in a suppression of free fatty acids.25-28 Treatment with glucose and insulin inhibits lipolysis, thereby decreasing circulating free fatty acid levels, and suppresses fatty acid oxidation. Moreover, in the postischemic myocardium contractile dysfunction may also be caused by impairment of glucose oxidation and cytosolic proton accumulation, whereas agents that enhance glucose oxidation in the postischemic heart may also improve contractile function.29 After prolonged periods of low-flow ischemia functional recovery is mainly determined by the extent of irreversible ischemic damage. After brief episodes of ischemic damage, oxidative metabolism rapidly returns, well before contractile activity is restored. Therefore GIK treatment is likely to be beneficial when started soon after onset of ischemia. Protection of the cell membrane of ischemic cardiac cells may also improve reflow after reperfusion and protect against the no reflow phenomenon by reducing cell swelling and microvascular compression.30 These microvascular protective effects on the coronary circulation are probably similar in patients with and without diabetes mellitus.31;32 GIK infusion showed an improvement in regional myocardial perfusion and function in segments adjacent to the infarct area in patients recovering from an acute MI.33 Another beneficial mechanism may be the protective effect of GIK on the cell membrane.34-36 Insulin promotes tolerance against ischemic cell death via the activation of innate cell-survival pathways in the heart.37 However, in a small study of patients with MI treated with PCI, administration of GIK did not improve the enzymatic antioxidant reserve.38 Study limitations Left ventricular function was measured in 88% of patients. For patients transferred back to the referring hospitals within 48 hours the measurement was often missing. The same accounts for patients who died within 48 hours. The exact relation between LVEF and 30day mortality can not be determined. It is unknown whether these missing data have influenced the results on the effect of GIK on left ventricular function. We determined the left ventricular function before discharge and it is suggested that measurements after long-term follow-up are more predictive.18 Conclusion High-dose GIK infusion in patients with acute MI treated with primary PCI, results in a lower rate of poor left ventricular function, defined as a left ventricular ejection fraction ≤30%. There is no effect of GIK on the pattern and magnitude of enzyme release. 58 GIK and myocardial function Contributors This study was supported by a generous grant from the Netherlands Heart Foundation (99.028). No other conflicts of interest or financial disclosure. References 1. Diaz R, Paolasso EA, Piegas LS et al. Metabolic modulation of acute myocardial infarction. The ECLA (Estudios Cardiologicos Latinoamerica) Collaborative Group. Circulation 1998;98:2227-34. 2. Fath-Ordoubadi F, Beatt KJ. Glucose-insulin-potassium therapy for treatment of acute myocardial infarction: an overview of randomized placebo-controlled trials. Circulation 1997;96:1152-56. 3. Malmberg K, Ryden L, Efendic S et al. Randomized trial of insulin-glucose infusion followed by subcutaneous insulin treatment in diabetic patients with acute myocardial infarction (DIGAMI study): effects on mortality at 1 year. J Am Coll Cardiol 1995;26:57-65. 4. van der Horst IC, Zijlstra F, van't Hof AW et al. Glucose-insulin-potassium infusion in patients treated with primary angioplasty for acute myocardial infarction: the glucose-insulinpotassium study: a randomized trial. J Am Coll Cardiol 2003;42:784-91. 5. Bellows SD, Kloner RA. Glucose-Insulin-Potassium Does Not Reduce Myocardial Infarct Size in an Ischemic/Reperfusion Rabbit Model. J Thromb Thrombolysis 1998;5:25-27. 6. Chaudhuri A, Janicke D, Wilson MF et al. Anti-inflammatory and profibrinolytic effect of insulin in acute ST segment-elevation myocardial infarction. Circulation 2004;109:849-54. 7. Dalby AJ, Bricknell OL, Opie LH. Effect of glucose-insulin-potassium infusions on epicardial ECG changes and on myocardial metabolic changes after coronary artery ligation in dogs. Cardiovasc Res 1981;15:588-98. 8. Heng MK, Norris RM, Singh BN, Barratt-Boyes C. Effects of glucose and glucose-insulinpotassium on haemodynamics and enzyme release after acute myocardial infarction. Br Heart J 1977;39:748-57. 9. Heng MK, Norris RM, Peter T, Nisbet HD, Singh BN. The effect of glucose-insulin-potassium on experimental myocardial infarction in the dog. Cardiovasc Res 1978;12:429-35. 10. Jonassen AK, Aasum E, Riemersma RA, Mjos OD, Larsen TS. Glucose-insulin-potassium reduces infarct size when administered during reperfusion. Cardiovasc Drugs Ther 2000;14:615-23. 11. Maroko PR, Libby P, Sobel BE et al. Effect of glucose-insulin-potassium infusion on myocardial infarction following experimental coronary artery occlusion. Circulation 1972;45:1160-1175. 12. Reduto L, Gulotta S, Morisson M. Effects of glucose-insulin-potassium infusion on ischemic 13. Rogers WJ, Segall PH, McDaniel HG, Mantle JA, Russell RO, Jr., Rackley CE. Prospective myocardium. Clinical Research 1974;22:685A. randomized trial of glucose-insulin-potassium in acute myocardial infarction. Effects on myocardial hemodynamics, substrates and rhythm. Am J Cardiol 1979;43:801-9. 59 Metabolic interventions in acute myocardial infarction 14. Sundstedt CD, Sylven C, Mogensen L. Glucose-insulin-potassium-albumin infusion in the early phase of acute myocardial infarction--a controlled study. Acta Med Scand 1981;210:6771. 15. Whitlow PL, Rogers WJ, Smith LR et al. Enhancement of left ventricular function by glucose- 16. Zhu P, Lu L, Xu Y, Greyson C, Schwartz GG. Glucose-insulin-potassium preserves systolic and insulin-potassium infusion in acute myocardial infarction. Am J Cardiol 1982;49:811-20. diastolic function in ischemia and reperfusion in pigs. Am J Physiol Heart Circ Physiol 2000;278:H595-H603. 17. Satler LF, Green CE, Kent KM, Pallas RS, Pearle DL, Rackley CE. Metabolic support during coronary reperfusion. Am Heart J 1987;114:54-58. 18. Castro PF, Larrain G, Baeza R et al. Effects of glucose-insulin-potassium solution on myocardial salvage and left ventricular function after primary angioplasty. Crit Care Med 2003;31:2152-55. 19. Ceremuzynski L, Budaj A, Czepiel A et al. Low-dose glucose-insulin-potassium is ineffective in acute myocardial infarction: results of a randomized multicenter Pol-GIK trial. Cardiovasc Drugs Ther 1999;13:191-200. 20. Pache J, Kastrati A, Mehilli J et al. A randomized evaluation of the effects of glucose-insulinpotassium infusion on myocardial salvage in patients with acute myocardial infarction treated with reperfusion therapy. Am Heart J 2004;148:105. 21. Henriques JP, Zijlstra F, van 't Hof AW et al. Angiographic assessment of reperfusion in acute myocardial infarction by myocardial blush grade. Circulation 2003;107:2115-19. 22. Ottervanger JP, van 't Hof AW, Reiffers S et al. Long-term recovery of left ventricular function after primary angioplasty for acute myocardial infarction. Eur Heart J 2001;22:785-90. 23. Sasso FC, Carbonara O, Cozzolino D et al. Effects of insulin-glucose infusion on left ventricular function at rest and during dynamic exercise in healthy subjects and noninsulin dependent diabetic patients: a radionuclide ventriculographic study. J Am Coll Cardiol 2000;36:219-26. 24. Ramanathan T, Shirota K, Morita S, Nishimura T, Huang Y, Hunyor SN. Glucose-insulinpotassium solution improves left ventricular mechanics in diabetes. Ann Thorac Surg 2002;73:582-87. 25. Apstein CS, Gravino FN, Haudenschild CC. Determinants of a protective effect of glucose and insulin on the ischemic myocardium. Effects on contractile function, diastolic compliance, metabolism, and ultrastructure during ischemia and reperfusion. Circ Res 1983;52:515-26. 26. Depre C, Vanoverschelde JL, Taegtmeyer H. Glucose for the heart. Circulation 1999;99:578- 27. Opie LH. The glucose hypothesis: its relation to acute myocardial ischemia. J Mol Cell Cardiol 28. Rackley CE, Russell RO, Jr., Rogers WJ, Mantle JA, McDaniel HG, Papapietro SE. Clinical 88. 1970;1:107-15. experience with glucose-insulin-potassium therapy in acute myocardial infarction. Am Heart J 1981;102:1038-49. 29. Lopaschuk GD, Wambolt RB, Barr RL. An imbalance between glycolysis and glucose oxidation is a possible explanation for the detrimental effects of high levels of fatty acids during aerobic reperfusion of ischemic hearts. J Pharmacol Exp Ther 1993;264:135-44. 60 GIK and myocardial function 30. Eberli FR, Weinberg EO, Grice WN, Horowitz GL, Apstein CS. Protective effect of increased glycolytic substrate against systolic and diastolic dysfunction and increased coronary resistance from prolonged global underperfusion and reperfusion in isolated rabbit hearts perfused with erythrocyte suspensions. Circ Res 1991;68:466-81. 31. McNulty PH, Pfau S, Deckelbaum LI. Effect of plasma insulin level on myocardial blood flow 32. Sundell J, Laine H, Nuutila P et al. The effects of insulin and short-term hyperglycaemia on and its mechanism of action. Am J Cardiol 2000;85:161-65. myocardial blood flow in young men with uncomplicated Type I diabetes. Diabetologia 2002;45:775-82. 33. Marano L, Bestetti A, Lomuscio A et al. Effects of infusion of glucose-insulin-potassium on 34. Aikawa R, Nawano M, Gu Y et al. Insulin prevents cardiomyocytes from oxidative stress- 35. Jonassen AK, Sack MN, Mjos OD, Yellon DM. Myocardial protection by insulin at reperfusion myocardial function after a recent myocardial infarction. Acta Cardiol 2000;55:9-15. induced apoptosis through activation of PI3 kinase/Akt. Circulation 2000;102:2873-79. requires early administration and is mediated via Akt and p70s6 kinase cell-survival signaling. Circ Res 2001;89:1191-98. 36. Matsui T, Tao J, del Monte F et al. Akt activation preserves cardiac function and prevents 37. Sack MN, Yellon DM. Insulin therapy as an adjunct to reperfusion after acute coronary injury after transient cardiac ischemia in vivo. Circulation 2001;104:330-335. ischemia: a proposed direct myocardial cell survival effect independent of metabolic modulation. J Am Coll Cardiol 2003;41:1404-7. 38. Diaz-Araya G, Nettle D, Castro P et al. Oxidative stress after reperfusion with primary coronary angioplasty: lack of effect of glucose-insulin-potassium infusion. Crit Care Med 2002;30:41721. 61 Metabolic interventions in acute myocardial infarction 62 GIK and left ventricular function Chapter 2.3 Preservation of myocardial function by glucose-insulin- potassium infusion as adjunct to primary angioplasty Iwan CC van der Horst, Jan Paul Ottervanger, Felix Zijlstra Critical Care Medicine 2004;32:906 63 Metabolic interventions in acute myocardial infarction To the editor: In 37 patients with acute myocardial infarction Castro and colleagues could not observe that high-dose glucose-insulin-potassium (GIK) infusion in adjunction to primary angioplasty did improve left ventricular ejection fraction (LVEF) and did not decrease the enzymatic infarct size.1 In the recently published Glucose-Insulin-Potassium-Study (GIPS) we randomized 940 patients to primary coronary angioplasty and GIK infusion or no infusion.2 As secondary endpoints we determined a left ventricular ejection fraction (LVEF) lower than 30%. LVEF was measured before discharge by radionuclide ventriculography using the multiple gated equilibrium method following the labeling of red blood cells of the patient with technetium-99m-pertechnate. When our results are compared with the Castro study (table 1) we suggest that GIK can induce a beneficial effect on myocardial function. We observed a LVEF <30% in 18% in the controls and in 12% in the GIK group (P=0.01). Finally, we also observed a relation between preservation of myocardial function and survival. By including more than 37 patients in their study possibly beneficial effects could have been observed. Table 1. Comparison of the Castro results and GIPS Characteristics GIPS Castro study GIK group Control group GIK group Control group 476 464 18 19 59.9±11.9 60.8±12.0 55±13 55.2±11 Men 351 (74) 368 (79) 13 (72) 15 (79) Hypertension 134 (28) 130 (28) 8 (44) 6 (32) Diabetes mellitus 50 (11) 49 (11) 3 (17) 1 (5) 3.3 3.3 3.6 4.3 Infarct location anterior 250 (53) 224 (49) 9 (50) 4 (21) Killip class 1 426 (90) 430 (93) 14 (77) 15 (78) Single-vessel disease 227 (48) 222 (48) 14 (77) 12 (63) TIMI 3 flow after PCI 459 (96) 435 (94) 16 (89) 17 (89) LVEF, % (mean±SD)* 43.7±11.0 42.4±11.7 38.9 43.7 23 (4.8) 27 (5.8) Number of patients Age, years (mean±SD) Time to angioplasty (hour) 30-day mortality Data are number (%) unless otherwise indicated. * LVEF denotes left ventricular ejection fraction. LVEF in the GIPS was determined before discharge i.e. after GIK infusion; the presented LVEF in the Castro study was determined before GIK infusion. 64 GIK and left ventricular function References 1. Castro PF, Larrain G, Baeza R et al. Effects of glucose-insulin-potassium solution on myocardial salvage and left ventricular function after primary angioplasty. Crit Care Med 2003;31:2152-55. 2. van der Horst IC, Zijlstra F, van't Hof AW et al. Glucose-insulin-potassium infusion in patients treated with primary angioplasty for acute myocardial infarction: the glucose-insulinpotassium study: a randomized trial. J Am Coll Cardiol 2003;42:784-91. 65 Metabolic interventions in acute myocardial infarction 66 GIK and ST segment elevation resolution Chapter 2.4 Electrocardiographic evidence of improved reperfusion after glucose-insulin-potassium infusion in patients treated with primary angioplasty for ST segment elevation myocardial infarction Iwan CC van der Horst, Giuseppe de Luca, Jan Paul Ottervanger, Menko-Jan de Boer, Jan CA Hoorntje, Harry Suryapranata, Jan-Henk E Dambrink, AT Marcel Gosselink, Felix Zijlstra, Arnoud WJ van ‘t Hof Submitted 67 Metabolic interventions in acute myocardial infarction Abstract Background To evaluate the impact of adjunctive high-dose glucose-insulin-potassium (GIK) on ST segment elevation resolution in patients with ST segment elevation myocardial infarction (MI). Methods As part of a randomized controlled trial about GIK versus no GIK in patients treated with primary percutaneous coronary intervention for ST segment elevation MI in a tertiary referral center, we analyzed ST segment elevation resolution. Paired electrocardiographic recordings (baseline and 3 hours after primary percutaneous coronary intervention) were available in 612 patients (65%) out of 940 patients. Results We analyzed paired electrocardiograms of 310 patients randomized to GIK and 302 control patients. Baseline characteristics of these groups were comparable. Combined complete (>70%) and partial (30-70%) resolution was more commonly observed in the GIK group (87%) when compared to the control group (78%), relative risk 1.72 (95% confidence interval 1.2-2.46, P<0.001). 1-year mortality was lower in patients with combined complete and partial resolution compared to patients without resolution (3.8% versus 10.3%, P=0.011). There was no difference in 1-year mortality between GIK and control patients (5.5% versus 4.3%, P=0.58). Conclusion In patients with ST segment elevation MI treated with primary percutaneous coronary intervention addition of GIK is associated with improved ST segment elevation resolution. ST segment elevation resolution is related to improved 1-year survival. No benefit of GIK on 1-year outcome was observed. Future trials should investigate whether GIK induced improvement of ST segment elevation resolution results in more favorable clinical outcome. 68 GIK and ST segment elevation resolution Introduction In patients with ST segment elevation myocardial infarction (MI) early resolution of ST segment elevation is a useful predictor of final infarct size, left ventricular function and clinical outcome after both thrombolytic and coronary interventional approaches.1-5 Primary percutaneous coronary intervention (PCI) results in a high proportion of patients with complete ST segment elevation resolution.6 Persistent ST segment elevation shortly after recanalization correlates with impaired myocardial reperfusion at the microcirculatory level and with further extension of myocardial damage.7 Impaired microvascular reperfusion, as defined by non-complete ST segment elevation resolution, may occur in up to 33% of patients with ST segment elevation MI, especially in older patients with low systolic pressure.8 In patients with Thrombolysis In Myocardial Infarction (TIMI) grade 3 flow after primary PCI, failed microvascular reperfusion, defined as impaired ST segment elevation resolution, peak creatine kinase levels after 12 hours, and T-wave inversion after 24 hours, is associated with poor outcome at 1 year.9 A beneficial effect of a glucoseinsulin-potassium (GIK) infusion on electrocardiographic signs of myocardial infarction (MI) has been suggested in experimental studies.10-15 In the Estudios Cardiologicos Latinoamerica (ECLA) pilot trial an beneficial effect of GIK on mortality was observed primarily in the subgroup of patients in which GIK was combined with thrombolysis (5.2% in GIK patients versus 15.2% in control patients, P=0.01).16 Recently, in the Reevaluation of Intensified Venous Metabolic Support for Acute Infarct Size Limitation (REVIVAL) trial with 312 MI patients treated with primary PCI, GIK did not result in a significant difference in mortality after 6 months (5.8% in the GIK group versus 6.4% in the control group, P=0.85).17 In the Glucose-Insulin-Potassium Study (GIPS) patients with ST segment elevation MI were randomly assigned to either a high-dose GIK infusion or no infusion in adjunction to primary PCI.18 30-Day mortality did not differ significantly between GIK and control patients (4.8% versus 5.8%, P=0.50). In an additional analysis of this trial, we investigated the effect of GIK on ST segment elevation resolution, and re-evaluated the relation between ST segment elevation resolution and 1year mortality in patients enrolled in a randomized controlled trial.18 Methods Patients Between April 1998 and September 2001, 940 patients with symptoms consistent with acute MI of >30 min duration, presenting within 24 hours after the onset of symptoms and with a ST segment elevation of more than 1 mm (0.1 mV) in two or more contiguous leads on the electrocardiogram were included in the GIPS. The exact details of the trial 69 Metabolic interventions in acute myocardial infarction protocol have been previously described.18 In short, a total of 940 patients were randomly assigned to either GIK infusion (N=476) or no infusion (N=464). Patients presented at our center as well as patients referred for treatment of high-risk MI, from nine referring hospitals without facilities to perform coronary interventions, were included. Assignments to the groups were made with a computerized randomization program. In the GIK group, a continuous infusion of 80 mmol potassium chloride in 500 mL 20% glucose with a rate of 3 mL/kg body weight/hour over an 8-12 hour period in a peripheral venous line was given. A continuous infusion of short-acting insulin (50 units Actrapid HM (Novo Nordisk, Copenhagen, Denmark) in 50 mL 0.9% sodium chloride was also started with the use of a pump (Perfusor-FM, B. Braun, Melsungen, Germany). Baseline insulin-infusion dose and hourly adjustments of the insulin dose were based on an algorithm, to obtain blood glucose levels between 7.0 and 11.0 mmol/L, based on measurements of whole-blood glucose (Modular System, Roche/Hitachi, Basel, Switzerland). GIK infusion was started 15 to 20 minutes after admission. Average door to balloon time was 45 minutes in the GIK group and 48 minutes in the control group.18 Protocol Primary PCI was performed with standard techniques if the coronary anatomy was suitable for PCI. Angiographic successful reperfusion was defined as TIMI flow grade 3, in combination with a myocardial blush grade 2 or 3. Additional standard treatment consisted of nitroglycerin intravenously, and aspirin 500 mg intravenously or 300 mg orally. During PCI 10000 IU heparin was administered as bolus. Low molecular weight heparin was given for 24 hours after sheath removal. Standard therapies after PCI included aspirin 80 mg and/or clopidogrel 75 mg in all patients that received a stent. Betablockers, lipid lowering agents and angiotensin converting enzyme inhibitors or angiotensin II receptor blockers were used according to current international guidelines.19;20 Whenever possible, patients remained in our hospital at least 24 hours before they were transferred back to a referring hospital. When no Coronary Care Unit bed was available, immediate transfer after PCI was arranged. Follow-up data were collected up to 18 months after randomization via the register office, the General Practitioner, or by direct contact with the patients or their relatives by telephone. The research protocol was reviewed and approved by the medical ethics committee of our hospital, and patients were included after informed consent. Measurements Electrocardiographic (ECG) recordings were obtained on admission to the hospital (first ECG), and in the coronary-care unit (second ECG) 3 hours after PCI. All ECGs were 70 GIK and ST segment elevation resolution analyzed as pairs by an independent core lab (Diagram BV, Zwolle, The Netherlands) and graded for ST segment elevation resolution by 2 investigators who were unaware of the clinical data, randomization, angiographic findings, and outcome data. The investigators analyzed the ECGs independently and when disagreements did exist, a third investigator graded the ST segment elevation resolution. The investigators were not blinded to the sequence. The sum of ST segment elevation was measured 20 ms after the end of the QRS complex in leads I, aVL, and V1–V6 for anterior, and leads II, III, aVF, and V5–V6 for non-anterior myocardial infarction. ST segment elevation resolution was defined as complete (>70% resolution), partial (30-70% resolution) or no resolution (<30% resolution). In this analysis only patients of whom paired ECG recordings were available were included. Statistical analysis All analyses concerning potential effects of GIK were by intention to treat. Differences between group means at baseline were assessed with the two-tailed Student’s t-test. Chisquare analysis or Fisher’s exact test was used to test differences between proportions. Survival was calculated by the Kaplan-Meier product-limit method. The Log-rank test was used to evaluate differences in survival curves between the two treatment groups. The Cox proportional-hazards regression model was used to calculate relative risks adjusted for differences in baseline characteristics. To predict the independent association between treatment with GIK and ST segment elevation resolution, a multivariate logistic regression analysis was performed. Statistical significance was considered a two-tailed P-value <0.05. The Statistical Package for the Social Sciences (SPSS Inc., Chicago, IL, USA) version 11.5 was used for all statistical analysis. Results Of 940 patients enrolled in the GIPS, data on ST segment elevation resolution were available in 310 patients (65%) randomized to GIK and 302 patients (65%) in the control group. For patients with (transient) bundle branch block (N=56), external pacemaker or AIVR (N=63), technical inadequate recordings (N=47), patients who died during primary PCI (N=2), patients who were transferred to a referring hospital immediately after PCI (N=138), and miscellaneous reasons (N=22) data were lacking. The baseline characteristics of patients included in this analysis and the excluded patients are presented in table 1. The included patients were less often referred from other hospitals (35% versus 51%), had less often signs of heart failure at admission (Killip class 1 patients 93% versus 88%), and were more often treated with PCI (96% versus 83%). 71 Metabolic interventions in acute myocardial infarction Table 1. Baseline characteristics of the patients with paired ECG recordings (included patients) and patients without paired ECG recordings (excluded patients) Characteristics Included patients Excluded patients 612 328 60±12 61±12 Men 472 (77) 247 (75) Referred patients# 216 (35) 166 (51) Previous MI 61 (10) 44 (13) Previous PCI 26 (4.2) 20 (6.1) Previous CABG 17 (2.8) 9 (2.7) History of stroke 23 (3.8) 9 (2.7) Diabetes mellitus 63 (10) 36 (11) Hypertension 162 (27) 102 (31) Dyslipidemia 123 (20) 66 (20) Currently smoker 304 (50) 158 (48) Positive family history 248 (41) 126 (38) Time to admission, min (IQR)* 145 (104-215) 161 (110-240) Door to balloon time, min (IQR) 50 (35-69) 38 (19-58) 569 (93) 287 (88) 43 (7) 41 (12) Anterior MI 293 (48) 181 (55) Multi-vessel disease 312 (51) 179 (55) PCI 588 (96) 273 (83) Stent** 336 (55) 155 (47) GP IIb/IIIa receptor blocker** 130 (21) 74 (23) In-hospital CABG† 11 (1.8) 27 (8.2) TIMI 3 flow after PCI 585 (96) 309 (94) Successful reperfusion* 513 (84) 265 (81) Intra-aortic balloon pump 41 (6.7) 46 (14) Mechanical ventilation 6 (1.0) 10 (3.0) Number of patients Age, years (mean±SD) Killip class 1 Killip class ≥2 Data are number (%) unless otherwise indicated. MI = myocardial infarction. IQR = interquartile range. PCI = percutaneous coronary intervention. CABG = coronary artery bypass grafting. #Referred patients denotes MI patients referred from hospitals without facilities to perform coronary interventions. *Time to admission denotes time between onset of symptoms and until admission. †In-hospital CABG = CABG defined as patients treated initially conservative, followed by elective CABG within 7 days. ‡Successful reperfusion denotes TIMI 3 flow and blush grade 2 or 3. **Percentage defined as the percentage of the patients that underwent PCI. 72 GIK and ST segment elevation resolution ST segment elevation resolution and outcome In 372 patients (60.8%) complete ST segment elevation resolution was observed, partial resolution in 133 patients (22%) and no resolution in 107 patients (17.5%). Baseline characteristics of the 3 groups are presented in table 2. No complete ST segment elevation resolution was more often observed in patients with anterior infarction location, previous MI or diabetes mellitus, and Killip class >1 at admission. Figure 1. ST segment elevation resolution and 1-year mortality 100 Survival (%) 90 Complete resolution 80 Partial resolution No resolution 0 0 100 200 300 Time after randomization (days) Log-rank test P-value is 0.014. ST segment elevation resolution was related to left ventricular function. Prevalence of left ventricular ejection fraction (LVEF) <30% was 11.8% in patients with complete ST segment elevation resolution, compared to 20.3% in those with partial or no resolution (P<0.01). Mortality after 1-year was 3.5% with complete and 4.5% with partial ST segment elevation resolution compared to 10.3% with no ST segment elevation resolution (P=0.016). 1-year mortality was lower in patients with combined complete and partial resolution compared to patients with no ST segment elevation resolution (3.8% versus 10.3%, P=0.011). Figure 1 represents the relation between ST segment elevation resolution and 1-year mortality (P= 0.014 using the Log-rank test). 73 Metabolic interventions in acute myocardial infarction ST segment elevation resolution and GIK Baseline characteristics were comparable between the 2 groups (table 3). A total of 299 patients (96%) in the GIK group and 289 (96%) in the control group underwent primary PCI (table 4). No difference was observed in procedural success and myocardial blush grades. The prevalence of ST segment elevation resolution was higher in patients treated with GIK. Complete ST segment elevation resolution was observed in 198 patients (64%) treated with GIK versus 174 patients (58%) in the control group (table 5). Partial ST segment elevation resolution was observed in 72 patients (23%) treated with GIK versus 61 patients (20%) in the control group. Combined complete and partial resolution was more commonly observed in the GIK group (87%) when compared to the control group (78%), relative risk 1.72 (1.2-2.46, P<0.01). No ST segment elevation resolution was observed in 40 patients (13%) in the GIK group compared to 67 patients (22%) in the control group, relative risk (RR) 0.58 (95% confidence interval 0.39-0.81, P<0.01). A total of 30 patients (4.9%) out of 612 patients died after 1-year. There were 2 patients lost to follow-up. No difference in mortality was observed between the two groups (5.5% versus 4.3%, P=0.58). Table 2. Comparison of patients with complete, partial and no ST segment elevation resolution Characteristics Complete resolution Partial resolution No resolution 372 133 107 59±12 60±11 64±11 Men 290 (78) 107 (81) 75 (70) Diabetes mellitus 27 (7.3) 22 (17) 14 (13) Hypertension 97 (26) 35 (26) 30 (28) Killip class 1 349 (94) 126 (95) 94 (88) Anterior MI 159 (43) 76 (57) 58 (54) Successful reperfusion* 326 (88) 107 (81) 80 (75) 30-day mortality 10 (2.7) 3 (2.3) 9 (8.4) LVEF ≤30% 40 (11.8) 22 (18.3) 21 (22.8) 1-year mortality 13 (3.5) 6 (4.5) 11 (10.3) Number of patients Age, years (mean±SD) Data are number (%) unless otherwise indicated. MI = myocardial infarction. LVEF = Left ventricular ejection fraction. *Successful reperfusion denotes TIMI 3 flow and blush grade 2 or 3. 74 GIK and ST segment elevation resolution Discussion This is the first study showing that adjunction of GIK to primary PCI for ST segment elevation MI results in improved resolution of ST segment elevation. We also observed that partial or complete ST segment elevation resolution was related to a favorable 1-year outcome compared to patients with no resolution. However, we could not demonstrate a direct relation between GIK and improved outcome. This analysis did not have the power to assess the effects on mortality. We therefore only can hypothesize that GIK may be beneficial by inducing ST segment elevation resolution, as a reflection of improved myocardial reperfusion. We could not detect a relation between infusion of GIK and myocardial blush grade, an angiographic parameter that reflects myocardial reperfusion.7 This may be related to the very short interval between epicardial patency and assessment of myocardial blush grade. Studies with continuous ST segment monitoring have shown that it takes sometime before myocardial perfusion is reestablished.16;34 We defined successful reperfusion as the combination of TIMI 3 flow after PCI and blush grade 2 or 3 and there was no difference in the rate of successful PCI between the GIK and control patients. Table 3. Baseline characteristics of the patients with paired ECG recordings Characteristics GIK group Control group 310 302 59±12 61±12 Men 230 (74) 242 (80) Referred patients# 118 (38) 98 (33) Previous MI 30 (9.7) 31 (10.3) Previous PCI 12 (3.9) 14 (4.6) Previous CABG 9 (2.9) 8 (2.6) History of stroke 14 (4.5) 9 (3.0) Diabetes mellitus 32 (10) 31 (10) Hypertension 78 (25) 84 (28) Dyslipidemia 94 (20) 95 (21) Currently smoker 152 (49) 152 (50) Positive family history 195 (41) 179 (39) Number of patients Age, years (mean±SD) Data are number (%) unless otherwise indicated. MI = myocardial infarction. IQR = interquartile range. PCI = percutaneous coronary intervention. CABG = coronary artery bypass grafting. #Referred patients denotes MI patients referred from hospitals without facilities to perform coronary interventions. 75 Metabolic interventions in acute myocardial infarction ST segment elevation resolution Primary PCI results in optimal epicardial recanalization in a large majority of patients. Nevertheless, it has been shown that myocardial perfusion may be suboptimal in a relevant percentage of patients. ST elevation segment elevation resolution is a cheap and user-friendly method to evaluate myocardial perfusion. In an animal study the relation between ST segment elevation and regional myocardial blood flow both 15 minutes and 24 hour after coronary occlusion was demonstrated.21 Several clinical studies have described the relation between electrocardiographic changes after the start of thrombolytic therapy and patency of the infarct-related vessel at follow-up coronary angiography.22;23 Table 4. Infarct characteristics, hemodynamic status and primary reperfusion treatment Characteristics GIK group Control group 310 302 Anterior MI 155 (50) 138 (46) Killip class 1 284 (92) 285 (94) 26 (8) 17 (6) Systolic BP, mmHg (mean±SD) 131±21 129±25 Diastolic BP, mmHg (mean±SD) 78±15 76±17 Heart rate, beats/min (mean±SD) 74±16 79±20 Time to admission, min (IQR)* 135 (99-210) 150 (105-240) Door to balloon time, min (IQR) 49 (34-68) 51 (35-70) Multi-vessel disease 162 (52) 150 (48) PCI 299 (97) 289 (96) Stent ** 178 (57) 158 (52) GP IIb/IIIa receptor blocker ** 62 (20) 68 (23) In-hospital CABG† 5 (1.6) 6 (2.0) TIMI 3 flow after PCI 301 (97) 284 (94) Successful reperfusion* 260 (84) 253 (84) Intra-aortic balloon pump 20 (6.5) 21 (7.0) Number of patients Killip class ≥2 Data are number (%) unless otherwise indicated. MI = myocardial infarction. BP = blood pressure. IQR = interquartile range. PCI = percutaneous coronary intervention. CABG = coronary artery bypass grafting. *Time to admission denotes time between onset of symptoms and until admission. **Percentage defined as the percentage of the patients that underwent PCI. †In-hospital CABG = CABG defined as patients treated initially conservative, followed by elective CABG within 7 days. ‡Successful reperfusion denotes TIMI 3 flow and blush grade 2 or 3. 76 GIK and ST segment elevation resolution Although complete ST segment elevation resolution predicts an open infarct artery reasonably well, the absence of ST segment elevation resolution gives no information about patency.24 It has been shown that the ECG will not predict infarct-vessel patency in many patients, as almost half of the patients with persistent ST segment elevation had an open epicardial vessel with TIMI 3 flow.6 ST segment changes after reperfusion therapy may, therefore, reflect myocardial flow rather than epicardial flow and predict clinical outcome better than epicardial vessel patency alone in patients treated with thrombolytic therapy5;25, and primary PCI.6 Table 5. Comparison of patients with complete, partial and no ST segment elevation resolution, according to treatment with GIK GIK group P for trend Control group Number of patients 310 <0.001 302 Complete resolution 198 (64) 174 (58) Partial resolution 72 (23) 61 (20) No resolution 40 (13) 67 (22) Data are number (%). Resolution denotes resolution of the ST segment elevation. GIK and ST segment elevation resolution In several animal studies the effect of GIK on ST segment elevation resolution was investigated. In dogs developing myocardial ischemia, GIK decreased epicardial ST segment elevation.12 Decreased epicardial ST segment elevation correlates with a reduction in the degree of eventual myocardial creatine kinase depletion and the reduction in the histologic severity of myocardial necrosis.26 One study found that GIK induced metabolic changes, such as reduced myocardial sodium and water and increased lactate, were associated with decreased ST segment elevation, especially in the periinfarct zone.10 Another study showed that the infusion of GIK was associated with a decrease in arterial plasma concentration of free fatty acids, a decrease in uptake of free fatty acids, and a decreased degree of ST segment elevation.11 An effect that was not observed in contols treated with saline. In 32 ST segment elevation MI patients were treated with reteplase and alternately assigned to either GIK or saline with potassiumchloride that ST segment elevation resolution at 90 minutes was >50% in 82% of the GIK patients versus 62% in control patients (NS).15 Our results confirm these observations: GIK results in a higher number of patients with partial or complete ST segment elevation resolution. 77 Metabolic interventions in acute myocardial infarction Table 6. 30-day mortality in patients treated with high-dose GIK and low-dose GIK versus control patients of published trials Included patient Trial (ref) 30-day mortality GIK patients Control patients GIK patients Control patients N N N (%) N (%) Heng 12 15 1 (8.3) 0 (-) Stanley35 55 55 4 (7.3) 4 (7.3) Rogers34 61 73 4 (6.5) 9 (12.3) Satler37 10 7 0 (-) 0 (-) 135 139 10 (7.4) 16 (11.5)* 28 16 ECLA * 18 476 464 23 (4.8) 27 (5.8) REVIVAL17 155 157 7 (4.5) 5 (3.2) Total (high-dose) 904 910 49 (5.4) 61 (6.7) Mittra 85 85 10 (11.8) 24 (23.5) Pilcher33 49 53 6 (6.7) 12 (22.7) 100 100 15 (15.0) 16 (16.0) GIPS 31 32 Pentecost 30 MRC 480 488 103 (21.5) 115 (23.6) Hjermann 29 104 100 11 (9.6) 20 (20) 16 133 139 10 (7.5) 16 (11.5)* ECLA * P 0.30 36 Pol-GIK 494 460 44 (8.9) 22 (4.8) Total (low-dose) 1445 1425 199 (13.8) 225 (15.8) 0.14 Total (all) 2349 2196 248 (10.6) 270 (12.3) 0.07 Data are number or number (%). Ref denotes reference. N denotes number of patients. ECLA = Estudios Cardiologicos Latinoamerica. GIPS = Glucose-Insulin-Potassium Study. REVIVAL = Reevaluation of Intensified Venous Metabolic Support for Acute Infarct Size Limitation. Pol-GIK = Polish Glucose Insulin Potassium. *In both comparisons the same control group is used; in the total of all patients this groups is accounted for once. GIK and clinical outcome The effect of GIK on 30-day mortality in ST segment elevation MI has been investigated by several clinical trials.16-18;27-37 An overview of the results of published trials (October 2004) is presented in table 6. Taken the results of all these trials together no significant beneficial effect on 30-day mortality is observed, mortality in GIK patients is 10.6% versus 12.3% in control patients (P=0.07). Care has to be taken since the individual trials differed in design. Trials used GIK in several doses and for different length of time. A few studies used GIK in combination with appropriate reperfusion therapy.16-18;37 When the results of these trials are analyzed separately, 30-day mortality is 4.8% in GIK patients compared to 6.2% in control patients (P=0.27). The study by Satler and colleagues and the ECLA used thrombolysis as reperfusion therapy. In the first trial only 17 patients were included and 78 GIK and ST segment elevation resolution no one had died after 30-days. In the ECLA the observed effect in the sub-group of patients treated primarily with thrombolysis the mortality rate in GIK patients was 5.2% versus 15.2% in control patients (P=0.01) GIK in these patients seems promising, albeit that this observation comes from a sub-group of a pilot trial in which the mortality rate in the control group was high. The GIPS and REVIVAL treated patients primarily with primary PCI.17;18 After 30-days the mortality rates in GIK and control patients was almost similar. New trials as the ECLA GIK 2/CREATE trial, the Organization to Assess Strategies for Ischemic Syndromes (OASIS)-6 trial and GIPS-2 currently randomize thousands of patients to GIK or no GIK in adjunction to either thrombolysis and primary PCI. These trials will determine whether GIK is of clinical benefit in combination with different reperfusion strategies. GIK and time to reperfusion Based on the results of an experimental study it has been estimated that treatment with GIK has the potential to protect ischemic myocardium before reperfusion for 10 hours or even longer.38 Two studies in Sprague-Dawley rats found that GIK can preserve the ischemic myocardium when started at reperfusion or even after reperfusion.39;40 The first study observed that GIK treatment started at the onset of reperfusion reduced infarct size to the same extent as GIK started throughout ischemia and reperfusion.39The other showed that after 20 minutes of global ischemia contractile function was improved. 40 In our study the time between admission and reperfusion averaged 45 minutes. The infusion of GIK was started up to 30 minutes before PCI. We did not record the exact time of start of the infusion and therefore did not perform additional analysis on the relation of the time of infusion and ST segment elevation resolution. It can be suggested that GIK is likely to have the most effect when started as soon as possible. However based on experimental results, GIK may still induce favourable effects when started during or after reperfusion. Mechanisms of action of GIK There are several potential mechanisms of the effects of GIK in the treatment of acute myocardial infarction.41 An important mechanism is the effect on substrate metabolism. GIK induces a decrease in myocardial uptake of free fatty acids, and reduces the amount of circulating free fatty acids and promotes the use of glucose as primary myocardial energy substrate.42;43 Insulin may be the principle component of this therapy. It has been demonstrated that hyperinsulinemia can increase coronary blood flow in patients with significant coronary artery disease.38 Even a small increase in myocardial blood flow can reduce myocardial ischemia.44 The vasodilative effects of insulin on coronary arteries are probably similar in patients with and without diabetes mellitus.45;46 The observed relation between GIK infusion and ST segment elevation resolution in our trial, i.e. microvascular 79 Metabolic interventions in acute myocardial infarction reperfusion, support this concept. GIK infusion also resulted in an improvement of regional myocardial perfusion and function mainly in segments adjacent to the infarcted area as determined with technetium-99m-tetrofosmin-gated SPECT.47 Finally, insulin promotes tolerance against ischemic cell death via the activation of innate cell-survival pathways in the heart.48 Study limitations Paired ECGs were available in only 65% of patients enrolled in the GIPS, due to various reasons. Nevertheless, the groups were well-matched, and our analysis has adequate statistical power. We performed a post-hoc analysis and our findings should be confirmed in future prospective studies. Quantitative ST segment evaluation may be more accurate, but recent post-hoc data from the Controlled Abciximab and Device Investigation to Lower Late Angioplasty Complications (CADILLAC) trial have reconfirmed the usefulness of visual grading in 3 categories.49 Grading of ST segment elevation resolution at a fixed period of time after reperfusion therapy, in our study 3 hours, may have limitations. Myocardial reperfusion is a dynamic process during which alternating episodes of ST segment elevation resolution may occur.50 Fluctuation of the ST segment has been described during or shortly after thrombolysis and primary PCI, and continuous ST segment monitoring has shown to be a valid alternative.50;51 Additional treatment with medication could influence early reperfusion and ST segment elevation resolution. We did not record the time concomitant medication was started. Aspirin, heparin and nitroglycerin were started early after admission. Clopidogrel was given to patients who received a stent. However, there were no differences in pharmacotherapy between GIK patients and controls (table 7). Table 7. Additional treatment at hospital discharge according to treatment group Medication GIK group Control group Aspirin 421 (88.4) 398 (85.8) Clopidogrel 194 (40.8) 192 (41.4) Coumarins 36 (7.6) 45 (9.7) Beta-blockers 392 (82.3) 381 (82.1) ACE-inhibitors 245 (51.5) 244 (52.6) AII receptor antagonists 7 (15) 3 (0.6) 15 (3.2) 19 (4.1) Diuretics 46 (9.7) 67 (14.4) Nitrates 70 (14.7) 67 (14.4) Statins 285 (51.3) 271 (48.7) Calcium channel blockers Data are number (%). 80 GIK and ST segment elevation resolution Conclusion In patients with ST segment elevation MI, addition of GIK to primary PCI is associated with improved ST segment elevation resolution. ST segment elevation resolution is related to improved 1-year survival. A significant benefit of GIK on 1-year outcome was not observed. Contributors This study was supported by a generous grant from the Netherlands Heart Foundation (99.028). No other conflicts of interest or financial disclosure. References 1. De Lemos JA, Braunwald E. ST segment resolution as a tool for assessing the efficacy of reperfusion therapy. J Am Coll Cardiol 2001;38:1283-94. 2. Pepine CJ. Prognostic markers in thrombolytic therapy: looking beyond mortality. Am J Cardiol 1996;78:24-27. 3. Cooper HA, De Lemos JA, Morrow DA et al. Minimal ST segment deviation: a simple, noninvasive method for identifying patients with a patent infarction-related artery after fibrinolytic administration. Am Heart J 2002;144:790-795. 4. Saran RK, Been M, Furniss SS, Hawkins T, Reid DS. Reduction in ST segment elevation after thrombolysis predicts either coronary reperfusion or preservation of left ventricular function. Br Heart J 1990;64:113-17. 5. Schroder R, Dissmann R, Bruggemann T et al. Extent of early ST segment elevation resolution: a simple but strong predictor of outcome in patients with acute myocardial infarction. J Am Coll Cardiol 1994;24:384-91. 6. van 't Hof AW, Liem A, de Boer MJ, Zijlstra F. Clinical value of 12-lead electrocardiogram after successful reperfusion therapy for acute myocardial infarction. Zwolle Myocardial infarction Study Group. Lancet 1997;350:615-19. 7. van 't Hof AW, Liem A, Suryapranata H, Hoorntje JC, de Boer MJ, Zijlstra F. Angiographic assessment of myocardial reperfusion in patients treated with primary angioplasty for acute myocardial infarction: myocardial blush grade. Zwolle Myocardial Infarction Study Group. Circulation 1998;97:2302-6. 8. Claeys MJ, Bosmans J, Veenstra L, Jorens P, De R, Vrints CJ. Determinants and prognostic implications of persistent ST segment elevation after primary angioplasty for acute myocardial infarction: importance of microvascular reperfusion injury on clinical outcome. Circulation 1999;99:1972-77. 9. Corbalan R, Larrain G, Nazzal C et al. Association of noninvasive markers of coronary artery reperfusion to assess microvascular obstruction in patients with acute myocardial infarction treated with primary angioplasty. Am J Cardiol 2001;88:342-46. 81 Metabolic interventions in acute myocardial infarction 10. Dalby AJ, Bricknell OL, Opie LH. Effect of glucose-insulin-potassium infusions on epicardial ECG changes and on myocardial metabolic changes after coronary artery ligation in dogs. Cardiovasc Res 1981;15:588-98. 11. Haneda T, Ganz W, Burnam MH, Katz J. Metabolic effects of glucose-insulin-potassium in the 12. Opie LH, Owen P. Effect of glucose-insulin-potassium infusions on arteriovenous differences ischemic myocardium. Jpn Heart J 1978;19:376-82. of glucose of free fatty acids and on tissue metabolic changes in dogs with developing myocardial infarction. Am J Cardiol 1976;38:310-321. 13. Ueno T, Ishiyama T, Morita Y, Hatanaka Y, Azuma J. An experimental study of the effect of glucose-insulin-potassium solution on energy metabolism of infarcted cardiac muscle. Recent Adv Stud Cardiac Struct Metab 1976;11:549-54. 14. Sodi-Pallares D, Testelli MR, Fishleder BL et al. Effects of an intravenous infusion of a potassium-glucose-insulin solution on the electrocardiographic signs of myocardial infarction. A preliminary clinical report. Am J Cardiol 1962;9:166-81. 15. Chaudhuri A, Janicke D, Wilson MF et al. Anti-inflammatory and profibrinolytic effect of 16. Diaz R, Paolasso EA, Piegas LS et al. Metabolic modulation of acute myocardial infarction. insulin in acute ST segment-elevation myocardial infarction. Circulation 2004;109:849-54. The ECLA (Estudios Cardiologicos Latinoamerica) Collaborative Group. Circulation 1998;98:2227-34. 17. Pache J, Kastrati A, Mehilli J et al. A randomized evaluation of the effects of glucose-insulinpotassium infusion on myocardial salvage in patients with acute myocardial infarction treated with reperfusion therapy. Am Heart J 2004;148:105. 18. van der Horst IC, Zijlstra F, van't Hof AW et al. Glucose-insulin-potassium infusion in patients treated with primary angioplasty for acute myocardial infarction: the glucose-insulinpotassium study: a randomized trial. J Am Coll Cardiol 2003;42:784-91. 19. Ryan TJ, Antman EM, Brooks NH et al. 1999 update: ACC/AHA Guidelines for the Management of Patients With Acute Myocardial Infarction: Executive Summary and Recommendations: A report of the American College of Cardiology/American Heart Association Task Force on Practice Guidelines (Committee on Management of Acute Myocardial Infarction). Circulation 1999;100:1016-30. 20. Van de Werf F, Ardissino D, Betriu A et al. Management of acute myocardial infarction in patients presenting with ST segment elevation. The Task Force on the Management of Acute Myocardial Infarction of the European Society of Cardiology. Eur Heart J 2003;24:28-66. 21. Heng MK, Singh BN, Norris RM, John MB, Elliot R. Relationship between epicardial ST segment elevation and myocardial ischemic damage after experimental coronary artery occlusion in dogs. J Clin Invest 1976;58:1317-26. 22. Klootwijk P, Langer A, Meij S et al. Non-invasive prediction of reperfusion and coronary artery patency by continuous ST segment monitoring in the GUSTO-I trial. Eur Heart J 1996;17:68998. 23. Clemmensen P, Ohman EM, Sevilla DC et al. Changes in standard electrocardiographic ST segment elevation predictive of successful reperfusion in acute myocardial infarction. Am J Cardiol 1990;66:1407-11. 82 GIK and ST segment elevation resolution 24. Califf RM, O'Neil W, Stack RS et al. Failure of simple clinical measurements to predict 25. Barbash GI, Roth A, Hod H et al. Rapid resolution of ST elevation and prediction of clinical perfusion status after intravenous thrombolysis. Ann Intern Med 1988;108:658-62. outcome in patients undergoing thrombolysis with alteplase (recombinant tissue-type plasminogen activator): results of the Israeli Study of Early Intervention in Myocardial Infarction. Br Heart J 1990;64:241-47. 26. Maroko PR, Kjekshus JK, Sobel BE et al. Factors influencing infarct size following experimental coronary artery occlusions. Circulation 1971;43:67-82. 27. Fath-Ordoubadi F, Beatt KJ. Glucose-insulin-potassium therapy for treatment of acute myocardial infarction: an overview of randomized placebo-controlled trials. Circulation 1997;96:1152-56. 28. Heng MK, Norris RM, Singh BN, Barratt-Boyes C. Effects of glucose and glucose-insulinpotassium on haemodynamics and enzyme release after acute myocardial infarction. Br Heart J 1977;39:748-57. 29. Hjermann I. A controlled study of peroral glucose, insulin and potassium treatment in 30. Medical Research Council Working Party on the Treatment of Myocardial Infarction. myocardial infarction. Acta Med Scand 1971;190:213-18. Potassium, glucose, and insulin treatment for acute myocardial infarction. Lancet 1968;2:1355-60. 31. Mittra B. Potassium, glucose, and insulin in treatment of myocardial infarction. Lancet 1965;2:607-9. 32. Pentecost BL, Mayne NM, Lamb P. Controlled trial of intravenous glucose, potassium, and 33. Pilcher J, Etishamudin M, Exon P, Moore J. Potassium, glucose and insulin in myocardial insulin in acute myocardial infarction. Lancet 1968;1:946-48. infarction. Lancet 1967;1:1109. 34. Rogers WJ, Stanley AW, Jr., Breinig JB et al. Reduction of hospital mortality rate of acute 35. Stanley AW, Jr., Prather JW. Glucose-insulin-potassium, patient mortality and the acute 36. Ceremuzynski L, Budaj A, Czepiel A et al. Low-dose glucose-insulin-potassium is ineffective in myocardial infarction with glucose-insulin-potassium infusion. Am Heart J 1976;92:441-54. myocardial infarction: results from a prospective randomised study. Circulation 1978;57:61. acute myocardial infarction: results of a randomized multicenter Pol-GIK trial. Cardiovasc Drugs Ther 1999;13:191-200. 37. Satler LF, Green CE, Kent KM, Pallas RS, Pearle DL, Rackley CE. Metabolic support during 38. Eberli FR, Weinberg EO, Grice WN, Horowitz GL, Apstein CS. Protective effect of increased coronary reperfusion. Am Heart J 1987;114:54-58. glycolytic substrate against systolic and diastolic dysfunction and increased coronary resistance from prolonged global underperfusion and reperfusion in isolated rabbit hearts perfused with erythrocyte suspensions. Circ Res 1991;68:466-81. 39. Jonassen AK, Aasum E, Riemersma RA, Mjos OD, Larsen TS. Glucose-insulin-potassium reduces infarct size when administered during reperfusion. Cardiovasc Drugs Ther 2000;14:615-23. 83 Metabolic interventions in acute myocardial infarction 40. Angelos MG, Murray HN, Gorsline RT, Klawitter PF. Glucose, insulin and potassium (GIK) during reperfusion mediates improved myocardial bioenergetics. Resuscitation 2002;55:32936. 41. Apstein CS. Increased glycolytic substrate protection improves ischemic cardiac dysfunction 42. McDaniel HG, Papapietro SE, Rogers WJ et al. Glucose-insulin-potassium induced alterations and reduces injury. Am Heart J 2000;139:S107-S114. in individual plasma free fatty acids in patients with acute myocardial infarction. Am Heart J 1981;102:10-15. 43. Rackley CE, Russell RO, Jr., Rogers WJ, Mantle JA, McDaniel HG, Papapietro SE. Clinical experience with glucose-insulin-potassium therapy in acute myocardial infarction. Am Heart J 1981;102:1038-49. 44. Apstein CS, Deckelbaum L, Mueller M, Hagopian L, Hood WB, Jr. Graded global ischemia and 45. McNulty PH, Pfau S, Deckelbaum LI. Effect of plasma insulin level on myocardial blood flow 46. Sundell J, Laine H, Nuutila P et al. The effects of insulin and short-term hyperglycaemia on reperfusion. Cardiac function and lactate metabolism. Circulation 1977;55:864-72. and its mechanism of action. Am J Cardiol 2000;85:161-65. myocardial blood flow in young men with uncomplicated Type I diabetes. Diabetologia 2002;45:775-82. 47. Marano L, Bestetti A, Lomuscio A et al. Effects of infusion of glucose-insulin-potassium on 48. Sack MN, Yellon DM. Insulin therapy as an adjunct to reperfusion after acute coronary myocardial function after a recent myocardial infarction. Acta Cardiol 2000;55:9-15. ischemia: a proposed direct myocardial cell survival effect independent of metabolic modulation. J Am Coll Cardiol 2003;41:1404-7. 49. McLaughlin MG, Stone GW, Aymong E et al. Prognostic utility of comparative methods for assessment of ST segment resolution after primary angioplasty for acute myocardial infarction: the Controlled Abciximab and Device Investigation to Lower Late Angioplasty Complications (CADILLAC) trial. J Am Coll Cardiol 2004;44:1215-23. 50. Shah PK, Cercek B, Lew AS, Ganz W. Angiographic validation of bedside markers of 51. Krucoff MW, Croll MA, Pope JE et al. Continuous 12-lead ST segment recovery analysis in the reperfusion. J Am Coll Cardiol 1993;21:55-61. TAMI 7 study. Performance of a noninvasive method for real-time detection of failed myocardial reperfusion. Circulation 1993;88:437-46. 84 GIK and metabolic derangements Chapter 2.5 Glucose and potassium derangements by glucose-insulinpotassium infusion related to 1-year mortality in acute myocardial infarction Iwan CC van der Horst, Jorik R Timmer, Jan Paul Ottervanger, Henk JG Bilo, Kor Miedema, Rijk OB Gans, Menko-Jan de Boer, Maarten WN Nijsten, Felix Zijlstra Submitted 85 Metabolic interventions in acute myocardial infarction Abstract Background Infusion of high-dose glucose-insulin-potassium infusion (GIK) appears to be beneficial in acute myocardial infarction (MI). It has been shown that GIK induces derangement in systemic glucose and potassium levels. We thought to investigate the effect of metabolic derangements on outcome in MI patients. Methods Patients with signs and symptoms of ST segment elevation MI and treated with primary percutaneous coronary intervention (PCI) were randomized to no infusion or high-dose GIK, i.e. 80 mmol potassium chloride in 500 mL 20% glucose with a rate of 3 mL/kg/hour and 50 units short-acting insulin in 50 mL 0.9% sodium chloride for 12 hours. We have investigated the effect of GIK infusion on serum values of glucose and potassium and the relation between derangement and 1-year mortality. Results In 940 patients a total of 6991 glucose values and 7198 potassium values were obtained. Mean serum glucose was 9.3±4.5 mmol/L in the GIK group (N=476) compared to 8.4±2.9 mmol/L in the control group (N=464) (P<0.001). Hyperglycemia (glucose >11.0 mmol/L) occurred in 337 patients (70.8%) treated with GIK and in 157 controls (33.8%) (P<0.001). A total of 48 hyperglycemic patients (9.4%) died versus 21 patients (4.7%) without hyperglycemia (P=0.004). In patients with hyperglycemia 1-year mortality was 8.3% in the GIK group versus 12.7% in controls (P=0.14). Hypoglycemia (glucose ≤3.0 mmol/L) occurred in 10 patients of whom 2 patients (20%) died, both treated with GIK. Hyperkalemia (potassium >5.5 mmol/L) was present in 26 GIK patients (5.5%) and 15 controls (3.2%) (P=0.11), and of these patients 9 (34.6%) in the GIK group and 9 (60%) in the control group died (P=0.19). Hypokalemia (potassium ≤3.5 mmol/L) occurred in 112 patients (23.5%) in the GIK group and 191 patients in the control group (41.2%) (P<0.001). A total of 30 patients (9.9%) with hypokalemia died, 10 GIK patients (8.9%) and 20 controls (10.5%) (P=0.84). Conclusion In ST segment elevation MI patients treated with primary PCI high-dose GIK induced hyperglycemia and hyperkalemia and prevented hypokalemia. These metabolic derangements were related to 1-year mortality. The beneficial effect of GIK on mortality may be dimished by these derangements. 86 GIK and metabolic derangements Introduction In the past three decades an extensive body of evidence has accumulated that underscores the importance of glucose metabolism during ischemia and reperfusion of the heart. A meta-analysis involving nine early clinical studies with 1932 patients indicated that GIK might play an important role in reducing in-hospital mortality after acute myocardial infarction (MI).1 In the four studies in which a higher dose was used, a reduction in mortality from 12% in the control group to 6.5% in the GIK group was observed.2-5 In these studies high-dose GIK denoted an infusion of at least 30 grams of glucose, 50 units of insulin, and 80 mmol potassium per liter at a rate of 1.5 mL/kg/hour This dose maximally suppressed arterial free fatty acids (FFA) levels and myocardial FFA uptake, and induced a maximal increase in myocardial glucose uptake.6 Thereafter in the Estudios Cardiologicos Latinoamerica (ECLA) pilot trial the combination of reperfusion and GIK was related to a 10% 30-day mortality reduction (5.2% versus 15.2%, P<0.001). In a randomized trial with 940 patients we studied if primary percutaneous coronary intervention (PCI) with high-dose GIK was beneficial.7 After 30 days the mortality rate in the overall population was 4.8% in the GIK group compared to 5.8% in the control group (P=0.50). In the large predefined subgroup of 856 patients without signs of heart failure the mortality reduction was 3.0% (1.2% versus 4.2%, P=0.01). In two early studies with 30 and 104 patients the infusion of GIK in MI patients induced hyperglycemia and hyperkalemia.8;9 The ECLA observed no significant differences between mean glucose levels in the GIK and control group during 48 hours.10 The mean potassium level was higher at 24 and 48 hours. The relation between these changes and outcome were not investigated. We shought to determine the relation between metabolic derangements induced by GIK infusion and 1-year mortality. Methods Study population Patients with symptoms and signs of ST segment elevation MI eligible for primary PCI were randomized to GIK or no infusion. GIK consisted of a continuous infusion of 80 mmol potassium chloride in 500 mL 20% glucose with a rate of 3 mL/kg/hour in a peripheral venous line and 50 units short-acting insulin in 50 mL 0.9% sodium chloride. The dose and adjustments of insulin infusion were based on a modified algorithm, to obtain bloodglucose levels between 7.0 and 11.0 mmol/L (figure 1). The infusion was continued for a maximum of 12 hours. All patients went to the catheterization laboratory where PCI was performed if the coronary anatomy was suitable. The research protocol was reviewed and 87 Metabolic interventions in acute myocardial infarction approved by the medical ethics committee, and patients were included after informed consent. Figure 1. Algorithm of insulin infusion rate in patients randomized to the GIK group. Scheme 1: Starting dose of insulin infusion rate Glucose (mmol/L) Additional action >15 8 IU short-acting insulin i.v. Infusion rate (IU/hour) 30 11.0-15.0 30 10.0-10.9 24 9.0-9.9 18 8.0-8.9 12 7.0-7.9 6 <7 3 Scheme 2: Hourly adjustment of insulin infusion rate based on hourly measured glucose Glucose level (mmol/L) Additional action >15 8 IU short-acting insulin i.v. Infusion rate (IU/hour) Increase with 6 11.0-15.0 Increase with 3 7.0-10.9 Leave unchanged 4.0-6.9 Decrease with 6 <4 1. Stop infusion for 15 minutes 2. Measure blood glucose level every 15 minutes until >6.9 mmol/L 3. Start infusion with infusion rate 6 mL/hour beneath rate before stop 4. If symptoms of hypoglycemia are present than give 20 mL of glucose 30% i.v. Metabolic determinants In all patients frequent measurements of glucose and potassium (Modular System, Roche/Hitachi, Basel, Switzerland) were obtained. We defined hyperglycemia as a glucose level >11.0 mmol/L11, hypoglycemia as a glucose ≤3.0 mmol/L12, hyperkalemia as a potassium level of ≥5.5 mmol/L13, and hypokalemia as a potassium level ≤3.5 mmol/L14. We compared the incidence of glucose or potassium values in GIK and control group, and in addition determined the relation between these derangements and 1-year mortality. 88 GIK and metabolic derangements Statistical analysis Data were expressed as means with standard deviation unless otherwise indicated. Differences between group means at baseline were assessed with the two-tailed Student’s t-test. Chi-square analysis was used to test differences between proportions. Survival was calculated by the Kaplan-Meier product-limit method. The Log-rank test was used to evaluate differences in survival curves between the two treatment groups. The Cox proportional-hazards regression model was used to calculate relative risks adjusted for differences in baseline characteristics. Differences were considered significant for a twotailed P-value <0.05. The Statistical Package for the Social Sciences (SPSS Inc., Chicago, IL, USA; version 11.0.1) was used for statistical analysis. Figure 2. Mean glucose level over 96 hours after admission 25 GIK group Glucose level (mmol/L) 20 Control group 15 10 5 0 0 10 20 30 40 50 60 70 80 90 100 Time after admission (hours) Mean±SD glucose level in patients in the GIK group (unbroken line) and control group (dashed line). Results A total of 6991 glucose values and 7198 potassium values were analyzed in 940 patients. Baseline characteristics of patients randomized to GIK (N=476) or no infusion (N=464) are represented in table 1. Mean glucose level was 9.3±4.5 mmol/L in the GIK group compared to 8.4±2.9 mmol/L in the control group (P<0.001), see table 2. The mean glucose values were significantly higher in the GIK patients between 2 and 6 hours after admission (figure 2). Hyperglycemia occurred in 337 GIK patients and in 157 control 89 Metabolic interventions in acute myocardial infarction patients (70.8% versus 33.8%, P<0.001). A total of only 10 patients developed hypoglycemia, 3 patients in the GIK group versus 7 patients in the control group (0.6% versus 1.5%, P=0.34). Mean potassium level was 4.2±0.5 mmol/L in the GIK group versus 3.9±0.39 mmol/L in the control group (P<0.001), see table 2. The potassium levels were significantly higher in the GIK group between 2 and 48 hours (figure 3). A total of 26 patients (5.5%) treated with GIK versus 15 patients (3.2%) who received no infusion had a potassium level of 5.5 mmol/L or higher (P=0.11). Hypokalemia was observed less often with 112 patients (23.5%) in the GIK group versus 191 patients (41.2%) in the control group (P<0.001). Figure 3. Mean potassium level over 96 hours after admission 4.9 GIK group Potassium level (mmol/L) 4.7 Control group 4.5 4.3 4.1 3.9 3.7 3.5 0 10 20 30 40 50 60 70 80 90 100 Time after admission (hours) Mean ± SD potassium level in patients in the GIK group (unbroken line) and control group (dashed line). Mortality at 1 year Thirty-one patients (6.5%) in the GIK group died compared to 38 patients (8.2%) in the control group (relative risk (RR) 0.79, 95% confidence interval 0.49–1.27, P=0.32). In the 856 patients (91.1%) without signs of heart failure (Killip class 1) 11 patients (2.6%) died in the GIK group compared to 28 patients (6.5%) in the control group RR 0.38 (0.19–0.78, P<0.01), see figure 4. In the 84 patients (8.9%) with signs of heart failure (Killip class ≥2) 20 patients (40%) in the GIK group versus 10 patients (29.4%) in the control group died RR 1.46 (0.68–3.11, P=0.32). After adjustment for baseline variables independently associated with 1-year mortality in the overall population, the RR of mortality with GIK was 0.63 90 GIK and metabolic derangements (0.39–1.04, P=0.07). In Killip class 1 patients the beneficial effect of GIK remained significant with an adjusted RR of 0.38 (0.19–0.78, P<0.01). In Killip class ≥2 patients an adjusted RR of 1.31 (0.55–3.14, P=0.54) was observed. Table 1. Baseline characteristics of the Glucose Insulin Potassium Study Characteristics GIK group Control group Age, years (mean±SD) 59.9±11.9 60.8±12.0 Men 351 (73.7) 368 (79.3) Referred patients 201 (42.3) 180 (38.8) Body mass index (mean±SD) 26.7±3.8 27.0±4.0 Previous MI 52 (10.9) 53 (11.4) Previous PCI 22 (4.7) 24 (5.2) Previous CABG 14 (2.9) 12 (2.6) History of stroke 17 (3.6) 15 (3.2) Diabetes mellitus 50 (10.5) 49 (10.6) Hypertension 134 (28.2) 130 (28.0) Dyslipidemia 94 (19.7) 95 (20.5) Currently smoker 225 (47.3) 237 (51.1) Positive family history 195 (41.0) 179 (38.6) Time to admission, min (IQR)* 150 (100-215) 150 (105-234) Door to balloon time, min (IQR) 45 (31-64) 48 (34-69) Killip class 1 426 (89.5) 430 (92.7) Killip class ≥2 50 (10.5) 34 (7.3) Anterior MI 250 (52.9) 224 (49.1) Multi-vessel disease 249 (52.3) 242 (52.2) PCI 436 (91.6) 424 (91.4) Stent ** 255 (58.5) 236 (55.7) GP IIb/IIIa receptor blocker ** 96 (22.1) 109 (25.7) In-hospital CABG 19 (4.0) 19 (4.1) TIMI 3 flow after PCI 459 (96.4) 435 (93.8) Successful reperfusion‡ 394 (82.8) 384 (82.8) Intra-aortic balloon pump 45 (9.5) 42 (9.1) Mechanical ventilation 12 (2.5) 4 (0.9) Data are number (%) unless otherwise indicated. MI = myocardial infarction. IQR = interquartile range. PCI = percutaneous coronary intervention. CABG = coronary artery bypass grafting. * Time to admission denotes time between onset of symptoms and until admission. † In-hospital CABG = CABG defined as patients treated initially conservative, followed by elective CABG within 7 days. ‡ Successful reperfusion denotes TIMI 3 flow and blush grade 2 or 3. ** Percentage defined as the percentage of the patients that underwent PCI. 91 Metabolic interventions in acute myocardial infarction Metabolic derangements and 1-year mortality In 494 patients with hyperglycemia during admission 48 patients (9.4%) died versus 21 patients (4.7%) out of 446 patients without hyperglycemia RR 2.18 (1.28–3.70, P=0.004). The number of patients who died with hyperglycemia in the GIK group were 28 (8.3%) out of 337 patients compared to 20 patients (12.7%) out of 157 controls RR 0.62 (0.34–1.14, P=0.14). Only 10 patients had a glucose level equal to or below 3.0 mmol/L and 2 of these patients (20%) died. Both were randomized to infusion with GIK and both PCI procedures were not successful. One died on day 2 and the other on day 4 after admission. The lowest glucose value was 2.8 mmol/L and 3.0 mmol/L in these patients. A total of 41 patients had hyperkalemia and 18 patients (43.9%) did not survive after 1 year. In the GIK group 26 patients had hyperkalemia and 9 patients (34.6%) died compared to 9 patients (60%) out of 15 patients in the control group RR 0.35 (0.10–1.31, P=0.19). Hypokalemia was present in 303 patients and 30 patients (9.9%) died. In the GIK group 10 patients (8.9%) out of 112 patients compared to 20 (10.5%) out of 191 control patients did not survive to 1 year, RR 0.84 (0.38–1.86, P=0.84). Table 2. Metabolic data of GIK group and control group patients Glucose level (mean±SD) GIK group Control group P-value 9.3±4.5 8.4±2.9 <0.001 Range 2.2–39.0 1.7–41.0 5%-95% percentiles 5.3–18.9 5.6–13.9 Hyperglycemia (%) 337 (70.8) 157 (33.8) <0.001 Hypoglycemia (%) 3 (0.6) 7 (1.5) 0.34 Potassium level (mean±SD) 4.2±0.5 3.9±0.4 <0.001 Range 2.3–6.9 2.4–7.3 5%-95% percentiles 3.5–4.9 3.4–4.6 Hyperkalemia (%) 26 (5.5) 15 (3.2) 0.11 Hypokalemia (%) 112 (23.5) 191 (41.2) <0.001 Discussion In ST segment elevation MI patients treated with primary PCI infusion of high-dose GIK is related to significantly higher glucose levels during the first hours after admission. Hyperglycemia is observed in at least 7 out of 10 patients treated with GIK. This is more than double the rate of patients who received no infusion. The relation between GIK infusion and hyperglycemia was found by others. Prather and colleagues found that the mean glucose values were higher in 18 patients treated with GIK compared to 7 untreated controls during the infusion period of 48 hours.8 A relation that was also present in a study 92 GIK and metabolic derangements by Sysoeva and colleagues comparing 56 patients treated with GIK with 48 controls.9 In the ECLA pilot trial including 407 patients no significant difference was observed in mean glucose values during the 24 hour infusion between GIK and control patients10. In the lowdose Polish GIK (Pol-GIK) trial the mean glucose level in 494 GIK patients was even lower in 460 control patients after 24 hours (5.9 mmol/L versus 6.2 mmol/L). In this study the amount of insulin infusion was decreased because of a glucose level <3.4 mmol/L in 35 (9.4%) out of 369 patients. In our study the amount of GIK infused however induced hyperglycemia and it has been suggested that hyperglycemia is related to impaired preconditioning, increased infarct size, and no-reflow phenomenon.15;16 Hyperglycemia is related to stress induced elevation of free fatty acids that may compromise myocardial function as they reduce contractility and increase ischemic and reperfusion injury. Possibly the potential beneficial effect of GIK could be diminished by the induction of hyperglycemia. Hypoglycemia was uncommon, and only 2 patients with hypoglycemia died, probably related to the sequel of unsuccessful reperfusion. In experimental studies hypoglycemia induced myocardial damage.17 In clinical studies it was found that hypoglycemia was related to increased in-hospital mortality.18 The infusion of potassium as part of the GIK infusion in our study had an only minor effect on the mean potassium level of the GIK group. That the differences in potassium levels between both groups persisted for 48 hours can be understood from the fact that potassium needs to be cleared by the kidneys. In the Prather study the mean potassium level was approximately 1.5 mmol/L higher in GIK patients after 24 hours till 96 hours after admission.8 In the ECLA the potassium levels were also significantly higher (4.25 mmol/L versus 4.04 mmol/L at 24 hours (P=0.0001) and 4.24 mmol/L versus 4.08 mmol/L at 48 hours (P=0.0027)). The number of GIK patients with hyperkalemia was somewhat higher and with hypokalemia a bit reduced. In the Pol-GIK trial 4 GIK patients (0.8%) had hyperkalemia and 3 patients (0.7%) had hypokalemia.13 The relation between hyperkalemia and 1-year mortality was especially present in the control group. Avoiding hypokalemia to be beneficial in several cardiovascular disease states including acute MI.19 The relation between hypokalemia and arrhythmias is found in some but not all studies.14;20;21 Sodi-Pollares and colleagues were the first to suggest that GIK was beneficial in the treatment of ischemic myocardial arrhythmias.22 It was observed that GIK infusion limited changes on the electrocardiogram. In our study GIK had no significant effect on 1-year mortality in the overall population. In patients without heart failure at admission the beneficial effect that was found after 30days is still present.7 The ECLA pilot trial was the first to show a beneficial effect of GIK and reperfusion on in-hospital mortality.10 This effect was observed in the subgroup of 93 Metabolic interventions in acute myocardial infarction patients that also underwent thrombolysis, in-hospital mortality was 5.2% in 173 patients who received GIK versus 15.2% in 79 controls (P<0.01). Figure 4. Kaplan-Meier curve of Killip class 1 and Killip class ≥2 patients 100 Survival (%) 90 80 70 60 0 0 50 100 150 200 250 300 350 Time after randomization (days) GIK - Killip 1 GIK - Killip ≥2 Control - Killip 1 Control - Killip ≥2 Kaplan-Meier curve showing cumulative survival of Killip 1 class and Killip class ≥2 patients randomized to GIK group or control group. Differences between the groups in Killip class 1 were significant (unadjusted P=0.01). Differences between the groups in Killip class ≥2 were nonsignificant (unadjusted P=0.32). P-value was determined with the use of the Log-rank test. The main effect of the GIK infusion was considered to be the beneficial effect of administration of glucose to the ischemic myocardium. The infusion of insulin during myocardial ischemia was shown to have anti-inflammatory and anti-apoptotic effects.23-25 It is suggested that infusion of insulin (and glucose) would increase contractile force.4 In contrast, others found that GIK made no difference in hemodynamic parameters in 110 patients.5 The results of intensive insulin therapy in critically ill patients to maintain blood glucose below 6.1 mmol/l gives direction for metabolic interventions directed towards strict glucose control.26 Although this study focussed on the effects of strict glucose control as an important factor in explaining the positive results, the results may also be interpreted differently. In most GIK studies there was a trend towards significance despite the fact that normal glucose levels were not obtained.1;7;10 The beneficial effect of an 94 GIK and metabolic derangements infusion of insulin during myocardial ischemia has been suggested by a small number of clinical studies, although they lacked a randomised design and were not conclusive.27;28 The most favourable results of insulin treatment in acute MI were observed in the Diabetes Insulin-Glucose in Acute Myocardial Infarction (DIGAMI) study. The DIGAMI included 620 patients with diabetes mellitus or glucose at admission >11.0 mmol/L were included.29;30 The combination of insulin-glucose infusion followed by intensive insulin treatment resulted in both better glycemic control in the insulin-glucose group 24 hours after randomization, with a blood-glucose level of 9.6 versus 11.7 mmol/L in the control group (P<0.0001). The reduction of in hospital mortality from 11.1% in the control group compared to 9.1% in the insulin-glucose group was non-significant.29;30 Data on the effect in patients who received thrombolysis (50% of all patients) were not reported. At 1-year follow-up, mortality was lower in the insulin-glucose group, with 18.6% versus 26.1% in the control group (P=0.0273). In a retrospective study including 3554 diabetic patients treated with coronary artery bypass grafting (CABG) glucose levels were lower in patients regulated with continuous insulin infusion compared to subcutaneous insulin injections (9.8 mmol/L versus 11.8 mmol/L, P <0.0001).31 The observed mortality was 2.5% in 2612 patients treated continuously versus 5.3% in 942 patients treated intermittent (P <0.0001). Likewise, a recent study of 141 diabetic CABG patients found that treatment with GIK resulted in lower glucose levels (7.7 mmol/L versus 14.4 mmol/L, P<0.0001) and after 2 years a reduction of mortality (P=0.04).32 Conclusion This study shows that in ST segment elevation MI patients treated with primary PCI infusion of high-dose GIK is related to both hyperglycemia and hyperkalemia, and prevention of hypokalemia. Possibly the beneficial effect of GIK on mortality was reduced by inducing these derangements. Substantial experimental evidence underscores the potential beneficial effects of metabolic treatment with glucose, insulin, and potassium for the heart exposed to the injuries of ischemia and reperfusion. Future trials have to determine whether or not to aim for strict glucose regulation during acute MI, and which algorithm allows a feasible and effective infusion of high-dose GIK without inducing metabolic disturbances. Contributors This study was supported by a generous grant from the Netherlands Heart Foundation (99.028). No other conflicts of interest or financial disclosure. 95 Metabolic interventions in acute myocardial infarction References 1. Fath-Ordoubadi F, Beatt KJ. Glucose-insulin-potassium therapy for treatment of acute myocardial infarction: an overview of randomized placebo-controlled trials. Circulation 1997;96:1152-56. 2. Heng MK, Norris RM, Singh BN, Barratt-Boyes C. Effects of glucose and glucose-insulinpotassium on haemodynamics and enzyme release after acute myocardial infarction. Br Heart J 1977;39:748-57. 3. Rogers WJ, Stanley AW, Jr., Breinig JB et al. Reduction of hospital mortality rate of acute myocardial infarction with glucose-insulin-potassium infusion. Am Heart J 1976;92:441-54. 4. Satler LF, Green CE, Kent KM, Pallas RS, Pearle DL, Rackley CE. Metabolic support during coronary reperfusion. Am Heart J 1987;114:54-58. 5. Stanley AW, Jr., Prather JW. Glucose-insulin-potassium, patient mortality and the acute myocardial infarction: results from a prospective randomised study. Circulation 1978;57:61. 6. Rackley CE, Russell RO, Jr., Rogers WJ, Mantle JA, McDaniel HG, Papapietro SE. Clinical experience with glucose-insulin-potassium therapy in acute myocardial infarction. Am Heart J 1981;102:1038-49. 7. van der Horst IC, Zijlstra F, van't Hof AW et al. Glucose-insulin-potassium infusion in patients treated with primary angioplasty for acute myocardial infarction: the glucose-insulinpotassium study: a randomized trial. J Am Coll Cardiol 2003;42:784-91. 8. Prather JW, Russell RO, Jr., Mantle JA, McDaniel HG, Rackley CE. Metabolic consequences of glucose-insulin-potassium infusion in treatment of acute myocardial infarction. Am J Cardiol 1976;38:95-99. 9. Sysoeva NA, Oganov RG, Mikhailova IL. [Metabolic effects of a glucose-insulin-potassium mixture in acute myocardial infarct]. Kardiologiia 1982;22:77-82. 10. Diaz R, Paolasso EA, Piegas LS et al. Metabolic modulation of acute myocardial infarction. The ECLA (Estudios Cardiologicos Latinoamerica) Collaborative Group. Circulation 1998;98:2227-34. 11. Bolk J, van der Ploeg T, Cornel JH, Arnold AE, Sepers J, Umans VA. Impaired glucose 12. Malmberg KA, Efendic S, Ryden LE. Feasibility of insulin-glucose infusion in diabetic patients metabolism predicts mortality after a myocardial infarction. Int J Cardiol 2001;79:207-14. with acute myocardial infarction. A report from the multicenter trial: DIGAMI. Diabetes Care 1994;17:1007-14. 13. Ceremuzynski L, Budaj A, Czepiel A et al. Low-dose glucose-insulin-potassium is ineffective in acute myocardial infarction: results of a randomized multicenter Pol-GIK trial. Cardiovasc Drugs Ther 1999;13:191-200. 14. Madias JE, Shah B, Chintalapally G, Chalavarya G, Madias NE. Admission serum potassium in patients with acute myocardial infarction: its correlates and value as a determinant of inhospital outcome. Chest 2000;118:904-13. 15. Iwakura K, Ito H, Ikushima M et al. Association between hyperglycemia and the no-reflow 16. Kersten JR, Schmeling TJ, Orth KG, Pagel PS, Warltier DC. Acute hyperglycemia abolishes phenomenon in patients with acute myocardial infarction. J Am Coll Cardiol 2003;41:1-7. ischemic preconditioning in vivo. Am J Physiol 1998;275:H721-H725. 96 GIK and metabolic derangements 17. Libby P, Maroko PR, Braunwald E. The effect of hypoglycemia on myocardial ischemic injury 18. Fischer KF, Lees JA, Newman JH. Hypoglycemia in hospitalized patients. Causes and 19. Macdonald JE, Struthers AD. What is the optimal serum potassium level in cardiovascular 20. Boyd JC, Bruns DE, DiMarco JP, Sugg NK, Wills MR. Relationship of potassium and 21. Higham PD, Adams PC, Murray A, Campbell RW. Plasma potassium, serum magnesium and during acute experimental coronary artery occlusion. Circulation 1975;51:621-26. outcomes. N Engl J Med 1986;315:1245-50. patients? J Am Coll Cardiol 2004;43:155-61. magnesium concentrations in serum to cardiac arrhythmias. Clin Chem 1984;30:754-57. ventricular fibrillation: a prospective study. Q J Med 1993;86:609-17. 22. Sodi-Pallares D, Testelli MR, Fishleder BL et al. Effects of an intravenous infusion of a potassium-glucose-insulin solution on the electrocardiographic signs of myocardial infarction. A preliminary clinical report. Am J Cardiol 1962;9:166-81. 23. Chaudhuri A, Janicke D, Wilson MF et al. Anti-inflammatory and profibrinolytic effect of 24. Gao F, Gao E, Yue TL et al. Nitric oxide mediates the antiapoptotic effect of insulin in insulin in acute ST-segment-elevation myocardial infarction. Circulation 2004;109:849-54. myocardial ischemia-reperfusion: the roles of PI3-kinase, Akt, and endothelial nitric oxide synthase phosphorylation. Circulation 2002;105:1497-502. 25. Jonassen AK, Sack MN, Mjos OD, Yellon DM. Myocardial protection by insulin at reperfusion requires early administration and is mediated via Akt and p70s6 kinase cell-survival signaling. Circ Res 2001;89:1191-98. 26. van den Berghe G, Wouters P, Weekers F et al. Intensive insulin therapy in the critically ill 27. Clark RS, English M, McNeill GP, Newton RW. Effect of intravenous infusion of insulin in patients. N Engl J Med 2001;345:1359-67. diabetics with acute myocardial infarction. Br Med J (Clin Res Ed) 1985;291:303-5. 28. Gwilt DJ, Nattrass M, Pentecost BL. Use of low-dose insulin infusions in diabetics after 29. Malmberg K, Ryden L, Efendic S et al. Randomized trial of insulin-glucose infusion followed myocardial infarction. Br Med J (Clin Res Ed) 1982;285:1402-4. by subcutaneous insulin treatment in diabetic patients with acute myocardial infarction (DIGAMI study): effects on mortality at 1 year. J Am Coll Cardiol 1995;26:57-65. 30. Malmberg K, Ryden L, Hamsten A, Herlitz J, Waldenstrom A, Wedel H. Effects of insulin treatment on cause-specific one-year mortality and morbidity in diabetic patients with acute myocardial infarction. DIGAMI Study Group. Diabetes Insulin-Glucose in Acute Myocardial Infarction. Eur Heart J 1996;17:1337-44. 31. Furnary AP, Gao G, Grunkemeier GL et al. Continuous insulin infusion reduces mortality in patients with diabetes undergoing coronary artery bypass grafting. J Thorac Cardiovasc Surg 2003;125:1007-21. 32. Lazar HL, Chipkin SR, Fitzgerald CA, Bao Y, Cabral H, Apstein CS. Tight Glycemic Control in Diabetic Coronary Artery Bypass Graft Patients Improves Perioperative Outcomes and Decreases Recurrent Ischemic Events. Circulation 2004;109:1497-502. 97 Metabolic interventions in acute myocardial infarction 98 GIK and 3-year outcome Chapter 2.6 Long-term survival after glucose-insulin-potassium infusion and primary angioplasty in ST segment elevation myocardial infarction: the randomized Glucose Insulin Potassium Study (GIPS) Iwan CC van der Horst, Jorik R Timmer, Jan Paul Ottervanger, Arnoud WJ van ‘t Hof, Henk JG Bilo, Menko-Jan de Boer, Jan CA Hoorntje, Jan-Henk E Dambrink, AT Marcel Gosselink, Harry Suryapranata, Rijk OB Gans, Felix Zijlstra Submitted 99 Metabolic interventions in acute myocardial infarction Abstract Introduction A combined approach of mechanical reperfusion of the infarct-related coronary artery and cardiac protection with glucose-insulin-potassium (GIK) infusion has been proposed to protect the ischemic myocardium. Methods We investigated the long-term clinical outcome of GIK infusion in ST segment elevation myocardial infarction (MI) patients treated with primary percutaneous coronary intervention (PCI). We performed an open-label randomized controlled trial, conducted from April 1998 to September 2001 in a single center. Nine hundred and forty patients with ST segment elevation MI and eligible for primary PCI were enrolled and followed for 3 years. Patients received either a continuous infusion of 80 mmol potassium chloride in 500 mL 20% glucose with a rate of 3 mL/kg/hour with a continuous infusion of shortacting insulin with the use of a pump for 8 to 12 hours or no infusion. Results All-cause mortality was 98 (10.4%) out of 940 patients after 3-year. Factors related to longterm mortality were age, previous cardiovascular disease, anterior MI, Killip class ≥2, (all P< 0.001), multi-vessel disease (P=0.001), and female gender (P=0.032). In the GIK group 46 (9.7%) out of 476 patients died compared to 52 (11.2%) out of 464 control patients (P=0.44). In patients with Killip class 1 (N=856) randomization to GIK resulted in a lower 3year mortality, adjusted relative risk 0.56 (0.34-0.94, P=0.028). Other factors related with long-term mortality in Killip class 1 patients were age (P<0.001), previous cardiovascular disease (P<0.001), anterior MI location (P=0.05), and multi-vessel disease (P=0.03). Conclusion Cardiac protection with GIK infusion and primary PCI in acute MI did not result in a significant mortality reduction in all patients. During the 3-years follow-up, the beneficial effect observed after 30-days in the predefined subgroup of Killip class 1 patients was sustained. 100 GIK and 3-year outcome Introduction High risk patients with early and sustained reperfusion of the infarct-related artery in acute ST segment elevation myocardial infarction (MI) the mortality rate may still be up to 10 percent.1-4 To further improve the outcome for ST segment elevation MI patients therapies directed toward cardiac protection have been suggested to be of additive value.5 One of these strategies is the infusion of glucose, insulin and potassium (GIK).6 The concept of metabolic protection of the ischemic myocardium hinges on the fact that glucose can be metabolized anaerobically and can thereby provide glycolytic adenosine triphosphate (ATP) in the cytosolic compartment.7 In both acute myocardial infarction and cardiac surgery the effect of GIK infusion has been investigated. An overview of trials in the era before reperfusion found that GIK resulted in improved short-term survival.8 New promising results were found in a pilot trial of GIK, in particular in patients treated with either thrombolysis or primary percutaneous coronary intervention (PCI).9 To investigate the potential role of the combination of GIK and early reperfusion, we conducted a randomized trial. We found no significant beneficial effect of GIK and primary PCI in the overall population.10 In a study of insulin infusion in diabetic patients with acute MI no effect was found on 30-day mortality.11 However, after 3.43 years follow-up the absolute mortality reduction was 11% (P=0.011).12 Long-term effects of GIK in MI patients have not been studied and described previously. We therefore investigated long-term clinical outcome in all patients enrolled in the Glucose-Insulin-Potassium Study (GIPS). Methods Patients The diagnosis acute MI included chest pain suggestive for myocardial ischemia for at least 30 minutes, a time from onset of symptoms less than 12 hours before hospital admission, and an ECG recording with ST T segment elevation of more than 1 mV in two or more contiguous leads or new onset left bundle-branch block on the electrocardiogram.13;14 Patients had to be eligible for acute angiography with a view to perform primary PCI. Patients presenting at our center and patients referred for treatment of high-risk MI, from nine referring hospitals without angioplasty facilities, were included. Patients were excluded when pre-treated with thrombolysis or when an illness associated with a marked restricted life expectancy was present. Before randomization baseline characteristics were recorded. The research protocol was reviewed and approved by the medical ethics committee of our hospital, and patients were included after informed consent. 101 Metabolic interventions in acute myocardial infarction Study Protocol After admission patients were randomly assigned, with the use of a computerized randomization program, to either GIK infusion or no infusion. In the GIK group, a continuous infusion of 80 mmol potassium chloride in 500 mL 20% glucose with a rate of 3 mL/kg/hour in a peripheral venous line was given over a period up to 12 hours. The infusion was started as soon as possible. A continuous infusion of short-acting insulin (50 units Actrapid HM [Novo Nordisk, Copenhagen, Denmark] in 50 mL 0.9% sodium chloride was started with the use of a pump (Perfusor-FM, B. Braun, Melsungen, Germany). Baseline insulin-infusion dose and hourly adjustments of the insulin dose were based on a modified algorithm, to obtain blood-glucose levels between 7.0 and 11.0 mmol/L, based on measurements of whole-blood glucose (Modular System, Roche/Hitachi, Basel, Switzerland). After the infusion was started, all patients went to the catheterization laboratory where both coronary arteries were visualized. PCI was performed with standard techniques if the coronary anatomy was suitable for PCI. Additional standard treatment consisted of heparin, nitroglycerin intravenously, and aspirin 500 mg intravenously or 300 mg orally. Low molecular weight heparin was given after sheath removal. Standard therapies after PCI included aspirin 80 mg, clopidogrel 75 mg, beta-blockers, lipid lowering agents and angiotensin converting enzyme inhibitors or angiotensin II receptor blockers and were used according to the guidelines of the European Society of Cardiology/American College of Cardiology at that time.13;15 All patients were seen approximately 6 weeks after discharge at the outpatient clinic. The additional treatment was evaluated and changed if indicated, i.e. start or increase in dosing of antihypertensive medication if blood pressure was above the goal or of statins if lipid profile did not meet guideline criteria. Statistical analysis The primary endpoint of this analysis was 3-year (long-term) mortality. The incidence of death was evaluated in predefined subgroups including age <60 year versus ≥60 year, men versus women, anterior MI versus non-anterior MI, diabetics versus non-diabetics, and Killip class 1 versus Killip class ≥2, successful reperfusion versus no successful reperfusion. Successful reperfusion was defined by TIMI blood flow grade 3 in combination with myocardial blush grades 2 and 3.16;17 Analyses were performed according to the intention-to-treat principle. Relative risks (RR) were calculated by dividing 102 GIK and 3-year outcome Table 1. Baseline clinical and demographic characteristics and initial therapies Characteristic Number of patients GIK Control 476 464 Age, years (mean±SD) 59.9±11.9 60.8±12.0 Men 351 (73.7) 368 (79.3) Referred patients 201 (42.3) 180 (38.8) Body mass index 26.7±3.8 27.0±4.0 Previous MI 52 (10.9) 53 (11.4) Previous PCI 22 (4.7) 24 (5.2) Previous CABG 14 (2.9) 12 (2.6) History of stroke 17 (3.6) 15 (3.2) Diabetes mellitus 50 (10.5) 49 (10.6) Hypertension 134 (28.2) 130 (28.0) Dyslipidemie 94 (19.7) 95 (20.5) Currently smoker 225 (47.3) 237 (51.1) Positive family history 195 (41.0) 179 (38.6) Time to admission, min (IQR)* 150 (100-215) 150 (105-234) Door to balloon time, min (IQR) 45 (31-64) 48 (34-69) Killip class 1 426 (89.5) 430 (92.7) Killip class 2 24 (5.0) 14 (3.0) Killip class 3 14 (2.9) 14 (3.0) Killip class 4 12 (2.5) 6 (1.3) Anterior MI 250 (52.9) 224 (49.1) Multi-vessel disease 249 (52.3) 242 (52.2) PCI 436 (91.6) 424 (91.4) Stent ** 255 (58.5) 236 (55.7) GP IIb/IIIa receptor blocker ** 96 (22.1) 109 (25.7) In-hospital CABG 19 (4.0) 19 (4.1) 459 (96.4) 435 (93.8) TIMI 3 flow after PCI Data are number (%) unless otherwise indicated. MI = myocardial infarction. IQR = interquartile range. PCI = percutaneous coronary intervention. CABG = coronary artery bypass grafting. * Time to admission denotes time between onset of symptoms and until admission. † In-hospital CABG = CABG defined as patients treated initially conservative, followed by elective CABG within 7 days. ** Percentage defined as the percentage of the patients that underwent PCI. the cumulative incidence rate in the GIK group by the cumulative incidence rate in the control group. The relative risks for 3-year mortality were also determined for clinical and demographic characteristics and randomization group. Differences between group means 103 Metabolic interventions in acute myocardial infarction at baseline were assessed with the two-tailed Student’s t-test. Chi-square analysis or Fisher’s exact test was used to test differences between proportions. Mortality was calculated by the Kaplan-Meier product-limit method. The Log-rank test was used to evaluate differences in survival curves between the two treatment groups. The Cox proportional-hazards regression model was used to calculate relative risks adjusted for differences in baseline characteristics. Statistical significance was considered a two-tailed P-value <0.05. The Statistical Package for the Social Sciences (SPSS Inc., Chicago, IL, USA) version 11.5 was used for all statistical analysis. Sample size calculation and other details of the statistical methods have been published.10 Table 2. Additional treatment at hospital discharge according to treatment group Medication GIK group Control group Aspirin 421 (88.4) 398 (85.8) Clopidogrel 194 (40.8) 192 (41.4) Coumarins 36 (7.6) 45 (9.7) Beta-blockers 392 (82.3) 381 (82.1) ACE-inhibitors 245 (51.5) 244 (52.6) AII receptor antagonists 7 (1.5) 3 (0.6) Calcium channel blockers 15 (3.2) 19 (4.1) Diuretics 46 (9.7) 67 (14.4) Nitrates 70 (14.7) 67 (14.4) Statins 285 (51.3) 271 (48.7) Data are number (%). ACE = angiotensin-converting enzyme. AII = angiotensin II. Results The baseline clinical and demographic characteristics of the 476 patients in the GIK group and 464 patients in the control group are represented in table 1. GIK infusion was started 15 to 20 minutes after admission. Average door to balloon time was 45 minutes in the GIK group and 48 minutes in the control group. After coronary angiography, 860 patients (90.5%) underwent primary PCI, 38 patients (4.0%) were referred for CABG within 7 days after initial stabilization, and 42 patients (4.5%) were treated conservatively. There were no differences in additional medication after hospital discharge between the GIK and control group (table 2). After 3 years 98 patients (10.4%) had died. A total of 50 patients (5.3%) died within 30 days and 69 patients (7.3%) died within 1-year. Baseline characteristics that were related 104 GIK and 3-year outcome to 3-year mortality were age (P<0.001), female gender (P=0.03), previous cardiovascular disease (P<0.001), anterior MI (P<0.001), Killip class ≥2 (P<0.001), and multi-vessel disease (P=0.001) (table 3). The relative risk (RR) per year was 1.04, female gender had a RR of 1.62, patients with a history of cardiovascular disease had a RR of 2.27, patients with an anterior MI had a RR of 2.56, patients with Killip class 2 a RR of 4.20, patients with Killip class 3 a RR of 12.52, and patients with Killip class 4 a RR of 26.23 compared to patients with Killip class 1. Table 3. Adjusted relative risks for 3-year mortality of baseline demographic and clinical characteristics in the overall population and Killip class 1 patients Characteristics Overall population Killip class 1 RR 3-year mortality P-value RR 3-year mortality P-value Randomization 0.75 (0.50-1.12) 0.17 0.81 (0.54-1.22) 0.27 Age per year older 1.04 (1.02-1.06) <0.001 1.05 (1.03-1.07) <0.001 Female gender 1.62 (1.04-2.50) 0.032 1.49 (0.96-2.33) 0.07 Previous CVD* 2.73 (1.76-4.24) <0.001 2.66 (1.72-4.12) <0.001 Killip class ≥2† 6.64 (4.32-10.2) <0.001 Anterior MI 2.31 (1.51-3.52) <0.001 1.95 (1.27-2.97) <0.001 Multi-vessel disease 2.32 (1.43-3.78) 0.001 2.18 (1.34-3.55) 0.002 Relative risk for 3-year mortality of baseline demographic and clinical characteristics. RR = relative risk. MI = myocardial infarction. CVD = cardiovascular disease. * Previous cardiovascular disease is a combination of previous myocardial infarction, previous percutaneous coronary intervention, previous coronary artery bypass grafting, or previous cerebrovascular accident. † P-value of risk compared to patients with Killip class 1. 3-year mortality was 46 of 476 patients (9.7%) randomized to GIK compared to 52 of 464 patients (11.2%) in the control group (P=0.44, using the Log-rank test) (figure 1). After adjustment for characteristics related with 3-year mortality the RR was 0.75 (95% confidence interval 0.50-1.12, P=0.17). In 856 patients (91.1%) without signs of heart failure at admission (Killip class 1), 3-year mortality was 23 of 426 patients (5.4%) in the GIK group versus 41 of 430 patients (9.5%) in the control group, (P=0.019 using the Logrank test) (figure 2). In Cox proportional-hazards regression model the RR was 0.56 (0.330.93, P=0.025). In patients without signs of heart failure at admission age (P<0.001), previous cardiovascular disease (P<0.001), anterior MI (P=0.05), Killip class ≥2 (P<0.001), and multi-vessel disease (P=0.03) were related to 3-year mortality (table 3). In 84 patients (8.9%) with signs of heart failure (Killip class ≥2), 3-year mortality was 23 of 50 patients (46%) in the GIK group and 11 of 34 patients (32%) in the control group (P=0.23, using the Log-rank test). As in our previous analysis of 30-day outcome, we did additional 105 Metabolic interventions in acute myocardial infarction analysis of predefined subgroups. Age, gender, ischemic time, infarct location, multivessel versus single vessel disease, and TIMI flow had no impact on the difference on outcome between the GIK group and the control group. Figure 1. Kaplan-Meier of the overall population 100 90 Survival (%) 80 GIK 70 Control 60 50 0 0 200 400 600 800 Time after randomization (days) 1000 P-value is 0.44 using the Log-rank test. Discussion In line with our 30-day mortality results we did not find a significant benefit on survival, 3year after GIK infusion in ST segment elevation MI patients treated with primary PCI, in the overall population. The favourable effect in patients without signs of heart-failure at admission was sustained. The absolute reduction in mortality in these patients was approximately 3% during the entire follow-up period (Kaplan-Meier curve in Killip class 1 patients, figure 2). Reasons for the absence of a survival benefit in all GIPS patients despite apparent improvements in myocardial function and mortality in earlier trials remain unclear. In the low-dose Polish-Glucose-Insulin-Potassium (Pol-GIK) trial with 954 patients 30-day mortality in the GIK group was significantly higher than in the control group (8.9% versus 106 GIK and 3-year outcome 4.8%, P=0.01).18 It is possible that the mortality reduction observed in the Estudios Cardiologicos Latinoamerica (ECLA) pilot trial was related to the mortality rate in the control group (15.1% in the ECLA pilot versus 5.8% in the GIPS).9 In the Reevaluation of Intensified Venous Metabolic Support for Acute Infarct Size Limitation (REVIVAL) trial with 312 MI patients treated with primary PCI, GIK did not result in a significant difference in mortality after 6 months (5.8% in the GIK group versus 6.4% in the control group, P=0.85).19 Figure 2. Kaplan-Meier in patients with Killip class 1 and Killip class ≥2 100 90 Survival (%) 80 70 60 50 0 0 200 400 600 800 Time after randomization (days) GIK - Killip 1 GIK - Killip ≥2 Control - Killip 1 Control - Killip ≥2 1000 P-value in Killip class 1 patients is 0.019, using the Log-rank test. P-value in Killip class ≥2 patients is 0.23, using the Log-rank test. With the low mortality rate in the control group of GIPS, as in the REVIVAL, the study may have been underpowered to find an improvement in the mortality in the overall population. Another explanation of our findings could be the high number of patients with signs of heart failure in the GIK group. In these patients the volume load may be detrimental.9 A high number of patients died during the first days after admission (figure 2). The number of patients with heart failure that died after 3 years was equal to the number of patients in other trials, such as the SHould we emergently revascularize 107 Metabolic interventions in acute myocardial infarction Occluded Coronaries for cardiogenic shocK (SHOCK) study.20 In the Diabetes InsulinGlucose in Acute Myocardial Infarction (DIGAMI) study with 620 patients with an acute MI and diabetes mellitus or glucose at admission >11.0 mmol/L, at 1-year follow-up, absolute mortality reduction was 7.5% (18.6% versus 26.1%, P=0.03).11 This increased to 11% (33% versus 44%, P=0.011) after a mean follow-up of 3.4 years.12 We did not see a similar pattern in our study population in mortality reduction. Possibly the post-discharge treatment with insulin in the DIGAMI study for at least 3 months caused this effect. The DIGAMI 2 will clarify this since diabetic MI patients have been randomized to acute insulinglucose infusion followed by multi-dose subcutaneous insulin, acute insulin-glucose infusion followed by conventional hypoglycemic therapy, or conventional hypoglycemic treatment. In 1548 patients admitted to a thoraco-surgical intensive care unit and randomized to either strict glucose regulation or conventional glucose-metabolic treatment short-term mortality decreased significantly (4.6% versus 8%, P<0.04).21 In two studies including diabetic patients treated with coronary artery bypass grafting strict glucose regulation with either insulin alone or GIK was related to a significant mortality reduction.22;23 It has been postulated that through reduction in the extent of ischemic myocardial damage and suppression of free fatty acid levels, GIK therapy prevents reperfusion injury that may occur after successful revascularization.24 Protection of the cell membrane of ischemic cardiac cells may also improve reflow after reperfusion and protect against noreflow phenomenon by reducing cell swelling and microvascular compression. It has been estimated that GIK therapy has the potential to protect ischemic myocardium before reperfusion for 10 hours or even longer.25 Our study offered the opportunity to analyse the effect of GIK in patients with different ischemic times, i.e. time from symptom-onset to admission and door to balloon time. We could not find a relation between time delays and the effect of GIK on long-term outcome. Should this therapy have any role in the contemporary management of acute MI? In MI patients treated with primary PCI in the absence of signs of heart failure the absolute mortality reduction of approximately 3% would imply that a number of 34 patients are needed to treat to save one. Since this study had no exclusion criteria for elderly patients, women, etcetera, the results can easily be translated into daily practice. In patients with signs of heart failure infusion further research is needed on the infusion rate and quantity before the effect on survival can be reinvestigated. Large trials are currently undertaken such as the ECLA GIK 2/CREATE trial, Organization to Assess Strategies for Ischemic Syndromes (OASIS)-6 trial, and the GIPS 2 to resolve various issues related to metabolic interventions in acute MI. 108 GIK and 3-year outcome Conclusion In patients with ST segment elevation MI treated with primary PCI, infusion of GIK has no significant long-term beneficial effect. In the large subgroup of patients without signs of heart failure at admission GIK reduced short-term and long-term mortality. Contributors This study was supported by a generous grant from the Netherlands Heart Foundation (99.028). No other conflicts of interest or financial disclosure. References 1. Rogers WJ, Canto JG, Lambrew CT et al. Temporal trends in the treatment of over 1.5 million patients with myocardial infarction in the US from 1990 through 1999: the National Registry of Myocardial Infarction 1, 2 and 3. J Am Coll Cardiol 2000;36:2056-63. 2. Keeley EC, Grines CL. Primary coronary intervention for acute myocardial infarction. JAMA 2004;291:736-39. 3. Grines CL, Browne KF, Marco J et al. A comparison of immediate angioplasty with thrombolytic therapy for acute myocardial infarction. The Primary Angioplasty in Myocardial Infarction Study Group. N Engl J Med 1993;328:673-79. 4. Zijlstra F, Hoorntje JC, de Boer MJ et al. Long-term benefit of primary angioplasty as compared with thrombolytic therapy for acute myocardial infarction. N Engl J Med 1999;341:1413-19. 5. Kloner RA, Rezkalla SH. Cardiac protection during acute myocardial infarction: where do we stand in 2004? J Am Coll Cardiol 2004;44:276-86. 6. LaDisa JF, Jr., Krolikowski JG, Pagel PS, Warltier DC, Kersten JR. Cardioprotection by glucose-insulin-potassium: dependence on KATP channel opening and blood glucose concentration before ischemia. Am J Physiol Heart Circ Physiol 2004;287:H601-H607. 7. Taegtmeyer H, Goodwin GW, Doenst T, Frazier OH. Substrate metabolism as a determinant for postischemic functional recovery of the heart. Am J Cardiol 1997;80:3A-10A. 8. Fath-Ordoubadi F, Beatt KJ. Glucose-insulin-potassium therapy for treatment of acute myocardial infarction: an overview of randomized placebo-controlled trials. Circulation 1997;96:1152-56. 9. Diaz R, Paolasso EA, Piegas LS et al. Metabolic modulation of acute myocardial infarction. The ECLA (Estudios Cardiologicos Latinoamerica) Collaborative Group. Circulation 1998;98:2227-34. 10. van der Horst IC, Zijlstra F, van't Hof AW et al. Glucose-insulin-potassium infusion in patients treated with primary angioplasty for acute myocardial infarction: the glucose-insulinpotassium study: a randomized trial. J Am Coll Cardiol 2003;42:784-91. 109 Metabolic interventions in acute myocardial infarction 11. Malmberg K, Ryden L, Efendic S et al. Randomized trial of insulin-glucose infusion followed by subcutaneous insulin treatment in diabetic patients with acute myocardial infarction (DIGAMI study): effects on mortality at 1 year. J Am Coll Cardiol 1995;26:57-65. 12. Malmberg K. Prospective randomised study of intensive insulin treatment on long term survival after acute myocardial infarction in patients with diabetes mellitus. DIGAMI (Diabetes Mellitus, Insulin Glucose Infusion in Acute Myocardial Infarction) Study Group. BMJ 1997;314:1512-15. 13. Ryan TJ, Antman EM, Brooks NH et al. 1999 update: ACC/AHA Guidelines for the Management of Patients With Acute Myocardial Infarction: Executive Summary and Recommendations: A report of the American College of Cardiology/American Heart Association Task Force on Practice Guidelines (Committee on Management of Acute Myocardial Infarction). Circulation 1999;100:1016-30. 14. Shlipak MG, Lyons WL, Go AS, Chou TM, Evans GT, Browner WS. Should the electrocardiogram be used to guide therapy for patients with left bundle-branch block and suspected myocardial infarction? JAMA 1999;281:714-19. 15. Van de Werf F, Ardissino D, Betriu A et al. Management of acute myocardial infarction in patients presenting with ST segment elevation. The Task Force on the Management of Acute Myocardial Infarction of the European Society of Cardiology. Eur Heart J 2003;24:28-66. 16. The Thrombolysis in Myocardial Infarction (TIMI) trial. Phase I findings. TIMI Study Group N 17. van 't Hof AW, Liem A, Suryapranata H, Hoorntje JC, de Boer MJ, Zijlstra F. Angiographic Engl J Med 1985;312:932-36. assessment of myocardial reperfusion in patients treated with primary angioplasty for acute myocardial infarction: myocardial blush grade. Zwolle Myocardial Infarction Study Group. Circulation 1998;97:2302-6. 18. Ceremuzynski L, Budaj A, Czepiel A et al. Low-dose glucose-insulin-potassium is ineffective in acute myocardial infarction: results of a randomized multicenter Pol-GIK trial. Cardiovasc Drugs Ther 1999;13:191-200. 19. Pache J, Kastrati A, Mehilli J et al. A randomized evaluation of the effects of glucose-insulinpotassium infusion on myocardial salvage in patients with acute myocardial infarction treated with reperfusion therapy. Am Heart J 2004;148:105. 20. Hochman JS, Sleeper LA, White HD et al. One-year survival following early revascularization for cardiogenic shock. JAMA 2001;285:190-192. 21. van den Berghe G, Wouters P, Weekers F et al. Intensive insulin therapy in the critically ill 22. Furnary AP, Gao G, Grunkemeier GL et al. Continuous insulin infusion reduces mortality in patients. N Engl J Med 2001;345:1359-67. patients with diabetes undergoing coronary artery bypass grafting. J Thorac Cardiovasc Surg 2003;125:1007-21. 23. Lazar HL, Chipkin SR, Fitzgerald CA, Bao Y, Cabral H, Apstein CS. Tight Glycemic Control in Diabetic Coronary Artery Bypass Graft Patients Improves Perioperative Outcomes and Decreases Recurrent Ischemic Events. Circulation 2004; 109:1497-502. 24. Jonassen AK, Aasum E, Riemersma RA, Mjos OD, Larsen TS. Glucose-insulin-potassium reduces infarct size when administered during reperfusion. Cardiovasc Drugs Ther 2000;14:615-23. 110 GIK and 3-year outcome 25. Eberli FR, Weinberg EO, Grice WN, Horowitz GL, Apstein CS. Protective effect of increased glycolytic substrate against systolic and diastolic dysfunction and increased coronary resistance from prolonged global underperfusion and reperfusion in isolated rabbit hearts perfused with erythrocyte suspensions. Circ Res 1991;68:466-81. 111 Metabolic interventions in acute myocardial infarction 112 Overview of GIK studies in acute MI Chapter 3 Glucose-insulin-potassium infusion as adjunctive therapy in myocardial infarction: current evidence and potential mechanisms Jorik R Timmer, Iwan CC van der Horst, Jan Paul Ottervanger, Giuseppe de Luca, Arnoud WJ van ‘t Hof, Henk JG Bilo, Felix Zijlstra Italian Heart Journal 2004;5:727-31 113 Metabolic interventions in acute myocardial infarction Abstract Background In ST segment elevation myocardial infarction (MI) there is conflicting evidence that mortality, morbidity and infarct size is reduced by therapies influencing myocardial metabolism, such as infusion of glucose-insulin-potassium (GIK). Several clinical trials with GIK have already provided insight in the magnitude of this effect. Our aim was to investigate current evidence on the potential beneficial effect of GIK infusion in ST segment elevation MI. Methods Randomized trials comparing GIK with placebo or untreated controls in patients with ST segment elevation MI were identified by electronic and manual searches. A systematic analysis of all data was performed, with regard to inclusion criteria, dose of GIK and additional use of reperfusion therapy. Results Thirteen trials, involving 5009 patients, were included. Overall, hospital mortality was 10.7% after GIK compared to 12.8% in controls (P=0.02). GIK infusions were in particular effective when a high-dose was used and if given as adjunctive to reperfusion therapy. Low-dose GIK was less beneficial, and may even increase hospital mortality. Also in patients with heart failure on admission, GIK may have worse effects. In all analyzed trials, GIK infusion caused only mild adverse effects, although fluid overload may be a problem in certain patients. Conclusion GIK may reduce mortality in patients with STEMI, particularly if a high dose is used and when GIK is administered as an adjunct to reperfusion therapy. However, all studies had a relative small sample size and additional large randomized trials are certainly needed before a definite conclusion can be made. The limited evidence currently available does not warrant GIK therapy to be applied in patients at the present time. 114 Overview of GIK studies in acute MI Introduction Glucose-insulin-potassium (GIK) infusion in the treatment of ST segment elevation myocardial infarction (MI) has been a field of interest for many decades.1;2 However, the results of early studies investigating the effect of GIK on clinical outcome after myocardial infarction were inconclusive and attention focussed on reperfusion therapies. Furthermore, lack of financial interest of the pharmaceutical industry made it difficult to perform a large clinical trial. Although early and sustained reperfusion is indeed the most important initial treatment of ST segment elevation MI, agents that influence energy substrate metabolism in the reperfused myocardium may have additional beneficial effects. In a meta-analysis of earlier randomised trials of GIK in ST segment elevation MI, it was shown that GIK has potential beneficial effects, but studies in the reperfusion era were lacking.3 Furthermore, the meta-analysis suggested that beneficial effects of GIK are particularly seen if high-dose GIK infusion was used.3;4 This potential dose dependent effect of GIK was also observed before. After the meta-analysis was published, several randomised trials have been reported, also with GIK as adjunctive therapy to reperfusion therapies.5-7 However, most trials had a relative small sample size. A meta-analysis or review of all relevant trials can provide sufficient power to demonstrate differences in outcome. This article will review the currently available data concerning the clinical benefits and potential mechanism of action of GIK. We also performed a stratified analysis of the effects of high and low dose GIK infusion, including all recently published trials. Methods We attempted to obtain results from all completed, published, randomised trials of GIK in acute MI. The literature was scanned by formal searches of electronic databases (MEDLINE) and informal searches for studies concerning the potential mechanism of action of GIK. Since experimental and clinical studies have suggested a dose-response curve of GIK, we performed stratified analyses of the effects of low and high dose of GIK. A high dose GIK was defined as an intravenous infusion of GIK in a dose equal to or higher than used by Rackley et al, 30% glucose (300 mg/L), 50 IU/L regular insulin and 80 mmol/L potassium chloride at 1.5 mL/kg per hour infusion rate.4 Our primary efficacy outcome of interest was hospital mortality. We calculated the relative risk (RR) for hospital death of patients treated with GIK as compared to those treated with placebo or no infusion. The RR and its 95% confidence interval (CI) were calculated for each trial and the grand totals. 115 1998 1987 1977 1978 1976 1999 1968 1965 1968 1967 1971 1995 2003 ECLA Satler Heng Stanley Rogers Pol-GIK Pentecost Mittra MRC Pilcher Hjermann DIGAMI GIPS 476 464 306 314 104 100 49 53 480 488 85 85 100 100 494 460 61 73 55 55 12 15 10 7 135 133 139 Patients (N) 50 IU/L 20 IU/L - Insulin 80 mmol/L 40 mmol/L - Potassium 50 IU 20% 5% 200 g or - 240 g or 160 g or 240 g or 10% 50 IU 80 IU 16 IU placebo 2x10 Usc 2x10 Usc 2x10 Usc 30 IU 10% 20 IU/L 0,9% NaCl/L 300g NaCl 300g 50 IU halfnormal saline 50% 0.3 IU/kg normal saline 160 mmol/L - 55 mEq - 52-78 mEq 52 mEq 52-78 mEq 20 mEq 6.0 g/L 80 mEq/L 80 mEq/L 0.15mmol/kg 300 mg/L 50 IU/L 80 mEq/L 5% dextrose in water 25% 10% - Glucose 3 mL/kg/h 0.7L - - in 1500 - 1.5 l/24h 42 mL/h 42 mL/h 1.5 ml/kg/h 1.5 ml/kg/h 1.5 ml/kg/h 1.5 ml/kg/h 1.5 mL/kg.h 1.0 mL/kg.h - Rate 8-12 h 24 h 10 d 14 d 14 d 14 d 48 h 24 h 24 h 48 h 48 h 6-12 h 1h 48 h 24 h 24 h - Period 4.8 5.8 9.1 11.1 11 20 6 12 103 115 10 24 15 16 44 22 4 9 4 9 1 0 0 0 10 8 16 Mortality (%) 0.82 (0.46-1.46) 0.89 (0.67-1.19) 0.47 (0.19-1.11) 0.48 (0.13-1.54) 0.69 (0.65-1.21) 0.34 (0.13-0.81) 0.93 (0.40-2.14) 1.95 (1.12-3.47) 0.50 (0.11-1.92) 0.40 (0.08-1.57) - - 0.69 (0.27-1.70) 0.63 (0.24-1.52) RR 95% CI 114 Time to Treatment 43 min 9.85±1.07 7.5±1.21 2.5 (1.67-3.58) 45 min 2.5 (1.75-3.9) 48 min 13±7 Chest pain to treatment 11.8 13.3 unknown 11.3 11.6 11.94±1.23 11.3±1.26 9.82 5.0 (3.0-10.1) 5.0 (2.5-10.0) <12 Chest pain to treatment 8 (4-11.5) 7.5 (4-14) Chest pain to treatment 6.8 7.0 11.4 (0.56) 10.1 (0.53) 10.6 (0.50) Chest pain to treatment 4.7 ± 2.7 Time to Random. RR denotes relative risk. CI denotes confidence interval. h denotes hour. d denotes days. min denotes minutes. or denotes oral. Usc denotes units subcutaneous. Year Study Table 1. Diffent glucose-insulin-potassium infusion schemes in 13 trials in acute myocardial infarction Metabolic interventions in acute myocardial infarction Overview of GIK studies in acute MI Results Our search yielded 13 studies, involving 5009 patients. The meta-analysis of FathOrdoubadi and Beatt including 9 studies did not include three recently published trials.3 They also excluded the Diabetes Mellitus, Insulin Glucose Infusion in Acute Myocardial Infarction (DIGAMI) in which GIK (insulin-glucose) was studied in patients with diabetes mellitus or a glucose at admission of >11.0 mmol/L.3;8 Baseline characteristics of all randomised trials are summarised in table 1. The studies used GIK in different doses, and the time from onset of symptoms of myocardial infarction to treatment varied, with a large proportion of patients being treated after more than 6 hours from onset of symptoms. It is shown that in patients with ST segment elevation MI treated by primary coronary intervention, symptom-onset-to-balloon time is related to mortality.9 This study found that a symptom-onset-to-balloon time >4 hour was identified as independent predictor of oneyear mortality. The studies included in the meta-analysis of Fath-Ordoubadi and Beatt had several other limitations.3 Firstly, randomization was not always optimal, resulting in significant differences in baseline clinical characteristics between the two treatment groups.1;10 Secondly, mortality rates were generally very high in both the treatment and in placebo groups, with hospital mortality up to 28%.11 Furthermore, only the study by Satler and colleagues including only 17 patients also received reperfusion therapy.12 The first randomised prospective trial in the era of reperfusion, the DIGAMI study including only patients with diabetes mellitus, found that the combination of insulin-glucose infusion with an intensive insulin treatment for at least three months after discharge resulted in a reduction in hospital mortality of 58% in patients without prior insulin use and a low cardiovascular risk profile.8 Potassium was added to the infusion when necessary. The Estudios Cardiologicos Latinoamerica (ECLA) pilot trial, was published in 1998 and also showed a beneficial effect of GIK.6 This effect was in particular observed in patients who also underwent reperfusion therapy. Hospital-mortality was 5.1% in patients treated with GIK versus 15.1% in controls (P<0.01). Most patients were treated with thrombolysis as reperfusion therapy, whereas only 3% were treated with primary angioplasty. In 1999, the Polish-Glucose-Insulin-Potassium (Pol-GIK) trial was published, including 954 patients.5 This trial demonstrated no differences in cardiac mortality or the occurrence of cardiac events at 35 days between GIK (6.5%) and control patients (4.6%). Total mortality at 35 days was even higher in the GIK group (8.9%) than in controls (4.8%, P<0.01). However, in this trial low-dose GIK was used. The most recent study, the Glucose Insulin Potassium Study (GIPS), included 940 ST segment elevation MI patients all treated with primary angioplasty as reperfusion therapy.7 High-dose GIK resulted in a non-significant reduction of mortality in GIK treated patients in the total patient group (4.8% versus 5.8%, P=0.50). 117 Metabolic interventions in acute myocardial infarction However, a significant mortality reduction was found in patients without signs of heart failure (1.2% versus 4.2%, P=0.01). With regard to the presumed protective effect of GIK infusion on the myocardium, several studies were performed investigating the benefit of GIK infusion during cardiac surgery. Comparison of results is difficult because the studies differed in initiation of GIK (pre, during or post cardiac surgery), duration and dosing of GIK13-15 and end points (including enzymatic myocardial damage, need for inotropic support and mortality). Lazar et al. found a benefit of GIK in two small sized studies.16;17 However, many other trials, including a well sized randomised trial (N=1127), failed to show a clear benefit of GIK infusions in cardiac surgery.18;19 So, no definite conclusions about the use of GIK infusions in cardiac surgery can be drawn. Table 2. 30-day mortality in patients treated with high-dose GIK and low-dose GIK versus control patients of published trials Included patient Trial (ref) GIK patients Heng38 39 Stanley 10 Control patients 30-day mortality GIK patients Control patients N N N (%) N (%) 12 15 1 (8.3) 0 (-) 55 55 4 (7.3) 4 (7.3) 61 73 4 (6.5) 9 (12.3) 10 7 0 (-) 0 (-) ECLA * 135 139 10 (7.4) 16 (11.5)* GIPS7 476 464 23 (4.8) 27 (5.8) 8 306 314 28 (9.2) 35 (11.1) Total (high-dose) 1065 1074 70 (6.6) 96 (8.9) 85 85 10 (11.8) 24 (23.5) 49 53 6 (6.7) 12 (22.7) Rogers Satler12 6 DIGAMI Mittra11 Pilcher40 2 Pentecost 100 100 15 (15.0) 16 (16.0) MRC1 480 488 103 (21.5) 115 (23.6) Hjermann 21 104 100 11 (9.6) 20 (20) 6 ECLA * 133 139 10 (7.5) 16 (11.5)* Pol-GIK5 494 460 44 (8.9) 22 (4.8) Total (low-dose) 1445 1425 199 (13.8) 225 (15.8) Total (all) 2510 2499 269 (10.7) 321 (12.8) Data are number or number (%). Ref denotes reference. N denotes number of patients. ECLA = Estudios Cardiologicos Latinoamerica. GIPS = Glucose-Insulin-Potassium Study. DIGAMI = Diabetes and Insulin-Glucose Infusion in Acute Myocardial Infarction. MRC = Medical Research Council. Pol-GIK = Polish Glucose Insulin Potassium. *In both comparisons the same control group is used; in the total of all patients this groups is accounted for once. 118 Overview of GIK studies in acute MI Time to treatment Time between admission and initiation of GIK varied among the studies. Mittra mentioned 10 hours, whereas in the MRC study 70% of patients were treated within 30 minutes after inclusion.1;11 In the ECLA pilot trial, time from onset of symptoms till the initiation of GIK treatment was 10 to 11 hours.6 Whether the clinical effects of GIK on outcome are influenced by the time of initiation of treatment is not yet known. However, reperfusion may be obligatory as prolonged severe ischemia is followed by necrosis, even in the presence of GIK. Furthermore, GIK might not reach adequate concentrations in nonperfused myocardium. It would be logical to assume that GIK infusion would be most effective when initiated before reperfusion therapy has started, when glucose can temporarily salvage the severely ischemic myocardium and offer protection to possible reperfusion injury still to come.20 Figure 1. Odds ratios and confidence intervals of high-dose and low-dose GIK trials Stanley Rogers GIPS ECLA high-dose DIGAMI Total high-dose Mittra Pentecost MRC Pilcher Hjermann ECLA low-dose Pol-GIK Total low-dose Total 0.0 0.5 GIK better 1.0 1.5 2.0 2.5 Control better GIPS = Glucose-Insulin-Potassium Study. ECLA = Estudios Cardiologicos Latinoamerica. DIGAMI = Diabetes Insulin-Glucose in Acute Myocardial Infarction study MRC = Medical Research Council. Pol-GIK = Polish Glucose Insulin Potassium. In both comparisons of the ECLA the same control group is used; in the total of all patients this groups is accounted for once. 119 Metabolic interventions in acute myocardial infarction Dose The above-mentioned meta-analysis showed that use of high-dose GIK is most effective.3 This was also demonstrated in dose-response studies, showing that increasing doses were associated with more suppressed arterial FFA levels as well as increased myocardial glucose uptake. Also the ECLA pilot-trial confirmed that high-dose GIK was superior to low-dose.6 In the Pol-GIK trial, using a very low dose of GIK, no effect of GIK was observed.5 Moreover, using this low dose regimen resulted in an increase in total mortality rate. We performed a stratified analysis according to GIK-dose, including all randomized trials investigating the influence of GIK on in-hospital mortality (table 2). Administration of high dose GIK resulted in a reduction of hospital mortality (6.6% versus 8.9%, RR 0.7; 95%CI: 0.5–1.0, P=0.04). Administration of low dose GIK versus placebo did not result in a significant difference of in-hospital mortality (13.8% versus 15.8%, RR 0.9; 95%CI: 0.7–1.1, P=0.13). Overall, GIK reduced statistically significant hospital mortality from 13% versus 11% (RR 0.8; 95%CI: 0.7-1.0, P=0.02) (figure 1). Adverse effects The reported adverse effects of GIK treatment were in general mild. Withdrawal because of side-effects was rare. As GIK was infused via peripheral intravenous catheters, phlebitis was relative common with percentages up to 15%2, but severe phlebitis however was rare.11 Infusion of large amounts of fluid in a short period may cause fluid overload. This potential adverse reaction was however, not reported in the meta-analysis. Possibly, because of inclusion of only few patients with Killip class >1 in earlier trials. Other studies demonstrated a small increase of signs of congestive heart failure after GIK.21 In the GIPS trial, there was a trend towards a higher mortality in GIK treated patients with Killip class >1 (36% versus 27%), possibly due to volume overload.7 A potential side-effect of GIK infusion is the induction of hypoglycemia.22 In the DIGAMI study, 15% of the patients who received intensified therapy had a hypoglycemic event (glucose <3.0 mmol/L), compared to none in the control group.8;23 In the Pol-GIK trial hypoglycemia occurred in 8% of the patients, where after the insulin dose was decreased.5 They also found hyperglycemia in less than 1% in 585 patients with no differences between GIK and control group. In the GIPS hyperglycemia occurred also in the GIK group although the period was short-lived. With a blood glucose level >16.8 mmol/L as criteria for interruption in the Pol-GIK; only 1% was interrupted. This is not surprising since a low dose GIK infusion was used. Hjermann and colleagues used a reduced dose of insulin, which prevented the occurrence of hypoglycemia.21 120 Overview of GIK studies in acute MI Mode of action There are several potential mechanisms by which GIK therapy might improve outcome after acute myocardial infarction. Although the primary energy substrate for the nonischemic myocardium is free fatty acids (FFA), the myocardium uses various forms of energy substrates, including glucose.24 During an acute myocardial infarction, circulating FFA levels are elevated and insulin sensitivity is reduced, limiting cellular uptake of glucose and promoting the use of FFA.25 These FFA are thought to have a detrimental effect on ischemic myocardium through varying pathways. They are an energy supply which is associated with relatively high oxygen consumption in comparison to the utilisation of glucose.26 Moreover, in contrast with glucose, FFA can not be metabolised without insulin. Indeed, experimental evidence suggests a negative influence of FFA on myocardial mechanical performance in the setting of hypoxia.27 Furthermore, excess FFA metabolism increases susceptibility to ventricular arrhythmia’s and reperfusion injury due to disturbances in calcium homeostasis and accumulation of free radicals.28;29 Administration of GIK lowers the circulating levels of FFA through the inhibitory effect of insulin on lipolyses.30 This decrease in FFA levels, in combination with an increase in glucose and insulin availability, promotes the myocardial use of glucose over FFA.28 Glucose is less oxygen consuming and has beneficial effect on preservation of mechanical function and membrane stability.31-33 Moreover, GIK therapy might also reduce 34 arrhythmias after successful reperfusion. As insulin itself induces coronary vasodilation, myocardial metabolism could further be improved through enhanced myocardial perfusion.35-37 SPECT analysis showed that GIK infusion improved regional myocardial perfusion and function in segments adjacent to recently infarcted areas using in human subjects.36 Recent evidence suggests that insulin might also inhibit reperfusion injury by inhibiting apoptosis via activation of innate cell-survival pathways in the heart.20 Conclusion Of 13 published randomized trials, 12 studies reported mortality reduction after GIK. Despite the possibility of existence of a publication bias, i.e. small negative trials that not have been published, this seems promising. Most effects were observed when GIK was given in a high dose and when it was given as an adjunctive to reperfusion therapy. Adverse effects were rare, fluid overload may be a problem in certain patients, such as patients with signs of heart failure at admission. To achieve definite conclusions about the place of GIK in acute myocardial infarction, more randomized trials in which GIK is combined with optimal reperfusion therapy are needed. Currently large trials in different populations are undertaken and within a few years more evidence will be available. Possibly these data will change daily practice. 121 Metabolic interventions in acute myocardial infarction References 1. Medical Research Council Working Party on the Treatment of Myocardial Infarction. Potassium, glucose, and insulin treatment for acute myocardial infarction. Lancet 1968;2:1355-60. 2. Pentecost BL, Mayne NM, Lamb P. Controlled trial of intravenous glucose, potassium, and insulin in acute myocardial infarction. Lancet 1968;1:946-48. 3. Fath-Ordoubadi F, Beatt KJ. Glucose-insulin-potassium therapy for treatment of acute myocardial infarction: an overview of randomized placebo-controlled trials. Circulation 1997;96:1152-56. 4. Rackley CE, Russell RO, Jr., Rogers WJ, Mantle JA, McDaniel HG. Glucose-insulin-potassium infusion in acute myocardial infarction. Review of clinical experience. Postgrad Med 1979;65:93-99. 5. Ceremuzynski L, Budaj A, Czepiel A et al. Low-dose glucose-insulin-potassium is ineffective in acute myocardial infarction: results of a randomized multicenter Pol-GIK trial. Cardiovasc Drugs Ther 1999;13:191-200. 6. Diaz R, Paolasso EA, Piegas LS et al. Metabolic modulation of acute myocardial infarction. The ECLA (Estudios Cardiologicos Latinoamerica) Collaborative Group. Circulation 1998;98:2227-34. 7. van der Horst IC, Zijlstra F, van't Hof AW et al. Glucose-insulin-potassium infusion in patients treated with primary angioplasty for acute myocardial infarction: the glucose-insulinpotassium study: a randomized trial. J Am Coll Cardiol 2003;42:784-91. 8. Malmberg K, Ryden L, Efendic S et al. Randomized trial of insulin-glucose infusion followed by subcutaneous insulin treatment in diabetic patients with acute myocardial infarction (DIGAMI study): effects on mortality at 1 year. J Am Coll Cardiol 1995;26:57-65. 9. De Luca G, Suryapranata H, Zijlstra F et al. Symptom-onset-to-balloon time and mortality in patients with acute myocardial infarction treated by primary angioplasty. J Am Coll Cardiol 2003;42:991-97. 10. Rogers WJ, Stanley AW, Jr., Breinig JB et al. Reduction of hospital mortality rate of acute 11. Mittra B. Potassium, glucose, and insulin in treatment of myocardial infarction. Lancet myocardial infarction with glucose-insulin-potassium infusion. Am Heart J 1976;92:441-54. 1965;2:607-9. 12. Satler LF, Green CE, Kent KM, Pallas RS, Pearle DL, Rackley CE. Metabolic support during 13. Lazar HL, Zhang X, Rivers S, Bernard S, Shemin RJ. Limiting ischemic myocardial damage 14. Lazar HL, Chipkin SR, Fitzgerald CA, Bao Y, Cabral H, Apstein CS. Tight glycemic control in coronary reperfusion. Am Heart J 1987;114:54-58. using glucose-insulin-potassium solutions. Ann Thorac Surg 1995;60:411-16. diabetic coronary artery bypass graft patients improves perioperative outcomes and decreases recurrent ischemic events. Circulation 2004;109:1497-502. 15. Rao V, Christakis GT, Weisel RD, Ivanov J, Borger MA, Cohen G. The insulin cardioplegia trial: myocardial protection for urgent coronary artery bypass grafting. J Thorac Cardiovasc Surg 2002;123:928-35. 122 Overview of GIK studies in acute MI 16. Lazar HL, Philippides G, Fitzgerald C, Lancaster D, Shemin RJ, Apstein C. Glucose-insulinpotassium solutions enhance recovery after urgent coronary artery bypass grafting. J Thorac Cardiovasc Surg 1997;113:354-60. 17. Lazar HL, Chipkin S, Philippides G, Bao Y, Apstein C. Glucose-insulin-potassium solutions improve outcomes in diabetics who have coronary artery operations. Ann Thorac Surg 2000;70:145-50. 18. Lell WA, Nielsen VG, McGiffin DC, Schmidt FE, Jr., Kirklin JK, Stanley AW, Jr. Glucose-insulinpotassium infusion for myocardial protection during off-pump coronary artery surgery. Ann Thorac Surg 2002;73:1246-51. 19. Smith A, Grattan A, Harper M, Royston D, Riedel BJ. Coronary revascularization: a procedure in transition from on-pump to off-pump? The role of glucose-insulin-potassium revisited in a randomized, placebo-controlled study. J Cardiothorac Vasc Anesth 2002;16:413-20. 20. Sack MN, Yellon DM. Insulin therapy as an adjunct to reperfusion after acute coronary ischemia: a proposed direct myocardial cell survival effect independent of metabolic modulation. J Am Coll Cardiol 2003;41:1404-7. 21. Hjermann I. A controlled study of peroral glucose, insulin and potassium treatment in myocardial infarction. Acta Med Scand 1971;190:213-18. 22. Sands MJ, Jr., McDonough MT, Neubauer SJ, Lemole GM, Spann JF. Hypoglycemia 23. Malmberg KA, Efendic S, Ryden LE. Feasibility of insulin-glucose infusion in diabetic patients complicating the use of solution of glucose, insulin and potassium. Chest 1975;67:363-65. with acute myocardial infarction. A report from the multicenter trial: DIGAMI. Diabetes Care 1994;17:1007-14. 24. Neely JR, Rovetto MJ, Whitmer JT, Morgan HE. Effects of ischemia on function and 25. Rutenberg HL, Pamintuan JC, Soloff LA. Serum-free-fatty-acids and their relation to 26. Vik-Mo H, Mjos OD. Influence of free fatty acids on myocardial oxygen consumption and metabolism of the isolated working rat heart. Am J Physiol 1973;225:651-58. complications after acute myocardial infarction. Lancet 1969;2:559-64. ischemic injury. Am J Cardiol 1981;48:361-65. 27. Severeid L, Connor WE, Long JP. The depressant effect of fatty acids on the isolated rabbit 28. Oliver MF, Opie LH. Effects of glucose and fatty acids on myocardial ischaemia and heart. Proc Soc Exp Biol Med 1969;131:1239-43. arrhythmias. Lancet 1994;343:155-58. 29. Tansey MJ, Opie LH. Relation between plasma free fatty acids and arrhythmias within the first 30. McDaniel HG, Papapietro SE, Rogers WJ et al. Glucose-insulin-potassium induced alterations twelve hours of acute myocardial infarction. Lancet 1983;2:419-22. in individual plasma free fatty acids in patients with acute myocardial infarction. Am Heart J 1981;102:10-15. 31. Cave AC, Ingwall JS, Friedrich J et al. ATP synthesis during low-flow ischemia: influence of increased glycolytic substrate. Circulation 2000;101:2090-2096. 32. Heng MK, Norris RM, Peter T, Nisbet HD, Singh BN. The effect of glucose-insulin-potassium on experimental myocardial infarction in the dog. Cardiovasc Res 1978;12:429-35. 123 Metabolic interventions in acute myocardial infarction 33. Rackley CE, Russell RO, Jr., Rogers WJ, Mantle JA, McDaniel HG, Papapietro SE. Glucoseinsulin-potassium administration in acute myocardial infarction. Annu Rev Med 1982;33:37583. 34. Eberli FR, Weinberg EO, Grice WN, Horowitz GL, Apstein CS. Protective effect of increased glycolytic substrate against systolic and diastolic dysfunction and increased coronary resistance from prolonged global underperfusion and reperfusion in isolated rabbit hearts perfused with erythrocyte suspensions. Circ Res 1991;68:466-81. 35. Laine H, Nuutila P, Luotolahti M et al. Insulin-induced increment of coronary flow reserve is not abolished by dexamethasone in healthy young men. J Clin Endocrinol Metab 2000;85:1868-73. 36. Marano L, Bestetti A, Lomuscio A et al. Effects of infusion of glucose-insulin-potassium on myocardial function after a recent myocardial infarction. Acta Cardiol 2000;55:9-15. 37. Sundell J, Knuuti J. Insulin and myocardial blood flow. Cardiovasc Res 2003;57:312-19. 38. Heng MK, Norris RM, Singh BN, Barratt-Boyes C. Effects of glucose and glucose-insulinpotassium on haemodynamics and enzyme release after acute myocardial infarction. Br Heart J 1977;39:748-57. 39. Stanley AW, Jr., Prather JW. Glucose-insulin-potassium, patient mortality and the acute 40. Pilcher J, Etishamudin M, Exon P, Moore J. Potassium, glucose and insulin in myocardial myocardial infarction: results from a prospective randomised study. Circulation 1978;57:61. infarction. Lancet 1967;1:1109. 124 Admission glucose and long-term outcome Chapter 4.1 Prognostic value of admission glucose in non-diabetic patients with myocardial infarction Jorik R Timmer, Iwan CC van der Horst, Jan Paul Ottervanger, José PS Henriques, Jan CA Hoorntje, Felix Zijlstra, on behalf of the Zwolle Myocardial Infarction Study Group American Heart Journal 2004;148:399-404 125 Metabolic interventions in acute myocardial infarction Abstract Introduction Patients with acute myocardial infarction (MI) who have diabetes have an increased risk of mortality. In non-diabetic patients, admission glucose levels may also be a predictor of survival. However, data regarding admission glucose and long-term outcome in nondiabetic patients treated with reperfusion therapy for acute MI are limited. Methods We investigated long-term clinical outcome in 356 consecutive non-diabetic patients with ST segment elevation MI, treated with primary percutaneous coronary intervention (PCI) or thrombolysis as reperfusion therapy. Mean follow up was 8±2 years. The patients were divided based on admission glucose level; group I: <7.8 mmol/L, group II: 7.8−11.0 mmol/L and group III: ≥11.1 mmol/L. Results Mortality in group I (N=163) was 19.0%, in group II (N=151) 26.5% and in group III (N=42) 35.7% (P<0.05). Higher glucose levels were associated with larger enzymatic infarct sizes (P<0.01) and more reduced residual left ventricular function (P<0.05). Multivariate analysis showed that Killip class >1 at admission, odds ration (OR) 2.9 (95% confidence interval 1.7–5.0, P<0.001), age ≥60 years, OR 2.4 (1.5–4.0, P=0.001), thrombolysis as compared to PCI, OR 1.7 (1.1–2.7, P=0.02), admission glucose category, OR 1.4 (1.0–1.9, P=0.04) and anterior location, OR 1.6 (1.0–2.6, 0.03) were independent predictors of longterm clinical outcome. Conclusion Elevated admission glucose levels in non-diabetic patients treated with reperfusion therapy for ST segment elevation MI are independently associated with larger infarct size and higher long-term mortality. 126 Admission glucose and long-term outcome Introduction Prognosis after ST segment elevation myocardial infarction (MI) has improved markedly, in particular due to reperfusion therapy by either thrombolytic therapy or primary percutaneous coronary intervention (PCI).1-3 Despite these advantages in treatment regimen, patients with diabetes mellitus (DM) still have a poor prognosis after ST segment elevation MI.4;5 Interestingly, this increased risk is not confined to DM patients only, but non DM patients with impaired glucose tolerance (IGT) may also have an increased incidence of cardiovascular complications.6 Moreover, increased admission glucose levels may be related to a higher mortality in patients with acute myocardial infarction (MI), regardless of diabetic status.7;8 These elevated glucose levels are thought to reflect pre existent IGT or increased physical stress. However, data regarding admission glucose and long-term clinical outcome in non-diabetic patients after ST segment elevation MI are limited and mainly based on patient groups in which only part of the patients received reperfusion therapy.9;10 Therefore, we investigated the influence of admission glucose levels on long-term clinical outcome in non-diabetic patients, all treated with reperfusion therapy, either with thrombolysis or primary PCI, for acute ST segment elevation MI. Methods It concerns a sub-analysis of the so-called ‘Zwolle trial’, a randomized study comparing primary PCI with thrombolysis, as described before.3 Baseline characteristics, clinical data, angiographic data and outcomes were recorded prospectively in a dedicated database. Patients were enrolled if they had no contraindications for thrombolytic therapy; had symptoms of acute myocardial infarction lasting longer than 30 minutes, accompanied by an electrocardiogram with ST segment elevation of more than 1 mm (0.1 mV) in two or more contiguous leads; and presented within 6 hours, or between 6 to 24 hours if there was evidence for continuing ischemia. After informed consent had been obtained, patients were randomly assigned to undergo PCI or to receive streptokinase (SK) as thrombolytic agent. All patients received heparin and aspirin. Additional revascularisation procedures were performed if indicated for symptoms or signs of myocardial ischemia, medication was according to the guidelines.11 Global left ventricular ejection fraction was measured by equilibrium radionuclide ventriculography between days 4 and 10 after treatment.12 Enzymatic infarct size was estimated by measurement of serial lactate dehydrogenase (LDH) activity. Cumulative enzyme release from 5 to 7 serial measurements up to 72 hours after symptom onset (LDH Q72) was calculated, without knowledge of the randomization outcome or clinical data. Previous cardiovasculair disease (CVD) was defined as a history of acute MI, coronary artery bypass grafting or PCI. 127 Metabolic interventions in acute myocardial infarction Nonfatal recurrent myocardial infarction was defined as the combination of chest pain, changes in the ST T segment, and a second increase in the serum creatine kinase level to more than two times the upper limit of normal. If the creatine kinase level had not decreased to normal levels, a second increase of more than 200 IU per liter over the previous value was regarded as indicating a recurrent infarction.12 Patients with DM were defined as patients with documented DM using either oral hypoglycemic agents or insulin treatment at admission. For the purpose of this sub-analysis, patients with DM were excluded. The remaining patients were divided into 3 groups regarding to admission glucose levels. Group I consisted of patients with no evidence of impaired glucose metabolism (glucose <7.8 mmol/L), group II consisted of patients with possible impaired glucose metabolism (glucose 7.8–11.0 mmol/L) and group III consisted of patients with profound impaired glucose metabolism (glucose ≥11.1 mmol/L). These cut-off values are based on diagnostic criteria for IGT and DM advised by the American Diabetes Association.13 Follow-up information was obtained in September 2000.14 All outpatients' reports were reviewed, and general practitioners were contacted by phone. For patients who had clinical events during follow-up, hospital records were reviewed. All subsequent hospital admissions (for angina, recurrent infarction, additional intervention or heart failure) and medication used during follow-up were recorded. Statistical analysis Statistical analysis was performed using Statistical Package for the Social Sciences (SPSS Inc., Chicago, IL, USA) version 10.0. Differences between group means were tested by two-tailed Student's t-test. A chi-square statistic was calculated to test differences between proportions, with calculation of odds ratios (OR) and exact 95% confidence intervals. The Fisher exact test was used when the expected value of cells was smaller than 5. Statistical significance was defined as a P-value <0.05. Cumulative survival curves were constructed according to the Kaplan–Meier method and differences between the curves were tested for significance by the Log-rank statistic. Cox proportional-hazards regression model was used to estimate the independent association between glucose levels and long-term mortality. Correlations between numeric variables were calculated using the bivariate Pearson correlation coefficient. Results Baseline characteristics The Zwolle trial patient cohort consisted of 395 patients. Of these patients, 32 (8%) had known DM and from 7 patients no laboratory data were available. Therefore, the present 128 Admission glucose and long-term outcome sub-analysis included 356 patients. Of the 356 patients, the mean age was 59 ±10 year and there were 293 male patients (82%). Residual ejection fraction of the left ventricle (LVEF) was measured in 337 patients (95%) and enzymatic infarct size in 333 patients (94%). During the total follow up period 86 patients died (24%). Table 1. Baseline clinical and demographic characteristics of three patient groups Group I Group II Group III (<7.8 mmol/L) (7.8−11.0 mmol/L) (≥11.1 mmol/L) 163 (46) 151 (42) 42 (12) 58±11 60±10∗ 64±9∗ Men 139 (85) 122 (81) 32 (76) Anterior MI 57 (35) 58 (38) 16 (41) Previous CVD 38 (23) 27 (18) 8 (19) Multi-vessel disease 92 (58) 74 (49) 26 (62) Primary PCI 84 (52) 66 (44) 24 (57) Killip class >1 15 (9) 19 (13) 7 (17) 190±205 171±175 229±239 Death 31 (19) 40 (27) 15 (36)∗ MACE 53 (33 ) 58 (38) 17 (41) Glucose level Number of patients Age, years (mean±SD) Time to admission, min (mean±SD) Outcome Data are number (%) unless otherwise indicated. ∗ Denotes statistical difference (P<0.05) compared to group I. MI = myocardial infarction. CVD = cardiovascular disease. MACE = major adverse cardiac event. PCI = percutaneous coronary intervention. Admission glucose levels The mean admission glucose level was 8.6±3.1 mmol/L (range 5.1 to 34.1 mmol/L). Mean glucose levels were higher in females compared to males (9.3±4.1 versus 8.4±2.9 mmol/L, P=0.048), in patients with age ≥60 year (9.0±3.5 versus 8.2±2.6 mmol/L, P=0.016) and in those who had Killip class >1 at presentation (9.7±4.8 mmol/L versus 8.5±2.8 mmol/L, P=0.019). There was no association between infarct location, reperfusion strategy, previous CVD, multi-vessel disease and glucose levels. In table 1, the baseline characteristics of patients in the 3 glucose categories are compared. Again, elevated glucose was more often observed in females, in patients with a higher age and in those with Killip class >1 at presentation. There were no significant differences with regard to discharge medication between the three glucose categories 129 Metabolic interventions in acute myocardial infarction Glucose and infarct size There was a clear association between glucose levels, enzymatic infarct size and LVEF. Higher admission glucose was strongly correlated with larger enzymatic infarct size (R = 0.2, P<0.01) and lower LVEF (R = 0.1, P<0.05). Subsequently, mean enzymatic infarct size was highest in the patient group with the highest admission glucose (figure 1) and the mean residual LVEF was lowest in this patient group (figure 2). Table 2. Predictors of Long-term Mortality, multivariate analysis OR 95% confidence interval P-value Killip class >1 2.9 1.7–5.0 <0.001 Age ≥60 year 2.4 1.5–4.0 0.001 Thrombolysis∗ 1.7 1.1–2.7 0.02 Glucose category† 1.4 1.0–1.9 0.04 Anterior MI 1.6 1.0–2.6 0.03 Previous CVD 1.3 0.8–2.2 0.29 Multi-vessel disease 1.3 0.8–2.1 0.27 Female gender 1.2 0.7–2.1 0.53 ∗ As compared to primary percutaneous coronary intervention. † Glucose < 7.8 mmol/L, 7.8 – 11.0 mmol/L and glucose ≥11.1 mmol/L; glucose <7.8 mmol/L was the reference group. MI = myocardial infarction. CVD = cardiovascular disease. Long-term mortality Mean glucose level in patients who died during follow-up was 9.5±4.6 mmol/L compared with 8.3±2.5 mmol/L in survivors (P=0.003). There was a gradual increase in mortality between the three glucose categories. Thirty-one patients died in group I (19.0%), 40 patients in group II (26.5%) and 15 patients in group III (35.7%). Mortality was significantly higher in the patient group with highest glucose compared to the group with normal glucose levels (P<0.05). MACE endpoints were reached in 53 patients (32.5%) in group I, in 58 patients (38.4%) in group II and in 17 (40.5%) patients in group III (table 1). KaplanMeier curves for cumulative mortality of patients in the 3 categories are shown in figure 3. Log-rank statistics showed significant differences in overall mortality between the patient groups (Log-rank 7.1; P= 0.029). Reperfusion strategy In order to investigate whether reperfusion strategy influences the association of admission glucose with long-term outcome, we stratified patients according to their randomization (primary PCI or thrombolysis). Regardless of reperfusion strategy, higher glucose levels were associated with more reduced LVEF and higher mortality. In all three 130 Admission glucose and long-term outcome patient groups treatment with PCI resulted in better preservation of LVEF, a smaller enzymatic infarct size and lower mortality compared to treatment with thrombolysis. In patients treated with primary PCI, no significant difference with regard to TIMI flow (Thrombolyis In Myocardial Infarction) prior and post intervention was present between the glucose categories. Figure 1. Mean enzymatic infarct size (LDH Q72) in the three patient groups P < 0.05 1600 1525 Mean LDH Q 72 (IU/L) 1400 1216 1200 1000 882 800 0 < 7.8 7.8 - 11.0 ≥ 11.1 Glucose levels (mmol/L) Multivariate analyses To study the independent predictive value of admission glucose on long-term survival, multivariate regression analysis was performed including age, reperfusion strategy, gender and all variables that were significant predictors in univariate analysis. Unadjusted predictors of long-term mortality were Killip class >1, increased age, anterior MI, previous CVD and multi-vessel disease. After multivariate analysis, the presence of Killip class >1 at admission odds ratio (OR) 2.9 (95% confidence interval 1.7–5.0, P<0.001), age ≥60 years, OR 2.4 (1.5–4.0, P=0.001), thrombolysis as reperfusion strategy, OR 1.7 (1.1–2.7, 131 Metabolic interventions in acute myocardial infarction P=0.02), admission glucose category, OR 1.4 (1.0–1.9, P=0.04) and anterior location, OR 1.6 (1.0–2.6, P=0.03) were independent predictors of long-term mortality (table 2). Figure 2. Mean residual left ventricular ejection fraction (LVEF) in the three patient groups 50 49.2 % 49 P < 0.05 LVEF (%) 48 46.8% 47 46 45.7% 45 0 7.8 - 11.0 < 7.8 ≥ 11.1 Glucose levels (mmol/L) Discussion Our study demonstrates that in non DM patients with ST segment elevation MI, elevated glucose levels on admission are associated with larger infarct sizes and increased longterm mortality compared to normal glucose levels on admission. Although the pathophysiological mechanism is unknown, this adverse relation of elevated glucose levels on admission with increased mortality is evident, despite the use or method of reperfusion therapy, and adjusting for other predictors of long-term mortality. Impaired glucose tolerance Patients with elevated glucose levels on admission may represent individuals who do not meet the diagnostic criteria of DM but have a mild form of dysglycemia. This impairment in glucose metabolism may lead to hyperglycemia during stressful events, such as acute 132 Admission glucose and long-term outcome MI. This sub or pre diabetic state, also known as impaired glucose tolerance (IGT), is associated with a higher incidence of cardiovascular events.15;16 As these patients also appear to have an increased mortality after acute MI, specific risk reducing interventions should be considered. Exercise training, dietary modifications and medical intervention reduce the risk of subsequent DM in these patients and may be of value.17;18 Figure 3. Kaplan-Meier curve showing overall mortality of the three patient groups. Logrank P=0.029 80 Overall mortality (%) 70 I: glucose< 7.8 mmol/L N = 163 II: glucose 7.8 – 11.0 mmol/L N = 151 III: glucose≥ 11.1 mmol/L N = 42 60 50 40 Group III Group II 30 Group I 20 10 0 1 2 3 4 5 6 7 8 9 Time after admission (years) However, intervention during hospitalization may also be of benefit. Interestingly, a stringent insulin regimen in DM patients with acute MI abolished the increase in mortality associated with elevated admission glucose levels. Whether insulin therapy or intervention through other hypoglycemic agents is also beneficial for IGT patients with acute MI is unknown. Stress related hyperglycemia and GIK A stress response is accompanied by high levels of catecholamines such as cortisol and adrenaline. These hormones increase glycogenolysis, lipolysis and reduce insulin 133 Metabolic interventions in acute myocardial infarction sensitivity resulting in elevated glucose levels.19 Therefore, patients with elevated glucose levels could represent patients with an increased response to stress, for example due to more severe hemodynamic compromise or more extensive myocardial damage. Indeed, in our study, patients with elevated glucose levels did more often have Killip class >1 at admission, had larger enzymatic infarct size and more reduced LVEF. All these variables are known to be predictors of long-term mortality.20-22 However, in our sub-analysis, after adjusting for confounding variables (including Killip class), there was still an association between admission glucose and long-term mortality. Furthermore, other evidence also suggests that dysglycemia during acute MI is more than only an epiphenomenon. Stress induced elevation of free fatty acids (FFA) may also compromise myocardial function as they reduce contractility and increase ischemic and reperfusion injury.23 Moreover, the adverse relation between admission glucose and clinical outcome is also present in patients suffering from acute coronary events without myocardial damage.24 There is some evidence that improvement of metabolic control through infusion of fluids containing glucose, insulin and potassium (GIK) may reduce mortality in acute MI.25-27 The beneficial effect of GIK is thought to result from a shift in primary energy substrate from FFA to glucose during ischemia. Our study confirms the importance of dysglycemia during acute MI, but further investigations regarding glycometabolic control should be initiated and awaited for. Reperfusion strategy Patients treated with PCI had better survival and less reduced LVEF than patients treated with thrombolysis, these results are in line with other studies.28;29 The impact of glucose levels on outcome however, was independent of reperfusion strategy. Patients with higher glucose levels had higher mortality, larger enzymatic infarct sizes and more reduced LVEF whether treated with PCI or with thrombolysis. So, apart from primary PCI, additional treatment of patients with elevated glucose is needed. Study limitations Our study included only a limited number of patients from a single center. We have no data on glycolysated hemoglobin (HbA1C) in our patients, which could have given more insight in the prevalence of IGT in our population. No routine tests were performed to detect undiagnosed DM after admission. However, a significant interaction of diabetic status with the association of hyperglycemia with adverse outcome is unlikely.24 Although non-fasting admission glucose levels may be influenced by prior meals or diurnal variations, the impact of a concomitant acute MI on glucose levels is probably much more substantial. Furthermore, as admission glucose is readily available, it has the advantage that immediate intervention can be instituted. Metabolic control through GIK infusions as 134 Admission glucose and long-term outcome adjunctive treatment was not used in our patients and, especially in patients with more severe glycometabolic derangement, this may have had influence on outcome.30 During the study period, intracoronary stenting and treatment with glycoprotein IIb/IIIa receptor blockers or clopidogrel were not available. Conclusion Elevated admission glucose levels in non-diabetic patients with admission MI are independently associated with larger infarct sizes and a higher long-term mortality when compared to patients with normal glucose levels. These findings warrant further investigation regarding glycometabolic control during acute MI and secondary prevention programs in patients with high admission glucose. References 1. Effectiveness of intravenous thrombolytic treatment in acute myocardial infarction. Gruppo Italiano per lo Studio della Streptochinasi nell'Infarto Miocardico (GISSI) Lancet 1986;1:397402. 2. Granger CB, Califf RM, Topol EJ. Thrombolytic therapy for acute myocardial infarction. A review. Drugs 1992;44:293-325. 3. Zijlstra F, Hoorntje JC, de Boer MJ et al. Long-term benefit of primary angioplasty as compared with thrombolytic therapy for acute myocardial infarction. N Engl J Med 1999;341:1413-19. 4. Mak KH, Moliterno DJ, Granger CB et al. Influence of diabetes mellitus on clinical outcome in the thrombolytic era of acute myocardial infarction. GUSTO-I Investigators. Global Utilization of Streptokinase and Tissue Plasminogen Activator for Occluded Coronary Arteries. J Am Coll Cardiol 1997;30:171-79. 5. Waldecker B, Waas W, Haberbosch W et al. Type 2 diabetes and acute myocardial infarction. Angiographic findings and results of an invasive therapeutic approach in type 2 diabetic versus nondiabetic patients. Diabetes Care 1999;22:1832-38. 6. Gerstein HC, Yusuf S. Dysglycaemia and risk of cardiovascular disease. Lancet 1996;347:94950. 7. Fava S, Aquilina O, Azzopardi J, Agius MH, Fenech FF. The prognostic value of blood glucose in diabetic patients with acute myocardial infarction. Diabet Med 1996;13:80-83. 8. Oswald GA, Smith CC, Betteridge DJ, Yudkin JS. Determinants and importance of stress hyperglycaemia in non-diabetic patients with myocardial infarction. Br Med J (Clin Res Ed) 1986;293:917-22. 9. Norhammar AM, Ryden L, Malmberg K. Admission plasma glucose. Independent risk factor for long-term prognosis after myocardial infarction even in nondiabetic patients. Diabetes Care 1999;22:1827-31. 135 Metabolic interventions in acute myocardial infarction 10. Wahab NN, Cowden EA, Pearce NJ, Gardner MJ, Merry H, Cox JL. Is blood glucose an independent predictor of mortality in acute myocardial infarction in the thrombolytic era? J Am Coll Cardiol 2002;40:1748-54. 11. Van de Werf F, Ardissino D, Betriu A et al. Management of acute myocardial infarction in patients presenting with ST-segment elevation. The Task Force on the Management of Acute Myocardial Infarction of the European Society of Cardiology. Eur Heart J 2003;24:28-66. 12. Zijlstra F, de Boer MJ, Hoorntje JC, Reiffers S, Reiber JH, Suryapranata H. A comparison of immediate coronary angioplasty with intravenous streptokinase in acute myocardial infarction. N Engl J Med 1993;328:680-684. 13. Report of the expert committee on the diagnosis and classification of diabetes mellitus 14. Henriques JP, Ottervanger JP, Zijlstra F. Prognostic Importance of Left Ventricular Function Diabetes Care 2003;26 Suppl 1:S5-20. after Angioplasty or Thrombolysis for Acute Myocardial Infarction: Long-Term Results of the Zwolle Trial. Cardiovasc reviews and reports 2001;22:343-48. 15. Coutinho M, Gerstein HC, Wang Y, Yusuf S. The relationship between glucose and incident cardiovascular events. A metaregression analysis of published data from 20 studies of 95,783 individuals followed for 12.4 years. Diabetes Care 1999;22:233-40. 16. Eschwege E, Richard JL, Thibult N et al. [Diabetes, hyperglycemia, hyperinsulinemia and risk of cardiovascular mortality. Findings of the Paris Prospective Survey, 10 years later]. Rev Epidemiol Sante Publique 1985;33:352-57. 17. Buchanan TA, Xiang AH, Peters RK et al. Preservation of pancreatic beta-cell function and prevention of type 2 diabetes by pharmacological treatment of insulin resistance in high-risk hispanic women. Diabetes 2002;51:2796-803. 18. Tuomilehto J, Lindstrom J, Eriksson JG et al. Prevention of type 2 diabetes mellitus by changes in lifestyle among subjects with impaired glucose tolerance. N Engl J Med 2001;344:1343-50. 19. Mizock BA. Alterations in fuel metabolism in critical illness: hyperglycaemia. Best Pract Res Clin Endocrinol Metab 2001;15:533-51. 20. Burns RJ, Gibbons RJ, Yi Q et al. The relationships of left ventricular ejection fraction, endsystolic volume index and infarct size to six-month mortality after hospital discharge following myocardial infarction treated by thrombolysis. J Am Coll Cardiol 2002;39:30-36. 21. DeGeare VS, Boura JA, Grines LL, O'Neill WW, Grines CL. Predictive value of the Killip classification in patients undergoing primary percutaneous coronary intervention for acute myocardial infarction. Am J Cardiol 2001;87:1035-38. 22. Gosselink AT, Liem AL, Reiffers S, Zijlstra F. Prognostic value of predischarge radionuclide ventriculography at rest and exercise after acute myocardial infarction treated with thrombolytic therapy or primary coronary angioplasty. The Zwolle Myocardial Infarction Study Group. Clin Cardiol 1998;21:254-60. 23. Mjos OD. Effect of free fatty acids on myocardial function and oxygen consumption in intact 24. Foo K, Cooper J, Deaner A et al. A single serum glucose measurement predicts adverse dogs. J Clin Invest 1971;50:1386-89. outcomes across the whole range of acute coronary syndromes. Heart 2003;89:512-16. 136 Admission glucose and long-term outcome 25. Diaz R, Paolasso EA, Piegas LS et al. Metabolic modulation of acute myocardial infarction. The ECLA (Estudios Cardiologicos Latinoamerica) Collaborative Group. Circulation 1998;98:2227-34. 26. Fath-Ordoubadi F, Beatt KJ. Glucose-insulin-potassium therapy for treatment of acute myocardial infarction: an overview of randomized placebo-controlled trials. Circulation 1997;96:1152-56. 27. van der Horst IC, Zijlstra F, van't Hof AW et al. Glucose-insulin-potassium infusion in patients treated with primary angioplasty for acute myocardial infarction: the glucose-insulinpotassium study: a randomized trial. J Am Coll Cardiol 2003;42:784-91. 28. Grines C, Patel A, Zijlstra F, Weaver WD, Granger C, Simes RJ. Primary coronary angioplasty compared with intravenous thrombolytic therapy for acute myocardial infarction: six-month follow up and analysis of individual patient data from randomized trials. Am Heart J 2003;145:47-57. 29. Nunn CM, O'Neill WW, Rothbaum D et al. Long-term outcome after primary angioplasty: report from the primary angioplasty in myocardial infarction (PAMI-I) trial. J Am Coll Cardiol 1999;33:640-646. 30. Malmberg K, Norhammar A, Wedel H, Ryden L. Glycometabolic state at admission: important risk marker of mortality in conventionally treated patients with diabetes mellitus and acute myocardial infarction: long-term results from the Diabetes and Insulin-Glucose Infusion in Acute Myocardial Infarction (DIGAMI) study. Circulation 1999;99:2626-32. 137 Metabolic interventions in acute myocardial infarction 138 Admission glucose and myocardial perfusion Chapter 4.2 Hyperglycemia reduces myocardial reperfusion after primary percutaneous coronary intervention for ST elevation myocardial infarction Jorik R Timmer, Iwan CC van der Horst, Giuseppe de Luca, Jan Paul Ottervanger, Jan CA Hoorntje, Menko-Jan de Boer, Harry Suryapranata, Jan-Henk E Dambrink, AT Marcel Gosselink, Felix Zijlstra, Arnoud WJ van ’t Hof Submitted 139 Metabolic interventions in acute myocardial infarction Abstract Background Patients with hyperglycemia on admission have an adverse prognosis after ST segment elevation myocardial infarction (MI). However, the causal link between disturbances in glucose metabolism and outcome is unclear. We sought to investigate whether hyperglycemia is related to impaired myocardial perfusion in ST segment elevation MI patients. Methods A total of 464 patients with ST segment elevation MI treated with primary percutaneous coronary intervention (PCI) were included. To determine myocardial reperfusion we determined ST segment elevation resolution on the electrocardiogram and myocardial blush grade during PCI. Results A total of 93 patients (20%) had hyperglycemia (glucose ≥11.0 mmol/L). They had more often a reduced myocardial blush grade (26% versus 15%, P=0.02) and incomplete ST segment elevation resolution (59% versus 39%, P=0.01) compared to patients without hyperglycemia on admission. Patients with hyperglycemia also had more reduced left ventricular function and higher mortality. These observations were demonstrated in patients with and without diabetes mellitus. Multivariate analyses did not change these findings. Conclusion Hyperglycemia on admission is associated with reduced myocardial reperfusion after primary PCI. This is associated with an adverse clinical outcome. 140 Admission glucose and myocardial perfusion Introduction It has been demonstrated that hyperglycemia on admission is associated with an adverse prognosis after acute myocardial infarction (MI), both in patients with and without diabetes mellitus.1;2 However, the causal link between disturbances in glucose metabolism and outcome is not yet clear. Evidence suggests that hyperglycemia could be associated with impaired microvascular myocardial reperfusion.3;4 We studied the association between hyperglycemia and myocardial reperfusion in patients treated with primary percutaneous coronary intervention (PCI) for acute ST segment elevation MI (MI). Both electrocardiographic (ST segment elevation resolution) and angiographic (myocardial blush grade) parameters of myocardial reperfusion were used. We also investigated the impact of reduced myocardial reperfusion on clinical outcome. Methods Study population All consecutive patients with symptoms consistent with acute MI of >30 min duration, presenting within 24 hours after the onset of symptoms and with ST segment elevation of more than 1 mm (0.1 mV) in two or more contiguous leads on the electrocardiogram were evaluated for inclusion in this study. Patients were excluded when pre-treated with thrombolysis or when an illness associated with a marked restricted life expectancy was present. All patients went to the catheterization laboratory as soon as possible, where both coronary arteries were visualized. PCI was performed with standard techniques if the coronary anatomy was suitable for angioplasty. Additional treatment consisted of intravenous heparin, nitroglycerin and aspirin. After sheath removal, low-molecularweight heparin was given for 1 to 3 days. Baseline characteristics, clinical data, angiographic data and outcomes were recorded prospectively in a dedicated database. Measurements and definitions Core laboratory annalists (Diagram BV, Zwolle, The Netherlands) who were unaware of the clinical history and outcome of the patients assessed ST segment elevation resolution, TIMI (thrombolysis in myocardial infarction) flow and myocardial blush grade. TIMI flow and myocardial blush grade were visually assessed on the angiogram. Myocardial blush grade has been defined previously5: 0, no myocardial blush; 1, minimal myocardial blush or contrast density; 2, moderate myocardial blush or contrast density but less than that obtained during angiography of a contra or ipsilateral non-infarct related coronary artery; and 3, normal myocardial blush or contrast density, comparable with that obtained during 141 Metabolic interventions in acute myocardial infarction angiography of a contralateral or ipsilateral non-infarct-related coronary artery. When myocardial blush persisted (“staining”), this phenomenon suggested leakage of contrast medium into the extravascular space and was graded 0. ST segment elevation resolution was analyzed as previously described in detail.6 In short, ST segment elevation resolution was defined as complete when there was ≥70% ST segment elevation resolution, partial when there was 30-70% resolution and absent if resolution was less than 30% as measured 180 minutes after primary PCI compared to ST elevation on admission. Left ventricular ejection fraction (LVEF) was measured before discharge by radionuclide ventriculography or by echocardiography. Radionuclide ventriculography was performed by using the multiple gated equilibrium method following the labeling of red blood cells of the patient with technetium-99m-pertechnate. A General Electric 300 gamma camera with a low-energy all-purpose parallel-hole collimator was used. Global ejection fraction was calculated by a General Electric Star View computer using the fully automatic PAGE program. Hyperglycemia was defined as whole blood glucose levels (Modular system – Roche/Hitachi, Basel, Switserland) on admission of ≥11.1 mmol/L (≥200 mg/dL), as stated by the American Diabetes Association.7 Statistical analysis Differences between group means at baseline were assessed with the two-tailed Student’s t-test. Chi-square analysis or Fisher’s exact test was used to test differences between proportions. To study independent predictors of reduced myocardial reperfusion, multivariate logistic regression analysis was performed. Statistical significance was considered a two-tailed P-value <0.05. The Statistical Package for the Social Sciences (SPSS Inc., Chicago, IL, USA) version 10.1 was used for all statistical analysis. Results Study population A total of 464 patients were included in this analysis. Myocardial blush grade was available in 401 patients (86%) and ST segment elevation resolution data were available in 302 patients (65%). Ejection fraction was measured in 404 patients (87%). Mean age was 61±12 years, 368 patients (79%) were men. At the end of the follow up period (mean 1.6±1.1 years) 38 patients (8%) had died. Baseline characteristics of the patient groups according to the absence or presence of hyperglycemia are shown in table 1. 142 Admission glucose and myocardial perfusion Table 1. Baseline characteristics of the patient groups according to admission glucose Glucose <11.1mmol/L Number of patients Glucose ≥11.1mmol/L P-value 371 93 60.3±12.0 62.8±11.7 0.07 Men 307 (83) 61 (66) 0.001 Previous MI 39 (11) 14 (15) 0.22 Previous PCI 20 (5) 4 (4) 0.67 Previous CABG 8 (2) 4 (4) 0.24 Diabetes mellitus 11 (3) 38 (41) <0.001 Hypertension 99 (27) 31 (33) 0.20 Currently smoking 195 (53) 42 (45) 0.20 Age, years (mean±SD) Positive family history 145 (39) 34 (37) 0.66 Ischemic time ≤3 hour 198 (60) 52 (61) 0.94 Heart rate (beats /minute) 73 ± 18 81 ± 26 0.01 Systolic BP ≤100 mmHg 37 (10) 14 (15) 0.16 Diastolic BP ≤60 mmHg 71 (19) 23 (25) 0.23 Killip class ≥2 20 (5) 14 (15) 0.001 Anterior infarction 176 (47) 48 (52) 0.47 Ischemic time ≤3 hour 198 (60) 52 (61) 0.94 Heart rate (beats /minute) 73±18 81±26 0.01 Admission glucose (mmol/L)* 8.1±1.4 14.4±3.9 <0.001 Glucose at 16 hours (mmol/L)* 7.9±1.9 12.0±3.7 <0.001 Cumulative ST elevation (mm) 9.4±8.7 9.0±6.9 0.77 30 (8) 12 (13) 0.15 IABP Data are number (%) unless otherwise indicated. * Data are mean ± SD. MI = myocardial infarction. PCI = percutaneous coronary intervention. CABG = coronary artery bypass grafting. BP = blood pressure. IABP= intra aortic balloon pumping. Hyperglycemia and myocardial reperfusion Both complete ST segment elevation resolution (61% versus 42%, P=0.009) and optimal myocardial blush (85% versus 74%, P=0.02) were higher in patients with normal glucose levels compared to those with hyperglycemia. Patients with hyperglycemia had more often a reduced LVEF (LVEF ≤30%) (28% versus 16%, P=0.01) and a higher mortality compared to patients without hyperglycemia (14% versus 7%, P=0.02), table 2. Diabetes mellitus and myocardial perfusion In diabetic patients, the absence of hyperglycemia was associated with a higher presence of complete ST segment elevation resolution (56% versus 41%, P=0.46) and optimal 143 Metabolic interventions in acute myocardial infarction myocardial blush grade (91% versus. 74%, P=0.23). Also in non-diabetic patients with normal glucose levels, both complete ST segment elevation resolution (61% versus 42%, P=0.04) and optimal myocardial blush grade (85% versus 74%, P=0.07) were higher compared to those without hyperglycemia. Table 2. Myocardial reperfusion and outcome of the patient groups according to admission glucose Glucose <11.1mmol/L Glucose ≥11.1 mmol/L P-value Myocardial blush grade (2-3) 272 (85) 59 (74) 0.02 Complete resolution 152 (61) 22 (42) 0.009 51 (16) 23 (28) 0.01 25 (7) 13 (14) 0.023 Myocardial reperfusion Myocardial infarct size LVEF ≤30% Mortality Data are number (%). LVEF = left ventricular ejection fraction. Multivariate analyses - ST segment elevation resolution To identify whether hyperglycemia was independently associated with ST segment elevation resolution we performed multivariate analyses and included age and gender and all clinical variables significantly different between patients with and without ST segment elevation resolution (anterior MI P=0.04, hyperglycemia P=0.009 and cumulative ST elevation P=0.002). After multivariate analyses, the variables that were independently associated with incomplete ST segment elevation resolution were the presence of admission hyperglycemia , relative risk (RR) 2.1 (95% confidence interval 1.1–4.0, P=0.02), anterior MI, RR 2.4 (1.4–4.0, P=0.001) and a cumulative ST elevation on admission RR 1.1 per mm elevation (1.0–1.1, P=0.001). Gender (P=0.54) and age (P=0.94) were not significantly associated with ST segment elevation resolution after multivariate analysis. The addition of time to treatment to our analysis did not change these findings. Multivariate analyses - myocardial blush grade Univariate angiographic characteristics of patients with and without hyperglycemia are shown in table 3. The only variable that was associated with hyperglycemia was a myocardial blush grade 0-1. After multivariate analysis including all angiographic variables (MVD, collaterals, infarct related vessel, TIMI flow and myocardial blush grade) hyperglycemia at admission remained associated with an impaired blush grade of 0-1, RR 2.2 (1.2–4.2, P=0.02). A stratified analysis including only patients with TIMI 3 flow after PCI also showed more often a reduced myocardial blush grade in patients with hyperglycemia 144 Admission glucose and myocardial perfusion (20% versus 9%, P=0.01). Furthermore, there was a gradual increase (7%, 9%, 10%, 12% and 19%) in reduced myocardial blush grade with increasing glucose levels (quintiles) in these patients (figure 1). Figure 1. Association between glucose at admission and myocardial blush grade Reduced myocardial blush grade (%) 20 15 10 5 0 Quintile 1 Quintile 2 Quartile 3 Quartile 4 Quartile 5 Quintiles of glucose at admission Myocardial reperfusion and outcome Reduced LVEF was more often present in patients with incomplete ST segment elevation resolution (25% versus 12%, P=0.01) and in those with reduced myocardial blush (33% versus 14%, P<0.001). Mortality was also higher in patients with incomplete ST segment elevation resolution (6% versus 3%, P=0.15) and in those with reduced myocardial blush (16% versus 4%, P<0.001). These associations between reduced myocardial reperfusion and worse outcome were observed in patients with and without hyperglycemia. Discussion This is the first study to report on the influence of hyperglycemia on myocardial reperfusion as assessed by myocardial blush grade and ST segment elevation resolution. Elevated glucose levels on admission were independently associated with both incomplete ST segment elevation resolution and reduced myocardial blush. These findings suggest microvascular dysfunction in hyperglycemic patients with ST segment elevation MI and might explain their adverse prognosis. Whether meticulous regulation of 145 Metabolic interventions in acute myocardial infarction glucose levels, prior or following restoration of epicardial flow, improves myocardial reperfusion is unclear. Table 3. Angiographic variables of the patient groups with regard to admission glucose P-value Glucose <11.1 mmol/L Glucose ≥11.1 mmol/L Multi-vessel disease 188 (51) 54 (58) 0.20 Collaterals 39 (12) 7 (8) 0.36 IRV (LAD) 164 (46) 42 (46) 0.91 TIMI 0 flow before PCI 222 (63) 58 (64) 0.86 TIMI 2-3 flow after PCI 232 (96) 82 (94) 0.44 Myocardial blush grade 0-1 49 (15) 21 (26) 0.02 Data are number (%). IRV = infarct related vessel. LAD = left descending artery. TIMI = thrombolysis in myocardial infarction. Increased age and diabetes were both more prevalent in hyperglycemic patients and their presence has been associated with reduced myocardial flow after restoration of epicardial flow.4;8 However, in our analysis, age was not associated with impaired ST segment elevation resolution and also non-diabetic patients with hyperglycemia appeared to have reduced myocardial reperfusion. There are several mechanisms that could clarify these findings. Hyperglycemia is associated with both plugging of leukocytes in the microvasculature of the myocardium and with increased procoaguable properties of platelets.9-11 Furthermore, the ability of platelets to induce vasodilatation is reduced by high levels of glucose.12 However, there may also be a link between stress, hyperglycemia and reduced myocardial reperfusion. Killip class ≥2 was significantly higher in patients with hyperglycemia (5% versus 15%, P=0.001). Stress, induced by hemodynamic instability, increases both levels of free fatty acids and glucose.13 These free fatty acids reduce endothelium derived vasodilatation and inhibit the myocardial use of glucose.14;15 Furthermore, improvement of myocardial flow by insulin is diminished, as it is dependent on the concomitant use of glucose. Administration of solutions containing glucose – insulin and potassium (GIK) may decrease the level of free fatty acids and promote the use of glucose as myocardial energy substrate. There is some evidence that improvement of metabolic control through infusion of fluids containing GIK may reduce mortality in acute MI.16-18 Whether this improved prognosis results from improved myocardial reperfusion is unclear. However, evidence suggests GIK infusion improves myocardial perfusion in segments adjacent to the recently infarcted area.19 Besides GIK infusion, other specific interventions, such as the use of glycoprotein IIb/IIIa receptor blockers, might be beneficial. Also in our study, patients with incomplete ST segment elevation resolution and reduced myocardial blush grade had significantly more reduced LVEF and higher 146 Admission glucose and myocardial perfusion mortality. Therefore, the search for improvement of myocardial flow is pivotal and further investigations are warranted. Study limitations As glycolysated hemoglobin levels, reflecting long-term glucose metabolism, were not available, it remains unclear whether isolated acute hyperglycemia or more long-standing disturbed glucose metabolism was associated with reduced myocardial reperfusion. No routine tests were performed to diagnose previously unrecognized diabetes in all patients, so some hyperglycemic patients may have had undiagnosed diabetes at discharge. Conclusion Hyperglycemia on admission is independently associated with impaired myocardial reperfusion. Impaired reperfusion was associated reduced LVEF and a higher mortality. Further investigation with regard to improvement of myocardial reperfusion in hyperglycemia is warranted. References 1. Fava S, Aquilina O, Azzopardi J, Agius MH, Fenech FF. The prognostic value of blood glucose in diabetic patients with acute myocardial infarction. Diabet Med 1996;13:80-83. 2. Oswald GA, Smith CC, Betteridge DJ, Yudkin JS. Determinants and importance of stress hyperglycaemia in non-diabetic patients with myocardial infarction. Br Med J (Clin Res Ed) 1986;293:917-22. 3. Di Carli MF, Janisse J, Grunberger G, Ager J. Role of chronic hyperglycemia in the pathogenesis of coronary microvascular dysfunction in diabetes. J Am Coll Cardiol 2003;41:1387-93. 4. Iwakura K, Ito H, Ikushima M et al. Association between hyperglycemia and the no-reflow phenomenon in patients with acute myocardial infarction. J Am Coll Cardiol 2003;41:1-7. 5. van 't Hof AW, Liem A, Suryapranata H, Hoorntje JC, de Boer MJ, Zijlstra F. Angiographic assessment of myocardial reperfusion in patients treated with primary angioplasty for acute myocardial infarction: myocardial blush grade. Zwolle Myocardial Infarction Study Group. Circulation 1998;97:2302-6. 6. van 't Hof AW, Liem A, de Boer MJ, Zijlstra F. Clinical value of 12-lead electrocardiogram after successful reperfusion therapy for acute myocardial infarction. Zwolle Myocardial infarction Study Group. Lancet 1997;350:615-19. 7. Report of the expert committee on the diagnosis and classification of diabetes mellitus Diabetes Care 2003;26 Suppl 1:S5-20. 8. Angeja BG, de Lemos J, Murphy SA et al. Impact of diabetes mellitus on epicardial and microvascular flow after fibrinolytic therapy. Am Heart J 2002;144:649-56. 9. Winocour PD. Platelet abnormalities in diabetes mellitus. Diabetes 1992;41 Suppl 2:26-31. 147 Metabolic interventions in acute myocardial infarction 10. Gresele P, Guglielmini G, De Angelis M et al. Acute, short-term hyperglycemia enhances shear stress-induced platelet activation in patients with type II diabetes mellitus. J Am Coll Cardiol 2003;41:1013-20. 11. Hokama JY, Ritter LS, Davis-Gorman G, Cimetta AD, Copeland JG, McDonagh PF. Diabetes enhances leukocyte accumulation in the coronary microcirculation early in reperfusion following ischemia. J Diabetes Complications 2000;14:96-107. 12. Oskarsson HJ, Hofmeyer TG. Platelets from patients with diabetes mellitus have impaired 13. Rutenberg HL, Pamintuan JC, Soloff LA. Serum-free-fatty-acids and their relation to ability to mediate vasodilation. J Am Coll Cardiol 1996;27:1464-70. complications after acute myocardial infarction. Lancet 1969;2:559-64. 14. Oliver MF, Opie LH. Effects of glucose and fatty acids on myocardial ischaemia and 15. Lind L, Fugmann A, Branth S et al. The impairment in endothelial function induced by non- arrhythmias. Lancet 1994;343:155-58. esterified fatty acids can be reversed by insulin. Clin Sci (Lond) 2000;99:169-74. 16. Diaz R, Paolasso EA, Piegas LS et al. Metabolic modulation of acute myocardial infarction. The ECLA (Estudios Cardiologicos Latinoamerica) Collaborative Group. Circulation 1998;98:2227-34. 17. Fath-Ordoubadi F, Beatt KJ. Glucose-insulin-potassium therapy for treatment of acute myocardial infarction: an overview of randomized placebo-controlled trials. Circulation 1997;96:1152-56. 18. van der Horst IC, Zijlstra F, van't Hof AW et al. Glucose-insulin-potassium infusion in patients treated with primary angioplasty for acute myocardial infarction: the glucose-insulinpotassium study: a randomized trial. J Am Coll Cardiol 2003;42:784-91. 19. Marano L, Bestetti A, Lomuscio A et al. Effects of infusion of glucose-insulin-potassium on myocardial function after a recent myocardial infarction. Acta Cardiol 2000;55:9-15. 148 Hyperglycemia and myocardial reperfusion Chapter 4.3 Hyperglycemia and no reflow phenomenon in acute myocardial infarction Iwan CC van der Horst, Arnoud WJ van ’t Hof, Henk JG Bilo, Felix Zijlstra Journal of the American College of Cardiology 2003;41:2100 149 Metabolic interventions in acute myocardial infarction To the editor: Dr Iwakura and colleagues conclude that hyperglycemia might be associated with impaired microvascular function after acute myocardial infarction (MI), this conclusion was reached by a retrospective analysis of 146 patients.1 The authors were the first to find an independent relation between elevated blood glucose levels at admission and no reflow phenomenon. They also stated that this relation was independent of HbA1C level or diabetes mellitus (DM), since there were no difference in HbA1c level or the frequency of DM in the no reflow and reflow group. We have some considerations about these results. First, the authors defined hyperglycemia by the optimal cutoff to differentiate the patients showing no reflow with a receiver-operating characteristic curve analysis. By using this cutoff in the same cohort they found a relation between hyperglycemic patients and no reflow phenomenon. The authors have generated an interesting hypothesis and new studies have to proof the validity of the cutoff. Second, we are interested in more details on the methods used to determine blood glucose and HbA1c levels. Information was lacking is the blood glucose level was measured either with point of care or whole blood glucose measurement and if the method is validated in critically ill patients. Clinically relevant differences in blood glucose level have been observed with point of care and whole blood measurement in patients with shock2, acidosis3, medication4, and different values due to differences in hematocrit5. Finally, the absolute differences of 0.3% in HbA1c and 13% in frequency of DM were indeed not statistically significant related to no reflow. It is our suggestion that these clinically relevant differences were not significant due to the small number of patients. Moreover, the authors found that 45.3% of the patients with hyperglycemia were diabetic versus 9.9% in patients without hyperglycemia (P<0.0001). The hypothesis that acute hyperglycemia (i.e. hyperglycemia at admission) is associated with the no reflow phenomenon is intriguing. We however hypothesize that these relation is not independent of chronic hyperglycemia (i.e. elevated HbA1c and/or DM). Therefore new studies have to determine the effect of hyperglycemia on no reflow and preferentially the effect of metabolic regulation. References 1. Iwakura K, Ito H, Ikushima M et al. Association between hyperglycemia and the no-reflow phenomenon in patients with acute myocardial infarction. J Am Coll Cardiol 2003;41:1-7. 2. Atkin SH, Dasmahapatra A, Jaker MA, Chorost MI, Reddy S. Fingerstick glucose determination in shock. Ann Intern Med 1991;114:1020-1024. 3. Tang Z, Du X, Louie RF, Kost GJ. Effects of pH on glucose measurements with handheld glucose meters and a portable glucose analyzer for point-of-care testing. Arch Pathol Lab Med 2000;124:577-82. 150 Hyperglycemia and myocardial reperfusion 4. Tang Z, Du X, Louie RF, Kost GJ. Effects of drugs on glucose measurements with handheld glucose meters and a portable glucose analyzer. Am J Clin Pathol 2000;113:75-86. 5. Louie RF, Tang Z, Sutton, DV, Lee JH, Kost GJ. Point-of-care glucose testing: effects of critical care variables, influence of reference instruments, and a modular glucose meter design. Arch Pathol Lab Med 2000;124:257-66. 151 Metabolic interventions in acute myocardial infarction 152 Time-averaged glucose and outcome Chapter 5.1 Glucose at admission or time-averaged glucose during hospital stay: predict major adverse cardiac events in patients with acute myocardial infarction? Iwan CC van der Horst, Maarten WN Nijsten, Felix Zijlstra Submitted 153 Metabolic interventions in acute myocardial infarction Abstract Background Elevated blood glucose values are a prognostic factor in myocardial infarction (MI) patients. The unfavorable relation between hyperglycemia and outcome is known for admission glucose and fasting glucose after admission. These predictors are single measurements and thus not indicative of overall hyperglycemia. Increased time-averaged glucose may better predict adverse events in MI patients. Methods In a prospective study of MI patients treated with primary percutaneous coronary intervention (PCI) frequent blood glucose measurements were obtained, to investigate the relation between glucose and the occurrence of major adverse cardiac events (MACE) at 30 days follow-up. MACE was defined as death, recurrent infarction, repeat primary coronary intervention, and left ventricular ejection fraction ≤30%. Results MACE occurred in 89 (21.3%) out 417 patients. In 17 patients (4.1%) it was a fatal event and in 72 patients (17.3%) a non-fatal event. MACE occurred more often in patients who were older, had previous cardiovascular disease, anterior infarction location, and multivessel disease. A mean of 7.4 glucose determinations were available per patient. Mean ± SD admission glucose was 10.1±3.7 mmol/L in patients with a MACE versus 9.1±2.7 mmol/L in event free patients (P=0.005). Mean time-averaged glucose was 9.0±2.8 mmol/L in patients with MACE compared to 8.0±2.0 mmol/L in event free patients (P<0.001). The area under the receiver operator characteristic curve was 0.64 for timeaveraged glucose and 0.59 for admission glucose. With Cox regression analysis including factors related with MACE in univariate analysis time-averaged glucose emerged as a significant independent predictor (P<0.001). Conclusion Elevated time-averaged glucose in MI has a stronger relation with 30-day MACE than elevated glucose at admission. 154 Time-averaged glucose and outcome Introduction Acute myocardial infarction (MI) patients with hyperglycemia at admission have a worse prognosis.1;2 This relation is found in both patients with diabetes mellitus (DM) and in patients without DM.3-6 It has been argued that in patients without DM hyperglycemia may be caused by undetected diabetes.7-9 Some patients who present with hyperglycemia are indeed diabetic but many patients with an admission glucose above 11.0 mmol/L are not diabetic.10 The early measurement of glycosylated hemoglobin (HbA1c) has been useful to find unknown diabetics among MI patients.7;11-13 HbA1c reflects the level of glucose regulation of the previous weeks. In diabetics it serves as a measure of glucose regulation and is a strong predictor of the risk for coronary heart disease.14 In MI patients HbA1c also showed a relation with worse outcome.5 In MI patients HbA1c and hyperglycemia at admission independently predicted short term mortality.11 Elevated fasting glucose after admission for MI also predicts unfavorable outcome.15;16 Admission glucose and fasting glucose as predictors of outcome have the drawback that they are based on a single measurement and thus are not indicative of persistent hyperglycemia.1-6;15-17 A first step to define persistent hyperglycemia is to compute the mean of all glucose values, a simple mean glucose ignores the unequal time distribution between measurements.17 The calculation of the time-averaged glucose addresses this problem. In this post-hoc analysis of data collected in a prospective study of MI patients we thought to investigate whether elevated time-averaged glucose is a better predictor of major adverse cardiac events than elevated glucose at admission. Methods Patients Patients with symptoms consistent with acute MI of >30 min duration, presenting within 24 hour after the onset of symptoms and with ST segment elevation of more than 1 mm (0.1 mV) in two or more contiguous leads on the electrocardiogram and treated with primary percutaneous coronary intervention (PCI) were included in this study. At baseline age, gender, previous cardiovascular disease defined as a history of coronary artery bypass grafting (CABG), previous PCI, stroke and MI, existence of diabetes mellitus (DM), smoking status, Killip class, electrocardiographic site of infarction, time of onset of symptoms, and time of hospital admission were recorded. Patients were defined as diabetic when treated with a diet, oral hypoglycemic drugs and/or insulin. The research protocol was reviewed and approved by the medical ethics committee, and patients were included after informed consent. 155 Metabolic interventions in acute myocardial infarction Glucose measures In all patients glucose levels were determined based on measurements of whole-blood glucose (Modular System, Roche/Hitachi, Basel, Switzerland). The first glucose after admission was defined as admission glucose. To determine the time-averaged glucose level for an individual patient, all glucose measurements performed during admission were analyzed with a dedicated computer algorithm. The first step was to interpolate all glucose values obtained during the first 48 hours after admission into a curve. Then the area under this glucose curve was calculated. This area under the curve was then divided by 48 hours. Enzymatic infarct size Enzymatic infarct size was estimated by serial measurements of creatine kinase (CK) fraction. CK was determined enzymatically on a Hitachi 717 automatic analyzer according to the International Federation of Clinical Chemistry (IFCC) recommendation at 30 degrees Celsius. Frequent CK determinations were performed according to a schedule that called for 4 to 8 measurements in the first 96 hours to calculate the area under the CK curves. Left ventricular function Left ventricular ejection fraction (LVEF) was measured before discharge by radionuclide ventriculography or by echocardiography. Radionuclide ventriculography was performed with the multiple gated equilibrium method following the labeling of red blood cells of the patient with technetium-99m-pertechnate. A General Electric 300 gamma camera with a low-energy all-purpose parallel-hole collimator was used. Global ejection fraction was calculated by a General Electric Star View computer using the fully automatic PAGE program. Two-dimensional echocardiography was performed by observers who were unaware of the clinical data. A LVEF ≤30% was defined as a poor left ventricular function.18 Cardiac events In all patients data were obtained with regard to mortality, recurrent myocardial infarction or repeat PCI during the first 30 days after admission. The primary endpoint of the study was the presence of a Major Adverse Cardiac Event (MACE) during the first 30 days after admission for acute MI. MACE was defined as the composite incidence of death, recurrent infarction, repeat PCI or a LVEF ≤30%. The combination of death and non-fatal short-term events as recurrent infarction, repeat intervention, and heart failure has been shown to be a valid predictor of 1-year mortality.19;20 Recurrent myocardial infarction was defined as the occurrence of symptoms consistent with acute MI of >30 min duration, signs of 156 Time-averaged glucose and outcome infarction on the electrocardiogram, and a second increase in the serum CK level to more than two times the upper limit of normal. If the CK level had not decreased to normal levels, a second increase of more than 200 IU per liter over the previous value was regarded as indicating a recurrent infarction.21 Repeat PCI was defined as angioplasty performed within 30 days due to repeat signs and symptoms of myocardial ischemia. Table 1. Baseline characteristics patients with a major adverse cardiac events (MACE) and without an adverse event within 30-days Characteristics MACE group Event free group 89 338 Number of patients Age, years (mean±SD) 62.5±12.6 60.1±11.8 Men 70 (78.7) 263 (80.2) Previous cardiovascular events 17 (19.1) 53 (15.7) Diabetes mellitus 11 (12.4) 33 (10.1) 11 (12.4) 28 (8.3) 6 (6.7) 17 (5.0) Type 2 diabetes mellitus† Tablets 2 (2.2) 13 (3.8) Hypertension Insulin 32 (36.0) 87 (26.5) Dyslipidemia 16 (18.0) 75 (22.9) Currently smoker 41 (46.1) 178 (54.3) Positive family history 27 (30.3) 133 (40.5) Data are numbers (%) unless otherwise indicated. Statistical analysis Differences between groups were assessed with the Student’s t-test or the Mann-Whitney U test. The Chi-square test and the Chi-square test for trend were used to test differences between proportions. Receiver operator characteristics (ROC) curves were computed to assess the ability of glucose-derived parameters to predict MACE or mortality. We also performed a Cox proportional-hazards regression model with factors at admission related to MACE at least with a level of significance of 0.2 or less. The Statistical Package for the Social Sciences (SPSS Inc., Chicago, IL, USA) version 11.5 was used for all statistical analysis. Results Between April 1th 1998 and October 1th 2001, 417 patients were included. After 30 days a MACE had occurred in 89 patients (21.3%), in 17 patients (4.1%) it was a fatal event and in 72 patients (17.3%) a non-fatal event. A repeat PCI was performed in 20 patients (4.8%). 157 Metabolic interventions in acute myocardial infarction Left ventricular function data was available of 377 patients (90.4%). In 68 patients (18%) the LVEF was equal or smaller than 30%. Baseline characteristics of patients with a MACE and patients without an event are represented in table 1. Patients with a MACE were older, more often female, and more likely to have a history of cardiovascular disease. Figure 1. Association between admission glucose and time-averaged glucose and 30-day major adverse cardiac events Receiver operator characteristic curves that depict the ability of admission glucose (thin line) and time-averaged glucose (thick line) to predict the occurrence of a major adverse coronary event within 30 days after admission. A mean of 7.4 glucose determinations were available per patient. Mean ± SD admission glucose was 10.1±3.7 mmol/L in patients with a MACE versus 9.1±2.7 mmol/L in event free patients (P=0.005). Mean time-averaged glucose was 9.0±2.8 mmol/L in patients with MACE compared to 8.0 ± 2.0 mmol/L in event free patients (P<0.001). 44 patients had diabetes mellitus and 34 patients (77.3%) had a glucose level at admission and 38 patients (86.4%) had a time-averaged glucose in the highest quartile. 158 Time-averaged glucose and outcome Table 2. Infarct characteristics, hemodynamic status and reperfusion treatment Characteristics MACE group Number of patients Event free group 89 338 Anterior MI 69 (77.5) 131 (39.9)** Killip class 1 79 (88.8) 311 (92.0) Killip class ≥2 10 (11.2) 27 (8.0) Multi-vessel disease 58 (65.2) 156 (47.6)** TIMI grade 0 flow before PCI 60 (67.4) 212 (64.6) Stent 48 (53.9) 184 (56.1) GP IIb/IIIa receptor blocker 28 (26.2) 79 (24.1) TIMI grade 3 flow after PCI 75 (86.2) 305 (93.3) Data are number (%) unless otherwise indicated. * P-value ≤0.2. ** P-value <0.01. MI = myocardial infarction. IQR = interquartile range. †Time to admission denotes time between onset of symptoms and until admission. The ROC curves for admission glucose and glucose over the first 48 hours are shown in figure 1. The area under the curve for admission glucose was 0.59 (95% confidence interval 0.52-0.65) and for time-averaged glucose was 0.64 (0.57-0.70). After correction for factors related with MACE in univariate analysis (tables 1, 2 and 3) anterior site of infarction, Killip class ≥2 and time-averaged glucose were the only independent predictors of 30-day MACE. Table 3. Relation between glucose measures and major adverse cardiac events MACE group Event free group P-value Number of patients 89 338 Admission glucose 10.1±3.7 9.1±2.7 0.002 Time-averaged glucose 9.0±2.8 8.0±2.0 <0.001 Glucose data are mmol/L (mean ± SD). The positive relations between admission glucose and 30-day MACE is illustrated in figure 2. MACE in the lowest quartile of glucose during admission was 11.5% compared to 33.3% in the highest quartile (P for trend <0.05). The stronger positive relation between time-averaged glucose and 30-day MACE is also illustrated in figure 2. The stepwise increase is more pronounced with time-averaged glucose than with admission glucose. MACE in the lowest quartile of time-averaged glucose was 13.5% compared to 26.7% in the highest quartile (P for trend <0.001). 159 Metabolic interventions in acute myocardial infarction Figure 2. 30-day major cardiac adverse events (MACE) according to quartiles of admission glucose and time-averaged glucose in MI patients 35 30 MACE (%) 25 20 15 10 5 0 Admission glucose Quartile 1 Quartile 2 Time-averaged glucose Quartile 3 Quartile 4 P-value for trend in admission glucose is <0.05 and for time-averaged glucose is <0.001. Discussion In this study we observed that the time-averaged glucose in the first 48 hours after admission for acute MI has a stronger relation with unfavourable short-term outcome than glucose at admission. Previous studies primarily focused on the prognostic value of admission hyperglycemia in both patients with and without diabetes mellitus.1-6 It has been described that patients with diabetes mellitus have an impaired outcome after myocardial infarction. Potentially, patients with persistent hyperglycemia are more likely to have diabetes mellitus either known or unknown.9;10;16 In our study patients with diabetes mellitus indeed had an elevated glucose at admission and a elevated timeaveraged glucose. The number of patients without diabetes mellitus in the highest quartile of admission glucose and time-averaged glucose was approximately 2 out of 3 patients. Some studies showed that an elevated fasting glucose after admission also predicts unfavorable outcome.15;16 Only one study used a measure of persistent hyperglycemia in the analysis of the relation between deregulation of the glucose metabolism during MI.17 In a study of 662 MI patients hyperglycemia was defined as a glucose level on admission or a four day mean blood glucose level higher than 6.67 mmol/L. 457 patients (69.0%) had 160 Time-averaged glucose and outcome hyperglycemia and only 195 (29.7%) had previously known diabetes mellitus. These patients developed more complications, and had higher 28 day mortality.17 Mechanism of action Several mechanisms can be postulated to explain the relation between acute and persistent hyperglycemia and unfavourable outcome after reperfusion therapy for MI. First, the relation between persistent hyperglycemia and outcome may be related to the presence of ongoing stress in more severely ill patients. During myocardial ischemia an increase in glucose levels is observed.22 It has been reported that glucose was related to adrenaline and cortisol in patients with ST segment elevation MI.23 In the current study, Killip class ≥2 on admission was more frequent and enzymatic infarct size was larger, suggesting that hyperglycemia reflects extensive myocardial damage. The second possible explanation is that patients with hyperglycemia are likely to have diabetes mellitus, even if it has not been diagnosed.7;7-13 Diabetes mellitus is associated with extensive coronary artery disease and adverse outcomes in MI patients. In the current study, elevated admission glucose and elevated time-averaged glucose were related to a higher prevalence of diabetes mellitus. Third, it is possible that hyperglycemia and concomitant metabolic abnormalities may exacerbate myocardial damage in MI. Table 4. Relation of quartiles of admission glucose and time-averaged glucose respectively with major adverse cardiac events and infarct size Quartile 1 Quartile 2 Quartile 3 Quartile 4 P-value* MACE (%) 14 (13.5) 23 (22.1) 24 (23.1) 28 (26.7) P<0.05 LVEF (% ± SEM) 44.6±1.1 41.9±1.2 41.8±1.2 40.7±1.2 CK AUC (IU ± SEM) 919±69 1430±155 1560±136 1579±146 MACE (%) 12 (11.5) 17 (16.3) 25 (24.0) 35 (33.3) LVEF (% ± SEM) 45.3±1.0 43.3±1.0 40.8±1.3 39.4±1.4 CK AUC (IU ± SEM) 1001±80 1283±99 1505±143 1690±181 Admission glucose Time-averaged glucose P<0.001 MACE = major adverse cardiac events. LVEF = left ventricular ejection fraction. SEM = standard error of the mean. CK = creatine kinase. AUC = area under the curve. *P-value denotes P-value for trend. Persistent hyperglycemia may reflect insulin resistance. Insulin resistance is more often present in non-diabetic patients with an acute MI compared to matched controls.24 In 181 patients admitted with acute MI and no history of diabetes mellitus compared to 180 matched controls without previously known diabetes mellitus or cardiovascular disease 161 Metabolic interventions in acute myocardial infarction glucose, HbA1c, proinsulin, proinsulin/insulin ratio, triglycerides, insulin resistance and fibrinogen were all consistently higher in patients than controls (P<0.01). It has been postulated that insulin resistance, and thereby hyperglycemia, decreases the responsiveness of leukocytes by inflammatory mediators. The question remains as to whether this hyperglycemic state adds injury to the ischemic myocardium, or is merely a marker for more severe disease or underlying metabolic disorder. Animal studies have shown that hyperglycemia may impair cardiac contractile function, interfere with nitric oxide pathways and promote apoptosis in the myocardium.25;26 Relative insulin deficiency decreases glucose transporter translocation to the cell surface and increases free fatty acids through increased lipolysis in adipose tissue. In this situation, glucose utilization is reduced and free fatty acids are mainly used in myocardium. This results in increased oxygen demand and, in ischemic myocardium, accumulation of unoxidized products of free fatty acids. Free fatty acids inhibit glucose oxidation to a greater extent than glucose uptake. In the presence of hyperglycemia, glycolytic intermediates therefore accumulate in the myocyte. Furthermore, hyperglycemia can lead to activation of protein kinase C and modification of macromolecules by forming advanced glycation end products, which can augment the production of proinflammatory cytokines. Recently, in a retrospective study it was shown that non-diabetic patients with signs of insulin resistance had an impaired recovery of left ventricular function of coronary angioplasty compared to patients without insulin resistance.27 Role for insulin (glucose-potassium) infusion In the clinical setting, the ultimate proof that the hyperglycemic state may have harmful effects on the ischemic myocardium is to demonstrate that cardiac outcomes can be improved by strict glucose regulation. Previous studies have investigated the benefits of insulin administration on outcomes after acute MI. The Diabetes and Insulin-Glucose Infusion in Acute Myocardial Infarction (DIGAMI) study was a randomized trial of insulinglucose infusion therapy in the reperfusion era and demonstrated that insulin-glucose therapy improved long-term survival after acute MI.28;29 In control patients, mortality was higher in patients with higher admission blood glucose. However, in patients with insulinglucose therapy, reduction of mortality was more obvious in patients with higher blood glucose and the relation between mortality and admission blood glucose disappeared. These findings suggest that relative insulin deficiency and hyperglycemia may be at least in part causally associated with increased mortality after acute MI. Evidence from animal studies suggested that insulin therapy may reduce reperfusion injury and enhance the cardioprotective effects of reperfusion therapy.30;31 On the other hand, hyperglycemia has been associated with the no reflow phenomenon following successful reperfusion after ST segment elevation MI.32 In the Estudio Cardiologicos Latinoamerica (ECLA) pilot trial, the 162 Time-averaged glucose and outcome combination of reperfusion therapy and glucose–insulin–potassium infusion for 24 hours following ST segment elevation MI resulted in a lower in-hospital mortality rate than the group that received reperfusion therapy alone. In the DIGAMI study, a direct comparison of the effect of thrombolysis in the treatment and control groups was not described. GIK in reperfused patients seems promising, albeit that this observation comes from a subgroup of a pilot trial in which the mortality rate in the control group was high. The GIPS and REVIVAL treated patients primarily with primary PCI.33;34 After 30-days the mortality rates in GIK and control patients were almost similar. New trials as the ECLA GIK 2/CREATE trial, the Organization to Assess Strategies for Ischemic Syndromes (OASIS)-6 trial and GIPS-2 currently randomize thousands of patients to GIK or no GIK in adjunction to either thrombolysis or primary PCI. These trials will determine the clinical benefit of GIK in combination with different reperfusion strategies. Conclusion In patients with acute MI treated with primary PCI hyperglycemia defined by the timeaveraged glucose during hospital admission predicts unfavorable short-term outcome better than admission hyperglycemia. Contributors This study was supported by a generous grant from the Netherlands Heart Foundation (99.028). No other conflicts of interest or financial disclosure. References 1. Malmberg K, Norhammar A, Wedel H, Ryden L. Glycometabolic state at admission: important risk marker of mortality in conventionally treated patients with diabetes mellitus and acute myocardial infarction: long-term results from the Diabetes and Insulin-Glucose Infusion in Acute Myocardial Infarction (DIGAMI) study. Circulation 1999;99:2626-32. 2. Timmer JR, van der Horst IC, Ottervanger JP et al. Prognostic value of admission glucose in non-diabetic patients with myocardial infarction. Am Heart J 2004;148:399-404. 3. Bolk J, van der Ploeg T, Cornel JH, Arnold AE, Sepers J, Umans VA. Impaired glucose metabolism predicts mortality after a myocardial infarction. Int J Cardiol 2001;79:207-14. 4. Capes SE, Hunt D, Malmberg K, Gerstein HC. Stress hyperglycaemia and increased risk of death after myocardial infarction in patients with and without diabetes: a systematic overview. Lancet 2000;355:773-78. 163 Metabolic interventions in acute myocardial infarction 5. Norhammar A, Tenerz A, Nilsson G et al. Glucose metabolism in patients with acute myocardial infarction and no previous diagnosis of diabetes mellitus: a prospective study. Lancet 2002;359:2140-2144. 6. Stranders I, Diamant M, van Gelder RE et al. Admission blood glucose level as risk indicator of death after myocardial infarction in patients with and without diabetes mellitus. Arch Intern Med 2004;164:982-88. 7. Oswald GA, Corcoran S, Yudkin JS. Prevalence and risks of hyperglycaemia and undiagnosed diabetes in patients with acute myocardial infarction. Lancet 1984;1:1264-67. 8. Husband DJ, Alberti KG, Julian DG. "Stress" hyperglycaemia during acute myocardial infarction: an indicator of pre-existing diabetes? Lancet 1983;2:179-81. 9. Madsen JK, Haunsoe S, Helquist S et al. Prevalence of hyperglycaemia and undiagnosed diabetes mellitus in patients with acute myocardial infarction. Acta Med Scand 1986;220:32932. 10. Tenerz A, Lonnberg I, Berne C, Nilsson G, Leppert J. Myocardial infarction and prevalence of diabetes mellitus. Is increased casual blood glucose at admission a reliable criterion for the diagnosis of diabetes? Eur Heart J 2001;22:1102-10. 11. Hadjadj S, Coisne D, Mauco G et al. Prognostic value of admission plasma glucose and HbA 12. Greci LS, Kailasam M, Malkani S et al. Utility of HbA(1c) levels for diabetes case finding in 13. Oswald GA, Yudkin JS. Hyperglycaemia following acute myocardial infarction: the 14. Selvin E, Marinopoulos S, Berkenblit G et al. Meta-analysis: glycosylated hemoglobin and 15. O'Sullivan JJ, Conroy RM, Robinson K, Hickey N, Mulcahy R. In-hospital prognosis of patients 16. Ravid M, Berkowicz M, Sohar E. Hyperglycemia during acute myocardial infarction. A six-year in acute myocardial infarction. Diabet Med 2004;21:305-10. hospitalized patients with hyperglycemia. Diabetes Care 2003;26:1064-68. contribution of undiagnosed diabetes. Diabet Med 1987;4:68-70. cardiovascular disease in diabetes mellitus. Ann Intern Med 2004;141:421-31. with fasting hyperglycemia after first myocardial infarction. Diabetes Care 1991;14:758-60. follow-up study. JAMA 1975;233:807-9. 17. Sala J, Masia R, Gonzalez de Molina FJ et al. Short-term mortality of myocardial infarction patients with diabetes or hyperglycaemia during admission. J Epidemiol Community Health 2002;56:707-12. 18. Greenberg H, Case RB, Moss AJ, Brown MW, Carroll ER, Andrews ML. Analysis of mortality events in the Multicenter Automatic Defibrillator Implantation Trial (MADIT-II). J Am Coll Cardiol 2004;43:1459-65. 19. Braunwald E, Cannon CP, McCabe CH. Use of composite endpoints in thrombolysis trials of 20. Cannon CP, Sharis PJ, Schweiger MJ et al. Prospective validation of a composite end point in acute myocardial infarction. Am J Cardiol 1993;72:3G-12G. thrombolytic trials of acute myocardial infarction (TIMI 4 and 5). Thrombosis In Myocardial Infarction. Am J Cardiol 1997;80:696-99. 21. Zijlstra F, de Boer MJ, Hoorntje JC, Reiffers S, Reiber JH, Suryapranata H. A comparison of immediate coronary angioplasty with intravenous streptokinase in acute myocardial infarction. N Engl J Med 1993;328:680-684. 164 Time-averaged glucose and outcome 22. Vetter NJ, Strange RC, Adams W, Oliver MF. Initial metabolic and hormonal response to acute myocardial infarction. Lancet 1974;1:284-88. 23. Oswald GA, Smith CC, Betteridge DJ, Yudkin JS. Determinants and importance of stress hyperglycaemia in non-diabetic patients with myocardial infarction. Br Med J (Clin Res Ed) 1986;293:917-22. 24. Bartnik M, Malmberg K, Hamsten A et al. Abnormal glucose tolerance--a common risk factor in patients with acute myocardial infarction in comparison with population-based controls. J Intern Med 2004;256:288-97. 25. Ren J, Gintant GA, Miller RE, Davidoff AJ. High extracellular glucose impairs cardiac E-C coupling in a glycosylation-dependent manner. Am J Physiol 1997;273:H2876-H2883. 26. Du XL, Edelstein D, Dimmeler S, Ju Q, Sui C, Brownlee M. Hyperglycemia inhibits endothelial nitric oxide synthase activity by posttranslational modification at the Akt site. J Clin Invest 2001;108:1341-48. 27. Fujino T, Ishii Y, Takeuchi T et al. Recovery of BMIPP uptake and regional wall motion in insulin resistant patients following angioplasty for acute myocardial infarction. Circ J 2003;67:757-62. 28. Malmberg K, Ryden L, Efendic S et al. Randomized trial of insulin-glucose infusion followed by subcutaneous insulin treatment in diabetic patients with acute myocardial infarction (DIGAMI study): effects on mortality at 1 year. J Am Coll Cardiol 1995;26:57-65. 29. Malmberg K. Prospective randomised study of intensive insulin treatment on long term survival after acute myocardial infarction in patients with diabetes mellitus. DIGAMI (Diabetes Mellitus, Insulin Glucose Infusion in Acute Myocardial Infarction) Study Group. BMJ 1997;314:1512-15. 30. Zhu P, Lu L, Xu Y, Greyson C, Schwartz GG. Glucose-insulin-potassium preserves systolic and diastolic function in ischemia and reperfusion in pigs. Am J Physiol Heart Circ Physiol 2000;278:H595-H603. 31. Doenst T, Richwine RT, Bray MS, Goodwin GW, Frazier OH, Taegtmeyer H. Insulin improves functional and metabolic recovery of reperfused working rat heart. Ann Thorac Surg 1999;67:1682-88. 32. Iwakura K, Ito H, Ikushima M et al. Association between hyperglycemia and the no-reflow 33. Pache J, Kastrati A, Mehilli J et al. A randomized evaluation of the effects of glucose-insulin- phenomenon in patients with acute myocardial infarction. J Am Coll Cardiol 2003;41:1-7. potassium infusion on myocardial salvage in patients with acute myocardial infarction treated with reperfusion therapy. Am Heart J 2004;148:105. 34. van der Horst IC, Zijlstra F, van't Hof AW et al. Glucose-insulin-potassium infusion in patients treated with primary angioplasty for acute myocardial infarction: the glucose-insulinpotassium study: a randomized trial. J Am Coll Cardiol 2003;42:784-91. 165 Metabolic interventions in acute myocardial infarction 166 Hyperglycemic index in critically ill patients Chapter 5.2 The hyperglycemic index is a tool to assess glucose control: a retrospective study Mathijs Vogelzang, Iwan CC van der Horst, Maarten WN Nijsten Critical Care 2004;8:R122-R127 167 Metabolic interventions in acute myocardial infarction Abstract Background Critically ill patients may benefit from strict glucose regulation. An objective measure of hyperglycemia to assess glucose regulation in acutely ill patients should reflect the magnitude and duration of hyperglycemia, be independent of the number of measurements and not be falsely lowered by hypoglycemic values. The time-average of glucose values above the normal range meets these requirements. It was our aim to investigate whether the hypeglycemic index (HGI) is related to outcome Methods A retrospective, single center study was performed at a 12-bed surgical ICU. From 1990 through 2001 all patients over 15 years, staying at least 4 days were included. Admission type, sex, age, APACHE-II and outcome were recorded. The HGI was defined as the area under the curve above the upper limit of normal (glucose level 6.0 mmol/L) divided by the total length of stay. HGI, admission glucose, mean morning glucose, mean glucose and maximal glucose were calculated for each patient. The relation of these measures with 30day mortality was determined. Results In 1779 patients with a median ICU-stay of 10 days the 30-day mortality was 17%. A total of 65 528 glucose values were analyzed. Median HGI was 0.9 (0.3-2.1) in survivors compared to 1.7 (0.7-3.3) mmol/L in non-survivors (p<0.001). Area under the receiver operator characteristic curve was 0.64 for HGI, compared with 0.61 and 0.62 for mean morning glucose and mean glucose. HGI was the only significant glucose measure in binary logistic regression. Conclusion HGI showed a better relation with outcome than other glucose indices. HGI is an useful measure of glucose regulation in critically ill patients. 168 Hyperglycemic index in critically ill patients Introduction Acute hyperglycemia is a prognostic factor for mortality in critically ill patients in the presence and in the absence of diabetes mellitus.1-3 The benefit of strict glucose regulation in the Intensive Care Unit (ICU) has been demonstrated by the Leuven study.4;5 A remarkable reduction in morbidity and mortality was achieved in patients who were treated according to a protocol that aimed for normoglycemia. Thus the logical aims of glucose regulation are to eliminate hyperglycemia as rapidly as possible and to maintain normoglycemia from then on, while avoiding hypoglycemia.6;7 Whereas this presents a clear goal for algorithms, there is no obvious way to assess the performance of different algorithms.8 In ICU patients we do not possess a measure like glycosylated hemoglobin A1c (HbA1c) which has proven to be an important predictor of long-term complications and useful to evaluate the quality of glucose regulation.9-11 Therefore glucose itself must be measured to assess hyperglycemia during the stay at the ICU. In studies of acutely ill patients, regular indices of glucose regulation that have been used are admission glucose, maximum glucose, mean morning glucose and mean glucose.4;12-15 All these indices have specific drawbacks. Admission glucose, maximum glucose and mean morning glucose are all based on either a single measurement or a subset of measurements, and thus are not indicative of overall hyperglycemia. A single mean glucose that uses all measurements can be strongly biased by an unequal time distribution between measurements, as commonly occurs in practice.16-18 Calculating a time-averaged glucose compensates for an unequal time distribution of glucose measurements. However, hypoglycemic episodes may still lower such an index, thus falsely suggesting normoglycemia, when in reality hyperglycemia is present. We hypothesized that an index that takes into account the unequal time distribution of glucose sampling and that is not falsely lowered by low glucose values would be a better index of glucose regulation. We defined the hyperglycemic index (HGI; figure 1) as the area under the glucose curve above the normal range, divided by the length of stay. We evaluated the association of HGI and conventional glucose indices of regulation with mortality in a large group of ICU patients with a prolonged ICU stay. Methods Study population In a retrospective analysis we included all patients more than 15 years of age admitted to the surgical ICU of our tertiary teaching hospital from 1990 to the end of 2001. Since glucose regulation appears to be especially relevant in patients with a prolonged stay at 169 Metabolic interventions in acute myocardial infarction the ICU, we only studied patients who stayed four or more days at the ICU.4;5 Age, sex, admission type and the acute physiology and chronic health evaluation II score (APACHEII) were obtained from case-records and electronic databases of all admitted patients to our hospital. Blood glucoses values were obtained from the central laboratory database. Figure 1. Calculation of the hyperglycemic index (HGI). All measured glucose values (black dots) and their corresponding sampling times are taken into account. The time-average is calculated for the area (shaded) under the glucose curve for hyperglycemic values only. The normal glucose-range is indicated by the hatched area, with 6.0 mmol/L (dotted line) as the cut-off. HGI is the shaded area divided by the total length of stay. In this case HGI is 0.73 mmol/L, as indicated by the dashed line. Note that normal or hypoglycemic measurements do not affect HGI, and thus do not falsely lower this index. Therapeutic protocol Patients were fed enterally as soon as possible. Total parenteral nutrition was only given when enteral nutrition failed. Concentrated glucose infusion was not routinely used. Insulin was only administrated to patients with diabetes mellitus or patients with glucose levels exceeding 10.0 mmol/L, and was never dosed above 10 IU/hour. Whole blood samples were taken from arterial or central lines and sent to the central laboratory for glucose measurement. Glucose indices Admission glucose was defined as the first measurement after ICU-admission. Morning glucose was calculated as the arithmetic mean of all measurements done between 6 and 8 170 Hyperglycemic index in critically ill patients AM.4;5 Mean glucose was calculated as the arithmetic mean of all measurements. Maximum glucose was the highest glucose determined for the entire ICU-stay. To determine the hyperglycemic index (HGI) of a patient, all glucose measurements performed during the ICU stay were analyzed. As indicated in figure 1, the first step was to interpolate all glucose values. Then the area between this glucose curve and the upper normal range was calculated. HGI was defined as this area under the curve divided by the total length of stay, thus making HGI independent of length of stay. As the Leuven proved improved outcome by lowering glucose levels under 6.0 mmol/L, we chose this value as our upper range of normal in all tests unless otherwise noted. Since the Leuven study others have hypothesized that 6.0 mmol/L might not be the best target to aim for.19 Therefore we also performed an analysis of the performance of HGI at other cut-off levels than 6.0. Table 1. Characteristics for surviving and non-surviving patients and results of univariate analysis of glucose indices Survivors Non-survivors Number of patients 1484 (83) 295 (17) Men 982 (66) 182 (61) 0.18 53±19 63±16 <0.001 10 (6-20) 10 (6-17) Age, years (mean±SD) Length of ICU stay, hour* Reason for ICU admission P-value 0.12 <0.001 Trauma 372 (25) 30 (10) Abdominal surgery 443 (30) 101 (34) Liver transplant 219 (15) 38 (13) Vascular surgery 164 (11) 51 (17) Miscellaneous 286 (19) 75 (25) APACHE-II score 18 (14-23) 25 (20-28) <0.001 Number of glucose measurements* 20 (10.5-41) 27 (15-45) <0.001 Mean glucose, mmol/L* 6.9 (6.0-8.4) 7.7 (6.4-9.5) <0.001 Morning glucose, mmol/L* 6.6 (5.9-7.9) 7.5 (6.2-8.8) <0.001 Admission glucose, mmol/L* 7.2 (5.8-9.5) 7.9 (6.0-10.9) 0.07 Maximum glucose, mmol/L* 10.2 (8.0-14.2) 12.3 (9.5-16.4) <0.001 0.9 (0.3-2.1) 1.8 (0.7-3.4) <0.001 HGI, mmol/L* Data are number (%) unless otherwise indicated. *Values are medians (interquartile range) unless otherwise noted. ICU denotes intensive care unit. HGI denotes hyperglycemic index. As the other measures of glucose regulation, HGI is expressed in mmol/L. Thus a patient in whom all glucose values happen to be 8.5 mmol/L will have an HGI of 2.5 mmol/L. A patient who is normoglycemic with all glucoses ≤6.0 mmol/L will have an HGI of 0.0 171 Metabolic interventions in acute myocardial infarction mmol/L. Even though this study's primary focus is hyperglycemia, hypoglycemia cannot be omitted. We determined the number of hypoglycemic episodes per patient as the number of intervals of 4 hours with at least one measurement <2.7 mmol/L.6;7 Statistical analysis Data were expressed as medians and interquartile ranges (IQR) unless otherwise indicated. Differences between groups were assessed with the Mann-Whitney U test. Chisquare analysis was used to test differences between proportions. The primary endpoint was 30-day mortality. In univariate analysis we assessed the performance of HGI and other glucose-derived measures in relation with 30-day mortality. Patients were divided in survivors (patients alive at 30 days) and non-survivors. Receiver operator characteristics (ROC) curves were computed. We performed a multivariate binary logistic regression analysis with age, sex, type of admission, APACHE-II and all glucose-derived measures as independent parameters and 30-day mortality as the dependent parameter. Differences were considered significant for a two-tailed P-value <0.05. The Statistical Package for the Social Sciences (SPSS Inc., Chicago, IL, USA; version 11.0.1) was used for statistical analysis. Results In the 12-year period 6 885 patients were admitted to the ICU. A total of 1 779 patients (26%) stayed for a period of at least four days and were included in the study. Mean age was 55 years (SD±19) and 65% were males. Table 1 lists the demographic data and glucose related measures for survivors and non-survivors. APACHE-II scores were available for the years 1992-1999, for all other parameters there were no missing data. Abdominal surgery and trauma were the most frequent reasons for ICU admission. A total of 65528 glucose measurements were performed in the 1 779 included patients, with a median number of glucose measurements of 21 (IQR 11-42). In less than 1% of the patients not a single glucose measurement was performed. The median mean glucose value of all patients was 7.0 (IQR 6.1-8.6), median morning glucose was 6.7 (IQR 5.9-8.1), median admission glucose was 7.3 (IQR 5.8-9.7), median maximum glucose was 8.7 (IQR 6.9-11.6) and median HGI was 1.0 (IQR 0.4-2.4). Severe hypoglycemia (glucose <2.7 mmol/L) occurred in 177 (6.6%) patients. The median duration of such hypoglycemic episodes was 1.5 (0.6-3.4) hours. Survivors and non-survivors both stayed at the ICU for a median of 10 days, IQR was 6 to 20 days for survivors and 6 to 17 days for non-survivors. A total of 295 patients (17%) died within 30 days after ICU admission. 172 Hyperglycemic index in critically ill patients Figure 2. Receiver operator characteristic (ROC) curves for different glucose measures In the univariate analysis, median mean glucose level was 7.7 mmol/L in non-survivors compared to 6.8 mmol/L in survivors (P<0.001). Median HGI was 1.8 in non-survivors, twice as high as in survivors (P<0.001). The ROC curves for all glucose derived parameters are shown in figure 2. HGI had the highest area under the curve (0.64). Figure 3 depicts the relation of HGI-quartiles with mortality. Mortality in the lowest HGIquartile was 8.6% compared to 25.1% in the highest HGI-quartile (P<0.001). Figure 4 shows the area under the ROC curve for HGI when cut-off values other than 6.0 mmol/L are used. In multivariate analysis with APACHE-II, sex and age, HGI remained as the only significant glucose index in the binary logistic model (P<0.001). P-values of mean glucose, morning glucose, admission glucose and maximum glucose were 0.08, 0.17, 0.43 and 0.49, respectively. With regard to mortality the results of regression analysis did not differ between the cohort of patients whose APACHE-II scores were available and the cohort of which the APACHE-II scores were not available. Discussion Of all measures of hyperglycemia evaluated, HGI correlated best with 30-day mortality in this population of critically ill patients. This supports our hypothesis that HGI is a useful 173 Metabolic interventions in acute myocardial infarction index to quantify glucose regulation. Therefore, assuming that normoglycemia is the aim, the goal of a glucose-insulin algorithm is clear. The algorithm should obtain an HGI as close to zero as possible. Both in the univariate analysis and in the multivariate binary logistic regression analysis - where severity of illness, age and sex were included - HGI emerged as the best indicator of hyperglycemia. We assume this reflects the fact that HGI takes better account of the factor time, and avoids the phenomenon that alternating high and low values average out to a normal value. Figure 3. Relation between HGI - divided in quartiles - and mortality 30-day mortality (%) 30 20 10 0 0-0.4 mmol/L 0.4-1.0 mmol/L 1.0-2.4 mmol/L 2.4-8.9 mmol/L HGI quartiles In the highest quartile mortality is nearly three times higher than mortality in the lowest quartile (P<0.001). HGI denotes hyperglycemic index. The principle of calculating the area under the glucose curve is not new. Brown and Dodek determined the area under the curve above a glucose threshold of 11.5 mmol/L.8 The area under the curve was used to assess the speed of initial normalization of glucose with an insulin algorithm. Other recent studies have also used glucose thresholds above 10.0 mmol/L to separate good control from poor control.20;21 However, such thresholds are now considered as high with regard to the Leuven study, since that study demonstrated improved outcome if normoglycemia (4.4 to 6.1 mmol/L) was pursued.4;5 Regarding the fact that the vast majority of glucoses in our patients were <10 mmol/L, crucial information would have been lost with a cut-off of 10.0 mmol/L as reflected by a decreased area under the ROC-curve at a cut-off value for HGI of 10.0 mmol/L (figure 4). The cut-off of 6.0 mmol/L was based on the upper limit of the group of patients with strict 174 Hyperglycemic index in critically ill patients regulation in the Leuven study. Recently Finney and colleagues found that glucose regulation below 8.3 mmol/L was not related to a better outcome.19 This agrees with our observations, as figure 4 shows that the optimal HGI-cut-off lies between 6.0 and 8.0 mmol/L. Study limitations Some limitations of this study should be mentioned. Our study concerned a retrospective, single ICU study that covers a period when strict glucose regulation was not a major issue. Mortality at 30 days was used as an outcome measure to identify the best glucose index. HGI was the best measure of glucose regulation, but with a ROC-area of 0.64 HGI alone can not serve as a useful predictor of mortality. The relative contributions of endogenous glucose production, exogenous glucose supply and insulin to HGI and other some other measures could not be identified since our study did not include glucose infusion or (par)enteral feeding, nor did it include intensive treatment with insulin. Figure 4. HGI for various glucose cut-offs ROC area 0,7 0,6 0,5 4 6 8 10 12 14 16 Cut-off for HGI mmol/l The cut-off in all other analyses was chosen at 6 mmol/L as it was the upper limit of the intensive treatment group in the Leuven study. To see how the performance of HGI is at other cut-off values the area under the ROC curve was determined for HGI cut-offs from 4.0 to 15.0 mmol/L. In the patients studied, a cut-off between 6.0 and 8.0 mmol/L was associated with the highest area. It should be stressed that HGI was designed to quantify hyperglycemia, not hypoglycemia. Prevention of hypoglycemia is a critical requirement for any algorithm for glucose regulation.5-7 However, unlike hyperglycemia, hypoglycemia is a phenomenon that tends to be relatively short-lived as our results show, and might be quantified by more 175 Metabolic interventions in acute myocardial infarction straightforward measures, such as the lowest glucose. An elevated admission glucose level is associated with a worse outcome, as has been found by many investigators in various patient categories, as was also found in our study.1-3;12;13;22-30 In our study however the area under the ROC curves was smaller for all conventional measures of glucose regulation than it was for HGI. Like other indices of glucose regulation, HGI is related to outcome. However in contrast to admission glucose, HGI is also amenable to therapy. HGI involves additional computation (figure 1) compared with more straightforward indices, but HGI does not require more information. Calculating HGI should be feasible in ICU's that possess a patient database management system (PDMS) that can provide automated input for the HGI calculation. The fact that HGI expresses glucose regulation as a single value, has methodological advantages. The performance of glucose-insulin algorithms could be compared with HGI. Therefore it is important to regularly measure glucose. A major advantage of HGI is that periods of very frequent sampling (e.g. during hyperglycemia or hypoglycemia) are compensated for as HGI is based on a time average. HGI must be reassessed in the era of tighter glucose regulation. Moreover, the value of HGI needs confirmation in other ICUs. Since HGI has not been used by other investigators, it would be of interest how HGI compares with other glucose indices in observational or intervention studies. Existing glucose patient databases could be reanalyzed to determine HGI. The use of glucose measures to predict outcome independently of other parameters such as age and severity scores is interesting but lacks power as is proven by the area under the ROC. More in general HGI may be more useful to relate hyperglycemia with organ failure scores such as the Sequential Organ Failure Assessment (SOFA) score 31 , or parameters of systemic inflammation. Continuous measurements of blood glucose will allow to calculate and compare HGI and the value of other glucose measures to a degree not possible with intermittent measurements.32-35 Currently available glucose sensors are promising but have not yet proven to be sufficiently reliable in critically ill patients and do not allow continuous measurements over prolonged periods.32-35 Conclusion In conclusion, HGI quantifies the impact of hyperglycemia in critically ill patients better than other glucose indices. HGI may thus be a useful measure of glucose regulation. References 1. Capes SE, Hunt D, Malmberg K, Gerstein HC. Stress hyperglycaemia and increased risk of death after myocardial infarction in patients with and without diabetes: a systematic overview. Lancet 2000;355:773-78. 176 Hyperglycemic index in critically ill patients 2. Capes SE, Hunt D, Malmberg K, Pathak P, Gerstein HC. Stress hyperglycemia and prognosis of stroke in nondiabetic and diabetic patients: a systematic overview. Stroke 2001;32:242632. 3. Umpierrez GE, Isaacs SD, Bazargan N, You X, Thaler LM, Kitabchi AE. Hyperglycemia: an independent marker of in-hospital mortality in patients with undiagnosed diabetes. J Clin Endocrinol Metab 2002;87:978-82. 4. van den Berghe G, Wouters P, Weekers F et al. Intensive insulin therapy in the critically ill patients. N Engl J Med 2001;345:1359-67. 5. van den Berghe G, Wouters PJ, Bouillon R et al. Outcome benefit of intensive insulin therapy in the critically ill: Insulin dose versus glycemic control. Crit Care Med 2003;31:359-66. 6. Fischer KF, Lees JA, Newman JH. Hypoglycemia in hospitalized patients. Causes and outcomes. N Engl J Med 1986;315:1245-50. 7. Stagnaro-Green A, Barton MK, Linekin PL, Corkery E, deBeer K, Roman SH. Mortality in hospitalized patients with hypoglycemia and severe hyperglycemia. Mt Sinai J Med 1995;62:422-26. 8. Brown G, Dodek P. Intravenous insulin nomogram improves blood glucose control in the critically ill. Crit Care Med 2001;29:1714-19. 9. Tenerz A, Lonnberg I, Berne C, Nilsson G, Leppert J. Myocardial infarction and prevalence of diabetes mellitus. Is increased casual blood glucose at admission a reliable criterion for the diagnosis of diabetes? Eur Heart J 2001;22:1102-10. 10. Tenerz A, Norhammar A, Silveira A et al. Diabetes, insulin resistance, and the metabolic syndrome in patients with acute myocardial infarction without previously known diabetes. Diabetes Care 2003;26:2770-2776. 11. Woo J, Lam CW, Kay R, Wong AH, Teoh R, Nicholls MG. The influence of hyperglycemia and diabetes mellitus on immediate and 3-month morbidity and mortality after acute stroke. Arch Neurol 1990;47:1174-77. 12. Bolk J, van der Ploeg T, Cornel JH, Arnold AE, Sepers J, Umans VA. Impaired glucose metabolism predicts mortality after a myocardial infarction. Int J Cardiol 2001;79:207-14. 13. Gore DC, Chinkes D, Heggers J, Herndon DN, Wolf SE, Desai M. Association of 14. Krinsley JS. Association between hyperglycemia and increased hospital mortality in a hyperglycemia with increased mortality after severe burn injury. J Trauma 2001;51:540-544. heterogeneous population of critically ill patients. Mayo Clin Proc 2003;78:1471-78. 15. Yendamuri S, Fulda GJ, Tinkoff GH. Admission hyperglycemia as a prognostic indicator in 16. Bonnier M, Lonnroth P, Gudbjornsdottir S, Attvall S, Jansson PA. Validation of a glucose- trauma. J Trauma 2003;55:33-38. insulin-potassium infusion algorithm in hospitalized diabetic patients. J Intern Med 2003;253:189-93. 17. van der Horst IC, Gans RO, Nijsten MW, Ligtenberg JJ. Beneficial effect of glucose-insulinpotassium infusion in noncritically ill patients has to be proven. J Intern Med 2003;254:513. 18. Bonnier M, Lonnroth P, Gudbjornsdottir S, Attvall S, Jansson PA. Beneficial effect of glucoseinsulin- potassium infusion in noncritically ill patients has to be proven - reply. J Intern Med 2003;254:514. 177 Metabolic interventions in acute myocardial infarction 19. Finney SJ, Zekveld C, Elia A, Evans TW. Glucose control and mortality in critically ill patients. 20. Furnary AP, Gao G, Grunkemeier GL et al. Continuous insulin infusion reduces mortality in JAMA 2003;290:2041-47. patients with diabetes undergoing coronary artery bypass grafting. J Thorac Cardiovasc Surg 2003;125:1007-21. 21. Pomposelli JJ, Baxter JK, III, Babineau TJ et al. Early postoperative glucose control predicts nosocomial infection rate in diabetic patients. JPEN J Parenter Enteral Nutr 1998;22:77-81. 22. Bruno A, Levine SR, Frankel MR et al. Admission glucose level and clinical outcomes in the 23. Foo K, Cooper J, Deaner A et al. A single serum glucose measurement predicts adverse 24. Goldberg PA, Siegel MD, Sherwin RS et al. Implementation of a Safe and Effective Insulin 25. Lam AM, Winn HR, Cullen BF, Sundling N. Hyperglycemia and neurological outcome in 26. Paret G, Barzilai A, Lahat E et al. Gunshot wounds in brains of children: prognostic variables NINDS rt-PA Stroke Trial. Neurology 2002;59:669-74. outcomes across the whole range of acute coronary syndromes. Heart 2003;89:512-16. Infusion Protocol in a Medical Intensive Care Unit. Diabetes Care 2004;27:461-67. patients with head injury. J Neurosurg 1991;75:545-51. in mortality, course, and outcome. J Neurotrauma 1998;15:967-72. 27. Penney DG. Hyperglycemia exacerbates brain damage in acute severe carbon monoxide poisoning. Med Hypotheses 1988;27:241-44. 28. Rovlias A, Kotsou S. The influence of hyperglycemia on neurological outcome in patients with severe head injury. Neurosurgery 2000;46:335-42. 29. Young LH, Dahl DM, Rauner D, Barrett EJ. Physiological hyperinsulinemia inhibits myocardial 30. Dorhout Mees SM, Van Dijk GW, Algra A, Kempink DR, Rinkel GJ. Glucose levels and protein degradation in vivo in the canine heart. Circ Res 1992;71:393-400. outcome after subarachnoid hemorrhage. Neurology 2003;61:1132-33. 31. Vincent JL, Moreno R, Takala J et al. The SOFA (Sepsis-related Organ Failure Assessment) score to describe organ dysfunction/failure. On behalf of the Working Group on SepsisRelated Problems of the European Society of Intensive Care Medicine. Intensive Care Med 1996;22:707-10. 32. Chee F, Fernando T, van Heerden PV. Closed-loop control of blood glucose levels in critically 33. Chee F, Fernando T, van Heerden PV. Closed-loop glucose control in critically ill patients ill patients. Anaesth Intensive Care 2002;30:295-307. using continuous glucose monitoring system (CGMS) in real time. IEEE Trans Inf Technol Biomed 2003;7:43-53. 34. Jungheim K, Wientjes KJ, Heinemann L, Lodwig V, Koschinsky T, Schoonen AJ. Subcutaneous continuous glucose monitoring: feasibility of a new microdialysis-based glucose sensor system. Diabetes Care 2001;24:1696-97. 35. Kapitza C, Lodwig V, Obermaier K et al. Continuous glucose monitoring: reliable measurements for up to 4 days with the SCGM1 system. Diabetes Technol Ther 2003;5:60914. 178 Hyperglycemia and outcome in critically ill patients Chapter 5.3 Relationship of baseline glucose and mortality during medical critical illness? Jack JM Ligtenberg, Sofie Meijering, Iwan CC van der Horst, Jan G Zijlstra, Mathijs Vogelzang, Maarten WN Nijsten Chest in press 179 Metabolic interventions in acute myocardial infarction To the editor: We read with interest the study by Cely and colleagues (September 2004) on the relationship of baseline glucose homeostasis to hyperglycemia in critically ill patients.1 The authors show that hyperglycemia generally is present in critical illness and that patients with low ‘baseline’ HbA1c levels are less inclined to hyperglycemia than patients with higher HbA1c. Furthermore, they mention that ‘patients with normal and abnormal baseline glucose control had similar survival rates’. We don’t think that this statement has statistical validity, concerning the limited number of evaluated patients (75 patients; ICU mortality rate 29%). To determine the relation between blood glucose regulation and mortality, we conducted an analysis among all patients admitted to our medical ICU over a 2 years period. 1209 consecutive patients were included. ICU mortality was 19.4%. Total number of glucose measurements was 10954. Mortality was significantly lower in the group with a mean glucose of 4.0-6.0 mmol/L versus the group with a mean glucose of 6.0-10.0 mmol/L: 12% versus 17.6%, P=0.03. Patients that died in the ICU (N= 235) also had significantly higher baseline glucose values than patients that left the ICU alive (N=974): 9.0±5.3 versus 7.6±4.3 mmol/L. We also calculated mortality rate after dividing patients in groups, based on average glucose level during ICU admission. Mortality rate in the group with an average glucose of 4.4-6.1 mmol/L (N= 300) was 12%, whilst mortality with an average glucose of >11.1 mmol/L (N= 96) was 37.5%. Maximal glucose values during admission appeared to be lower in survivors than in non-survivors: 9.6±5.2 versus 11.7±6.0 mmol/L. Acute hyperglycemia is frequently found in stress situations.2-8 Since it is so common, it could be explained as a physiologic adaptation. On the other hand, hyperglycemia is associated with complications and there is increasing evidence that strict regulation of glucose could have beneficial effects on morbidity and even mortality.9-11 Based on our own findings and those of others, we assume that hyperglycemia is correlated with mortality in critically ill patients. The next important step is to design and start up feasible glucose regulation protocols and study the effect of strict glucose regulation also in medical intensive care patients. References 1. Cely CM, Arora P, Quartin AA, Kett DH, Schein RM. Relationship of baseline glucose homeostasis to hyperglycemia during medical critical illness. Chest 2004;126:879-87. 2. Bonnier M, Lonnroth P, Gudbjornsdottir S, Attvall S, Jansson PA. Validation of a glucoseinsulin-potassium infusion algorithm in hospitalized diabetic patients. J Intern Med 2003;253:189-93. 3. Goldberg PA, Siegel MD, Russell RR et al. Experience with the continuous glucose monitoring system in a medical intensive care unit. Diabetes Technol Ther 2004;6:339-47. 180 Hyperglycemia and outcome in critically ill patients 4. McCowen KC, Malhotra A, Bistrian BR. Stress-induced hyperglycemia. Crit Care Clin 2001;17:107-24. 5. Mizock BA. Alterations in fuel metabolism in critical illness: hyperglycaemia. Best Pract Res Clin Endocrinol Metab 2001;15:533-51. 6. Umpierrez GE, Isaacs SD, Bazargan N, You X, Thaler LM, Kitabchi AE. Hyperglycemia: an independent marker of in-hospital mortality in patients with undiagnosed diabetes. J Clin Endocrinol Metab 2002;87:978-82. 7. van der Horst IC, Gans RO, Nijsten MW, Ligtenberg JJ. Beneficial effect of glucose-insulinpotassium infusion in noncritically ill patients has to be proven. J Intern Med 2003;254:513. 8. van der Horst IC, Ligtenberg JJ, Bilo HJ, Zijlstra F, Gans RO. Glucose-insulin-potassium infusion in sepsis and septic shock: no hard evidence yet. Crit Care 2003;7:13-15. 9. Krinsley JS. Association between hyperglycemia and increased hospital mortality in a heterogeneous population of critically ill patients. Mayo Clin Proc 2003;78:1471-78. 10. van den Berghe G, Wouters P, Weekers F et al. Intensive insulin therapy in the critically ill 11. van den Berghe G, Wouters PJ, Bouillon R et al. Outcome benefit of intensive insulin therapy patients. N Engl J Med 2001;345:1359-67. in the critically ill: Insulin dose versus glycemic control. Crit Care Med 2003;31:359-66. 181 Metabolic interventions in acute myocardial infarction 182 Rationale and design of GIPS-2 Chapter 6 Glucose-insulin-potassium and reperfusion in acute myocardial infarction: rationale and design of the Glucose-InsulinPotassium Study-2 (GIPS-2) Iwan CC van der Horst, Jorik R Timmer, Jan Paul Ottervanger, Henk JG Bilo, Rijk OB Gans, Menko-Jan de Boer, Felix Zijlstra, on behalf of the GIPS investigators American Heart Journal in press 183 Metabolic interventions in acute myocardial infarction Abstract Background The combination of reperfusion therapy and high-dose glucose-insulin-potassium infusion (GIK) seems beneficial in acute myocardial infarction (MI). Current evidence however is not considered conclusive. Study design The Glucose-Insulin-Potassium Study-2 (GIPS-2) will investigate whether GIK, in adjunction to reperfusion therapy, is beneficial in MI patients without signs of heart failure at admission. A total of at least 1044 patients with an acute MI treated with either thrombolysis or primary percutaneous coronary intervention (PCI) will be randomized to an infusion of high-dose GIK or no infusion. The primary endpoint of the study is 30-day mortality. Secondary endpoints are mortality at 1-year, recurrence of MI, repeat intervention and infarct size. Implications If high-dose GIK significantly reduces mortality at 30-days in all patients, the adjunction of this treatment to reperfusion therapy may become part of standard regimen for patients with acute MI without heart failure. 184 Rationale and design of GIPS-2 Introduction Mortality, morbidity and infarct size following acute myocardial infarction (MI) are considerably reduced by reperfusion therapy, i.e. thrombolysis or primary percutaneous coronary intervention (PCI), and adequate medical treatment.1-3 Further reduction may be obtained by therapies influencing cardiac metabolism, such as the infusion of glucoseinsulin-potassium (GIK). Background GIK therapy may improve outcome after MI through several potential mechanisms.4 GIK reduces the amount of circulating free fatty acids (FFA) and promotes the use of glucose as primary myocardial energy substrate.5-8 Glucose is less oxygen consuming in comparison to free fatty acids (FFA) and has a beneficial effect on myocardial function and membrane stability.9;10 Furthermore, insulin improves myocardial perfusion and may reduce reperfusion injury.11 Insulin activates intracellular signaling pathways that promote cell survival and inhibit apoptosis related events. As apoptosis may play a significant role in reperfusion injury, GIK infusion may limit additional myocardial damage after adequate perfusion has been restored 11-13 Previous studies Treatment with GIK was first mentioned in the early sixties by Sodi-Pollares.14 Thereafter, GIK infusion has been advocated in small trials as the therapy of choice in the early hours following acute myocardial infarction.15-21 An systematic overview involving nine of these early studies with 1932 patients concluded that GIK might play an important role in reducing in-hospital mortality after acute myocardial infarction.22 This benefit was particularly present in studies that used a high dose GIK scheme, with a reduction of inhospital mortality from 11.8% to 7.0% (p=0.05). This is in accordance with experimental studies showing that high-dose GIK (≥5 units insulin/hour) maximally suppresses circulating FFA levels and induces maximum myocardial glucose uptake.5 The first clinical study of GIK patients with MI in the era of reperfusion was the Diabetes Mellitus, Insulin Glucose Infusion in Acute Myocardial Infarction (DIGAMI) study.23 This study included 620 patients with diabetes mellitus or hyperglycemia (glucose > 11.0 mmol/l) on admission and randomly assigned them to either conventional therapy or adjunctive therapy through a glucose-insulin infusion followed by a multidose insulin regimen for at least 3 months. Patients treated with GIK had a significantly lower 1-year mortality (18.6% versus 26.1%, p=0.03). A few years later the Estudios Cardiologicos Latinoamerica (ECLA) pilot trial, which included 407 patients was published.24 It showed that after 30 days mortality in the group of patients randomized to GIK (both high and low dose) was lower than in the 185 Metabolic interventions in acute myocardial infarction control group (6.7% versus 11.5%, NS). The effect was most pronounced in patients in which GIK had been combined with reperfusion treatment, mostly thrombolysis (5.1% versus 15.1%, P=0.01). Again, high dose GIK proofed to be most beneficial compared to low dose GIK. In the Polish-Glucose-Insulin-Potassium (Pol-GIK) trial with 954 patients, the mortality in patients treated with low dose GIK was higher than in the control group (8.9% versus 4.8%, P=0.01).25 Mortality due to a cardiovascular incident was not significantly different, and as such the cause of this difference remained unclear. In the GlucoseInsulin-Potassium Study 1 (GIPS-1) 940 patients were randomized to high-dose GIK or no infusion in combination with primary PCI.26 Figure 1. The odds ratio and confidence interval of all randomized trials with GIK stratified according to the use of high versus low dose GIK Stanley Rogers GIPS ECLA high-dose DIGAMI Total high-dose Mittra Pentecost MRC Pilcher Hjermann ECLA low-dose Pol-GIK Total low-dose Total 0.0 0.5 GIK better 1.0 1.5 2.0 2.5 Control better Overall there is a significant benefit of GIK in comparison to the control group. High dose GIK seems more beneficial in comparison to low dose. HD denotes high-dose GIK. LD denotes low-dose GIK. GIPS = Glucose-Insulin-Potassium Study. ECLA = Estudios Cardiologicos Latinoamerica. DIGAMI = Diabetes Insulin-Glucose in Acute Myocardial Infarction study MRC = Medical Research Council. Pol-GIK = Polish Glucose Insulin Potassium. In both comparisons of the ECLA the same control group is used; in the total of all patients this groups is accounted for once. 186 Rationale and design of GIPS-2 In the overall population the beneficial effect of GIK did not reach significance (4.8% versus 5.8%, P=0.50). In 856 of the 940 patients (91.6%) admitted without signs of heart failure (Killip class 1) a significant difference was observed (1.2% versus 4.2%, P=0.01). Results of all randomized trials are summarized in figure 1. Figure 2. Trial design of GIPS-2 Taken all these results together, a recent editorial concluded that current evidence for the use of GIK in acute MI is not conclusive and whether it is, is a crucial issue to resolve.27 The multicenter GIPS-2 is designed to address this issue, i.e. whether the infusion of highdose GIK has a beneficial effect on 30-day and 1-year mortality and morbidity in patients eligible for reperfusion therapy, without signs of heart failure. 187 Metabolic interventions in acute myocardial infarction Methods Overview The planned inclusion calls for a total of at least 1044 patients with an acute MI treated with thrombolysis or primary PCI which will be randomly assigned to high-dose GIK infusion or no infusion (ratio 1:1). It is a multicenter trial performed in the Netherlands, with participation of hospitals of varying sizes, both with and without coronary intervention facilities. Randomization and GIK administration will take place in the hospital that will initiate the reperfusion therapy. A flow chart of the study design is shown in figure 2. Patients have to meet the stated inclusion criteria. Patients with signs of heart failure and reduced life expectancy due to other diseases will be excluded. Patients eligible for randomization will either receive conventional care with reperfusion with GIK or no infusion. Primary endpoint is 30-day mortality. Patients will at least be followed until 1year after randomization. MI denotes myocardial infarction. GIK denotes glucose-insulinpotassium infusion. Endpoints The primary endpoint is 30-day mortality. Secondary endpoints are 1-year mortality, recurrent myocardial infarction and repeat intervention. Furthermore, left ventricular function, enzymatic infarct size and ST segment elevation resolution on the electrocardiogram will be measured. Systemic metabolism will be derived from specific laboratory measurements. At baseline kreatinin, K, glucose, HbA1c, and free fatty acids (FFA) will be determined. Glucose and FFA measurements will be repeated at 1-2 hour intervals in all patients during hours of infusion. In earlier studies administration of GIK lowered the circulating levels of FFA through the inhibitory effect of insulin on lipolyses.8 This decrease in FFA levels, in combination with an increase in glucose and insulin availability, promotes the myocardial use of glucose over FFA.28 To obtain insight in the effect of GIK infusion on left ventricular function, we will determine left ventricular ejection fraction (LVEF). LVEF will be measured before discharge by radionuclide ventriculography or by echocardiography. Radionuclide ventriculography will be performed by using the multiple gated equilibrium method following the labeling of red blood cells of the patient with 99mTc-pertechnate [General Electric 300 gamma camera with a low-energy all-purpose parallel-hole collimator]. Global ejection fraction will be calculated by a General Electric Star View computer using the fully automatic PAGE program. 188 Rationale and design of GIPS-2 Electrocardiography (ECG) will be performed at admission, and at 3 hours after PCI. All ECGs will be analyzed as pairs by an independent core laboratory (Diagram BV, Zwolle, The Netherlands) and graded for ST segment elevation resolution by 2 investigators who are unaware of the data and outcome. ST segment resolution will be defined as complete (>70% resolution), partial (30-70% resolution) or no resolution (<30% resolution).29 Core laboratory annalists who are unaware of the clinical history and outcome of the patients will assess TIMI (Thrombolysis In Myocardial Infarction) flow and myocardial blush grade (MBG). TIMI flow and MBG will be visually assessed on the angiogram. MBG has been defined previously: 0, no myocardial blush; 1, minimal myocardial blush or contrast density; 2, moderate myocardial blush or contrast density but less than that obtained during angiography of a contra or ipsilateral non-infarct related coronary artery; and 3, normal myocardial blush or contrast density, comparable with that obtained during angiography of a contralateral or ipsilateral non-infarct-related coronary artery.30;31 When myocardial blush persists, this phenomenon suggests leakage of contrast medium into the extravascular space and is graded 0. With these measures more detailed information about the microcirculation will be available. We can determine whether GIK is beneficial in patients with disturbed or normal blush grade or in patients with TIMI 3 flow after primary PCI. Number of patients Based on the results of the GIPS-1 it can be anticipated that the primary endpoint in the two groups of randomization will be the following. A sample size of 1044 patients, with 522 patients in each treatment group is planned. The number of patients included in this study is based on a power-analysis. A study of this size has a statistical power of 80% at an alpha level of 0.05 to show a mortality reduction as previously reported in patients without signs of heart failure on admission. These mortality rates were 1.2% in the GIK group and 4.2% in the control group.26 We did hypothesize that a risk reduction of 30% in patients with Killip class 1 would be more realistic.26 We therefore will perform an interim analysis using Snapinn’s method after approximately 731 patients.32 This method describes a conditional probability procedure which attempts to maintain the overall significance level by balancing the probabilities of false early rejection and false early acceptance. At the time of the interim analysis it will be considered to prolong the inclusion and thereby including the sufficient number of patients. Patient selection, patient consent and randomization All patients admitted to one of the participating hospitals with acute MI are considered for the study and prospectively evaluated. The purpose and details of the study are explained 189 Metabolic interventions in acute myocardial infarction to all patients and their consent will be obtained prior to participation in the study. Patients are enrolled in an emergency situation, and therefore consent is given verbally in the presence of an independent witness. Written informed consent has to be given by the patient as soon as the clinical situation of the patient allows it, i.e. after the patient has recovered from the acute phase of the MI. After verbal consent is obtained patients will be randomized by telephone using a computerized voice response system. Randomization will be performed by means of a computer program in blocks of 4-8 patients (randomly changing block size) to achieve a balanced allocation. All patients will receive a unique randomization number. Study population The diagnosis acute MI will include chest pain suggestive for myocardial ischemia for at least 30 minutes, the time from onset of this symptoms should be less than 6 hours before hospital admission, and an ECG recording with ST T segment elevation of more than 1 mV in 2 or more leads. Patients have to be eligible for either thrombolysis or primary PCI. Patients with signs of heart failure at admission (Killip class ≥2) will be excluded. Heart failure at admission is defined as the existence of either one of the following symptoms, i.e. a heart rate over 90 beats/min, a systolic blood pressure beneath 100 mmHg with anterior myocardial infarction, a third heart sound, or rales more than one hand-wide. Further exclusion criteria are the unwillingness to participate and the existence of a lifethreatening disease with a life-expectancy of less than 6 months. There will be no upper age limit. Medication The mode of reperfusion therapy given is chosen by the individual cardiologist. If the cardiologist decides for thrombolysis, this may consist of any of the appropriate regimens, as stated in the recently updated guidelines of the European Society of Cardiology/American College of Cardiology.33;34 If the cardiologist decides for primary PCI the patient is transported to the catheterisation laboratory for emergency coronary angiography and if indicated primary angioplasty is performed. Additional standard treatment consist of 5000 IU heparin, nitroglycerin intravenously, and aspirin 500 mg intravenously or 300 mg orally. During angioplasty 10,000 IU heparin is administered as bolus. Low molecular weight heparin is given for 24 hours thereafter. Standard therapies including aspirin 80 mg, clopidogrel 75 mg, beta-blockers, lipid lowering agents and angiotensin converting enzyme inhibitors or angiotensin II receptor blockers are likely to be protective in most patients, and should be used according to the guidelines of the European Society of Cardiology/American College of Cardiology.33;34 190 Rationale and design of GIPS-2 Figure 3. Algorithm of GIK administration Scheme 1: Starting dose of insulin infusion rate Glucose (mmol/L) Additional action > 15 6 IU short-acting insulin i.v. Infusion rate (IU/hour) 23 11.0-15.0 23 10.0-10.9 18 9.0-9.9 14 8.0-8.9 9 7.0-7.9 5 < 7 3 Scheme 2: Hourly adjustment of insulin infusion rate based on hourly measured glucose Glucose level (mmol/L) Additional action > 15 6 IU short-acting insulin i.v. Infusion rate (IU/hour) Increase with 5 11.0-15.0 Increase with 3 10.0-10.9 Increase with 2 6.0-9.9 Leave unchanged 4.0-5.9 Decrease with 8 <4 1. Stop infusion for 15 minutes 2. Measure blood glucose level every 15 minutes until >6,9 mmol/L 3. Start infusion with infusion rate 7 ml/hour beneath rate before stop 4. If symptoms of hypoglycemia are present than give 20 ml of glucose 30% i.v. An infusion of 500 ml 20% glucose with 40 mmol potassium chloride is started with a fixed infusion rate of 2 ml/kg body weight/hour. In addition, a variable infusion of short acting insulin is started. Initial insulin dose is according to the admission glucose (Scheme 1). For example: a glucose level at admission of 9.5 mmol/L dictates an initial insulin dose of 14 units/hour. Based on subsequent hourly measured glucose levels the insulin infusion rate will be changed according to Scheme 2. As can be seen in scheme 2; insulin infusion is increased when glucose levels are ≥ 10 mmol/L and decreased when glucose levels are < 6.0 mmol/L. If blood glucose levels drop more than 30% and glucose is still > 11.0 mmol/L the rate should not be increased. If blood glucose levels drops more than 30% and the eventual glucose is between 6.0 and 11.0 mmol/L, than the rate should be decreased with 5 units. Infusion rate must not exceed 38 ml/hour. If the infusion rate should be increased above 38 ml/hour than add 6 IU of short-acting insulin. ∗ GIK denotes glucose-insulinpotassium infusion. 191 Metabolic interventions in acute myocardial infarction Patients randomly assigned to the GIK group receive an infusion of 40 mmol potassium chloride in 500 ml 20% glucose, which is administered with a fixed rate of 2.0 ml/kilogram body weight/hour over a 12 hour period in a peripheral venous line. The infusion is started as soon as possible after admission at the hospital (i.e. after blood-glucose level is determined), preferably before reperfusion therapy is started. Thereby a continuous infusion of short-acting insulin (50 units Actrapid HM [Novo Nordisk, Copenhagen, Denmark]) in 49.5 ml of 0.9 percent sodium chloride with the use of a perfusor-pump will also be started. This insulin infusion rate is variable. The first measured glucose level, prior to the glucose-potassium infusion, determines the dosage at which the insulin pump is started (figure 3 – scheme 1). Hereafter, glucose levels will be measured every hour. Subsequent adjustment of the insulin dose will be based on these hourly measurements of glucose, aiming at blood-glucose levels of 6.0 to 10.0 mmol/l (figure 3 – scheme 2). After the glucose-potassium infusion is stopped insulin may be continued based on glucose measurements according to the conventional care. In the control group blood glucose regulation will be according to the conventional care. In general, the initial insulin infusion rate will be at least 5 units/hour, as most patients will have an admission glucose ≥7.0 mmol/L. The insulin dose is comparable with the DIGAMI study (4.8 units/hour) and the high dose regimen of the ECLA trial (5.6 units/hour).35;36 Whereas it is higher than the low dose regimen of the ECLA (1.5 units/hour) or the Pol-GIK trial (1.3 units/hour).24;25 Most studies employed insulin as a fixed dose with glucose delivery titrated to maintain target glucose concentrations. In our studies we use a fixed glucose infusion combined with potassium chloride and titrate insulin to obtain strict control of blood-glucose levels. It is known that hyperglycemia is a prognostic factor in acute MI in both patients with and without diabetes mellitus.37;38 Treating MI patients with insulin in the DIGAMI has shown to have beneficial effects on both glucose control and survival.23 The reduction of mortality by intensive insulin therapy in critically ill patients to maintain blood glucose below 6.1 mmol/l gives also direction for metabolic interventions, such as GIK infusion, that are directed towards prevention of hyperglycemia.39 In two studies including diabetic patients treated with coronary artery bypass grafting strict glucose control with either insulin alone or GIK was related to a significant mortality reduction.40;41 Baseline demographic and clinical characteristics Baseline characteristics that will be collected include age, gender, time of symptom onset, time of admission, history of previous myocardial infarction, hypertension, diabetes mellitus (and type and medication, i.e. diet, tablets, insulin), positive family history for cardiovascular diseases. Physical diagnosis at admission includes heart rate, systolic and diastolic blood pressure, weight, length, heart sounds and lung sounds. 192 Rationale and design of GIPS-2 Inhospital and follow-up assessment All randomized patients should undergo trial follow-up at discharge, 30 days, and 1 year. Follow-up information will be obtained by a telephone interview with the patient. Additional information on events that occurred will be retrieved from hospital records. The hospital in which the patient initially was included and randomized is responsible for complementation of follow-up. Statistical analysis The primary endpoint of the study is 30-day mortality. Secondary endpoints are one-year mortality, recurrent infarction, repeat intervention and infarct size. The incidence of death will be evaluated in predefined subgroups with regard to age, gender, time to treatment, location of the infarction, diabetic status and glycometabolic state on admission. Analyses will be performed according to the intention-to-treat principle. Differences between group means will be assessed with the two-tailed Student’s t-test. Chi-square analysis or Fisher’s exact test was used to test differences between proportions. Survival will be calculated by the Kaplan-Meier product-limit method. The Mantel-Cox (or Log-rank) test will be used to evaluate differences in survival between the two treatment groups. The Cox proportionalhazards regression model will be used to calculate relative risks and to adjust for differences in baseline characteristics. Statistical significance is considered as a two-tailed P-value <0.05. The Statistical Package for the Social Sciences (SPSS Inc., Chicago, IL, USA) version 11.0.1 will be used for all statistical analysis. Study organisation Data on mortality will be collected according to the Case Record Form (CRF). The participating centers will send copies of the CRF. All data will be recorded in a dedicated database at the data-management centre. For entering the data into the database a double data entry system will be used. Data will be checked through an error check program, queries generated out of that program will be solved by the research personnel of the participating centers. Monitors will periodically check a sample of the recorded patient data against source documents at the study site. Future GIK trials Other promising trials investigating GIK in acute MI are underway. The multinational DIGAMI–2 will provide data on potential effects of glycometabolic control in hyperglycemic patients. It was planned to randomize approximately 3000 patients with suspected MI to acute insulin-glucose infusion followed by multidose subcutaneous insulin, acute insulin-glucose infusion followed by conventional hypoglycemic therapy, or conventional hypoglycemic treatment. The main comparison will be the mortality rate 193 Metabolic interventions in acute myocardial infarction between patients randomized to insulin-glucose infuson. The combined multinational ECLA GIK 2/CREATE trial, investigating high-dose GIK, has already included a tremendous number of patients (>27000) and therefore has optimal statistical power. Primary endpoint will be to compare 30-day mortality rate in acute MI patients presenting within 12 hours from symptoms onset and eligible for any reperfusion strategy (thrombolysis or primary PCI) allocated to a high dose GIK infusion versus the control treatment. The multinational Organization to Assess Strategies for Ischemic Syndromes (OASIS)-6 trial will include at least 10000 patients presenting with an acute MI treated with a range of thrombolytic agents, primary PCI and those not eligible for reperfusion therapy (e.g. late presentation or contra-indication to reperfusion therapy). The study has a side arm to investigate the effect of GIK infusion on death and nonfatal cardiac arrest up to day 30. Although the GIPS-2 trial will only include a fraction of patients compared to the latter trials, extensive laboratory and angiographic data and measurement of residual left ventricular function will provide additional insight into the therapeutic mechanisms of GIK. The time between onset of symptoms and initiation of the GIK infusion will be short and secondary prevention will be initiated in all patients. Finally, the GIPS-2 will give the opportunity to complete follow-up over a long time. Current status Enrolment started at August 4th 2003. Conclusion GIPS-2 is a multicenter, randomized, controlled trial that will enroll patients during the acute phase of MI to determine whether GIK should be added to the standard regimen in patients without heart failure at admission. Acknowledgements Research of ICC van der Horst was made possible by a generous grant of the Netherlands Heart Foundation (99.028). The GIPS-2 is recently accepted for an independent grant of the Netherlands Heart Foundation. 194 Rationale and design of GIPS-2 Appendix Steering committee: Dr F. Zijlstra (chair), I.C.C. van der Horst, Dr R.O.B. Gans, Groningen University Hospital, Dr J.P. Ottervanger, J.R. Timmer, Dr M.J. de Boer, Dr H.J.G. Bilo, Isala Klinieken, Locatie Weezenlanden Participating centers: Amsterdam, Academic Medical Center, Dr J.P.S. Henriques Apeldoorn, Ziekhuiscentrum Apeldoorn, Dr E.G. Faber - Assen, Wilhelmina Ziekenhuis, Dr M. Pentinga - Delfzijl, Delftzicht Ziekenhuis, Dr J.N. Spanjaard - Deventer, Deventer Ziekenhuis, Dr H. Groeneveld - Dokkum, Talma Sionsberg, Dr H. The - Emmen, Scheperziekenhuis, Dr T. Vet – Groningen, University Hospital, Dr S.A.J. van den Broek Hardenberg, Streekziekenhuis, locatie Röpcke-Zweers, Dr A.J. Schaap - Harderwijk, Ziekenhuis St. Jansdal, Dr R. Dijkgraaf - Meppel, Diaconessenhuis, Dr R. Brons - Sneek, Antonius Ziekenhuis, Dr. A. Oomen - Winschoten, Sint Lucas Ziekenhuis, Dr T.R. Bouwmeester - Zwolle, Isala Klinieken, locatie Sophia, Dr A.H.E.M. Maas - Zwolle, Isala Klinieken, locatie Weezenlanden, Dr J.H.E. Dambrink -. References 1. Grines CL, Browne KF, Marco J et al. A comparison of immediate angioplasty with thrombolytic therapy for acute myocardial infarction. The Primary Angioplasty in Myocardial Infarction Study Group. N Engl J Med 1993;328:673-79. 2. Zijlstra F, de Boer MJ, Hoorntje JC, Reiffers S, Reiber JH, Suryapranata H. A comparison of immediate coronary angioplasty with intravenous streptokinase in acute myocardial infarction. N Engl J Med 1993;328:680-684. 3. Zijlstra F, Hoorntje JC, de Boer MJ et al. Long-term benefit of primary angioplasty as compared with thrombolytic therapy for acute myocardial infarction. N Engl J Med 1999;341:1413-19. 4. Apstein CS. Increased glycolytic substrate protection improves ischemic cardiac dysfunction and reduces injury. Am Heart J 2000;139:S107-S114. 5. McDaniel HG, Papapietro SE, Rogers WJ et al. Glucose-insulin-potassium induced alterations in individual plasma free fatty acids in patients with acute myocardial infarction. Am Heart J 1981;102:10-15. 6. Opie LH. The glucose hypothesis: its relation to acute myocardial ischemia. J Mol Cell Cardiol 1970;1:107-15. 7. Prather JW, Russell RO, Jr., Mantle JA, McDaniel HG, Rackley CE. Metabolic consequences of glucose-insulin-potassium infusion in treatment of acute myocardial infarction. Am J Cardiol 1976;38:95-99. 8. Rackley CE, Russell RO, Jr., Rogers WJ, Mantle JA, McDaniel HG, Papapietro SE. Clinical experience with glucose-insulin-potassium therapy in acute myocardial infarction. Am Heart J 1981;102:1038-49. 9. Cave AC, Ingwall JS, Friedrich J et al. ATP synthesis during low-flow ischemia: influence of increased glycolytic substrate. Circulation 2000;101:2090-2096. 195 Metabolic interventions in acute myocardial infarction 10. Korvald C, Elvenes OP, Myrmel T. Myocardial substrate metabolism influences left ventricular 11. Legtenberg RJ, Houston RJ, Oeseburg B, Smits P. Physiological insulin concentrations energetics in vivo. Am J Physiol Heart Circ Physiol 2000;278:H1345-H1351. protect against ischemia-induced loss of cardiac function in rats. Comp Biochem Physiol A Mol Integr Physiol 2002;132:161-67. 12. McNulty PH, Pfau S, Deckelbaum LI. Effect of plasma insulin level on myocardial blood flow and its mechanism of action. Am J Cardiol 2000;85:161-65. 13. Marano L, Bestetti A, Lomuscio A et al. Effects of infusion of glucose-insulin-potassium on 14. Sodi-Pallares D, Testelli MR, Fishleder BL et al. Effects of an intravenous infusion of a myocardial function after a recent myocardial infarction. Acta Cardiol 2000;55:9-15. potassium-glucose-insulin solution on the electrocardiographic signs of myocardial infarction. A preliminary clinical report. Am J Cardiol 1962;9:166-81. 15. Hjermann I. A controlled study of peroral glucose, insulin and potassium treatment in myocardial infarction. Acta Med Scand 1971;190:213-18. 16. Medical Research Council Working Party on the Treatment of Myocardial Infarction. Potassium, glucose, and insulin treatment for acute myocardial infarction. Lancet 1968;2:1355-60. 17. Mittra B. Potassium, glucose, and insulin in treatment of myocardial infarction. Lancet 18. Pentecost BL, Mayne NM, Lamb P. Controlled trial of intravenous glucose, potassium, and 1965;2:607-9. insulin in acute myocardial infarction. Lancet 1968;1:946-48. 19. Rogers WJ, Stanley AW, Jr., Breinig JB et al. Reduction of hospital mortality rate of acute 20. Stanley AW, Jr., Prather JW. Glucose-insulin-potassium, patient mortality and the acute myocardial infarction with glucose-insulin-potassium infusion. Am Heart J 1976;92:441-54. myocardial infarction: results from a prospective randomised study. Circulation 1978;57:61. 21. Pilcher J, Etishamudin M, Exon P, Moore J. Potassium, glucose and insulin in myocardial infarction. Lancet 1967;1:1109. 22. Fath-Ordoubadi F, Beatt KJ. Glucose-insulin-potassium therapy for treatment of acute myocardial infarction: an overview of randomized placebo-controlled trials. Circulation 1997;96:1152-56. 23. Malmberg K, Ryden L, Efendic S et al. Randomized trial of insulin-glucose infusion followed by subcutaneous insulin treatment in diabetic patients with acute myocardial infarction (DIGAMI study): effects on mortality at 1 year. J Am Coll Cardiol 1995;26:57-65. 24. Diaz R, Paolasso EA, Piegas LS et al. Metabolic modulation of acute myocardial infarction. The ECLA (Estudios Cardiologicos Latinoamerica) Collaborative Group. Circulation 1998;98:2227-34. 25. Ceremuzynski L, Budaj A, Czepiel A et al. Low-dose glucose-insulin-potassium is ineffective in acute myocardial infarction: results of a randomized multicenter Pol-GIK trial. Cardiovasc Drugs Ther 1999;13:191-200. 26. van der Horst IC, Zijlstra F, van't Hof AW et al. Glucose-insulin-potassium infusion in patients treated with primary angioplasty for acute myocardial infarction: the glucose-insulinpotassium study: a randomized trial. J Am Coll Cardiol 2003;42:784-91. 196 Rationale and design of GIPS-2 27. Apstein CS. The benefits of glucose-insulin-potassium for acute myocardial infarction (and 28. Eberli FR, Weinberg EO, Grice WN, Horowitz GL, Apstein CS. Protective effect of increased some concerns). J Am Coll Cardiol 2003;42:792-95. glycolytic substrate against systolic and diastolic dysfunction and increased coronary resistance from prolonged global underperfusion and reperfusion in isolated rabbit hearts perfused with erythrocyte suspensions. Circ Res 1991;68:466-81. 29. 't Hof AW, Liem A, de Boer MJ, Zijlstra F. Clinical value of 12-lead electrocardiogram after successful reperfusion therapy for acute myocardial infarction. Zwolle Myocardial infarction Study Group. Lancet 1997;350:615-19. 30. Henriques JP, Zijlstra F, van 't Hof AW et al. Angiographic assessment of reperfusion in acute 31. van 't Hof AW, Liem A, Suryapranata H, Hoorntje JC, de Boer MJ, Zijlstra F. Angiographic myocardial infarction by myocardial blush grade. Circulation 2003;107:2115-19. assessment of myocardial reperfusion in patients treated with primary angioplasty for acute myocardial infarction: myocardial blush grade. Zwolle Myocardial Infarction Study Group. Circulation 1998;97:2302-6. 32. Snapinn SM. Monitoring clinical trials with a conditional probability stopping rule. Stat Med 1992;11:659-72. 33. Ryan TJ, Antman EM, Brooks NH et al. 1999 update: ACC/AHA Guidelines for the Management of Patients With Acute Myocardial Infarction: Executive Summary and Recommendations: A report of the American College of Cardiology/American Heart Association Task Force on Practice Guidelines (Committee on Management of Acute Myocardial Infarction). Circulation 1999;100:1016-30. 34. Van de Werf F, Ardissino D, Betriu A et al. Management of acute myocardial infarction in patients presenting with ST-segment elevation. The Task Force on the Management of Acute Myocardial Infarction of the European Society of Cardiology. Eur Heart J 2003;24:28-66. 35. Sack MN, Yellon DM. Insulin therapy as an adjunct to reperfusion after acute coronary ischemia: a proposed direct myocardial cell survival effect independent of metabolic modulation. J Am Coll Cardiol 2003;41:1404-7. 36. Yellon DM, Baxter GF. Protecting the ischaemic and reperfused myocardium in acute 37. Bolk J, van der Ploeg T, Cornel JH, Arnold AE, Sepers J, Umans VA. Impaired glucose myocardial infarction: distant dream or near reality? Heart 2000;83:381-87. metabolism predicts mortality after a myocardial infarction. Int J Cardiol 2001;79:207-14. 38. Capes SE, Hunt D, Malmberg K, Gerstein HC. Stress hyperglycaemia and increased risk of death after myocardial infarction in patients with and without diabetes: a systematic overview. Lancet 2000;355:773-78. 39. van den Berghe G, Wouters P, Weekers F et al. Intensive insulin therapy in the critically ill 40. Furnary AP, Gao G, Grunkemeier GL et al. Continuous insulin infusion reduces mortality in patients. N Engl J Med 2001;345:1359-67. patients with diabetes undergoing coronary artery bypass grafting. J Thorac Cardiovasc Surg 2003;125:1007-21. 41. Lazar HL, Chipkin SR, Fitzgerald CA, Bao Y, Cabral H, Apstein CS. Tight Glycemic Control in Diabetic Coronary Artery Bypass Graft Patients Improves Perioperative Outcomes and Decreases Recurrent Ischemic Events. Circulation 2004; 109:1497-502. 197 Metabolic interventions in acute myocardial infarction 198 Summary and future perspectives Chapter 7 Summary and future perspectives 199 Metabolic interventions in acute myocardial infarction This thesis primarily describes the results of high-dose glucose-insulin-potassium (GIK) infusion in ST segment elevation MI patients treated with primary percutaneous coronary intervention (PCI).1 In the introduction (Chapter 1) it has already been stated that the experimental and clinical evidence accumulated over the better part of a century underscores the importance of glucose metabolism during ischemia/reperfusion of the heart. In 1912, Goulston suggested that treatment with glucose could be beneficial in several categories of heart disease.2 Sodi-Pallares and colleagues were the first to report the use of GIK in patients with acute myocardial infarction and found that it limited electrocardiographic changes.3 After the promising results of nine early randomized trials with 1932 patients and publication of the first results in patients treated with both reperfusion therapy and GIK the Glucose-Insulin-Potassium Study (GIPS-1) was set up.4;5 GIPS-1 included 940 patients randomized to primary PCI with or without GIK (glucose 20% with 80 mmol potassium in 500 ml sodiumchloride 0.9% at a rate of 3 ml/kg/ per hour and 50 IU insulin in 50 ml water administered according to serum glucose concentrations). Baseline insulin-infusion dose and adjustments of the insulin dose, to obtain bloodglucose levels between 7.0 and 11.0 mmol/L, were based on a modified algorithm. In Chapter 2.1 we describe the results of GIPS-1 on 30-day mortality and major adverse cardiac events (MACE).6 We observed that the mortality rate was lower in the GIK group (4.8%) compared to the control group (5.8%), albeit not statistically significant. After adjustment for differences at baseline, the relative risk of mortality with GIK became 0.61 (0.34–1.10, P=0.09). In the large predefined subgroup of 856 patients without signs of heart failure (Killip class 1), a significant reduction of mortality was seen (1.2% in the GIK compared to 4.2% in the control group, P=0.01). In 84 patients (8.9%) with signs of heart failure (Killip class ≥2), the effect of GIK is uncertain since a (non-significant) higher mortality rate was observed. In Chapters 2.2 and 2.3, we analyzed the effects of GIK on myocardial function and determined enzymatic infarct size and left ventricular function. There was no difference in the time course or magnitude of creatine kinase MB (CK-MB) release between the two groups: peak CK-MB level was 249±228 IU/L in the GIK group versus 240±200 IU/L in the control group (NS). The mean left ventricular ejection fraction (LVEF) was higher in the GIK group (43.7±1.0% versus 42.4±11.7%, P=0.12). Poor left ventricular function (LVEF ≤30%) was observed in 18% in the controls and in 12% in the GIK group (P=0.01). We observed a relation between enzyme release and left ventricular function; the mean peak CK-MB was 463±318 IU/L in patients with LVEF ≤30% versus 215±166 IU/L in patients with LVEF >30% (P<0.001). We therefore hypothesized that the effect of GIK on left ventricular function is mediated by factors unrelated to enzymatic infarct size. Chapter 2.4 describes the effect of GIK on the resolution of ST segment elevation. The electrocardiograms at admission and after 3 hours were analyzed in 612 patients. 200 Summary and future perspectives Combined complete (>70%) and partial (30-70%) resolution was more commonly observed in the GIK group (87%) when compared to the control group (78%), relative risk 1.72 (95% confidence interval 1.2-2.46, P<0.001). One-year mortality was lower in patients with combined complete and partial resolution compared to patients without resolution (3.8% versus 10.3%, P=0.011). ST segment elevation resolution after reperfusion therapy reflects myocardial flow rather than epicardial flow and predicts clinical outcome better than epicardial vessel patency alone in patients treated with reperfusion therapy7-9 One of the effects of GIK in reperfused MI patients may be the restoration/preservation of myocardial perfusion. The goal of the infusion of GIK during acute MI is to modulate the (myocardial) metabolism in such a manner that it is related to the preservation of myocardial function and a favorable clinical outcome. In Chapter 2.5, we describe the effect of GIK infusion on glucose and potassium levels. Mean serum glucose was 9.3±4.5 mmol/L in the GIK group compared to 8.4±2.9 mmol/L in the control group (P<0.001). Hyperglycemia (glucose >11.0 mmol/L) occurred in 337 patients (70.8%) treated with GIK and in 157 controls (33.8%) (P<0.001). A total of 48 hyperglycemic patients (9.4%) died versus 21 patients (4.7%) without hyperglycemia (P=0.004). In patients with hyperglycemia, 1-year mortality was 8.3% in the GIK group versus 12.7% in controls (P=0.14). Hypoglycemia (glucose ≤3.0 mmol/L) occurred in 10 patients of whom 2 patients (20%) died, both treated with GIK. Hyperkalemia (potassium >5.5 mmol/L) was present in 26 GIK patients (5.5%) and in 15 controls (3.2%) (P=0.11); of these patients 9 (34.6%) died in the GIK group and 9 (60%) in the control group (P=0.19). Hypokalemia (potassium ≤3.5 mmol/L) occurred in 112 patients (23.5%) in the GIK group and in 191 patients in the control group (41.2%) (P<0.001). A total of 30 patients (9.9%) with hypokalemia died, 10 GIK patients (8.9%) and 20 controls (10.5%) (P=0.84). The beneficial effect of GIK on mortality may be diminished by these derangements. The 3-year results are represented in Chapter 2.6. All-cause mortality occurred in 98 (10.4%) out of 940 patients after 3 years. Factors related with long-term mortality were age, previous cardiovascular disease, anterior MI, Killip class ≥2, and multi-vessel disease (all P<0.001). In the GIK group, 46 (9.7%) out of 476 patients died compared to 52 (11.2%) out of 464 patients (P=0.44, using the Log-rank test). In patients with Killip class 1 (N=856) randomization to GIK had an independent relation with 3-year mortality, with an adjusted relative risk of 0.56 (0.34-0.94, P=0.028). Other factors related with long-term mortality in Killip class 1 patients were age (P<0.001), previous cardiovascular disease (P<0.001) and multi-vessel disease (P=0.046). Cardiac protection with GIK infusion and primary PCI in acute MI did not result in a significant reduction in mortality in all patients. During the 3year follow-up, the beneficial effect observed after 30-days in the predefined subgroup of Killip class 1 patients was sustained. 201 Metabolic interventions in acute myocardial infarction In Chapter 3 we describe the results of an overview off all studies on glucose-insulinpotassium solution. Of 13 published randomized trials, 12 studies reported mortality reduction after GIK. Most promising effects were observed when GIK was given in a high dose and when it was given as an adjunctive to reperfusion therapy. In the second part of this thesis we describe our observational studies regarding the relation between hyperglycemia and outcome without controlled interventions on glucose metabolism. In Chapter 4.1, we determined whether admission glucose predicted longterm outcome in MI patients without diabetes mellitus that were treated with streptokinase or primary PCI. We observed that elevated admission glucose levels in nondiabetic patients treated with reperfusion therapy for ST segment elevation MI are independently associated with larger infarct size and higher long-term mortality. In Chapter 4.2, we describe the results of an analysis of the effect of admission hyperglycemia on myocardial perfusion in MI patients. A total of 93 patients (20%) out of 464 patients had hyperglycemia (glucose ≥11.0 mmol/L). They had more often a reduced myocardial blush grade (26% versus 15%, P=0.02) and incomplete ST segment elevation resolution (59% versus 39%, P=0.01) compared to patients without hyperglycemia on admission. Also, in patients with hyperglycemia there was a greater reduction in left ventricular function and a higher mortality. This was observed in patients with and without diabetes mellitus. Hyperglycemia on admission is associated with reduced myocardial reperfusion after primary PCI, which was associated with adverse clinical outcome. In Chapter 4.3, we respond to a study that stated that hyperglycemia might be associated with impaired microvascular function after acute myocardial infarction (MI). The authors reached this conclusion by a retrospective analysis of 146 patients.10 The hypothesis that acute hyperglycemia (i.e., hyperglycemia at admission) is associated with the ‘no reflow’ phenomenon is intriguing. However, we hypothesize that ‘no reflow’ is related to acute hyperglycemia and chronic hyperglycemia (i.e., elevated HbA1c and/or DM). Therefore, new studies will have to determine the effect of hyperglycemia on ‘no reflow’ and preferentially on the effect of metabolic regulation. Although admission glucose is a predictor of unfavorable outcome in MI patients, the predictive value is not strong. We hypothesized that persistent hyperglycemia (an elevated time-averaged glucose during admission) in critically ill patients could be a better predictor. In Chapter 5.1, we describe the relation between an elevated glucose at admission and an elevated time-averaged glucose with short-term MACE in MI patients treated with primary PCI. We included 417 patients of which 89 patients (21.3%) had had at least one MACE. In 17 patients (4.1%) it had been a fatal event and in 72 patients (17.3%) a non-fatal event. MACE occurred more often in patients who were older, had previous cardiovascular disease, anterior infarction location, and multi-vessel disease. The area under the receiver operator characteristic curve was 0.64 for time-averaged glucose 202 Summary and future perspectives and 0.59 for admission glucose. Time-averaged glucose emerged as a significant independent predictor after multivariate analysis (P<0.01). We concluded that elevated time-averaged glucose in MI has a stronger relation with short-term MACE than elevated admission glucose. In Chapter 5.2, the relation between hyperglycemia during admission and outcome was analyzed in a retrospective study of critically ill patients admitted to a surgical Intensive Care Unit. An objective measure of hyperglycemia to assess glucose regulation was defined. The so-called, hyperglycemic index (HGI) denotes the area under the curve as ‘above the upper limit of normal’ (glucose level 6.0 mmol/L) divided by ‘the total length of stay’. In 1779 patients with a median ICU-stay of 10 days, 30-day mortality was 17%. Median HGI was 0.9 (0.3-2.1) in survivors compared to 1.7 (0.7-3.3) mmol/L in nonsurvivors (p<0.001). Area under the receiver operator characteristic curve was 0.64 for HGI, compared with 0.61 and 0.62 for mean morning glucose and mean glucose. HGI was the only significant glucose measure in binary logistic regression. We concluded that HGI quantifies the impact of hyperglycemia in critically ill patients better than other glucose indices. HGI may thus be a useful measure of glucose regulation. We also determined whether the relation between HGI and outcome was present in patients admitted to a medical Intensive Care Unit (Chapter 5.3). Finally, in Chapter 6, we describe the protocol of the GIPS-2 study. This chapter is already the implementation of future perspectives based on the results described in this thesis. GIPS-2 is an ongoing multi-center trial on the effect of GIK infusion in ST segment elevation MI patients without signs of heart-failure and eligible for reperfusion therapy. Future perspectives The definite role for metabolic modulation of the ischemic myocardium with GIK infusion has to be determined yet. Studies with GIK in acute MI were primarily based on the premises that infusion of glucose is beneficial for the ischemic myocardium.11;12 Decades ago the glucose hypothesis was proposed: enhanced uptake and metabolism of glucose delays cellular damage.13;14 Glucose utilization during ischemia prevents the breakdown of glycogen stores and leads to increased net intramyocardial glycogen synthesis, thereby limiting enzymatic infarct size and contracture.15-17 Recently, Opie stated that new concepts (table 1) have updated and outdated this hypothesis although the balance of glucose versus fatty acid oxidation remains crucial in ischemia.18;19 We agree, that the potential positive effects of insulin during stress situations are multifarious and open for investigation in different patient groups.37;38 Insulin is involved in the uptake of glucose by several tissues including the myocardium.39;40 It is also involved 203 Metabolic interventions in acute myocardial infarction in gene transcription, expression of various metabolic enzymes, and activation of various pathways with mitogenic activity.41 Insulin inhibits postischemic apoptosis, energetic failure and damage to cardiac tissue, possibly through reduced oxidative stress mediated by KATP channel activation.33;42-44 Insulin stimulates protein synthesis and inhibits intracellular protein breakdown in cardiac tissue.45-47 Insulin potentiates ischemic preconditioning.48;49 Insulin has an anti-inflammatory effect.50;51 Insulin improves the fibrinolytic profile during myocardial ischemia.51;52 Insulin/strict-glucose-control restores the abnormalities in the serum lipid profile.53;54 Finally, insulin has vasodilating capacities in the blood vessels of muscle tissue as well as in the myocardium.55;56 Table 1. Key new concepts on the role of insulin and glucose in myocardial ischemia [partly adapted from Opie LH, Jonassen A, Yellon DM. Cardiovasc J S Afr 2004;15:S1]18 • Reset of glycolysis-oxidation mismatch20 • Fatty acid oxidation↓, glucose↑21 • Low flow induces myocardial glucose uptake and is related to ATP↑22;23 • Insulin is related to increased myocardial flow24 • Insulin stimulates Akt/PKB25 • Inhibition of malonyl CoA decarboxylase: fatty acid oxidation↓, glucose↑26 • PPAR & nucleus↑27-29 • Fatty acid-induced genes30 • Prosurvival pathway stimulation31;32 • Activation of KATP channel related to reduced oxidative stress33 • Mitochondrial uncoupling proteins 2 and 3 regulatory role on myocardial metabolism34 • AMP-activated protein kinase mediates ischemic glucose uptake35;36 The results of a landmark study on intensive insulin therapy in critically ill patients in order to maintain blood glucose between 4.4 and 6.1 mmol/L and the results of the Diabetes Mellitus, Insulin Glucose Infusion in Acute Myocardial Infarction study emphasize the beneficial effect of insulin.57-60 Although, these studies focussed on the effects of more strict glucose regulation as an important factor in explaining the positive results, the results may also be interpreted in a different manner. In studies regarding acute MI there is a trend towards a significant beneficial effect of insulin or glucose-insulin-potassium infusion despite the fact that normoglycemia was not obtained.5;6;61 Therefore, insulin could be both a moderator for transmembrane glucose transport to obtain normoglycemia and a moderator of the effects that are mentioned above. It is to be expected that in future studies the role of insulin or GIK, with or without meticulous glucose regulation, will be established in the treatment of various conditions.37 The GIPS-2 204 Summary and future perspectives is designed to investigate the effect of GIK infusion in ST segment elevation MI patients without signs of heart-failure and eligible for reperfusion therapy. For patients with signs of heart failure on admission, a more tailored approach seems warranted, such as the admission of glucose 30% or an infusion of no more than 500 ml, or a period of infusion of 12 to 24 hours.62 A first step is to investigate the effect of GIK infusion on the hemodynamics after admission with acute MI. Already we performed a pilot-study on this subject in approximately 90 MI patients. The results of this study will be used to determine a tailored approach. Only three small prospective studies, including 12 to 30 patients, have been published on the possible beneficial effect of GIK infusion in stable patients with ischemic cardiac dysfunction.63-65 We designed a prospective study to address whether high-dose lowvolume infusion of GIK administered through a central line will lead to improved myocardial function without causing hemodynamic disturbances in stable patients suffering from severe ischemic myocardial dysfunction. To investigate the potential benefit of strict glucose regulation by insulin in patients admitted to Intensive or Coronary Care Units, a feasible algorithm and reliable glucose monitor are mandatory.66 To obtain strict regulation in critically ill patients, it is necessary to measure glucose levels frequently and then change the rate of insulin infusion accordingly. These frequent measurements also protect against adverse hypoglycemic episodes.67 The infusion of either insulin alone or GIK can be adjusted according to an algorithm.68 Table 2. Characteristics of algorithms with proved effective glucose regulation (the most effective form of administration is mentioned first) • Continuous versus intermittent infusion • Intravenous versus subcutaneous administration • Adjusting the rate of infusion to the last two blood-glucose values prevents hypoglycemic episodes and promotes stricter regulation • Starting with a bolus expedites reaching target values • Hourly adjustments lead to stricter regulation • Starting at lower values reduces the period of infusion • Combining insulin treatment with a supply of energy (i.e. parenteral or enteral feeding, glucose infusion) At the moment, an algorithm in which the infusion of insulin has been determined on the basis of the last two measured blood-glucose values seems to be the most effective to obtain strict glucose regulation. Other features of an algorithm which seem more 205 Metabolic interventions in acute myocardial infarction favorable are represented in table 2. After an algorithm is implemented, it has to be evaluated and adjusted until satisfying results are achieved. To prevent delay due to long turnaround times of glucose measurements at the laboratory, bedside glucometry, and an accepted method for estimating blood glucose concentrations among ambulatory and hospital ward patients would be useful. Because the accuracy of this system among the critically ill has not been properly evaluated, although it is used, we performed a prospective audit of bedside glucometry in our ICU setting.59;60 We installed point-of-care bloodgas/glucose analyzers – ABL 715 [Radiometer Medical, Copenhagen, Denmark] – in our Intensive and Coronary Care Units.59;60 In 27 male and 19 female Medical Intensive Care Unit patients, aged 32 years to 88 years, we performed a prospective audit in which the reference laboratory instrument [YSI, Yellow Springs Instruments, Ohio, USA] were compared with the bloodgas analyzer. Pearson’s correlation coefficient was calculated, which was fairly good: 0.95. A tested handheld device [Precision PCx, Abbott Laboratories, Illinois, USA] proofed also to be good with 100% of all paired measures within the set ranges. A continuous display of blood glucose levels in critically ill patients for optimal titration of insulin therapy could be a next step.69-72 The performance of the Continuous Glucose Monitoring System [Medtronic MiniMed, Northridge, USA] was recently found to be clinically acceptable.73 In a pilot-study of 20 patients, we also investigated the reliability and accuracy of the Continuous Glucose Monitoring System which was fairly good, with a Pearson’s correlation coefficient of 0.88. We found that glucometry with the bloodgas analyzer, and the continuous monitoring system provided a reasonable estimate of conventional (reference) laboratory glucose assessment. These systems could play an important role in future investigations in both the effect and potential beneficial mechanisms of metabolic modulation in critically ill patients. At the moment, clinical studies support the effectiveness of metabolic interventions in several groups of critically ill patients.5;6;57-61;74;75 We will have to wait for new clinical studies that will show that experimentally obtained results, such as the effect of insulin on immune function, inflammation, lipid profile, and apoptosis, can be effectively translated in every day practice. In conclusion to this thesis: substantial experimental evidence underscores the potential benefit of treatment with insulin, glucose and potassium for the heart exposed to ischemia and reperfusion. References 1. Rackley CE, Russell RO, Jr., Rogers WJ, Mantle JA, McDaniel HG, Papapietro SE. Clinical experience with glucose-insulin-potassium therapy in acute myocardial infarction. Am Heart J 1981;102:1038-49. 206 Summary and future perspectives 2. Goulston A. West Indian cane sugar in treatment of certain forms of heart diseases. British Medical Journal 1912;2:693-95. 3. Sodi-Pallares D, Testelli MR, Fishleder BL et al. Effects of an intravenous infusion of a potassium-glucose-insulin solution on the electrocardiographic signs of myocardial infarction. A preliminary clinical report. Am J Cardiol 1962;9:166-81. 4. Fath-Ordoubadi F, Beatt KJ. Glucose-insulin-potassium therapy for treatment of acute myocardial infarction: an overview of randomized placebo-controlled trials. Circulation 1997;96:1152-56. 5. Diaz R, Paolasso EA, Piegas LS et al. Metabolic modulation of acute myocardial infarction. The ECLA (Estudios Cardiologicos Latinoamerica) Collaborative Group. Circulation 1998;98:2227-34. 6. van der Horst IC, Zijlstra F, van't Hof AW et al. Glucose-insulin-potassium infusion in patients treated with primary angioplasty for acute myocardial infarction: the glucose-insulinpotassium study: a randomized trial. J Am Coll Cardiol 2003;42:784-91. 7. Barbash GI, Roth A, Hod H et al. Rapid resolution of ST elevation and prediction of clinical outcome in patients undergoing thrombolysis with alteplase (recombinant tissue-type plasminogen activator): results of the Israeli Study of Early Intervention in Myocardial Infarction. Br Heart J 1990;64:241-47. 8. Schroder R, Dissmann R, Bruggemann T et al. Extent of early ST segment elevation resolution: a simple but strong predictor of outcome in patients with acute myocardial infarction. J Am Coll Cardiol 1994;24:384-91. 9. van 't Hof AW, Liem A, de Boer MJ, Zijlstra F. Clinical value of 12-lead electrocardiogram after successful reperfusion therapy for acute myocardial infarction. Zwolle Myocardial infarction Study Group. Lancet 1997;350:615-19. 10. Iwakura K, Ito H, Ikushima M et al. Association between hyperglycemia and the no-reflow 11. Rackley CE, Russell RO, Jr., Rogers WJ, Mantle JA, McDaniel HG. Glucose-insulin-potassium phenomenon in patients with acute myocardial infarction. J Am Coll Cardiol 2003;41:1-7. infusion in acute myocardial infarction. Review of clinical experience. Postgrad Med 1979;65:93-99. 12. Henderson MJ, Morgan HE, Park CR. Regulation of glucose uptake in muscle. IV. The effect of hypophysectomy on glucose transport, phosphorylation, and insulin sensitivity in the isolated, perfused heart. J Biol Chem 1961;236:273-77. 13. Opie LH. Hypothesis: Glycolytic rates control cell viability in ischemia. J Appl Cardiol 14. Opie LH. The glucose hypothesis: its relation to acute myocardial ischemia. J Mol Cell Cardiol 15. Owen P, Dennis S, Opie LH. Glucose flux rate regulates onset of ischemic contracture in 16. Eberli FR, Weinberg EO, Grice WN, Horowitz GL, Apstein CS. Protective effect of increased 1988;3:407-14. 1970;1:107-15. globally underperfused rat hearts. Circ Res 1990;66:344-54. glycolytic substrate against systolic and diastolic dysfunction and increased coronary resistance from prolonged global underperfusion and reperfusion in isolated rabbit hearts perfused with erythrocyte suspensions. Circ Res 1991;68:466-81. 207 Metabolic interventions in acute myocardial infarction 17. Depre C, Vanoverschelde JL, Taegtmeyer H. Glucose for the heart. Circulation 1999;99:578- 18. Opie LH, Jonnesen A, Yellon DM. The glucose hypothesis: Updated or outdated? Role of 19. Van Rooyen J, McCarthy J, Opie LH. Increased glycolysis during ischaemia mediates the 88. insulin. Cardiovasc J S Afr 2004;15:S1. protective effect of glucose and insulin in the isolated rat heart despite the presence of cardiodepressant exogenous substrates. Cardiovasc J S Afr 2002;13:103-9. 20. Lopaschuk GD, Wambolt RB, Barr RL. An imbalance between glycolysis and glucose oxidation is a possible explanation for the detrimental effects of high levels of fatty acids during aerobic reperfusion of ischemic hearts. J Pharmacol Exp Ther 1993;264:135-44. 21. Stanley WC, Lopaschuk GD, Hall JL, McCormack JG. Regulation of myocardial carbohydrate metabolism under normal and ischaemic conditions. Potential for pharmacological interventions. Cardiovasc Res 1997;33:243-57. 22. Cave AC, Ingwall JS, Friedrich J et al. ATP synthesis during low-flow ischemia: influence of 23. Sondergaard HM, Bottcher M, Schmitz O, Nielsen TT, Botker HE. Insulin-stimulated increased glycolytic substrate. Circulation 2000;101:2090-2096. myocardial glucose uptake and the relation to perfusion and the nitric oxide system. J Vasc Res 2004;41:38-45. 24. Sundell J, Luotolahti M. Association between insulin resistance and reduced coronary 25. Jonassen AK, Sack MN, Mjos OD, Yellon DM. Myocardial protection by insulin at reperfusion vasoreactivity in healthy subjects. Can J Cardiol 2004;20:691-95. requires early administration and is mediated via Akt and p70s6 kinase cell-survival signaling. Circ Res 2001;89:1191-98. 26. Dyck JR, Cheng JF, Stanley WC et al. Malonyl coenzyme a decarboxylase inhibition protects the ischemic heart by inhibiting fatty acid oxidation and stimulating glucose oxidation. Circ Res 2004;94:e78-e84. 27. Young ME, Laws FA, Goodwin GW, Taegtmeyer H. Reactivation of peroxisome proliferatoractivated receptor alpha is associated with contractile dysfunction in hypertrophied rat heart. J Biol Chem 2001;276:44390-44395. 28. Young ME, Guthrie PH, Razeghi P et al. Impaired long-chain fatty acid oxidation and 29. Young LH. Insulin resistance and the effects of thiazolidinediones on cardiac metabolism. Am 30. Razeghi P, Young ME, Alcorn JL, Moravec CS, Frazier OH, Taegtmeyer H. Metabolic gene contractile dysfunction in the obese Zucker rat heart. Diabetes 2002;51:2587-95. J Med 2003;115 Suppl 8A:75S-80S. expression in fetal and failing human heart. Circulation 2001;104:2923-31. 31. Hausenloy DJ, Duchen MR, Yellon DM. Inhibiting mitochondrial permeability transition pore opening at reperfusion protects against ischaemia-reperfusion injury. Cardiovasc Res 2003;60:617-25. 32. Zhang HF, Fan Q, Qian XX et al. Role of insulin in the anti-apoptotic effect of glucose-insulinpotassium in rabbits with acute myocardial ischemia and reperfusion. Apoptosis 2004;9:77783. 208 Summary and future perspectives 33. LaDisa JF, Jr., Krolikowski JG, Pagel PS, Warltier DC, Kersten JR. Cardioprotection by glucose-insulin-potassium: dependence on KATP channel opening and blood glucose concentration before ischemia. Am J Physiol Heart Circ Physiol 2004;287:H601-H607. 34. Essop MF, Razeghi P, McLeod C, Young ME, Taegtmeyer H, Sack MN. Hypoxia-induced decrease of UCP3 gene expression in rat heart parallels metabolic gene switching but fails to affect mitochondrial respiratory coupling. Biochem Biophys Res Commun 2004;314:561-64. 35. Russell RR, III, Li J, Coven DL et al. AMP-activated protein kinase mediates ischemic glucose uptake and prevents postischemic cardiac dysfunction, apoptosis, and injury. J Clin Invest 2004;114:495-503. 36. Altarejos JY, Taniguchi M, Clanachan AS, Lopaschuk GD. Myocardial ischemia differentially 37. Das UN. Insulin: an endogenous cardioprotector. Curr Opin Crit Care 2003;9:375-83. 38. Groeneveld AB, Beishuizen A, Visser FC. Insulin: a wonder drug in the critically ill? Crit Care regulates LKB1 and an alternate 5'AMP-activated protein kinase kinase. J Biol Chem 2004. 2002;6:102-5. 39. McNulty PH, Jacob R, Deckelbaum LI, Young LH. Effect of hyperinsulinemia on myocardial 40. Ferrannini E, Santoro D, Bonadonna R, Natali A, Parodi O, Camici PG. Metabolic and 41. Sun XJ, Wang LM, Zhang Y et al. Role of IRS-2 in insulin and cytokine signalling. Nature 42. Aikawa R, Nawano M, Gu Y et al. Insulin prevents cardiomyocytes from oxidative stress- 43. Jonassen AK, Brar BK, Mjos OD, Sack MN, Latchman DS, Yellon DM. Insulin administered at amino acid uptake in patients with coronary artery disease. Metabolism 2000;49:1365-69. hemodynamic effects of insulin on human hearts. Am J Physiol 1993;264:E308-E315. 1995;377:173-77. induced apoptosis through activation of PI3 kinase/Akt. Circulation 2000;102:2873-79. reoxygenation exerts a cardioprotective effect in myocytes by a possible anti-apoptotic mechanism. J Mol Cell Cardiol 2000;32:757-64. 44. Kim B, Feldman EL. Insulin-like growth factor I prevents mannitol-induced degradation of 45. Madibally SV, Solomon V, Mitchell RN, Van De WL, Yarmush ML, Toner M. Influence of 46. Solomon V, Madihally S, Mitchell RN, Yarmush M, Toner M. Antiproteolytic action of insulin 47. Young LH, Dahl DM, Rauner D, Barrett EJ. Physiological hyperinsulinemia inhibits myocardial 48. Kersten JR, Schmeling TJ, Orth KG, Pagel PS, Warltier DC. Acute hyperglycemia abolishes focal adhesion kinase and Akt. J Biol Chem 2002;277:27393-400. insulin therapy on burn wound healing in rats. J Surg Res 2003;109:92-100. in burn-injured rats. J Surg Res 2002;105:234-42. protein degradation in vivo in the canine heart. Circ Res 1992;71:393-400. ischemic preconditioning in vivo. Am J Physiol 1998;275:H721-H725. 49. Kersten JR, Montgomery MW, Ghassemi T et al. Diabetes and hyperglycemia impair activation of mitochondrial K(ATP) channels. Am J Physiol Heart Circ Physiol 2001;280:H1744-H1750. 50. Dandona P, Aljada A, Mohanty P et al. Insulin inhibits intranuclear nuclear factor kappaB and stimulates IkappaB in mononuclear cells in obese subjects: evidence for an anti-inflammatory effect? J Clin Endocrinol Metab 2001;86:3257-65. 51. Chaudhuri A, Janicke D, Wilson MF et al. Anti-inflammatory and profibrinolytic effect of insulin in acute ST segment-elevation myocardial infarction. Circulation 2004;109:849-54. 209 Metabolic interventions in acute myocardial infarction 52. Melidonis A, Stefanidis A, Tournis S et al. The role of strict metabolic control by insulin infusion on fibrinolytic profile during an acute coronary event in diabetic patients. Clin Cardiol 2000;23:160-164. 53. Mesotten D, Swinnen JV, Vanderhoydonc F, Wouters PJ, Van den BG. Contribution of circulating lipids to the improved outcome of critical illness by glycemic control with intensive insulin therapy. J Clin Endocrinol Metab 2004;89:219-26. 54. Dai T, Abou-Rjaily GA, Al Share' QY et al. Interaction between altered insulin and lipid 55. Legtenberg RJ, Houston RJ, Oeseburg B, Smits P. Physiological insulin concentrations metabolism in CEACAM1-inactive transgenic mice. J Biol Chem 2004;279:45155-61. protect against ischemia-induced loss of cardiac function in rats. Comp Biochem Physiol A Mol Integr Physiol 2002;132:161-67. 56. McNulty PH, Pfau S, Deckelbaum LI. Effect of plasma insulin level on myocardial blood flow 57. Malmberg K, Ryden L, Efendic S et al. Randomized trial of insulin-glucose infusion followed and its mechanism of action. Am J Cardiol 2000;85:161-65. by subcutaneous insulin treatment in diabetic patients with acute myocardial infarction (DIGAMI study): effects on mortality at 1 year. J Am Coll Cardiol 1995;26:57-65. 58. Malmberg K, Ryden L, Hamsten A, Herlitz J, Waldenstrom A, Wedel H. Effects of insulin treatment on cause-specific one-year mortality and morbidity in diabetic patients with acute myocardial infarction. DIGAMI Study Group. Diabetes Insulin-Glucose in Acute Myocardial Infarction. Eur Heart J 1996;17:1337-44. 59. van den Berghe G, Wouters P, Weekers F et al. Intensive insulin therapy in the critically ill 60. van den Berghe G, Wouters PJ, Bouillon R et al. Outcome benefit of intensive insulin therapy 61. Pache J, Kastrati A, Mehilli J et al. A randomized evaluation of the effects of glucose-insulin- patients. N Engl J Med 2001;345:1359-67. in the critically ill: Insulin dose versus glycemic control. Crit Care Med 2003;31:359-66. potassium infusion on myocardial salvage in patients with acute myocardial infarction treated with reperfusion therapy. Am Heart J 2004;148:105. 62. Heng MK, Norris RM, Singh BN, Barratt-Boyes C. Effects of glucose and glucose-insulinpotassium on haemodynamics and enzyme release after acute myocardial infarction. Br Heart J 1977;39:748-57. 63. Alan S, Ulgen MS, Dedeoglu I, Kaya H, Toprak N. Long-term glucose insulin potassium infusion improves systolic and diastolic function in patients with chronic ischemic cardiomyopathy. Swiss Med Wkly 2003;133:419-22. 64. Cottin Y, Lhuillier I, Gilson L et al. Glucose insulin potassium infusion improves systolic function in patients with chronic ischemic cardiomyopathy. Eur J Heart Fail 2002;4:181-84. 65. Khoury VK, Haluska B, Prins J, Marwick TH. Effects of glucose-insulin-potassium infusion on 66. Brown G, Dodek P. Intravenous insulin nomogram improves blood glucose control in the chronic ischaemic left ventricular dysfunction. Heart 2003;89:61-65. critically ill. Crit Care Med 2001;29:1714-19. 67. Libby P, Maroko PR, Braunwald E. The effect of hypoglycemia on myocardial ischemic injury 68. Goldberg PA, Siegel MD, Sherwin RS et al. Implementation of a Safe and Effective Insulin during acute experimental coronary artery occlusion. Circulation 1975;51:621-26. Infusion Protocol in a Medical Intensive Care Unit. Diabetes Care 2004;27:461-67. 210 Summary and future perspectives 69. Chee F, Fernando T, van Heerden PV. Closed-loop control of blood glucose levels in critically 70. Chee F, Fernando T, van Heerden PV. Closed-loop glucose control in critically ill patients ill patients. Anaesth Intensive Care 2002;30:295-307. using continuous glucose monitoring system (CGMS) in real time. IEEE Trans Inf Technol Biomed 2003;7:43-53. 71. Jungheim K, Wientjes KJ, Heinemann L, Lodwig V, Koschinsky T, Schoonen AJ. Subcutaneous continuous glucose monitoring: feasibility of a new microdialysis-based glucose sensor system. Diabetes Care 2001;24:1696-97. 72. Kapitza C, Lodwig V, Obermaier K et al. Continuous glucose monitoring: reliable measurements for up to 4 days with the SCGM1 system. Diabetes Technol Ther 2003;5:60914. 73. Goldberg PA, Siegel MD, Russell RR et al. Experience with the continuous glucose monitoring 74. Furnary AP, Gao G, Grunkemeier GL et al. Continuous insulin infusion reduces mortality in system in a medical intensive care unit. Diabetes Technol Ther 2004;6:339-47. patients with diabetes undergoing coronary artery bypass grafting. J Thorac Cardiovasc Surg 2003;125:1007-21. 75. Lazar HL, Chipkin SR, Fitzgerald CA, Bao Y, Cabral H, Apstein CS. Tight glycemic control in diabetic coronary artery bypass graft patients improves perioperative outcomes and decreases recurrent ischemic events. Circulation 2004;109:1497-502. 211 Metabolic interventions in acute myocardial infarction 212 Dutch summary Chapter 8 Dutch summary 213 Metabolic interventions in acute myocardial infarction Dit proefschrift beschrijft bovenal de resultaten van onderzoek naar de effecten van het glucose-insuline-kalium (GIK) infuus bij patiënten met een acuut myocardinfarct (MI) die behandeld zijn met een primaire percutane coronair interventie (PCI).1 In het tweede deel van dit proefschrift wordt nader ingegaan op het voorkomen van hyperglykemie en de morbiditeit en mortaliteit bij patiënten waarbij strikte glucose regulatie niet is nagestreefd. Reeds in 1912 suggereerde Goulston dat glucose gunstig kon zijn bij verschillende soorten hartziekten.2 Het beoogde effect van GIK infusie tijdens ischemie en reperfusie van het myocard is dat de opname en verbranding van glucose wordt bevorderd en de opname en verbranding van vrije vetzuren wordt beperkt (de glucose hypothese van Opie).3 Hierdoor zou het metabolisme zo te beïnvloeden zijn dat de functie van het myocard wordt behouden en ritmestoornissen worden voorkomen, hetgeen tot een betere prognose leidt. Bij verbranding van vrije vetzuren komen immers schadelijke produkten vrij en meer zuurstof is nodig om een zelfde hoeveelheid energie te verkrijgen dan bij de verbranding van glucose. Sodi-Pallares en zijn collega’s waren de eerste die rapporteerden over het gebruik van een GIK infuus bij patiënten met een MI. De auteurs concludeerden dat GIK ritme- en geleidingsstoornissen gedurende ischemie van het myocard beperkte.4 Na het verschijnen van een overzicht van 9 onderzoeken met 1932 MI patiënten naar het effect van GIK op overleving, werd in een begeleidend redactioneel schrijven geschreven dat de tijd gekomen was voor een grote studie.5 Een eerste pilot-onderzoek (Estudios Cardiologicos Latinoamerica) met 407 patiënten dat daarop volgde, concludeerde dat met name patiënten, die behandeld werden met zowel een GIK infuus als thrombolyse, van het GIK infuus bleken te profiteren.6 Dit betrof echter een beperkt aantal patiënten en de sterfte in de groep patiënten die met thrombolyse en niet met GIK behandeld werden, was hoog (15.2%). Het vormde echter wel de basis voor het opzetten van de Glucose-Insulin-Potasssium Study (GIPS-1).7 In de GIPS-1 zijn 940 patiënten met een acuut MI geïncludeerd en gerandomiseerd naar een behandeling van het afgesloten vat door middel van een primaire PCI met GIK (N=476) of zonder GIK (N=464). Het GIK infuus bestond uit glucose 20% met 80 mmol kalium in 500 ml natriumchloride 0.9% dat met een snelheid van 3 ml/kg/per uur werd toegediend. Daarnaast werd afhankelijk van de serum glucose concentratie insuline (50 IU insuline in 50 ml water) gegeven. Het doel van de infusie van insuline was om de serum glucose concentratie tussen de 7.0 mmol/L en de 11.0 mmol/L te krijgen en vervolgens te houden. In vergelijking met de reeds uitgevoerde studies werd in de GIPS-1 reperfusie nagestreefd middels PCI (en niet middels thrombolyse) en werd een hoge dosis GIK infuus gebruikt. Een hoge dosis GIK infuus is een dosis die qua samenstelling gelijk of hoger ligt met een dosis waarvan is aangetoond dat het de opname en verbranding van vrije vetzuren onderdrukt (glucose hypothese).8 214 Dutch summary In hoofdstuk 2.1 wordt het resultaat op de mortaliteit en cardiale complicaties na 30 dagen beschreven. De mortaliteit in de GIK groep was lager (4.8%) vergeleken met de controle groep (5.8%). Het relatieve risico op overlijden in de GIK groep was 0.61. Het gevonden verschil was echter niet statistisch significant. Analyse van vooraf vastgestelde subgroepen liet zien dat patiënten (N=856) zonder tekenen van hartfalen bij binnenkomst (Killip klasse 1), een statistisch significante reductie van de mortaliteit (1.2% in de GIK groep versus 4.2% in de controle groep, P=0.01) hadden. Bij patiënten die bij binnenkomst wel tekenen van hartfalen vertonen (Killip klasse ≥2) (N=84), werd echter een hogere mortaliteit gezien. Deze laatste groep is echter te klein om duidelijke conclusies uit te trekken. Wel lijkt voor deze groep het in toekomstig onderzoek van belang de samenstelling van GIK aan te passen. In Hoofdstukken 2.2 en 2.3, wordt het effect van het GIK infuus op de functie van het myocard, de enzymatische infarctgrootte en de linker ventrikel functie, beschreven. Geen verschil werd gevonden in het beloop of de hoogte van het creatine kinase MB (CK-MB) (als maat voor enzymatische infarctgrootte) tussen beide groepen. Het behoud van de linker ventrikel ejectiefractie (LVEF) bleek wel beter te zijn in de GIK groep vergeleken met de controle groep. In de GIK groep had 12% van de patiënten een slechte LVEF (LVEF ≤30%), in de controle groep had 18% een slechte LVEF (P=0.01). Aangezien er een verband is aangetoond tussen de hoogte van het CK-MB en de LVEF wordt gesuggereerd dat het effect van GIK mogelijk bewerkstelligd wordt door factoren die niet samenhangen met de enzymatische infarct grootte. Hoofdstuk 2.4 beschrijft het effect van het GIK infuus op de ST segment elevatie resolutie (afname). ST segment elevatie resolutie blijkt een goede weerspiegeling van de perfusie van het myocard te zijn en tevens een prognostische factor.9-11 Bij 612 patiënten opgenomen in GIPS-1 werd het ECG bij binnenkomst en het ECG 3 uur na binnenkomst geanalyseerd. Een complete (>70%) of partiële (30-70%) resolutie werd vaker bereikt in de GIK groep (87%) vergeleken met de controle groep (78%) (P<0.001). Omdat ST segment elevatie resolutie na reperfusie therapie een afspiegeling van bloeddoorstroming in het myocard is wordt gesuggereerd dat het effect van GIK mogelijk voor een deel kan samenhangen met een toename van de myocardiale perfusie. In Hoofdstuk 2.5, wordt het effect van het GIK infuus op de serum concentraties van glucose en kalium beschreven. De gemiddelde glucose waarde bij patiënten behandeld met GIK lag hoger (9.3 mmol/L) vergeleken met de controle groep (8.4 mmol/L) (P<0.001). Hyperglykemie gedefinieerd als een glucose waarde van >11.0 mmol/L werd bij 70.8% van de patiënten in de GIK groep geobserveerd vergeleken met 33.8% van de patiënten in de controle groep (P<0.001). De mortaliteit van de patiënten met een hyperglykemie lag hoger vergeleken met de patiënten zonder hyperglykemie, respectievelijk 9.4% en 4.7% (P=0.004). Hypoglykemie (glucose ≤3.0 mmol/L) werd 10 maal geobserveerd, 2 patiënten overleden, beiden werden behandeld met het GIK infuus. Hyperkaliëmie (kalium >5.5 215 Metabolic interventions in acute myocardial infarction mmol/L) kwam bij 5.5% van de GIK patiënten en 3.2% van de controle patiënten voor (p=0.11). Hypokaliëmie (kalium ≤3.5 mmol/L) werd vaker gevonden bij controle patiënten (23.5% versus 41.2%, P<0.001). Hyperglykemie blijkt iets vaker voor te komen bij patiënten die worden behandeld met het GIK infuus, hypokaliëmie minder vaak. Het is heel goed mogelijk dat de voordelige effecten van het GIK infuus, besproken in de eerdere hoofdstukken verminderd worden door het optreden van bovengenoemde metabole effecten. De 3-jaars resultaten van de GIPS-1 worden gerapporteerd in Hoofdstuk 2.6. De mortaliteit na 3 jaar in de totale groep bedroeg 10.4% (98 van de 940 patiënten). Factoren samenhangend met mortaliteit waren leeftijd, cardiovasculaire aandoeningen in de voorgeschiedenis, een voorwand MI, Killip klasse ≥2, en meervatslijden. Na 3 jaar waren in de GIK groep, 46 van de 476 patiënten (9.7%) overleden, vergeleken met 52 van de 464 patiënten (11.2%) in de controle groep (NS). In de subgroep van patiënten die bij binnenkomst geen tekenen van hartfalen hadden (Killip klasse 1, N=856) bleek het GIK infuus een onafhankelijke voorspeller te zijn voor de 3-jaars overleving, met een relatief risico op overlijden van 0.56 (P=0.028). Het beschermende effect van het GIK infuus resulteerde niet in een significante reductie van mortaliteit na 3 jaar bij alle patiënten. Echter het positieve effect in de subgroep van patiënten met een Killip klasse 1 bleek ook na 3 jaar nog aanwezig te zijn. In Hoofdstuk 3 wordt een overzicht gegeven van alle studies naar het effect van glucoseinsuline(-kalium) infusie bij patiënten met een acuut MI. Van de 13 gepubliceerde onderzoeken laten 12 onderzoeken een gunstig effect zien op mortaliteit gedurende de eerste 30 dagen na opname. De meest gunstige resulaten zijn verkregen in onderzoeken waarin een hoge dosis GIK gebruikt werd en waarin GIK gecombineerd werd met een vorm van reperfusie. Omdat de onderzoeken verschillen in opzet is een definitieve conclusie omtrent het toevoegen van GIK aan de behandeling nog niet te trekken. In het tweede deel van dit proefschrift worden de resultaten van observationele studies beschreven, met betrekking op het vóórkomen van hyperglykemie en de morbiditeit en mortaliteit bij patiënten waarbij niet gestreeft is naar strikte glucose regulatie. Hoofdstuk 4.1, beschrijft de invloed van het glucose bij binnenkomst en de morbiditeit en mortaliteit bij patiënten met een MI die niet bekend met diabetes mellitus (DM). De onderzochte patiënten werden behandeld met streptokinase (thrombolyse) of primaire PCI. Een verhoogde glucose waarde bij binnenkomst blijkt onafhankelijk geassocieerd te zijn met een grotere infarctgrootte en een hogere mortaliteit. Hoofdstuk 4.2, beschrijft het effect van de glucose bij binnenkomst op de myocardiale perfusie bij patiënten met een MI behandeld met primaire PCI. Van 464 patiënten hadden 93 patiënten (20%) hyperglykemie (glucose ≥11.0 mmol/L). Vergeleken met patiënten die geen hyperglykemie bij binnenkomst hadden, bleken zij vaker een verminderde 216 Dutch summary myocardiale blush (maat voor perfusie van het myocard) te hebben (26% versus 15%, P=0.02) en vaker een incomplete ST segment elevatie resolutie te hebben (59% versus 39%, P=0.01). Bovendien was de mortaliteit in de groep van patiënten met een hyperglykemie bij binnenkomst hoger en was de reductie van de LVEF in deze groep groter. Dit effect werd zowel geobserveerd bij patiënten die wel en niet bekend met DM waren. Concluderend is hyperglykemie bij binnenkomst geassocieerd met een verminderde myocardiale reperfusie en geassocieerd met een slechtere beloop. Hoofdstuk 4.3, is een reactie op een publicatie waarin geconcludeerd wordt dat hyperglykemie mogelijk samenhangt met een gestoorde microvasculaire functie na een acuut MI. De auteurs concludeerden dit naar aanleiding van een retrospectieve analyse bij 146 patiënten.12 Hun hypothese dat acute hyperglykemie (hyperglykemie bij binnenkomst) geassocieerd is met het ‘no reflow’ fenomeen is intrigerend. Echter, het is heel goed mogelijk dat ‘no reflow’ niet alleen gerelateerd is aan acute hyperglykemie maar ook aan chronische hyperglykemie (een verhoogd HbA1c en/of DM). Nieuwe studies zullen het effect van hyperglykemie (acuut en chronisch) op het ‘no reflow’ fenomeen moeten vaststellen. Ondanks dat hyperglykemie bij binnenkomst een voorspeller is voor een minder gunstig beloop bij patiënten met een MI is de voorspellende waarde niet erg sterk. Persisterende hyperglykemie (een verhoogde glucose waarde gedurende de opname gedeeld door de factor tijd) is mogelijk een betere voorspeller. In Hoofdstuk 5.1, wordt de relatie beschreven tussen hyperglykemie bij binnenkomst, persisterende hyperglykemie en cardiale complicaties (fataal/niet fataal) op korte termijn bij patiënten met een MI behandeld met primaire PCI. Er werden 417 patiënten geïncludeerd, hiervan hadden 89 patiënten (21.3%) een cardiale complicatie, waarvan 17 maal (4.1%) fataal. Voorspellers voor deze complicaties waren een oudere leeftijd, een cardiovasculaire aandoening in de voorgeschiedenis, een voorwandinfarct en meervatslijden. In een multivariate analyse is persisterende hyperglykemie maar niet hyperglykemie bij binnenkomst een onafhankelijke voorspeller voor deze complicaties. Persisterende hyperglykemie blijkt dus een betere voorspeller te zijn voor het optreden van cardiale complicatie vergeleken met hyperglykemie bij binnenkomst. In Hoofdstuk 5.2, wordt het begrip hyperglycemic index (HGI) geïntroduceerd. HGI is een objectieve maat voor persisterende hyperglykemie. Het beschrijft de area under the curve (AUC) boven een glucose van 6.0 mmol/L gedurende de gehele opname (mmol/L). In een retrospectieve studie op de chirurgisch Intensive Care werd bij 1779 patiënten de HGI als glucoseparameter bepaald, met als uitkomstmaat mortaliteit na 30 dagen. Deze mortaliteit na 30 dagen was 17%. De mediane HGI was 0.9 mmol/L (0.3-2.1) bij patiënten die overleefden versus 1.7 (0.7-3.3) mmol/L bij patiënten die overleden (P<0.001). De area onder de receiver operator characteristic (ROC) curve was 0.64 voor HGI, vergeleken met 0.61 and 0.62 voor andere glucoseparameters (gemiddelde ochtend glucose waarde en 217 Metabolic interventions in acute myocardial infarction de gemiddeld glucose tijdens de opname respectievelijk). HGI was de enige glucose parameter die een onafhankelijke voorspeller was voor de mortaliteit. Concluderend is HGI als maat voor persisterende hyperglykemie een betere voorspeller dan andere glucoseparameters. Naast de retrospectieve studie op de chirurgische Intensive Care, werd dit nogmaals bevestigd bij patiënten die werden opgenomen op de algemene Intensive Care (Hoofdstuk 5.3). Hoofdstuk 6 beschrijft het protocol van de GIPS-2. GIPS-2 is een multi-center onderzoek naar het effect van het GIK infuus bij ST segment elevatie MI patiënten, die in aanmerking komen voor reperfusie therapie echter zonder tekenen van hartfalen bij binnenkomst. In deze GIPS-2 zijn de resultaten en de bevindingen van dit proefschrift geïmplementeerd. Zo wordt gestreefd naar het voorkomen van hyperglykemie (streefwaarde serum glucose concentratie tussen de 6.0 mmol/L en 10.0 mmol/L). In Hoofdstuk 7 wordt ten slotte beschreven dat toekomstig onderzoek de rol van scherpere glucoseregulatie tijdens myocardiale ischemie zou dienen uit te zoeken. Ten tijde van de GIPS-1 werd in een gerandomiseerd onderzoek op een chirurgische Intensive Care een (onverwacht) grote afname van complicaties en mortaliteit waargenomen door patiënten zeer scherp te reguleren.13 Het doel van de infusie van insuline was om de serum glucose concentratie tussen de 4.4 mmol/L en de 6.1 mmol/L te krijgen en vervolgens te houden. Na het verschijnen van deze resultaten zijn velen er toe overgegaan om bij ernstig zieke patiënten scherpere glucoseregulatie na te streven dan in de GIPS-1 en 2. In de dagelijkse praktijk blijkt het niet eenvoudig om tot scherpere regulatie te komen. Bovendien zijn na het bovenbeschreven onderzoek meer resultaten beschikbaar gekomen waardoor het niet geheel duidelijk is welke mate van regulatie optimaal is. Van belang lijkt dat glucoseregulatie een vast onderdeel van de behandeling van ernstig zieke patiënten vormt. Met het beschikbare nieuwe bewijs uit zowel experimenteel en klinisch onderzoek lijkt niet het toedienen van glucose maar het toedienen van insuline met name van belang.14-18 Recent schreef Opie dat de glucose hypothese misschien aangepast zou moeten worden in een insuline hypothese.19 Daar het toedienen van insuline het risico heeft van het optreden van een hypoglykemie en/of een hypokaliemie is het waarschijnlijk dat een combinatie van glucose, insuline en kalium gegeven zal moeten blijven worden. Onderzoeken zullen moeten aantonen of voor het beïnvloeden van het glucosemetabolisme tijdens myocardiale ischemie het noodzakelijk is om GIK toe te dienen in een tot nu toe gebruikelijke samenstelling. Op basis van de huidige resultaten zoals beschreven in dit proefschrift lijkt een rol voor GIK in de behandeling van patiënten met een acuut MI van belang. 218 Dutch summary Referenties 1. Rackley CE, Russell RO, Jr., Rogers WJ, Mantle JA, McDaniel HG, Papapietro SE. Clinical experience with glucose-insulin-potassium therapy in acute myocardial infarction. Am Heart J 1981;102:1038-49. 2. Goulston A. West Indian cane sugar in treatment of certain forms of heart diseases. British Medical Journal 1912;2:693-95. 3. Opie LH. The glucose hypothesis: its relation to acute myocardial ischemia. J Mol Cell Cardiol 1970;1:107-15. 4. Sodi-Pallares D, Testelli MR, Fishleder BL et al. Effects of an intravenous infusion of a potassium-glucose-insulin solution on the electrocardiographic signs of myocardial infarction. A preliminary clinical report. Am J Cardiol 1962;9:166-81. 5. Fath-Ordoubadi F, Beatt KJ. Glucose-insulin-potassium therapy for treatment of acute myocardial infarction: an overview of randomized placebo-controlled trials. Circulation 1997;96:1152-56. 6. Diaz R, Paolasso EA, Piegas LS et al. Metabolic modulation of acute myocardial infarction. The ECLA (Estudios Cardiologicos Latinoamerica) Collaborative Group. Circulation 1998;98:2227-34. 7. van der Horst IC, Zijlstra F, van't Hof AW et al. Glucose-insulin-potassium infusion inpatients treated with primary angioplasty for acute myocardial infarction: the glucose-insulinpotassium study: a randomized trial. J Am Coll Cardiol 2003;42:784-91. 8. Rackley CE, Russell RO, Jr., Rogers WJ, Mantle JA, McDaniel HG. Glucose-insulin-potassium infusion in acute myocardial infarction. Review of clinical experience. Postgrad Med 1979;65:93-99. 9. Barbash GI, Roth A, Hod H et al. Rapid resolution of ST elevation and prediction of clinical outcome in patients undergoing thrombolysis with alteplase (recombinant tissue-type plasminogen activator): results of the Israeli Study of Early Intervention in Myocardial Infarction. Br Heart J 1990;64:241-47. 10. Schroder R, Dissmann R, Bruggemann T et al. Extent of early ST segment elevation resolution: a simple but strong predictor of outcome in patients with acute myocardial infarction. J Am Coll Cardiol 1994;24:384-91. 11. van 't Hof AW, Liem A, de Boer MJ, Zijlstra F. Clinical value of 12-lead electrocardiogram after successful reperfusion therapy for acute myocardial infarction. Zwolle Myocardial infarction Study Group. Lancet 1997;350:615-19. 12. Iwakura K, Ito H, Ikushima M et al. Association between hyperglycemia and the no-reflow phenomenon in patients with acute myocardial infarction. J Am Coll Cardiol 2003;41:1-7. 13. van den Berghe G., Wouters P, Weekers F et al. Intensive insulin therapy in the critically ill 14. Jonassen AK, Brar BK, Mjos OD, Sack MN, Latchman DS, Yellon DM. Insulin administered at patients. N Engl J Med 2001;345:1359-67. reoxygenation exerts a cardioprotective effect in myocytes by a possible anti-apoptotic mechanism. J Mol Cell Cardiol 2000;32:757-64. 15. LaDisa JF, Jr., Krolikowski JG, Pagel PS, Warltier DC, Kersten JR. Cardioprotection by glucose-insulin-potassium: dependence on KATP channel opening and blood glucose concentration before ischemia. Am J Physiol Heart Circ Physiol 2004;287:H601-H607. 219 Metabolic interventions in acute myocardial infarction 16. Young ME, Guthrie PH, Razeghi P et al. Impaired long-chain fatty acid oxidation and 17. Zhang HF, Fan Q, Qian XX et al. Role of insulin in the anti-apoptotic effect of glucose-insulin- contractile dysfunction in the obese Zucker rat heart. Diabetes 2002;51:2587-95. potassium in rabbits with acute myocardial ischemia and reperfusion. Apoptosis 2004;9:77783. 18. Sundell J, Luotolahti M. Association between insulin resistance and reduced coronary vasoreactivity in healthy subjects. Can J Cardiol 2004;20:691-95. 19. Opie LH, Jonnesen A, Yellon DM. The glucose hypothesis: Updated or outdated? Role of insulin. Cardiovasc J S Afr 2004;15:S1. 220 List of abbreviations List of Abbreviations ACC American College of Cardiology ADA American Diabetes Association ADP Adenosine diphosphate AHA American Heart Association AMP Adenosine monophosphate APACHE-II Acute Physiology And Chronic Health Evaluation II ATP Adenosine triphosphate AUC Area under the curve CABG Coronary artery bypass grafting CADILLAC Controlled Abciximab and Device Investigation to Lower Late Angioplasty Complications CCU Coronary care unit CI Confidence interval CK creatine kinase CoA Coenzyme A CRF Case Record Form CVD Cardiovascular event DIGAMI Diabetes Insulin-Glucose in Acute Myocardial Infarction study ECLA Estudios Cardiologicos Latinoamerica pilot trial ESC European Society of Cardiology FFA Free fatty acid GCS Glasgow Coma Scale GIK Glucose-insulin-potassium infusion GIPS Glucose-Insulin-Potassium Study GLUT Glucose transporter GP IIb/IIIa Glycoprotein IIb/IIIa GRACE Global Registry of Acute Coronary Events HbA1C Glycosylated hemoglobin A1c HGI Hyperglycemic index IABP Intra-aortic balloon pump ICU Intensive care unit IFCC International Federation of Clinical Chemistry IGF Insulin-like growth factor IGT Impaired glucose tolerance IRA Infarct related artery 221 Metabolic interventions in acute myocardial infarction IRV Infarct related vessel IQR Interquartile range LAD Left descending artery LDH Lactate dehydrogenase MACE Major Adverse Cardiac Event MBG Myocardial blush grade MI Myocardial infarction MRC Medical Research Council MVD Multi-vessel disease NF-κB Nuclear factor-κB OASIS Organization to Assess Strategies for Ischemic Syndromes OR Odds ratio PDMS Patient database management system PCI Primary coronary intervention PI3-K Phosphatidylinositol 3-kinase Pol-GIK Polish-Glucose-Insulin Potassium trial PTCA REVIVAL Primary transluminal coronary angioplasty Reevaluation of Intensified Venous Metabolic Support for Acute Infarct Size Limitation ROC Receiver operator characteristics RR Relative risk SD Standard deviation SEM Standard error of the mean SHOCK Should we emergenly revascularize Occluded Coronaries for cardiogenic shocK SK Streptokinase SOFA Sequential Organ Failure Assessment SPSS Statistical Package for the Social Sciences TG Triglyceride TIMI Thrombolysis in myocardial infarction 222 Acknowledgements Acknowledgements Thank you Anouk (love you), Kasper (love you too); B or J; Papa & Mama (Ω); family and friends; Henk Bilo; Menko-Jan de Boer; Greet van den Berghe; Dirk-Jan van Veldhuisen; Bruce Wolffenbuttel; Carl Apstein; Jan-Paul Ottervanger (my third co-promotor); Arnoud van ‘t Hof; Jan Hoorntje; Harry Suryapranata; Jan-Henk Dambrink; Marcel Gosselink; Jorik Timmer; Nicolette Ernst; José Henriques; Giuseppe de Luca; Stoffer Reiffers; Kor Miedema; Mathijs Vogelzang; Jack Ligtenberg; Jan Zijlstra; Rob Spanjersberg; Sofie Meijering; Carine Doggen; Gerrit Zijlstra; Peter van der Voort; Ferdinand Snellen; Bas Houweling; Harma Israël; Thea Schenk (√); Vera Derks; Anneke Stegeman (many thanks); everyone at Diagram BV, Zwolle, the Netherlands; Edwin Nibbering; Joep Dille; Olga Klompstra & Alma Guikema (coffee time); Cardiologist and CCU personnel at the University Medical Center Groningen (see you again very soon); Brigitte Klinkenbijl; David Stocker; Christine Gesseney; Coldplay & Keane (for accompanying me at night); Maarten Nijsten (utmost); Jolanda & Rémon () Very special thanks Felix Zijlstra; Rijk Gans Last but not least All Cardiologists, (former) residents & CCU, laboratory and nuclear medicine personnel at the Isala Klinieken, location Weezenlanden (without you this was never achieved!) 223 Metabolic interventions in acute myocardial infarction Generous contributions and unrestricted grants from Abbott Laboratories BV, Amgen BV, Astra-Zeneca BV, Aventis BV, Bristol-Myers Squibb BV, Eli Lilly BV, Groningen University Institute for Drug Exploration (GUIDE), Medtronic Europe Sarlé, Medtronic Minimed BV, Merck Sharp & Dohme BV, Novartis Pharma BV, Novo-Nordisk Farma BV, Otsuka Pharmaceutical Factory Inc Japan, Pfizer Nederland BV, Sanofi-Synthelabo BV, Servier Farma Nederland BV, and Solvay Pharma BV 224


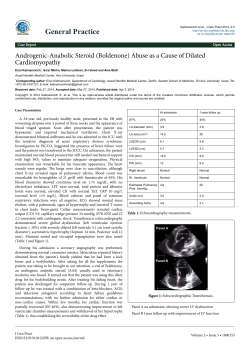


© Copyright 2026