
Document 71673
MOTORCYCLE-RELATED INJURIES
TO CHILDREN AND
ADOLESCENTS
by
Narelle Haworth
Joan Ozanne-Smith
Barbara Fox
Irene Brumen
Monash University
Accident Research Centre
.VicHealth
Project funded by
Victorian Health Promotion Foundation
May 1994
Report No. 56
Printed by the Australian Road Research Board as part of an agreement with
Monash University Accident Research Centre.
MONASH UNIVERSITY ACCIDENT RESEARCH CENTRE
REPORT DOCUMENTATION PAGE
Report No
56
ISBN
0732600553
Report Date
May 1994
Pages
91
Title and sub-title
Motorcycle-related
Author(s)
Haworth,N.L.
Ozanne-Smith,
Fox, B.
Brumen,1.
injuries to children and adolescents
Type of Report & Period Covered
1.
E.
GENERAL, 1992-94
Performing Organization
Monash University Accident Research Centre
Wellington Road
Clayton Victoria 3168
Sponsoring Organization
Victorian Health Promotion Foundation
333 Drummond Street
Carlton Victoria 3053
Abstract
This study is an exploratory one, aiming to assess the magnitude of the problem of motorcycle-related
injuries (both on- and off-road) to children and adolescents, to characterise the crashes and resulting
injuries and to suggest possible countermeasures.
Analyses of hospital admission data (Victorian Inpatient Minimum Dataset - VlMD) showed that
Police-reported data account for only 80.4% for 18-20 year old motorcyclists involved in on-road
crashes and only 37.4% for under 18 year olds in on-road crashes. On- and off-road crashes were
each responsible for a total of more than 4000 hospital bed-days in Victoria in 1991. This comprised
2822 and 1282 hospital bed-days for on- and off-road injuries, respectively. From information
derived from the Victorian Injury Surveillance System (VlSS) and the VlMD, it is estimated that
motorcycle injuries to riders and passengers aged under 21 result in 1868 presentations to Emergency
Departments in Victorian hospitals per year.
Earlier research into factors contributing to crash occurrence and injury severity and injuries resulting
from motorcycle crashes are reviewed. The results of a follow-up study of 185 injured motorcyclists
are presented. Possible countermeasures to reduce crash occurrence or injury severity discussed
include those which reduce the severity of injury (helmets, lower limb protection, protective clothing,
airbags) and those which reduce the risk of a crash occurring (conspicuity improvements, training for
motorcyclists and car drivers, restrictions on off-road riding, alcohol restrictions and vehicle
improvements).
KeyWords
motorcycle, injury, children, adolescents, road
trauma, off-road injury, statistics
Reproduction of this page is authorised.
Disclaimer
This report is disseminated in the interests of
information exchange. The views expressed
are those ofthe authors, and not necessarily
those of Monash University or the Victorian
Health Promotion Foundation.
EXECUTIVE SUMMARY
This study is an exploratory one, aiming to assess the magnitude of the problem of
motorcycle-related injuries (both on- and off-road) to children and adolescents, to
characterise the crashes and resulting injuries and to suggest possible countermeasures.
Mass data analyses
Both nationally and in Victoria, the absolute numbers of motorcyclists killed in onroad crashes has been dropping. The proportion of all roadusers killed who are
motorcyclists has dropped nationally but Victorian data show an increase from 1989 to
1992, suggesting that different factors are affecting motorcyclists compared with other
roadusers in this State.
Nationally, almost a quarter of all motorcyclists killed in on-road crashes are under 21
years of age. In Victoria, the figure was 38% in 1990.
Most of the motorcyclists under 21 involved in on-road crashes in Victoria in 1990-93
were over 16 but the crashes of younger riders were more severe (probably a reporting
bias - see later discussion). Crashes outside of Melbourne and in higher speed zones
were more severe. Overtaking and loss of control on curve crashes resulted were the
most severe. Almost a quarter of intersection crashes were right-turn against. The
motorcycle was travelling straight ahead in about 85% of these crashes and so was
unlikely to have been at fault.
Analyses of hospital admission data (Victorian Inpatient Minimum Dataset - VIMD)
showed that the reporting rate is 80.4% for 18-20 year old motorcyclists involved in
on-road crashes but only 37.4% for under 18 year olds in on-road crashes. On- and
off-road crashes were each responsible for a total of more than 4000 hospital bed-days
in Victoria in 1991. This comprised 2822 and 1282 hospital bed-days for on- and offroad injuries, respectively.
From information derived from the Victorian Injury Surveillance System (VISS) and
the VIMD, it is estimated that motorcycle injuries to riders and passengers aged under
21 would result in 1868 presentations to Emergency Departments in Victorian
hospitals per year.
Literature review
The factors contributing to crash occurrence and injury severity were identified from
the literature review as
•
•
•
•
•
•
being male
being
.. young
mexpenence
being unlicensed
riding a borrowed motorcycle
consumption of alcohol
ii
•
•
riding during peak hours
curves
•
•
slippery or uneven surfaces
poor motorcycle maintenance
Injuries to the extremities, particularly the legs, are the most common injuries,
followed by head injuries. Spinal injuries are less common but have very long-term
effects. Among on-road crashes, those involving collisions result in more severe
injuries than noncollision crashes. There is less information available about injury
patterns in off-road crashes. However, there is some evidence of more injuries to the
right side of the body, a preponderance of injuries to the extremities and head injuries
when helmets are not worn. The lower speed in off-road riding may underlie the lesser
severity of the resulting injuries, compared with on-road riding.
The cost of injuries in motorcycle crashes is most clearly documented for on-road
crashes. Generally the cost of injuries is very high for motorcyclists, only being
exceeded by the costs for pedestrians. Collision crashes have higher injury costs than
noncollision crashes. The over-involvement of teenagers means that motorcycle
crashes have a high cost in terms of years of potential life lost.
Throughout the literature review it is evident that much more is known about on-road
crashes than off-road crashes. This underlines the need for this study.
Follow-up of hospitalised motorcyclists
The study included 174 riders and 11 pillion passengers aged under 21 years, of whom
160 were admitted to hospital and 25 were killed. About 60% of the hospitalised
motorcyclists were under licensing age. Most of the motorcyclists under licensing age
were injured in off-road crashes and most of the older group were injured in on-road
crashes. The on-road crashes were much more likely to be fatal.
The youngest injured motorcyclists were 5 years old and most off-road motorcyclists
were aged 12 to 17. The finding that 20% of the riders weighed under 50 kg suggests
that their light weight may have led to difficulty in controlling the motorcycle.
Most riders, even those below licensing age, had more than three years riding
experience but few had any formal training. However, in almost one-fifth of the cases,
the crash motorcycle was being ridden for the first time or had only been ridden once
before. The involvement of lack of familiarity of the motorcycle was found for both
on- and off-road crashes.
More than 40% of riders involved in on-road crashes were not licensed and more than
30% of motorcycles in on-road crashes were known to be unregistered. Overall, 45%
of on-road crashes involved unlicensed riding or an unregistered motorcycle.
Helmets were not worn in 14% of crashes and other protective gear was not worn in
40% of crashes. The prevalence was the same in on- and off-road crashes.
iii
Most motorcyclists interviewed gave very high estimates of the likelihood of being
injured or killed in a motorcycle crash. Many had previously been injured in a
motorcycle crash. However, most intended to continue riding after recovering from
their current injuries.
The most common sites for off-road crashes were motocross tracks, farms or
paddocks and bush tracks. The type of crash was more commonly a collision in onroad crashes whereas loss of control was more common in off-road crashes. Natural
obstacles (e.g. ditches and logs) and artificial obstacles (fences, poles, gutters, jumps
on motocross tracks) were recorded as the immediate cause of most off-road crashes.
Off-road collisions commonly involved other motorcycles.
Both on- and off-road crashes were more likely to occur on Saturday than any other
day of the week. In accord with this, leisure was the purpose of most of the crash trips
(both on- and off-road).
Not surprisingly, on-road crashes had higher estimated speeds than off-road crashes.
It is important to note, however, that even at estimated speeds ofless than 20 km/h,
injury was severe enough to require hospitalisation.
On-road crashes were more severe (by mean Injury Severity Score) than off-road
crashes and collision crashes were more severe than non-collision crashes.
Head injuries were sustained by 64% of injured motorcyclists but were less common in
off-road than on-road crashes. Off-road motorcyclists who wore helmets were less
likely to sustain head injuries than those who did not wear helmets. Because of the
small numbers not wearing helmets, this relationship could not be tested in on-road
crashes. Neither were analyses of severity of injury with and without helmets possible.
It was estimated that about half of the motorcyclists killed would have survived if the
severity of head injury was less.
About 57% of the motorcyclists sustained one or more fractured limbs. Fractures
were more common below the elbow or knee (respectively) than above. There was a
tendency for off-road crashes to result in injury to limbs on the left side of the body
and on-road crashes to injure limbs on the right side.
Most injured motorcyclists suffered abrasions and about half sustained contusions and
lacerations. In off-road crashes, there was a trend for motorcyclists wearing protective
clothing to be less likely to sustain external injuries. In on-road crashes, almost all
motorcyclists sustained external injuries, whether or not protective clothing was worn.
Collision with another vehicle was the most common cause of injury for on-road
crashes, followed by the impact of landing on the ground and striking roadside objects.
In off-road crashes, the impact of landing on the ground was the most common cause
of injury, followed by the motorcycle landing on the person. Many of the motorcycles
are heavy compared to the rider's weight and this may contribute to difficulty in
moving the vehicle off the body. Striking a roadside object was the most common
cause of injuries resulting in death.
iv
The countermeasures discussed include those which reduce the severity of injury
(helmets, lower limb protection, protective clothing, airbags) and those which reduce
the risk of a crash occurring (conspicuity improvements, training for motorcyclists and
car drivers, restrictions on off-road riding, alcohol restrictions and vehicle
improvements) .
Recommendations to reduce motorcycle-related injuries to children and
adolescents
1.
Helmets should be made mandatory for off-road riding to reduce the frequency
of head injuries. Further investigations of helmet performance (including
retention) should be undertaken to attempt to reduce head injuries.
2.
Motorcyclists be educated about the value of protective clothing and be
encouraged to wear it.
3.
That further investigations be conducted of when children develop the skills
needed for safe motorcycle riding. In the interim, motorcycle riding by very
young riders (perhaps under eight years) should be discouraged because of the
likelihood of insufficient development of motor coordination.
4.
Guidelines on minimum rider heights (for various styles and sizes of
motorcycles) and a minimum ratio of weight of rider to weight of motorcycle be
developed and distributed to retailers to advise intending purchasers and to offroad motorcycle clubs.
5.
That riders be informed of the very high risks associated with riding a different
motorcycle for the first (or second) time, even if they are experienced riders.
The risk of riding a different motorcycle could be minimised by riding in an area
free of obstacles, riding more slowly and wearing protective gear.
6.
That an appropriate government authority (or authorities) take authority for offroad motorcycle safety.
7.
That the extent and nature of under-reporting of on-road crashes be considered
when benefit:cost ratios for countermeasures are developed.
8.
Improvements to enforcement to reduce the high incidence of unlicensed riders
and unregistered motorcycles in on-road crashes.
9.
More widespread testing for alcohol in riders after motorcycle crashes, even if
riders are young and the crash occurs off-road.
10.
That parents be made aware through retailers and off-road motorcycle clubs that
slowing down motorcycles for young riders will not eliminate injuries warranting
hospital admission.
11.
Further investigations into improving protection for the limbs is warranted
because of the high incidence of fractures.
v
TABLE OF CONTENTS
Page
1. INTRODUCTION
1
On- and off-road riding
Structure of the report
1
2
2. SIZE OF THE PROBLEM: ON-ROAD INJURIES
National road crash statistics
Victorian road crash statistics
Trends
4
4
6
6
Motorcyclists involved in crashes
Locations of crashes involving young motorcycle riders
Motorcyclist admissions to Victorian hospitals 1991
General characteristics of hospitalised motorcyclists
Under-reporting of on-road crashes
7
10
13
14
16
3. SIZE OF THE PROBLEM: OFF-ROAD INJURIES
18
Hospital admission
Presentations to hospital Emergency Departments
Numbers of motorcyclists aged under 21 injured in Victoria
18
18
21
4. FACTORS CONTRIBUTING TO CRASH OCCURRENCE AND INJURY
SEVERITY
23
Rider and passenger factors
Sex
23
23
Age
Inexperience
Licence status
Alcohol
Crash factors
24
25
27
27
28
Time of day
Wet weather
Curves
Environmental hazards
Vehicle factors
29
30
30
30
31
Type of motorcycle
Engine capacity
Mass of motorcycle
Mechanical defects
Summary
31
34
34
35
35
vi
5. INJURIES RESULTING FROM MOTORCYCLE CRASHES
Injury patterns
Lower extremities
Head
Spinal injuries
Burns
Collision versus noncollision traffic crashes
On- versus off-road injuries
Injuries to killed motorcyclists
Costs of injuries
6. FOLLOW-UP STUDY OF INJURED MOTORCYCLISTS
Aim
Method
Sample characteristics
Motorcyclist factors
Sex
Age
Experience and training
Licence status
Alcohol
Protective gear
Estimates of injury frequency
Crash factors
Crash type
Surface characteristics
Immediate cause of the crash
Speed of travel
Vehicle factors
Type of motorcycle
Engine capacity
Registration status
Headlights
Injury patterns
Abbreviated Injury Scale (ArS)
Injury Severity Scale (ISS)
Injury Severity Scale scores in the sample
Injuries by body region
Head and neck injuries
Facial injuries
Chest injuries
Abdominal injuries
Injuries to the limbs
External injuries
Causes of injury
36
36
36
37
37
37
37
38
39
39
42
42
42
42
43
43
43
43
46
47
47
47
48
48
49
50
51
52
52
53
53
54
54
54
55
55
55
56
57
58
58
58
60
61
vii
7. PROTECTIVE MEASURES
Helmets
Lower limb protection
Protective clothing
62
62
63
64
~~
M
Conspicuity
Motorcycle training
Awareness training for car drivers
Enforcement
64
66
68
68
Zero BAC limit for all motorcyclists
Restrictions on carriage of pillion passengers
Restrictions on off-road riding by children and adolescents
Vehicle-based countermeasures
69
69
69
70
Engine capacity and power restrictions
70
8. CONCLUSIONS AND RECOMMENDATIONS
Recommendations to reduce motorcycle-related injuries to children and adolescents
71
71
REFERENCES
73
APPENDIX 1. The External Cause of Injury Codes used to identify motorcyclists
in the Victorian Inpatient Minimum Dataset
82
APPENDIX 2. Interview form and injury coding form for follow-up study of
injured motorcyclists
83
1
CHAPTER 1:
INTRODUCTION
This study was an exploratory one, aiming to assess the magnitude of the problem of
motorcycle-related injuries (both on- and off-road) to children and adolescents, to
characterise the crashes and resulting injuries and to suggest possible countermeasures.
The project was funded by the Victorian Health Promotion Foundation and benefitted
from the input of an expert Project Consultative Committee. The Project Consultative
Committee comprised representatives of the Victorian Health Promotion Foundation,
Vic Roads, Victoria Police, Motorcycle Riders Association, Motorcycle Trail Riders
Association, Federal Chamber of Automotive Industries, Victorian Automotive
Chamber of Commerce, Victorian Farmers Federation and members of the project
team. In addition to raising issues which it felt should be addressed, the Committee
provided specialised advice and access to data. It also provided a channel for
communication with the Motorcycle Safety Forum.
ON-ROAD AND OFF-ROAD RIDING
There are a number of characteristics of on- and off-road riding which lead us to
expect different patterns of crash occurrence and injury for these two forms of
motorcycling. In general,
off-road riders
are younger
are less experienced
are mostly unlicensed
off-road motorcycles
are lighter
have lower engine capacity
may have poorer braking
off-road riding
is more for recreation rather than for transport
surfaces have less traction than roads
surfaces are rougher than roads
absence of large moving vehicles
slower speeds
Much of the literature relating to motorcycling injuries refers to crashes which occur
on-road and are reported to the police. It is difficult to determine the proportion of the
actual injuries that these crashes represent. The issue of under-reporting of on-road
motorcycle injuries is acknowledged to be a large problem. In the United Kingdom the
police report rate was found to be 37% for injuries to motorcyclists from single vehicle
2
crashes (Tunbridge, Everest, Wild and Johnstone, 1988). From a survey of motorcycle
owners in Great Britain, Taylor and Lockwood report that only 25% of the injury
accidents and 52% of the serious injury accidents were reported to police. In the
Netherlands the estimate was 40% (Harris, 1990). New Zealand Ministry of Transport
statistics were found to account for only 46% of motorcyclists admitted to hospital and
may have also mistakenly included some persons who were treated but not admitted
(Langley, Begg and Reeder, 1993).
The relative contribution of on- and off-road motorcycling to deaths and injuries is not
known in most countries. In New Zealand, on-road motorcycling accounted for 96%
of fatal motorcycle crashes and off-road, 4% in 1978-87 (Begg, Langley and Reeder,
1993). Off-road crashes accounted for relatively more motorcyclist hospitalisations
(15%). Interestingly, children aged under 15 years were more likely to have been
injured in off-road crashes than adults (55% vs 13%).
The off-road motorcycle crash problem may be comparable to that of all-terrain
vehicles (ATVs), which are popular in North America. The injury risk associated with
ATVs have been well documented (Accident Prevention Commission, 1987; Dolan,
Knapp and Andres, 1989; Golladay, Slezak, Mollitt and Seibert, 1985; Greene and
Metzler, 1988; Hargarten, 1991; Hasselback and Wilding, 1987; Kane, Ricci, Sweeney
and Deshmukh, 1988; Margolis, 1988; Postl, Moffat, Black and Cameron, 1987;
Rogers, Pagliarello and Nelson, 1990), and issues such as the effects of potential risk
factors like alcohol, helmet wearing, age and engine size have been studied. ATV s
may provide a good comparison for analyses of the injuries to young riders and offroad crashes.
STRUCTURE OF THE REPORT
The study comprised an examination of available data, a review of the literature
regarding on- and off-road crashes and injury patterns, and a follow-up of injured
motorcyclists in order to identifY potential countermeasures.
The report commences with an examination of the size of the problem of on-road
injuries to motorcyclists aged under 21. Road crash statistics for Police-reported
crashes in Australia and Victoria are examined to assess the involvement of young
motorcyclists in on-road crashes. Data for persons admitted to hospital (the Victorian
Inpatient Minimum Dataset) were also examined to provide information on the nature
of injuries sustained in crashes and to measure the degree of under-reporting to Police
of motorcycle crashes. An estimate of the number of persons injured in on-road
motorcycle crashes but not admitted to hospital was derived from the Victorian Injury
Surveillance System (VISS) database.
Compared to on-road injuries to young motorcyclists, little is known about the
problem of off-road injuries. This is largely because no organisation has responsibility
for the safety of off-road motorcycling. In Chapter 3, analyses of the Victorian
Inpatient Minimum Dataset and VISS database provide general information about the
incidence of off-road crashes and the injury patterns resulting.
3
Earlier research into factors contributing to crash occurrence and injury severity and
injuries resulting from motorcycle crashes are reviewed in Chapters 4 and 5.
Chapter 6 presents the results of a follow-up study of 185 injured motorcyclists.
Possible countermeasures to reduce crash occurrence or injury severity are then
reviewed and discussed (Chapter 7).
4
CHAPTER 2:
SIZE OF THE PROBLEM: ON-ROAD INJURIES
On-road motorcycling is widely regarded as a dangerous form of transport. The
Federal Office of Road Safety (1988) has estimated that the involvement of
motorcycles in fatal crashes in Australia is more than eight times that of cars per 100
million vehicle kilometres travelled.
A number of overseas studies have also compared fatality and injury rates for
motorcyclists and car occupants. A US study of on-road crashes showed that the risk
of being killed as a motorcyclist is about 17 times higher than that of a car occupant
per vehicle mile travelled (Insurance Institute for Highway Safety, 1989). This result
concurs with that of an early study of university students (Cracchiolo, Blazina and
MacKinnon, 1968), which showed that a motorcycle rider was 16 times more likely to
be hospitalised as a result of an on-road crash than an automobile occupant during a
three-year period. West German research found an even worse result: the death rate
per kilometre travelled in West Germany was calculated to be 44 times higher for
motorcyclists than other road users (Appel, 1986, cited by Hancock, Wulf, Thorn and
Fassnacht, 1990).
Not only are motorcyclists more prone to on-road collisions and accidents, but in the
event of an accident, severe injury is common. Analysis of Victorian on-road crashes
reported to Police shows that motorcycle riders have the second highest rate of injury
severity (after pedestrians): 54% of injured motorcycle riders are killed or taken to
hospital compared with less than 40% for other vehicle drivers, passengers and
bicyclists (VIC ROADS, unpublished, cited by Cameron, 1992).
Road crash statistics are compiled by the Federal Office of Road Safety (nationally)
and by each State. Because of the problem of under -reporting of motorcycle crashes
which we have discussed, these statistics will be compared with those derived from the
Victorian Inpatient Minimum Dataset, a collection of data for persons admitted to
hospital. An estimate of the number of persons injured in on-road motorcycle crashes
but not admitted to hospital will be derived from the Victorian Injury Surveillance
System database.
NATIONAL ROAD CRASH STATISTICS
In 1992 and 1993, a total of 91 motorcyclists under the age of 21 were killed in onroad crashes (see Table 2.1). Eleven of those killed were pillion passengers. It is
important to note that 18 of those killed were aged 5-16 years, and so were not old
enough to be licensed to ride a motorcycle in the majority of Australian states.
5
Table 2.1. Numbers of motorcycle riders and pillion passengers killed in road
crashes in 1992 and 1993 as a function of age. (Source: Federal Office of Road
Safety, Road Fatality Statistics, December 1992 and December 1993)
Age
9 Total 284
364
64
16
307
398
73
18
23
2Riders
0
034
Passengers
Figure 2.1 shows that both the absolute numbers of motorcycle riders and pillion
passengers killed and the proportion of road fatalities that they constitute have been
falling since 1984. This suggests that general road safety countermeasures and those
more particularly aimed at motorcyclists may be having an impact. However, in order
to know that, it is important to know whether the amount of motorcycle riding has
changed over that period of time. Rate information is always harder to obtain than
crash or injury numbers.
z.!!l
~
450
300
0=
U
E
0:';;
200
~"C
250
ci
350
o50 I 150
400
~
Q)
100
T
0.14
t
0.12
I
r
I
1 0.10
u~
I
r
I
I
-----{}---
Motorcyc I.Ists
-.-
Mcyclists:all
Vi
;
'I, :::
f!
o '"
a.
0
t
0.04.l:
t
0.02
roadusers
+---+----+----+-----+--1---+----+----+---+---1.
1984
1985
1986
1987
1988
1989
1990
1991
1992
1993
0.00
Year
Figure 2.1. Motorcycle rider and pillion passenger (motorcyclists) fatalities and
motorcyclist fatalities as a proportion of all road users killed in road crashes from
1984 to 1993. (Source: Federal Office of Road Safety, Road Fatality Statistics,
December 1993)
Some rate data are available from 1984-85, using exposure data from the National
Day-to-Day Travel Survey. A preliminary analysis based on approximately 1000
motorcycle trips, indicated that young motorcyclists (under 26 years old) are overrepresented in fatalities, based on total time they spend travelling. However, due to
the small numbers of motorcycle trips involved in this survey these results need to be
interpreted with care. (FORS, 1988, pp.51-52)
6
The survey showed that seventeen year old male licensed motorcycle riders made more
motorcycle trips and travelled further per day than riders of other ages. In addition,
most of the total di ~tance travelled by this group was by motorcycle, a larger
proportion than for older groups. It may be that some riders who begin motorcycling
because it allows solo travel (on L-plates) younger than for car driving, change to car
driving when they reach the age that a car licence can be obtained.
Time of day patterns ofriding also differ according to the age of the motorcyclist. The
survey showed that 19 year olds ride a lot at night, compared to 20 year olds who
spend a similar amount of total time riding. Riders aged 18 and under do very little
riding at night.
It is acknowledged that road crash statistics for motorcyclists are less reliable for
injuries than for fatalities (and also less timely). Given this caveat, Table 2.2 shows
that the absolute numbers of riders and passengers seriously injured dropped from
1989 to 1990, but their contribution to the total number of serious injuries resulting
from road crashes did not drop. This is in agreement with the pattern of data for
motorcyclist fatalities for that year (see Figure 2.1).
Table 2.2. Numbers of motorcycle riders and pillion passengers seriously injured
in road crashes in Australia in 1989 and 1990. (Source: Federal Office of Road
Safety, Road Fatality Statistics, December 1992)
Year
3182
325
339 and
12.4passengers as %
2799
12.5
Riders
Passengers
Riders
of total serious ini uries
VICTORIAN
ROAD CRASH STATISTICS
Trends
The number of motorcyclists killed in road crashes in Victoria has been dropping since
1986 (see Figure 2.2). Since 1990, the total number of persons killed in road crashes
in Victoria has dropped dramatically. Yet the number of motorcycle riders killed has
not decreased as much. This suggests that different factors are affecting motorcyclists
compared with other road users and that the proportion of crashes involving
motorcyclists is not dropping as quickly in Victoria as in the rest of Australia.
7
70
z
30
~""
40
0 ..••
'C ~
III
10
0
50
60
20
. •'
0.12
"
/
/
1I 0.14
0.1
~
Ql
III
0.08 :g ~
:l
.-0""..
0.06 ~0.=e
c::
----0--
o ••
Riders
et
0.04
-11--
Riders:all
road users
0.02
o
1986
1987
1988
1990
1989
1991
1992
1993
Years
Figure 2.2. Number of motorcycle riders killed in road crashes in Victoria 19861993 and riders killed as a proportion of all road users killed. (Sources: Vic
Roads Road Safety Facts Document and FORS Road Crash Statistics Australia)
Motorcyclists
involved in crashes
More than half of the motorcycle riders injured in road crashes are aged between 18
and 26 years (see Table 2.3). On average, 18 motorcycle riders aged under 21 are
involved in fatal crashes in Victoria each year (Table 2.4). While 63 motorcycle riders
under 21 were killed in 1990-93 (Table 2.5), the crashes in which they were involved
claimed a total of71 lives and resulted in an additional 38 injuries (Table 2.6). As
Table 2.7 shows, those injured included pillion passengers, pedestrians and car drivers.
Table 2.3. Age and sex of motorcycle riders killed and seriously injured in road
crashes in Victoria in 1990. (Source: Vic Roads)
Killed
injured
injured
15
11
0317.1
13
1735409.1
05.7
011.0
743
14.3
20.3
9.1
291
309
215
228
18
178
174
37
13
00
18
9.2
518.517
15.813
15
0130Percentage
35
778
50
23.4
1.549
0.0
Seriously
0.0
16.1
0.8
70.1
Males
Females
Total all
Age
road casualties
8
Table 2.4. Numbers of motorcycle riders aged under 21 in crashes in Victoria
1990-93 (data from Vic Roads).
Crash severitv
50.8
4.0
45.2
915
72
Percent
Number
of 813
riders
of riders
Table 2.5. Injuries to motorcycle riders aged under 21 years in Victoria 1990-93
(data from Vic Roads).
Number of riders
63
761
926
50
Percent of riders
3.5
42.3
51.4
2.8
Table 2.6. Injuries to all road users in fatal crashes which involved a motorcycle
rider aged under 21 years in Victoria 1990-93 (data from Vic Roads). (Age
group relates to the person injured, not just the riders)
41
Unknown
18-20
14098451
22
71
12
036 Total
28
In.iury severitvOver
20 <18
632
20
Table 2.7. Roadusers injured in fatal crashes involving motorcyclists aged under
21 in Victoria 1990-93 (data from Vic Roads).
I I
73iniury
14
24120Total
25
05
16
50
10
03iniury
22
40
02
150
4073
14
Serious
Other
Type of roaduser
Noninjury
I
71
63
07
Fatal
Overall, only 4.3% of motorcycle riders involved in crashes were female. All of the
motorcycle riders killed were male. Females comprised 3.4% of those seriously injured
and 5.5% of other injured.
9
About 93% of motorcycle riders aged under 21 were 17, 18, 19 or 20 (see Table 2.8).
However the crash severity (proportion of crashes which were fatal) was highest for
riders aged under 17 (X2(8)=40.3, p<.OI) This suggests that crashes involving
motorcyclists aged under 17 years are more severe, on average, than those involving
older riders.
Table 2.8. Age of motorcycle riders (under 21) involved in crashes of varying
levels of severity in Victoria 1990-93 (data from Vic Roads).
Age
1800
Total
Fatal
430
(100.0)
237
226
38
123
180
235
(30.9)
(55.1)
(50.7)
(52.6)
(41.9)
(41.4)
Serious
915
309
105
813
203
123
234
446
567
72
(44.9)
(54.5)
(50.8)
23(4.1)
13
17(3.8)
13
(45.2)
injury
6(45.5)
(100.0)
(58.5)
(100.0)
(IOO.O)
(I0.6)
(((4.0)
2.6)
3.0)
Other
72
in.iury
Problems exist with the quality of data regarding licence status (see the Under 10 year
olds and 10-16 year olds in Table 2.9). Despite this, Table 2.9 shows that many of the
young riders involved in crashes did not have a valid licence. Of those old enough to
hold a motorcycle licence (18, 19 and 20 year olds), 3.6% of those known did not hold
a valid licence. The prevalence appeared to be higher for 19 year olds (5.7%). Table
2.10 suggests that not having a valid licence was a more common problem in the more
severe crashes.
Table 2.9. Licence status as a function of age for motorcycle riders (under 21)
involved in crashes in Victoria 1990-93 (data from Vic Roads). Not valid licence
includes cancelled, disqualified, expired, suspended and surrendered.
Licence status
10660
14
48567
446
11
20
19
37
543
26
317
118
169
516
218
380
393
430
34
10-16
Under531 10
Table 2.10. Licence status as a function of crash severity for motorcycle riders
(under 21) involved in crashes in Victoria 1990-93 (data from Vic Roads). The
percentage of cases are given in parentheses.
Licence status 537
Fatal
Total
1443
(100.0)
56(9.1)
106
Serious
(7.3)
in.iury
(I5.1)
42
Other
(5.4)
in.iurv
618
25
1289
772
(86.9)
(100.0)
(100.0)
(89.3)
711
19
48(4.0)
(2.5)
(3.3)
(92.1)
53
41
48 (100.0)
(7.5)
(77.4)
Not valid licence
10
Information about helmet wearing was available for about three-quarters of the riders.
A helmet was not worn by 6.2% of riders for which this information was available.
Table 2.11 shows the blood alcohol concentrations (BAC levels) of riders aged under
21 involved in crashes. Unfortunately, BAC levels were not available for about twothirds of riders. Of those riders for which information was available, 16.1% had an
illegal BAC level.
Table 2.11. Blood alcohol concentration (BAC level) for motorcycle riders
(under 21) involved in crashes in Victoria 1990-93 (data from Vic Roads).
BAC level
25.8
465
40
30
37of riders
2.1
2.2
1.7
1.4
66.8 1202
26
Number
Percent
Locations of crashes involving young motorcycle riders
Overall, 56.6% of the crashes occurred in the Melbourne Metropolitan area and 43.4%
in the rest of Victoria. Table 2.12 suggests that the crashes in the rest of Victoria may
have been more severe than those in Melbourne. This may reflect more severe crashes
in higher speed zones. This is supported by the finding that 40.3% of fatal crashes but
only 26.0% of serious injury crashes occurred in 100 km/h zones (Table 2.13).
Table 2.12. Locations of crashes involving motorcycle riders aged under 21 years
in Victoria 1990-93 (data from Vic Roads).
1800
781
1019
41
813
915
358
72
Rest
382
ofMelbourne
Victoria
Total
431
31
557
11
Table 2.13. Speed zones at sites of crashes involving motorcycle riders aged
under 21 years in Victoria 1990-93 (data from Vie Roads).
SDeed
12
43753715
116
58
1269
19
10
2128
520
209
366
1Other
921 Fatal
29
027
Total0
34
Serious
injury
injury
About two-thirds of motorcycle crashes occurred during daylight hours (see Table
2.14). It was raining at the time of7.7% of crashes and the road was wet for 15.1% of
crashes. Crashes were more common in March and May than other months. Generally
crash numbers were lower in winter months, presumably because of less riding.
Table 2.14. Light conditions for crashes involving motorcycle riders aged under
21 years in Victoria 1990-93 (data from Vic Roads).
Light conditions
106
28.4
5.9
1182
512
Percent
Number
of
riders
of riders
65.7
Fatal crashes were more likely to occur midblock than at an intersection (Table 2.15,
X2(6)=20.7, p<.01). This may be another reflection of the higher severity of rural
crashes where intersections are fewer than in cities.
Table 2.15. Intersection or mid-block location of crashes involving motorcycle
riders aged under 21 years in Victoria 1990-93 (data from Vic Roads).
Location typeSerious
Total
Fatal
96Other
(1.1)
813
402
17
11
857
(0.7)
(0.9)
(l.4)
(100.0)
(49.4)
(47.6)0(0.0)
72
(100.0)
391
18
908
9494
406
(1.0)
(1.0)
injury
(48.1)
(44.4)
(50.4)
injury
49
(68.1)
(54.0)
230(0.0)
(31.9)
915
(100.0)
1800
(100.0)
In urban areas (defined as speed limit less than 70 km/h), most crashes occurred where
there was no traffic control (see Table 2.16). More crashes occurred at traffic lights
(125) than at giveway signs (95) or stop signs (89). This pattern was the same when
all crashes at intersections (regardless of speed zone) were considered (see Table
2.17).
12
Table 2.16. Type of traffic control at crashes in urban areas (speed limit less
than 70 km/h) involving motorcycle riders aged under 21 years in Victoria 199093 (data from Vic Roads).
Type of trafficSerious
control
7
890
12
7
42
125
31
16
0
54
9
89
95
Total
53
370
6
8
40
18
6
23
5
4 in.iury
499
Other
injury
I
21
4
2
0
Fatal
Table 2.17. Type of traffic control for intersection crashes only. Crashes
involving motorcycle riders aged under 21 years in Victoria 1990-93 (data from
Vic Roads).
14
8
7
3
46
4
500
94
Type of trafficSerious
control
55
34
12
122
116
27
6
2
5
0
2
71
6 iniury
220
53
18
0
Total
Other
iniury
0
4
9
5
3
1
Fatal
Table 2.18 shows the crashes classified according to the Definitions for Classifying
Accidents (DCA codes). Off-path on straight and off-path on curve are types ofloss
of control crashes. The most common crash types were off path on straight (18.8%
riders), opposing directions (16.9% riders), same direction (16.3% riders) and adjacent
direction (15.7% riders). The most severe crash types were off path on curve (8.3%
fatal), overtaking (13.3% fatal) and opposing directions (5.2% fatal).
Right -turn against crashes were identified as dca= 121. There were 206 such crashes
(7 fatal, 114 serious injury and 85 other injury). The motorcycle was travelling straight
ahead in most of these crashes (85.9%) and therefore not likely to have been at fault.
There were no traffic controls at 62.1 % of these sites and traffic lights at 35.0% of the
sites.
strian
13
Table 2.18. Definitions for Classifying Accidents applied to crashes involving
motorcycle riders aged under 21 years in Victoria 1990-93 (data from Vic
Roads).
59
175
126
71
116
39
305
338
21
3193
45
15
11
106
11
51
71
294
173
20
16
4
201
56
114
6
150-159
190-199
107
125
282
146
98
18
130-139
110-119
100-109
120-129
140-149
160-169
170-179
180-189
Totalinjury
182
Fatal
Description Serious
DCA
code
injury
Other
Opposing directions
Table 2. 19 shows whether the motorcycles headlight was on at the time of the crash.
This information was unknown for about 10% of the crashes. Nevertheless, it shows
that the headlight was on in 164 daylight crashes and offin 35 night-time crashes.
Table 2.19. Whether the headlight was on at the time of the crash as a function
of light conditions.
7Total
106
512
12
109
63
1800
193
171
11
15
379
100
52
3
23
Yes
No
1182
105
384
77
69
129
12
164
611
13
2
035
286
Unknown
Light conditions
825
780
21
24
4
18
0
2
Not
ay
MOTORCYCLIST
ADMISSIONS
TO VICTORIAN HOSPITALS
1991
The Victorian Inpatient Minimum Dataset (VIMD) is a collection of data regarding
persons admitted to Victorian hospitals. These data were analysed to provide
information on the nature of injuries sustained in crashes and to overcome some of the
acknowledged problems of under-reporting of on-road motorcycle crashes.
Motorcyclists were identified using the External Cause oflnjury Codes (E-codes) of
the International Classification of Diseases (ICD-9 CN) which form part of the VIMD.
This allowed identification of injured motorcycle riders and pillion passengers in on-
14
and off-road crashes. Appendix 1 gives details of the E-codes which were used to do
this.
General characteristics of hospitalised motorcyclists
Of the 632 motorcyclists aged under 21 hospitalised in 1991, 572 (90.5%) were riders
and 60 (9.5%) were passengers. More than half of the motorcyclists were under 18
years (59.3%) and almost half were involved in off-road crashes (45.1%). As
expected, motorcyclists aged under 18 years were more likely to have been involved in
off-road crashes and the reverse pattern was found for motorcyclists aged 18 to 20
years (X2(1)=85.7, p<.05, see Table 2.20). The proportion of motorcyclists who were
pillion passengers appeared somewhat higher for on-road than off-road crashes but this
difference was not statistically significant (11.2% vs. 7.4%, X2(1)=2.7, p=.I).
Table 2.20. Motorcyclists hospitalised following on- and ofT-road crashes in
1991.
Crash location
632
347
Total
18 (77.0%)
to
20
years
285
226
(60.3%)
149
(39.7%)
257
(100.0%)
375
(100.0%)
198
59
(23.0%)
A2e ~roup
Under 18 years
Overall, 8.7% of hospitalised motorcyclists were female. There were similar
proportions of males and females in the two age groups and in on- and off-road
crashes. However, females were more likely to be pillion passengers than were males
(40.0% versus 6.6%, x2(1)=65.2, p<.05).
In general, the injuries sustained in on-road crashes were more severe than those in offroad crashes. All six motorcyclists who died in hospital had been involved in on-road
crashes. Those injured in on-road crashes were more likely to be transferred to
another hospital for further treatment than those in off-road crashes (7.5% vs 3.3%).
Motorcyclists in on-road crashes spent more days in hospital, on average, than those in
off-road crashes (8.2 vs 3.3, t(1012)=7.42, p<.OOI). This pattern was found for both
age groups, although 18-20 year old motorcyclists spent longer in hospital, on average,
than the younger group. Table 2.21 shows that on- and off-road crashes were each
responsible for a total of more than 4000 hospital bed-days in Victoria in 1991. This
comprised 2822 and 1282 hospital bed-days for on- and off-road injuries, respectively.
To obtain an indication of the nature of injuries to on- and off-road motorcyclists, the
first injury coded in the hospital data for each motorcyclist was examined. The injuries
are summarised in Table 2.22. Overall, upper and lower limb fractures and intracranial
injuries were the most common injuries. The distributions of on- and off-road injuries
did not differ (x2(19)=23.2, p>.1O).
15
Table 2.21. Length of stay in hospital for motorcyclists injured in on- and offroad crashes.
Mean
number
991
1831
255
Total
334
196
148
948
59Number
5.7
4.2
2165
374
of9.3
226
6.7
1939
8.5
5.2
admissions
of number
days
<18 years
Table 2.22. First injury coded in the Victorian Inpatient Minimum Dataset for
each motorcyclist.
15
1380
22
179
1134
929
65
24
8632
16
043
228
4042
285
88
All
10
6874 crashes
97118
19
Type of injury
Off-road
Total
Open
wound
upper limb
Traumatic
complications,
347
69
598731
99
17
14
On-road
19
10
46
25
16
UNDER-REPORTING
OF ON-ROAD CRASHES
In an attempt to measure the amount of under-reporting of on-road motorcycle crashes
involving young riders, a comparison was made of the numbers and characteristics of
injured motorcyclists from the Victorian Inpatient Minimum Dataset and the Vic
Roads data for Police-reported crashes. The VIMD data were for motorcyclists aged
under 21 admitted to hospitals in 1991, excluding those who were coded as dying in
hospital. The Vic Roads data were for motorcyclists aged under 21 who were
recorded as being" seriously injured" in 1991. It was considered that most of these
motorcyclists would have been admitted to hospital. Unfortunately, it is not possible
to establish which motorcyclists were and were not admitted to hospital. Thus the Vic
Roads data are likely to include some motorcyclists who were not admitted to hospital.
In the VIMD, the number of motorcyclists admitted to hospital would have been
underestimated due to the road user being coded as "unspecified" when it was unclear
whether the injured person was the rider of the motorcycle or a pillion passenger.
These factors mean that any estimate of under-reporting based on comparison of the
Vic Roads and VIMD databases should be considered a conservative value.
Overall, Vic Roads data show that 211 motorcyclists were seriously injured, compared
to 341 from the hospital admissions data. Given the difficulties in definition discussed
above, this suggests that only 61.9% of motorcyclists aged under 21 who are admitted
to hospital are actually captured by the Vic Roads data. In other words, there is a
38.9% under-reporting factor.
Given that under-reporting exists, is it a general phenomenon or are there particular
groups for which under-reporting is greater? Comparison of the two data sources
suggests that the male:female ratios are similar (91.3% male VIMD, 93.8% male Vic
Roads) as are the rider:passenger ratios (88.9% riders VIMD, 91.5% riders Vic
Roads). Figure 2.3 shows that the Vic Roads data underestimates the number of
young motorcyclists (under 18) much more than the number of older motorcyclists.
Under 18 year olds comprise 26% of the Vic Roads sample but 43.1% of the hospital
sample. Put differently, while the reporting rate is 80.4% for 18-20 year old
motorcyclists involved in on-road crashes, the rate is only 37.4% for under 18 year
olds in on-road crashes.
17
80
70
60
No. seriously
50
injured!
admitted to
40
hospital
30
•
VicRoads
o Hospital
20 1
10
o
Under
10
10-16
17
18
19
20
Age (years)
Figure 2.3. Age distributions of on-road motorcyclists admitted to Victorian
hospitals (hospital) and seriously injured (VicRoads) in 1991.
18
CHAPTER 3:
SIZE OF THE PROBLEM: OFF-ROAD INJURIES
Compared to on-road injuries to young motorcyclists, little is known about the
problem of off-road injuries. This is largely because no organisation has responsibility
for the safety of off-road motorcycling. Two sources of injury data for off-road
motorcycling are the Victorian Inpatient Minimum Dataset, describing persons
admitted to hospital, and the Victorian Injury Surveillance System, which provides
information on injured persons presenting at Emergency Departments of a sample of
Victorian hospitals.
HOSPITAL ADMISSIONS
The analysis of the Victorian Inpatient Minimum Dataset in the previous chapter
showed that 285 motorcyclists aged under 21 were admitted to Victorian hospitals in
1991 as a result of off-road crashes. Almost 80% of these motorcyclists were aged
under 18 (226/285). There were 1.5 motorcyclists aged under 18 admitted following
an ofT-road crash for every under 18 year old motorcyclist admitted following an 00road crash (see Table 2.20). For 18 to 20 year olds, the ratio is markedly different.
There were only 0.3 off-road motorcyclists hospitalised for every on-road
motorcyclist.
As mentioned in the previous chapter, the injuries sustained in off-road crashes were
generally less severe than those in on-road crashes. Motorcyclists in off-road crashes
spent fewer days in hospital (3.3 vs 8.2), were less likely to die and were less likely to
be transferred to another hospital for further treatment. Despite the lower severity of
off-road crashes, they still accounted for 948 bed-days for under 18 year olds and 334
bed-days for 18 to 20 year olds in 1991.
The patterns of injuries were similar for on- and off-road motorcyclists (see Table
2.22).
PRESENTATIONS TO HOSPITAL EMERGENCY DEPARTMENTS
Injury Surveillance Systems collect information on injured persons presenting to
Emergency Departments at a number of hospitals throughout Australia. An analysis of
presentations resulting from sports and recreation activities in 1989 to 1993 showed
that minibikes or trailbikes (not registered) were a frequent cause of severe injury
Australia-wide. For both children (under 15 years) and adults, minibikes or trailbikes
was not in the most 20 common causes of presentation resulting from sports and
recreation activities. However, the admission rate for minibikes or trailbikes was
second highest overall among sport and recreational injuries for children and third
highest for adults. In Victoria, minbikes were third in admission rate for children and
fifth for adults.
19
More detailed information from the Victorian Injury Surveillance System (VISS) has
been analysed. It is based on data collected from patients who presented with injuries
or poisonings at the Emergency Departments of Royal Children's Hospital (RCH),
Western Hospital (WH), Preston and Northcote Community Hospital (PANCH),
Latrobe Regional Hospital (LRH) and the Royal Melbourne Hospital (RMH). The
ratios of under 18 year olds to 18 to 20 year olds may be biased because the data
collection for adults (i.e. >15 years) was not undertaken throughout the entire period
at all hospitals. For this reason, analyses by time of year have not been reported.
The numbers of injured motorcyclists aged under 21 years old who presented to the
Emergency Departments of VISS hospitals during 1992 and 1993 is summarised in
Table 3.1. The ratio of off-road to on-road injured motorcyclists was greater in the
VISS data than in the hospital admission data (VIMD). In the VISS data there were
3.2 off-road motorcyclists injured for every on-road motorcyclist injured in the
younger group and 06. off-road motorcyclists injured for every on-road motorcyclist in
the older group (1.5: 1 and 0.3: 1 were found in VIMD). This reflects the lower
severity of off-road crashes.
Table 3.1. Numbers of injured motorcyclists presenting to Emergency
Departments at VISS hospitals in 1992 and 1993.
Crash location
437
Total
18
to
20
284
75years
(23.9%)
153
78
123
(100.0%)
3239(76.1%)
14
(100.0%)
45(634%)
(36.6%)
A2e 2rouD
Under 18 years
In
both age groups, about 90% of the injured motorcyclists were males.
Overall, more than half of the crashes occurred on the weekend. On-road crashes of
18 to 20 year olds were more likely to occur midweek than crashes of the other
groups.
Regardless of whether the crash occurred on- or off-road, the older group were injured
more commonly from collisions, and the younger group were injured more commonly
from crashes which occurred as a result ofloss of control (see Table 3.2). This
suggests that the younger group are less able to control the motorcycle, either because
of lack of skill, inadequate weight or reach or some other factor.
20
Table 3.2. Reported events leading to crashes by motorcyclists under 21 years
who presented at a VISS hospital in 1992 and 1993.
13%
40%
10%
7%
12%
16%
11%
41%
8%
67%
Reported event
18-20
<18 years
18-20
years
13%
4% On-road
Off-road
26%
57%
Table 3.3 summarises responses to the question about safety devices worn at the time
of the crash. The category "did not report wearing helmet" is likely to correspond
largely with people who did not wear a helmet but it might also include some riders
who wore a helmet but did not fill in this item on the report form. This means that the
percentages given for "motorcycle helmet worn" in the table may be underestimates.
Given this caveat, older riders were more likely to wear helmets on-road but not offroad (see Table 3.3). It is of concern that about 5% of riders report wearing bicycle
helmets at the time of the crash. Some of this may reflect coding errors but the issue
does require further examination.
Table 3.3. Reported use of helmets in crashes by motorcyclists under 21 years
who presented at a VISS hospital in 1992 and 1993.
48%
36%
43%
58%
3%
0%
62%
6%
4%
36%
2%
2%
Reported use 18-20
18-20
<18 years
years
Other/unknown
Off-road
47%
46%
2%
5% On-road
On-road crashes of young riders were more likely to result in admission or transfer to
hospital for further treatment (46%) than other crashes. This suggests that the injuries
in this group were most severe. This group had the highest proportion of fractures
(see Table 3.4).
The average number of injuries per motorcyclist was also greatest for off-road crashes
of 18-20 year olds (see Table 3.4) but this group had small numbers and so the ratio
may not be reliable.
21
Table 3.4. Injuries incurred by motorcyclists under 21 years who presented at a
VISS hospital in 1992 and 1993. (NB: up to three injuries can be recorded for each
person).
4139
156
<18
22
14
16
0865
50
10
35
334
123
44
29
42
97
06231.40
11
38
18
065injuries OfT-road 1.62
4530
49
18-20
3.09
1.78
130
12
19
16
On-road
Summary 23
of
years
Fractures
Dislocation
VISS:RCH, WH, PANCH, LRH, RMH
NUMBERS OF MOTORCYCLISTS AGED UNDER 21 INJURED IN
VICTORIA
Earlier in this chapter it was shown that estimating the size of the problem of injuries
to young motorcyclists (under 21) is not simple. There is more information available
for on-road crashes than off-road crashes, but even for on-road crashes there is underreporting in the Vic Roads data system (which relies on Police reports). The database
of admissions to hospitals is more complete, but injured motorcyclists cannot be
identified if the coding of type of road user is not available.
While the hospital admissions data (VIMD) gives coverage of the whole of Victoria,
the VISS data for presentations at Emergency Departments covers only a sample of
hospitals. In order to estimate the total number of motorcyclists injured in Victoria
(presenting at Emergency Departments or being admitted to hospital), ratios of number
of motorcyclists presenting to numbers being admitted to hospital were calculated (see
Table 3.5).
22
Table 3.5. Numbers of injured motorcyclists presenting to Emergency
Departments and numbers admitted at VISS hospitals in 1992 and 1993. Ratio
marked * is based on small numbers and therefore may not be reliable.
Presentations
78
75
2.69153
29
35
64
984
45
75
284
239
2.14
5*
Ratios
3.19
Admissions
vrs
< 18 yrs
If the ratios of presentations to admissions which were found in the VISS hospitals are
representative of those found in Victorian hospitals as a whole, then the ratios can be
applied to the statewide number of admissions from the VIMD to provide an estimate
of total numbers of presentations throughout Victoria. These calculations are shown
in Table 3.6. It should be noted that the ratios are calculated from 1992 and 1993
presentations and applied to 1991 admissions data.
Based on the above calculations and assumptions, it is estimated that motorcycle
injuries to riders and passengers aged under 21 would result in 1868 presentations to
Emergency Departments in Victorian hospitals per year, or 1236 presentations not
resulting in admission.
Table 3.6. Calculation of the total numbers of young motorcyclists (aged under
21) presenting to and being admitted to Victorian hospitals per year. Ratio
marked * is based on small numbers and therefore may not be reliable.
664
319
1Admissions
226
149
98 257
2.14
494
336
236
572
3.19
170
347
285
59
375no.
5*
2.69
720
534
admissions
Estimated
Ratios
oftono.
295
Estimated
presentations
presentations
< 18 yrs
853
1039
829admission
1015
in
not
resulting
23
CHAPTER 4:
FACTORS CONTRIBUTING TO CRASH OCCURRENCE AND INJURY
SEVERITY
Research into motorcycle crashes has identified a number of factors contributing to
crash occurrence and injury severity. These include rider and passenger factors (sex,
age, inexperience, licence status, alcohol), crash factors (time of day, wet weather,
curves, road environment) and vehicle factors (type of motorcycle, engine capacity,
mass, mechanical defects). While these factors are treated separately in the sections
which follow, some of them are strongly correlated and therefore it is difficult to
separate their effects. Taylor and Lockwood (1990) found strong correlations
between age and experience, car driving and age, engine capacity and age, and distance
driven and engine capacity, for example. Thus, the effects of each factor differ
depending on which other factors are taken into consideration.
Most of the research has addressed on-road crashes. Those studies are summarised
here with information on off-road crashes added where this is available.
RIDER AND PASSENGER FACTORS
Sex
Most injured motorcyclists are male. Females comprised only 2% of motorcycle riders
killed and 5% of riders injured in on-road crashes reported to the Police in Victoria in
1988-90 (VIC ROADS, 1992). In their study of motorcycle injuries in New Zealand,
Begg et al. (1993) found that females comprised about 9% of riders hospitalised, both
on- and off-road. In a British study, Avery (1979) found that the ratio of males to
females among motorcycle riders aged 15 to 29 injured in on-road crashes was 4.6: 1.
This probably reflects the fact that the great majority of (injured plus noninjured)
motorcyclists are male. However, in a US study, Kraus, Riggins and Franti (1975a)
found that female riders were more frequently injured as a result of an on-road
motorcycle collision than was expected on the basis of their representation among
motorcycle riders.
Among crash-involved riders in Victoria, novice riders were more likely to be female
than were more experienced riders and females were less likely to have a positive
blood alcohol concentration (Cameron, 1992).
In general, females comprise a greater proportion of injured pillion passengers than
motorcycle riders. Begg et al. (1993) report that females comprised a larger
proportion of killed pillion passengers (45%) than riders (5%). There were too few
females killed in off-road crashes to be able to determine whether this pattern was the
same for on- and off-road crashes. When hospital admissions were considered,
females comprised 9% of riders but 40% of pillion passengers. Similarly, Kraus et al
(1975a) found that females accounted for 8.7% of injured riders but 47% of injured
pillion passsengers. It is likely, but not known, that this difference represents greater
24
exposure
males.
as a pillion passenger
(relative to as a rider) for females compared with
Age
Most motorcyclists injured in on-road crashes are young. Of the 196 motorcyclists
killed in on-road crashes in Australia in 1991 (FORS, 1992), 13 (6.6%) were aged 16
years or less. A further 47 (24.0%) were aged between 17 and 20 years. Half of the
motorcycle riders killed in on-road crashes in the USA are aged 15-24 (Rivara, 1988).
Some of this overrepresentation
of younger persons in on-road motorcycle crashes can
be accounted for by the greater popularity of motorcycle riding among younger,
compared with older, adults. For example, the National Travel Survey (INTST AT,
1988) estimated that 20 year olds made an average of 0.16 motorcycle trips per day
per person, compared to 0.04 trips for 30-59 year aIds and 0.01 for persons aged 60
years and over.
Even after the greater popularity of motorcycling among younger people is controlled
for, an overrepresentation
of young motorcyclists among those injured and killed
remains. For on-road crashes, Kraus et al (1975a) found that almost eight times as
many injured male riders as compared with noninjured male riders were less than 16
years of age.
Age has been shown to affect both the risk of being involved in a crash and the severity
of resulting injuries. The crash risk of young children is increased because they have
incompletely developed sensory-motor coordination, difficulty in reaching controls and
a lack of strength to control the bike.
Jackson and Baderman (1984) claimed that children aged 6 to 12 are unable to
coordinate all four limbs in the operation of accelerator, clutch, brakes and gears
simultaneously with processing visual information with regard to speed and distance,
and therefore should not be permitted to ride motorcycles.
Short stature and light weights have been found to be overrepresented among injured
male riders compared with noninjured male riders (Kraus et aI, 1975a). In addition, it
was found that short riders «173 cm) were at high risk when riding motorcycles with
capacities greater than 250 cc. It may be that short riders are unable to easily reach
and manipulate the various controls located on the handlebars or at the base of the
motorcycle frame.
A number of British studies of children involved in "scrambling" (motocross) have
commented that children with immature skeletons are more prone to injury (Avery,
1988; Sherman and McKinnon, 1984) and that the severity of injuries sustained by
children is greater than for adults (Wilson-MacDonald
et aI., 1987).
It is unclear whether injury severity is less for younger, compared to older, adults. An
Australia Post study suggested that the consequences of injuries to young adults might
be less than to older adults (Australia Post, 1988). Postmen (37% of whom were
motorcycle riders) aged under 25 years were over-represented
in lost time injuries,
25
they were not over-represented in number oflost work days. The average number of
lost work days was greatest for riders aged over 35 years. The authors conclude that
the older group appear to take longer to recover from injuries. Confounding factors
such as differing levels of motivation to return to work might account for part of this
difference, though.
Inexperience
Another factor underlying the relationship between young age and crash involvement is
that younger riders are generally less experienced. All of the studies which address this
issue have examined on-road crashes only.
Victorian analyses (VIC ROADS, 1990, cited by Cameron, 1992) compared the crash
involvement rate of holders oflearner, probationary and standard motorcycle licences.
Holders of learner permits were more than 3.5 times more likely to be involved in a
crash than were standard permit holders. Motorcyclists holding probationary licences
were twice as likely to be involved in a crash as holders of standard permits. Since
most learner permit and probationary licence holders were young, it is unclear whether
this difference is one of age or experience.
Wong, Lee, Phoon, Yiu, Fung and McLean (1990) studied the effect of experience on
crash involvement of motorcycle riders in Singapore. They calculated the odds ratios
for riders with 1-4, 5-9 and over 10 years experience as being 0.6,0.5 and 0.36
respectively. Wong, Phoon, Lee, Yiu, Fung and Smith (1990) reported that
inexperienced motorcyclists tended to be more severely injured than more experienced
riders.
The findings of Kraus et al (1975a) regarding the role of inexperience in crashes are
not as straightforward (see Table 4.1). Riders were under-represented in crashes in the
first month of riding (20.5% versus 37.9%) but over-represented during the rest of the
first year of riding. One might speculate that the amount of riding (and thus exposure
to crash risk) is low in the first month.
Table 4.1. Percentage distribution of injured and not injured male motorcycle
riders according to length of previous motorcycling experience. Sacramento
County, California, 1970. (from Kraus et aI., 1975)
20.5
25.5
25.7
28.3
Not injured riders (%
37.9
10.1
15.0
37.0
Degree of experience also tends to affect the type of crash in which riders are involved.
Two Victorian studies have compared crashes involving novice motorcyclists and
26
those involving experienced motorcyclists (Bui, 1992; Cameron, 1992). They defined
novice riders as holders of learner or probationary licences and experienced riders as
holders of a standard licence.
Both studies demonstrated that novice motorcyclists were more likely to be involved in
multiple vehicle crashes (compared to single vehicle crashes) than more experienced
riders (as did a US study by McKnight and Robinson, reported by Friedman, 1991).
Many of these crashes occur in areas with low speed zones and at Give Way signs
suggesting that the greater involvement of novice riders in multi-vehicle crashes may
reflect greater city driving where traffic densities are higher.
Other characteristics of novice motorcyclists noted by Cameron (1992) were
overinvolvement in crashes:
•
•
•
•
in January and March to August
at night
at those times of the week in which alcohol involvement in crashes is high
in dark conditions with street lights
Novice motorcyclists were significantly under-involved in wet road crashes compared
to standard licence riders.
An analysis of serious motorcycle crashes in Queensland revealed two distinct types of
crashes involving young motorcyclists (aged 17-21 years). Lake (1992) suggests that
the "single vehicle, hit obstacle" crashes reflect loss of control by inexperienced riders
whereas the "multi-vehicle, head-on" crashes may reflect aggressive overtaking or
riding on the part of the rider.
Experience on the particular motorcycle
A study was conducted which compared the crash rate of borrowers of motorcycles
with that of owners in an attempt to determine the effect of experience with a
particular motorcycle on crash risk (Barry, 1970). It found that riders of borrowed
bikes were 9 times more likely to crash than riders who owned their bikes. Twovehicle crashes and collisions due to loss of control while turning were particularly
common among borrowers. Riding at night was particularly dangerous on borrowed
motorcycles.
Barry's study and another by Hurt (1979) suggest that overall motorcycling experience
needs to be supplemented by experience with the particular type of motorcycle for safe
operation to result. Hurt found that more than half of the crash-involved riders had
less than five months experience with the crash motorcycles, although their total onroad riding experience was three years.
27
Licence status
Many motorcycle riders involved in on-road crashes are not licensed to ride a
motorcycle. Kraus, Anderson, Zador, Williams, Arzemanian, Weichang and Salatka
(1991) cited earlier findings that 46% of motorcycle riders involved in crashes in Los
Angeles and 43% of motorcyclists killed on-road in the US were unlicensed. Kraus et
al (1991) went on to show that unlicensed riding was more common among those
involved in crashes than those not involved in crashes. They found that 67% of riders
involved in crashes were unlicensed, compared to 43% of motorcyclists not involved in
crashes. This pattern applied across all age groups. Crash-involved riders who were
riding borrowed motorcycles were likely to be unlicensed, especially if the owner of
the motorcycle was unlicensed.
Alcohol
Motorcycle riding demands greater co-ordination, balance and concentration than that
required to drive a car. It is not surprising therefore that the effects of alcohol
consumption on motorcycle riding are more drastic than on car driving. Mayhew and
Simpson (cited in Friedman, 1991) calculated that alcohol increases the likelihood of a
crash occurring by a factor of nine.
Findings about the relative involvement of alcohol in motorcycle and car crashes are
mixed. In Queensland in 1990, 33% oftested dead motorcyclists exceeded 0.05%
BAC compared with only 29% of car drivers (Queensland Transport, 1991). A
number of US studies show that crashed motorcyclists are more likely to have
consumed alcohol than crashed car drivers (Soderstrom, Dischinger, Shiu and
Soderstrom, 1993). For example, the rider had a measurable level of alcohol in 53%
ofU.S. motorcycle related deaths in 1988, compared to 40% in all traffic fatalities
(Friedman, 1991).
However, some Australian data suggest that fewer motorcyclists crash with positive
blood alcohol content (BAC's) than car drivers. In 1991,24.4% ofmotorcyc1e riders
killed in crashes in Victoria for whom BAC was known exceeded 0.05% BAC,
compared with 29.4% of drivers (VIC ROADS, 1992b).
The role of alcohol appears to increase with crash severity. In Victoria in 1988-90,
BAC was greater than 0.05% for 16% of motorcycle riders injured in casualty crashes
but 32% of riders killed (VIC ROADS, 1992a).
Victorian data show that young riders are no more likely to have a positive BAC than
older riders (see Table 4.2). Riders injured in casualty crashes were 4.5 times more
likely to die if they had a BAC greater than 0.15%.
28
Table 4.2. Age and distribution of blood alcohol concentrations for motorcycle
riders injured in Police-reported casualty crashes in Victoria, 1988-90. Source:
VIC ROADS (1992a)
A~e
6%
10%
3%
6%
9%
0.051
Over
Zero
to85%
84%
87%
0.15
to
0.15
0.05
Overseas research suggests that alcohol consumption also acts to increase injury
severity by reducing the likelihood that a helmet will be worn. In a Californian study,
Romano and McLoughlin (1991) found that fatally injured motorcycle riders with
detectable BAC's were less likely to have been wearing a helmet than sober riders.
Helmet wearing rates were lower among intoxicated (11%) than sober (38%)
motorcycle riders admitted to a Seattle trauma centre (Luna, Maier, Sowder, Copass
and Oreskovich, 1984). Overall, serious head injuries were more common among
intoxicated than sober riders (74% vs 39%). For the sample as a whole, the mortality
rate was four times greater for intoxicated than sober riders (23% vs 6%).
There is some evidence that crashes of alcohol-impaired riders differ from those of
nonimpaired riders. Luna et al. (1984) found that intoxicated riders were more often
judged to be at fault in the crash (66% vs 44%). Soderstrom et al. (1994) found the
same pattern. In addition they found that intoxicated riders were more likely to have
preinjury convictions than nonintoxicated riders.
In addition, the frequency of serious head injuries (AIS>=3) among unhelmeted
intoxicated riders was significantly greater than among unhelmeted sober riders (74%
vs 48%), suggesting that the types of crashes of intoxicated riders may have been such
as to produce more severe injury (Luna et aI., 1984).
Soderstrom et al. (1993) found that motorcyclists injured in single vehicle crashes were
more likely to have used alcohol than those in multiple vehicle crashes (68.1 % vs
42.7%).
Alcohol consumption among pillion passengers has been identified as a problem
(Larsen and Hardt-Madsen, 1987). In one county in Denmark, 6 of 10 pillion
passengers killed had a BAC>.08. In each case the rider was also under the influence.
CRASH FACTORS
The crash factors discussed here relate to the time of day that the crash occurred and
the characteristics of the crash location (wet weather, curves, environmental hazards).
Little information is available regarding the involvement of these crash factors in offroad crashes. Some material relating to agricultural bikes and all terrain vehicles has
been reported, however.
29
Time of day
Analyses of motorcycle crashes reported to Police in Victoria show that the majority of
weekday motorcycle casualty crashes occur during the morning and evening peak hour
periods (see Figure 4.1). In contrast, the majority of weekend crashes occur in the
afternoon and early evening (see Figure 4.2). This does not allow any conclusions to
be drawn about the risks of riding at any particular time of the day, since the data may
merely reflect motorcycle usage patterns.
35
% of crashes
15
10
20
0
5
30
25
Midnight3am
3am-6am
6am-9am
9am-noon
noon-3pm
3pm-6pm
6pm-9pm
9pmmidnight
Figure 4.1. Time of day pattern for weekday motorcycle casualty crashes.
Source: VIC ROADS, 1992a
35
% of crashes
15
5
10
20
30
0
25
Midnight3am
3am-6am
6am-9am
9am-noon
noon-3pm
3pm-6pm
6pm-9pm
Figure 4.2. Time of day pattern for weekend motorcycle casualty crashes.
Source: VIC ROADS, 1992a
9pmmidnight
30
Wet weather
Motorcycle riding in wet weather is considered by many to be dangerous, because of
the reduction in traction that results from the road being wet. However, there is little
evidence of a large crash problem in wet weather. Hurt, Ouellet and Thorn (1981,
cited in Bui, 1992) found that only 12.2% of crashes occurred in wet weather which
was consistent with their exposure surveys showing that motorcyclists preferred not to
ride in wet weather.
Preferring not to ride in wet weather may underlie the seemingly counter-intuitive
finding (Cameron, 1992) that novice motorcyclists are under-involved in wet
conditions compared with standard licence motorcyclists.
The combination of wet conditions, darkness and high speeds appears to be dangerous.
Bui (1992) found that injured riders on curves were over-represented on rainy days in
speed zones above 75 km/h. Riders in dark conditions were over-represented
(compared with riders crashing in daylight) on rainy days and on wet roads.
Curves
Curves are dangerous for motorcyclists. Victorian analyses of on-road crashes have
shown that, compared to other motor vehicles, motorcycles are more than twice as
likely to be involved in a crash on a curve, rather than a straight section of road (VIC
ROADS, 1992a). The analyses also showed that motorcyclists injured in casualty
crashes are twice as likely to die if the crash occurs on a curve. The latter finding may
reflect the greater frequency of curves on rural roads, where speeds are higher.
Environmental hazards
Environmental hazards are features of the road or track which present hazards to
motorcycle control and/or injury hazards.
Ouellet (1982) found that motorcycle control hazards accounted for less than 3% of
the on-road crashes he studied but that the environment was a major source of injuries.
Environmental features which were dangerous included dividers, overpasses, poles and
fences. Motorcyclists may collide with these features or other drivers have their
visibility blocked by them. Fabre, Griffith, Hull and Towers (1993) noted that riders
comment that roundabouts are often hazardous because of negative camber on the
roundabout path and foreign objects such as grease and soil deposits. Motorcyclists
often express concern about the dangers of slipping on tramlines, particularly in the
wet. Little crash data is available to evaluate the magnitude of this problem.
Injury in single-vehicle crashes may result from a fall. An Australia Post study of
motorcycle crashes sustained by postmen concluded that
The majority of falls were caused by the wheels of the motorcycle slipping on loose or
slippery surfaces, eg oil slicks on the road, grass, wet footpaths and driveways, gravel
and sand. They also occurred while the rider was cornering or taking evasive action,
from potholes and road protusions. (1988, p.21)
31
For agbike and all terrain vehicles, environmental hazards which have been identified as
causing injuries have included:
•
•
•
holes, bumps, rocks and gravel resulting in loss of control
collision with logs, rocks, pipes etc.
animals
•
fences (Agricultural Health Unit, 1993)
VEHICLE FACTORS
Type of motorcycle
Motorcycles vary according to their size and intended use. Categories of motorcycle
include road, scooter, trail, enduro, motocross, agbike (agricultural motorcycle) and
moped.
A survey of motorcycles on Sydney roads in 1986 showed that 85.7% were road bikes,
11.0% were trail bikes and 3.2% were step-through style (scooter) (Johansen, 1987).
On-road braking distance is generally longer for trailbikes than for those motorcycles
of the same engine capacity intended for street use (Kraus et aI., 1975a).
Unfortunately, there is little known about the use and risks of on-road use of trail
bikes.
Rogerson et al (1992) found that crash risk for novice riders was higher for
motorcycles classed as 'Sports Racer'. In a study of motorcycles in fatal crashes in Los
Angeles, Arzemanian, Salatka, Anderson and Kraus (1993) concluded that racingdesign motorcycles were involved in more crashes than street-design vehicles, based on
numbers registered. Rogerson et al note that more information is needed on the travel
patterns of different classes of motorcycle before it can be concluded that the class of
motorcycle plays a real role in increasing crash risk. Fabre et al (1993) note that it is
unlikely that racing style motorcycles are inherently injurious but that the riders of
these vehicles may be greater risk takers.
The sections which follow describe specialised studies of the crash involvement of
mopeds and agbikes.
Mopeds
Mopeds are motorised bicycles which are capable of being pedaled as well as being
equipped with a helper motor. In many countries mopeds are legally considered a type
of bicycle and so may not require registration and riders may not require a licence.
This results in lack of training and, often, in use by very young riders.
A study at a children's hospital in Ohio (Westman and Morrow, 1984) found that
children with moped injuries were 12.8 years old on average (licensing age 14 years).
Fifty percent of the patients had orthopaedic injuries and 46% had neurologic injuries.
32
Most children were not wearing helmets. Moped injuries were more severe than
bicycle injuries.
The ambivalent status of the moped as part bicycle and part motor vehicle again may
have caused problems according to a Swedish study (Matzsch and Karlsson, 1986). In
Sweden mopeds are not registered and riders do not require a driving licence or any
formal training. Most of the moped riders involved in crashes at intersections had
failed to give way (78%), whereas only a small proportion of motorcyclists had done
so (11 %). In addition, the legal status of mopeds resulted in little information about
the numbers of mopeds owned and only about a third of moped crashes being reported
to police (somewhat like bicycle crashes). Tracing hospitalisations resulting from
moped injuries is made more difficult because there is no separate ICD-9 E-code for
moped-related injuries.
Compared with motorcyclists, mopedists tend to have more head injuries and fewer
injuries to the upper extremities (Matzsch and Karlsson, 1986; Suren and Otte, 1980
cited by Matzsch and Karlsson). Suren and Otte considered that the difference in
patterns of injuries related to differences in collision dynamics "while moped accident
victims, due to the lesser speed, are thrown head first onto the car and are injured at
the moment of first impact, motorcyclists are thrown over the car at the collision and
sustain many of their injuries at the second impact with the road surface" (Matzsch and
Karlsson, 1986, p.542). Lower helmet wearing rates among moped riders are likely to
contribute to the prevalence of head injuries, also.
A Dutch study (Wegman, 1992) reported that the average risk (expressed as fatalities
per kilometre travelled) for moped riders was about 12 times greater than for car
passengers, 5 times greater than for bicyclists, 1.5 times greater than for pedestrians
and about the same as for motorcycle riders. The risk decreased with rider age. The
lack of a requirement to wear a helmet with the low-speed moped was identified as a
contributor to injuries.
Mopeds are less popular in Australia than in some other countries because the
legislation in most states is as strict for mopeds as it is for motorcycles. One
evaluation was conducted in Western Australia after legislation changed to enable 16
year olds to obtain a licence to ride a moped and to allow holders of a Class A licence
to ride a moped (Jackes, 1984). The definition of a moped in the legislation contained
three criteria:
•
•
•
maximum engine capacity 50 ml
maximum speed 60 km/h
capable of being propelled as a pedal cycle
The study compared the riding habits of moped owners and owners of small
motorcycles (capacity less than 50 ml). Mopeds were more likely to be owned by
males and by younger persons, more likely to use headlights during daytime, than
were small motorcycles. Distance ridden was similar for the two vehicle types. Most
respondents did not ride at night because they considered it to be too dangerous. In
general, riders and patterns of use of mopeds were similar to riders and patterns of use
of motorcycles of similar capacity.
33
Agbikes
Agbikes are two-, three- or four-wheeled motorcycles which are used on farms for
work and recreational activities. They are cheaper than trail bikes but they have poorer
braking, steering and suspensions. A special gearbox is fitted to agbikes to allow low
speed work (van Muiswinkel, 1994) and consequently they have a lower maximum
speed than most other motorcycles (about 50 km/h). They are often fitted with racks
to carry goods, leading to poorer stability. Generally, agbikes have an engine capacity
of between 100 and 200 cubic centimetres.
A study by the Australian Agricultural Health Unit (Ag Health, 1993, cited in van
Muiswinkel, 1994) showed that agbikes are involved in about 10% of all rural injuries
presenting to Accident and Emergency Departments of rural hospitals (11.6% Coastal
Area of NSW, 8.2% North West Plains of NSW, 10.5% Latrobe Valley). About half
of the injured persons were aged 10 to 24 years.
In an earlier study, the National Injury Surveillance Unit provided information about
528 injuries involving trail bikes, ATVs and motorcycles (less than 250cc) which
occurred on farms, fields and paddocks occurring across a broader area (Ag Health,
1993). Compared to the farm injury sample, these injuries more often occurred during
leisure activities (rather than work) close to cities and towns. These injured persons
were younger on average (mostly 10 to 19), were more likely to sustain fractures and
were more likely to have upper extremity injuries. More than 40% of this group were
wearing helmets, compared with 25% of the farm injury sample. However, there were
surprisingly few head injuries to members of the farm injury sample.
All Terrain Vehicles (ATVs)
The current study focusses on two-wheeled vehicles and thus excludes ATV s. ATV s
have three or four low pressure, high flotation tyres and are designed for off-road use
in a variety of terrains. Generally, they weigh less than 275 kg and are of four types:
general use, sports, youth and utility (agricultural) (Wright, Carpenter, Johnson and
Nelson, 1991, cited by van Muiswinkel, 1994). In the US, ATVs are primarily used as
recreational vehicles whereas in Australia and New Zealand their primary used is for
farming (van Muiswinkel, 1994).
34
Engine Capacity
There is a public perception that motorcycles with larger engine capacities are more
involved in crashes, perhaps because they are thought to travel faster. While early
evidence supported this perception, the picture is now less clear.
Kraus et al (1975a) found that for young riders, the risk of injury was higher on bikes
of 501cc's or larger. For riders over 20 years old, there was additional risk (beyond
that associated with age) for drivers of motorcycles of 251-500cc's. In a more recent
study, Lynn's (1990) analysis of self-reported data found that engine size was inversely
correlated with crash frequency. In addition, riders of smaller motorcycles rode less
distance per year, resulting in an increased crash rate per mile compared with larger
motorcycles.
In a review of the relationship between crash liability and engine capacity, Mayhew and
Simpson (1989, cited in Langley et al., 1993) concluded that "the relationship between
motorcycle engine size/power and collision involvement remains elusive, largely as a
result of difficulties in obtaining adequate measures of exposure. Nevertheless the
weight of the evidence does not support the contention that size/power is a risk factor
for collision involvement".
Engine characteristics other than capacity may influence crash risk: Rogerson (1991)
found that motorcycles with 2-stroke engines were over-represented compared with 4stroke engines.
Mass of motorcycle
It is generally accepted that the severity of a crash increases with kinetic energy which,
for a given speed, is proportional to the combined mass of the motorcycle plus the
rider. Thus one would expect that heavier motorcycles would be involved in more
severe crashes. There are fewer studies of the effect of mass than of engine capacity
although there is probably a strong correlation between the two characteristics.
Surprisingly, Clark and Morton (1971) refer to earlier studies which suggest that there
is an overinvolvement of lightweight motorcycles in injury-causing crashes. It may be
that the power to weight ratios of these lighter machines are higher, thus allowing
greater acceleration.
It is likely that a heavier motorcycle requires greater physical strength to control.
Wilson-MacDonald and Sherman (1987) propose that children, who contribute a
smaller part of the total rider plus bike mass, and are weaker and therefore less able to
control a heavy bike in the event of a crash, may sustain more serious injuries than
adults.
Mechanical
defects
Poor motorcycle maintenance was cited as a factor in falls by one study (Australia
Post, 1988). Defects which were considered to have contributed to the fall included
worn tyres, punctures, brakes, wheels, throttle and suspension problems. Other
35
mechanical problems reported by Australia Post staff included underinflated tyres or
tyres with tread type inappropriate to the road surface, missing mirrors, damaged
spokes and chains and inadequate battery and charging system resulting in dim
headlights, stoplights and turn indicators. The report recommends daily 10-minute
roadworthiness checks of the motorcycle, weekly inspections and servicing each two
months.
SUMMARY
In summary, the factors contributing to crash occurrence and injury severity have been
identified as:
• •
•• ..
curves
young
a borrowed
motorcycle
being
poor
consumption
riding
slippery
motorcycle
unlicensed
male
during
surfaces
of
peak
alcohol
maintenance
hours
mexpenence
The roles of mass of the motorcycle and engine capacity are unclear.
36
CHAPTER 5:
INJURIES RESULTING FROM MOTORCYCLE CRASHES
INJURY PATTERNS
Studies of injury patterns have been conducted at a number of threshold severity levels:
surveys of all motorcyclists (Reeder et al., 1992), attendance at hospital emergency
department (e.g. Haddad, Echave, Brown, Scott and Thompson, 1976; WilsonMacDonald, Sherman and Mackinnon, 1987), admission to a general hospital (e.g.
Begg et al., 1993; Wong et al., 1989) and admission to specialised trauma centres (e.g.
Gissane, Bull and Roberts, 1970; Krane, Ricci, Sweeney and Deshmukh, 1988). It is
to be expected that injury patterns will vary among these studies. Studies conducted at
trauma centres might be expected to include more patients with severe head injuries,
for example.
Very often there are multiple injuries. King (1979) found that half of his sample of
motorcyclists with upper limb injuries also had lower limb injuries. He cautioned that
"minor injuries can easily be overlooked, and the severity of some major injuries can be
underestimated at the initial assessment" (p.210).
Lower extremities
Definite patterns emerge with respect to the type of injuries sustained during
motorcycle crashes and the body part injured. The extremities, predominantly the legs,
are the most common site of injury (Had dad, Echave, Brown, Scott and Thompson,
1976; Wong et al., 1989). A review of injuries to child motorcyclists admitted to a
Canadian hospital showed 34.7% lower extremity and 22.7% upper extremity injuries
(Y ong-Hing, Howlett and Owen, 1984, cited by van Muiswinkel, 1994).
Fractures of the femur and tibia are common, and these are often compound fractures
(King, 1979). There is evidence that the knee is the predominant area for minor and
moderate injuries, but the shin and thigh are more commonly involved in the more
severe injuries (Craig, Sleet and Wood, 1983). Leg injuries sometimes result in
amputation (4/57 cases, King, 1979). King noted that a leg injury from a motor cycle
crash may be life-threatening by producing severe blood loss, fat embolism or gas
gangrene. Craig, Sleet and Wood (1983) concluded that "although injuries to the
lower limbs rarely result in death, they are a major cause of morbidity, prolonged
hospital stay and difficult rehabilitation" (p.163).
According to MacKenzie, Siegel, Shapiro, Moody and Smith (1988, cited by Begg et
al., 1993), injuries to the extremities are the most costly form of moderately severe
trauma. One year after discharge from hospital 22% of patients who had suffered an
extremity injury of minor severity and 25% of patients who had suffered an extremity
injury of moderate severity were still convalescing. In comparison, only 6% and 14%
of those with minor and major head injuries, respectively, were still convalescing.
Since motorcyclists have a high incidence of injury to the lower extremity, then the
cost of motorcycling injuries would be relatively high.
37
Studies have concluded that there is no significant difference between the left and right
sides of the body in regard to occurrence of injuries, with the exception of the heel flap
injuries which occur mainly on the right side because the wheel is exposed on that side
(Wilson-MacDonald, Sherman and Mackinnon, 1987, Das De and Pho, 1982). Craig et
al. (1983) noted that the total number of right and left-sided injuries were nearly equal,
but slightly more minor injuries occurred to the left side.
Head
The frequency and severity of head injuries differs among countries according to the
rate of helmet use. This review focusses on studies in countries (like Australia) where
helmet use is relatively high.
After the extremities, the head is the next most common body part injured (Haddad et
aI., 1976; Wong et aI., 1989), with the severity of injuries ranging from lacerations and
contusions to intracranial haemorrages and major maxillofacial trauma (Dillihunt,
Maltby and Drake, 1966). Begg, Langley and Reeder (1993) found that the leading
injuries to hospitalised motorcyclists in New Zealand were to the lower limb (43%,
typically fractures) and head (24%).
Spinal injuries
A study of the long term effects of road crashes noted that spinal injuries are more
commonly sustained by motorcyclists and pedestrians than other road users (Oxley and
Fildes, 1993). Severe spine and spinal cord injuries were associated with large
hospital, medical, para-medical and rehabilitation costs and long-term impairment.
Burns
Pegg and Mayze (1980) report a study of 19 patients admitted to Royal Brisbane
Hospital with burns resulting from motorcycle crashes. Ten patients were burnt by
contact with the exhaust pipe or other hot metal surfaces, six were burnt by flames
from petrol fires and three were burnt by road friction. The lower limbs were most
often burnt followed by upper limbs, head, chest and abdomen. The right leg was
more often burnt than the left leg, although both arms were equally likely to be burnt.
Exhaust burns on the right hand side may have reflected the tendency for single
exhaust motorcycles to have the exhaust pipe on the right hand side. In general,
exhaust pipe burns involved only one body region whereas petrol fires and friction
burns mostly affected multiple body regions.
Collision versus non collision traffic crashes
Several studies have reported that injuries resulting from collisions are more severe
than those resulting from noncollision crashes (AIlan et aI., 1988; Langley et aI., 1993;
Australia Post, 1988).
Langley et al. (1993) found that collision crashes generally produced more severe
injuries than noncollision crashes, resulting in higher AIS scores and longer stays in
38
hospital. Sixty-five percent of deaths were attributable to crashes involving other
moving motor vehicles.
Similarly, Australia Post (1988) data showed that collisions (with motor vehicles or
other objects) resulted in higher average compensation and medical payments per rider
than falls (in which no other vehicle was involved). The pattern of injuries was similar
for the two types of crashes, however, most riders sustained multiple injuries (41%
falls, 44% collisions), followed by lower limb (31% and 35%, respectively), upper limb
(17% and 12%) and trunk injuries (11% and 7%).
On- versus off-road injuries
Few studies have compared the injuries resulting from on- and off-road crashes. In a
British study, Wilson-MacDonald, Sherman and Mackinnon (1987) examined the
injuries of 126 patients involved in off-road motorcycle crashes and compared these
with all motorcyclists who had attended the accident department of their hospital. Of
155 injuries, there were 55 lower limb injuries (21 of the knee) and 39 upper limb
injuries. Right-sided injuries were more common among riders involved in off-road
(scrambling) crashes. Eight riders sustained 14 stable compression fractures of the
thoracic spine. Eleven riders sustained crushing injuries of the foot. In general, the
injuries in children were more severe than those in adults.
Begg, Langley and Reeder (1993) found that traffic crashes tended to result in internal
injury more often than non-traffic crashes (6% vs 1%) whereas non-traffic crashes
resulted in more head injury (23% vs 27%). This is in accord with the group's earlier
finding that helmets were worn by 93% of on-road motorcyclists but only 63% of offroad motorcyclists (Reeder, Chalmers, Langley and Begg, 1992). Injuries from traffic
crashes were generally more severe than those from non-traffic crashes: 29% of traffic
crashes resulted in injury of AIS-3 or higher but only 19% of non-traffic crashes. Begg
et al attribute this to the generally lower speeds in off-road motorcycling.
A study of farming motorcycle injuries (Ag Health, 1993, reported by van Muiswinkel,
1994) found different patterns of injuries according to the geographical area in which
data were collected. In the Latrobe Valley, upper extremity injuries were most
frequent. However in the North West Plains of NSW lower extremity injuries were
more frequent than upper extremity injuries. In the coastal area of NSW the two parts
of the body were about equally involved in injury.
Fractures were most common in the Latrobe Valley whereas cuts and lacerations were
more frequent in the other two areas. Farm motorcycle injuries reporting to the
Bloomfield Hospital in Orange, NSW (Robson, 1993, cited in van Muiswinkel, 1994),
showed lower extremity injuries to be most common and fractures of a lower limb
were the most common type of injury.
Allan, Reid and Saboe (1988) studied off-road crashes involving three-wheel ATV s,
snowmobiles, dirtbikes and other vehicles which resulted in treatment at a tertiary care
hospital or in death. Twenty-two persons were injured in dirtbike crashes. Twenty of
the injured were male, the average age was 19.8 years and 41% of the sample were
aged under 16 years. The injuries sustained by these riders are summarised in Table
5. 1. Musculoskeletal injuries were the most common. Riders were hospitalised for an
39
average of6.5 days. The mechanism of injury was falling off in 16 cases but the four
collisions resulted in more severe injuries.
Table 5.1. Sites and severities of injuries sustained in dirtbike crashes. From
Allan et at. (1988)
3.00
Site of injury
2.00
(0)
2.86
1.80
2.00
(5)
14
(64)
Injury
Cases
severity
45o1(percent)
(I
(23)
8)(average
of Injury
Total Abbreviated
Scale)
Injuries to killed motorcyclists
Analysis of the 1988 Federal Office of Road Safety Fatality File (Attewell and Dowse,
1992) found that the causes of death were similar for motorcyclist and motor vehicle
occupant fatalities. Multiple injuries were present for 38% of motorcyclists (31 %
vehicle occupants), head injuries for 38% of motorcyclists (36% vehicle occupants)
and chest injuries for 12% of motorcyclists (13% vehicle occupants). There were
more head and lower extremity injuries amongst motorcyclists, however (head: 75% vs
68%, lower extremity 33% vs 27%).
COSTS OF INJURIES
The economic costs of motorcycle crashes include:
•
Person costs: lost productivity (present/future), losses to others, medical costs,
inpatient and outpatient costs, funeral allowance, rehabilitation, ambulance, pain
and suffering and other
•
Vehicle repair costs: towing costs, repair costs, total loss and payment for third
party repairs
•
Incident costs: delay to other traffic, vehicle insurance administration, crash
investigation and reporting, legal costs and alternate transport but does not include
property damage costs. (Andreassen, 1992).
40
general, motorcycle crashes result in injuries to the motorcyclist alone, so most
studies have focussed on the costs of these injuries. Motorcycle crashes in which
pedestrians or other persons are injured are uncommon.
In
Very little information is available about the cost of injuries resulting from off road
crashes. The New Zealand study cited earlier (Begg et aI., 1993) showed that on-road
crashes accounted for 92% of the total inpatient cost for all motorcycle crashes ($13
million).
Andreassen (1992) has estimated costs per motorcycle crash (not per motorcyclist
injured) for crashes involving motorcyclists which were reported to Police in Victoria
in 1987 and 1988. The under-reporting of on-road motorcycle crashes means that
these reported crashes are a subset of the crashes that occurred during that period
which is likely to be biassed toward more serious crashes. The person costs of a
motorcycle crash were about $65,000 (but $86,000 for a two-vehicle crash in a rural
area). The total person costs for all reported motorcycle crashes (one and two vehicle
falling into specified crash groups) in Victoria in 1987 and 1988 was estimated as $281
million. This is much greater than the total vehicle costs which was estimated as
between $10.8 million and $12.5 million.
addition, Andreassen presented person costs for motorcycle crashes disaggregated
by crash types and urban or rural occurrence. Person costs were highest for single
vehicle crashes where the motorcycle left the carriageway on the straight and hit an
object, for similar crashes on a curve, and for two vehicle head-on crashes. Crash
types resulting in the lowest person costs were single vehicle crashes where the
motorcycle went out of control on a straight road in an urban area, single vehicle
crashes where the motorcycle went out of control on a curve in a rural area and two
vehicle crashes involving lane change.
In
While it is not clear in Andreassen's study, several other investigations have shown that
crashes involving a collision lead to higher injury costs than noncollision crashes. In a
New Zealand study (Begg, Langley and Reeder, 1993), on-road crashes that involved a
collision were found to be about twice as expensive as crashes that did not involve a
collision and accounted for 61% of the total inpatient costs.
Oxley and Fildes (1993) present an analysis of characteristics of persons injured in
crashes who made claims from the Transport Accident Commission (TAC). A
summary of information relating to motorcyclists is presented in Table 5.2. Of persons
making claims to the TAC, the probability of claiming for each of the types of claim
was higher for motorcyclists than any other type of road user (including pedestrians).
Generally, the average claim was highest for pedestrians.
41
Table 5.2. Probability of claiming and average claim for motorcyclists claiming
compensation from the Transport Accident Commission (from Oxley and Fildes,
1993).
treatment
claiming
Type of claim
$2,362
$21,030
$3,321
$4,001
Average claim
In-patient rehabilitation
0.81
0.37 of
0.07
0.71
Probability
The Australia Post (1988) data presented in Table 5.3 shows that collisions (with
motor vehicles or other objects) were less frequent than falls (in which no other vehicle
was involved) but the average compensation and medical payments per rider was more
than double for collisions than falls ($2905 vs $1083 per injured rider)
Table 5.3. Costs to Australia Post of motorcycle injuries.
Year
km million
5891
0.443
5\01
199
178
18.5
547
km
0.459
28.6
29.6
cost
Million
567
Number
Total
Per
19.8
Per
$million
14,980
16,026
Compensation/
Lost
work days medical
Lost
injuries
$million
Cost time
per
Number
costs
There have been numerous overseas studies of the cost of motorcycling injuries. Many
of the US studies were fuelled by the increase in injuries resulting from the removal of
compulsory helmet wearing lcrws. The over-involvement of teenagers in motorcycle
crashes highlights the enOrmOlI.,~ost to the community of these crashes, in terms of
years of potential life lost. Smith,1!uehler, Sikes, Goodman and Rogers (1983)
estimated that 6113 years of potential life (to age 65) were lost in Georgia in the years
1980-81 from 158 motorcycle fatalities. Since 61% of injured helmeted riders but only
30% of injured non-helmeted riders were fQund to be insured in a separate study (May
and Morabito, 1989), a substantial portion of this sum is borne by the community.
Avery (1979) estimates that costs of motorcyclist casualties in the UK would exceed
196 million pounds per year. In Sweden riders and passengers of heavy motorcycles
averaged 55 days off work per year, and lighter bikes and mopeds 35 days (Hansson,
1976, cited by Avery, 1979). Avery does not specify whether these averages are for
injured motorcyclists only, or all motorcyclists.
42
CHAPTER 6:
FOLLOW-UP STUDY OF INJURED MOTORCYCLISTS
AIM
A follow-up study was conducted of injured motorcyclists (riders and pillion
passengers) aged under 21 who were admitted to hospital as a result of their injuries or
fatally injured. The study aimed to find out more about the circumstances leading to
injuries amongst young motorcyclists and the nature of the injuries sustained. It also
aimed to compare the injuries and circumstances for on- and off-road crashes and for
motorcyclists above and below licensing age.
METHOD
Ethics approval was obtained to interview injured motorcyclists (or parents of
children) admitted to five metropolitan hospitals (Box Hill, Dandenong, Preston and
Northcote Community, Royal Childrens' and Royal Melbourne) and three regional
hospitals (Ballarat Base, Geelong and Latrobe Regional). Hospitalised motorcyclists
were identified through the Victorian Injury Surveillance System or from admission
records. After gaining consent, a research nurse interviewed the motorcyclist or the
parent if the motorcyclist was too young to be interviewed. Typical reasons for noninclusion were: parents did not know about the motorcycle crash, unwillingness to be
interviewed and inability to be contacted. Details of injuries were later coded from the
medical record.
The questions on the interview forms were also completed from Coroners records for
motorcycle riders and passengers killed in Victoria who were aged under 21.
The interview form and injury recording form are attached as Appendix 2.
SAMPLE CHARACTERISTICS
The study included 174 riders and 11 pillion passengers. Of the 185 motorcyclists,
160 were admitted to hospital and 25 were killed. The percentage of motorcyclists
who were killed was higher in the study than in the database of hospital admissions
(13.5% versus 0.9%). This resulted largely from the Coronial system being able to
identify all cases within the sample period (while we were able to identify and
interview only some of the motorcyclists admitted to a sample of hospitals) and from
motorcyclists who died before reaching hospital not forming part of the hospital
admissions data.
As Table 6.1 shows, 86 motorcyclists were involved in on-road crashes and 99 in offroad crashes. Not surprisingly, most under-age motorcyclists were injured off-road
and most of the older group were injured in on-road crashes. Table 6.2 shows that
only one off-road crash was fatal, whereas 24 on-road crashes were fatal.
43
All but three of the motorcyclists normally resided in Victoria. All but two of the
crashes occurred in Victoria.
Table 6.1. Numbers of motorcyclists involved in on- and off-road crashes who
were under licensing age (17 years 9 months) and over licensing age but under
21.
185
99
18
85
67
86
100
81
19licensing
Total age age
Under
licensing
Over
der 21
Table 6.2. Motorcyclists killed and hospitalised in on- and off-road crashes.
Under licensing age
80
14 Killed
51
Hospitalised
Over licensing age but under 21
18 Killed
0
48
19
Hospitalised
MOTORCYCLIST
FACTORS
Sex
The sample comprised 14 females and 171 males. The females were more likely than
males to have been pillion passengers (5/14 versus 6/171).
Age
As Figure 6.1 shows, the youngest injured motorcyclists in the study were five years
old. Almost 10% of the sample were aged under 10 years old. Most off-road
motorcyclists were aged between 12 and 17. The bulk of on-road crashes involved
riders aged 17 or over.
44
25
,-
20
i •
On-road
!
, ':J Off-road
,--~~~---
;
:
15
11
Number of cases
10
5
o
5
6
7
8
9
10
11
12
13
14
15
16
17
18
19
20
Age of motorcyclist
Figure 6.1. Ages of motorcyclists involved in on- and off-road crashes.
The literature has shown that short and light riders experience difficulty in reaching the
controls and in manoeuvring the motorcycle. The height and weight of motorcyclists
was recorded from the medical records. The height of the motorcyclists varied from
92 cm to 198 cm and their weight varied from 20 kg to 102 kg. Twenty riders were
shorter than 150 cm and 33 riders weighed less than 50 kg. At least six of the riders
who weighed less than 50 kg were recorded as riding a motorcycle with an engine
capacity of more than 100 cc (a proxy for weight of motorcycle)
It is likely that these
riders would have been too light to effectively control the motorcycle. Kraus et al.
(1975) had found that riders less than 173 cm tall were at higher risk of injury when
riding motorcycles with capacities greater than 250 cc. Only two riders in this study
were in this high risk group.
Experience and training
Most riders involved in on- or off-road crashes had more than three years motorcycle
riding experience (including unlicensed and off-road riding, see Table 63). However,
5/61 on-road riders and 12/96 off-road riders for whom this information was available
had less than six months experience before the crash. More than half of the riders
under licensing age (51/91) had more than three years riding experience
Members of
this group were more likely than other riders to have less than six months of
experience. Most riders had no formal training (see Table 6.4)
Information about who was the owner of the motorcycle was available for almost all
injured riders (>90%). Where the information was available, the rider of the
motorcycle was the owner in 79% of on-road crashes and 63% of off-road crashes. In
21 % of off-road crashes, the motorcycle was owned by a friend or neighbour. In 13%
of off-road crashes it was owned by another member of the family.
45
Table 6.3. Number of years experience riding a motorcycle (includes unlicensed
and off-road riding). (Riders only).
I
714
101
19
18
495
163Over
9Under
12
58
17
797
60
12
17
51
50
15
174
77
crashes
79
Length of experience
25
5Total
Off-road
licensing
age age On-road41
licensing
but under 21
Table 6.4. Type of training undergone by riders in on- and ofT-road crashes.
42
4
732
88crashes
21
8
crashes
97174
0
69
OfT-road
All
Type of training
4
21
8
25
19
77
On-road
The literature review showed that the combination of riding someone else's motorcycle
with little experience or low frequency of riding is dangerous. The results shown in
Table 6.5 support this view: in 30 cases, the motorcycle was being ridden for the first
time or had only been ridden once before. In addition, it was only the first or second
pillion ride for two of the five injured pillions for whom this information was available.
The involvement oflack of familiarity was found for both on- and otT-road crashes.
However, Table 6.6 shows that most riders rode more than once per month, with those
over licensing age riding more frequently than younger riders.
Table 6.5. Familiarity
with the motorcycle (riders only).
1017
59
crashes
103
1013
97
74crashes
1018
8
23
All
OfT-road
Extent of familiarity
77
3
7
On-road
44
15
8
es
46
Table 6.6. Frequency of riding a motorcycle (riders only).
I
I
11
4
31
7 13
24
3
174
97
95
11
14
40
18
33
3 Total
79
77
14
44
651
13
22
2
18
3
15
18
53
33
20
33
13
31
a2e
but
under On-road
21
Riding frequency
Off-road
Under
Over
licensing
Weekly or more often
Licence status
Table 6.7 shows the licence status of riders involved in on- and off-road crashes.
Overall, only 41/77 riders involved in on-road crashes held a motorcycle licence.
More than 40% of the riders involved in on-road crashes were not licensed. Licence
status was known for 56 of the 61 motorcyclists old enough to be licensed who were
involved in on-road crashes (see Table 6.8). Of these riders, 15/56 (27%) did not hold
a permit or road licence.
Thirty of the 61 older motorcyclists in on-road crashes held a learner's permit or a
probationary licence to drive a car. These included 25 of the 41 licensed
motorcyclists.
Table 6.7. Licence status of riders involved in on- and off-road motorcycle
crashes.
Licence status
2
01
11
0crashes
174
97
29
113
0
83
62
13
All
crashes
10
Off-road
77
30
27
2
12
0
51
On-road
47
Table 6.8. Licence status of riders involved in on-road crashes.
Licencea~estatus
30
212
1 27
12
27
577
61
214
5121
0
16
All riders
but under
Over
licensing
Under licensing
Alcohol
Little information was available on the presence or role of alcohol. Alcohol was tested
for in only 14 of the 185 crashes. Positive readings were found in six cases, four riders
(.13, .15, .20 and .22) and two pillion passengers (both .05). All of the motorcyclists
with positive alcohol readings were involved in on-road crashes.
Protective gear
In 182 cases, it was known whether a helmet was worn or not. Helmets were not
worn in 14% of both on-road and off-road crashes. In eight on-road and four off-road
crashes the helmet came off during the crash.
Information about other protective gear was known for 67 on-road and 98 off-road
motorcyclists. No protective gear (gloves, leathers, boots) was worn by 27 on-road
(40%) and 37 off-road motorcyclists (38%).
Estimates of injury frequency
Hospitalised motorcyclists (not parents) were asked to judge how often they expected
to be injured and what was the probability of being killed in a motorcycle crash.
As Table 6.9 shows, most motorcyclists who responded estimated that they would be
injured at least once a year. Table 6.10 shows that judgements of the probability of
being killed in a motorcycle crash in the next year were also very high. It is interesting
to note that most motorcyclists stated that they would continue riding after their
current injury.
At least seventy-two riders had sustained a previous injury from a motorcycle crash
(this was unknown in some cases). Contusions were the most common previous injury
(26), followed by fractures (16) and lacerations (15).
48
Table 6.9. Estimated frequency of being injured.
33
39
72
8 13
85
100
617
32
AllUnder licensing
50
16
34
5315
17
185
451
a2e but
under
21
Estimated
frequency
motorcyclists
Over licensing
Table 6.10. Estimated probability of being killed in a motorcycle crash.
AllUnder licensing
48
31
74
1 13
015
35
761
31
16
39
11
20
517
85
100
185
motorcvclists
Estimated
probability
a2e but
under
21
Over licensing
CRASH FACTORS
Crash type
Single-vehicle crashes comprised 34% of the on-road crashes and 80% of the off-road
crashes. Table 6.11 shows the type of other vehicle involved in the multi-vehicle
crashes. Most multi-vehicle on-road crashes involved cars (including vans, utilities and
four wheel drives), although seven involved trucks, buses or trams. Of the multivehicle off-road crashes, 17 involved other motorcycles.
The crash type can also be classified as collisions (with vehicles and objects), loss of
control or other (see Table 6.12). On-road crashes were more likely than off-road
crashes to be collisions.
Both on- and off-road crashes were more likely to occur on Saturday than any other
day of the week (see Table 6.13). Off-road crashes were also common on Sundays.
49
Table 6.11. Other vehicles involved in multi-vehicle crashes.
78
21
57
48
2
01crashes
17
1
729crashes On-road 46
271
OfT-road
Type of vehicle All
Table 6.12. Crash type for on- and ofT-road crashes.
Crash type
101
185
5
3
76crashes On-road 52
86
69
399
24
All
OfT-road
3220
crashes
Table 6.13. Day of week of crashes.
Day
16
220
999
11
21
185
52
640 crashes On-road 86
28
crashes
141
10
10
33
489
13
12
11
All
OfT-road
19
Surface characteristics
The most common crash sites for the off-road crashes were dirt or sand motocross
tracks (19/99), grass in farms or paddocks (20/99) and dirt or sand bush tracks (27/99)
(see Table 6.14). It was raining or the ground was wet in 6% of on-road crashes and
13% of off-road crashes.
n or
50
Table 6.14. Crash sites and surface characteristics
I I
27
99
00Grass
20
57
52040Dirt
37
Crash 27
site
20
10
119
00
02Unknown
0Total
0 1or
33
4
2
Mud
Gravel
sand
I
05
2
for the ofT-road crashes.
Surface
Motocross
track
Back
or front
yard
Other
As expected, leisure was the purpose of most of the trips which resulted in off-road
crashes (see Table 6.15). Leisure was also the most frequent purpose of the on-road
crashes (as well as travel to leisure). Relatively few of the crashes resulted from the
motorcycle being used as a means of transport
Table 6.15. Purpose of the trip.
2OfT-road
185
86
399
All
15
19
0230 crashes On-road 31
24
73
24
crashes
171
19
104
12
Purpose of the trip
Immediate cause of the crash
The immediate cause of the crash was a natural or artificial obstacle in 39 of the offroad crashes. The role of collisions with other vehicles was more important in on-road
crashes. Features of the surface were felt to have contributed to five on-road crashes
and 17 off-road crashes (Table 6.17).
51
Table 6.16. Immediate cause of crash. Examples of natural obstacles are ditches
and logs. Examples of artificial obstacles are fences, poles, gutters, built-up
jumps on motocross tracks.
Immediate cause
15
14
12
22
3
4
2
8 crashes
25
23
15
38
75
crashes
18
19
Off-road
All
Natural obstacle
2
10
1
13
4
3
On-road 52
Table 6.17. Surface features which contributed to the crash.
Surface feature All
5
082
6
33
163
2 crashes
6
crashes
Off-road
01
On-road 81
2
Speed of travel
Estimates of speed just prior to the crash were available for 85% of the cases. While
the speed estimates given may not be accurate, Table 6.18 strongly suggests that onroad crashes generally occurred at higher speeds than off-road crashes. About 20% of
the off-road crashes occurred at speeds ofless than 20 km/h. Even at these low
speeds, injury was severe enough to require hospitalisation.
52
Table 6.18. Estimate of speed just prior to on- and off-road crashes.
3
2
4crashes
185
99
18
46
32
6
10
68
22
55
crashes
Estimated speedAll
Off-road
86
6
3
On-road22
33
VEHICLE FACTORS
Type of motorcycle
The types of motorcycles involved in the crashes are shown in Table 6.19. Honda and
Yamaha motorcycles were most common amongst the younger injured motorcyclists
whereas Yamahas were the most common amongst the older motorcyclists (Tables
20).
Table 6.19. Type of motorcycle involved in crash.
01
2
185
2
1
63
4
78
8632
17
99
10
12
54
crashes
All
crashes
Off-road
Type of motorcycle
Table 6.20. Manufacturer
Manufacturer
20
28
20
27
15
18
0
24
18
99
25
45
2
34
35
8Over
5 age
15
17
9crashes
100
115
185
16
28
1
18
53
29
2
Off-road
Total
Under
On-road
16
16
7
licensing
licensing
age86
but under 21
2
0
1
15
4
On-road86
51
11
of motorcycle involved in crash.
53
Engine capacity
The motorcycles involved in off-road crashes generally had a smaller engine capacity
than those involved in on-road crashes. Half of the motorcycles in off-road crashes
(for which this information was known) had an engine capacity ofless than 100 cc,
compared with less than 10% of those involved in on-road crashes.
Table 6.21. Engine capacity of motorcycle involved in crash.
28
0299
72crashes
8
343
46
18
185
62
crashes
515
OfT-road
Engine capacityAll
(cc)
Registration
15
47
11
256
On-road86
status
Of the 169 motorcycles for which the information was available, 64 were registered for
use on-road. The registered motorcycles were involved in 53/86 on-road crashes and
11199 off-road crashes. In on-road crashes, 23/76 (30.2%) motorcycles were known
to be unregistered.
Table 6.22 shows the matrix of registration and licensing status for the 86 on-road
crashes. Both licensing and registration information was available for 71 of these
crashes. Of these 71 crashes, only 39 (54.9%) involved a licensed rider on a registered
motorcycle. Conversely, 32/71 (45.1%) crashes involved unlicensed riding or an
unregistered motorcycle. It is likely that the unknown data would increase this figure.
Table 6.22. Registration
48
27
5Total
10
180
486
11
No
6023
Motorcycle Unknown
and licensing status in on-road crashes.
39
95
53
Yes
Motorcycle registered?
54
If the analysis is confined to only the 61 on-road crashes of riders over licensing age,
of these 54 crashes, only 38 (70.4%) involved a licensed rider on a registered
motorcycle and 15/54 (27.8%) crashes involved unlicensed riding or an unregistered
motorcycle.
Riders were asked whether the motorcycle had a two- or four-stroke engine. For the
cases for which this was known, 60 motorcycles were two-stroke and 25 were fourstroke.
Headlights
Table 6.23 shows headlight status by light conditions. Headlight status was
unavailable for about a third of the crashes occurring during dark conditions.
Nevertheless, it was found that three motorcycles were riding without the headlight
being on while it was dark (3/22=14%). In two of these cases, no headlight was fitted
to the vehicle.
Table 6.23. Headlight status by light conditions.
46
032
035
42
11
2050
47
043
1Total
185
11headlight
151
Unknown
No
OfT
Light conditions
01
27
18
On 46
broken)
INJURY PATTERNS
Abbreviated
Injury Scale (AIS)
Numerical scales have been developed in order to quantify and compare the severity of
injuries of different nature and to different body parts. The Abbreviated Injury Scale
(AIS) is a consensus derived, anatomically based system that classifies individual
injuries by body region on a six-point severity scale ranging from AIS 1 (minor) to AIS
6 (currently untreatable). Over 2000 injury descriptions are included for coding in the
1990 revision of the AIS manual. The AIS does not assess the combined effects of
multiply-injured patients (AAAM, 1990).
The maximum AIS (MAIS), which is the highest single AIS code in a patient with
multiple injuries, has been used by investigators to describe overall severity. Its
usefulness remains important in motor vehicle injury research concerned with vehicle
design changes. Death rates vary significantly within each AIS value for the most
severe injury depending upon the AIS value for the second most severe injury.
55
Inj ury Severity Score (ISS)
The Injury Severity Score (ISS) developed by Baker, O'Neill, Haddon and Long
(1974) is a mathematically derived code number determined by adding the squares of
the highest AIS codes in each of the three most severely injured body regions. An ISS
of 75 is the highest possible. Injuries coded AIS-6 are automatically assigned an ISS
of 75. In the case of the killed motorcyclists in our study, this convention has been
waived in oder to focus on the full range of injuries. It should be noted that a major
limitation of the ISS is that it only recognises one severe injury for each body region.
Thus, an injured person with three AIS scores of 4 to the head could have an ISS of
only 16.
Injury Severity Scale scores in the sample
The Injury Severity Scale (ISS) scores ranged from 1 to 75 (see Table 6.24). As
would be expected, the mean ISS score was higher for fatal than hospitalisation
crashes. On-road crashes were more severe (by mean ISS) than off-road crashes and
collision crashes were more severe than non-collision crashes.
Table 6.24. Ranges and means of Injury Severity Scale (ISS) scores for different
types of crashes. ** indicates significantly higher at probability .01
Type of crash
Mean
44.8**
19.5**
12.7
10.2
7.7
6.81.0-75.0
ISS
4.0-75.0
11.0-21.0
.0-75.0
16.7*
1.0-75.0
1.0-27.0
1.0-66.0
* score
Range
of
ISS scores
Injuries by body region
External injuries and injuries to the extremities were the most common, followed by
head injuries (see Table 6.25).
56
Table 6.25. Number of injuries to each body region and number of persons with
injuries in each body region.
7reeion
8322
489
120
17
9than
342
104
312
3266
45
10
25
71
14
127
Two
198
218
34
63
Persons
with
120
Body region More
re~ion
Onetoinjury
two
injuries
injuries
injury
toto265
this
Head and neck injuries
The most common head injuries were closed head injuries and unconsciousness (see
Table 6.26). The mean maximum AIS severity of head injury was 2.9 for on-road
cases and 2.6 for off-road cases (lack information for 2 cases). Ten of the 14 skull
fractures were sustained by fatally injured motorcyclists.
Table 6.26. Summary of head and neck injuries sustained in the sample of
motorcycle crashes.
I
Type of head injury
US
692831of persons
49
23
17
Number
rain
In off-road
crashes, fewer helmet-wearing
nonhelmet-wearing
motorcyclists (176%
motorcyclists suffered head injuries than
vs 42.9%, x2(1)=4.6, p<.05). This was not
true for on-road crashes (54.9% vs 75.0%, X2(2)=1.8, p>.I). Analyses of the severity
of head injury to motorcyclists with and without helmets were inconclusive due to the
small number of nonhelmeted motorcyclists.
57
All but three of the fatally injured motorcyclists sustained head injuries. In 17/22 of
these cases, the maximum AIS severity of the head injury was four or above. Table
6.27 shows the maximum severity of injury in each body region for each of these
motorcyclists.
None of the 17 motorcyclists had an AIS severity=6 injury in a body
region other than the head, so in a strict sense there were none who would have been
expected to die from an injury to another body region, if the head injury was not
present. However, 3 cases had AIS severity=5 injuries to the chest and 2 had AIS
severity=5 injuries to the abdomen. Thus, it is possible that 12 of the 17 motorcyclists
who died with head injuries of AIS severity=4 or above would have survived, if the
head had been better protected. Clearly, this would also depend on other
characteristics not measured by the AIS, e.g. extent of shock.
Table 6.27. Number of injuries to each body region and number of persons with
injuries in each body region. Sample: fatally injured motorcyclists with
maximum AIS of head injury greater than or equal to four.
26
32
056184035
Body re~ion2183
01 :lIe with ~iven maximum AIS severity in body re~ion
15
No. peo
1
Facial injuries
There were relatively few facial injuries in the sample of motorcyclists (see Table
6.28). Fractures of facial bones were the most common injuries. The prevalence of
facial injury was similar for helmeted and nonhelmeted motorcyclists in both on- and
off-road crashes.
Table 6.28. Summary of facial injuries sustained in the sample of motorcycle
crashes.
Number of persons
1
1
o
o
14
6
2
24
58
Chest inj uries
Chest injuries most commonly consisted of internal injuries, followed by fractured ribs
and injuries to the thoracic spine (see Table 6.29).
Table 6.29.
crashes.
Summary
of chest injuries sustained
in the sample of motorcycle
Number of persons
1
41
12
12
2
68
Abdominal
injuries
Injuries to the urinary system and the liver were the most common abdominal injuries
(see Table 6.30).
Table 6.30. Summary
motorcycle crashes.
of abdominal
injuries sustained
in the sample of
Number of persons
10
11
9
9
2
4
1
7
53
Injuries to the limbs
Fractures were the most common injuries to the limbs (see Tables 6.31 and 6.32). Of
the 185 motorcyclists, 105 sustained one or more fractured limbs. Eleven had two
limbs fractured and single motorcyclists had three and four limbs fractured,
59
respectively. Fractures were more common below the elbow or knee (respectively)
than above.
Table 6.31. Summary of injuries to the upper limb sustained in the sample of
motorcycle crashes.
Type of upper limb injury
81
3871 persons
10
Number 47
of
Table 6.32. Summary of injuries to the lower limb sustained in the sample of
motorcycle crashes.
Type of lower limb in.iury
44
6
3291 persons
74
Number 142
of
Table 6.33 summarises the numbers of injuries to the left and right upper and lower
limbs. Overall, there were similar numbers of injuries to the two sides. This is in
agreement with earlier studies cited in Chapter 5. However, off-road crashes resulted
in nearly twice as many injuries to the left lower limb than the right. There is some
evidence of the reverse pattern for on-road crashes. The patterns for the upper limb is
not as clear but there is a suggestion that collisions and on-road crashes produce more
injuries on the left side whereas the reverse pattern holds for loss of control and offroad crashes.
60
Table 6.33 Numbers of injuries to the left and right upper and lower limbs.
58
78
25
20
34
51081injuries
139
37
75
64
40
37
19
62
44
40
69
42
21
615
16
20
32
unknown
Total
Side to
44
27
17
22
13 to
14
Type of crash
ri2ht
Injury
Injury
Collision
External inj uries
Most injured motorcyclists were coded as sustaining abrasions and about half of all
motorcyclists sustained contusions and lacerations (see Table 6.34). Burns were
relatively infrequent (5 injuries). In general, the severity of external injuries was low.
The mean maximum severity of external injuries was 1.15 for on-road cases and 1.17
for off-road cases.
The role of protective clothing in preventing or lessening the severity of external
injuries was analysed. Information about the wearing of protective clothing was
available for 165/185 cases. In off-road crashes, there was a trend for motorcyclists
without protective clothing to be more likely to suffer external injuries (86.5% vs
65.6%, X2(2)=5.6, p=.06). This pattern was not found for on-road crashes, in which
about 90% of motorcyclists suffered external injuries, whether protective clothing was
worn or not.
Table 6.34. Summary of external injuries sustained in the sample of motorcycle
crashes.
Number of persons
163
100
88
6
4
1
2
364
s
61
In both on- and off-road crashes, the severity of external injury (mean maximum AIS)
was similar whether or not protective clothing was worn.
Causes of injury
The probable causes of the most serious injury are shown in Table 6.35. Collision with
another vehicle was the most common cause of injury for on-road crashes, followed by
the impact of landing on the ground and striking roadside objects. In off-road crashes,
the impact oflanding on the ground was the most common cause of injury, followed
by the motorcycle landing on the person. This latter cause may be a consequence of
the motorcycle being a large proportion of the young rider's weight and difficulty in
moving the vehicle off the body.
Table 6.36 shows that striking a roadside object was the most common cause of
injuries leading to death.
Table 6.35. Probable causes of most serious injury in on- and off-road crashes.
54
8
4
2663
52
33
014
32
65Off-road
6 crashes
31
crashes
On-road
I 47
All
Probable
cause
I
19
Table 6.36. Probable cause of most serious injury in crashes resulting in
hospitalisation and fatal crashes.
Probable cause
Crashes
resulting in
hospitalisation
Fatal
crashes
All crashes
o
3
2
52
2
19
12
31
5
o
31
1
5
32
6
40
o
7
47
6
o
6
4
o
4
49
6
62
CHAPTER 7:
PROTECTIVE MEASURES
Protective measures can be divided into those which reduce injury in motorcycle
crashes (helmets, lower limb protection) and those which aim to prevent crashes
(motorcycle training, exposure reduction measures such as restrictions on off-road
riding).
HELMETS
The most effective intervention currently available to reduce motorcyclist injuries is the
motorcycle helmet. There have been numerous analyses performed which address the
efficacy of helmets. Many of these analyses focus on the U.S states which repealed or
weakened their mandatory helmet wearing laws leading to a 40-50% decrease in
helmet wearing rates (Chenier and Evans, 1987). The US studies have found that:
•
the probability of sustaining an injury while wearing a helmet is 15.1% but 22.8%
while not wearing one (Kraus et aI., 1975)
•
the average Injury Severity Score (ISS) for crash victims wearing helmets is 9,
compared to a score of 11.5 for those not wearing helmets, and the cost of
treatment varies accordingly ($6,637 versus $12,109) (May and Morabito, 1989)
•
the average hospital stay was 5.8 days for helmeted riders and 11.8 days for nonhelmeted riders (McSwain and Belles, 1990). Other studies have shown similar
effects (e.g. Shankar, Ramzy, Soderstrom, Dischinger and Clark, 1992)
•
a helmeted rider is one sixth as likely to die of head injury as an unhelmeted rider
(Carr et ai, 1981)
•
fatalities increased by 25-26% as a result of the reduction in helmet wearing
(Chenier and Evans, 1987). McSwain and Belles (1990) also showed that fatality
rates were higher for unhelmeted riders.
Fortunately, helmet wearing is compulsory for motorcyclists riding on roads in
Australia and wearing rates are quite high. A survey of motorcycles on Sydney roads
in 1986 showed that 97.4% of riders and 96.0% of pillion passengers wore helmets
(Johansen, 1987). The vast majority of these were full-face style.
Pegg and Mayze (1980) noted that a full-face visor is helpful in preventing respiratory
burns but argued that standards should ensure that helmet visors do not melt when
fires occur in crashes.
There are ongoing investigations of the performance of motorcycle helmets and
methods for improving their performance (e.g. Zellmer, 1993). Zellmer concludes that
the possibilities for enhancing helmet performance by only increasing the energy
absorption are rather low. He notes that an enhancement of liner deformation of
63
6.8mm would give a reduction of39.2% in head injury criterion (HIC). He concludes
that the use of HIC in testing, rather than maximum acceleration reached, would make
it easier to distinguish between poor and good helmets.
As can be seen, there is ample evidence for the value of helmets, and a worldwide
effort to create mandatory wearing laws should be encouraged. Unfortunately, such
laws do not apply to riders on private property. This is a major shortcoming. It also
means that children under licensing age can ride motorbikes, with no protective gear,
while they are on private ground.
LOWER LIMB PROTECTION
Leg protection for motorcyclists has been the subject of considerable controversy in
England (Watson, 1990). It has generally been designed as a safety fairing. Craig et
al. (1983) observed that 'crash bars' (tubular metal protective devices) were fitted to 21
percent of patients' motorcycles and "appeared to offer no protection to the lower
limbs" (p.165). They recommend that "to reduce the incidence of severe lower limb
injuries it might help to provide some form of shell surrounding the legs to protect
them against impacts from other vehicles which are most likely to strike the outer side
of the lower leg" (pp.165-166). They warn, though, that "this form of device offers no
protection against impacts after being thrown from the machine, although the resulting
lower limb injuries are generally less severe. Special boots with knee protectors made
from an impact-absorbent material could help to reduce the injuries if all motorcyclists
would wear them - racing leathers are already known to give some protection" (p.166)
The need for a standard to ensure the strength of crash bars was noted by Pegg and
Mayze (1980). They argue that many of the fitted crash bars were too flimsy or poorly
designed to be effective.
There is considerable concern that structures to provide leg protection may worsen
overall rider injuries by increasing head and chest impact loads (Ouellet, 1990, cited by
van Muiswinkel, 1994).
Fuel tanks can sometimes cause damage to knees or legs (Pegg and Mayze, 1980) or
pelvis (de Peretti, Cambas, Veneau and Argenson, 1993). Care should be taken to
ensure that petrol filler caps are recessed, not raised as a potential hazard.
The extent of burns to the lower extremities can be reduced by covering the legs and
wearing adequate footwear e.g., thick jeans and long leg boots (Pegg and Mayze,
1980).
The heel flap injury can easily be prevented by the wearing of protective footwear
while riding, and by the installation of wheel guards (Das De and Pho, 1982)
Other effective countermeasures include foot guards and knee pads, especially for off
road riding.
64
PROTECTIVE CLOTHING
Protective clothing such as leather gloves, jackets and trousers significantly reduce soft
tissue injury (lacerations, contusions and abrasions). In addition proper protective
clothing can move the thresholds for more serious injury to higher collision velocities
("The implications ...", 1991). While most on-road motorcyclists wear protective
jackets, it is estimated that only about half of these riders wear protective trousers and
gloves.
Benefit-cost calculations for compulsory wearing of protective clothing by
motorcyclists and pillion passengers (Torpey, Ogden, Cameron and Vulcan, 1991)
showed the measure would need to be only 2.5% effective to reach break even point.
These calculations were based on Police-reported crashes. If these figures were
adjusted to account for the under-reporting of crashes, the effectiveness needed for the
measure to reach break even point would be reduced.
AIRBAGS
Fitting an airbag to the instrument panel or the top of the petrol tank has been
suggested as a method of preventing injuries by reducing the impact velocity. Airbags
are one of the few restraint systems that do not obstruct the rider during normal riding.
However, Oellet (1990, cited by van Muiswinkel, 1994) concluded that "tank mounted
airbags worked very well in perpendicular impacts, but were only marginally effective
in angled impacts and nearly useless in impacts with a moving car" (p.20).
CONSPICUITY
Motorcycles are smaller than cars and as such are less easily seen by other road users.
Hancock et al (1990) discuss the contribution of the conspicuity problem to crashes in
which a rider's right of way is violated (the most common multi-vehicle collision
scenario), and conclude that it is considerable. Olson et al. (1980) concluded that
many of these crashes involved cars turning in front of oncoming motorcycles and
other angle collisions at intersections.
Analyses of motorcycle crashes in Victoria and South Australia have concluded that
failure of a motorist to see the approaching motorcycle may have been responsible for
between 12% and 21% of crashes (McLean et aI., 1979; Williams and Hoffman, 1979,
both cited in Bui, 1992).
Most studies which have concluded that motorcycle conspicuity underlies right-angle
crashes have compared single and multi-vehicle motorcycle crashes. Olson (1989)
cautioned that the relationship is not clear. Cercarelli, Arnold, Rosman, Sleet and
Thornett (1992) noted that this procedure compares crashes with clearly different
causes (car drivers' possible failure to detect a motorcyclist against motorcyclists' loss
of vehicle control). In their study, Cercarelli et al. compared car-motorcycle and carcar crashes, after controlling for amount of day and night-time driving by both vehicle
types. They hypothesised that poor motorcycle conspicuity should result in more
65
daytime car-motorcycle than car-car crashes. Their study did not support this
hypothesis, the difference was negligible when the relatively greater daytime use of
motorcycles than cars was taken into account. They caution that their results do not
prove that there is not a conspicuity problem, it may be that the restricted sample size
and widespread daytime use of headlights at the time contributed to the lack of a
significant difference.
Measures to increase conspicuity which have been proposed include
•
•
•
•
bright clothing
daytime use of headlights
daytime running lights
encouraging car drivers to look out for motorcycles
Olson, Halstead-Nussloch and Sivak (1980) tested a number of methods of improving
motorcycle conspicuity by examining their effect on gap acceptance by unalerted car
drivers. The results indicate that daytime conspicuity is most improved by fluorescent
garments or steady or modulating lights whereas nighttime conspicuity is aided by
retroreflective garments and running lights.
Avery (1979) sums up the consensus view that bright coloured clothes and
motorcycles reduce the chance of collisions. The Social Development Committee
Inquiry into Motorcycle Safety in Victoria (1992) recommended that riders be
encouraged to use yellow, white, red and fluorescent colours for their motorcycles and
their clothes. An early observational study on Sydney roads showed that most
motorcycles were a dark colour and motorcycle riders tended to wear dark colours
with 55.9% wearing black coats and 13.9% wearing blue coats (J ohansen, 1987).
The use of headlights or running lights during the day has been a controversial issue in
recent years. Running lights are two lights, usually placed about half a metre apart but
at the same height. Donne and Fulton (1985, cited by Ravinder, 1987) and Fulton,
Kirkby and Stroud (1980, cited by Ravinder, 1987) found that daytime use of running
lights significantly increased the conspicuity of motorcycles. Australian studies have
generally shown a strong association between daylight headlight use and safety.
Vaughan, Pettigrew and Lukin (1977) found that motorcycles without headlights on
were two to three times more likely to be involved in a crash than motorcycles with
headlights on. During 1986 in NSW, motorcyclists using headlights during daylight
hours were nearly three times less involved in fatal crashes than non-headlight users
(Ravinder, 1987). A reanalysis of Vaughan et al.'s data by Kearns (1981) dismissed
the objection that the earlier results did not prove anything about headlight use per se
but were merely a reflection that motorcyclists who rode with headlights on in daytime
were generally more safety conscious.
"Victorian Rider", the official manual for motorcycle riders recommends the use of the
headlight on low beam during the day, a view that is also held by Avery (1979). The
Federal Government has recently implemented Australian Design Rule 19/01 requiring
hard-wiring of daytime running lights for motorcycles. This has been opposed by
motorcycling organisations. The Social Development Committee Inquiry into
Motorcycle Safety in Victoria (1992) recommended that
66
The Minister for Transport advise the Federal Government of the possible dangers inherent in
specifying daytime running lights for motorcycles be hard-wired, and request they delay
implementation of Australian Design Rule 19/0 I until the report of the International
Committee on Daytime Running Lights is available and its implications for Australia are
examined.
The Minister for Transport advise the Federal Government that the light specifications
included in Australian Design Rule 19/0 I are inappropriate for Australian conditions.
The Minister for Transport amend the Road Safety (Vehicles) Regulations 1988 to exclude
Australian Design Rule 19/0 I from roadworthiness requirements for motorcycles registered in
Victoria.
The use of daytime running lights for motorcycles remains voluntary.
The percentage of motorcycles with the headlamp on during daylight was 65.5% in a
survey conducted on Sydney roads in 1986, before use was legislated (Johansen,
1987). An observational study in Perth in 1990 showed that 61. 8% of motorcyclists
were using their headlamps during the day (Cercarelli, Smith and Arnold, 1990; cited
in Cercarelli et aI., 1992).
Motorcycle riders attitudes to measures to increase conspicuity were examined in a
study in Sydney in 1987 (Ravinder, 1987). The overwhelming majority believed that it
is important to ensure that the motorcyclist is visible to other road users. About 60%
of motorcycle riders reported using headlights during the day but approximately 40%
of respondents were worried about the amount of drainage and reduction of service life
of batteries caused by daylight use of headlights. Less than half of the motorcyclists
believed in the safety value of high visibility clothing. This was in accord with the very
small percentage of motorcyclists observed wearing such clothing (Johansen, 1987).
A headlamp which is in use at the time of the crash can increase the risk of fire by
ignition after bulb breakage. Pegg and Mayze (1980) recommend that the headlamp
casing be made of stronger material to reduce the incidence of bulb breakage.
MOTORCYCLE TRAINING
Many difficulties exist in evaluating training programs, including those aimed at
decreasing motorcyclist crash risk. For this reason, many studies have failed to reach
meaningful conclusions and the conclusions of studies vary. For example, Wood and
Bowen (1987) reported on changes to motorcyclist training and licensing in Victoria
but were forced to conclude that the relative effects of training and testing could not be
separated from the effect of the scheme as a whole.
Most evaluation studies compare a group of riders who chose to undertake a course
with another group who choose not to take that course. It is quite possible that those
choosing to take a course differ in important respects from those not taking the course.
addition, care needs to be taken in evaluating a training scheme within several years
of its implementation. Riders who have gone through the course will be considerably
In
67
younger on average than riders who have not gone through the course (because it was
not offered in earlier years).
Studies of motorcycle training have shown reductions, no effect or increases in crash
risk. Some early studies which showed crash reductions from motorcycle training have
since been shown to have had methodological flaws. Kraus et al (1975a) found that,
regardless of age, the proportion of injured riders with training was higher than that of
noninjured (noncrash-involved) riders. Cooper and Rothe (1988), in a Canadian study
of 877 motorcycle riders, found that the amount and type of exposure were the most
important determinants of motorcyclist crash risk. In contrast, there was no evidence
that formal motorcycle training was effective in reducing crash risk.
Adams, Collingwood and Job (1985) report on a training programme for Australia
Post motorcycle telegram delivery staff Injury records for the six months before and
after training were compared. The two-day course had theoretical and practical
components which covered: service and maintenance of a motorcycle, riding attitude,
road craft, identification of potential dangers and defensive riding. Difficulties relating
to nonattendance, employee mobility and disturbance to the experimental design made
analysis and interpretation of the programme difficult. The authors concluded that
"while the results of the present study show no evidence that the 1982 training course
changed the accident rates of those participating, a number of circumstances indicate
that these results should not be taken as in any sense discouraging, but rather as a
genuine failure to produce positive evidence" (Adams et aI., 1985, p.18).
The findings of Barry (1970) and Hurt (1979) suggested that experience with a
particular type of motorcycle is needed to improve rider safety. Thus it would seem
best if riders rode their own motorcycle during practical training programmes. The
current training scheme for Australia Post motorcycle riders includes practical
instruction on the model of motorcycle which will be ridden for mail deliveries, fullyloaded.
The Australia Post (1988) study of motorcycling injuries pointed out the need for
refresher training for those who had been riding for a number of years because of
changes in the road rules and in the characteristics of the task. An added advantage of
training programmes for experienced motorcyclists is the potential to train riders who
may have missed training at the recruiting or novice rider stage.
McLaren (1992, cited in Langley et aI., 1993) reviewed sixteen studies of motorcycle
training. He concluded that "formal motorcycle training or enhanced skills testing
programmes of the type and standard identified are unlikely to lead to substantial or
sustainable reductions in accidents or traffic violations arising through improvements in
safe riding practices" (McLaren, p.50). Where significant beneficial effects arose,
these were more likely to be attributable to reduced exposure than to skill acquisition.
Simulator-based training programs for motorcyclists are currently being developed and
tested. Yuhara, Oguchi and Ochiai (1993) note that "the purpose of safe driving
education by the riding simulator is to predict and forecast dangerous situations that
can take place in dangerous traffic scenes and to drive defensively" (p.59). Simulators
allow novice riders to "experience" dangerous situations that could not be safely
68
incorporated in on-road training. While the technical advances needed for effective
simulation of motorcycle riding are ongoing, evaluations of the effectiveness in terms
of reduced risk of on-road crashes are not yet available.
While motorcycle training has focussed on crash avoidance, it can also include learning
how to minimise injury if a crash cannot be avoided. Some aspects could include the
use of protective clothing and safer motorcycles (e.g. leg protectors). Palmer
(unknown) has outlined actions that a motorcyclist can take to reduce the extent of
injury in an unavoidable intersection crash with a car. Unfortunately, there has been no
evaluation of the usefulness of training on minimising injury.
Awareness training for car drivers
Training to decrease crash rates by educational measures may be valuable. There is
evidence that car drivers who have motorcycling experience have a lower chance of
being involved in a crash with a motorcyclist than drivers without such experience.
This may be because drivers who ride know where to expect motorcyclists and are
better at anticipating their behaviour. Since most multi-vehicle motorcycle crashes
result from an automobile driver violating the motorcyclist's right of way (Potter,
1973; Hancock et aI, 1990), efforts to increase the awareness of the car drivers may
result in a reduction in these crashes.
Behavioural aspects of riding also determine the extent to which other drivers notice
motorcyclists. Being aware of the blind spots of cars and avoiding them, lowers the
chance of being hit. The Social Development Committee Inquiry into Motorcycle
Safety in Victoria (1992) recommended that programmes be developed to encourage
car drivers to be aware of motorcycles. The Transport Accident Commission launched
an advertising campaign in 1993 featuring this message.
ENFORCEMENT
Each of the analysis of road crash statistics, the literature review and the follow-up
study found that many young riders involved in on-road crashes are unlicensed or
riding an unregistered motorcycle. These findings suggest that more effective
enforcement of licensing and registration for motorcycles could serve as a deterrent to
unsafe practices and thus have potential as a measure to reduce crashes.
It is acknowledged that a number of practical difficulties exist in enforcement for
motorcycles. Sometimes motorcyclists will evade Police driving cars by lane splitting
or riding into areas where Police cannot follow or it is unsafe for them to follow.
There is only a limited number of Police motorcyclists.
In addition, there is a need for Police to intercept riders in a safe manner, avoiding
pursuits. Two crashes in the follow-up study occurred while the motorcyclists were
being chased by Police. Perhaps a program of checking of licensing and registration
details as part of ongoing Police activity (e.g. random breath testing) would serve as an
appropriate deterrent.
69
The suggestion has been made that intending purchasers of motorcycles be required to
hold a current motorcycle licence. While this has the potential to decrease unlicensed
riding, it would have to be implemented in such a way as to avoid problems for those
learning to ride a motorcycle and to provide for registration of motorcycles for
business use.
ZERO BAC LIMIT FOR ALL MOTORCYCLISTS
Currently, similar BAC limits apply to motorcyclists and car drivers in most
jurisdictions. Given the evidence cited earlier that alcohol is likely to cause even
greater increase in crash risk to motorcyclists than car drivers, it has been suggested
that a zero BAC limit should apply for all motorcyclists. Introduction and enforcement
of such a limit is calculated as having a likely benefit-cost ratio of3: 1 (Torpey et aI.,
1991).
RESTRICTIONS ON CARRIAGE OF PILLION PASSENGERS
There is evidence that carriage of pillion passengers not only increases the total number
of persons at risk but that the severity of injury to the rider is greater when a pillion
passenger is carried (Social Development Committee, 1991).
In Victoria, motorcyclists are not allowed to carry pillion passengers within the first
year of licensing. It was calculated that extending this restriction from one to three
years would cost about $250,000 in publicity and $1m in enforcement. To break even,
the countermeasure would need to be 18.6% effective in reducing injuries (Torpey et
aI., 1991).
RESTRICTIONS ON OFF-ROAD RIDING BY CHILDREN AND
ADOLESCENTS
A number of authors have suggested restricting or prohibiting motorcycle riding by
children and adolescents to prevent crashes and thus reduce injuries.
Mason (1984) pointed out that in the case of children riding on private ground, the
parent or guardian is responsible for ensuring that their children minimise the risks
associated with motorcycling by wearing appropriate clothing and helmets, riding
safely and using suitable bikes (if it is deemed appropriate for them to be riding at all).
Currently motorcycle clubs allow children as young as six to participate in races,
although there is a body of experts who feel children so young are not able to control a
motorcycle satisfactorily (Sherman and McKinnon, 1984, Craft, 1979, Mason, 1984
and Wilson-MacDonald et ai, 1987). It does seem that in general these clubs do make
a reasonable effort to ensure the safety of the participants by making helmet wearing
compulsory and usually designing race courses sensibly (Place, 1979; Sherman and
McKinnon, 1984).
70
Kraus et al (1975a) suggest banning the use of motorcycles by persons less than 16
years of age in places without available riding areas. They comment that "with the
absence of readily available recreational riding places to use the motorcycle, the young,
unskilled driver turns to city streets, highways, and county roads to operate the
minicycle, which is not designed for this type of use but is capable of speeds of 72
km/hr" (p.93).
Paediatricians have argued that boys aged six to twelve years are "developmentally
incapable both physically and mentally of carrying out the complex co-ordination of
movements required to handle a motorcycle in competitive events ....There is growing
concern both for the adverse effects of permanent brain damage and for damage to the
growth points of bones" (Avery, 1988, p.29).
VEHICLE-BASED
COUNTERMEASURES
Improvements to motorcycle design and better maintenance are the two classes of
vehicle-based countermeasures which have the potential to reduce the risk of
occurrence of a crash. Imbalances between braking efforts of the front and rear brakes
can contribute to crash involvement. Some new motorcycles have linked braking
systems or antilock braking systems to reduce this problem. Van Muiswinkel (1993)
recommends improvements to handling and stability, particularly in regard to agbikes.
Better maintenance of motorcycles has potential to reduce crash involvement.
Maintenance of the brakes, suspension, clutch and throttle is important.
Engine capacity and power restrictions
In response to the perception that higher capacity motorcycles are more dangerous,
many jurisdictions have implemented restrictions on maximum engine capacity for
novice motorcyclists. The consensus is that these have not been successful in reducing
crash risk (Fabre et ai, 1993).
One of the reasons for this lack of success may be that some small capacity
motorcycles (satisfying engine capacity restrictions) are very powerful. This has led to
pressure for the restriction to be framed in terms of power instead of (or in addition to)
capacity. Rogerson, Lambert and Alien (1993) have argued against this, though. They
found that 18.7% of novice riders involved in crashes in Victoria in 1987-90 were not
complying with the 260 cc capacity limitation. They conclude that increasing
compliance with the capacity limitation would result in a greater crash reduction than a
150 kw/tonne laden power to weight restriction.
71
CHAPTER 8:
CONCLUSIONS AND RECOMMENDATIONS
This study was an exploratory one which aimed to assess the magnitude of the problem
of motorcycle-related injuries (both on- and off-road) to children and adolescents, to
characterise the crashes and resulting injuries and to suggest possible countermeasures.
It has shown that motorcycle-related injuries (both on- and off-road) to children and
adolescents constitute a significant public health problem, being responsible for a total
of more than 4000 hospital bed-days and 1868 presentations to Emergency
Departments in Victoria in 1991.
Compared to on-road injuries to young motorcyclists, little is known about the
problem of off-road injuries. This is largely because no organisation has responsibility
for the safety of off-road motorcycling.
While Vic Roads and the Victoria Police have responsibility for road trauma, analyses
of hospital admission data (Victorian Inpatient Minimum Dataset - VIMD) showed
that Police-reported data account for only 80.4% for 18-20 year old motorcyclists
involved in on-road crashes and only 37.4% for under 18 year olds in on-road crashes.
RECOMMENDA TIONS TO REDUCE MOTORCYCLE-RELATED
TO CHILDREN AND ADOLESCENTS
INJURIES
1.
Helmets should be made mandatory for off-road riding to reduce the frequency
of head injuries. Further investigations of helmet performance (including
retention) should be undertaken to attempt to reduce head injuries to helmeted
motorcyclists.
2.
Motorcyclists be educated about the value of protective clothing and be
encouraged to wear it. Off-road motorcyclists are less likely to suffer external
injuries if wearing protective clothing.
3.
That further investigations be conducted of when children develop the skills
needed for safe motorcycle riding. In the interim, motorcycle riding by very
young riders (perhaps under eight years) should be discouraged because of the
likelihood of insufficient development of motor coordination.
4.
That riders should be sufficiently tall to allow effective reach and manipulation of
controls and sufficiently heavy to allow effective control of the motorcycle.
Guidelines on minimum rider heights (for various styles and sizes of
motorcycles) and a minimum ratio of weight of rider to weight of motorcycle be
developed and distributed to retailers to advise intending purchasers and to offroad motorcycle clubs.
72
5.
That riders be informed of the very high risks associated with riding a different
motorcycle for the first (or second) time, even if they are experienced riders.
The risk of riding a different motorcycle could be minimised by riding in an area
free of obstacles, riding more slowly and wearing protective gear.
6.
That an appropriate government authority (or authorities) take authority for offroad motorcycle safety.
7.
That the extent and nature of under-reporting of on-road crashes be considered
when benefit cost ratios for countermeasures are developed.
8.
Improvements to enforcement to reduce the high incidence of unlicensed riders
and unregistered motorcycles in on-road crashes. These problems are likely to
be contributing to crash risk because many unlicensed riders are inexperienced in
riding in traffic and some unregistered motorcycles are unsuitable for on-road
use.
9.
More widespread testing for alcohol in riders after motorcycle crashes, even if
riders are young and the crash occurs off-road. This would improve knowledge
about the role of alcohol in these crashes and possibly act as a deterrent to drink
riding.
10.
That parents be made aware through retailers and off-road motorcycle clubs that
slowing down motorcycles for young riders will not eliminate injuries warranting
hospital admission.
11.
Further investigations into improving protection for the limbs is warranted
because of the high incidence of fractures.
73
REFERENCES
Accident Prevention Committee, Canadian Paediatric Society. (1987). Two-, three- and four-wheel
unlicensed off-road vehicles. Canadian Medical Association Journal, 136, 119-120.
Adams, A., Collingwood, v., & Job, R. F. S. (1985). Evaluation of the 1982 Australia Post
Motorcycle Rider Training Scheme (RN3/85). Sydney: Traffic Authority of New South
Wales.
Agricultural Health Unit. (1992). Agbike and all terrain vehicles injury profile.
October 1991. Moree: North West Farmsafe.
November 1990 -
Allan, D. G., Reid, D. c., & Saboe, K. (1988). Off-road recreational motor vehicle accidents:
Hospitalization and deaths. The Canadian Journal of Surgery, 31 (4),233-237.
Andreassen, D. (1992). Trucks, semi-trailers, and motorcycles (ARR 232). Vermont, Melbourne:
Australian Road Research Board.
Anutha, K., & Chladil, M. A. (1989). The geographical distribution of motorcycle accidents in
Tasmania, 1983-1986. Social Science and Medicine, 29, 1003-1008.
Arzemanian, S., Salatka, M., Anderson, C., & Kraus, 1. (1993). Geographic distribution offatal
motorcycle crashes, by design type, in Los Angeles, Orange and San Diego Counties from 1983
- 1985. Journal of Safety Research, 24(2).
Association for the Advancement of Automotive Medicine. (1990). The Abbreviated Injury Scale:
1990 Revision. Illinois: AAAM.
Attewell, R. G. and Dowse, M. J. (1992). Fatal crash types. Analysis of 1988 Fatality File (CRI05).
Canberra: Federal Office of Road Safety.
Australia Post. (1988). Report on Australia Post motorcycle rider injury prevention programme.
Melbourne: OHS Section, Work Environment Unit.
Avery, 1. G. (1979). Motorcycle accidents in teenage males. The Practitioner 222, 369.
Avery,1. G. (1984). Motorcycling injuries in children (letter). British Medical Journal, 289, 1143.
Avery, J. G. (1988).
Sporting motorcycle acidents in children. Public Health, 102, 27-31.
Baker, S. P., O'Neill, B., Haddon, W., Jr. and Long, W. B. (1974). The Injury Severity Score: A
method for describing patients with multiple injuries and evaluating emergency care. Journal
of Trauma, 14, 187-196.
Baker, S. P., Wailer, A., & Langlois, 1. (1991). Motor vehicle deaths in children:
variations. Accident Analysis and Prevention. 23(1): 19-28.
Geographic
Balcerak,1. C., Pancione, K. L., & States, 1. D. (1978). Moped, minibike, and motorcycle accidents.
New York State Journal of Medicine, 78,628-633.
Barry, P. Z. (1970). The role of inexperience in motorcycle crashes. Journal of Safety and Research,
2(4), 229-239.
Batchler, M. W. (1988). Evaluation of the pre-licence motorcycle training course at the New South
Wales Traffic Education Centre (CRn). Canberra: Federal Office of Road Safety.
74
Begg, D. 1., Langley, 1. D., & Chalmers, D. 1. (1990). Road crash experiences during the fourteenth
and fifteenth years of life; an overview. New Zealand Medical Journal, 103, 174-176.
Begg, D. 1., Langley, 1. D., & Reeder, A I. (1993). Motorcycle crashes in New Zealand resulting in
death and hospitalisation 1: Introduction methods and overview. Dunedin: Injury Prevention
Research Unit, University ofOtago Medical School.
Bjornstig, U. L., Bylund, P. 0., Lekander, T, & Brorsson, B. (1985). Motorcycle fatalities in
Sweden. Acta Chirurgica Scandinavica, 151(7),577-581.
Bray,
T, Szabo,
R, Timmerman, L., Yen, L., & Madison, M. (1985). Cost of Orthopedic injuries
sustained in motorcycle accidents. Journal of the American Medical Association, 254 (17),
2452-2453.
Bui, B. B. D. (1992). A study of motorcycle crashes CEWP 92IT8. Melbourne:
Department of Civil Engineering.
Monash University,
Bull, 1. (1988). Motorcycling - a high risk activity. Injury, 19, 3.
Cameron, M. H. (1992). Accident data analysis to develop target groups for countermeasures.
Volume 2: Analysis reports Report No. 47. Melbourne: Monash University Accident
Research Centre.
Carr, W. P., Brandt, D., & Swanson, K. (1981). Injury patterns and helmet effectiveness among
hospitalised motorcyclists. Minnesota Medicine, 64, 521-527.
Cercarelli, L. K., Arnold, P. K., Rosman, D. L., Sleet, D., & Thornett, M. L. (1992). Travel exposure
and choice of comparison crashes for examining motorcycle conspicuity by analysis of crash
data. Accident Analysis and Prevention, 24, 363-368.
Chenier, T c., & Evans, L. (1987). Motorcyclist fatalities and the repeal of mandatory helmet
wearing laws. Accident Analysis and Prevention, 19 (2), 133-139.
Clark, D.W., & Morton, 1. H. (1971). The motorcycle accident: A growing problem. Journal of
Trauma, 11, 230.
Committee on Accident and Poison Prevention. (1987). All-terrain vehicles: Two-, three- and fourwheeled unlicensed motorized vehicles. Pediatrics, 79, 306-308.
Cooper, P. 1., & Rothe, 1. P. (1988). Motorcyclists: Who they are and why they do what they do.
Transportation Research Record, N1168, 78-85.
Corner, 1. P., Whitney, C. W., O'Rourke, N., & Morgan, O. E. (1987). Motorcycle and bicycle
protective helmets CR55. Canberra: Federal Office of Road Safety.
Cracchiolo, A, Blazina, M. E., & MacKinnon, O. S. (1968). Motorcycle injuries to university
students- the high price of the economical motorbike. Journal of the American Medical
Association, 204 (1), 175-176.
Craig, G. R, Sleet, R,
15, 163-166.
& Wood, S. R (1983). Lower limb injuries in motorcycle accidents. Injury,
Cushman, L.A, Good, RG., & States, 1.0. (1990). Psychiatric disorders and motorvehicle accidents.
Psychological Reports, 67,483-489.
Oas De, S., & Pho, R W. H. (1982). Heel flap inuries in motorcycle accidents. Injury, 15, 87-92.
7S
Dillihunt, R. c., Maltby, G. L., & Drake, E. H. (1966). The increasing problem of motorcycle
accidents. Journal of the American Medical Association, 196 (12), 1045-1047.
Dolan, A M., Knapp, 1. F., & Andres, 1. (1989). Three-wheel and four-wheel all-terrain vehicle
injuries in children. Pediatrics, 84 (4), 694-698.
Doolittle, R. P., Brown, R. T., & Boshell, A (1979). Adolescents And Motorcyle Safety: The Case
For Health Advocacy. Pediatrics, 64 (6), 963-965.
Evans, L., & Frick, M. C. (1988). Helmet effectiveness in preventing motorcycle driver and
passenger fatalities. Accident Analysis and Prevention, 20,447-458.
Federal Office of Road Safety. (1988). Analysis of fatal road crashes 1984-85. A ustralia (SRI).
Canberra: FORS.
Fontijne, W. P. 1., Duis, H. G. T., & Klasen, H. (1989). Motorcycle injuries in speed sport for
youngsters. Journal of Sports Medicine and Phys Fitness, 29 (2), 199-201.
Friedman, A (1991). Safety Summit: Report of the 1990 International Motorcycle Safety
Conference. Motorcyclist, February 1991,:33-38.
Fulton, E. 1., & Donne, G. L. (1986). Evaluating ways of making motorcycles more conspicuous to
other road users. In A G. Gale et al (eds.). Vision in vehicles. Elsevier North-Holland,
p.149-.
Gissane, W., Bull, 1., & Roberts, B. (1970). Sequelae of road injuries. A review of one year's
admissions to an accident hospital. Injury. 1(3), 195-203.
Golladay, E. S., Slezak, 1. W., Mollitt, D. L., & Seibert, R. W. (1985). The three wheeler - a menace
to the preadolescent child. The Journal of Trauma, 25, 232-233.
Gottschalk, F. A B. (1984). Amputations following motorcycle accidents. South African Medical
Journal. 66, 108-109.
Greene, M. A, & Metzler, M. H. (1988). Trauma associated with three and four-wheel all-terrain
vehicles. The Journal of Trauma, 28, 391-394.
Haddad, 1.P., Echave, V., Brown, R. A, Scott, H. 1., & Thompson, M. D. (1976). Motorcycle
accidents: A review of77 patients treated in a 3 month period. Journal of Trauma. 16. 550557.
Hancock, P. A, Wulf, G., Thorn, D., & Fassnacht, P. (1990). Driver workload during differing
driving maneuvers. Accident Analysis and Prevention. 22,281-290.
Hargarten, S. (1991). All terrain vehicle mortality in Wisconsin:
American Journal of Emergency Medicine. 9(2), 149-152.
a case study in injury control.
Harris, S. (1990). The real number of road traffic accident casulties in the Netherlands:
survey. Accident Analysis and Prevention, 22 (4),371-378.
a year long
Hasselback, P., & Wilding, H-R. (1987). Accidents involving off-road motor vehicles in a northern
community. Canadian Medical Association Journal. 137, 630-632.
Hancock, P.A, Wulf, G., & Thorn, D. (1990). Driver workload during differing driving maneuvers.
Accident Analysis and Prevention. 22 (3), 281-290.
Henderson, S. A, Graham, H. K., & Piggot, 1. (1987). Death and serious injury in child
motorcyclists. British Medical Journal, 294, 1259.
76
Holubowycz, O. T., Kloeden, C. N., & McLean, A. 1. (1992). Drinking behaviour and other
characteristics of injured drivers and riders (Research Report 2/92). Adelaide: NHMRC
Road Accident Research Unit, The University of Adelaide.
The implication of protective clothing for the active and passive safety of motorcyclists. (English
abstract). (1991). Forschungbericht, 245, 68p.
Injury Prevention Network Newsletter (1991). Motorcycle helmet laws: Questions and answers.
Injury Prevention Network Newsletter, 8 (1).
Insurance Institute for Highway Safety. (1989). Motorcycles.
IIHS facts.
Arlington, VA: IIHS.
INTSTAT. (1988). Day-to-day travel in Australia 1985-86 (CR69). Canberra:
Road Safety.
Federal Office of
Jackes, L. (1984). A survey of small motorcycle and moped owners (Report 84/1). Perth: Police
Department.
Jackson, R. H., Baderman, H., & Craft, A. W. (1984). Motorcycling injuries in children (letter).
British Medical Journal, 289, 1227-1228.
Jackson, R. H., & Craft, A. W. (1979). Injuries to boys who scramble. British Medical Journal,
1979,1624-5.
i
Johansen, P. (1987). Survey of motorcycles in Sydney, 1986 (RN3/87). Sydney: Traffic Authority of
New South Wales.
Kelley, A. B. (1976). Motorcycles and public apathy. American Journal of Public Health 66, 475.
King, P. (1979). The pattern of injury in motor cycle accidents in a country area. Australian and
New Zealand Journal of Surgery, 49(2), 207-210.
Koch, H., & Brendicke, R. (1988). Motorcycle accidents with guardrails (VTI report 343A).
Falkoping, Sweden: Swedish Road and Traffic Institute.
Krane, B. D., Ricci, M. A., Sweeney, W. B., & Deshmukh, N. (1988). All-terrain vehicle injuries - a
review at a Level 11Trauma Center. The American Surgeon, 54, 471-474.
Kraus,1. F., Riggins, R. S., & Franti, C. E. (1975). Some epidemiologic features of motorcycle
collision injuries - I Introduction, methods and factors associated with incidence American
Journal of Epidemiology, 102(1), 74-98.
Kraus,1. F., Riggins, R. S., & Franti, C. E. (1975). Some epidemiologic features of motorcycle
collision injuries - 11Factors associated with the severity of injuries. American Journal of
Epidemiology, 102(1),99-109.
Kraus,1. F., Anderson, c., Zador, P., Williams, A., Arzemanian, S., Li, w., & Salatka, M. (1991).
Motorcycle Iicensure, ownership and injury crash involvement. American Journal of Public
Health, 81 (2), 172-176.
Lake, R. (1992). Serious motorcycle accidents in Queensland: A loglinear analysis of accident data
(Report RUB92-003). Brisbane: Queensland Department of Transport.
Langley,1. D., Begg, D. 1., & Reeder, A. I. (1993). Motorcycle crashes in New Zealand resulting in
death and hospitalisation 11: Traffic crashes. Dunedin: Injury Prevention Research Unit,
University of Otago Medical School.
77
Larsen, C. F., & Hardt-Madsen, M. (1987). Fatal motorcycle accidents and alcohol. Forensic
Science International. 33, 165-168.
Leaman, A., & Fitch, M. (1986). Perception of risk in motorcyclists. Archives of Emergency
Medicine, 3, 199-201.
Luna, G. K., Maier, R v., Sowder, L., Copass, M. K., & Oreskovich, M. R (1984). The influence of
ethanol intoxication on outcome of injured motorcyclists. The Journal of Trauma, 24(8), 695700.
Lynn, P. (1990). Factors affecting the accident liability of motorcyclists - an analysis of survey data
(Contractor Report 146). Crowthorne, Berkshire: Transport and Road Research Laboratory.
Margolis, 1. L. (1988). All-terrain vehicle accidents in Maine. The Journal of Trauma, 28, 395-399.
Mason, M.A. (1984). Children on motorcycles: a cause for concern. British Medical Journal, 289,
854-855.
Matzsch, T., & Karlsson, B. (1986). Moped and motorcycle accidents - similarities and
discrepancies. The Journal of Trauma, 26, 538-543.
May,
c., & Morabito, D. (1989). Motorcycle helmet use, incidence of head injury, and cost of
hospitalization.
Journal of Emergency Nursing, 15 (5),389-392.
McDavid, J. c., Lohrmann, B. A., & Lohrmann, G. (1989). Does motorcycle training reduce
accidents? Evidence from a longitudinal quasi-experimental study. Journal of Safety
Research, 20, 61-72.
McLean, A. 1., Chen, P. C. Y., Wong, T. W., & Ukai, T. (1990). Comparative study of motorcycle
accidents (Report 2/90). Adelaide: NH&MRC Road Accident Research Unit.
McSwain, N. E. (1990). Helmet use, patterns of injury, and medical outcome among motorcycle
drivers in Maryland. In 34th Annual Proceedings, Association for the Advancement of
Automotive Medicine, October 1-3, 1990, Scottsdale, Arizona.
McSwain, N. E., & Belles, A. (1990). Motorcycle helmets - medical costs and the law. Journal
ojTrauma. 30(10),1189-1199.
Muller, A. (1980). Evaluation of the costs and benefits of motorcycle helmet laws. American
Journal of Public Health, 70(6), 586-592.
Namdaran, F., & Elton, R. A. (1988). A study of reported injury accidents among novice motorcycle
riders in a Scottish region. Accident Analysis and Prevention, 20 (2), 117-121.
O'Connor, P. 1. (1989). Review of 250cc limit for novice motorcyclists. Paper presented to the Road
Safety Researchers Conference. South Australia: Ofjice of Road Safety, South Australia,
Ofjice of Road Safety.
0lson, P. L., Halstead-Nussloch, R, & Sivak, M. (1980). Enhancing motorcycle and moped
conspicuity. In Proceedings of the International Motorcycle Safety Conference. Washington,
D.e. 18-23 May, VoI Ill, 1029-1057.
Ouellet, 1. V. (1982). Environmental hazards in motorcycle accidents. Proceedings. American
Association for Automotive Medicine 26th Annual Conference, October 4-6, 1982, Ottawa,
117-129.
Oxley,1. A., & Fildes, B. N. (1993). Pilot study of the long-term effects of road crashes (CRI16).
Canberra: Federal Office of Road Safety.
78
Palmer, M. (1993). How to survive a fatal accident. Motorcycle Rider, 2(64), 28-29.
Paulson, 1.A. (1988). The epidemiology of injuries in adolescents.
Pediatric Annals, 17(2), 84-96.
Pegg, S. P., & Mayze, T. D. (1980). The pattern of burn injuries associated with motor cycles
(Research Report U80). Brisbane: Queensland Department of Transport.
Pelz, D. C., & Schuman, S. H. (1971). Are young drivers really more dangerous after controlling for
exposure and experience. Journal of Safety Research, 3(2),68-79.
de Peretti, F., Cambas, P. M., Veneau, B. and Argenson, C. (1993). Le reservoir d'essence des
motocycles. Role dans les traumatismes graves du pelvis. Presse Med. 22(2),61-63. (French
article, English abstract, abstract in Index Medicus)
Place, M. (1979). Injuries to boys who scramble. British Medical Journal, i, 1322.
Place, M. (1979). Injuries to boys who scramble (letter). British Medical Journal, ii, 48.
Postl, B. D., Moffat, M. E. K., Black, G. B., & Cameron, C. B. (1987). Injuries and deaths
associated with off-road recreational vehicles among children in Manitoba. The Canadian
Medical Association Journal, 137, 297-300.
Potter, 1. B. (1973). Motorcycles: New dimension.
Highway User, May 73, 19-21, 31.
Prower, S. (1991). Legislative round-up. Motorcycle Rider, 2(53),29-30.
Purkiss, S. F. (1990). Motorcycle injuries in Bermuda. Injury, 21, 228-230.
Rabreau,1.-P.(1982).
La moto et les adolescents.
Sfpea, Journee, 8-9, 428-431.
Ravinder, S. (1987). Motorcycle conspicuity: An overview of research findings and strategies for
the future (RN4/87). Sydney: Traffic Authority of New South Wales.
Reeder, A. 1., Chalmers, D. 1., & Langley, 1. D. (1992). Motorcycling attitudes and behaviours.
12 and 13 year old adolescents. Journal of Paediatrics and Child Health, 28, 225-230.
1.
Reeder, A. 1., Chalmers, D. 1., Langley, 1. D., & Begg, D. 1. (1992). Motorcycling attitudes and
behaviours. 11. 142 and 15 year old adolescents. Journal of Paediatrics and Child Health, 28,
387-394.
Rivara, F. P. (1988). Motor vehicle injuries during adolescence.
Pediatric Annals, 17 (2), 107-113.
Road Safety Committee. (1993). Report upon the inquiry into motorcycle safety in Victoria.
Melbourne: Parliament of Victoria.
Road Traffic Authority. (1987). Victorian rider. Official guide to the motorcycle roadcraft test.
Melbourne: RT A.
Rockett, 1. R. H., Lieberman, E. S., Hollinshead, W. H., Putnam, S. L., & Thode, H. C. (1990). Age,
sex and road-use patterns of motor vehicular trauma in Rhode Island: A population-based
hospital emergency department study. American Journal of Public Health, 80, 1516-1518.
Rodgers, G. B. (1990). The effectiveness of helmets in reducing all-terrain vehicle injuries and
deaths. Accident Analysis and Prevention, 22, 47-58.
79
Rogers, C. D., Pagliarello, G., & Nelson, W. R. (1990). Environmental and rider related factors in
snowmobile, all-terrain vehicle and dirtbike crashes. 34th Annual Proceedings, Association
for the Advancement of Automotive Medicine, October 1-3, 1990, Scottsdale Arizona.
Rogerson, P., Lambert, 1., & Allen, P. (1992). Motorcycle accident involvement by power to weight
ratio for novice and experienced riders (Report GR92-11). Melbourne: Vic Roads.
Rogerson, P., Lambert, 1., & Allen, P. (1993). Motorcycle accident involvement by power to weight
ratio for novice and experienced riders. Paper presented at the Road Safety Researchers
Conference, Adelaide, December 1993.
Romano, P. S. and McLoughlin, E. (1991). Helmet use and fatal motorcycle injuries in California,
1987-1988. Journal of Head Trauma Rehabilitation, 6(2), 21-37.
Rosson, 1. W. (1988). Closed traction lesions of the brachial plexus - an epidemic among young
motorcyclists. Injury, 19, 4-6.
Saunders, R. A., & Wheeler, T. 1. (1987). Statements made to police and road traffic accident
analysis. Journal of the Royal Society of Health, 107 (6),227-230.
Shankar, B. S., Ramzy, A. 1., Soderstrom, C. A., Dischinger, P. c., & Clark, C. C. (1992). Helmet
use, patterns of injury, medical outcome and costs among motorcycle drivers in Maryland.
Accident Analysis and Prevention, 24, 385-396.
Sherman, K., & Mackinnon, 1. (1984). Motorcycling injuries in children. British Medical Journal,
289, 877-878.
Simpson, D. A., Brazenor, G. A., Dan, N. G., & McLean, A. 1. (1992). Medical certificates
exempting motorcyclists from wearing helmets: An Australian experience. Journal of Traffic
Medicine, 20(4), 171-176.
Smith, D. 1., Buehler, 1. W., Sikes, R. K., Goodman, R. A., & Rogers, D. L. (1986). Motorcycleassociated fatalities in Georgia, 1980-81. South Medical Journal, 79 (3), 291-294.
Social Development Committee. (1992). Inquiry into motorcycle safety in Victoria. First report.
Motorcycle visibility. Melbourne: Parliament of Victoria.
Soderstrom, C. A., Dischinger, P. c., Shiu, M. H. and Soderstrom, M. T. (1993). Alcohol use, driving
records, and crash culpability among injured motorcycle drivers. Accident Analysis and
Prevention, 25(6), 711-716.
Sos in, S. M., Sacks, 1. 1., & Holmgreen, P. (1990). Head injury - associated deaths from motorcycle
crashes. Journal of the American Medical Association, 264 (18), 2395-2399.
South Australian Health Commission.
Bulletin, No.4.
(1986). Road accidents. Injury Surveillance Monthly
Speca, 1.M., & Conwell, H. R. (1975). Minibike and motorcycle accidents in adolescents:
epidemic. Journal of the American Medical Association, 232(1), 55-56.
Stillwell,1.
A new
H. (1978). Motor-cycle scrambling injuries in boys. British Medical Journal, i, 758.
Taylor, M. c., & Lockwood, C. R. (1990). Factors affecting the accident liability of motorcyclists
A multivariate analysis of survey data (RR270). Crowthorne, Berkshire: Transport and
Road Research Laboratory.
Thomson, G. A. (1980). The role frontal motorcycle conspicuity has in road accidents. Accident
Analysis and Prevention, 12, 165-178.
-
80
Torpey, S., Ogden, K., Cameron, M. and Vulcan, P. (1991). Indicative benefitlcost analysis of road
trauma countermeasures. Interim report for discussion. Melbourne: Monash University
Accident Research Centre.
Tunbridge, R, Everest, 1. T., Wild, B. R, & Johnstone, R. A. (1988). An in-depth study of road
accident casualties and their injury patterns (Report. 136). Berkshire: Transport and Road
Research Laboratory.
Van Muiswinkel, W. 1. (1994). Optionsfor improvement infarm motorcycle safety. Literature review.
Moree: Australian Agricultural Health Unit.
Vaughan, R. G., Pettigrew, K., & Lukin, 1. (1977). Motorcycle crashes: A level two study Report
No. 2/77). Sydney: Traffic Accident Research Unit, Department of Motor Transport.
WaIler, A. E., Baker, S. P., & Szocka, A. (1989). Childhood injury deaths: National analysis and
geographic variations. American Journal of Public Health, 79, 310-315.
Watson, P. (1990). Motorcycle casulties - A time bomb? How long to the fuse? Journal of Traffic
Medicine. 18,95-99.
Watson, G. S., Zador, P. L., & Wilks, A. (1980). The repeal of helmet laws and increased
motorcyclist mortality in the United States, 1975-1978. American Journal of Public Health,
70 (6), 579-585.
Wegman, F. C. M. (1992). Young moped riders: Reducing high risks and high insurance premiums.
Paper presented at the International Conference on Automobile Insurance and Road Accident
Prevention, Amsterdam, 6-8 April 1992.
Weisbuch, J. B. (1987). The prevention of injury from motorcycle use: Epidemiologic success,
legislative failure. Accident Analysis and Prevention, 19 (1), 21-28.
Westman,1.
A.,
& Morrow, G. (1984). Moped injuries in children. Pediatrics, 74(5),820-822.
Widome, M. E. (1989). On the relevance of poor judgement.
Pediatrics, 84, 724-726.
Wiley,1. 1. (1986). The dangers of off-road vehicles to young drivers. Canadian Medical
Association Journal, 135, 1345-1346.
Wiley,1. 1., Mclntyre, W. M., & Mercier, P. (1986). Injuries associated with off-road vehicles
among children. Canadian Medical Association Journal, 135, 1365-1366.
Wilson-MacDonald, 1., Sherman, K., & Mackinnon, 1. (1987). Off-the-road motorcycling injuries
1982-1985. Injury, 18, 196-198.
Wong, T-W, Lee, 1., Phoon, w., Yui, P., Fung, K., & McLean, 1. A. (1990). Driving experience and
the risk of traffic accident among motorcyclists. Social Science and Medicine, 30 (5), 639-640.
Wong, T. W., Phoon, W. 0., Lee, 1., Yiu, P. c., Fung, K. P., Smith, G., & McLean, A. 1. (1989).
Nonfatal injuries among motorcyclists treated as in-patients in a general hospital. Annals
Academy of Medicine, Singapore, 18 (6),672-4.
Wong, T. w., Phoon, W. 0., Lee, 1., Yiu, I. P. C., Fung, K. P., & Smith, G. (1990). Motorcyclist
traffic accidents and risk factors: A Singapore study. Asia-Pacific Journal of Public Health,
4(1), 34-38.
Wood, T., & Brown, R (1987). Evaluation of the revised motorcycle learner permit scheme July
1983 to December 1985. Summary report (GR/87/13). Melbourne: Road Traffic Authority.
81
Yuhara, N., Oguchi, y. and Ochiai, H. (1993). Riding simulator in safe driving education - A method
to evaluate the effectiveness and the simulated fidelity of necessary functions using fuzzy
relation. IATSS Research, 17(1), 54-71.
Zellmer, H. (1993). Investigation of the performance of motorcycle helmets under impact conditions.
37th Stapp Car Crash Conference Proceedings P-269. Warrendale, PA: SAE International.
933113. (pp.59-67)
82
APPENDIX 1. EXTERNAL CAUSE OF INJURY CODES USED TO
IDENTIFY MOTORCYCLISTS IN THE VICTORIAN INPATIENT
MINIMUM DATASET
On-road
Reentrant collision with another vehicle
811.2 Motorcyclist
811.3 Passenger
Collision with another motor vehicle including parked, stopped etc.
812.2 Motorcyclist
812.3 Passenger
Collision with other (nonmotor) road vehicle
813.2 Motorcyclist
813.3 Passenger
Other collision (due to loss of control) with features etc.
815.2 Motorcyclist
815.3 Passenger
Loss of control without collision on highway
816.2 Motorcyclist
816.3 Passenger
Other noncollision (includes falls from)
818.2 Motorcyclist
818.3 Passenger
Motor vehicle traffic accident of unspecified nature
819.2 Motorcyclist
819.3 Passenger
Off-road
Nontraffic accident involving other off-road motor vehicle
821.2 Motorcyclist
821.3 Passenger
Other motor vehicle nontraffic accident involving collision with moving object
822.2 Motorcyclist
822.3 Passenger
Other motor vehicle nontraffic accident while boarding or alighting
825.2 Motorcyclist
825.3 Passenger
83
APPENDIX 2: INTERVIEW FORM AND INJURY CODING FORM FOR
FOLLOW-UP STUDY OF INJURED MOTORCYCLISTS
MONASH UNIVERSITY ACCIDENTREsEARCH CENTRE
MOTORCYCLE
INJURIES STUDY
PATIENT INTERVIEW
MUARC Case No
UR Number:
.
.
Hospital:
Personal Details
Age:
Sex:
Residential Postcode:
Motorcyclist
.
.
/ Passenger
(circle one)
If motorcyclist,
Licence status :
Trail Bike
Unlicensed / Learner's Permit
Probationary
Full Licence
Car Licence status:
Unlicensed (can drive/never driven)
Learner's Permit / Probationary / Full Licence
Training:
Experience:
(please describe type and duration)
(how long have you been riding and how often do you ride?)
.
Any previous motorcycle related injuries?
YES / NO
If YES, please give details
............................................................................
...........................................................................
............................................................................
Motorcycle / Trail-bike Details
Own motorcycle?
YES / NO
If NO, whose bike was it?
If NO, do you own a bike?
How familiar with the bike were you?
............................................................................
............................................................................
If passenger:
Do you ride a motorcycle yourself!
YES / NO
If YES, what is your licence status:
Unlicensed / Learner's Permit / Probationary / Full Licence
If NO, how often had you travelled as a motorcycle passenger?
Regularly / Sometimes / Rarely / Once
Motorcycle / Trail-bike Details
Make:
Model:
Engine Capacity:
CC.
Registered / Unregistered (circle one)
Was the headlight on/off at time of crash? (circle one)
Accident Details
Location:
On-road I Off-road
Location postcode:
.
Describe in detail the area where accident occurred :
( e.g. paved roadway, intersection with tram tracks in shopping area; muddy, rough bush
track on private property)
..............................................................................................................
Purpose of trip :
Date:
Day of Week:
Time:
Light I Dark
Season:
Weather Conditions :
Protective Clothing :
Helmet worn
Other protective clothing
YES I NO
YES I NO
If YES, please list :
Was another vehicle involved?
YES I NO
If YES, what type of vehicle was it?
.
What type of accident was it?
Collision
Loss of control
Other (please describe)
............................................................................
Please describe what happened (including what you think caused the accident)
What injuries did you suffer as a result of the accident?
..............................................................................................................
..............................................................................................................
..............................................................................................................
..............................................................................................................
What do you think caused each of these injuries? (e.g struck vehicle, fall, crush, bum, etc.)
Were there any other factors which you feel may have contributed to the accident or to the
injuries?
How often do you think an average motorcyclist is injured while riding?
Once a month
Once in 6 months
Once a year
Once in 2 years
Once in 10 years
What do you think the chance is of an average motorcyclist being killed while riding a
motorcycle in the next year?
1 in 2
1 in 4
1inlO
1 in 100
1 in 1,000
1 in 1,000,000
What was the approximate speed of the motorcycle/trail-bike at the time of the accident?
....................
Interviewer's
Date
, ..... km/hr
Name
,
.
.
MONASH UNIVERSITY ACCIDENT RESEARCH CENTRE
PA TIENT INFORMATION
case No
.
HOSPITAL
........•....•.............................
PATIENT DETAILS
Age
.
D.O.B
.
1. Blood Alcohol Concentration
HeadlNeck Injuries (ISS Body Regions, maximum AIS)
-----------2. ------------
AIS 90
3.
AIS 90
1.
AIS 90
Face Injuries (ISS Body Region, maximum AIS)
------------
2.
_
AIS 90
AIS 90
AIS 90
3.
Chest Injuries (ISS Body Region, maximum AIS)
1.
2.
3.
-----------------------
.
.
2. INJURIES BY BODY REGION:
1.
Sex
AIS 90
AIS 90
AIS 90
Abdomen and Pelvic Content (ISS Body Region, maximum AIS)
-----------2. -----------1.
3.
AIS 90
AIS 90
AIS 90
Extremity and Pelvis (ISS Body Region, maximum AIS)
1.
----------Sidel (circle)
Left
AIS 90
Right
2.
Unknown
AIS 90
Side2 (circle)
Left
Right
3.
Unknown
AIS 90
Side3 (circle)
Left
Right
Unknown
No. of fractured limbs
External Injuries (ISS Body Region, maximum AIS)
1.
2.
_
------------
3.
AIS 90
AIS 90
AIS 90
3. ISS
4.
Other comments
--------------------------


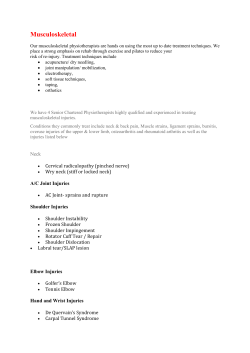


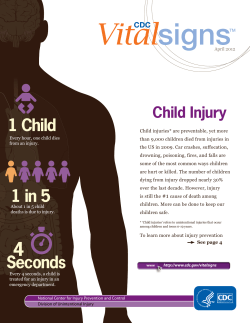

© Copyright 2026