
Nepalese Engineers Association, Japan (NEAJ)
NEAJ Newsletter, Volume 1, Issue 1 Nepalese Engineers Association, Japan (NEAJ) Newsletter Volume 1, Issue 1 Contents Activity Reports Technical Papers Nepalese Engineers Association, Japan (NEAJ) January 2015 i NEAJ Newsletter, Volume 1, Issue 1 First Executive Committee, NEAJ President Er. Dr. Badri Bhakta Shrestha Vice President Secretary Er. Dr. Priza Kayestha Er. Pawan Kumar Bhattarai Treasurer Er. Khagendra Belbase Member Member Member Er. Amit Regmi Er. Anu Aryal Er. Sapana Poudel Contact Address Nepalese Engineers Association, Japan (NEAJ) Email: [email protected] http://www.neajc.org/ ii NEAJ Newsletter, Volume 1, Issue 1 NEAJ Sub-Committees Professional Relation Committee Er. Badri Bhakta Shrestha (Coordinator) Er. Achyut Sapkota (member) Er. Binaya Kumar Mishra (member) Er. Chandi Subedi (member) Er. Ved Kafle (member) Membership Management Committee Er. Khagendra Belbase (Coordinator) Er. Amit Regmi (member) Er. Priza Kayestha (member) Publication Committee Er. Pawan Kumar Bhattarai (Coordinator) Er. Khagendra Belbase (member) Er. Sapana Poudel (member) Event Management Committee Er. Priza Kayestha (Coordinator) Er. Amit Regmi (member) Er. Pawan Kumar Bhattarai (member) Webpage Management Committee Er. Anu Aryal (Coordinator) Er. Badri Bhakta Shrestha (member) Er. Sapana Poudel (member) iii NEAJ Newsletter, Volume 1, Issue 1 EDITORIAL The publication committee of NEAJ presents its first volume and first issue of NEAJ Newsletter. This issue reports on recent activities of NEAJ and also includes technical papers. The editorial and publication committee would like to thank all of those who have contributed in their own ways to make this issue possible. We hope that you will enjoy reading this issue. Thank you! With Best Regards, Guest Editor Badri Shrestha Publication Committee Pawan Kumar Bhattarai Khagendra Belbase Sapana Poudel iv NEAJ Newsletter, Volume 1, Issue 1 President's Message I am very pleased to write my few words for first issue of NEAJ Newsletter. This is the first publication of the newly restructured organization NEAJ. This issue includes activities of NEAJ and some technical papers from various fields. I would like to thanks all colleagues, specially our editorial and publication committee to prepare it. The NEAJ is an organization of Nepalese engineers established to facilitate mutual cooperation and support for the professional welfare and development among Nepalese engineers residing in Japan and to effectively contribute and play the role of Nepalese engineers community for the development of the country. Formerly, Nepalese engineers residing in Japan established Nepal Engineers Association-Japan Center (NEA-JC) on March 24, 2003 according to Act-13(2) of the Nepal Engineers’ Association (NEA) constitution (3rd amendment). The general assembly members officially dissolved NEA-JC and established the newly restructured organization “Nepalese Engineers Association, Japan (NEAJ)” through general assembly meeting held from 19 April 2014 to 25 June 2014. The new restructured organization NEAJ was established on 25 June 2014. The first executive committee, have formally assumed office of the tenure from 1 August 2014. We, the executive committee, are trying our best to strengthen newly born NEAJ and to achieve its objectives. This publication of newsletter is definitely a symbol of progress for NEAJ. I am fully confident that this will help strengthening Nepalese engineers community for the development of the country and make our activities more vibrant. I hope that the publication of NEAJ newsletter will get continuity in the future with the support from all NEAJ colleagues. Thank you Best Regards Badri Bhakta Shrestha President, NEAJ v NEAJ Newsletter, Volume 1, Issue 1 NEAJ Newsletter Volume 1, Issue 1 Contents 1. Activity Reports ……………………………………………………. 1 2. Technical Papers …………………………………………………… 4 DECISION SUPPORT SYSTEM FOR SUSTAINABLE WATER RESOURCES MANAGEMENT - B. K. Mishra, S. Herath, D.S. Sampat, K. Fukushi, S. B. Weerakoon ………5-10 RAINFALL-BASED LANDSLIDE AND DEBRIS FLOW FORECASTING APPROACH - Badri Bhakta Shrestha …………………………………………………………....11-16 AN OVERVIEW OF RIVER WATER ENVIRONMENT IN KATHMANDU VALLEY - Ram Krishna Regmi, Binaya Kumar Mishra, Pingping Luo, Asako Toyozumi-Kojima, Kensuke Fukushi, Kazuhiko Takemoto, Niranjan Shrestha ..…………………………………………………..17-22 RAINFALL RUNOFF MODELLING FOR FLOOD FORECASTING (A CASE STUDY ON WEST RAPTI WATERSHED) – Rocky Talchabhadel, Narendra Man Shakya ..……………………………………………………………………………………………….23-27 vi NEAJ Newsletter, Volume 1, Issue 1 Activity Reports Skype Discussion Meeting Engineering Approach on Natural Disaster Mitigation: A “Skype Discussion Meeting on Natural Disaster Mitigation: Engineering Approach” was organized on 31st August 2014 (13:30 – 15:30). The main agenda of the meeting was discussion on possible application of engineering technologies for natural disaster mitigation in Nepal. The main discussion point and ideas are summarized as below. Discussion and Ideas: (1) Er. Chandi Subedi briefly explained about possible application of IT solutions for disaster mitigation and management in context of Nepal including introduction of Raspberry PI, challenges and further actions to implement a pilot project for disaster mitigation in Nepal. Er Chandi also mentioned that Raspberry PI can put in riverbed and detect temperature, river water level, flow velocity, or some other geological vibration and these data can be transmitted via IP to local government or other central monitoring body and alert the inhabitants before the disaster. This technology also could be useful for landslide monitoring and issuing the warning. (2) Er. Dr. Ved Kafle shared hand-on experience with Raspberry Pi kit and pointed that the sensors and communication modules would incur additional monetary and battery-power. Raspberry Pi is a computing board that includes a CPU, 256 or 512 MB memory, SD card for storage, USB and serial slots. It doesn't include any sensors or radio communication units. It runs Raspbian (Linux like) OS over which TCP/IP communication protocols and applications can be implemented easily. WiFi or Zigbee (e.g. XBee) radio modules, and different sensor modules (eg. location, temperature, pressure, humidity, light) can be attached easily through the serial slots. (Source: Er. Ved Kafle) (3) For practical application of Raspberry Pi technology for landslide monitoring and early warning system, it was discussed to implement prototype project at first for checking reliability of this technology for landslide monitoring and issuing early warning. (4) Collaboration with geotechnical engineers is also necessary to implement landslide mitigation project in Nepal. (5) For sustainable implementation of pilot project and also for regular monitoring, participation of local community would be better option. To overcome socio-economic problem, it would be better to provide some application to community and collect data from users. (6) Collaboration is also necessary with other IT experts/professional, particularly for data transmission. 1 NEAJ Newsletter, Volume 1, Issue 1 Research grant to assist the Masters level thesis Nepalese Engineers Association, Japan (NEAJ) has decided to provide research grant from President Fund of NEAJ to assist the Masters Level Thesis of the students of engineering studying in academic institute in Nepal. The call on application for research grant to assist the Masters level thesis was announced and it is currently in selection process. The detail information about the grant support is available at following NEAJ website. http://www.neajc.org/2014/11/21/call-for-research-grant-to-assist-the-masters-level-thesis/ Organization of 8th NEAJ Symposium on Current and Future Technologies The 8th “NEAJ symposium on Current and Future Technologies” is going to be organized in TOKYO on January 25 (Sunday), 2015. Presentations are invited from Nepalese and non-Nepalese academics, researchers, experts and students. Presentations by working people in different Japanese companies are also encouraged to share their ideas and experiences. The basic aim of this symposium is to provide a common platform for students, researchers and people working in different kinds of industries to share their findings, knowledge and experiences. By doing so, we can help in transferring technologies, experiences, ideas to different Nepalese friends and ultimately to our home country. Date, Time and Venue: January 25, 2015 (Sunday) 10:00 A.M to 5:00 P.M. Interactive Dinner: 5:30 P.M to 7:30 P.M. Venue: Seminar A (4th floor, room number 406), Engineering building Number 1 Hongo Campus, the University of Tokyo Bunkyo-ku, Tokyo, 113-8656, Japan The detail information is available at http://www.neajc.org/2014/11/29/8thneajsymposium/ Further inquiries: [email protected] 2 NEAJ Newsletter, Volume 1, Issue 1 Other Activities: NEAJ Sub-committees were formed. Designing of NEAJ Logo: The NEAJ logo was designed. The new group mailing system of NEAJ was created. The NEAJ bank account has been opened. The NEAJ home page was updated. The NEAJ membership list is updating. The NEAJ membership application form is prepared. Information/Notice To all NEAJ Colleagues, If you have not yet joined NEAJ mailing system, please contact us to join NEAJ group mail system as soon as possible. For Membership Application of NEAJ: http://www.neajc.org/membershipapp/ or Contact us by email at: [email protected] 3 NEAJ Newsletter, Volume 1, Issue 1 Technical Papers 1. DECISION SUPPORT SYSTEM FOR SUSTAINABLE WATER RESOURCES MANAGEMENT - B. K. Mishra, S. Herath, D.S. Sampat, K. Fukushi, S. B. Weerakoon ………5-10 2. RAINFALL-BASED LANDSLIDE AND DEBRIS FLOW FORECASTING APPROACH - Badri Bhakta Shrestha …………………………………………………………...11-16 3. AN OVERVIEW OF RIVER WATER ENVIRONMENT IN KATHMANDU VALLEY - Ram Krishna Regmi, Binaya Kumar Mishra, Pingping Luo, Asako Toyozumi-Kojima, Kensuke Fukushi, Kazuhiko Takemoto, Niranjan Shrestha ..………………………………………17-22 4. RAINFALL RUNOFF MODELLING FOR FLOOD FORECASTING (A CASE STUDY ON WEST RAPTI WATERSHED) – Rocky Talchabhadel, Narendra Man Shakya ..…………………………………………………………………………………………….23-27 4 NEAJ Newsletter, Volume 1, Issue 1 DECISION SUPPORT SYSTEM FOR SUSTAINABLE WATER RESOURCES MANAGEMENT B. K. Mishra, United Nations University – Institute for the Advanced Study of Sustainability, Tokyo, Japan S. Herath, United Nations University – Institute for the Advanced Study of Sustainability, Tokyo, Japan D.S. Sampath, Department of Civil Engineering, University of Peradeniya, Sri Lanka K. Fukushi, Integrated Research Systems for Sustainability Science, University of Tokyo, Japan S. B. Weerakoon, Department of Civil Engineering, University of Peradeniya, Sri Lanka Abstract: The ancient irrigation tank systems in Sri Lanka have been playing a crucial role for agricultural water supply. These systems also constitute one of the richest sources of wetland biodiversity in the country. In recent years, these tanks are found to be less effective due to increasing water demands for irrigation, climate change, variability and several others. A key issue with these ancient tanks is seasonality and duration of water retention. Several structural and non-structural measures are being made to tackle the problems of water shortage. Deduru Oya reservoir Project, under construction, will supply irrigation water to existing farm area under village tank systems as well as new farm area through a network of canals. Water supply and demand situations were tested for normal and drought climatic scenarios. Water Evaluation And Planning (WEAP) was applied to test the water shortage along the left bank canal irrigation systems. The results pointed out that tanks will get dried in some months in drought year if the farmers are allowed to withdraw water conventionally (i.e. farmers are free to withdraw water as they wish). Simulations of the WEAP model suggested that there will not be any irrigation water scarcity for some changes in usual withdrawal. Additionally, water levels will not get very low during the dry season and many tanks will not dry out resulting little loss of biodiversity. Keywords: Decision support systems, Irrigation water requirement, Water evaluation and planning. support system [1,2], to evaluate water supplies and demands in Deduru river reservoir project system, Sri Lanka. Deduru river reservoir project is aimed to exploit the Deduru basin water resources in improving crop intensities of existing agricultural lands under tank irrigation systems and developing new agricultural lands in the Deduru and adjacent Mee river basins in view of enhancing productivity. Additionally, the project needs to ensure enough water for hydropower and environmental uses. Overall objective of this study is to develop and test water balance at monthly time scale under different supply and demand management scenarios. INTRODUCTION Optimal use of water resources is highly important for the sustainable future. Many emerging and developing countries lack adequate supply of water for irrigation and other uses due to inefficient infrastructural and allocation arrangements. Potential conflicts arising from competing demands of complex water resource systems require a holistic approach to address the various components of water management. The planning of water resource systems brings together an array of technical tools and expertise along with parties of varied interests and priorities. This research aims to enhance resilience of rural community by integrating traditional (ancient tanks) and modern (reservoir) agricultural systems using water and evaluation planning (WEAP) tool, a decision 5 NEAJ Newsletter, Volume 1, Issue 1 Figure 1 : Location and topography of the Deduru Oya basin, Sri Lanka. very low flows in the stream usually during January, February, July and August months. The water available with the rainfall and collected in the existing tanks is not sufficient for two season cultivation. Seventy percent of annual rainfall in the region flows to ocean without being utilized in any way to serve needs of the local population. As a result, an optimal level of agricultural development has not been achieved. STUDY AREA Deduru Oya river basin is one of the major river basins of Sri Lanka. It is located between 7.32N and 7.86N latitudes, and 79.79E and 80.58E Longitudes. The Deduru Oya river has a length of 115 km and flows through, Matale, Kurunegala and Puttalama Districts. The Deduru Oya river basin has a catchment area of 2620 km2. Location of the basin in Sri Lanka and topography of the basin are shown in Figure 1. Annual rainfall in Deduru Oya region varies from 1100 mm to 2600 mm. The rainfall pattern in the basin shows two clear peaks in the months of April/ May and October/November and the minima are in February and August. Monthly evaporation in the area is averaged 1250 mm. Farmers in Deduru Oya river and adjacent Mee Oya river basins complain non-availability of an assured water supply for the agricultural areas. Large part of the agricultural land is paddy crops. Potential water resources in the basin are: direct rainfall, stream flow, surface (tanks) water storage and groundwater storage. Quantity of water availability varies spatially and temporally across the basin significantly. There are METHODOLOGY Development of a decision support system for managing water shortages in the project area consists four major components (Figure 2): (i) office and field visits for determining key planning issues and collecting hydroclimatic, tank/reservoir, crop and other datasets; (ii) estimation of water demands considering paddy crop irrigation water, hydropower and environmental requirements; (iii) estimation of available water supplies considering tank and reservoir storages; and (iv) water evaluation and planning for different hydroclimatic conditions, water allocation arrangements and system efficiencies. 6 NEAJ Newsletter, Volume 1, Issue 1 Figure 2: Schematic of water supply and demand management Cropwat by FAO Land and Water Development Division enabled to estimate irrigation water requirement for rice crops, the main agricultural water demand. Literature review and discussions with local officials enabled to estimate environmental and hydropower requirements. A conceptual rainfall-runoff model, Simhyd, was employed to generate tank inflows [3]. Monthly normal and dry year flow corresponding to 50% and 80% probability of exceedance in ancient tanks along the left bank canal and Deduru river near reservoir site were used as potential water resources. Finally, WEAP model, an integrated water resources management tool, was employed to assess the water supply and demand management scenarios for the Deduru river reservoir project systems. to the amount of water required to compensate for the evapotranspiration loss from the cropped field. Estimation of the CWR is derived from crop evapotranspiration (crop water use) which is the product of the reference evapotranspiration (ETo) and the crop coefficient (Kc).The climatic data (ETo and rainfall) used for the calculations of Irrigation Water Requirement (IWR) is based on Batalagoda station [4]. Information on soil data is based on textural properties ISRIC-WISE global soil data [5]. The soils in the area are predominantly coarse textured, ranging from loamy to sandy loam in the surface horizons and from sandy loam to clay in the subsurface horizon. Red loamy soil type was assumed for the study area after reviewing textural information and ‘preliminary assessment of surface water resources’ [6]. Soil parameters are based on the standard values for Red loamy soil in the Cropwat model sample data sets. Calculation of IWR at scheme level for a given year is the sum of individual CWR calculated for each irrigated crop. Multiple cropping (several cropping periods per year) is thus automatically taken into account by separately computing CWR for each cropping period. Annual irrigation water requirement with system efficiency 0.5 (application efficiency 0.7 × conveyance efficacy 0.7) and 0.6 was found to be 24354 and 20295 cubic meter per hectare respectively. Environmental flow requirement: There is an increasing awareness of the need to release minimum water along a river to ensure the continued functioning of ecological process that provide much needed goods and services for human use and WATER REQUIREMENTS Irrigation Water Requirement: Calculation of irrigation water requirement needs crop, climate and soil data sets of the study area. Paddy (rice) is the main crop in the region accounting for most of the agricultural water demand. The climatic data includes reference evapotranspiration and rainfall. This study used the Cropwat model by FAO Land and Water Development Division for calculation of irrigation water requirement. The irrigation water requirement is defined as the difference between the crop water requirements and the effective rainfall (FAO, 1998). The primary objective of irrigation is to apply water to maintain crop evapotranspiration when rainfall is insufficient. Crop water requirements (CWR) refers 7 NEAJ Newsletter, Volume 1, Issue 1 maintenance of biodiversity. Water which is allocated and made available for maintaining ecological processes in a desirable state is referred as the instream flow requirement, environmental flows, or environmental flow requirement. The allocation of water to satisfy environmental uses initially developed out of the need to release from dams minimum flows to ensure the survival of often a single aquatic species with high economic value. However, the provision of environmental flows that attempt to preserve natural flow characteristics such as timing, frequency, duration and magnitude of flows is considered important for the sustenance of fresh water ecosystems, since the flow regime is one of the major drives of ecological processes on a river. The practice of environmental flow requirement began as a commitment to ensuring a ‘minimum flow’ in the river, often arbitrarily fixed at 10% of mean annual runoff. However, this ‘minimum flow’ approach may not be appropriate for safeguarding essential downstream environmental conditions of the river system. In this study, a minimum of 10% normal climatic year monthly river discharge has been ensured as environmental flow requirement for testing the water supply and management scenarios. Hydropower requirements: The project is supposed to have a small hydropower scheme. The hydropower station of 1.5 MW (3 units of 0.5 MW capacity) is planned to be located just downstream of the reservoir so that water released for downstream irrigation schemes and environmental use can be utilized for power generation. This water will be diverted into the river after power generation. According to feasibility study project report, a discharge of 7 m3/s will be necessary to be released for the generation of 1.5 MW hydropower. determines the infiltration capacity. The excess rainfall that exceeds the infiltration capacity becomes infiltration excess runoff. Moisture that infiltrates is subjected to a soil moisture function which diverts the water to the stream (interflow), groundwater store (recharge) and soil moisture store. Calibration and validation of the rainfall-runoff model was carried out using hydroclimatic data at Tittawela tank. The Tittawela tank has drainage area of 2.95 km2. Calibration of the model was performed over the period 1995/05/01 to 1995/12/31. The model performance is illustrated by comparing observed daily and simulated daily stream flow values over the period 1996/01/01 to 1997/03/31. The calibrated/validated rainfall-runoff model enabled generation of daily inflows to the ancient tanks using respective drainage area and climatic data. The model possesses both manual as well as automatic optimization facilities for parameter calibration. In this study, SCE-UA (shuffled complex evolution university of Arizona) option was selected for carrying automatic optimization. The Nash-Sutcliffe coefficient (E) of efficiency was used as a measure of the model performance [9]. The E value describes agreement between all modeled (Qm) and observed (Qo) runoffs, with E=1.0 indicating that all the modeled runoffs are same as the recorded runoffs. The Nash Sutcliffe coefficient for the calibration and validation was found as0.93 and 0.69 respectively. WATER ALLOCATION MODELING There are several tools which are designed to assess water supply and demand management in river basins. WEAP model was preferred because of its robustness and ease of use for developing and testing the water supply and demand management [1,2]. The WEAP model is GIS based integrated water resources management tool that integrates different water supplies and demands at catchment scale. WEAP was developed by the Stockholm Environment Institute. The WEAP model uses the basic principle of water balance accounting. WEAP represents a particular water system, with its main supply and demand nodes and the links between them, both numerically and graphically. Users specify allocation rules by assigning priorities and supply preferences for each node; these preferences are changeable, both in space and time. WEAP then employs a priority-based TANK INFLOWS ESTIMATION SimHyd, a conceptual rainfall runoff model, was used to simulate daily inflows towards to the left bank ancient tanks. SimHyd model has been extensively used for various applications [7,8]. The SymHyd model is a component of the rainfall-runoff library (RRL) produced by Cooperative Research Centre for Catchment Hydrology, Australia. In this model, daily rainfall first fills the interception store which is emptied each day by evaporation. The excess rainfall is then subjected to an infiltration function that 8 NEAJ Newsletter, Volume 1, Issue 1 optimization algorithm and the concept of equity groups to allocate water in times of shortage. The simplicity of representation means that different scenarios can be quickly set up and compared and it can be operated easily. Water allocation to demand sites is done through linear programming solution. Therefore demand site satisfaction is maximized subject to the mass balance, supply preferences, demand priority and other constraints. Water balance is necessary to be made for detecting the condition of water demand and available discharge at the intake. Analysis of water balance is usually based on normal (mean) and 80% reliable flow [10]. Normal and dry year corresponds to the amount of flow with 50% and 80% probability of exceedance respectively. Monthly normal and dry flow in Deduru Oya near reservoir site for the period of 1970-1995 has been estimated for developing and testing the water supply and demand management scenarios. Comparison of water surplus and deficit is based on normal and 80% reliable flow. minimization in water losses need to be considered. • Tanks and reservoir with dry year climatic year and reduced water losses: This scenario was modelled to assess the impact of improved irrigation efficiency. Tanks and reservoir supplies will be only enough to meet all the water demands if ancient tanks are given higher filling priorities for the use in September, the water shortage month. CONCLUSIONS WEAP results reveal that traditional tanks are highly important to meet the water shortages in the dry climatic year. Existing tanks with larger storage than demands can be used to supplement other tanks. Additionally, water loss reductions and optimal reservoir operation with alternative water demand priorities and allocations can play important role to meet water shortages in dry climatic year. Accurate data is important to perform such analysis. Cropwat model successfully enabled to estimate rice crop irrigation water requirement. The estimated irrigation water requirement was found to be similar to that of Sri Lankan counterpart. Alternative agricultural practice (e.g., plantation time) can help in addressing unmet demands. A conceptual rainfall-runoff model, Simhyd, enabled generation of tank inflows. Calibration and validation results indicated that the modelled results were good. However, the model can perform better with availability of long observation hydroclimatic data. The Deduru Oya Reservoir project with optimal water allocation will highly resolve water scarcity problems. With the completion of the Deduru Oya reservoir project, paddy cultivation will be increased by many folds. The productivity of not only paddy but also other highland crops, including vegetables and fruits, will increase many fold contributing further to the socio-economic betterment of the agricultural families. Additionally, all neighboring areas will be benefitted through the replenishment of groundwater aquifers. RESULTS Scenario analysis enabled to answer ‘what if’ questions such as: what unmet demands can be expected if current trends are projected into the future?; What alternative allocations could be?; How should reservoirs be operated? The following scenarios were created for developing and testing sustainable water supply-demand management: • Tanks supply only for two cultivation seasons: Graphs of irrigation area coverage and unmet water demands pointed out that most tanks are not able to meet two cultivation season irrigation water requirements. Water shortages occurred in the months of March, May, June and September. • Tanks supply only with single (Maha) season cultivation: Most of tanks are able to meet single season irrigation water requirements. Water shortage occurred for some of the tanks in September. • Reservoir supply only: Reservoir alone in normal climatic year is well enough to meet all the irrigation, hydropower and environmental flow requirements. • Tanks and reservoir supply with dry climatic year: In dry climatic year, tanks and reservoir supplies are not enough to meet 100% water demands if operated normally. Water shortage occurred in the month of September. Alternative water allocations as well as REFERENCES [1] Hussein, I., Weshah, R.A., 2009. Optimizing the water allocation system at Jordan Valley through adopting water evaluation and planning system 9 NEAJ Newsletter, Volume 1, Issue 1 model, Thirteenth International Water Technology Conference, Hurghada, Egypt, pp. 753-777. [2] Holf, H., Noel, S. and Droogers, P., 2007. Water use and demand in the Tana Basin – analysis using the Water Evaluation and Planning (WEAP) tool. Green Water Credits Report 4, ISRIC – World Soil Information, Wageningen. [3] Chiew, F. H. S. and Siriwardena, L., “Estimation of SIMHYD parameter values for application in ungauged catchments”, MODSIM Congress, Melbourne, Australia, 12–15 December, 2005, pp. 2883–2889. [4] Dharmarathna W.R.S.S., Weerakoon S.B., Herath S., Rathnayake U.R. and Weerakoon W.M.W., 2011. Application of Decision Support System for Agrotechnology Transfer (DSSAT) model to optimize irrigated paddy cultivation under changing hydro-climate, Technical papers, Annual Transactions of IESL, Volume I, Part B, pp 207-211. [5] Batjes, N.H., 2008. ISRIC-WISE Harmonic Global Soil profile dataset (version 3.1), Report 2008/02, ISRIC-World Soil Information. [6] Wickramaarachchi, T.N., 2004. Preliminary assessment of surface water resources- a study from DeduruOya Basin of Sri Lanka, APHW Proceedings (http://rwes.dpri.kyoto-u.ac.jp/~tanaka/APHW/AP HW2004/proceedings/OHS/56-OHS-A341/56-OH S-A341.pdf). [7] Podger, G., 2004. Rainfall runoff library, CRC for Catchment Hydrology (http://www.toolkit.net.au/cgi-bin/WebObjects/too lkit) Australia. [8] Chiew FHS, Siriwardena L. 2005. Estimation of SimHyd parameter values for application in ungauged catchments (http://www.mssanz.org.au/modsim05/papers/chie w_2.pdf). [9] Nash, J.E. and Sutcliffe, J.V., 1970. River forecasting using conceptual models, part 1, A discussion of principles, Journal of Hydrology, 10: 282-290. [10] Juwono, P.T., Priyantoro1, D., Rumaropen, N., 2012. Evaluation of Flow Capacity and the Pattern of Water Requirement in Irrigation Area of Lereh, Jayapura Regency of Indonesia, J. Basic. Appl. Sci. Res., 2(8)8218-8229. AUTHOR’S PROFILE Name: Binaya Kumar Mishra Affiliation: United Nations University, Tokyo Correspondence address: 4-53-70 Jingumae, Shibuya, Tokyo 150-8925, Japan Education background: PhD (Urban and Environmental Engineering, Kyoto University, Japan), MSc (Water Resource Engineering, Tribhuvan University, Nepal), B.Sc. (Civil Engineering, The Institution of Engineers, India) Selected publications: 1. Mishra, B.K., Awal, R., Herath, S. and Fukushi, K. (2014, accepted): Trends and variability of climate and river flow in context of run-of-river hydropower schemes: a case study of Sunkoshi river basin, Nepal, International Journal of Hydrologic Science and Technology (http://www.inderscience.com/info/ingeneral/forthco ming.php?jcode=ijhst) 2. Mishra, B.K. and Herath, S. (2014): Assessment of future floods in Bagmati River Basin of Nepal using bias corrected daily GCM precipitation data, Journal of Hydrologic Engineering, ASCE, DOI: 10.1061/(ASCE)HE.1943-5584.0001090. 3. Mishra, B.K. and Takara, K. (2014): Integrating synthetic flood data for selection of regional frequency distribution, International Journal of Hydrologic Science and Technology, Vol. 4, Issue 1. pp. 1-17. Professional affiliations: Nepal Engineering Council (1705 ‘Civil’); Japanese society of civil engineers (200600494 ‘General’); The Institution of Engineers (India) (A/524224/0) 10 NEAJ Newsletter, Volume 1, Issue 1 RAINFALL-BASED LANDSLIDE AND DEBRIS FLOW FORECASTING APPROACH Badri Bhakta Shrestha International Centre for Water Hazard and Risk Management, Public Works Research Institute, Tsukuba, Japan Abstract: Sediment disasters such as landslides and debris flows frequently occur in the mountainous areas due to heavy rainfall. The establishment of early warning systems and evacuations strategies is very important essential to reduce loss of life and property damage. In this paper, rainfall-based forecasting approach for landslide and debris flow has been presented. The relationship between rainfall and soil water index has been analyzed for forecasting system by using hydrological distributed model. The approach has been analyzed by using both ground-observed and satellite based rainfall data. The Sabagawa river basin located in Yamaguchi prefecture of Japan was selected for case study. The snake lines could be useful for forecasting and warning system of sediment disasters. Keywords: Landslide, debris flow, forecasting, snake curve, soil water index. satellite based rainfall data could be also useful to get supplementary information for forecasting system. The Sabagawa river basin located in Yamaguchi prefecture of Japan was selected for case study. There was a heavy rainfall in the Sabagawa river basin in July 2009 and large number of sediment disasters occurred in the areas. The relationship between rainfall and soil water index was thus analyzed for rainfall event in July 2009. INTRODUCTION Recently landslides and debris flows frequently occur in the mountainous areas due to heavy rainfall, which cause severe damage to property and loss of life [1]. It is thus essential to implement reliable and accurate forecasting system to provide communities timely information enabling them to prepare for hazard events and reduce loss of life and property damage. Effective forecasting systems for rainfall-induced landslide and debris flow must have strong hydrological, meteorological and geotechnical components [2]. Forecasting is a very important component in preparedness systems in non-structural measures of landslides and debris flows, which may help save more lives and reduce property. Rainfall and soil water are important indicators of rainfall-induced landslide and debris flow. In this paper, rainfall-based forecasting approach for landslide and debris flow has been presented. The relationship between rainfall and soil water index (SWI) has been analyzed for forecasting system by using hydrological distributed model. The soil water is an important parameter in the hydrological balance and is essential for understanding land-surface interactions [3]. The approach has been analyzed by using both ground-observed and satellite based rainfall data. The STUDY AREA The Sabagawa river basin is located in Yamaguchi prefecture of Japan (Figure 1). The catchment area of the basin and length of main stream are 460km2 and 56km, respectively. Geology of its mountain areas is mainly composed of fresh and weathered granite. This area is thus vulnerable to sediment disasters such as landslides and debris flows [4]. There was a heavy rainfall on 21 July 2009 and caused a large number of landslides and debris flows. Figure 2 shows the rainfall and accumulated rainfall at Manao station with some occurrence time of sediment disasters. The figure shows that sediment disasters occurred when accumulated rainfall was exceeded about 200 mm. The accumulated rainfall was about 268 mm and maximum hourly rainfall was about 60 mm/hour at Manao station. 11 NEAJ Newsletter, Volume 1, Issue 1 Mitani Yasaka Hori Shimaji Nihotsu Urushi Hiroshima Wada Shimonoseki Manao Fukuoka Shinbashi Figure 1 Location of Sabagawa river basin and hydro-meteorological stations Occuranae of sediment disaster 12:20 Hourly rainfall (mm) 280 60 Rainfall 240 50 Cumullative Rainfall 200 40 160 30 120 20 80 10 40 0 0 Accumulated rainfall (mm) 11:20 70 20 12:00 20 18:00 21 0:00 21 6:00 21 12:00 21 18:00 Day and Time Figure 2 Ground observed rainfall and accumulated rainfall at Manao station. Figure 3 Basic idea used for sediment disaster warning models in Japan (Source: Osanai et al. [5]) METHODOLOGY In Japan, the timing of the issuing of early-warning information is determined by the expected values of the 60-min cumulative rainfall and soil water index calculated using the forecast rainfall for 1–3 h into the future. A sediment disaster alert will be issued when the Critical Line is predicted to be exceeded by the expected rainfall in the following 1–3 hours as shown in Fig. 3 [5] [6]. In this study, Integrated Flood Analysis System (IFAS) model was used to simulate rainfall-runoff and temporal variation soil moisture in the soil mass [7]. The IFAS is a concise rainfall-runoff analysis system based on a hydrological distributed tank model (Fig. 4). In the model Global map elevation and land cover data were used. The three layer tanks (surface, subsurface and aquifer layers) were considered. The model was Figure 4 Basic structure of a model 12 NEAJ Newsletter, Volume 1, Issue 1 2500 0 (a) 20 Rainfall Ground Measured Discharge 1500 Rainfall (mm) Discharge (m3/sec) 2000 40 Ground Ori-GsMap 1000 60 Cor-Gsmap 3B42RT 500 80 0 18-Jul 100 19-Jul 20-Jul 21-Jul 22-Jul 23-Jul Date 2500 0 (b) 20 Rainfall Ground Measured Discharge 1500 40 Ground Ori-Gsmap 1000 60 Cor-GsMap Rainfall (mm) Discharge (m3/sec) 2000 3B42RT 500 80 0 18-Jul 100 19-Jul 20-Jul 21-Jul 22-Jul 23-Jul Date 2500 0 (c) 20 Rainfall Ground 1500 Measured Discharge 40 Ground Ori-GsMap 1000 60 Cor-Gsmap 3B42RT 500 0 18-Jul Rainfall (mm) Discharge (m3/sec) 2000 80 100 19-Jul 20-Jul 21-Jul 22-Jul 23-Jul Date Figure 5 Calculated and observed discharges at (a) Shinbashi, (b) Manao and (c) Urushi Stations. calibrated and validated by comparing simulated discharge with observed discharge. The rainfall event in July 2009 was used for calibration of model and the calibrated parameters were validated using rainfall event in September 2005. The absolute value of the soil water index was defined as the sum of water depths in 13 NEAJ Newsletter, Volume 1, Issue 1 70 180 Rainfall-Ground SWI-Ground SWI-3B42RT SWI-Gsmap-Ori SWI-Gsmap-Cor 120 90 60 50 40 30 60 20 30 10 (a) Rainfall (mm) Soil Water Index 150 0 0 18-Jul 19-Jul 20-Jul (b) 21-Jul 22-Jul Date 70 Possibility of sediment disaster occurrence 60 Rainfall (mm/hr) SWI-Ground 50 SWI-3B42RT SWI-Gsmap-Ori 40 SWI-Gsmap-Cor Snake lines 30 20 10 0 0 20 40 60 80 100 120 140 160 180 Soil Water Index Figure 6 (a) Relationship between rainfall and soil water index, and (b) Calculated snake lines using ground observed and satellite based rainfall data (at Manao Station). each of the tank layers. The relationship between SWI and rainfall was analyzed by using ground based rainfall and satellite based rainfall data (3B42RT and GSMaP). calculated snake line which could be used for early warning and forecasting systems. The soil water index increases when rainfall intensity is increased, which can cause sediment disasters in the area. The satellite based rainfall data also could be useful to get supplementary information for forecasting and warning system of sediment disasters. The results show that results of SWI obtained using 2B42RT satellite based rainfall data are closer to those obtained using ground rainfall data than GSMaP rainfall. The snake lines could be useful for forecasting and warning system of sediment disasters. To use snake line for warning system in sediment disasters, critical lines for warning criteria, alarm criteria and evacuation criteria should be determined based on past data of sediment disasters. The determination of critical line is very important for judging warning criteria based on RESULTS AND DISCUSSIONS Figure 5 shows comparison of calculated river discharges with observed discharges at Shinbashi, Manao and Ursuhi stations. The calculated discharges using ground rainfall and 3B42RT satellite based rainfall data are more agreeable with observed discharges. Figures 6 and 7 show relationship of rainfall and soil water index calculated by using ground rainfall and satellite based rainfall data at Manao and Shinbashi stations, respectively. The figures also show the 14 NEAJ Newsletter, Volume 1, Issue 1 70 180 Rainfall-Ground SWI-Ground SWI-3B42RT SWI-Gsmap-Ori SWI-Gsmap-Cor 120 90 60 50 40 30 60 20 30 10 (a) 0 18-Jul Rainfall (mm) Soil Water Index 150 0 19-Jul 20-Jul Date 21-Jul 22-Jul 70 Possibility of sediment disaster occurrence Rainfall (mm/hr) 60 SWI-Ground 50 SWI-3B42RT SWI-Gsmap-Ori Snake lines 40 SWI-Gsmap-Cor 30 20 10 (b) 0 0 50 100 150 200 Soil Water Index Figure 7 (a) Relationship between rainfall and soil water index, and (b) Calculated snake lines using ground observed and satellite based rainfall data (at Shinbashi Station). snake line. The warning/alerting can be issued when snake line crosses the critical line. The lines inside red circle in Fig. 6 (b) and Fig. 7 (b) could be critical line for possibility of sediment disaster occurance. determining critical lines. When we planned any monitoring and alerting systems for sediment disasters such as landslides and debris flows, we must consider at least following issues: Any alerting systems must capable to issue warnings early enough ahead of potential disasters to enable adequate preparation and evacuation. A good warning/alert system not only needs to promptly issue alerts before a disaster occurs, but must also avoid false alerts since local governments and inhabitants will ignore the warnings if there are too many false alerts. COMCLUSIONS The relationships between rainfall and soil water index were analyzed by using ground observed and satellite based rainfall data in Sabagawa river basin. The snake line calculated based on rainfall and soil water index could be useful for effective warning and forecasting systems of sediment disasters by 15 NEAJ Newsletter, Volume 1, Issue 1 REFERENCES AUTHOR’S PROFILE [1] Shrestha, B. B., Nakagawa, H., Kawaike, K., Baba, Y. and Zhang, H.: Driftwood deposition from debris flows at slit-check dams and fans, Natural Hazards, Springer, Vol.61, No. 2, pp.577-602, 2012. [2] Baum, R. L. and Godt, J. W.: Early warning of rainfall-induced shallow landslides and debris flows in the USA, Landslides, Vol. 7, pp. 259–272, 2010. [3] Hunt, E. D., Hubbard, K. G., Wilhite, D. A., Arkebauer, T. J. and Dutcher, A. L.: The development and evaluation of a soil moisture index, International Journal of Climatology, Vol. 29, pp. 747-759, 2008. [4] Nagano, H., Hashimoto, H., Kuroda, Y. and Takaoka, H.: Debris flows produced by heavy rains on July 21, 2009 in Hofu City, Japan, Italian Journal of Engineering Geology and Environment – Book, pp.725-733, 2011. [5] Osanai, N., Shimizu, T., Kuramoto, K., Kojima, S. and Noro, T.: Japanese early-warning for debris flows and slope failures using rainfall indices with radial basis function network, Landslides, Vol. 7, pp. 325-338, 2010. [6] Chen, C. Y. and Fujita, M.: An analysis of rainfall-based warning systems for sediment disasters in Japan and Taiwan, International Journal of Erosion Control Engineering, Vol. 6, pp. 47-57, 2013. [7] Sugiura, T., Fukami, K., Fujiwara, N., Hamaguchi, K., Nakamura, S., Hironaka, S., Nakamura, K., Wada, T., Ishikawa, M., Shimizu, T., Inomata, H. and Ito, K.: Development of integrated flood analysis system (IFAS) and its applications, Proceedings of 7th ISE & 8th HIC, Chile, 2009. Name: Badri Bhakta Shrestha Affiliation: ICHARM, PWRI Correspondence address: [email protected] Education background: - PhD (Engineering), 2009, Kyoto University, Japan - M. Sc. in Water Resources Engineering, 2004, Institute of Engineering, Tribhuvan University, Nepal - B.E. in Civil Engineering, Institute of Engineering, 2001, Tribhuvan University, Nepal Selected publications: - Shrestha, B. B. and Nakagawa, H.: Assessment of potential outburst floods from the Tsho Rolpa glacial lake in Nepal, Natural Hazards, Vol. 71, No. 1, pp.913-936, 2014. - Shrestha, B. B., Nakagawa, H., Kawaike, K., Baba, Y. and Zhang, H.: Glacial hazards in the Rolwaling valley of Nepal and numerical approach to predict potential outburst flood from glacial lake, Landslides, Springer, Vol. 10, No. 3, pp. 299-313, 2013. - Shrestha, B. B., Nakagawa, H., Kawaike, K., Baba, Y. and Zhang, H.: Driftwood deposition from debris flows at slit-check dams and fans, Natural Hazards, Springer, Vol.61, No. 2, pp.577-602, 2012. Professional affiliations: - Member, JSCE (Japan Society of Civil Engineers) - Life Member, NEA (Nepal Engineers’ Association) - Member, NEC (Nepal Engineering Council) 16 NEAJ Newsletter, Volume 1, Issue 1 AN OVERVIEW OF RIVER WATER ENVIRONMENT IN KATHMANDU VALLEY Ram Krishna REGMI; United Nations University, Japan Binaya Kumar MISHRA; United Nations University, Japan Pingping LUO; United Nations University, Japan Asako TOYOZUMI-KOJIMA; United Nations University, Japan Kensuke FUKUSHI; The University of Tokyo, Japan Kazuhiko TAKEMOTO; United Nations University, Japan Niranjan SHRESTHA; Environmental Services Nepal P. Ltd., Nepal Abstract: Water is a key element in sustaining human and environmental health. Healthy ecosystems are sustained by good water quality, which leads to improved human well-being. In recent years, surface water in several developing countries including Kathmandu Valley is considered to be highly deteriorated. Water demand for drinking, domestic, industrial, and recreational uses has increased over the time with increase in population, quality of life, economic activities and development activities in Kathmandu. Several government and non-government institutions, civil societies and others are working for the improvement of river environment inside the Kathmandu Valley. UNU-IAS (United Nations University-Institute for the Advanced Study of Sustainability), Japan has launched a research program ‘Water and Urban Initiative (WUI)’ for enhancing urban water quality in rapidly developing Asian cities. This study under WUI provides preliminary overview of river water environment inside the Kathmandu Valley. The study will contribute in figuring out an effective management plan for the sustainable urban water environment. A WUI study team visited Kathmandu Valley for field observation and conducting interaction and discussion with concerned stakeholders of various government and non-governmental line agencies to perceive the existing water environment situation of the valley. The field observation showed that wastewater produced from households, industries, vehicle machinery repairing and washing centers, agro-lands have been discharging directly to the river system without any even primary treatment except upstream of Guheshwori. Keywords: Urban Water Environment, Environmental Health, Water Quality, Sustainability, Field Observation. biological, water chemistry and habitat indicators will be reviewed in selected urban watersheds. Kathmandu Valley experienced rapid urbanization due to accelerated immigration after the onset of democracy in 2007 B.S. [1]. The major river system of the valley is Bagmati River system (Figure 1). The main sources of water in the river are rainfall and natural springs. About 82% of water volume is extracted daily from the surface water sources for drinking water supply in the valley [2]. The amount of water required for drinking, domestic, industrial, and recreational uses has increased over time with increase in population, quality of life, economic activities and development activities in Kathmandu. The rising demand for water and limited available resources of water in the Kathmandu Valley has put pressure on the quality of water. The status of health and environmental indicators directly and indirectly related to the quality of water. Table 1 presents the health and environmental indicators of Kathmandu INTRODUCTION Water is a key element in sustaining human and environmental health. Healthy ecosystems are sustained by good water quality, which leads to improved human well-being. Due to over population and its consequent stress on the environment, the water quality and quantity both are getting worse. The problem is more severe in urban areas of fast growing cities. Deterioration of water bodies by improperly treated or untreated industrial/domestic wastewater, chemicals or heavy metals is a common environmental problem in most of the developing countries. UNU-IAS Japan is carrying out a research program titled WUI with the objective of ‘enhancing urban water quality in rapidly developing Asian cities’. In this research, existing water quality management frameworks and spatial relationships between land uses and urban water quality measured with 17 NEAJ Newsletter, Volume 1, Issue 1 Valley [3]. Water pollution is the most serious public health issue in Kathmandu Valley. The solid wastes like kitchen wastes, dead animals, hospital wastes, industrial wastes are dumped by the riverside. Additionally, the sewer lines of domestic and industrial wastewater are connected in the river. The river receives direct discharge of untreated wastewater and becomes extremely polluted when it reaches core city areas. These activities excessively polluted the river system and are responsible for causing water borne diseases such as diarrhea, dysentery, cholera, and skin diseases. Table 2 presents the estimated volume of wastewater generated by municipalities of Kathmandu Valley in 2001 [5-6]. Table 2 Estimation of wastewater generation in Kathmandu Valley urban region, 2001 Municipality Population, Million 2001 litres/day Kathmandu 671,846 34.3 Lalitpur 162,991 8.3 Bhaktapur 72,543 3.7 Kirtipur 40,835 2.1 Madhyapur 47,751 2.4 Thimi Total 995,966 50.8 (Source: CBS, 2001 [5]; NWSC, 2001 [6]) Scientific studies have reported that the River health is at good condition at upstream but gradually decreases as it enters the core city areas [7-12]. The original communities of aquatic fauna have completely disappeared and two groups of pollution tolerant aquatic fauna like Tubificids and Chironomids. Also, most of the river stretches, at the core urban areas have no any living organisms in it [12]. In this study, we provide an overview of existing urban water environment of major rivers in Kathmandu Valley which will be helpful to figure out an effective management plan for the sustainable urban water environment of the valley in future. CONCERENED INSTITUTIONS IN RELATION TO RIVER WATER POLLUTION Several government and non-government institutions, civil societies and other stakeholders are working for environmental improvement of rivers in Kathmandu Valley and they are in increasing trend, but the status of the rivers is deteriorating day to day. Several studies in the pasts have indicated that the coordination among the stakeholders is one of the key issues behind the current situation of these rivers. All stakeholders need to be involved in an integrated and coordinated way in both planning and implementation of the activities. Some of the major concerned institutional and management set-up in relation to urban water pollution are discussed below: High Powered Committee for Integrated Development of the Bagmati Civilization (HPCIDBC): The government formed this High Powered Committee to examine ways of improving the quality of water in Bagmati River through priority in construction and improvement of sewer lines and treatment plants. Kathmandu Upatyaka Khanepani Limited (KUKL): KUKL should follow the norms and regulations for using water from rivers and groundwater so that impact of use of such natural resources has minimum impact in the river ecosystem. Figure 1 Map showing river systems in Kathmandu Valley (Source: THE BAGMATI: Issues, Challenges and Prospects [4]) Kathmandu Lalitpur Bhaktapur Total urban Nepal 30.65 92.30 40.12 81.42 24.01 83.16 51.71 77.06 68.51 39.22 (Source: UNDP, 2004 [3]) Population without access to safe (%) Population with access to sanitation (%) Infant Mortality/1000 live births Municipality Table 1 Health and environmental indicators of Kathmandu Valley 11.05 15.85 19.71 11.46 20.48 18 NEAJ Newsletter, Volume 1, Issue 1 KUKL should also manage sewerage network and make sure the waste water discharge into the river should meet the national quality standard. KUKL should develop, operate and maintain major waste water treatment systems in the valley. Other Government Line Agencies: Many activities that help in protecting river ecosystem have already been initiating in different ways by different government line agencies. Some of the key agencies are: Department of Urban Development and Building Construction; Department of Roads; Kathmandu Valley Town Development Committee; Solid waste Management and Technical Support Center; Department of Land Survey-Cadastral Survey and Registration; Ministry of Science, Technology and Environment; Water and Energy Commission Secretariat (WECS); Ministry of Forests and Soil Conservation; Department of Hydrology and Meteorology; Department of Water Induced Disaster Prevention; District Development Committees (DDCs); Municipalities; and Village Development Committees (VDCs). Users committee and community-based institutions: There are several users committee and clubs working for improving environmental status of the rivers in community level. There are many good initiations taken by such communities which can be replicated in different parts of the rivers, such as creating awareness about importance of river environment to the people along the river banks, conserving culture and heritage, promoting eco-friendly practices such as river side plantation, rain water harvesting, river side cleaning campaign, etc. NGOs and Private Sectors: NGOs and private sectors have also played significant roles in activities such as awareness campaign, community based waste management, cleaning campaign, plantation and protection of river side cultural and heritage, management of parks, and other public utilities along the river banks. sewerage discharge from the river course. High level government officials are hosting the programme on a voluntary basis. People from all backgrounds come around a predefined place and collect solid wastes scattered around the river stretch. The collected waste is managed by Kathmandu Metropolitan City (KMC). The campaign has collected thousands of metric tons of solid wastes from the river. The Bagmati River system receives sewerage from wide range of sources. The river system receives liquid wastes from drainage networks made by KMC and also from illegal drainage networks. Additionally, the squatter settlements near the river side discharge their wastes directly into the river. The Bagmati Cleanup Campaign has created awareness among the local people; and participatory community efforts for the river restoration are increasing. The Pudasaini Sewa Samaj, Jorpati Youth Club, Gokarna youth club, Ama Samuha are the examples of such groups. The local clubs has also controlled most illegal sewage discharge points into the river. FIELD OBSERVATION Bagmati and Bishnumati Rivers are the main artery of Kathmandu, the capital of Nepal and king pin of its socio-economic, touristic, industrial, educational, scientific, religious and cultural centers. It has been observed that the Bagmati and its tributaries (Hanumante, Manohara, Dhobi Khola, Kodku, Tukucha, Bisnumati, Balkhu, Godawari and Nakhkhu) are heavily polluted primarily due to disposal of untreated raw domestic and industrial sewage, solid waste and other sources such as slaughtering at the bank of the river, sand mining and dead animals/carcasses disposal. Recently a WUI study team has visited Kathmandu Valley for field observation and conducting interaction and discussion with concerned stakeholders of various government and non-governmental line agencies to perceive the existing urban water environment situation of the valley. While travelling along the river site the study team observed gradual decline in water quality towards the downstream reach of the rivers. Main contributing factors for the degradation of river water quality were observed as haphazard urbanization, unmanaged poultry and pig farms stock activities, direct disposal of sewage to rivers. The urbanization of Kathmandu Valley is strongly associated with the river systems. The process of urbanization is now more rapid and massive, mainly because it is now rampant in the Kathmandu Valley. The present trends in the valley clearly reflect that there will be a growing pressure on limited water resources. The direct impacts of present urbanization POLLUTION ABATEMENT ACTIVITIES The conservation of Bagmati River system is a key issue to sustain Kathmandu Valley. Although efforts have been made to conserve the river, the impacts are not significant. Nepal Government approved Bagmati Action Plan (2009-2014) to manage Bagmati basin. Since the Bagmati basin has a number of crosscutting issues, the progress in implementing the plan is not satisfactory. From May 19, 2013, a strong civil society movement and public's general interest named as “Bagmati Cleanup Campaign” is generating tremendous concerns for cross-sectoral coordination to divert the 19 NEAJ Newsletter, Volume 1, Issue 1 are especially visible in the Bagmati River with its tributaries. At present, Bishnumati and Bagmati Rivers and their tributaries are found as dumping sites for all types of wastes. The rich cultural heritage along the river and the tributaries such as traditional monuments, ghats and temples, are seen slowly eroding. Some section of urban population living in riverside are found to be using polluted river water for washing and other purposes. Shortage of water in the city have forced certain section of the society to use the polluted water from the valley rivers for various purposes which has severely affected human health due to water born diseases. As a part of the river restoration activities, the construction of sewage diversion structures, concretizing river bank for bank stabilization, altering river flow, flow modification, sewerage line construction works are in progress. Figures 2-5 illustrates more about the present condition of Bishnumati and Bagmati Rivers. Figure 4 Direct disposal of sewage from Balaju industrial area to Bishnumati River Figure 5 Solid waste disposal in Bishnumati River Figure 2 The young generation has been practicing to have picnic at Sandarijal, they swim, wash the clothes and leave the used solid wastes even practice open defecation at source The field observation showed that wastewater produced from households, industries, vehicle machinery repairing and washing centers, agro-lands have been discharging directly to Bagmati and Bishnumati Rivers and their tributaries without any even primary treatment except upstream of Guheshwori. Guheshwori Waste Water Treatment Plant (WWTP) is partially in operation and existing rest WWTPs and Waste Stabilization Pond (WSP)/Aerated Lagoon with fine bubbled diffusers at Sallaghari, Bhaktapur and WSP at Sundarighat, Lalitpur are entirely out of function. WWTPs and WSPs at Bode, Madhyapur Thimi and Kodku, Patan, Lalitpur are partially processing the wastewater by natural forces such as settling, evaporation, surface aeration and aquatic water plants. Under the initiation of KUKL and HPCIDBC, a few WWTPs (about five) are under construction, which are financed by Government of Nepal (GoN) and Asian Development Bank (ADB). Figure 3 The squatter settlement near Bagmati River side, Thapathali 20 NEAJ Newsletter, Volume 1, Issue 1 [6] NWSC, Annual Report 2001, Nepal Water Supply Corporation, Kathmandu, 2001. [7] Shrestha, T. K. (1980): The Biological indicators of pollution in the river Bagmati, Kathmandu Valley, Journal of T.U., Vol. 11 (1), pp. 114-135, 1980. [8] Upadhaya, N. P and Roy, N. N., Studies on river pollution in Kathmandu Valley, Indian Journal of Environmental HCTH, Vol 24 (2), pp. , 1982. [9] RONAST, Water quality of the Bagmati River in the Pashupati area, In Proc. of the Seminar on Environmental Issues of Pashupati Area: Identification and Control Measures, Royal Nepal Academy of Science and Technology, pp. 99-124, 1987. [10] DISVI/ENPHO, Water Quality Assessment of the Bagmati River, Health Education and Service Project, Kathmandu, 1988. [11] Moog, O. and Sharma, S., Biological rapid field assessment of water quality in the Bagmati River and its tributaries, Kathmandu Valley, Nepal, Proceedings of the Ecohydrology Conference on High Mountain Areas, March 23-26, Kathmandu, Nepal, pp. 609-621, 1996. [12] Shah, R. D. T. and Shah, D. N., Evaluation of benthic macroinvertebrate assemblage for disturbance zonation in urban rivers using multivariate analysis: Implications for river management, Journal of Earth System Science, pp. 1125-1139, 2013. CONCLUSIONS The quality of both surface and groundwater in Kathmandu Valley has deteriorated and safe drinking water is not easily available in Kathmandu. Main causes for the degradation of urban water quality are domestic waste, industrial waste, change in land use pattern and increase in the use of agrochemicals. Municipal and industrial effluents are often directly discharged to natural water bodies without any treatment. Recently, the Bagmati Cleanup Campaign is generating tremendous concerns to divert the sewerage discharge from the river course. The campaign has created awareness among the local people; and participatory community efforts for the river restoration are increasing. The field observation showed that wastewater produced from households, industries, vehicle machinery repairing and washing centers, agro-lands have been discharging directly to river system without any even primary treatment except upstream of Guheshwori. Though there are some wastewater treatment systems, most of them are not functioning well. A scientific study has become essential for the improvement of urban water environment of Kathmandu Valley. ACKNOWLEDGEMENT This study was carried out under Water and Urban Initiative of United Nations University-Institute for the advanced Study of Sustainability with focus on developing strategies to enhance urban water environment in developing Asian cities. We would like to thank all the stakeholders and experts from various agencies in Japan and Nepal for their comments and assistance. AUTHOR’S PROFILE REFERENCES Name: Ram Krishna Regmi Affiliation: United Nations University-Institute for the Advanced Study of Sustainability Correspondence address: Jingumae 5-53-70, Shibuya-ku, Tokyo 150-8925, Japan Education background: Dr. Eng, (2011), Kyoto University, Japan. M. Sc. in Water Resources Engineering (2005), Institute of Engineering, Tribhuvan University, Nepal. B. E. in Civil Engineering (2000), Institute of Engineering, Tribhuvan University, Nepal. Selected publications: 1. Regmi, R. K., Jung, K., Nakagawa, H. and Kang, [1] Dixit, A. and Upadhyaya, M., Augmenting groundwater in Kathmandu Valley: challenges and possibilities, Nepal Water Conservation Foundation, Kathmandu, Nepal, 2005. [2] Dahal, A., Khanal, M. and Ale, M., Bagmati River festival: conservation of degrading river, Proceedings of the 2011 Georgia Water Resources Conference, the University of Georgia, 2011. [3] UNDP, Human Development Report, United Nations Development Programme, Kathmandu, 2004. [4] NWCF and NTNC, The Bagmati: Issues Challenges and Prospects, National Water Conservation Foundation and National Trust for Nature Conservation , Kathmandu, 2009. [5] CBS, Statistical Year Book of Nepal 2001, Central Bureau of Statistics, Kathmandu, 2001. J., Study on Mechanism of Retrogressive Slope Failure using Artificial Rainfall, Catena, 122: 27-41, 2014. DOI: 10.1016/j.catena.2014.06.001 21 NEAJ Newsletter, Volume 1, Issue 1 2. Regmi, R. K., Jung, K., Nakagawa, H., Kang, J. and Lee, G., Sediment Erosion and Transport Experiments in Laboratory using Artificial Rainfall Simulator, Journal of the Korea Geo-Environmental Society, 15 (4): 13-27, 2014. DOI: http://dx.doi.org/10.14481/jkges.2014.15.4.13 3. Regmi, R. K., Jung, K., Lee, G., Analysis on Failure of Slope and Landslide Dam, KSCE Journal of Civil Engineering, 17 (5): 1166-1178, 2013. DOI:10.1007/s12205-013-0049-y Professional affiliations: - Nepal Engineers’ Association - Nepal Engineering Council - Japan Society of Civil Engineers (2009-2011) - Korea Society of Hazard Mitigation (2011-2012) - Korea Water Resources Association (2012-2014) 22 NEAJ Newsletter, Volume 1, Issue 1 RAINFALL RUNOFF MODELLING FOR FLOOD FORECASTING (A CASE STUDY ON WEST RAPTI WATERSHED) Rocky Talchabhadel1, Narendra Man Shakya2 Graduate School of Engineering, Civil and Earth Resources Engineering, Kyoto University, Japan 2 Institute of Engineering, Department of Civil Engineering, Water Resources Engineering, Nepal 1 Abstract: Floods are the most widespread climate-related hazards in the world, and they impact more people globally than any other type of natural disaster. In Nepal each year, on an average 330 lives are lost due to floods and landslides and infrastructure and property amounting to more than US$ 100 million is damaged causing negative impacts on the social and economic development of the country. Structural solutions are mainly preventative and focusing on curtailing the magnitude of floods using different methods such as dams, embankment, compound channels, widening of river beds, etc. However these solutions have adverse environmental, hydrologic, ecologic or economic consequences. The non-structural mitigating measure places people away from flood. This method is designed to reduce the impact of flooding to society and economy. Rainfall runoff modeling for the flood forecasting and warning schemes is a non-structural hydrologic method for mitigating flood damages. In this context due to unavailability of detail information of the study area, lumped model NAM is used for simulating rainfall into runoff. Due to lack of hourly interval data of rainfall, development of synthetic unit hydrograph from Snyder method is done to determine runoff hydrograph of the basin. The Snyder coefficients, coefficient of slope (Ct) and coefficient of peak (Cp) are calibrated for each sub basins and the values are found to be in the range from 0.41-0.58 and 0.32-0.43 for Ct and Cp respectively. Mike UHM rainfall runoff model is used to incorporate developed unit hydrograph Keywords: Rainfall runoff, Unit hydrograph, Flood forecasting, Snyder method and provide warning to people threatened by floods. The accuracy of operational hydrological models primarily rely on goof rainfall data input in terms of temporal and spatial resolution and accuracy ( Pathirana et al., 2005). INTRODUCTION Floods are the most common natural disasters that affect societies around the world. More than one third of the world’s land is prone to flood affecting about 82 percentage of the world’s population (Dilley et al., 2005). The study area is located in Terai region downstream of sikta dam to the Nepal- India border of Banke district, Nepal in which flood is one of the natural hazards. A large portion of the Nepalese territory is inundated every year by the flood of Rapti River in the Banke District of Nepal (DWIDP, 2006). In Nepal, like many other developing countries, the hydro-meteorological station networks are sparse and rainfall data are available only after a significant delay. Precipitation is highly variable in both space and time and is an important input in rainfall-runoff modeling. Flood forecasting in basins with sparse rain gauges poses an additional challenge. Using hydrologic modeling techniques, it is possible to better prepare for and respond to flood events. Use of appropriate hydrologic models can mitigate flood damage and provide support to contingency planning STUDY AREA The West Rapti River inside Nepalese territory is selected as the study area. The West Rapti River (WR) basin is located in the mid-western region of Nepal (Figure 1). Geographically the study area extends from 270 56’ 50” to 280 02’30” North latitudes and 81045’ 00” to 81040’00” East longitudes. The length of main stream channel is 257 km. The river originates from the middle mountains of Nepal, then enters the lowlands and finally drains to the Ghagra (Karnali) River, a tributary of the Ganges River. It has several tributaries. Major tributaries are Jhimruk River, Mari River, Arun River, Lungri River, Sit River, Dunduwa River, Sotiya and Gandheli rivulets. Downstream of the confluence of the Jhimruk and Mari Rivers, the river is named the West 23 NEAJ Newsletter, Volume 1, Issue 1 Rapti River. The average slope of the basin is 16.8%. The source of runoff is due to the monsoon rainfall and groundwater. The drainage network of the river basin and telemetry stations are shown in Figure 1. There are four hydrological stations. The catchment area of the basins of Nayagaon, Cherneta, Bagasoti and Kusum gauging stations are 1980 km2, 644 km2, 3380 km2 and 5200 km2 respectively. United States. He proposed equations for estimating synthetic unit hydrograph and gave the value for Coefficient of slope(Ct) and Coefficient of peak (Cp). The values for Ct and Cp range from 0.3 to 6 and 0.31 to 0.9 respectively. Flood forecast and modeling refer to the processes of transformation of rainfall into a flood hydrograph and to the translation of that hydrograph throughout a watershed or any other hydrologic system. In a country like Nepal, where the unavailability of the required information is quite prominent, the mathematical model should be so chosen that, the input parameters shall be as least as possible and that the model can establish a well-defined and consistent rainfall-runoff relationship. In this regard, the attempt has been made to use lumped model Mike NAM. This study proposed to use Snyder method since unit hydrograph can be developed from the basin characteristics. Mike UHM rainfall runoff model has been used to incorporate so developed unit hydrograph. Snyder (1938), based on a study of a large number of catchments in the Appalanchian Highlands of eastern United States developed a set of empirical equations for synthetic unit hydrographs in those areas. These equations are used in USA and with some modifications in many countries including Nepal. The synthetic unit hydrograph of Snyder is based on relationships between the characteristics of a standard unit hydrograph and basin morphology. Snyder formulate equation for the effective rainfall duration (Tr), the peak direct runoff rate (qp), and the basin lag time (Tl). From these relationships, five characteristics of a required unit hydrograph for a given effective rainfall duration is calculated (Chow et al., 1988) the peak discharge qp, the basin lag Tl, the base time Tb, and the widths W (in time units) of the unit hydrograph at 50 and 75 percent of the peak discharge. Figure 1. Location of WR Basin While the upper WR basin has a temperate climate, the lower basin including the Banke district has a tropical to subtropical climate. The period from March to May is hot and dry, June to August is hot and humid, September to October is pleasant, and November to February is cool and foggy with occasional rainfall due to westerly winds. The temperature reaches 46 oC in summer in the lower part of the basin and falls below 2 oC during winter in the upper part of the basin. The study area receives summer monsoon rainfall extending from June to September, accounting about 80% of the total annual. The average rainfall for WR Basin is about 1500 mm. The relative humidity goes as low as about 60% in May to above 90% in January. (Talchabhadel R, 2012) LITERATURE REVIEW ) Rainfall-runoff relationship is mostly used mathematical model for water resource management planning, flood forecasting and warning schemes. For this purpose, different types of models with various degrees of complexity have been developed. They are based on empirical, physically-based or combined conceptual-physically-based model. Sherman,(1932) was the first to explain the procedure for development of the unit hydrograph and recommended that the unit hydrograph method should be used for watersheds of 5000 km2 or less. Snyder analyzed a larger number of basins in the Appalachian mountain region of the Where L is the length of the main stream in kilometers from the outlet to the upstream divide, Lc is the distance in kilometers from the outlet to a point on the stream nearest the centroid of the watershed area, Ct,Cp are coefficients which need to be calibrated, A is the area of the basin in km2 , D is rainfall duration in hour. 24 NEAJ Newsletter, Volume 1, Issue 1 RESULTS AND DISCUSSIONS The study results are from Mike NAM method, Snyder method, Mike UHM model and flood hydrograph for various situations. The hydrological model is calibrated based on secondary data of 1980 – 2003 and validated for consecutive five years from 2004 to 2008. The average coefficient of determination for calibration and validation in all four stations are tabulated in Table 2. Figure 2. Snyder synthetic unit hydrograph METHODOLOGY Digital Elevation Model (DEM) of study area was downloaded and hydraulic data were extracted using spatial analyst of ArcGIS. Precipitation, hydrological and evaporation data were acquired from Department of Hydrology and Meteorology (DHM) and were processed. For modeling in sub catchment, mean catchment rainfalls were calculated using thiessen polygon analysis. Table 2: Average coefficient of determination for calibration and validation period Mari Jhimruk Bagasoti Kusum Calibration 84.3 81.9 83.4 83.85 Validation 82.7 81.1 80.8 82.3 Table 1- Calculated rainfall depth from thiessen method MIKE NAM was used for rainfall runoff modeling for daily interval data set. The NAM model can be characterized as a deterministic, lumped, conceptual model of overland flow+ interflow + base flow with moderate input data requirements. Parameters were calibrated and validated. Since there is not hourly interval data set of rainfall and evaporation, the simulated discharge from daily rainfall runoff model will not take account of extreme discharge so for this purpose unit hydrograph for instantaneous discharge was made in event basis. Synthetic unit hydrograph method is adopted to determine runoff hydrographs. Unit Hydrographs were developed using Snyder method and were calibrated for Snyder coefficients Ct and Cp. S–curve method was applied to generate 1hour, 2 hour and 3 hour unit hydrograph to determine duration of rainfall in each sub basins. Mike UHM module simulates the runoff from single storm events by the use of the well-known unit hydrograph techniques and constitutes an alternative to the NAM model for flood simulation in areas where continuous stream flow records are not available or where unit hydrograph techniques have already been well established. Duration of rainfall and position of rainfall for each sub basins were calibrated and validated with observed instantaneous maximum discharge Finally the flood hydrograph was prepared for different scenarios. Figure 3.Calibration plots against discharge at Kusum for the year 2001 and 2002 The difference between daily Qmax and Q instantaneous is shown in Figure 4. It is clearly seen that the instantaneous peaks are missing by the calibrated model from average daily discharge. Figure 4: Daily maximum instantaneous discharge at Kusum 25 discharge and NEAJ Newsletter, Volume 1, Issue 1 Table 3: Simulated discharge for different days of the year 2011 Date 6/13/2011 6/19/2011 3 7/27/2011 3 8/3/2011 Discharge mari Q sim in m /s 108.7 Q sim in m /s 286.7 Q sim in m /s 38.3 Q sim in m3/s 485.3 jhimruk 168.9 280.2 47.3 388.5 bagasoti 808.6 1000.8 838.4 1175.6 kusum 928.6 1125 1119.7 1351.7 Max. Water Level at Kusum 4.2 4.3 4.5 4.6 Q Kusum from rating curve 843 916 1072 1156 % diff 10.15 22.82 4.45 16.93 Unit hydrographs for the sub basin in event basis from the max instantaneous discharge are prepared using Snyder Method and used in MIKE UHM model for rainfall runoff relationship. The calibrated value for Snyder method of Ct ranges from 0.41-0.58 and Cp ranges from 0.32-0.43 for West Rapti basin. The MIKE UHM model is calibrated and validated at each sub basin outlets using observed instantaneous maximum discharge from the year 1964-2008. When the position of starting of rainfall at same time for all the sub basins, the multiple peaks are seen as in Figure 5 .The maximum simulated discharge at Kusum station is found when the position of rainfall intensity in sub basins at Mari, Jhimruk, Bagasoti and Kusum is provided at 3hr, 6hr, 5hr, and 1hr respectively. The relative error for peak discharge is within 10%. Upon running different scenario to look the flood hydrographs it is found that the discharge at outlet of Kusum is higher when peak rainfall is considered in downstream two sub basins at Bagasoti and Kusum rather than upstream two sub basins at Mari and Jhimruk. There are 4 telemetric hydrological stations and 7 telemetric rainfall stations from 2011 onwards in the basin with continuous time series data of every 15 min. interval (Easily downloadable from www.hydrology.gov.np). Random 4 monsoon days are picked up as June 13, June 19, July27 and Aug 3 2011 to see the applicability of model with available real time rainfall and discharge data shown in Table 3. Stage Discharge Rating curve table for Kusum station is used to convert water level into discharge. 3 Figure 5. Runoff hydrograph considering rainfall at the same time (Top) and various starting time (Bottom) Figure 6. Simulated Runoff Hydrograph on Aug 03, 2011 26 NEAJ Newsletter, Volume 1, Issue 1 CONCLUSIONS AUTHOR’S PROFILE The relationship between rainfall and runoff is an important parameter for flood forecasting. For an ungauged basin or basin with the lack of availability of hourly data, unit hydrograph needs to be developed to get runoff hydrograph at the outlet. The study only focuses on the Snyder method for the development of Synthetic unit hydrograph. For better result different synthetic unit hydrograph method should be applied to compare the output. Name: Rocky Talchabhadel Affiliation: Doctoral Student, Kyoto University Correspondence address: Ohbaku International House, Kyoto University Sanbanwari Gokasho, Uji 611-0011 A322 Education background: Bachelor in Civil Engineering and Master of Science in Water Resources Engineering from Pulchowk Campus Selected publications: Talchabhadel, R., & Sharma, R. (2014). Real Time Data Analysis of West Rapti River Basin of Nepal. Journal of Geoscience and Environment Protection, 2, 1-7. http://dx.doi.org/10.4236/gep.2014.25001 REFERENCES [1] Bhunya P.K., Panda S.N. and Goel M.K. , 2011, “Synthetic Unit Hydrograph Methods: A Critical Review” [2] Chow, V.T., Maidment, D., and Mays, L. W., 1988. Applied Hydrology. McGraw Hill. [3] Dilley M., Chen R.S., Deichmann U., Lerner-Lam A.L., Arnold M., with Agwe J., Buys P., Kjekstad O., Lyon B. and Yetman. G. 2005, “Natural disaster hotspots: a global risk analysis”, International Bank for Reconstruction And Development/ The world Bank and Columbia University, Washington, DC [4] DHM, 2006, “Stream Flow Record of Nepal 2006”, Department of Hydrology and Meteorology, Kathmandu, Nepal. [5] DHM, 2008, “Climatological Records of Nepal (1964-2008)”, Department of Hydrology and Meteorology, Kathmandu, Nepal. [6] DWIDP, 2006, Disaster Reviews from 1983-2006. Department of Water Induced Disaster Prevention, Lalitpur, Nepal [7] Pathirana A., Herath S. , Swain D., 2005, “Hydrometeorological input for improving flood forecasting in the Mekong” in Proc. International Symposium on role of Water science in transboundary river basin management, Ubon Ratchathani, Thailand, [8] Ramírez, J. A., 2000: Prediction and Modeling of Flood Hydrology and Hydraulics Chapter 11 of Inland Flood Hazards: Human, Riparian and Aquatic Communities Eds. Ellen Wohl; Cambridge University Press. [9] Talchabhadel R. (2012) Master Thesis on Rainfall Runoff Modeling for Flood Forecasting: A case study on West Rapti Watershed. MSc Library IOE Pulchowk Campus. Professional affiliations: Nepal Engineers’ Association Nepal Engineering Council Society of Hydrologists and Meteorologists, Nepal Integrated Disaster Risk Management Society 27 NEAJ Newsletter, Volume 1, Issue 1 For further suggestions and inquiries: Nepalese Engineers Association, Japan (NEAJ) Email: [email protected] 28 Nepalese Engineers Association, Japan (NEAJ) Published by http://www.neajc.org/

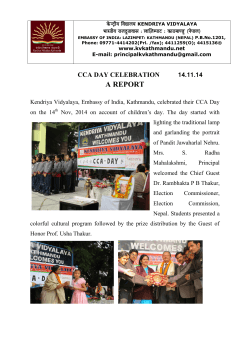


© Copyright 2026