
5 Early child development and growth Strategic areas for action
5 Early child development and growth
Strategic areas for action
Early child
development
and growth
(prenatal to
age 3)
Early school
engagement
and
performance
(preschool to
year 3)
Positive
childhood
and
transition
to
adulthood
Substance
use and
misuse
Functional
and resilient
families and
communities
Effective
environmental
health systems
Economic
participation
and
development
- Injury and preventable diseases
- Infant mortality
- Birthweight
- Hearing impediments
- Children with tooth decay
Providing children with a good start in life can have a profound effect on their
passage through the life cycle. While options and opportunities in the future can be
determined at this early stage, so too can barriers.
Early childhood experiences have a significant influence on health and educational
outcomes in later life. Research has shown that health, growth and development in
the first three years of life play a crucial role in later outcomes. Brain development
is at its greatest to the age of three. Deprivation, stress and neglect in these early
years can have significant impacts on later childhood and adult health and
educational outcomes (see, for example, McCain and Mustard (1999), and Keating
and Hertzman (1999)).
Headline indicators influence, or reflect, the environment in which young children
are born and grow up:
•
household and individual income
•
suicide and self-harm
•
substantiated child abuse and neglect
•
family and community violence
•
imprisonment and juvenile detention rates.
Early child development and growth can be affected by outcomes in other strategic
areas for action including:
EARLY CHILD
DEVELOPMENT AND
GROWTH
5.1
•
substance use and misuse (alcohol, tobacco, drug and other substance misuse
and harm) — chapter 8
•
functional and resilient families and communities (access to primary health care,
mental health, engagement with service delivery) — chapter 9
•
effective environmental health systems (rates of diseases associated with poor
environmental health, access to clean water and functional sewerage,
overcrowding in housing) — chapter 10
•
positive childhood and transition to adulthood (the education of the parents of
young children and whether parents have made a good transition from school to
work and established themselves well before becoming parents) — chapter 7
•
economic participation and development (employment, governance capacity and
skills, governance arrangements) — chapter 11
Injury and preventable diseases in early childhood can prove fatal for young
children. Even when they are not fatal, they can affect nutrition, growth and mental
stimulation at a crucial time when children are developing rapidly. Research has
shown that negative stresses in early childhood can adversely affect child
development (see McCain and Mustard 1999 for examples). Repeated infections
can lead to kidney stones and high blood pressure (DHAC 1999).
Hospitalisation and deaths from injury and preventable diseases are reported in
section 5.1.
Infant mortality reflects the most serious outcome of disadvantage and illness
during pregnancy and infancy (the first year of life). Infants are growing rapidly and
still developing immunity to diseases and are more vulnerable to many illnesses and
environmental hazards than older children and adults. Section 5.2 reports on the
survival of Indigenous children in their first year of life.
Low birthweight has been shown in several studies to be correlated with coronary
heart disease and non-insulin dependent diabetes later in life. Small size and
disproportion at birth can indicate lack of nutrients or oxygen during particular
stages of pregnancy (see Mackerras 1998; Fall et al. 1995; Barker 1995;
Barker et al. 2001). Birthweight is also a key factor affecting neonatal mortality
(Sayers and Powers 1997). Section 5.3 examines data relating to babies born to
Indigenous mothers.
Hearing impediments in Indigenous children are often the result of recurring ear
infections. Chronic ear infections and subsequent hearing loss are generally agreed
to impair language development and educational achievement (Bowd (2002);
Couzos, Metcalf and Murray (1999); and Smith Mackenzie and Hatcher (1995)
5.2
OVERCOMING
INDIGENOUS
DISADVANTAGE 2007
cited in Couzos, Metcalf and Murray (2001)). A recent study found that school
attendance rates were much lower for Indigenous children with chronic ear
infections when compared with other children (NACCHO 2003).
Hearing impediments in early childhood may not be diagnosed until children begin
school and are unable to hear properly in the classroom. Deafness makes learning
much more difficult for children throughout their schooling and later life and is a
particular problem for children for whom English is not their first language (NTDE
1999). From the results of a large scale survey conducted in 2001 and 2002,
Zubrick et al. (2004) found that:
Recurrent and discharging ear infections, which affected one in eight Aboriginal
children in WA, had a very significant impact on rates of hearing loss and on speech,
language and learning problems.
Data on hearing impediments are contained in section 5.4.
The indicator of children with tooth decay has been moved from the strategic area
‘Early school engagement and performance (preschool to year 3)’ in recognition of
the importance of good oral health as part of early child development and growth.
The level of tooth decay, missing or filled teeth in primary school aged children
(where most data are available) reflects diet, dental hygiene and access to treatment
in the early years of life. Aboriginal and Torres Strait Islander children suffer from
much higher rates of decayed or missing teeth than non-Indigenous children, which
can also indicate poor access to, and unmet need for, dental care (AHMAC 2006).
Healthy teeth are an important part of overall good health, as tooth decay causes
illness and pain. Other effects can include difficulties chewing and discomfort while
eating, as well as impaired speech and language development. Tooth decay can also
exacerbate chronic disease, and generate negative psycho-social effects such as
embarrassment and social isolation (AHMAC 2006).
Data on tooth decay from school dental services, as well as data on hospitalisations
for dental problems are contained in section 5.5.
Attachment tables
Attachment tables for this chapter are identified in references throughout this
chapter by an ‘A’ suffix (for example, table 5A.1.1). A list of attachment tables is in
section 5.7. These tables can be found on the Review web page
(www.pc.gov.au/gsp). Users can also contact the Secretariat to obtain the
attachment tables.
EARLY CHILD
DEVELOPMENT AND
GROWTH
5.3
5.1
Injury and preventable diseases
Box 5.1.1
Key messages
•
In 2004-05, Indigenous children under four were twice as likely to be hospitalised for
potentially preventable diseases and injuries than non-Indigenous children
(251.0 per 1000 compared to 122.6 per 1000) (table 5.1.1).
•
For the period 2001 to 2005, the death rate from external causes and preventable
diseases was around five times as high for Indigenous children (from 5.7 to
10.8 per 10 000 population) as for non-Indigenous children (from 1.4 and
2.5 per 10 000 population) in Queensland, WA, SA and the NT (figure 5.1.2).
Since the 2005 Report, this indicator has been changed from ‘rates of hospital
admission for infectious diseases’ to ‘injury and preventable diseases’. This reflects
comments received during consultations on the 2003 and 2005 Reports that the
health of Indigenous children involved more than just infectious diseases. This
report covers a wide range of preventable conditions, including infectious diseases,
non-infectious diseases and injury (includes injuries caused by transport accidents,
other accidents, assault and complications of medical and surgical care).
Until the second half of the 20th century, infectious diseases were a prominent cause
of death in Australia. Between 1921 and 1995, age standardised death rates from
infectious diseases fell from 185 per 100 000 population to 6 per 100 000
(ABS 1997). In 2005, the death rate from certain infectious and parasitic diseases in
Australia (total persons, both Indigenous and non-Indigenous) was 7.8 per 100 000
population (ABS 2007).
Infectious diseases range in severity from minor conditions such as the common
cold, to serious illnesses such as meningococcal infection and tuberculosis, which
can result in death. Disease is caused by organisms such as bacteria, viruses or
parasitic worms, and can be transmitted directly (for example, through droplet
infection) between people, or from insects and animals to people. Disease can also
be indirectly transmitted (for example, through contaminated food or water) and
through the environment. Infection can also result from the pathological growth of
organisms already present in a person’s body (ABS 1997).
Some infections that may appear minor can have serious longer term health effects.
Recurring skin and throat infections (caused by group A streptococcal bacteria) in
5.4
OVERCOMING
INDIGENOUS
DISADVANTAGE 2007
some Aboriginal communities are associated with the highest worldwide rates of
acute rheumatic fever (Currie and Carapetis 2000).1
the major pathogen of skin infection, group A streptococcus, is also associated with
chronic renal failure — a prevalent and highly burdensome condition of Aboriginal
adults. (Zubrick et al. 2004, p.150)
In Australia, many childhood diseases are generally prevented or successfully
treated without requiring hospitalisation. The main focus of this indicator is to
examine the range of diseases and injuries experienced by children that result in a
hospital admission.
A wide range of social, cultural, physical and economic factors influence the health
of children. Health initiatives of communities and governments can assist in the
prevention of disease and promote the health of children. These initiatives include
education on the benefits of breastfeeding, good nutrition and sanitation, and the
provision of adequate housing (see chapter 10 for more information on diseases
associated with poor environmental health). Access to effective and appropriate
health care services (including dental and immunisation services) can also influence
the health of children in both the short and long term. More information on
immunisation rates in children and the prevalence of vaccine preventable diseases
as well as access to primary health care in general, is included in section 9.3.
Section 5.4 includes information on ear infections in children and section 5.5 covers
tooth decay in children.
1 The role of group A streptococcal bacteria (in skin and throat infections) leading to acute
rheumatic fever is contentious but it appears likely in Australia that it plays a role. Interventions
which aim to reduce group A streptococcal throat and skin infection are likely to reduce the rate
of acute rheumatic fever. Acute rheumatic fever is an auto-immune disease initiated by infection
with group A streptococcal bacteria. The important of acute rheumatic fever is its major
complication, rheumatic heart disease. After an initial episode of acute rheumatic fever, a person
is at risk of recurrent episodes, each of which can increase the risk of rheumatic heart disease.
Rheumatic heart disease is caused by the damage done to the heart valves during an episode of
acute rheumatic fever (ABS and AIHW 2003; Online Medical Dictionary 2005). Acute rheumatic
fever and rheumatic heart disease are now rare in populations with good living conditions —
optimal hygiene and minimal household overcrowding — and easy access to quality medical care
(things that Indigenous people often lack).
EARLY CHILD
DEVELOPMENT AND
GROWTH
5.5
Box 5.1.2
‘Things that work’ — injury and preventable diseases
Jabba Jabba Indigenous Immunisation Program — Sunshine Coast, Queensland
Indigenous vaccination programs in the past have sometimes had limited success, and
those most in need and at risk of disease have been most difficult to reach. The Jabba
Jabba Indigenous Immunisation program operated initially as a pilot between March
2002 and June 2004 to enable culturally appropriate access for ‘hard to reach’ sections
of the Indigenous community and to provide an entry point to mainstream health
services. The program now operates on a permanent basis in recognition of its
success in providing Indigenous clients with an entry point to mainstream health
services.
The program operates within an Indigenous child and family health model and provides
first time vaccinations for children who would otherwise have missed their vaccination
schedules. It also provides follow up to children who were long overdue for
vaccinations. The program was designed to have a high degree of cultural sensitivity.
For example Indigenous health workers assist the nurse immuniser during home
visiting. This not only breaks down cultural barriers but also enhances the skills and
knowledge of Indigenous health workers. Importantly the community has become
aware of other Indigenous services and has shown increased use of those services
(Queensland Government and Central Public Health Unit Network Sunshine Coast
2005).
Keeping Kids Healthy Makes a Better World, NT
This program operated in four communities in the Northern Territory: Mt Liebig,
Titjikala, Nyirripi and Willowra. Funded by UNICEF, Waltja and the Telstra Foundation,
its initial aim was to improve the nutrition of 0–5 year olds, but over time it was used to
achieve other outcomes such as engagement in the community, cultural awareness
and strength and greater family cohesion, including an emphasis on the role of men.
Program strategies included education, providing better access to healthy foods at the
community store, healthy breakfast programs, bush tucker and bush medicine activities
with elders, and gardening. The whole community was involved in these activities.
Local workers were trained as nutrition workers. Community engagement was an
essential element of program design — in the selection of foods to grow and stock, in
the development of priorities and in developing activities that achieved program aims.
The program itself was developed in response to concerns from the local communities
about diet.
Outcomes included decreased numbers of children failing to thrive, increased
awareness of the importance of nutrition, better access to healthy foods, decreased
incidence of anaemia in children and coordination between community-based agencies
such as the clinic, school, store and council. The communities involved continued to
focus on better nutrition even after the project came to an end.
(Continued next page)
5.6
OVERCOMING
INDIGENOUS
DISADVANTAGE 2007
Box 5.1.2
(continued)
Growth Assessment and Action and Healthy School-Age Kids Programs are now being
implemented across all remote communities, supported by the Maternal, Child and
Youth Health Team (MCYH), in collaboration with Remote Health and Workforce
Support. Comprehensive under-five child health promotion, action planning for children
who are not thriving and early identification and treatment of ear infection programs are
being developed. Interdivisional collaboration is integrating health and wellbeing
assessments and interventions in a ‘one-stop shop’ approach (NT Government,
unpublished).
Team approach to children’s nutrition (0 to 5 years) on Tiwi Islands, NT
A new approach to child nutrition on Tiwi Islands started in 2006 built on knowledge
that a team approach was the best form of management for child nutrition issues in
remote communities. A nutritionist worked with a multidisciplinary team, the crèche and
local women to support the nutrition of children aged less than five years. The Tiwi
child health strategy became part of routine practice at the health centre to be
continued after the nutritionist left. In the first six months of implementation began only
one child (who had other complex health issues) had to be sent away for failure to
thrive. The outcomes are shared with the Strong Women group (see section 5.3), who
are happy with and support the strategy, which has highlighted the importance of child
health and growth in the community (NT Government, unpublished).
Box 5.1.2 describes programs to reduce rates of preventable diseases in Indigenous
children.
Despite overall improvements in the health of most Australian children, significant
inequalities still exist. Hospitalisation data indicate that Indigenous children under
age four are hospitalised for injury and preventable diseases at twice the rate of nonIndigenous children of the same age.
Time series data on hospitalisations for injury and preventable diseases are not
included in this Report. Definitions of potentially preventable diseases and injury
(and the conditions that should be included) are currently being reviewed by
national health data committees. The conditions included in table 5.1.1 are based on
advice from the AIHW and include conditions that could have potentially been
prevented by the provision of appropriate non-hospital health services as well as
injuries that could potentially have been prevented (usually outside the health
system in broader society). Some of the disease codes included in table 5.1.1 may
also include some non-preventable conditions. Once definitions have been agreed it
should be possible to provide more precise, as well as time series, data for future
Reports.
EARLY CHILD
DEVELOPMENT AND
GROWTH
5.7
Table 5.1.1
Potentially preventable hospitalisations for children aged less
than 4 years, Qld, WA, SA, and public hospitals in the
NT, 2004-05a, b, c
Hospitalisations (number)
ICD-10-AM code and description
Certain infectious and parasitic
diseases (A00–B99)
Nutritional anaemias (D50–D53) and
malnutrition (E40–E46)
Diseases of the ear and mastoid
process (H60–H95)
Diseases of the respiratory system
(J00–J99)
Diseases of oral cavity salivary
glands and jaws (K00–K14)
Diseases of the skin and
subcutaneous tissue (L00–L99)
Injury, poisoning and certain other
consequences of external causes
(S00–T98)e
Transport accidents (V01–V99)e
Other external causes of accidental
injury (W00–X59)e
Assault (X85–Y09)
Complications of medical and
surgical care (Y40–Y84)e
Othere
Total potentially preventable
hospitalisations
Age specific rate (per
1000 population)
Indigenous
NonIndigenousd
Total
Indigenous
NonIndigenousd
1 731
7 792
9 523
59.8
22.0
104
43
147
3.6
0.1
303
5 813
6 116
10.5
16.4
3 416
19 285
22 701
118.1
54.5
297
2 146
2 443
10.3
6.1
594
1 273
1 867
20.5
3.6
815
62
7 003
286
7 818
348
28.2
2.1
19.8
0.8
602
73
6 067
79
6669
152
20.8
2.5
17.2
0.2
66
12
551
20
617
32
2.3
0.4
1.6
0.1
7 260
43 355
13 063
251.0
122.6
a Data are based on principal diagnosis as classified by the ICD-10-AM code and description. b Data are
based on state of usual residence. c Age specific rates are as per 1000 people in that age group (based on
ABS estimated resident population (ERP)). d Hospitalisations where Indigenous status was not stated are
included in the non-Indigenous numbers and rates. e External causes sub-categories classified by first
external cause.
Source: AIHW National Hospital Morbidity Database (unpublished); table 5A.1.1.
•
In 2004-05, Indigenous children aged less than four years were twice as likely to
be hospitalised for potentially preventable diseases and injuries than nonIndigenous children (251.0 per 1000 compared to 122.6 per 1000) (table 5.1.1).
•
Diseases of the respiratory system were the most common cause of potentially
preventable hospitalisations for both Indigenous and non-Indigenous children
aged less than four years, however the rate for Indigenous children (118.1 per
1000) was twice as high as for non-Indigenous children (54.5 per 1000).
•
Indigenous children aged less than four years suffered from nutritional anaemias
and malnutrition at 29.6 times the rate for non-Indigenous children (3.6 per 1000
compared to 0.1 per 1000). However, it was the least common potentially
5.8
OVERCOMING
INDIGENOUS
DISADVANTAGE 2007
preventable condition for which Indigenous children aged less than four years
were hospitalised (104 Indigenous hospitalisations).
•
Data on hospitalisations of children aged less than four years for potentially
preventable diseases and injuries by state and territory are included in table
5A.1.1.
Figure 5.1.1 Potentially preventable hospitalisations for children aged less
than 4 years, Qld, WA, SA, and public hospitals in the NT,
2004-05a, b, c, d
Indigenous
Non-Indigenous
Per 1000 population
400
350
300
250
200
150
100
50
0
Qld
WA
SA
NT
Total
a Data are based on principal diagnosis as classified by the ICD-10-AM code and description. b Data are
based on state of usual residence. c Age specific rates are as per 1000 people in that age group (based on
ABS estimated resident population(ERP)). d Hospitalisations where Indigenous status was not stated are
included in the non-Indigenous numbers and rates.
Source: AIHW National Hospital Morbidity Database (unpublished); table 5A.1.1.
•
Hospitalisations for potentially preventable diseases and injuries were higher for
Indigenous than non-Indigenous children aged less than four years in 2004-05
for each of the four states and territories for which data are available
(figure 5.1.1).
Results from the Western Australian Aboriginal Child Health Survey (Zubrick et al.
2004) undertaken in 2001 and 2002 are outlined below.
•
Recurring chest infections affected 12.3 per cent of Indigenous children aged
0–17 years, with infection rates highest in children aged 0–3 years and lowest in
children aged 12–17 years. There was no association between infection rates and
levels of relative isolation.2
2 Zubrick et al. (2004) used a different series of geographic region (remoteness) categories than the
standard ABS categories used elsewhere in this Report and discussed in chapter 2. Both sets of
categories are based on the Accessibility Remoteness Index of Australia (ARIA). The ABS
EARLY CHILD
DEVELOPMENT AND
GROWTH
5.9
•
An estimated 8.5 per cent of Indigenous children had recurring skin infections
such as school sores or scabies. Children aged 4–11 years were the most likely to
have recurring skin infections. The prevalence was 17.6 per cent in extremely
isolated areas, more than twice the rate in all other areas.
•
An estimated 5.6 per cent of Indigenous children suffered from recurring
gastrointestinal infections, with infection rates twice as high in extremely
isolated areas as in other areas. Prevalence decreased significantly after 12 years
of age.
•
Some 18.1 per cent of Indigenous children had recurring ear infections. Older
children aged 12–17 years were significantly less likely to have recurring ear
infections (13.6 per cent) than children aged 0–3 years (20.4 per cent) and
children aged 4–11 years (19.9 per cent).
•
An estimated 9.7 per cent of Indigenous children reported more than one of
recurring chest, skin, gastrointestinal and/or ear infections, with 6.9 per cent
suffering from two types, 2.3 per cent suffering from three types and 0.5 per cent
suffering from all four types. Significantly more children in areas of extreme
isolation (17.9 per cent) had more than one type of recurring infection than
children in less isolated areas.
•
An estimated 16.3 per cent of children in households where their primary carer
reported financial strain suffered from more than one type of recurring infection,
which was significantly higher than the prevalence in households where the
primary carer could ‘save a bit now and again’ (8.4 per cent) or could ‘save a
lot’ (7.2 per cent). There was no association between the primary carer’s
educational attainment and either recurring infections or ear infections.
categories are a widely used version known as ARIA+, whereas the version used by Zubrick et al.
(2004) is known as ARIA++, which has been designed to allow greater distinction between
locations that are all classified as very remote in the ABS ARIA+ version. The five ARIA++
categories used by Zubrick et al. (2004) are called levels of relative isolation and comprise the
categories: none (Perth metropolitan area), low, moderate, high and extreme.
5.10
OVERCOMING
INDIGENOUS
DISADVANTAGE 2007
Figure 5.1.2 Deaths from external causes and preventable diseases as a
proportion of total population for children aged less than five
years, 2001–2005a, b
Indigenous
Non-Indigenous
Per 10 000 population
12
10
8
6
4
2
0
Qld
WA
SA
NT
a Data are subject to a degree of uncertainty and apparent differences in life expectancy estimates between
jurisdictions may not be statistically significant. b Calculations of rates for the Indigenous population are based
on ABS Experimental Projections, Aboriginal and Torres Strait Islander Australians (low series, 2001 base).
There are no comparable population data for the non-Indigenous population. Calculations of rates for the
non-Indigenous population are based on data derived by subtracting Indigenous population projections from
total population estimates and should be used with care.
Source: ABS Causes of Deaths 2005, Cat. no. 3303.0 (unpublished); table 5A.1.4.
•
Between 2001–2005, the death rate from external causes and preventable
diseases was five times as high for Indigenous children (between 5.7 and
10.8 per 10 000 population) as the rate for non-Indigenous children (between 1.4
and 2.5 per 10 000 population) in Queensland, WA, SA and the NT (the four
jurisdictions for which data were available) (figure 5.1.2).
5.2
Infant mortality
Box 5.2.1
Key message
Indigenous infant mortality rates in most of the states and territories for which data are
available have improved in recent years. Nevertheless, mortality rates for Indigenous
infants in these jurisdictions remain two to three times as high as those for the total
population of infants (figures 5.2.1 and 5.2.2).
EARLY CHILD
DEVELOPMENT AND
GROWTH
5.11
The rate of infant mortality (the number deaths of children under one year of age
per 1000 live births)3 is commonly viewed as an indicator of the general health and
wellbeing of a population. A low infant mortality rate is a major contributor to
increased life expectancy for a population.
There was a dramatic decline in infant mortality rates in Australia over the 20th
century (the rate of infant deaths decreased from 103 deaths per 1000 live births in
1900 to 4.8 deaths per 1000 live births in 2003). During the first half of the 20th
century, a significant share of the decline in infant mortality was associated with
improvements in public sanitation and health education. By the 1940s, the
development of vaccines and mass vaccination programs resulted in further gains.
Improved medical technology (including improvements in neonatal intensive care)
and education campaigns about the importance of immunisation, and more recently,
in the case of sudden infant death syndrome, infant sleeping position, have led to
further modest declines in infant deaths in the last half of the century (ABS 1996
and 2004).
The main causes of Indigenous infant deaths are congenital disorders, sudden infant
death syndrome, respiratory and cardiovascular disorders, and accidents
(ABS 1996).
Box 5.2.2
‘Things that work’— infant mortality
NSW Aboriginal Maternal and Infant Health Strategy
The NSW Aboriginal Maternal and Infant Health Strategy commenced in 2001. It aims
to improve access to culturally appropriate maternity services for Aboriginal mothers,
including antenatal visits for pregnant women. The purpose of antenatal visits is to
monitor the health of both the mother and baby, provide information, identify antenatal
complications and provide appropriate intervention at the earliest time.
In those areas of NSW where the strategy has been implemented, 78 per cent of
Aboriginal women had their first antenatal visit before 20 weeks gestation in 2003-04,
compared with 64 per cent for these areas in the period 1996–2000 (prior to the
strategy).
(Continued next page)
3 Infant deaths are usually divided into ‘neonatal’ (occurring in the first 28 days after birth (0–27
days)) and ‘postneonatal’ periods (those occurring in the remainder of the first year (28 days to
364 days).
5.12
OVERCOMING
INDIGENOUS
DISADVANTAGE 2007
Box 5.2.2
(continued)
Between 1993–95 and 2002–04, the perinatal mortality4 rate among babies born to
Aboriginal mothers in NSW decreased from 19.7 to 12.5 per 1000 live births. The NSW
Aboriginal Maternal and Infant Health Strategy may have been one of several factors
and programs contributing to the decrease in mortality over this period (NSW
Government, unpublished).
Townsville Aboriginal and Islander Health Service, Queensland — Mums and
Babies program
In February 2000, the Mums and Babies project commenced at Townsville Aboriginal
and Islander Health Service (TAIHS). Under a partnership arrangement between the
Queensland Health Child Health Unit and the Aboriginal and Islander Health Team, the
Kirwan Women's Hospital, and TAIHS, a collaborative model of antenatal and
postnatal care for women was developed. The program encompasses regular
antenatal and postnatal medical examinations, pregnancy nutrition advice, birthing
information and support, supervised childcare, and a transport service. The program
has seen a decrease in perinatal deaths by 62 per cent, pre-term births by 44 per cent
and the incidence of low birthweight by 26 per cent since 2000. The Mums and Babies
clinic also sees large numbers of infants and children who are regularly monitored for
growth, development, and hearing. The program has been extended to include primary
health care for children up to eight years of age (TAIHS 2005; Atkinson 2001;
Panaretto et al. 2005; Queensland Government (unpublished)).
As well as those mentioned in box 5.2.2, a variety of programs have been developed
to improve the health of Indigenous babies and young children, some of which are
included as case studies in sections 5.1 and 5.3. Efforts to improve the health of
mothers and babies through better antenatal care, immunization and greater use of
maternal and child health services are likely to help reduce infant mortality.
At present, estimates of the infant mortality rate among Australia’s Indigenous
population are imprecise:
The exact scale of difference between the Indigenous and total population mortality is
difficult to establish conclusively, due to data quality issues with Indigenous deaths
data and the uncertainties inherent with estimating and projecting the Indigenous
population over time. Caution should be exercised when undertaking precise analysis
of Indigenous mortality and trends in Indigenous data. (ABS 2006)
The ABS suggests that under-coverage of Indigenous infant mortality is mainly due
to under reporting. Although each jurisdiction now asks a standard question about
the Indigenous status of the deceased, it is sometimes left unanswered or recorded
4 Perinatal mortality is the death of an infant within 28 days of birth (neonatal death) or of a fetus
(unborn child) that weighs at least 400 grams or that is of a gestational age of at least 20 weeks.
EARLY CHILD
DEVELOPMENT AND
GROWTH
5.13
incorrectly. There is some evidence that under-identification of Indigenous deaths is
primarily caused by Indigenous people being incorrectly recorded as not
Indigenous, rather than from their Indigenous status not being recorded at all. The
ABS suggests accuracy of Indigenous status data varies with how the information is
collected (for example, by surveys or through administrative data) and who
provides the information (for example, the person of interest, a relative, a health
professional or an official) and other factors that influence data collected for death
certificates (ABS 2006).
Although the total proportion of deaths for which Indigenous status is not stated is
quite small (1.2 per cent), comparison with population projections based on Census
data suggests that many Indigenous deaths are incorrectly recorded as nonIndigenous. The implied coverage of Indigenous deaths, for the period 2001 to
2005, ranged from 92 per cent in the NT, to 45 per cent and 31 per cent in NSW and
Victoria respectively (ABS 2006).5 Consequently, in this Report, Indigenous infant
mortality data are only presented for NSW, Queensland, WA, SA, and the NT.
Figure 5.2.1 Indigenous infant mortality
NSW
Qld
WA
SA
NT
Rate per 1000 live births
25
20
15
10
5
0
1997-99
1998-00
1999-01
2000-02
2001-03
2002-04
2003-05
Source: ABS (2006), Deaths Australia, 2005 (and previous issues); table 5A.2.1.
•
Between 1997–1999 and 2003–2005, Indigenous infant mortality fell in NSW,
Queensland, WA and the NT. Because of the incomplete identification of
Indigenous deaths and as the rates are based on small numbers of deaths, which
fluctuate from year to year, and because changes in some states are small, trends
should be interpreted with caution (figure 5.2.1).
•
Infant mortality rates for all persons (Indigenous plus non-Indigenous) also fell
over the same time periods (table 5A.2.1 and ABS (2006)).
5 Coverage ratios for Tasmania and the ACT are not calculated due to small numbers.
5.14
OVERCOMING
INDIGENOUS
DISADVANTAGE 2007
Figure 5.2.2 Infant mortality, by Indigenous status, 2003–2005a
Rate per 1000 live births
Indigenous persons
Total persons
18
16
14
12
10
8
6
4
2
0
NSW
Qld
WA
SA
NT
a Total includes Indigenous status not stated.
Source: ABS (2006), Deaths Australia, 2005; table 5A.2.1.
•
Infant mortality rates among Indigenous people were about two to three times
those for total persons for the period 2003–2005, in states and territories for
which data are available (figure 5.2.2).
•
In the NT, the significant proportion (28.8 per cent in 2001) of Indigenous
people in the total population skews the comparison between Indigenous and
total persons. The Indigenous infant mortality rate for the NT is best compared
with the total Australian infant mortality rate (5.0 per 1000 live births) (ABS
2006). For other states and territories Indigenous people comprised
approximately 2.4 per cent of the total population in 2001, therefore, infant
mortality for total persons represents mostly non-Indigenous births (for
population data see table A.6 of appendix 3).
•
Data in figure 5.2.2 compare Indigenous with total population infant mortality,
which allows the inclusion of data for NSW. Data comparing Indigenous and
non-Indigenous infant mortality for Queensland, WA, SA and the NT (but
excluding NSW) have been published by AHMAC (2006, p.65).
•
Indigenous infants in the US, Canada and New Zealand have higher mortality
rates than infants in the general populations of those countries, but the gap is not
as large as for Aboriginal and Torres Strait Islander infants in Australia
(AHMAC 2006, p.64).
EARLY CHILD
DEVELOPMENT AND
GROWTH
5.15
Figure 5.2.3 Indigenous infant mortality by sex, 2003–2005
Rate per 1000 live births
Males
Females
25
20
15
10
5
0
NSW
Qld
WA
SA
NT
Source: ABS (2006), Deaths Australia, 2005; table 5A.2.1.
•
In the period 2003–2005, infant mortality was higher for Indigenous males than
females in NSW, Queensland, WA and the NT (figure 5.2.3).
•
The male infant mortality rate for the total population has been consistently
higher than the female infant mortality rate over the past 20 years (ABS 2006).
5.3
Birthweight
Box 5.3.1
Key messages
•
From 2002 to 2004, babies born to Indigenous mothers were more than twice as
likely to have low birthweight (13.0 per 1000 live births) than babies born to
non-Indigenous mothers (6.1 per 1000 live births) (table 5.3.2).
•
Average birthweights and proportions of low birthweight babies to Indigenous
mothers did not change between 1998–2000 and 2002–2004 (tables 5A.3.1 to
5A.3.5).
•
From 2002 to 2004, the average birthweight of live births to Indigenous mothers was
3161 g, compared with 3380 g for babies born to non-Indigenous mothers — a
difference of 219 g (table 5.3.2).
The birthweight of a baby is a key indicator of health status. Children with low
birthweights are more likely to have problems early in life, or even die in infancy.
Low birthweight can also have long-term influences on the development of chronic
diseases in adulthood, including diabetes and heart disease (Mackerras 1998;
Fall et al. 1995). For many Indigenous children, health risks associated with low
5.16
OVERCOMING
INDIGENOUS
DISADVANTAGE 2007
birth weight are compounded by high rates of infectious disease and poor infant
nutrition (Singh and Hoy 2003).
Low birthweight is defined as less than 2500 g. Within this category, babies
weighing less than 1500 g are considered as very low birthweight and those less
than 1000 g as extremely low birthweight (AIHW 2003). Generally, a higher
proportion of female infants are born with a low birthweight compared to male
infants. However, female infants tend to do better than male infants of the same
weight.
Low birthweight might be a result of being born early (pre-term), although the
infant may be within the expected size range for its gestational age. Alternatively,
the infant may be small for its gestational age (fetal growth retardation). Low
birthweight can also result from a combination of these two factors (ABS/AIHW
2003). Mackerras (1998) and Sayers and Powers (1997) identify fetal growth
retardation as the main cause of low birthweight among Indigenous babies born in
non-remote areas. Conversely, Rousham and Gracey (2002), in a study of
Indigenous infants in the Kimberley region of WA, identified pre-term birth as the
more likely cause of low birthweight in this rural population.
Predictors for fetal growth retardation and pre-term birth are listed in table 5.3.1.
Some predictors cannot be altered (for example, infant sex or race), others may take
at least a generation to change (for example, maternal birthweight), while others
might be influenced in the short-term (for example, maternal weight or cigarette
smoking). Fetal-alcohol syndrome, which is more prevalent in Indigenous than
non-Indigenous populations (see section 8.1), can also lead to low birthweight.
Presence of multiple births can also influence an infant’s birthweight
(ABS/AIHW 2003).
Table 5.3.1
Direct
Indirect
Predictors of fetal growth retardation and pre-term birtha
Fetal growth retardation
Pre-term birth
infant sex, race/ethnic origin, maternal
height, maternal pre-pregnancy weight,
paternal height and weight, maternal
birthweight, parity, prior low birthweight
infant, gestational weight gain, energy
intake, general morbidity, malaria, maternal
cigarette smoking, alcohol consumption, and
tobacco chewing.
Very young maternal age, socio-economic
status (including maternal education)
maternal pre-pregnancy weight, prior
preterm birth, prior spontaneous
abortion, maternal cigarette smoking,
in utero diethylstilboestrolb exposure,
maternal diabetes, urogenital
infections, bacterial vaginosis, and
placental, cervical or uterine
abnormalities.
a Excludes deliveries in women with an underlying chronic illness. b Diethylstilboestrol is a drug prescribed
widely from the 1940s to 1970s that has been associated with increased risks of vaginal and cervical cancers
and other disorders in people who were exposed to the drug in the uterus when their mothers were given it
while pregnant.
Source: Mackerras 1998.
EARLY CHILD
DEVELOPMENT AND
GROWTH
5.17
Factors that may reduce low birthweight in the long term include:
•
increasing attendance for antenatal care in the first trimester, which would allow
for the identification and possible modification of factors (such as smoking) that
might compromise the mother’s and child’s health. Plunkett et al. (1996) found
that Indigenous women are less likely than non-Indigenous women to attend
early antenatal care. Some Indigenous women face difficulties in accessing
antenatal care, such as a lack of local facilities or suitable transport, cost, and a
lack of culturally accessible programs.
•
introducing nutritional assessment and monitoring into prenatal care, with
evaluation of their use and effectiveness
•
evaluating strategies to improve maternal nutrition by increased weight gain
during pregnancy (Mackerras 1998).
A study undertaken by the Nganampa Health Council on people residing in the
Anangu Pitjantjatjara Lands in the far north-west of SA found that better antenatal
care for expectant mothers led to positive outcomes in perinatal mortality and
improved birthweights (ABS/AIHW 2003).
Box 5.3.2 provides examples of successful programs providing antenatal care to
Indigenous women.
Box 5.3.2
‘Things that work’ — birthweight
Congress Alukura Women’s Health Program
Based in Alice Springs, NT, Congress Alukura is a women’s health and birthing centre
developed in the 1980s to address the needs of Aboriginal women in Central Australia.
The services include the provision of culturally appropriate antenatal, intrapartum,
postnatal and women’s health care through a midwifery led maternity service and
women’s health clinic. The service includes home visiting, transport, specialist/hospital
liaison, limited mobile bush service and adult and youth health education. The program
employs a full-time medical officer, midwives, women’s health nurse, liaison officer,
educators, traditional grandmothers and administrative/support staff.
A large proportion of Aboriginal mothers use Alukura for antenatal care (in 1994,
98 per cent of urban women and 18 per cent of rural women). Mean birthweight of
Aboriginal infants in the Alice Springs urban area increased from 3168 g in 1986–90 to
3271 g in 1991–95 (an increase of 103 g or 3.3 per cent) and was maintained at
3268 g in 1996–99 (Ah Chee, Alley and Milera 2001; Carter et al. 2004).
(Continued next page)
5.18
OVERCOMING
INDIGENOUS
DISADVANTAGE 2007
Box 5.3.2
(continued)
Strong Women, Strong Babies, Strong Culture
The Strong Women, Strong Babies, Strong Culture (SWSBSC) Program is a bi-cultural
program that supports Indigenous women to look after and teach young pregnant
women and new mothers to care for themselves and their children in ways that reflect
traditional cultural values and practices.
The aims of SWSBSC are:
•
to address the modifiable health risks during pregnancy for low birthweight
•
support involvement in cultural ceremonies and traditions for women
•
encourage early presentation for antenatal care
•
support families to care for their women during pregnancy and after the birth of the
baby
•
support and encourage women to care for their babies and young children.
The program is delivered ‘by Aboriginal women, for Aboriginal women’. The local
community-based Strong Women Workers are supported to provide information and
health promotion by regional SWSBSC Coordinators, who are employed by the NT
Department of Health and Community Services. The program is built on the respect
and understanding of Aboriginal women's cultural ways for the health of women and
children by keeping ‘grandmother's law’ strong.
The SWSBSC program was set up in 1993-94 and evaluation has shown a reduction in
low birthweight in participating communities compared to those without the program.
The program is currently funded in 15 communities (NT Government, unpublished).
Djuli Galban, NSW
Djuli Galban operates in Kempsey, NSW, with a focus on antenatal and early postnatal
care and education.
The format is an accessible, community based, culturally sensitive outreach program.
Participating women are provided with individualised, flexible and supportive care and
education that is appropriate to their individual needs. ‘At risk’ pregnancies (including
teenage pregnancies) are monitored and referred to specialist services. Culturally
appropriate resources have been developed to facilitate the delivery of education and
care. In addition, the delivery of education has been adapted to suit the needs of the
local community (one-on-one sessions are used, as group sessions were found to be
less effective). The program aims to create close relationships and trust between staff
and clients. Transport assistance is provided.
(Continued next page)
EARLY CHILD
DEVELOPMENT AND
GROWTH
5.19
Box 5.3.2
(continued)
The service uses an electronic registration and recall system to keep track of
appointments and vaccinations. Women using the program are invited to participate in
the early postnatal care and education program. Home visits are provided if desired.
•
88 per cent of Aboriginal women in the Macleay area presented for antenatal care
before 20 weeks gestation.
•
93 per cent of women use the postnatal service.
•
Child immunisation coverage has increased to 95.2 per cent.
•
The rate of premature birth is lower than for the total NSW Aboriginal population, but
there is significant variation over time. In 2004-05 the rate was 10.5 per cent.
(Aspery, Jarrett and Donovan 1998).
Koori Maternity Strategy, Victoria
The main aim of the service is to provide culturally appropriate maternity care to Koori
women and align their birthing experiences and outcomes with those experienced by
all Australian women. The strategy operates across Victoria.
The program provides both ante and postnatal care, antenatal education, birthing
support and a health service for children in early childhood. Transport is provided for
mothers to facilitate access to the clinic. Aboriginal women still have their babies in the
local hospital, but it is not uncommon for them to be discharged after only two days.
The birthing program is able to provide support for mothers in this situation, particularly
in relation to continuation of breastfeeding after discharge from hospital.
A self assessment of the strengths of the program pointed to the cultural
appropriateness of the service provided, its flexibility and reliability, with confidentiality
assured, and to the fact that it is community based, owned and controlled.
There has been an increase in Koori women accessing antenatal care and earlier in
pregnancy. Social networks have improved and better working relationships with
mainstream organisations have been established (Dwyer 2005).
Marrang Aboriginal Child and Family Health Model, NSW
The Marrang Aboriginal Child and Family Health Model was developed to improve
access and health outcomes for Aboriginal families in Orange, NSW. It is based on a
two person team consisting of an Aboriginal Health Worker and a child and family
health nurse dedicated to servicing Aboriginal families. The model engages Aboriginal
families in a culturally appropriate manner.
(Continued next page)
5.20
OVERCOMING
INDIGENOUS
DISADVANTAGE 2007
Box 5.3.2
(continued)
The model was developed following consultation with Aboriginal families to gain a
better understanding of why they were not accessing child and family health services.
The model advocates community development and building strong partnerships with
local communities. Flexibility of service provision and a strong antenatal focus assists
in engaging the Aboriginal community. The NSW Health Family Partnership Model and
training was utilised to sustain quality relationships with families in this project.
The main change in the service delivery model was the formation of a two person team
dedicated to Aboriginal families. Aboriginal clients who had been referred through the
antenatal clinic or maternity service were allocated to the new team. Each client was
followed up personally, either at the hospital or through a home visit to determine if
they wanted to access the service and, more importantly, how they wanted to access
the service. The 'how' component needed to consider other health and social issues
within the family unit.
The form of the contact is the key to the success of the new service delivery model.
The contact recognised socio-economic factors affecting the Aboriginal community
which have often been overlooked. These may be low literacy levels, no telephone or
not having transport. Improved health access was achieved by being an interpreter,
providing transport, encouraging clients to seek additional health services, ensuring
health appointments are attended and providing health education.
Referrals from within the Aboriginal community or through the more traditional health
services and health professionals and attendances at antenatal clinics increased. The
sustained contact by the dedicated team increased trust within the community (Bootle
and Toomey 2006).
Nganampa Health Council Child and Maternal Health Program, SA
Nganampa Health Council Child and Maternal Health Program is an intensive
antenatal and early postnatal care program operating in the Anangu Pitjantjatjara lands
of SA since the mid 1980s.
The program introduced standard protocols for antenatal and child health care. An
electronic registration and recall system helps to achieve these protocols. Dedicated
positions were created to collect and review data with a focus on improving outcomes.
The development of culturally appropriate resources appears to have been a key factor
in the program’s success.
The program is founded upon close relationships between midwives and pregnant
women. Individual Growth Action Plans are developed with parents and carers,
supported by culturally appropriate resource materials. The program is integrated
within the Health Council, enabling continuity of care for pregnant women, infants and
even school age children.
(Continued next page)
EARLY CHILD
DEVELOPMENT AND
GROWTH
5.21
Box 5.3.2
(continued)
Rates of low birth weight in the region have fallen to the level of the national Australian
figure and are substantially better than those in many other Aboriginal communities.
84 per cent of pregnant women have at least five antenatal visits during pregnancy and
two thirds of all pregnant women have a first antenatal assessment in the first
trimester. Eighty-three per cent of five year olds, 80 per cent of 10 year olds and
66 per cent of 15 year olds participated in child health screening (school based).
Immunisation coverage is high with rates well over 90 per cent in most communities.
However, although wasting has ceased, rates of anaemia and stunted growth in
children remain high in the region (Sloman et al. 1999, OATSIH 2001).
Ngua Gundi — the Mother/Child Project, Queensland
Ngua Gundi — the Mother/Child Project — was funded by the Commonwealth Birthing
Services Project to address the serious under utilisation of antenatal services by young
Aboriginal mothers in Woorabinda, Queensland.
An initial needs analysis indicated that, although there was a lack of local hospital
facilities, Aboriginal women were reluctant to attend the Rockhampton Hospital for
antenatal classes and/or to have their babies. The promotion and support of
breastfeeding and provision of education and support in relation to infant nutrition are
integrated into the maternal and child health care services. The program has expanded
its range of services to include adolescent and older mothers, birthing support and the
health needs of children 0–5 years. Transport is provided for mothers wanting to attend
the clinic and the midwife will visit mothers in their own homes.
There is a high level of acceptance of, and involvement with the program. Trust has
built up between the community and the Aboriginal Health Workers (Dorman 1997;
Perkins 1998, Pholeros, Rainow and Torzillo 1993).
The analyses in this section are based on data provided by the AIHW National
Perinatal Statistics Unit. Each jurisdiction has a perinatal data collection in which
midwives and other staff, using information obtained from mothers and from
hospital or other records, complete notification forms for each birth. Information on
Indigenous people based on hospital records is limited by the accuracy with which
Indigenous people are identified in these records (see appendix 3). Not all
Indigenous mothers are identified as Indigenous, therefore, not all births to
Indigenous mothers are recorded as Indigenous.
There are also problems with the reliability of data from jurisdictions with small
numbers of babies born to Indigenous mothers. Caution needs to be exercised when
examining data from these jurisdictions. The perinatal statistics do not record any
information about the father. Therefore, births in the Indigenous population reported
here only include those from Indigenous mothers, and do not include births to
Indigenous fathers and non-Indigenous mothers. In 2003, 27 per cent of Indigenous
5.22
OVERCOMING
INDIGENOUS
DISADVANTAGE 2007
babies had non-Indigenous mothers and Indigenous fathers (ABS and AIHW 2005,
p. 78). Hence, these figures underestimate the total number of Indigenous babies
born in a given period.
Table 5.3.2
Birthweight, by live births and fetal deaths, 2002–2004a, b
Births to Indigenous mothersc
Mean birthweight (grams)
Low birthweight (<2500g)
Very low birthweight (<1500g)
Extremely low birthweight (<1000g)
All births
Births to non-Indigenous mothers
Mean birthweight (grams)
Low birthweight (<2500g)
Very low birthweight (<1500g)
Extremely low birthweight (<1000g)
All births
All birthse
Mean birthweight (grams)
Low birthweight (<2500g)
Very low birthweight (<1500g)
Extremely low birthweight (<1000g)
All births
Live births.
3 161
no.
3 459
630
296
26 583
%
13.0
2.4
1.1
100.0
Live births
3 380
no.
43 974
7 275
3 182
720 309
%
6.1
1.0
0.4
100.0
Live births
3 372
no.
48 652
8 108
3 549
763 773
%
6.4
1.1
0.5
100.0
Fetal deathsd.
1 300
no.
%
241 78.2
206 66.9
184 59.7
308 100.0
Fetal deaths
1 297
no.
3 822
3 219
2 858
4 981
%
76.7
64.6
57.4
100.0
Fetal deaths
1 293
no.
4 197
3 538
3 141
5 452
%
77.0
64.9
57.6
100.0
Total births
3 140
no.
3 700
836
480
26 891
%
13.8
3.1
1.8
100.0
Total births
3 366
no.
47 796
10 494
6 040
725 290
%
6.6
1.4
0.8
100.0
Total births
3 358
no.
52 849
11 646
6 690
769 225
%
6.9
1.5
0.9
100.0
a Birthweight is collected at birth and includes stillbirths of at least 20 weeks gestation or 400g birthweight.
b Data are presented in a three year grouping due to small numbers from year to year. c Indigenous data
relate to babies born to Indigenous mothers only, and exclude babies born to non-Indigenous mothers and
Indigenous fathers. Thus, the information is not based on the total count of Indigenous babies. d The
denominator for the fetal death percentages is fetal deaths rather than births. e Includes babies to mothers of
unknown Indigenous status. The number of all births is greater than the sum of births to Indigenous plus nonIndigenous mothers because births for Tasmania are included in the total births but were not available by
Indigenous status for Tasmania and so are not included in the Indigenous and non-Indigenous totals for
Australia.
Source: AIHW National Perinatal Data Collection, National Perinatal Statistics Unit (unpublished); table
5A.3.1.
EARLY CHILD
DEVELOPMENT AND
GROWTH
5.23
The following analyses are based on table 5.3.2. The data on Indigenous babies
relate to babies born to Indigenous mothers only, as the data collection excludes
babies born to non-Indigenous mothers and Indigenous fathers:
•
During 2002–2004, there was a total of 763 773 live births in Australia, of
which 94.3 per cent were babies born to non-Indigenous mothers and
3.5 per cent were babies born to Indigenous mothers6.
•
The mean birthweight of live births to Indigenous mothers was 3161 g,
compared with 3380 g for babies born to non-Indigenous mothers — a
difference of 219 g (non-Indigenous births were 6.9 per cent heavier).
•
The proportion of live births to Indigenous mothers with low birthweight was
more than twice that of non-Indigenous mothers (13.0 per cent compared with
6.1 per cent). Further, the proportion of live births to Indigenous mothers with
very low and extremely low birthweights (2.4 and 1.1 per cent respectively) was
higher than for babies born to non-Indigenous mothers (1.0 and 0.4 per cent).
•
Of all live births, 6.4 per cent had low birthweight compared with 77.0 per cent
of all fetal deaths.
•
1.1 per cent of babies born to Indigenous mothers, compared with 0.7 per cent of
babies born to non-Indigenous mothers, were fetal deaths.
•
Of those fetuses that died, over half — for both Indigenous and non-Indigenous
mothers — had extremely low birthweights.
Across states and territories, there was little variation in the proportion of live births
with low birthweight for babies born to non-Indigenous mothers (table 5A.3.1).
Mean birthweights and proportions of low birthweight babies in 2002–2004 have
not changed in the period since 1998–2000 (except for some minor fluctuations)
(tables 5A.3.1 to 5A.3.5). In general, comparisons of birthweights of babies to
Indigenous mothers between states and territories and over time should be
interpreted with care.
6 Proportions do not add to 100 per cent because births for Tasmania are included in the total live
births but were not available by Indigenous status for Tasmania and so are not included in the
Indigenous and non-Indigenous totals for Australia.
5.24
OVERCOMING
INDIGENOUS
DISADVANTAGE 2007
5.4
Hearing impediments
Box 5.4.1
Key messages
•
In 2004-05, the prevalence of hearing conditions for Indigenous children was three
times as high as for non-Indigenous children (table 5A.4.1).
•
Between 2001 and 2004-05, there was no change in the overall prevalence of
hearing problems among Indigenous children (figure 5.4.1).
•
From 2001-02 to 2004-05, hospitalisations for middle ear and mastoid diseases
decreased for Indigenous children aged 0–3 years (from 12.9 per 1000 to
9.5 per 1000) (tables 5A.4.6 to 5A.4.9).
This indicator presents data on the prevalence of hearing problems for Indigenous
and non-Indigenous children, and information on ear or hearing problems that
resulted in admission to a hospital for Queensland, WA, SA and the NT.
In 2004-05, rates of hearing loss were higher among Indigenous people than
non-Indigenous people in all age groups up to 55 years of age (ABS 2006). The
greatest disparity was between Indigenous and non-Indigenous children aged
0–14 years (ABS 2006). Between July 2002 and June 2004, Indigenous children
aged 0–14 years were hospitalised for tympanoplasty7 procedures due to middle ear
infection at a rate five times as high as other children (AHMAC 2006). The
excessive burden of ear disease, particularly otitis media, in Indigenous populations
has long been recognised (Burrow and Thomson 2006; Coates et al. 2002; Howard
and Hampton 2006; Lowell 1991 cited in Nienhuys 1992; Morris et al. 2005;
Thorne 2004; WHO 2006; Zubrick et al. 2004).
The Australian Health Ministers’ Advisory Council (2006) identified children’s
hearing loss as a health issue that needs improvement. Children’s hearing loss is a
performance measure in the Aboriginal and Torres Strait Islander Health
Performance Framework (AHMAC 2006).
The most common causes of hearing loss among Indigenous people are disorders of
the middle ear. Otitis media, which is an inflammation of the middle ear, often
occurs as a result of another illness (such as a cold), caused by bacterial and viral
infections (Burrow and Thomson 2006; Morris et al. 2005; Couzos, Metcalf and
Murray 2001).
7 Tympanoplasty is a surgical procedure to repair the tympany, or eardrum, perforated as a result of
chronic otitis media (infections of the middle ear). The procedure restores the hearing of children
affected by a perforated eardrum.
EARLY CHILD
DEVELOPMENT AND
GROWTH
5.25
The rates of otitis media remain extremely high for Indigenous children (Burrow
and Thomson 2006; Morris et al. 2005; Morris et al. 2006). A recent study based on
the assessment of 709 Aboriginal children aged 6–30 months living in 29 remote
Aboriginal communities across Northern Australia found:
•
25 per cent of the children had acute otitis media without perforation
•
6 per cent had acute otitis media with perforation.
The authors of the study noted that no other published surveys in other populations
have documented such high prevalence rates of acute otitis media
(Morris et al. 2006).
The Western Australian Aboriginal Child Health Survey (WAACHS) revealed that
Indigenous children aged four to 17 with recurring ear infections not only had an
increased risk of abnormal hearing but also a significantly greater risk of language
problems and learning difficulties (Zubrick et al. 2004).
There are various forms of otitis media. Generally accepted definitions are provided
in box 5.4.2. The types of otitis media observed among Indigenous people are
different from those common among non-Indigenous Australians. Indigenous
people are more likely to suffer from acute and chronic suppurative forms of otitis
media while otitis media with effusion is a major problem among non-Indigenous
people (Burrow and Thomson 2003; Couzos, Metcalf and Murray 2001).
Box 5.4.2
Types of otitis media
•
Otitis media with effusion (OME) is inflammation of the middle ear characterised by
fluid behind the eardrum without signs or symptoms of acute otitis media.
Sometimes referred to as ‘glue ear’.
•
Acute otitis media without perforation (AOM without perforation) is acute
inflammation of the middle ear and eardrum (tympanic membrane) with signs or
symptoms of infection. AOM is characterised by fluid behind the eardrum combined
with one or more of the following: bulging eardrum, red eardrum, recent discharge of
pus, fever, ear pain or irritability. Bulging of the eardrum is the most reliable
indicator of AOM in Aboriginal children.
•
Recurrent acute otitis media (rAOM) is where there are three or more attacks of
AOM within six months.
•
Acute otitis media with perforation (AOM with perforation) is where there is
discharge of pus through a perforation (hole) in the eardrum within the last six
weeks.
(Continued next page)
5.26
OVERCOMING
INDIGENOUS
DISADVANTAGE 2007
Box 5.4.2
(continued)
•
Chronic otitis media is a persistent inflammation of the middle ear. It can occur with
or without perforation, either as chronic suppurative otitis media or as otitis media
with effusion.
•
Chronic suppurative otitis media (CSOM) is recurrent or persistent bacterial
infection of the middle ear, with discharge of pus through a perforation in the
eardrum for at least six weeks. Sometimes referred to as ‘runny ears’.
•
Dry perforation is the presence of a perforation in the eardrum without any signs of
discharge or fluid behind the eardrum.
Sources: Close, Murphy and Goodwin 1996; Coates et al. 2002; Couzos, Metcalf and Murray 1999 and
Menzies School of Health Research 2001 cited in Burrow and Thomson 2006.
Otitis media in Indigenous children is characterised by very early onset, persistence
and high rates of severe disease — resulting in a chronic disease which Indigenous
people carry from childhood into adolescence (Morris et al. 2005; Morris et al.
2006; Leach et al. 1994). In contrast, otitis media in non-Indigenous children
typically resolves with age and is rarely seen amongst non-Indigenous children over
the age of eight (Burrow and Thompson 2003).
Persistent bacterial colonisation, which is said to come from poor environmental
factors such as overcrowded living conditions and poor hygiene, contribute to the
chronic nature and severity of otitis media in Indigenous people (Coates et al. 2002;
Jones and Smith 2006; WHO 2006; Zubrick et al. 2004). The condition is often
exacerbated by inadequate health infrastructure, ineffective treatment and poor
nutrition and exposure to passive smoking (Burrow and Thomson 2003; WHO
2006; Zubrick et al. 2004).
The impact of conductive hearing loss, due to otitis media, on the quality of life of
Indigenous children and their caregivers is well documented (Brouwer et al. 2005;
Howard and Hampton 2006; Nienhuys 1992; Thorne 2004). Indigenous children
suffer significantly from conductive hearing loss in early infancy and their hearing
level may not recover fully before adulthood. The fluctuation of hearing level
during childhood has implications for children’s auditory, linguistic, cognitive and
psychosocial development (Brouwer et al. 2005; Nienhuys 1992).
To a large extent, otitis media is preventable and treatable. A surgical procedure
(myringotomy) can be performed to assist in restoring hearing. This is achieved by
releasing the fluid that builds up in the middle ear (NSW DoH 2002).
Identifying risk factors for otitis media might increase the chances for early
prevention and intervention. Some of the possible risk factors are outlined below.
EARLY CHILD
DEVELOPMENT AND
GROWTH
5.27
•
There is relatively higher bacterial colonisation in Indigenous infants, which is
strongly correlated with the onset of middle ear effusion (this tended to occur
within the first 12 weeks of life in 66 per cent of Indigenous infants). No
correlation is found between colonisation and the onset of otitis media in
non-Indigenous infants. Further, once established, it is significantly less likely
for an Indigenous infant compared with a non-Indigenous infant to clear the
bacterial pathogens (Morris et al. 2006). The early bacterial colonisation in
Indigenous infants might be linked to the fact that Indigenous communities are
more exposed to factors such as a greater number of siblings in an overcrowded
household, which increases the risk factors for bacterial colonisation and acute
otitis media.
•
Some studies have found a link between the early first onset of otitis media and
the increased risk of recurrent infections (that is, ‘early and often appears to be
the rule’). Indigenous infants tend to have persistent acute otitis media and other
ear infections that are rarely resolved (Boswell and Nienhuys 1996;
Morris et al. 2006).
•
The incidence of acute otitis media in other family members may significantly
increase the risk of ear infection, especially in children.
•
Although few studies have evaluated this relationship, malnutrition in
Indigenous children might be associated with the development of chronic otitis
media (Jones and Smith 2006).
•
High rates of smoking within the Indigenous population might contribute to the
prevalence of otitis media among Indigenous children (see section 8.2 for more
information on tobacco use).
Box 5.4.3 provides examples of programs that have improved health outcomes for
Indigenous children.
5.28
OVERCOMING
INDIGENOUS
DISADVANTAGE 2007
Box 5.4.3
‘Things that work’ — improving health outcomes
Swimming pools in remote communities
Indigenous children in remote areas suffer from high rates of skin diseases, including
pyderma, which is associated with chronic renal failure, and otitis media. Many
Indigenous children also suffer from perforated tympanic membranes and some degree
of hearing loss, which can create learning difficulties.
The 2005 Report presented the outcomes of a preliminary study into the health
benefits of swimming pools in remote communities (Lehmann et al. 2003). A final
report (TICHR 2006) from the Telethon Institute for Child Health Research compared
the heath status of children from the Burringurrah Aboriginal community before and
after the swimming pool was opened. The installation of the swimming pool was part of
a ‘no school, no pool’ initiative. In Burringurrah the pool is open continuously each
summer season.
The first health examinations were conducted in 2000, before the pool was built. The
final health examinations were conducted in early 2005. Some of the findings include:
•
before the pool opened, 62 per cent of children had skin infections (which included
30 per cent who had severe skin infections requiring antibiotics). In April 2005,
these figures were 10 per cent and 2 per cent, respectively.
•
33 per cent of children had an ear perforation before installation of the pool. In April
2005, this had decreased to 15 per cent of children.
The Telethon Institute noted that the outcomes from the study provided evidence to
support the importance of providing infrastructure in remote communities
(TICHR 2006).
Improved hearing assessment for primary school children in Townsville
A 2005 study by the Townsville Learning and Engagement Centre (LEC), Education
Queensland and Queensland Health assessed the hearing of children in a local
Townsville primary school. The study found that 44.8 per cent of year 2 students were
identified as having possible conductive hearing loss (this confirmed an earlier study
that found at least 40 per cent of Indigenous children have an unidentified conductive
hearing loss).
A high proportion of the students assessed at the local Townsville primary school were
Indigenous and many were not achieving high results in literacy and numeracy and
were also identified as demonstrating behavioural concerns. This led the LEC to:
•
develop in-class hearing assessment tools for teaching staff
•
develop hearing assessment games for parents and
•
provide professional development for both teachers and parents to identify any
hearing loss that may reduce the opportunity for academic and schooling success.
EARLY CHILD
DEVELOPMENT AND
GROWTH
5.29
Prevalence of hearing conditions
Survey data provide information on the prevalence of hearing conditions for
Indigenous and non-Indigenous children.
Figure 5.4.1 Prevalence of hearing conditions in children aged 0–14
yearsa, b, c
Indigenous
Non-Indigenous
Per cent of population
15
10
5
0
2001
2004-05
Deafness
2001
2004-05
Other hearing problem
2001
2004-05
Total with hearing
condition
a Error bars represent 95 per cent confidence intervals around each estimate (see chapter 2 for more
information). b Other hearing problem includes otitis media, tinnitus and Meniere's disease/vertiginous
syndrome. c Total with hearing condition includes ‘Type of ear/hearing problem’ not known.
Source: ABS 2004-05 NATSIHS (unpublished); ABS 2004-05 NHS (unpublished); ABS 2001 NHS
(unpublished); tables 5A.4.1 and 5A.4.2.
•
In 2001 and 2004-05, Indigenous children aged 0–14 years old were more likely
to suffer from hearing problems than non-Indigenous children (figure 5.4.1).
•
There was no statistically significant difference in the prevalence of hearing
problems among Indigenous children between 2001 and 2004-05, while there
was a statistically significant reduction in prevalence for non-Indigenous
children (tables 5A.4.1 and 5A.4.2).
•
In 2004-05 the prevalence of hearing conditions, including total/partial hearing
loss and otitis media, was higher for Indigenous children aged 0–14
(9.5 per cent) than non-Indigenous children (3.0 per cent) (table 5A.4.1).
•
The prevalence of hearing conditions in the Indigenous population (all ages) did
not vary with remoteness in 2001 or 2004-05 (tables 5A.4.3 and 5A.4.4).
5.30
OVERCOMING
INDIGENOUS
DISADVANTAGE 2007
Figure 5.4.2 Prevalence of otitis media, 2004-05a
Indigenous
Non-Indigenous
Per cent of population
10
8
6
4
2
0
0–4 years
5–9 years
10–14 years
a Error bars represent 95 per cent confidence intervals around each estimate (see chapter 2 for more
information).
Source: ABS 2004-05 NATSIHS (unpublished); ABS 2004-05 NHS (unpublished); table 5A.4.5.
•
In 2004-05, the prevalence of otitis media among Indigenous children aged five
to nine years was 6.5 per cent (compared with 2.3 per cent for non-Indigenous
children) (figure 5.4.2).
•
Across all age groups Indigenous children were two to four times as likely as
non-Indigenous children to suffer from hearing problems (table 5A.4.5).
Hospitalisations for ear and hearing problems
The availability of hospitalisations data for Indigenous people is significantly
reduced in the 2007 Report compared to previous Reports. AIHW analyses into the
quality of Indigenous identification of hospital admitted patient statistics has shown
that while the quality is good in some jurisdictions, in other jurisdictions it is poor
(AIHW 2005). Consequently, Indigenous hospitalisations data are only available for
Queensland, WA, SA and the NT. Data from NSW, Victoria, Tasmania and the
ACT were considered to be of insufficient quality. Data issues, including
hospitalisations are discussed in chapter 2.
EARLY CHILD
DEVELOPMENT AND
GROWTH
5.31
Table 5.4.1
Age specific hospitalisations where the principal diagnosis was
diseases of the ear and mastoid process, Qld, WA, SA, and
public hospitals in the NT, 2004-05a, b, c
Principal diagnosis
Indig.
Non
-Indig.
Not
stated
Total
no.
no.
no.
no.
Indig.
NonIndig.d
per 1000
People aged 0–3 years
Diseases of external ear
Diseases of middle ear and mastoid
Suppurative and unspecified otitis
media
Diseases of inner ear
Other disorders of ear
People aged 4–14 years
Diseases of external ear
Diseases of middle ear and mastoid
Suppurative and unspecified otitis
media
Diseases of inner ear
Other disorders of ear
18
275
164
94
4 956
1 596
np
466
110
np
5 697
1 870
0.6
9.5
5.7
0.3
15.3
4.8
–
10
7
277
–
9
7
296
–
0.3
–
0.8
27
558
148
316
5 419
1 140
12
485
74
355
6 462
1 362
0.3
7.0
1.9
0.3
5.5
1.1
–
19
13
261
np
7
np
287
–
0.2
–
0.2
a Hospitalisation is the discharge, transfer, death or change of episode of care of an admitted patient (see
glossary for a detailed definition). b Data are based on state of usual residence. c Identification of Indigenous
patients is incomplete and completeness varies across jurisdictions. The AIHW has advised that only data for
Queensland, WA, SA and the NT are considered to be acceptable for analytical purposes. Data for NSW, Vic,
Tasmania and the ACT were withheld by AIHW due to high rates of Indigenous under-identification (see
chapter 2 and appendix 4 for more information). d Includes separations where Indigenous status was not
reported. – Nil or rounded to zero. np Not published.
Source: AIHW National hospital morbidity database (unpublished); table 5A.4.6.
Hospitalisations data only include those who access medical services, and have
been diagnosed and admitted to hospital for the specified conditions. Therefore,
when examining hospital statistics on ear and hearing problems it should be noted
that only ear or hearing related illness resulting in admission to a hospital are
collected. Cases that result in a visit to a general practitioner or to an emergency
department, but do not lead to hospitalisation, are excluded. This is likely to include
a large share of 0–3 year olds where parents may not be aware that their children
have an ear or hearing problem or where access to hospitals may be limited.
Based on data available from Queensland, WA, SA and the NT, in 2004-05:
•
The most common hospitalisation rate (for both populations and age groups)
was for diseases of the middle ear and mastoid.
•
Indigenous children three years and under had a higher hospitalisation rate for
suppurative and unspecified otitis media than non-Indigenous children (5.7 per
1000 compared with 4.8 per 1000) but a lower rate of hospitalisation than nonIndigenous children for all diseases of the middle ear and mastoid (table 5.4.1).
5.32
OVERCOMING
INDIGENOUS
DISADVANTAGE 2007
•
Although the hospitalisation rate for suppurative and unspecified otitis media for
children aged four to 14 years is lower than the hospitalisation rate for children
aged under three years, Indigenous children aged between four and 14 years still
had a higher hospitalisation rate than non-Indigenous children aged between four
and 14 years (1.9 per 1000 compared with 1.1 per 1000).
•
Indigenous children aged between four and 14 years had a higher hospitalisation
rate for diseases of the middle ear and mastoid than non-Indigenous children
(7.0 per 1000 compared with 5.5 per 1000).
Data for Queensland, WA, SA and the NT show that from 2001-02 to 2004-05:
•
Hospitalisation rates for middle ear and mastoid diseases decreased for
Indigenous children aged 0–3 years (from 12.9 per 1000 to 9.5 per 1000) and
non-Indigenous children aged 0–3 years (16.2 per 1000 to 15.3 per 1000)
(tables 5A.4.6 to 5A.4.9).
•
The hospitalisation rate for suppurative and unspecified otitis media decreased
for Indigenous children under the age of three years from 7.0 per 1000 in
2001-02 to 5.7 per 1000 in 2004-05 (tables 5A.4.6 to 5A.4.9).
5.5
Children with tooth decay
Box 5.5.1
•
Key messages
Data on tooth decay were available only for NSW, SA and the NT. For these
jurisdictions:
– Indigenous children had higher numbers of both infant and adult teeth with decay
than non-Indigenous children, in both metropolitan and rural areas (table 5.5.1)
– fewer Indigenous children than non-Indigenous children had decay-free infant
and adult teeth across all age groups and in both metropolitan and rural areas
(table 5.5.2).
•
National data on dental hospitalisation rates and procedure rates showed:
– Indigenous children aged less than five years had the highest dental
hospitalisation rate of any age group, almost one and a half times the rate for
non-Indigenous children of that age group (table 5A.5.8)
– extraction rates were greater for Indigenous children than for non-Indigenous
children. The rate of extraction procedures for Indigenous boys was 1.3 times as
high as the rate for non-Indigenous boys (figure 5.5.4).
In the 2005 Report, data on tooth decay among Indigenous children were presented
under the indicator ‘Primary school children with dental caries’, which was part of
EARLY CHILD
DEVELOPMENT AND
GROWTH
5.33
the ‘Early school engagement and performance (preschool to year 3)’ strategic area
for action. For the 2007 Report, data on the dental health of Indigenous children
have been expanded and moved to the ‘Early child development and growth’
strategic area for action. Dental health status was considered more an indicator of
growth and development rather than school engagement.
Tooth decay is caused by acid-producing bacteria living in the mouth and is often
caused by a diet of sugary or sticky foods and inadequate dental hygiene. Unless
treated in its early stage, tooth decay may result in pain, infection, and destruction
of soft tissues in the mouth (AIHW 2000). It has a significant impact on
self-esteem, psychological and social wellbeing, employment, interpersonal
relations and quality of life (National Advisory Committee on Oral Health 2004).
While tooth decay is fully reversible if treated early, when left untreated, it requires
complex and costly procedures to prevent tooth loss (Harford, Spencer and
Roberts-Thomson 2003).
Historically, Indigenous people had less tooth decay due to their traditional diet. As
their diet changed to include food rich in fermentable carbohydrates, they have
become as exposed to tooth decay risk factors as non-Indigenous people
(Davies et al. 1997). This risk is worsened by limited access to dental health
services and lack of preventive measures and education in some parts of Australia
(Harford, Spencer and Roberts-Thomson 2003).
While the dental health of non-Indigenous children has generally improved since
the introduction of the School Dental Scheme in 1977 and the addition of fluoride to
public drinking water supplies, the dental health of Indigenous children appears to
have deteriorated in the last couple of decades (AIHW 1996 and 1998, cited in
Al-Yaman, Bryant and Sargeant 2002).
A paper by Endean, Roberts-Thomson and Wooley (2004) found that the dental
health of Indigenous children living in an Indigenous community in the north west
of South Australia deteriorated between 1987-88 and 2000. This paper compared
the dental health of Indigenous children aged 4 to 10 years in 2000 with information
obtained from the Nganampa Health Council (NHC) Dental Program in 1987.
AHMAC (2006) reported that Indigenous children had more decayed than filled
teeth in SA, NSW and the NT, reflecting a large unmet need for dental care.
In far north Queensland, a privately-funded dental health program was successfully
implemented in 2005, with the aim of improving the dental health of Indigenous
people in and around Cairns (see box 5.5.2). Box 5.5.3 describes a program
successfully established by the SA Dental Service to increase the use of dental
services and improve the oral health of the Indigenous community around Adelaide.
5.34
OVERCOMING
INDIGENOUS
DISADVANTAGE 2007
Box 5.5.2
‘Things that work’ — ‘Filling the Gap’: Indigenous Dental
Program
Wuchopperen Indigenous Health Service provides care to approximately 20 000
Aboriginal and Torres Strait Islander people in and around Cairns (far north
Queensland). Oral health is an important component of Wuchopperen’s services, with
two fully equipped dental rooms at the clinic in Cairns plus a mobile dental van ready to
travel to outlying communities. However, up until recently, there was a severe shortage
of dentists, limiting Wuchopperen’s dental services (for example, there was a waiting
list of one year for basic care). This lack of access to dental care worsened the
continuing poor standard of dental health amongst Aboriginal and Torres Strait Islander
people in this region.
The ‘Filling the Gap Indigenous Dental Program’ has partly alleviated this problem by
making full use of the existing facilities by supplying volunteer dentists from around
Australia to assist the Wuchopperen clinic. This privately funded volunteer program
provides air fares to Cairns, accommodation and the cost of registration with the
Queensland Dental Board in return for one to two weeks of a dentist’s time. With a
generous $10 000 donation from an anonymous donor and word-of-mouth promotion,
Filling the Gap got off the ground in late 2005 and the first dentists flew to Cairns in
January 2006 (University of NSW 2006).
Box 5.5.3
‘Things that work’ — SA Dental Service Aboriginal Liaison
Program
In February 2005, a dental therapist from the northern area of Adelaide commenced
work as an Aboriginal Liaison Officer for the SA Dental Service. The aim of her role
was to develop a partnership with the local Aboriginal and Torres Strait Islander
community through involvement with the Muna Paiendi Health Service and Kaurna
Plains Primary School. She regularly attended community based events, including a
diabetes luncheon and young mothers’ group, and provided clinical services for the
school children at the local school dental clinic.
The Aboriginal Liaison Officer’s continued enthusiasm and genuine interest has since
gained her respect within the local Aboriginal and Torres Strait Islander community and
increased the community’s confidence and trust in mainstream dental services.
Children are now transported via school bus to the dental clinic for examinations and
treatment twice a week. The dental clinic staff frequently attend Kaurna Plains School
to provide classroom education and oral health information resources. Increased
attendance at the school dental clinic has been the direct result of this more interactive
and flexible approach.
(Continued next page)
EARLY CHILD
DEVELOPMENT AND
GROWTH
5.35
Box 5.5.3
(continued)
A broader Aboriginal Liaison Program was then established in late 2005 to build on the
achievements in the north of Adelaide. The aim of the program is to improve oral health
outcomes for Aboriginal and Torres Strait Islander people by increasing the number
who access dental care. Five Aboriginal Liaison Officers are currently working with
local Aboriginal Health Services and Aboriginal communities to develop sustainable
pathways for referring clients to dental services and to increase knowledge about oral
health care (SA government unpublished).
Tooth decay is measured as the sum of the number of untreated decayed teeth (D),
missing teeth (M) extracted due to caries8, and filled teeth (F) restored following
caries (that is DMFT = D+M+F). While DMFT is used for permanent (adult) teeth,
dmft (in lower case) refers to infant teeth and is derived in the same way as DMFT.
The indicator DMFT=0 (dmft=0 for infant teeth) refers to caries-free teeth and is
used to refer to the number/proportion of teeth that are free of decay (Armfield and
Roberts-Thomson 2004).
The data for this indicator are sourced from four published articles prepared by the
Australian Research Centre for Population Oral Health (Ellershaw, Spencer and
Slade 2005; Jamieson, Armfield and Roberts-Thomson 2006a, 2006b; Jamieson and
Roberts-Thomson 2006). The first part of this section reports on the extent of tooth
decay among Indigenous and non-Indigenous children enrolled in school dental
services in NSW, SA and the NT (Jamieson, Armfield and Roberts-Thomson
2006a). The second and third parts focus on the dental health of Indigenous and
non-Indigenous children in the NT (Jamieson, Armfield and Roberts-Thomson
2006b) and SA (Ellershaw, Spencer and Slade 2005), respectively. The fourth part
presents hospital dental admission and procedure rates based on separations data
from 1297 public and private hospitals located across Australia (Jamieson and
Roberts-Thomson 2006).
Indigenous children’s dental health in NSW, SA and the NT combined
Measures of tooth decay for Indigenous and non-Indigenous children enrolled in
school dental services in metropolitan and rural NSW, SA and the NT presented in
tables 5.5.1 and 5.5.2 are based on data collected over three 12-month periods; 2000
for NSW, 2002 for the NT, and 2003 for SA. Of the 326 099 children examined,
10 743 (3.2 per cent) were Indigenous (Jamieson, Armfield and
Roberts-Thomson 2006a).
8 Dental caries is a technical term for tooth decay.
5.36
OVERCOMING
INDIGENOUS
DISADVANTAGE 2007
Table 5.5.1
Children’s mean number of teeth with decay, by remoteness
and age group, NSW, SA and the NT, selected years between
2000 and 2003a
Metropolitan
Indigenous
Age
Mean
SE
Mean dmft score (for infant teeth)
4 years
2.89
0.33
5 years
2.63
0.20
6 years
2.74
0.18
7 years
2.09
0.13
8 years
2.20
0.15
9 years
1.98
0.12
10 years
1.39
0.13
Rural
Non-Indigenous
Indigenous
Non-Indigenous
Mean
SE
Mean
SE
Mean
SE
1.31
1.20
1.42
1.44
1.48
1.26
1.00
0.03
0.01
0.02
0.01
0.02
0.01
0.01
3.56
4.13
4.09
3.43
3.16
2.28
1.66
0.19
0.15
0.15
0.12
0.11
0.09
0.08
1.39
1.68
1.82
1.86
1.87
1.60
1.27
0.05
0.03
0.03
0.02
0.03
0.02
0.02
0.00
0.00
0.01
0.01
0.01
0.01
0.01
0.01
0.03
0.18
0.36
0.53
0.68
1.00
1.05
1.33
1.77
2.27
0.03
0.03
0.04
0.04
0.06
0.06
0.09
0.17
0.24
0.05
0.22
0.28
0.36
0.44
0.59
0.70
0.90
1.19
0.00
0.01
0.01
0.01
0.01
0.01
0.02
0.01
0.04
Mean DMFT score (for permanent (adult) teeth)
6 years
0.13
0.04
0.08
7 years
0.22
0.03
0.22
8 years
0.44
0.06
0.30
9 years
0.56
0.05
0.39
10 years
0.77
0.08
0.47
11 years
0.80
0.07
0.59
12 years
1.08
0.11
0.77
13 years
1.44
0.16
0.88
14 years
1.83
0.31
1.18
SE = Standard error.
a D=number of untreated decayed teeth; M=number of missing teeth; F=number of filled teeth; DMFT=D+M+F
(for permanent adult teeth); dmft refers to infant teeth and is derived in the same way as DMFT. The indicator
DMFT=0 (dmft=0 for infant teeth) refers to decay-free teeth.
Source: Jamieson, Armfield and Roberts-Thomson (2006a); table 5A.5.1 and 5A.5.2.
•
The mean (average) number of infant teeth with decay was higher for
Indigenous children than non-Indigenous children across all ages (from four to
10 years) and for both metropolitan and rural areas (table 5.5.1).
•
The highest number of infant teeth with decay for Indigenous children was 2.89
for children four years of age in metropolitan areas and 4.13 for five-year-old
Indigenous children living in rural areas (table 5.5.1).
•
The mean number of permanent (adult) teeth with decay was higher for
Indigenous children than non-Indigenous children across all ages except for
seven-year-olds in metropolitan areas (both had the same DMFT score of 0.22)
(table 5.5.1).
•
The mean number of permanent teeth with decay for Indigenous children living
in metropolitan areas ranged from 0.13 for six-year-olds to 1.83 for 14-year-olds,
compared with 0.08 for non-Indigenous six-year-olds and 1.18 for
non-Indigenous 14-year-olds (table 5.5.1).
EARLY CHILD
DEVELOPMENT AND
GROWTH
5.37
•
The level of decay on infant teeth was higher for both Indigenous and
non-Indigenous children living in rural areas than those living in metropolitan
areas (table 5.5.1).
•
For both Indigenous and non-Indigenous children living in metropolitan and
rural areas, the mean number of permanent teeth with decay increased with age
(table 5.5.1).
Table 5.5.2
Proportion of children with decay-free teeth, by remoteness and
age group, NSW, SA and the NT, selected years between 2000
and 2003a
Metropolitan
Indigenous
Rural
Non-Indigenous
Age
%
SE
%
Per cent dmft=0 (decay-free infant teeth)
4 years
41.6
4.4
69.7
5 years
47.7
2.5
70.9
6 years
36.6
2.8
64.5
7 years
51.8
2.2
62.9
8 years
43.6
2.9
58.9
9 years
48.9
2.3
62.2
10 years
57.0
2.9
66.1
Indigenous
Non-Indigenous
SE
%
SE
%
SE
0.6
0.2
0.4
0.3
0.4
0.3
0.4
31.0
31.8
24.2
28.8
28.6
38.1
44.9
2.3
1.6
1.7
1.5
1.6
1.6
1.8
64.3
62.2
56.8
54.2
51.6
54.2
59.7
0.5
0.5
0.3
0.5
0.6
0.5
0.6
90.4
83.5
74.6
68.9
60.6
60.5
53.5
52.3
40.0
1.2
1.3
1.5
1.6
1.8
1.7
2.2
3.1
4.1
97.1
90.1
86.7
83.3
79.1
75.3
70.9
65.6
59.1
0.1
0.3
0.4
0.4
0.5
0.4
0.6
0.6
0.9
Per cent DMFT=0 (decay-free permanent (adult) teeth)
6 years
93.8
1.4
96.7
0.1
7 years
89.5
1.3
90.4
0.2
8 years
78.7
2.4
86.0
0.3
9 years
74.7
2.0
83.1
0.2
10 years
66.6
2.8
78.9
0.3
11 years
67.8
2.2
75.4
0.3
12 years
59.3
3.2
70.6
0.4
13 years
57.4
3.2
70.0
0.3
14 years
41.3
5.1
62.1
0.6
SE = Standard error.
a D=number of untreated decayed teeth; M=number of missing teeth; F=number of filled teeth; DMFT=D+M+F
(for permanent adult teeth); dmft refers to infant teeth and is derived in the same way as DMFT. The indicator
DMFT=0 (dmft=0 for infant teeth) refers to decay-free teeth.
Source: Jamieson, Armfield and Roberts-Thomson (2006a); table 5A.5.1 and 5A.5.2.
•
In both metropolitan and rural areas and across all age groups (from four to 10
years), the proportion of Indigenous children with decay-free infant teeth was
lower than the proportion of non-Indigenous children without decay
(table 5.5.2).
•
The proportion of Indigenous children with decay-free permanent teeth was
lower than the proportion of non-Indigenous children without decay, across all
age groups (from six to 14 years) in rural areas and for eight to 14-year-olds in
metropolitan areas (table 5.5.2).
5.38
OVERCOMING
INDIGENOUS
DISADVANTAGE 2007
•
The percentage of Indigenous children with decay-free infant teeth was greater
in metropolitan areas than rural areas (table 5.5.2).
•
For both Indigenous and non-Indigenous children living in metropolitan and
rural areas, the proportion of children with decay-free permanent teeth decreased
with age (table 5.5.2).
Tooth decay among Indigenous and non-Indigenous children in the NT
Tooth decay measures for Indigenous and non-Indigenous children enrolled in
school dental services in the NT presented in figure 5.5.1 and table 5.5.3 were
calculated using data collected in 2002-03. Of the 12 584 children examined, 4 417
(35.1 per cent) were Indigenous (Jamieson, Armfield and Roberts-Thomson 2006b).
EARLY CHILD
DEVELOPMENT AND
GROWTH
5.39
Figure 5.5.1 Mean number of teeth with decay for 4–13 year old Indigenous
and non-Indigenous children, by age group, NT School Dental
Service, 2002-03a, b
Mean dmft score (for infant teeth)
Indigenous
Non-Indigenous
Mean dmft score
5.0
4.0
3.0
2.0
1.0
0
4
5
6
7
8
9
10
Age in years
Mean DMFT score (for permanent (adult) teeth)
Mean DMFT score
5.0
4.0
3.0
2.0
1.0
0
6
7
8
9
10
Age in years
11
12
13
a D=number of untreated decayed teeth; M=number of missing teeth; F=number of filled teeth; DMFT=D+M+F
(for permanent adult teeth); dmft refers to infant teeth and is derived in the same way as DMFT. The indicator
DMFT=0 (dmft=0 for infant teeth) refers to decay-free teeth. b Error bars represent 95 per cent confidence
intervals around each mean.
Source: Jamieson, Armfield and Roberts-Thomson (2006b); table 5A.5.3.
•
Average numbers of infant teeth with decay were higher for Indigenous children
than non-Indigenous children across all ages (from four to 10 years) in the NT
school dental service in 2002-03 (figure 5.5.1).
•
The highest scores for infant teeth decay for Indigenous children were 4.34 and
4.14 for five and six-year-olds, respectively (figure 5.5.1). The greatest
5.40
OVERCOMING
INDIGENOUS
DISADVANTAGE 2007
difference in scores between Indigenous and non-Indigenous children was for
5-year-olds (4.34 for Indigenous children compared to 1.47 for non-Indigenous
children) (figure 5.5.1).
•
Average numbers of adult teeth with decay for Indigenous children ranged from
0.15 for six-year-olds to 1.81 for 13-year-olds, compared to 0.07 for
non-Indigenous six-year-olds and 0.80 for non-Indigenous 13-year-olds
(figure 5.5.1).
•
The greatest difference in permanent tooth decay scores between Indigenous and
non-Indigenous children was for 13-year-olds; the score for Indigenous children
was 2.3 times as high as the score for non-Indigenous children (figure 5.5.1).
•
For both Indigenous and non-Indigenous children, permanent tooth decay scores
increased with age (figure 5.5.1).
Attachment tables 5A.5.4 and 5A.5.5 presents average infant and adult tooth decay
scores for Indigenous and non-Indigenous children aged four to 13 years enrolled in
the NT school dental service classified by the Socio-Economic Indices for Areas
(SEIFA). The SEIFA was developed by the ABS using data derived from the 2001
Census of Population and Housing, using a range of measures to rank areas based
on their relative social and economic wellbeing. A SEIFA category of ‘1’ denotes
the most disadvantaged areas and ‘4’ denotes the least disadvantaged areas
(Jamieson, Armfield and Roberts-Thomson 2006b). None of the NT tooth decay
data for Indigenous children fell into category ‘4’ of the SEIFA (the least
disadvantaged areas.
Average infant tooth decay scores were higher for Indigenous children than
non-Indigenous children across all ages (from four to 10 years) and SEIFA
categories ‘1’, ‘2’ and ‘3’ (table 5A.5.4). The highest scores for Indigenous children
were consistently associated with SEIFA category ‘1’ and the lowest scores with
SEIFA category ‘3’ (table 5A.5.4). This provides evidence that Indigenous children
from the most disadvantaged areas tend to have a greater number of decayed infant
teeth.
A similar trend was found for permanent tooth decay scores for Indigenous
children, with the average number of decayed teeth decreasing as the level of
disadvantage decreased from SEIFA category ‘1’ to ‘3’ (table 5A.5.5). Average
scores were higher for Indigenous children than non-Indigenous children across all
ages (from six to 13 years) in SEIFA category ‘1’ (table 5A.5.5).
For non-Indigenous children, there was no consistent pattern between the average
number of decayed teeth (infant and permanent) and the level of disadvantage as
measured by SEIFA (tables 5A.5.4 and 5A.5.5).
EARLY CHILD
DEVELOPMENT AND
GROWTH
5.41
Tooth decay among Indigenous and non-Indigenous children in SA
Average tooth decay scores for Indigenous and non-Indigenous children attending
school dental services in SA, presented in figure 5.5.2, were calculated using data
from the 2002 Child Dental Health Survey (Ellershaw, Spencer and Slade 2005).
Figure 5.5.2 SA, mean number of teeth with decay for 4–15 year old
Indigenous and non-Indigenous children, by age group, 2002
Child Dental Health Surveya
Mean dmft score (for infant teeth)
Indigenous
Mean dmft score
4.0
Non-Indigenous
3.0
2.0
1.0
0
4
5
6
7
Age in years
8
9
10
Mean DMFT score (for permanent (adult) teeth)
Mean DMFT score
4.0
3.0
2.0
1.0
0
7
8
9
10
11
12
13
14
15
Age in years
a D=number of untreated decayed teeth; M=number of missing teeth; F=number of filled teeth; DMFT=D+M+F
(for permanent adult teeth); dmft refers to infant teeth and is derived in the same way as DMFT. The indicator
DMFT=0 (dmft=0 for infant teeth) refers to decay-free teeth.
Source: Ellershaw, Spencer and Slade (2005); table 5A.5.6.
5.42
OVERCOMING
INDIGENOUS
DISADVANTAGE 2007
•
According to the 2002 Child Dental Health Survey, average numbers of infant
teeth with decay were higher for Indigenous children than non-Indigenous
children across all ages (from four to 10 years) in SA. The highest scores for
Indigenous children were 3.91 and 3.40 for four and five-year olds, respectively
(figure 5.5.2). The greatest difference in scores between Indigenous and
non-Indigenous children was for four-year-olds (3.91 for Indigenous children
compared to 1.31 for non-Indigenous children) (figure 5.5.2).
•
For both Indigenous and non-Indigenous children, permanent tooth decay scores
increased with age (figure 5.5.2). Average scores for Indigenous children ranged
from 0.44 for seven-year-olds to 2.27 for 15-year-olds, compared with 0.20 for
non-Indigenous seven-year-olds and 1.65 for non-Indigenous 15-year-olds
(figure 5.5.2). The greatest relative difference in scores between Indigenous and
non-Indigenous children was for seven-year-olds; the score was 2.2 times greater
for Indigenous children than non-Indigenous children (figure 5.5.2).
EARLY CHILD
DEVELOPMENT AND
GROWTH
5.43
Figure 5.5.3 SA, proportion of Indigenous and non-Indigenous children with
calculus and gingival bleeding, by age group, 2002 Child Dental
Health Surveya, b
Calculus
Indigenous
Non-Indigenous
50
Per cent
40
30
20
10
0
6–7
8–9
10–11
12–13
14–15
12–13
14–15
Age in years
Gingival bleeding
50
Per cent
40
30
20
10
0
6–7
8–9
10–11
Age in years
a Gingival bleeding is bleeding of the gums associated with gingivitis, which is an inflammation of the gums
surrounding the teeth caused by a buildup of plaque or food particles. b Calculus is a hard deposit of
mineralized plaque which is attached to crowns and/or roots of teeth.
Source: Ellershaw, Spencer and Slade (2005); table 5A.5.7.
•
5.44
For each age group presented in figure 5.5.3, a smaller proportion of Indigenous
children had calculus than non-Indigenous children. For both Indigenous and
non-Indigenous children, the proportion with calculus increased with age.
Eighteen per cent and 22.8 per cent, respectively, of 14–15-year old Indigenous
and non-Indigenous children had calculus.
OVERCOMING
INDIGENOUS
DISADVANTAGE 2007
•
A greater proportion of Indigenous children had gingival bleeding than
non-Indigenous children across all age groups (figure 5.5.3). Forty-four per cent
of Indigenous children aged 8–9 years suffered from gingival bleeding, greater
than any other age group.
Hospital dental admission and procedure rates for Indigenous children
living in all Australian states and territories
In 2002-03, dental hospitalisation rates for male and female Indigenous children
(aged two to 14 years) were higher than the rates for male and female
non-Indigenous children, based on dental hospitalisations data from 1297 public and
private hospitals (AIHW National Hospital Morbidity Database) (table 5A.5.8).
Dental hospitalisation rates for Indigenous children aged under five years and those
living in remote areas were particularly high compared with rates for
non-Indigenous children and Indigenous children of other age groups or remoteness
areas (table 5A.5.8).
Figures 5.5.4, 5.5.5 and 5.5.6 compare the hospital dental procedure rates for
Indigenous and non-Indigenous children aged two to 14 years by sex, age group and
remoteness. Over 80 dental procedure codes (International Classification of
Diseases Australian Modification) were grouped into ‘extraction’, ‘pulpal care’,
‘restorative care’, or ‘other’ (including the provision of splints, crowns or bridges)
(Jamieson and Roberts-Thomson 2006).
EARLY CHILD
DEVELOPMENT AND
GROWTH
5.45
Figure 5.5.4 Hospital dental procedure rates for children aged 2–14 years,
by type of procedure and sex, 2002-03a, b, c, d, e
Indigenous male
Indigenous female
Per 100 000 children
700
Non-Indigenous male
Non-Indigenous female
600
500
400
300
200
100
0
Extraction
Pulpal care
Restoration
Other
a Error bars represent 95 per cent confidence intervals around each estimate. b Extraction procedures are
performed to remove decayed, damaged, malformed, or malpositioned teeth. c Pulpal care refers to
procedures carried out on the soft inner structure of a tooth, consisting of nerve and blood vessels.
d Restoration procedures involve placing a material in a tooth to restore function and morphology when tooth
structure has been lost due to decay or fracture (generally, because of extensive caries), or to improve the
aesthetics of the tooth. e Other includes the provision of splints, crowns or bridges.
Source: Jamieson and Roberts-Thomson (2006); table 5A.5.9.
•
Extraction is an invasive procedure used on patients with excessive decay (that
is, when multiple teeth are affected or when time constraints preclude more
comprehensive care) (Jamieson and Roberts-Thomson 2006). For Indigenous
and non-Indigenous children, the rate of extraction procedures was greater than
any other procedure rate presented in figure 5.5.4.
•
For ‘extraction’ and ‘restoration’ procedures, rates for Indigenous males and
females were greater than the rates for these procedures for non-Indigenous
males and females (figure 5.5.4). The rate of ‘extraction’ procedures for
Indigenous males was 1.3 times the rate for non-Indigenous males.
•
For ‘pulpal’ and ‘other’ procedures, the rates for Indigenous males and females
were less than the rates for these procedures for non-Indigenous males and
females (figure 5.5.4).
5.46
OVERCOMING
INDIGENOUS
DISADVANTAGE 2007
Figure 5.5.5 Hospital dental procedure rates for children aged 2–9 years, by
type of procedure and age, 2002-03a, b, c, d, e
Per 100 000 children
1000
Indigenous (< 5 years)
Non-Indigenous (< 5 years)
Indigenous (5-9 years)
Non-Indigenous (5-9 years)
800
600
400
200
0
Extraction
Pulpal care
Restoration
Other
a Error bars represent 95 per cent confidence intervals around each estimate. b Extraction procedures are
performed to remove decayed, damaged, malformed, or malpositioned teeth. c Pulpal care refers to
procedures carried out on the soft inner structure of a tooth, consisting of nerve and blood vessels.
d Restoration procedures involve placing a material in a tooth to restore function and morphology when tooth
structure has been lost due to decay or fracture (generally, because of extensive caries), or to improve the
aesthetics of the tooth. e Other includes the provision of splints, crowns or bridges.
Source: Jamieson and Roberts-Thomson (2006); table 5A.5.10.
•
Indigenous children aged less than 5 years and 5–9 years of age experienced
higher rates of ‘extraction’ procedures than non-Indigenous children in the same
age groups (figure 5.5.5). The rate of ‘extraction’ procedures for Indigenous
children aged less than five years was 2.2 times the rate for non-Indigenous
children.
•
The rate for ‘restoration’ procedures was also greater for Indigenous children
aged less than 5 years; 1.4 times greater than the ‘restoration’ procedure rate for
non-Indigenous children (figure 5.5.5).
•
Similar to the pattern shown in figure 5.5.4, rates for ‘pulpal’ and ‘other’
procedures were lower among Indigenous children than non-Indigenous children
in both age groups (figure 5.5.5).
•
Indigenous children aged 10 to 14 years were hospitalised for extractions at
around one third the rate for non-Indigenous children of the same age
(table 5A.5.10).
EARLY CHILD
DEVELOPMENT AND
GROWTH
5.47
Figure 5.5.6 Hospital dental procedure rates for children aged 2–14 years,
by type of procedure and remoteness area, 2002-03a, b, c, d, e
Per 100 000 children
1000
Indigenous (major city)
Non-Indigenous (major city)
Indigenous (remote)
Non-Indigenous (remote)
800
600
400
200
0
Extraction
Pulpal care
Restoration
Other
a Error bars represent 95 per cent confidence intervals around each estimate. b Extraction procedures are
performed to remove decayed, damaged, malformed, or malpositioned teeth. c Pulpal care refers to
procedures carried out on the soft inner structure of a tooth, consisting of nerve and blood vessels.
d Restoration procedures involve placing a material in a tooth to restore function and morphology when tooth
structure has been lost due to decay or fracture (generally, because of extensive caries), or to improve the
aesthetics of the tooth. e Other includes the provision of splints, crowns or bridges.
Source: Jamieson and Roberts-Thomson (2006); table 5A.5.11.
•
Indigenous children in major cities and remote areas experienced greater rates of
‘extraction’ procedures than non-Indigenous children in the same locations. The
rate of ‘extraction’ procedures for Indigenous children living in remote areas
was nearly twice the rate for non-Indigenous children (figure 5.5.6). The rate for
‘restoration’ procedures for Indigenous children living in remote areas was 1.5
times greater than the rate for non-Indigenous children (figure 5.5.6).
•
For ‘pulpal care’ and ‘other’ procedures, the rates for Indigenous children living
in major cities were lower than the rates for non-Indigenous children
(figure 5.5.6).
5.6
Future directions in data
Hearing impediments
There are only limited data available on the burden of hearing loss in Indigenous
children. Comprehensive, up-to-date data need to be collected to enable the
assessment of the type and severity of ear infections in the Indigenous population.
5.48
OVERCOMING
INDIGENOUS
DISADVANTAGE 2007
The proposed Longitudinal Study of Indigenous Children (LSIC) may collect data
on hearing impediments.
Children with tooth decay
Reliable data on the dental health status of Indigenous children are currently limited
to three jurisdictions (NSW, SA and NT). There is considerable scope to expand the
availability of comparable data on Indigenous children’s dental health so that a
national picture can be seen as well as variations over time and by remoteness area.
5.7
Attachment tables
Attachment tables are identified in references throughout this chapter by an ‘A’
suffix (for example, table 5A.2.1 is table 1 in the attachment tables for section 5.2).
The files containing the attachment tables can also be found on the Review web
page (www.pc.gov.au/gsp). Users without access to the Internet can contact the
Secretariat to obtain the attachment tables (see contact details on the inside front
cover of the Report).
5.1 Injury and preventable diseases
Table 5A.1.1
Table 5A.1.2
Number and rate of hospitalisations for injury and potentially preventable
diseases for children aged less than 4 years, Qld, WA, SA, and public hospitals
in the NT, 2004-05
Deaths from external causes and preventable diseases for children aged less
than 5 years, 2001−2005
5.2 Infant mortality
Table 5A.2.1
Infant mortality rates (per 1000 live births)
5.3 Birthweight
Table 5A.3.1
Baby's birthweight, by live births and fetal deaths, 2002–2004
Table 5A.3.2
Baby's birthweight, by live births and fetal deaths, 2001–2003
Table 5A.3.3
Baby's birthweight, by live births and fetal deaths, 2000–2002
Table 5A.3.4
Baby's birthweight, by live births and fetal deaths, 1999–2001
Table 5A.3.5
Baby's birthweight, by live births and fetal deaths, 1998–2000
EARLY CHILD
DEVELOPMENT AND
GROWTH
5.49
5.4 Hearing impediments
Table 5A.4.1
Persons with a long-term hearing problem: type of ear/hearing problem, by age
and Indigenous status, 2004-05 (per cent of population)
Table 5A.4.2
Persons with a long-term hearing problem: type of ear/hearing problem, by age
and Indigenous status, 2001 (per cent of population)
Table 5A.4.3
Persons with a long-term hearing problem: type of ear/hearing problem, by
remoteness areas and Indigenous status, 2004-05 (per cent of population)
Table 5A.4.4
Persons with a long-term hearing problem: type of ear/hearing problem, by
remoteness areas and Indigenous status, 2001 (per cent of population)
Table 5A.4.5
Persons with otitis media, by age and Indigenous status, 2004-05 (per cent of
population)
Table 5A.4.6
Age specific separations where the principal diagnosis was diseases of the ear
and mastoid process, Qld, WA, SA, and public hospitals in NT, 2004-05
Table 5A.4.7
Age specific separations where the principal diagnosis was diseases of the ear
and mastoid process, Qld, WA, SA, and public hospitals in NT, 2003-04
Table 5A.4.8
Age specific separations where the principal diagnosis was diseases of the ear
and mastoid process, Qld, WA, SA and public hospitals in NT, 2002-03
Table 5A.4.9
Age specific separations where the principal diagnosis was diseases of the ear
and mastoid process, Qld, WA, SA and public hospitals in NT, 2001-02
5.5 Children with tooth decay
Table 5A.5.1
Table 5A.5.2
Table 5A.5.3
Table 5A.5.4
Table 5A.5.5
Table 5A.5.6
Table 5A.5.7
Table 5A.5.8
Decayed and decay-free infant teeth in 4- to 10-year-old children enrolled in
school dental services in NSW, SA and the NT, by Indigenous status and
location
Decayed and decay-free permanent teeth in 6- to 14-year-old children enrolled
in school dental services in NSW, SA and the NT, by Indigenous status and
location
Mean number of teeth with decay for children enrolled in the NT School Dental
Service, by age and Indigenous status, 2002-03
Mean tooth decay (dmft) for 4- to 10-year-old children enrolled in the NT School
Dental Service, by SEIFA index of relative socio-economic disadvantage, age
and Indigenous status, 2002-03
Mean tooth decay (DMFT) for 6- to 13-year-old children enrolled in the NT
School Dental Service, by SEIFA index of relative socio-economic
disadvantage, age and Indigenous status, 2002-03
SA, infant and permanent tooth decay, mean dmft and DMFT by Indigenous
status and age, 2002 Child Dental Health Survey
SA, proportion of children with calculus and gingival bleeding by Indigenous
status and age, children attending school dental service, 2002 Child Dental
Health Survey
Dental hospitalisations for children aged 2 to 14 years, per 100 000 children, by
sociodemographic characteristics and Indigenous status, 2002-03
Table 5A.5.9
Hospital dental procedure rates for children aged 2 to 14 years, per 100 000
children, by sex and Indigenous status, 2002-03
Table 5A.5.10
Hospital dental procedure rates for children aged 2 to 14 years, per 100 000
children, by age group and Indigenous status, 2002-03
Table 5A.5.11
Hospital dental procedure rates for children aged 2 to 14 years, per 100 000
children, by remoteness area and Indigenous status, 2002-03
5.50
OVERCOMING
INDIGENOUS
DISADVANTAGE 2007
5.8
References
5 Early child development and growth (prenatal to age 3)
AHMAC (Australian Health Ministers’ Advisory Council) 2006, Aboriginal and
Torres Strait Islander Health Performance Framework Report 2006, AHMAC,
Canberra.
Barker, D.J.P. 1995, ‘Fetal origins of coronary heart disease’, British Medical
Journal,
July
1995,
311:171–174,
http://bmj.bmjjournals.
com/cgi/content/full/311/6998/171?maxtoshow=&HITS=10&hits=10&RESULT
FORMAT=1&author1=Barker&title=Fetal+origins+of+coronary+heart+disease
&searchid=1066711293030_23493&stored_search=&FIRSTINDEX=0&sortspe
c=relevance&resourcetype=1,2,3,4,10 (accessed 20 August 2003).
—— Forsen, T., Uutela, A., Osmond, C. and Eriksson, J.G. 2001, ‘Size at birth and
resilience to effects of poor living conditions in adult life: longitudinal study’,
British
Medical
Journal,
December
2001,
323:1273,
http://bmj.bmjjournals.com/cgi/content/full/323/7324/1273?maxtoshow=&HITS
=10&hits=10&RESULTFORMAT=1&author1=barker&title=size+at+birth+and
+resilience&searchid=1066711789231_23529&stored_search=&FIRSTINDEX
=0&sortspec=relevance&resourcetype=1,2,3,4,10 (accessed 20 August 2003).
Bowd, A. 2002, Otitis Media: Its Health, Social and Educational Consequences
Particularly for Canadian Inuit, Metis and First Nations Children and
Adolescents, Centre of Excellence for Children and Adolescents with Special
Needs, Lakehead University, Thunder Bay, Ontario.
Couzos, S., Metcalf, S. and Murray, R. 1999, Aboriginal Primary Health Care: An
Evidence - Based Approach, Oxford University Press, Melbourne.
Couzos, S. Metcalf, S. and Murray, R.B. 2001, Systematic Review of Existing
Evidence and Primary Care Guidelines on the Management of Otitis Media in
Aboriginal and Torres Strait Islander Populations, National Aboriginal
Community Controlled Health Organisation (NACCHO) for the Office of
Aboriginal and Torres Strait Islander Health, Commonwealth Department of
Health and Ageing, Canberra.
DHAC (Commonwealth Department of Health and Aged Care) 1999, The National
Environmental Health Strategy, Canberra.
Fall, C., Vijayakumar, M., Barker, D., Osmond, C. and Duggelby, S. 1995 ‘Weight
in infancy and prevalence of coronary heart disease in adult life’, British
Medical Journal, no. 310, pp.17–19.
EARLY CHILD
DEVELOPMENT AND
GROWTH
5.51
Keating, D.P. and Hertzman, C. (eds) 1999, Developmental Health and the Wealth
of Nations: Social, Biological and Educational Dynamics, Guilford Press,
New York.
Mackerras, D. 1998, Evaluation of the Strong Women, Strong Babies, Strong
Culture Program: Results for the Period 1990-1996 in the Three Pilot
Communities, Menzies Occasional Papers, Issue No 2/98, Menzies School of
Health Research, Darwin.
McCain, M.N. and Mustard, J.F. 1999, Reversing the Real Brain Drain, Early Years
Study, Final Report, Ontario Children’s Secretariat, Toronto.
NACCHO (National Aboriginal Community Controlled Health Organisation) 2003,
NACCHO Ear Trial and School Attendance Project, final report to the
Department of Education Science and Training, NACCHO, Canberra.
NTDE (Northern Territory Department of Education) 1999, Learning Lessons, An
Independent Review of Indigenous Education in the Northern Territory, Darwin.
Sayers, D., and Powers, J. 1997, ‘Risk factors for Aboriginal low birthweight,
intrauterine growth retardation and preterm birth in the Darwin Health Region’,
Australian and New Zealand Journal of Public Health, 21(5):524-530.
Smith, A., McKenzie, I. and Hatcher, J. 1995, ‘Treatment of chronic suppurative
otitis media’ in Douglas, R., Berman, S., Black, R.E., Bridges-Webb, C.,
Campbell, H., Glezen, P., Goodman, S., Lozano, J., Margolis, P., Shimouchi, A.,
Steinhoff, M., Wang, E. and Zhu, Z. (eds), Acute Respiratory Infections Module
of the Cochrane Database of Systematic Reviews, [updated 24 February 1995],
BMJ Publishing Group, London.
Zubrick, S.R., Lawrence, D.M., Silburn, S.R., Blair, E., Milroy, H., Wilkes, T.,
Eades, S., D’Antoine, H., Read, A., Ishiguchi, P., Doyle, S. 2004, The Western
Australian Aboriginal Child Health Survey: the Health of Aboriginal Children
and Young People, Telethon Institute for Child Health Research, Perth.
5.1 Injury and preventable diseases
ABS (Australian Bureau of Statistics) 1997, Australian Social Trends 1997 Health Mortality & Morbidity: Infectious diseases, http://www.abs.gov.au/Ausstats/
[email protected]/0/61bbd6935d9ef749ca2569bb00164f67?OpenDocument
(accessed
20 August 2003).
——2007, Causes of Death, Australia 2005, Cat. no. 3303.0, Canberra.
ABS and AIHW (Australian Institute of Health and Welfare) 2003, The Health and
Welfare of Australia’s Aboriginal and Torres Strait Islander Peoples, 2003,
ABS Cat. no. 4704.0, AIHW Cat. no. IHW11, Canberra.
5.52
OVERCOMING
INDIGENOUS
DISADVANTAGE 2007
Central Public Health Unit Network Sunshine Coast 2005, Jabba Jabba
Immunisation Program Final Evaluation, Queensland Health, Queensland.
Currie, B.J. and Carapetis, J.R. 2000, ‘Skin infection and infestations in Aboriginal
communities in northern Australia’, Australian Journal of Dermatology vol. 41,
pp. 139–145, quoted in Zubrick et al. (2004).
Central Public Health Unit Network Sunshine Coast 2005, Jabba Jabba
Immunisation Program Final Evaluation May 2005, Queensland Health,
Maroochydore, Queensland.
On-line Medical Dictionary, http://cancerweb.ncl.ac.uk/omd/ (accessed 26 June
2005).
Zubrick, S.R., Lawrence, D.M., Silburn, S.R., Blair, E., Milroy, H., Wilkes, T.,
Eades, S., D’Antoine, H., Read, A., Ishiguchi, P., Doyle, S. 2004, The Western
Australian Aboriginal Child Health Survey: the Health of Aboriginal Children
and Young People, Telethon Institute for Child Health Research, Perth.
5.2 Infant mortality
ABS (Australian Bureau of Statistics) 2004, Deaths, Australia 2003, Cat. no.
3302.0, Canberra.
—— 2006, Deaths, Australia 2005, Cat. no. 3302.0, Canberra.
—— 1996, Occasional Paper: Mortality and Indigenous Australians, Cat. no.
3315.0, Canberra.
AHMAC (Australian Health Ministers’ Advisory Council) 2006, Aboriginal and
Torres Strait Islander Health Performance Framework Report 2006, Canberra.
Atkinson, R. 2001, ‘Antenatal care and perinatal health – how to do it better in an
urban Indigenous community. Proceedings of the 6th National Rural Health
Conference, Canberra, 2001.
Panaretto, K.S., Lee, H.M., Mitchell. M.R., Larkins, S.L., Manessis, V., Buettner,
P.G., Watson., D. 2005, ‘Impact of a collaborative shared antenatal care program
for urban Indigenous women: a prospective cohort study’, Medical Journal of
Australia, vol. 182, pp. 514–519.
TAIHS (Townsville Aboriginal and Islander Health Service) 2005, Mums and
Babies Project: Project Report, Townsville, Queensland.
EARLY CHILD
DEVELOPMENT AND
GROWTH
5.53
5.3 Birthweight
ABS (Australian Bureau of Statistics) and AIHW (Australian Institute of Health and
Welfare) 2003, The Health and Welfare of Australia’s Aboriginal and Torres
Strait Islander Peoples, Cat. no. 4704.0, Canberra.
—— 2005, The Health and Welfare of Australia’s Aboriginal and Torres Strait
Islander Peoples, Cat. no. 4704.0, Canberra.
Ah Chee, D., Alley, S. and Milera, S. 2001, ‘Congress Alukura — women’s
business’, Proceedings of the 4th Australian Women’s Health Conference,
Adelaide, 19–21 February, pp. 167–174.
AIHW 2003, Australia’s Mothers and Babies 2000, Cat. no. PER 21, National
Perinatal Statistics Unit Sydney, http://www.npsu.unsw.edu.au/ps12.pdf
(accessed 11 August 2003).
Aspery, W., Jarrett, J. and Donovan, I., 1998, ‘Durri Aboriginal Corporation
Medical Service — Djuligalban Program’, pp. 75–77 in: Groos, A., Engeler, T.,
Miller, M. and McDonald, M.A, Stories & Ideas from around Australia. Giving
Aboriginal and Torres Strait Islander Babies the Best Start in Life: Supporting
Breastfeeding and Good Food Choices for Infants, Department of Social and
Preventative Medicine, Northern Clinical School, University of Queensland, the
Tropical Public Health Unit; and Apunipima, Cape York Health Council, Cairns.
Bootle, L. and Toomey, R. 2006, ‘Marrang, “Good and Friend” — an Aboriginal
child and family health model’, presentation from the Greater Western Area
Health Service at the NSW Health Expo, 19–20th October,
http://www.archi.net.au/e-ibrary/health_administration/awards06/access/marrang
(accessed 29 March 2007).
Carter, E., Lumley, J., Wilson, G., Bell, S. 2004, ‘Alukura … for my daughters and
their daughters and their daughters. A review of Congress Alukura’, Australian
and New Zealand Journal of Public Health; vol. 28, pp. 229–34.
Dorman, R. 1997, ‘Ngua Gundi (Mother and Child) Program’, Aboriginal and
Islander Health Worker Journal vol. 21, pp. 2–6.
Dwyer, G. 2005, ‘Koori Maternity Services’, presentation to the Rural Health
Conference,
18–19
May,
Beechworth,
Victoria,
http://www.vha.org.au/content/Presentations/2005/Rural%20Health_2005/A1_G
il%20Dwyer.pdf (accessed 29 March 2007).
Fall, C., Vijayakumar, M., Barker, D., Osmond, C. and Duggelby, S. 1995 ‘Weight
in infancy and prevalence of coronary heart disease in adult life’, British
Medical Journal, no. 310, pp.17–19.
5.54
OVERCOMING
INDIGENOUS
DISADVANTAGE 2007
Mackerras D 1998, Evaluation of the Strong Women, Strong Babies, Strong Culture
Program: Results for the Period 1990-1996 in the Three Pilot Communities,
Menzies Occasional Papers, Issue No 2/98, Menzies School of Health Research,
Darwin.
OATSIH (Office for Aboriginal and Torres Strait Islander Health) 2001, Better
Health Care. Canberra.
Perkins, S. 1998, The Ngua Gundi (Mother/Child) Project 1993–1996, Queensland
Health, Rockhampton.
Pholeros, P., Rainow, S. and Torzillo, P. 1993, Housing for Health. Towards a
Healthy Living Environment for Aboriginal Australia, HealthHabitat, Newport
Beach.
Plunkett, A., Lancaster, P. and Huang, J. 1996, Indigenous Mothers and their
Babies Australia 1991–1993, AIHW National Perinatal Statistics Unit: Perinatal
Statistics Series No. 4, Sydney.
Rousham, E. and Gracey, M. 2002 ‘Factors affecting birthweight of rural Australian
Aborigines’, Annals of Human Biology, vol. 29, no. 4, pp. 363–372.
Sayers, D. and Powers, J. 1997, ‘Risk factors for Aboriginal low birthweight,
intrauterine growth retardation and preterm birth in the Darwin Health Region’,
Australian and New Zealand Journal of Public Health, 21(5):524–530.
Singh, G. and Hoy, W. 2003, ‘The association between birthweight and current
blood pressure: a cross-sectional study in an Australian Aboriginal community’,
Medical Journal of Australia, vol. 179, pp. 532–535, November.
Sloman, D., Shelley, J., Watson, L. and Lumley, J. 1999, ‘Obstetric and Child
Health Outcomes on the Anangu Pitjantjatjara Lands, 1984-1996: A preliminary
analysis’, proceedings of the Canberra: National Rural Health Alliance 5th
National Rural Health Conference, 14-17 March, Adelaide.
5.4 Hearing impediments
ABS (Australian Bureau of Statistics) 2006, National Aboriginal and Torres Strait
Islander Health Survey, 2004-05, Cat. no. 4715.0, Canberra.
AHMAC (Australian Health Ministers’ Advisory Council) 2006, Aboriginal and
Torres Strait Islander Health Performance Framework Report 2006, Canberra.
AIHW (Australian Institute of Health and Welfare) 2005, Improving the Quality of
Indigenous Identification in Hospital Separations Data, Cat. no. HSE 101,
Canberra.
EARLY CHILD
DEVELOPMENT AND
GROWTH
5.55
Bailie, R.S., Stevens, M.R., McDonald, E., Halpin, S., Brewster, D., Robinson, G.
and Guthridge, S. 2005, ‘Skin infection, housing and social circumstances in
children living in remote Indigenous communities: testing conceptual and
methodological approaches’, BMC Public Health, vol. 8, no. 5, p. 128.
Boswell, J. and Nienhuys, T.1996, ‘Patterns of persistent otitis media in the first
year of life in Aboriginal and non-Aboriginal infants’, The Annals of Otology,
Rhinology and Laryngology, vol. 105, no. 11, pp. 898–900.
Brouwer, C.N., Rovers, M.M., Maille, A.R., Veenhoven, R.H., Grobbee, D.E.,
Sanders, E.A. and Schilder, A.G. 2005, ‘The impact of recurrent acute otitis
media on the quality of life of children and their caregivers’, Clinical
Otolaryngology, vol. 30, no. 3, pp. 258–65.
Burrow, S. and Thomson, N. 2003, ‘Ear Disease and Hearing Loss’, in Thomson, N.
(eds), The Health of Indigenous Australians, Oxford University Press, South
Melbourne, pp. 247–272.
Burrow, S. and Thomson, N. 2006, ‘Summary of Indigenous health: ear disease and
hearing loss’, Aboriginal and Islander Health Worker Journal, vol. 30, no. 1,
pp. 10–11.
Close, G.R., Murphy, E.P. and Goodwin, A. 1996, ‘Guidelines on the prevention
and control of otitis media and its sequelae in Aboriginal children’, Medical
Journal of Australia, vol. 164 (Supplement), pp. S1–S17.
Coates, H.L., Morris, P.S., Leach, A.J. and Couzos, S. 2002, ‘Otitis media in
Aboriginal children: tackling a major health problem’, The Medical Journal of
Australia, vol. 177, no. 4, pp. 177–178.
Couzos, S., Metcalf, S. and Murray, R.B. 1999, ‘Ear health’, in Couzos, S. and
Murray, R. (eds), Aboriginal Primary Health Care: An Evidence-based
Approach, Oxford University Press, South Melbourne, pp. 240–320.
Couzos, S. Metcalf, S. and Murray, R.B. 2001, Systematic Review of Existing
Evidence and Primary Care Guidelines on the Management of Otitis Media in
Aboriginal and Torres Strait Islander Populations, National Aboriginal
Community Controlled Health Organisation (NACCHO) for the Office of
Aboriginal and Torres Strait Islander Health, Commonwealth Department of
Health and Ageing, Canberra.
Howard, D. and Hampton, D. 2006, ‘Ear disease and Aboriginal families’,
Aboriginal and Islander Health Worker Journal, vol. 30, no. 3, pp. 9–11.
Jones, R. and Smith, F. 2006, ‘Are there health benefits from improving basic
nutrition in a remote Aboriginal community?’, Australian Family Physician,
vol. 35, no. 6, pp. 453–4.
5.56
OVERCOMING
INDIGENOUS
DISADVANTAGE 2007
Leach, A.J., Boswell, J.B., Asche, V., Nienhuys, T.G. and Mathews, J.D. 1994,
‘Bacterial colonisation of the nasopharynx predicts very early onset and
persistence of otitis media in Australian Aboriginal infants’, The Pediatric
Infectious Disease Journal. vol.13, pp. 983–989.
Lehmann, L., Tennant, M., Silva, D., McAullay, D., Lannigan, F., Coates, H. and
Stanley, F. 2003, ‘Benefits of swimming pools in two remote Aboriginal
communities in Western Australia: intervention study’, British Medical Journal;
327(7412):415-419.
Lowell, A. 1991, ‘Effects of Otitis media on the development of communications
skills in Aboriginal Children’, paper presented at the Education for All
Conference, Darwin, September (cited in Nienhuys (1992)).
Menzies School of Health Research 2001, Recommendations for Clinical Care
Guidelines on the Management of Otitis Media in Aboriginal and Torres Strait
Islander populations, Commonwealth Department of Health and Aged Care,
Canberra.
Morris, P.S., Leach A.J., Silberberg P., Mellon G., Wilson C., Hamilton E. and
Beissbarth J. 2005, ‘Otitis media in young Aboriginal children from remote
communities in Northern and Central Australia: a cross-sectional survey’, BMC
Pediatrics, vol. 20, no. 5, pp. 27–36.
Morris, P.S., Leach, A.J., Halpin, S., Mellon, G., Gadil, G., Wigger, C.,
Mackenzie, G., Wilson, C., Gadil, E. and Torzillo, P. 2006, ‘An overview of
acute otitis media in Australian Aboriginal children living in remote
communities’, Vaccine, September 22.
Nienhuys, T.G. 1992, ‘The significance of prelingual conductive hearing loss for
auditory and linguistic development of Aboriginal infants’, Conference
Proceedings Medical Options for Prevention and Treatment of Otitis Media in
Australian Aboriginal Infants, Menzies School of Health Research and the
Australian
Doctors
Fund
Darwin,
16–18
February,
http://www.adf.com.au/archive.php?doc_id=137 (accessed 9 June 2005).
New South Wales Department of Health (NSW DoH) 2002, Report of the New
South Wales Chief Health Officer Aboriginal and Torres Strait Islander Peoples
Otitis
Media
and
Myringotomy
by
Indigenous
Status,
http://www.health.nsw.gov.au/public-health/chorep/atsi/atsi_om.pdf (accessed
21 July 2003).
TICHR (Telethon Institute for Child Health Research) 2006, The Swimming Pool
Study, 2000–2006, Western Australian Department of Housing and Works and
Western Australian Department of Health, Perth.
EARLY CHILD
DEVELOPMENT AND
GROWTH
5.57
Thorne, J.A. 2004, ‘Middle ear problems in Aboriginal school children cause
developmental and educational concerns’, Contemporary Nurse, vol. 16,
no. 1–2, pp. 145–150.
WHO (World Health Organisation) 2006, Deafness and Hearing Impairment,
http://www.who.int/mediacentre/factsheets/fs300/en/index.html (accessed 20
November 2006)
Zubrick, S.R., Lawrence, D.M., Silburn, S.R., Blair, E., Milroy, H., Wilkes, T.,
Eades, S., D’Antoine, H., Read, A., Ishiguchi, P., Doyle, S. 2004, The Western
Australian Aboriginal Child Health Survey: the Health of Aboriginal Children
and Young People, Telethon Institute for Child Health Research, Perth.
5.5 Children with tooth decay
AIHW (Australian Institute of Health and Welfare) 1996, ‘Australia’s Health’,
quoted in Al-Yaman, F., Bryant, M. and Sargeant, H. 2002, Australia’s
Children: their Health and Wellbeing 2002, Cat. no. PHE 36, AIHW, Canberra,
p. 225.
—— 1998, ‘International Health, How Australia Compares’ quoted in Al-Yaman,
F., Bryant, M. and Sargeant, H. 2002, Australia’s Children: their Health and
Wellbeing 2002, Cat. no. PHE 36, AIHW, Canberra, p. 225.
—— 2000, Oral Health and Access to Dental Services among Indigenous
Australians, Cat. no. DEN 64, University of Adelaide, Adelaide.
Al-Yaman, F., Bryant, M. and Sargeant, H. 2002, Australia’s Children: their Health
and Wellbeing 2002, Cat. no. PHE 36, AIHW, Canberra.
Armfield, J.M. and Roberts-Thomson, K.F. 2004, Child Dental Health Survey,
Northern Territory 2001, AIHW and the University of Adelaide, Adelaide.
AHMAC (Australian Health Ministers’ Advisory Council) 2006, Aboriginal and
Torres Strait Islander Health Performance Framework, Department of Health
and Ageing, Canberra.
Davies, M.J., Spencer, A.J., Westwater, A., and Simmons, B. 1997, ‘Dental caries
among Australian Aboriginal, non-Aboriginal Australian born, and overseasborn children’, Bulletin of the World Health Organisation, 75 (3), pp. 197–203.
Ellershaw, A., Spencer, A.J., Slade, G.D. 2005, Oral Health in South Australia
2004, Australian Research Centre for Population Oral Health, University of
Adelaide.
Endean, C., Roberts-Thomson, K., and Wooley, S. 2004, ‘Anangu oral health: the
status of the Indigenous population of the Anangu Pitjantjatjara lands’,
Australian Journal of Rural Health, 12, pp. 99–103.
5.58
OVERCOMING
INDIGENOUS
DISADVANTAGE 2007
Harford, J., Spencer, J., Roberts-Thomson, K. 2003, ‘Oral health’, in Thomson, N.,
(ed.), The Health of Indigenous Australians, Oxford University Press, South
Melbourne, pp. 247–272.
Jamieson, L., Roberts-Thomson, K.F., 2006, ‘Indigenous children and receipt of
hospital dental care in Australia’, International Journal of Paediatric Dentistry,
16, pp. 327–34.
Jamieson, L., Armfield, J.A., Roberts-Thomson, K.F., 2006a, ‘The role of location
in Indigenous and non-Indigenous child oral health’, Journal of Public Health
Dentistry, 66, pp. 123–30.
Jamieson, L., Armfield, J.A., Roberts-Thomson, K.F., 2006b, ‘Oral health
inequalities among Indigenous and non-Indigenous children in the Northern
Territory of Australia’, Community Dentistry and Oral Epidemiology, 34, pp.
267–76.
National Advisory Committee on Oral Health 2004, Healthy Mouths Healthy Lives:
Australia’s National Oral Health Plan 2004-2013, for South Australia
Department of Health.
University of NSW 2006, Filling the Gap, http://www.fillingthegap.com.au
(accessed 27 February 2007).
EARLY CHILD
DEVELOPMENT AND
GROWTH
5.59
5.60
OVERCOMING
INDIGENOUS
DISADVANTAGE 2007


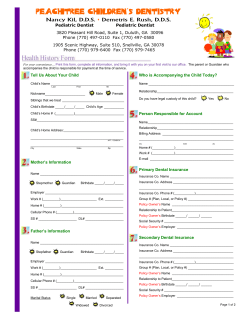
© Copyright 2026