
A genome-wide association study of global gene expression
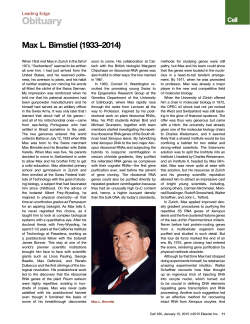
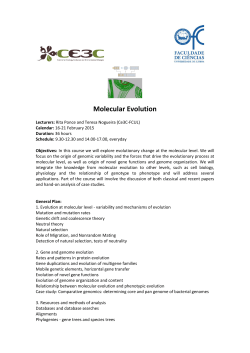
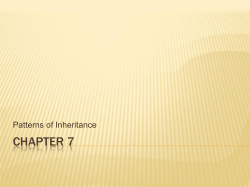
© 2007 Nature Publishing Group http://www.nature.com/naturegenetics
ARTICLES
A genome-wide association study of global
gene expression
Anna L Dixon1,2,6, Liming Liang3,6, Miriam F Moffatt1,6, Wei Chen3, Simon Heath4, Kenny C C Wong1,
Jenny Taylor2, Edward Burnett5, Ivo Gut4, Martin Farrall2, G Mark Lathrop4, Gonc¸alo R Abecasis3 &
William O C Cookson1
We have created a global map of the effects of polymorphism on gene expression in 400 children from families recruited through
a proband with asthma. We genotyped 408,273 SNPs and identified expression quantitative trait loci from measurements of
54,675 transcripts representing 20,599 genes in Epstein-Barr virus–transformed lymphoblastoid cell lines. We found that 15,084
transcripts (28%) representing 6,660 genes had narrow-sense heritabilities (H2) 4 0.3. We executed genome-wide association
scans for these traits and found peak lod scores between 3.68 and 59.1. The most highly heritable traits were markedly enriched
in Gene Ontology descriptors for response to unfolded protein (chaperonins and heat shock proteins), regulation of progression
through the cell cycle, RNA processing, DNA repair, immune responses and apoptosis. SNPs that regulate expression of these
genes are candidates in the study of degenerative diseases, malignancy, infection and inflammation. We have created a
downloadable database to facilitate use of our findings in the mapping of complex disease loci.
Variation in gene transcription is important in mediating disease
susceptibility, and global identification of genetic variants that regulate
gene transcription will be helpful in mapping human disease genes.
The many genome-wide association (GWA) studies currently underway are likely to identify multiple genetic variants that are associated
with multifactorial traits. We anticipate that these variants will often
reside outside of coding regions and will have no known or evident
functional effects. Gene transcript abundance is directly modified by
polymorphism in regulatory elements and consequently may be
mapped with considerable power1,2. As a consequence, our objective
was to build a database that would allow researchers to systematically
examine potential effects of disease-associated variants on transcript
expression. By studying global gene expression in a comprehensive
GWA study, we also hoped to add global understanding to issues of
heritability, marker coverage, interactions and dominance that are of
relevance to all GWA studies of complex traits.
We recruited a panel of 206 families of British descent (MRC-A)
through a proband with childhood asthma, as described previously3,4.
We included siblings regardless of asthma status5. The panel contained
297 sib pairs and 11 half-sib pairs. Lymphoblastoid cell lines (LCLs)
were derived from peripheral blood lymphocytes on probands and
siblings. Cells were harvested at log phase from roller cell cultures in
the first growth after transformation. Global gene expression was
measured with the Affymetrix HG-U133 Plus 2.0 chip. All analyses of
transcript abundance used quantile normalization, after performing
robust multi-array averaging (RMA)6,7, to enforce normality and deal
with outliers.
RESULTS
Global gene expression
We initially considered all transcripts detected by probes on the array
as independent phenotypes. As many genes are represented by more
than one transcript probe, we ran parallel analyses on the mean
transcript level for all probes in each gene. In general, the results were
similar whether we considered transcripts or genes. We report the
results for transcripts, except when biological interpretation is helped
by considering genes.
The H2 for all the expression levels after RMA and quantile
normalization ranged between 0.0 and 1.0, with a mean of 0.203 and
a third quartile (Q3) of 0.317 (Fig. 1a). We considered highly heritable
expression levels to be the best evidence that a trait was genetically
regulated, and we applied an arbitrary H2 threshold of 0.3 to filter
transcripts for downstream analyses. We did not apply a threshold filter
for transcript abundance because we felt that genetic regulation of
transcripts with low abundance might still occur and could be
biologically relevant. Nevertheless, we note that the correlation between
mean expression and heritability was substantial (r ¼ 0.45).
Human LCLs provide general information about gene expression,
even for genes whose primary function is not in these cells1,8–10.
Although the LCLs used in our analyses were derived from children
1National Heart and Lung Institute, Imperial College London, London SW3 6LY, UK. 2Wellcome Trust Centre for Human Genetics, University of Oxford, Oxford OX3
7BN, UK. 3Center for Statistical Genetics, Department of Biostatistics, School of public Health, Ann Arbor, Michigan 48109-2029, USA. 4Centre National de
¢´ nergie Atomique, 91057 Evry, France. 5European Collection of Cell Cultures (ECACC), Porton Down, SP4 0JG, UK.
Ge´notypage, Institut Ge´nomique, Commissariat a` l E
6These authors contributed equally to this work. Correspondence should be addressed to W.O.C.C. ([email protected]).
Received 31 May 2006; accepted 2 July 2007; published online 16 September 2007; doi:10.1038/ng2109
NATURE GENETICS ADVANCE ONLINE PUBLICATION
1
ARTICLES
61
45
Simulation
Real data
15
20
Percentage
Percentage
20
10
Simulation
Real data
15
10
Mean = 0.20, s.d. = 0.17
5
Mean = 0.23, s.d. = 0.17
5
>0.3
>0.3
0
0
0.0
0.2
0.4
0.6
0.8
1.0
0.0
0.2
0.4
0.6
0.8
1.0
Total heritability by gene
b7
Maximum 59.13
Q3
5.34
Median
4.85
Q1
4.53
Minimum 3.68
s.d.
3.85
Mean
5.8
6
5
Percentage
4
3
2
1
0
3.
3
3.
7
4
4.
3
4.
8
5.
3
5.
8
6.
4
7
7.
5
8.
3
9
9.
8
11
12
.4
14
15
.8
18
.2
20
.9
24
27
.1
31
.2
35
.9
41
.3
47
.5
54
.6
62
.8
© 2007 Nature Publishing Group http://www.nature.com/naturegenetics
Total heritability by probe
lod (log scale)
both with and without asthma, only 10 of 54,675 transcripts
(B0.018%) differed significantly (P o 0.0001) between asthmatics
and non-asthmatics, and we did not find any significant differences
after adjusting for the number of comparisons (Supplementary Fig. 1
online). This result is not unexpected, as we measured expression in
cultured, unchallenged cell lines; many of the changes in transcript
abundances previously observed in asthma cells and tissues are the
result of challenge with environmental and pro-inflammatory stimuli.
Consequently, we expect our experiment to inform the genetics of
gene expression not only for studies of asthma but also more generally.
Genome-wide association
We genotyped 830 offspring and parents successfully with the Illumina
Sentrix Human-1 Genotyping BeadChip (concentrated on genes and
surrounding sequences, producing 89,653,540 genotypes for 109,157
SNPs with a 36.0% average heterozygosity and a 99.0% average call
rate). We genotyped 378 offspring for 317,149 SNPs using the Illumina
Sentrix HumanHap300 BeadChip (derived from HapMap phase I). Of
these, 18,033 overlap with Illumina Human-1 BeadChip, so that
overall the Sentrix chip resulted in an additional 112,464,123 genotypes for 299,116 SNPs with 34.5% average heterozygosity (99.5% call
rate). We found only 0.321 mendelian errors per SNP among the
109,157 markers typed on all family members using the Sentrix chip.
Genotypes that were not consistent with mendelian inheritance were
excluded from subsequent analyses.
The minimum allele frequency (MAF) was predominantly 4 0.1
(Supplementary Fig. 2 online). Our 408,273 genotyped SNPs included
372,821 common SNPs (MAF 4 0.05) from the HapMap database.
These covered 1,794,828 HapMap SNPs (including the 372,821) at
R2 4 0.8, so that the total coverage of the 2,236,212 HapMap common
2
Figure 1 Summaries of heritability and association analysis for all genes.
(a) Total heritability of expression quantitative traits. The distribution of
measured heritability estimates (light blue bars) may be compared with those
from simulation (gray bars). Results are shown for individual transcripts, and
for mean transcript abundances for individual genes. (b) Distribution of lod
scores for association between 14,819 traits with annotation entries in the
UCSC browser with H 2 4 0.3 and 408,273 SNP markers.
SNPs was 80.3%. We tested for association between our genotyped
SNPs and expression (Supplementary Table 1 online) using the
FASTASSOC component of MERLIN11 and including sex in the
model. We applied the method of genomic control12 to results of
the association analyses and derived a coefficient of 1.0099, indicating
negligible population stratification. We found that the 14,819 traits
with annotation entries in the University of California Santa Cruz
(UCSC) browser and H2 4 0.3 had a minimum peak lod score for
association of 3.683, and a maximum of 59.128 (median 4.853, Q3
5.339) (Fig. 1b). We estimated the threshold for genome-wide significance to be a lod score 46.076 (equivalent to P ¼ 0.05). We found
that the false discovery rate (FDR) was 0.152 for a lod score of 5.5,
0.056 for a lod of 6, 0.0067 for a lod of 7.0 and 0.0008 for a lod of 8.
The mean H2 explicable by association with the SNP showing the
strongest association to each trait was 0.077 (s.d. 0.049, maximum
0.707) compared with 0.429 for the overall H2 (s.d. 0.103, maximum
1.0), indicating that, on average, the peak SNP can explain 18.2% of
the H2 in these traits. For the 1,989 transcripts where the peak lod was
46, the mean H2 explicable by association with the SNP showing the
strongest association was 0.157, and the average overall H2 was 0.479,
indicating that 32.9% of the H2 in these traits can be explained by the
peak SNP. The proportion of peak SNPs exceeding the lod significance
threshold of 6 rose with the H2 of the underlying trait, so that 81% of
traits with H2 4 0.8 were associated with at least one SNPs with lod
4 6 (Fig. 2 and Supplementary Fig. 3 online). This may suggest that
increases in sample size or selection for trait distribution may have a
greater impact on GWA studies compared with the effects of an
increase in marker density.
We carried out a sequential search to test for transcripts independently associated with multiple SNPs. This identified 88 genes that
were separately associated with three or more SNPs, which typically
mapped to a combination of cis and trans locations (Supplementary
Table 2 online).
1.0
Proportion of significant probes (max. lod >6)
a
0.81
0.8
0.6
0.47
0.4
0.25
0.18
0.2
0.1
0.12
0.05
0.0
≤ 0.3
0.3 – 0.4 0.4– 0.5 0.5– 0.6
0.6 – 0.7 0.7– 0.8
>0.8
Overall heritability
Figure 2 Proportion of significantly associated SNPs and expression trait
heritability. All analyses were adjusted for sex. The proportion of significantly
associated SNPs rises with the measured heritability of individual traits.
ADVANCE ONLINE PUBLICATION NATURE GENETICS
ARTICLES
Table 1 Gene Ontology of exceptionally heritable (positive Z score)
and non-heritable (negative Z score) traits
Overlap histograms of LOD in cis and trans groups
0.5
© 2007 Nature Publishing Group http://www.nature.com/naturegenetics
Density (truncated at 0.5)
0.4
Trans
0.3
0.2
Cis > 100 kb
0.1
Cis < 100 kb
0.0
10
20
30
40
50
60
LOD
Figure 3 Associations in cis and trans. The density scale on the y axis is
truncated at 0.5. Signals in cis within 100 kb of the transcription unit are
shown in red; signals in cis distant (4100 kb) from the transcription unit
are shown in green; signals in trans are shown in blue. The overlap of the
cis loci 4100 kb from the start with the other distributions is shown
orange and gray.
Previous studies have shown the power of expression quantitative
trait locus (eQTL) mapping, but they have examined limited numbers
of transcripts or markers in a small number of CEPH pedigrees1,2,9. In
order to investigate the impact of sample size, we repeated our
analyses using only the first 50 sibships in our sample. We identified
only 503 associations (for 106 transcripts) in this subset that exceed
our lod threshold of 6 for genome-wide significance. Using 100
sibships, we found 4,923 such associations (for 736 transcripts), and
in our full data set of 206 sibships, we found a total of 16,098 such
associations (for 1,989 transcripts). These results clearly suggest that
further increases in sample size will enable even more regulators of
gene expression to be mapped with statistical confidence.
Dominance and interaction
We explored the heritability that was not explained by our initial
association analyses by testing for dominance and interaction effects
on association among the 13,095 transcripts with H2 4 0.3 that
could not be mapped (maximum lod o 6) under the additive
model. We identified 699 transcripts under a dominant model
with P o 6.12 108 (Bonferroni correction for 2 408,273 tests).
However, this was fewer than the 1,097 transcripts that we observed in
simulated null genotype data, suggesting that in these subjects,
dominance had a minimal effect on gene transcription.
We conducted further tests for interactions among the top 100
SNPs for each of the 13,095 transcripts with high heritability but no
significant genome-wide SNP associations. We found that 600 had
a P o 6 108 for the interaction term (Bonferroni correction for
2 408,273 + 10,000 tests), compared to 219 in a permuted genomewide association scan data set. Although many of the interactions
were between SNPs in the same chromosome (and could simply point
to a haplotype effect), we observed an excess of interacting SNPs even
after removing these. Thus, our data suggest that genetic interactions
may have an important influence on regulation of expression for
individual genes.
NATURE GENETICS ADVANCE ONLINE PUBLICATION
H2
Z for H 2
6,986
74
0.38
0.26
9.03
8.2
RNA processing
DNA repair
6,396
6,281
0.3
0.29
7.85
7.81
Protein folding
Immune response
6,457
6,955
0.3
0.26
7.8
7.62
Regulation of I-kappaB kinase/NF-kappaB cascade
Mitosis
43,123
7,067
0.28
0.3
6.84
5.82
Intracellular signaling cascade
Regulation of transcription
7,242
45,449
0.26
0.29
5.72
5.7
Regulation of viral genome replication
Protein biosynthesis
45,069
6,412
0.39
0.26
5.47
5.45
Vesicle-mediated transport
Cytokinesis
16,192
910
0.27
0.32
5.02
4.94
Protein complex assembly
6,461
0.25
4.67
6,260
48,015
0.27
0.32
4.61
4.59
Humoral immune response
Apoptosis
6,959
6,915
0.3
0.24
4.47
4.42
Phagocytosis; engulfment
Cell adhesion
6,911
7,155
0.1
0.18
–3.06
–3.12
G protein signaling
Calcium-dependent cell-cell adhesion
7,187
16,339
0.14
0.12
–3.14
–3.14
Cell-cell signaling
Cell-cell adhesion
7,267
16,337
0.18
0.15
–3.25
–3.47
Adenylate cyclase activation
Sodium ion transport
7,190
6,814
0.11
0.13
–3.55
–3.63
Phospholipase C activation
Potassium ion transport
7,202
6,813
0.12
0.14
–3.74
–4.43
Glutamate signaling pathway
Synaptic transmission
7,215
7,268
0.08
0.16
–4.52
–5.64
Gene Ontology (GO) biological process
GO ID
Response to unfolded protein
Regulation of progression through cell cycle
DNA replication
Phosphoinositide-mediated signaling
The analysis compared the mean total H 2 of transcripts in an individual GO category
with the mean total H 2 of all 54,675 transcripts.
Cis and trans and master regulators
Trans effects were weaker than those in cis (defined as a SNP
within 100 kb upstream and downstream of a gene), and most
lod scores 49 were in cis. (Fig. 3) This is consistent with
previous studies in humans1,2 and mice13. Despite the relative
weakness of trans effects, we observed numerous distant associations
(for example, the peak of association for 698 transcripts was on the
same chromosome but 4100 kb from the nearest transcribed
gene, and for 10,382 transcripts, the peak of association was on a
different chromosome), and it may be anticipated that larger
samples will define more precisely the extent of trans regulation of
human transcripts.
It has been proposed, on the basis of genetic linkage, that the
human genome contains hotspots of transcriptional regulation with
effects on multiple expression phenotypes2. We found 13 SNPs that
showed association with ten or more heritable expression traits with
lod scores 46 (Supplementary Table 3a online). These represent
potential master regulators. However, when we confined the analysis
to traits with H2 4 0.3 and excluded markers and transcripts within
the extended linkage disequilibrium of the major histocompatibility
complex, only three SNPs (rs1035665, rs10509971 and rs1031808)
were associated with more than five transcripts (Supplementary
Table 3b). These markers were not in known genes, and the mean
3
a
Gene Ontology categories:
Regulation of progression through cell cycle (1)
RNA processing (2)
DNA repair (3)
Cis (± 100 kb of gene)
Cis (same chromosome)
Trans
24
22
20
18
MUTYH(3)
16
GSG2(1)
RBMS2(2)
14
lod
Figure 4 Regulators of genes involved in the cell
cycle or immune response. (a) Mapping of genes
with Gene Ontology biological process descriptors
for cell cycle, DNA repair and RNA processing.
Genome position is shown along the x axis
divided by chromosome, and the lod score for
association is shown on the y axis. Genes
showing significant associations (lod 4 6)
are labeled in red for cis effects (±100 kb
of the gene), in green if on the same
chromosome but 4100 kb away and in
blue if in trans on a different chromosome.
(b) Mapping of genes with Gene Ontology
biological process descriptors for
immune responses.
XPC(3)
12
BIN1(1)
10
9
8
7
6
5
4
3
2
1
0
lod scores for association were only 6.7, 6.6
and 6.5. Thus, from our data, it seems that
master regulators with strong effects on
many genes are not widely prevalent in the
human genome.
HNRPL(2)
ERCC8(3)
RBM6(2)
TDP1(3)
GTF2H2(3)
ABL1(1)
CCT4(1)
1
2
3
4
5
NFYC(1)
RBM14(3)
RNGTT(2)
6
7
8
MYBL2(1)
BLM(3)
IFITM1(1)
9
10
11 12
13 14 15 16 17
19 21 x
Chromosomes
Gene Ontology
b 29
We used Gene Ontology (GO) analyses to
27
identify genes that were significantly enriched
25
among highly heritable traits (Table 1 and
23
Supplementary Table 4 online). The most
21
highly heritable GO biological process was
19
‘‘response to unfolded proteins’’. This group
contained numerous chaperonins and heat
17
CTSS
shock proteins (CRNN; seven DNAJ family
15
members; HERPUD1; 16 HSPA, HSPB, HSPC
13
or HSPD family members; SERPINH1;
IL19
11
CNR2
CD244
TOR1A and TOR1B; HSP90B1 and TXNDC4)
9
(Supplementary Table 5a online). The indi8
AIM2
7
vidual variation in response to unfolded pro6
5
teins may represent an evolutionary response
4
3
to cellular stress, and these genes could be
2
1
candidates in the study of neurodegenerative
0
diseases and aging processes.
1
2
Genes regulating progression through the
cell cycle, RNA processing and DNA repair
were also exceptionally heritable (Supplementary Table 5b online and Fig. 4a). We speculate that expression
of these genes is under very tight genetic control, with little stochastic
noise, so that nearby polymorphisms can more easily influence
expression in a detectable manner. The evolutionary advantage of
individual variation in these genes is unclear. These genes may
be relevant candidates for the investigation of inherited susceptibility
to cancer.
Genes expressed in LCLs have been shown to be enriched in
GO categories of immune response14, and the significant
heritability that we observed for these traits emphasizes the value of
our data for the study of infectious and inflammatory diseases
(Supplementary Table 5c and Fig. 4b). Genetic variation of HLADQ expression has been observed15, but effects that we found on
HLA-DR and HLA-DP, as well as the smaller effects on HLA-A and
HLA-C, have not been reported previously (Fig. 4b). The strength of
these effects suggests that associations of major histocompatibility
complex class I and class II polymorphism with diseases may depend
on the amount of gene transcription as much as the restriction of
response to antigen.
4
RAD51C(3)
TCF19(1)
Gene Ontology category:
Immune response
HLA-DQA1
Cis (± 100 kb of gene)
Cis (same chromosome)
Trans
HLA-DRB1
HLA-DPA1
lod
© 2007 Nature Publishing Group http://www.nature.com/naturegenetics
ARTICLES
TLR1
FYB
HLA-DQB1
HLA-DQA1,HLA-DQA2
DGKD
HLA-C
IFITM2
B2M
3
4
5
6
7
CD59
SEMA4D
8
9
10
IGHA1,IGHG1,IGHG3,MGC27165
IL16
IL2RG
11 12 13 14 15 16 17
19 21 x
Chromosomes
Applications
Our data set has wide application to the study of genetic markers
associated with disease or other biological phenotypes. We have
recently used the genome-wide SNP data to map a new susceptibility
locus for childhood asthma to noncoding SNPs residing within a
206-kb segment on chromosome 17q23 (ref. 3). Our expression
database showed that transcripts from ORMDL3, one of the nineteen
genes within and around this segment, were strongly (P o 1022) and
consistently positively associated with exactly the same SNPs showing
association with childhood asthma. The correlation between the
P values from the test statistics for association with asthma and
ORMDL3 expression for markers across the 206-kb segment was
0.67 (P ¼ 0.004). The disease-associated markers accounted for
29.5% of the variance of expression. After we accounted for the effects
of the disease-associated markers, residual heritability of the ORMDL3
expression was not significant (P ¼ 0.29, compared with P ¼ 0.0009
before adjustment).
These results focus attention on ORMDL3 as a strong candidate
gene in asthma, and they illustrate how the combination of gene
ADVANCE ONLINE PUBLICATION NATURE GENETICS
© 2007 Nature Publishing Group http://www.nature.com/naturegenetics
ARTICLES
expression with genetic data can be much more powerful than
differential gene expression alone in identifying candidate
disease genes.
Our database has also been of use in the identification of a new
susceptibility locus from Crohn’s disease on chromosome 5 (ref. 16). A
GWA study had identified markers with a strong disease association
within a 1.25-Mb gene desert. Examination of our database showed
that these markers are also associated with expression of PTGER4, a
gene that resides on chromosome 5 outside of the 1.25-Mb segment.
This led to the identification of PTGER4 as the primary candidate
gene for this disease susceptibility locus16.
A recent GWA for type II diabetes (non–insulin-dependent diabetes
mellitus (NIDDM)) identified four putative loci modulating disease
risk17: three of these were not associated with significant transcript
variation, but the fourth on chromosome 11 at 44.2 Mb showed
strong association in our database with variation in PHACS
(P o 1033). PHACS could now be considered a potential candidate
for NIDDM.
Finally, we cite the example of intergenic variants between HBS1L
and MYB on chromosome 6q23 that are responsible for a major QTL
influencing fetal hemoglobin expression (a2g2) in adults, a hereditary
character that underlies the remarkable diversity in phenotypic
severity of sickle cell disease and b thalassemia18. The trait-associated
markers are located upstream of HBS1L and MYB, both of which are
plausible biological candidates. Our database showed expression of
HBS1L to be highly heritable and strongly associated with fetal
hemoglobin QTL markers (P o 1016), whereas MYB expression
had lower heritability and no marker association. Thus, HBS1L seems
to be the principal candidate gene for this QTL, as also suggested by
other data18.
DISCUSSION
Our findings show excellent concordance with previous studies
that have identified smaller numbers of eQTLs, despite the use of
different platforms for genotyping and measuring expression. Five of
our fifty most significant eQTLs (RPS26, IRF5, LDLRAP1, CHI3L2
and HSD17B12) had been identified previously by linkage analyses
in CEPH pedigrees2. Our study included nine mRNA traits that
had shown ancestral differences in abundance in a previous study19,
and we identified significant cis associations for eight of these
with peak lod scores within 20 kb of the previously reported
association peak. Another recent study contrasted the impact of
SNP variation and copy number polymorphism on gene expression20.
In our data, we evaluated 13 of the 20 transcripts reported as showing
the strongest associations with cis SNPs in the HapMap CEU panel.
Ten of these thirteen showed similar strong cis-acting signals that
reached genome-wide significance in our data. Two of the remaining
three showed weaker evidence for cis association (peak lod scores
within 100 kb of the transcript were 3.89 for UBA52 and 4.513
for USMG5).
Our results have identified an important part of the natural
variation in the human transcriptome and may be used as a general
tool to investigate whether SNPs associated with any disease alter
transcription of genes in cis or trans. We have created a downloadable
database (the mRNA by SNP Browser) for the interrogation of our
data (see Methods). The tool allows users to browse the results by
transcript or by position as well as search for information on specific
SNPs. Linkage disequilibrium and tag information is provided for
SNPs not in our database but evaluated by the International HapMap
Consortium. We are currently investigating copy number variation
in our data.
NATURE GENETICS ADVANCE ONLINE PUBLICATION
Our results suggest that increases in sample size will provide greater
power to detect SNP association with particular transcript abundances. In addition, it will be of interest to test global gene expression
with other platforms and to investigate the LCLs with denser transcript arrays. eQTL mapping of other cell types is also desirable.
Finally, exposing our LCLs directly to inflammatory and other stimuli
will allow investigation of the effects of polymorphism on a wider
range of transcripts outside of their basal state.
METHODS
Subjects. The recruitment of the subjects was as described previously4. All
subjects or their parents gave written informed consent. Ethical approval was
given by the Multicentre Research Ethics Committees (UK).
Epstein-Barr virus (EBV). The transformation of the peripheral blood
lymphocytes in all children in the panel was carried out by the European
Collection of Cell Cultures. Previously transformed cryopreserved EBV cell
lines were grown as 500-ml roller cultures. Once the log phase was reached, cells
were pelleted, medium was discarded and a mixture of RLT buffer and
b-mercaptoethanol was added. Pellets were vortexed to ensure thorough
resuspension, after which they were frozen at –70 1C and stored at –80 1C.
RNA was extracted in batches using the RNeasy Maxi Kit, and quality and
quantity of RNA were assessed.
Microarray hybridization. We used 10 mg of RNA to synthesize doublestranded cDNA using the One-Cycle cDNA Synthesis Kit (Affymetrix). Using
the cDNA as a template, in vitro transcription (IVT) of cRNA was carried out
using the IVT Labeling Kit (Affymetrix), following the manufacturer’s protocol.
A hybridization cocktail was made according to the Affymetrix protocol using
15 mg of labeled, fragmented cRNA and was then hybridized to U133 Plus 2.0
GeneChips (Affymetrix) for 16 h at 45 1C in a rotating oven. GeneChips were
washed and stained following the protocol and were then scanned on a highresolution scanner (Affymetrix).
Genotyping. Whole-genome genotyping was carried out according to manufacturers’ instructions using the Sentrix Human-1 Genotyping BeadChip21 and
the HumanHap300 Genotyping BeadChip22 (Illumina) in a BeadLab with full
automation. All DNA samples were subjected to rigorous quality control to
check for fragmentation and amplification. We used 20 ml of DNA at a
concentration of 50 ng/ml for each array. DNA samples were tracked using a
laboratory information management system (LIMS). The HumanHap300
Genotyping BeadChip was used with an Illumina LIMS, and the Sentrix
Human-1 Genotyping BeadChip was tracked through the Illumina process
by hand. Groups of 24 samples were batched. In order to determine the degree
of error due to mix-ups and plate inversions, 5% of the samples were selected
from the different batches for re-genotyping, and the results were compared.
We did not detect any discrepancies. Raw data were analyzed using GTS Image
and were extracted for statistical analysis.
Association. All data from the gene expression experiment were normalized
together using the RMA (robust multi-array average) package6,7 to remove any
technical or spurious background variation. A second inverse normal
transformation step was also applied to each trait to avoid any outliers. We
did not test for batch effects in the data. Before performing association analyses,
we used a variance components method to estimate narrow-sense heritability of
each trait using MERLIN23.
Association analysis was applied with MERLIN (with the FASTASSOC
option)11,23. We fitted a simple regression model to each trait and used a
variance component approach to account for correlation between different
observed phenotypes within each family. For individuals for whom genotype
data were available, we coded genotypes as 0, 1 or 2 depending on the number
of copies of the allele being tested. For individuals with missing genotype data,
we used the Lander-Green algorithm to estimate an expected genotype score
between 0 and 2 (ref. 23). Briefly, to estimate each genotype score, we first
calculated the likelihood of the observed genotype data. Then, we instantiated
each missing genotype to a specific value and updated the pedigree likelihood.
The ratio of the two likelihoods gives a posterior probability that the
5
© 2007 Nature Publishing Group http://www.nature.com/naturegenetics
ARTICLES
instantiated genotype is true, conditional on all available data. As our model
uses information from all available individuals and does not focus on the
offspring of heterozygous parents, it is potentially sensitive to stratification.
Consequently, we tested for the effects of population structure and cryptic
relatedness between sampled individuals with the genomic control method12.
The genomic control parameter was close to its expected value of 1.0, indicating
no stratification.
A significance level of 0.05 and a Bonferroni correction applied to each
expression trait individually led to a P value threshold of 1.2 107,
corresponding to a lod score of 6.076. This equates to a false discovery rate
of 0.049 for 408,273 SNPs tested for association with 15,084 transcripts24.
Heritable genes used in the main analysis were annotated with UCSC
refGenes based on NCBI’s RefSeq. Expression traits shown to be heritable
were annotated using probe IDs and the programs NetAffx (see URL below)
and EASE.
Gene Ontology. Transcripts and genes were matched to Gene Ontology25
categories using the HG-U133 Plus 2.0 annotation file (accessed 19 December
2005) available from Affymetrix NetAffx (see URL below). We excluded GO
annotations inferred from electronic annotation only, as these are considered
less reliable26. We investigated the average heritability of the transcripts assigned
to each GO category using the statistic
ZH 2 ¼
i
Hi2 m
pffiffiffiffi
s= ni
where H2i is the average heritability of the transcripts assigned to the ith GO
category, ni is the number of transcripts in the ith category and m and s are the
overall mean and s.d. of all heritability estimates, respectively. We also investigated the proportion of genes and transcripts that were associated with specific
SNPs at genome-wide significance levels within each category using the statistic
pi p
Zpi ¼ pffiffiffiffiffiffiffiffiffiffiffiffiffiffiffiffiffiffiffiffiffiffiffi
pð1 pÞ=ni
where pi is the proportion of significant transcripts in the ith category, and p is
the overall proportion of significant transcripts.
Accession number. The microarray data have been deposited in the Gene
Expression Omnibus (GEO) database under accession number GSE8052.
URLs. MRBS browser: http://www.sph.umich.edu/csg/liang/asthma/. RefSeq:
http://www.ncbi.nlm.nih.gov/RefSeq/. NetAffx: http://www.affymetrix.com.
Human Genome U133 Plus 2.0 Array: http://www.affymetrix.com/support/
technical/byproduct.affx?product¼hg-u133-plus.
Requests for materials: [email protected].
Note: Supplementary information is available on the Nature Genetics website.
ACKNOWLEDGMENTS
The study was funded by the Wellcome Trust, the Medical Research Council, the
French Ministry of Higher Education and Research and the US National
Institutes of Health (the National Human Genome Research Institute and the
National Heart, Lung and Blood Institute).
6
Published online at http://www.nature.com/naturegenetics
Reprints and permissions information is available online at http://npg.nature.com/
reprintsandpermissions
1. Schadt, E.E. et al. Genetics of gene expression surveyed in maize, mouse and man.
Nature 422, 297–302 (2003).
2. Morley, M. et al. Genetic analysis of genome-wide variation in human gene expression.
Nature 430, 743–747 (2004).
3. Moffatt, M.F. et al. Genetic variants regulating ORMDL3 expression are determinants of
susceptibility to childhood asthma. Nature 448, 470–473 (2007).
4. British Thoracic Society and Scottish Intercollegiate Guidelines Network. British
guideline on the management of asthma. Thorax 58 (Suppl.), i1–i94 (2003).
5. Abecasis, G.R., Cookson, W.O. & Cardon, L.R. Selection strategies for disequilibrium
mapping of quantitative traits in nuclear families. Am. J. Hum. Genet. 65, A245
(1999).
6. Irizarry, R.A. et al. Exploration, normalization, and summaries of high density oligonucleotide array probe level data. Biostatistics 4, 249–264 (2003).
7. Bolstad, B.M., Irizarry, R.A., Astrand, M. & Speed, T.P. A comparison of normalization
methods for high density oligonucleotide array data based on variance and bias.
Bioinformatics 19, 185–193 (2003).
8. Yan, H., Yuan, W., Velculescu, V.E., Vogelstein, B. & Kinzler, K.W. Allelic variation in
human gene expression. Science 297, 1143 (2002).
9. Cheung, V.G. et al. Natural variation in human gene expression assessed in lymphoblastoid cells. Nat. Genet. 33, 422–425 (2003).
10. Gretarsdottir, S. et al. The gene encoding phosphodiesterase 4D confers risk of
ischemic stroke. Nat. Genet. 35, 131–138 (2003).
11. Chen, W.-M. & Abecasis, G.R. Family based association tests for genome wide
association scans. Am. J. Hum. Genet. (in the press).
12. Devlin, B., Roeder, K. & Wasserman, L. Genomic control, a new approach to geneticbased association studies. Theor. Popul. Biol. 60, 155–166 (2001).
13. Hubner, N. et al. Integrated transcriptional profiling and linkage analysis for identification of genes underlying disease. Nat. Genet. 37, 243–253 (2005).
14. Monks, S.A. et al. Genetic inheritance of gene expression in human cell lines. Am. J.
Hum. Genet. 75, 1094–1105 (2004).
15. Beaty, J.S., West, K.A. & Nepom, G.T. Functional effects of a natural polymorphism in
the transcriptional regulatory sequence of HLA-DQB1. Mol. Cell. Biol. 15, 4771–4782
(1995).
16. Libioulle, C. et al. Novel Crohn disease locus identified by genome-wide association
maps to a gene desert on 5p13.1 and modulates expression of PTGER4. PLoS Genet.
3, e58 (2007) (doi:10.1371/journal.pgen.0030058).
17. Sladek, R. et al. A genome-wide association study identifies novel risk loci for type 2
diabetes. Nature 445, 881–885 (2007).
18. Thein, S.L. et al. Intergenic variants of HBS1L-MYB are responsible for a major QTL
on chromosome 6q23 influencing HbF levels in adults. Proc. Natl. Acad. Sci. USA
104, 11346–11351 (2007).
19. Spielman, R.S. et al. Common genetic variants account for differences in gene
expression among ethnic groups. Nat. Genet. 39, 226–231 (2007).
20. Stranger, B.E. et al. Relative impact of nucleotide and copy number variation on gene
expression phenotypes. Science 315, 848–853 (2007).
21. Gunderson, K.L., Steemers, F.J., Lee, G., Mendoza, L.G. & Chee, M.S. A genome-wide
scalable SNP genotyping assay using microarray technology. Nat. Genet. 37, 549–554
(2005).
22. Steemers, F.J. et al. Whole-genome genotyping with the single-base extension assay.
Nat. Methods 3, 31–33 (2006).
23. Abecasis, G.R., Cherny, S.S., Cookson, W.O. & Cardon, L.R. Merlin–rapid analysis of
dense genetic maps using sparse gene flow trees. Nat. Genet. 30, 97–101 (2002).
24. Benjamini, Y. & Hochberg, Y. Controlling the false discovery rate: a practical and
powerful approach to multiple testing. J. R. Statist. Soc. Ser. B 57, 289–300
(1995).
25. Ashburner, M. et al. Gene ontology: tool for the unification of biology. The Gene
Ontology Consortium. Nat. Genet. 25, 25–29 (2000).
26. Harris, M.A. et al. The Gene Ontology (GO) database and informatics resource. Nucleic
Acids Res. 32, D258–D261 (2004).
ADVANCE ONLINE PUBLICATION NATURE GENETICS


© Copyright 2026