
Child Survival THE STATE OF THE WORLD’S CHILDREN 2008
THE STATE OF THE WORLD’S CHILDREN 2008
CHILD SURVIVAL
United Nations Children’s Fund
3 United Nations Plaza
New York, NY 10017, USA
Email: [email protected]
Website: www.unicef.org
US $25.00 UK £12.10 €16.80
ISBN: 978-92-806-4191-2
Sales no.: E.08.XX.1
© United Nations Children’s Fund (UNICEF)
December 2007
THE STATE OF THE WORLD’S CHILDREN 2008
Child
Survival
UNICEF Offices
UNICEF Headquarters
UNICEF House
3 United Nations Plaza
New York, NY 10017, USA
UNICEF Regional Office for Europe
Palais des Nations
CH-1211 Geneva 10, Switzerland
UNICEF Central and Eastern Europe,
Commonwealth of Independent
States Regional Office
Palais des Nations
CH-1211 Geneva 10, Switzerland
UNICEF Eastern and Southern Africa
Regional Office
P.O. Box 44145-00100
Nairobi, Kenya
UNICEF West and Central Africa
Regional Office
P.O. Box 29720 Yoff
Dakar, Senegal
UNICEF The Americas and Caribbean
Regional Office
Avenida Morse
Ciudad del Saber Clayton
Edificio #102
Apartado 0843-03045
Panama City, Panama
UNICEF East Asia and the Pacific
Regional Office
P.O. Box 2-154
19 Phra Atit Road
Bangkok 10200, Thailand
UNICEF Middle East and North Africa
Regional Office
P.O. Box 1551
Amman 11821, Jordan
UNICEF South Asia Regional Office
P.O. Box 5815
Lekhnath Marg
Kathmandu, Nepal
Further information is available at
our website <www.unicef.org>
THE STATE OF THE
WORLD’S CHILDREN
2008
Acknowledgements
This report was made possible with the advice and contributions of many people, both inside and outside of UNICEF.
Important contributions were received from the following UNICEF field offices: Afghanistan, Angola, Argentina,
Bangladesh, Benin, Bolivia, Bosnia and Herzegovina, Brazil, Cambodia, Cameroon, Chile, China, Colombia, Congo,
Côte d’Ivoire, Dominican Republic, Ecuador, Egypt, Eritrea, the Gambia, Ghana, Haiti, India, Islamic Republic of Iran,
Jamaica, Jordan, Kazakhstan, Kenya, Mongolia, Morocco, Mozambique, Nicaragua, Niger, Nigeria, Pakistan, Papua
New Guinea, Peru, Saint Lucia, Senegal, Somalia, South Africa, Sudan, Suriname, Tajikistan, United Republic of
Tanzania, Timor-Leste, Turkmenistan, Uganda, Uruguay, Bolivarian Republic of Venezuela, Yemen, Zambia and
Zimbabwe. Input was also received from UNICEF regional offices and the Innocenti Research Centre.
Special thanks to President Ellen Johnson-Sirleaf, Tedros Adhanom, Paul Farmer, Paul Freeman, Melinda French Gates,
Jim Yong Kim, Elizabeth N. Mataka, and Henry Perry.
RESEARCH AND POLICY GUIDANCE
DESIGN AND PRE-PRESS PRODUCTION
Programme Division; Division of Policy and Planning
Prographics, Inc.
STATISTICAL TABLES
PRINTING
Strategic Information Section, Division of Policy and
Planning
Hatteras Press, Inc.
Produced, translated and distributed by Editorial, Design and Publications Section, Division of Communication
© United Nations Children’s Fund (UNICEF)
December 2007
United Nations Children’s Fund
3 United Nations Plaza
Permission to reproduce any part of this publication
is required. Please contact:
Editorial, Design and Publications Section
Division of Communication, UNICEF
3 United Nations Plaza, New York, NY 10017, USA
Tel: (+1-212) 326-7434
Fax: (+1-212) 303-7985
Email: [email protected]
New York, NY 10017, USA
Permission will be freely granted to educational or
non-profit organizations. Others will be requested
to pay a small fee.
Commentaries represent the personal views
of the authors and do not necessarily reflect
positions of the United Nations Children’s Fund.
For any corrigenda found subsequent to printing, please visit
our website at <www.unicef.org/publications>
ISBN: 978-92-806-4191-2
Sales no.: E.08.XX.1
ii
Email: [email protected]
Website: www.unicef.org
Cover photo: © UNICEF/HQ07-0108/Thierry Delvigne Jean
Foreword
However, there is no room for complacency. The loss
of 9.7 million young lives each year is unacceptable,
especially when many of these deaths are preventable.
And despite progress, the world is not yet on track
to achieve the Millennium
Development Goal target
of a two-thirds reduction in the
rate of child mortality by 2015.
Data compiled by the Interagency Group for Child
Mortality Estimation reveals
that progress has been made
in countries in every region of
the world. Since 1990, China’s
under-five mortality rate has
declined from 45 deaths for every
1,000 live births to 24 per 1,000,
a reduction of 47 per cent.
India’s under-five mortality rate
has declined by 34 per cent.
The rates in six countries –
Bangladesh, Bhutan, Bolivia,
Eritrea, the Lao People’s Democratic Republic and
Nepal – were reduced by 50 per cent or more since
1990, although under-five mortality rates in these
countries remain high. And Ethiopia achieved a nearly
40 per cent reduction since 1990.
Of the 62 countries making no progress or insufficient
progress towards the Millennium Development Goal on
child survival, nearly 75 per cent are in Africa. In some
countries in southern Africa, the prevalence of HIV and
AIDS has reversed previously recorded declines in child
mortality. Achieving the goal in these countries will
require a concerted effort.
impact of pneumonia, diarrhoea, malaria, severe acute
malnutrition and HIV.
We know that lives can be saved when children have
access to community-based health services, backed by
a strong referral system.
The focus must be on delivering key interventions at the
community level, as part of integrated efforts to support
the establishment of stronger national health systems.
And particular attention must
be paid to the special needs of
women, of mothers and of
newborn children.
© UNICEF/HQ07-1608/Georgina Cranston
In 2006, for the first time in recent history, the total
number of annual deaths among children under the
age of five fell below 10 million, to 9.7 million. This
represents a 60 per cent drop in the rate of child
mortality since 1960.
The World Health Organization,
the World Bank and UNICEF, at
the invitation of the African
Union, have jointly developed a
framework, examined in detail
in this year’s The State of the
World’s Children report, to help
African countries achieve
the MDG for child survival.
One source of hope is the new
momentum on global health.
Public and private interest is
high, and innovative partnerships are being established and strengthened, as we
collectively seek to capitalize on this momentum.
Partnerships hold great promise for accelerating
progress towards the achievement of the Millennium
Development Goals. UNICEF is working closely with
UN system partners and with governments, regional
and non-governmental organizations, foundations and
the private sector to coordinate activities and to pool
expertise and knowledge.
Our challenge now is to act with a collective sense of
urgency to scale up that which has proven successful.
Widespread adoption of basic health interventions,
including early and exclusive breastfeeding,
immunization, vitamin A supplementation and the use
of insecticide-treated mosquito nets to prevent malaria,
are essential to scaling up progress, in sub-Saharan
Africa and elsewhere.
More needs to be done to increase access to treatment
and means of prevention, to address the devastating
Ann M. Veneman
Executive Director
United Nations Children’s Fund
iii
CONTENTS
Acknowledgements ......................................................................ii
Foreword
1.12 The probability of maternal mortality is far higher in
the developing world than in industrialized countries......12
Ann M. Veneman
Executive Director, UNICEF ......................................................iii
1.13 Low levels of maternal care contribute
to high rates of maternal death in South Asia
and sub-Saharan Africa ......................................................12
1
1.14 Sub-Saharan Africa accounts for almost
90 per cent of paediatric HIV infections ............................13
Child survival: Where we stand
Summary ....................................................................................vi
Panels
The under-five mortality rate: The indispensable
gauge of child health......................................................................2
Underlying and structural causes of maternal
and child mortality..........................................................................3
Newborn survival ..........................................................................4
The main proximate causes of child deaths ................................8
Pneumonia: The forgotten killer of children ..............................10
The continuum of maternal, newborn and
child health care across time and place ....................................17
1.15 Around 80 per cent of the developing
world has access to improved water sources ..................14
1.16 Only half of the population in the developing
world has access to adequate sanitation ...........................14
1.17 The 60 priority countries for child survival
targeted by Countdown to 2015..........................................16
1.18 Connecting caregiving across the continuum for
maternal, newborn and child health ..................................17
1.19 Connecting caregiving between households
and health facilities to reduce maternal, newborn
and child deaths ..................................................................17
1.20 Levels of birth registration are low in South Asia
and sub-Saharan Africa ......................................................22
Child health in complex emergencies ........................................18
Empowering women to advance maternal,
newborn and child health ............................................................20
Birth registration: An important step towards
accessing essential services ......................................................22
Child survival in post-conflict situations: Liberia’s challenges
and triumphs, by President Ellen Johnson-Sirleaf ....................24
2
Lessons learned from evolving
health-care systems and practices
Summary ..................................................................................26
Panels
The Measles Initiative ..................................................................28
Figures
1.1 The benefits of meeting Millennium Development
Goal 4 – and the cost of failing to reach the goal ..............2
1.2 Global rates of neonatal mortality, 2000 ..............................4
1.3 High-impact, simple interventions to save
newborn lives within the continuum of maternal
and child health care ..............................................................5
1.4 The global child mortality rate declined
by almost one quarter between 1990 and 2006 ..................6
1.5 Fewer than 10 million children under five died
in 2006 ....................................................................................6
1.6 Global progress in reducing child
mortality is insufficient to reach MDG 4 ..............................7
National immunization days and child health days ..................32
Health sector financing: Sector-wide approaches
and the Heavily Indebted Poor Countries Initiative ..................33
Integrated Management of Neonatal and
Childhood Illnesses in India ........................................................35
The Bamako Initiative ..................................................................36
Diagonal approaches: The Mexican way....................................38
Accelerated Child Survival and Development
in West Africa ................................................................................40
HIV and AIDS in Africa and its impact on women
and children, by Elizabeth N. Mataka ........................................42
Partnership for Maternal, Newborn & Child Health ..................43
1.7 Almost one third of the 50 least developed countries
have managed to reduce their under-five mortality
rates by 40 per cent or more since 1990 ..............................8
Figures
1.8 Global distribution of cause-specific
mortality among children under five ....................................8
2.2 Selective primary health care and trends in
immunization rates since 1980............................................35
1.9 Health and the Millennium Development Goals ................9
1.10 More than half of children under five with suspected
pneumonia are taken to an appropriate health provider....10
2.3 IMCI case management in the outpatient health
facility, first-level referral facility and at home for the
sick child from age two months up to five years ..............37
1.11 South Asia has the highest level of
undernutrition among the regions......................................11
2.4 Conceptual framework for achieving
health-related Millennium Development Goals ................39
iv
2.1 Global burden of measles deaths ......................................29
THE STATE OF THE WORLD’S CHILDREN 2008
Child Survival
3
Community partnerships in primary
health care for mothers, newborns
and children
A new way of working together for multilateral
institutions ....................................................................................88
Human rights, community-based health care and
child survival, by Paul Farmer and Jim Yong Kim ....................90
Summary ..................................................................................44
Figures
Panels
4.1 Conceptual framework for scaling up primary
health care in developing countries ..................................64
Basic practices for community-based health-care
interventions ................................................................................47
Common aspects and challenges of community
partnerships in health and nutrition ..........................................48
India: Reducing undernutrition through community
partnerships ..................................................................................50
Preventing mother-to-child transmission of HIV:
Impact of mothers2mothers programmes in eastern
and southern Africa ......................................................................52
Leadership brings change for mothers and children in
Ethiopia, by Tedros Adhanom ....................................................54
Focus On Mozambique: Reducing under-five mortality
through a community-based programme ..................................59
4.2 Ways of addressing bottlenecks in health-service
delivery ..................................................................................69
4.3 Estimated impact and cost of minimum, expanded
and maximum packages for the Strategic Framework
for Africa................................................................................78
4.4 Funding sources 2007–2015 ................................................79
4.5 Brazil: Wide disparities in infant mortality rates
between and within selected regions, by family
income and by mother’s ethnicity, 2002 ............................87
Community partnerships in water systems
and school sanitation ..................................................................60
5
Figure
Summary ..................................................................................94
3.1 Prevalence of stunting by age (months) ............................51
Panels
4
Uniting for child survival
Strengthening data collection and monitoring for public
health decisions ..........................................................................100
Strengthening community
partnerships, the continuum of care,
and health systems
Summary ..................................................................................62
Panels
Scaling up: Adequate nutrition for mothers, newborns
and children ..................................................................................66
‘Marginal Budgeting for Bottlenecks’ ........................................70
Scaling up: Safe water, adequate sanitation
and improved hygiene practices ................................................74
The other side of the mat: Uniting for maternal, newborn
and child survival and health, by Melinda French Gates........102
Figure
5.1 Selected financial flows to developing countries..............99
References ..............................................................................104
Statistical Tables ........................................................109
Under-five mortality rankings ................................................113
Table 1: Basic indicators ........................................................114
The urgent need to address the health worker
crisis in Africa................................................................................76
Table 2: Nutrition ....................................................................118
The investment case for child survival and other
health-related Millennium Development Goals
in sub-Saharan Africa ..................................................................78
Table 4: HIV/AIDS ....................................................................126
Focus On Botswana: Going to scale with HIV prevention
and treatment using community partnerships ..........................81
Table 6: Demographic indicators ............................................134
Strengthening accountability and governance
in health-service delivery ............................................................83
Table 8: Women ......................................................................142
Performance-based financing in Rwanda ..................................84
Table 10: The rate of progress ..............................................150
Focus On Brazil: Creating a national community-based
health-system network ................................................................86
Table 3: Health ........................................................................122
Table 5: Education ..................................................................130
Table 7: Economic indicators ................................................138
Table 9: Child protection ........................................................146
Acronyms
................................................................................154
v
Child mortality is
a sensitive indicator of a country’s development
and telling evidence of its priorities and values. Investing in the
health of children and their mothers is not only a human rights
imperative, it is a sound economic
decision and one of the surest
ways for a country to set its
course towards a better future.
SUMMARY
Impressive progress has been
made in improving the survival
rates and health of children, even
in some of the poorest countries,
since 1990. Nonetheless, achieving
Millennium Development Goal 4
(MDG 4), which aims to reduce the
global under-five mortality rate by
two thirds between 1990 and 2015,
will require additional effort.
Attaining the goal is still possible,
but the challenge is formidable.
Every child has the right to live a healthy
life. A group of children at a community
child centre, Malawi.
Reaching the target means reducing the number of child deaths
from 9.7 million in 2006 to around
4 million by 2015. Accomplishing
this will require accelerated action
on multiple fronts: reducing poverty
and hunger (MDG 1), improving
maternal health (MDG 5), combating HIV and AIDS, malaria and
other major diseases (MDG 6),
increasing the usage of improved
water and sanitation (MDG 7) and
providing affordable essential drugs
on a sustainable basis (MDG 8). It
will also require a re-examination of
strategies to reach the poorest,
most marginalized communities.
The remarkable advances in
reducing child deaths achieved
by many developing countries in
recent decades provide reason
for optimism. The causes of and
solutions to child deaths are well
known. Simple, reliable and
affordable interventions with the
potential to save the lives of millions of children are readily available. The challenge is to ensure
that these remedies – provided
through a continuum of maternal,
newborn and child health care –
reach the millions of children and
families who, so far, have been
passed by.
T H E S TAT E O F T H E W O R L D ’ S C H I L D R E N 2 0 0 8
Child survival: Where we stand
© UNICEF/2007/David Anthony
The current situation
What is a life worth? Most of us
would sacrifice a great deal to save a
single child. Yet somehow on a global
scale, our priorities have become
blurred. Every day, on average more
than 26,000 children under the age
of five die around the world, mostly
from preventable causes. Nearly all
of them live in the developing world
or, more precisely, in 60 developing
countries. More than one third of
these children die during the first
month of life, usually at home and
without access to essential health
services and basic commodities that
might save their lives. Some children
succumb to respiratory or diarrhoeal
infections that are no longer threats
in industrialized countries or to early
childhood diseases that are easily
prevented through vaccines, such as
measles. In up to half of under-five
deaths an underlying cause is undernutrition, which deprives a young
child’s body and mind of the nutrients
needed for growth and development.
Unsafe water, poor sanitation and
inadequate hygiene also contribute
to child mortality and morbidity.
In 2006, the most recent year for
which firm estimates are available,
close to 9.7 million children died
before their fifth birthday. Although
the numbers have changed, the
problem is no less poignant today
than it was 25 years ago when the
‘child survival revolution’ was
launched by the United Nations
Children’s Fund (UNICEF). The
current focus of the development
community in relation to child survival is Millennium Development
Goal 4 (MDG 4), which aims to
reduce the global rate of under-five
mortality by two thirds between
1990 and 2015. Since child deaths
in 1990 numbered around 13
million in absolute terms, meeting
MDG 4 implies that during the next
seven years the number of child
deaths must be cut in half – to fewer
than 13,000 child deaths per day,
or fewer than 5 million per year.1
The enormity of the challenge should
not be underestimated. The world
will have to reduce the number of
child deaths between 2008 and 2015
at a far faster rate than it has managed since 1990 (see Figure 1.6, page
7). Moreover, the bulk of the efforts
must be focused on the most difficult
situations and circumstances: in the
poorest countries, among the most
impoverished, isolated, uneducated
and marginalized districts and com-
1
munities, within nations ravaged
by AIDS, conflict, weak governance
and chronic underinvestment in
public health systems and physical
infrastructure.
Business as usual will be grossly insufficient to meet the health-related
Millennium Development Goals for
children. This is abundantly clear in
sub-Saharan Africa, the region furthest
behind on almost all of the healthrelated MDGs, but also in several
countries in South Asia and in other
countries across the developing world.
If current trends continue, 4.3 million
child deaths will occur in 2015 that
could have been averted had MDG 4
been met (see Figure 1.1, page 2).
To underscore the need to position
children’s issues at the heart of the
international agenda, The State of the
World’s Children 2008 returns to a
theme that marked the launch of the
series in the early 1980s. Then, as
now, UNICEF and its partners aspired
to reduce the number of child deaths
by about half by a target date. Then,
as now, it proposed simple, effective,
low-cost, practical solutions and
strategies to reduce child mortality
and improve child health. Now, as
then, it is inviting partners from all
1
walks of life – from religious leaders to
Goodwill Ambassadors, from mayors
to Heads of State, from sports personalities to parliamentarians, from professional associations to trade unions –
to join the child survival and development movement.
Far from ploughing a lone furrow
as it often did in the 1980s, UNICEF
today is championing child survival as
part of a large community of concern.
The partnerships that have developed
during the past two decades are proving vital in tackling problems that
demand more complex systemic and
sociocultural changes than the early
architects of the child survival revolution realized. The State of the World’s
Children 2008 outlines the results
born from these partnerships, as well
as from the experiences and approaches to child survival and health of
recent decades.
Figure 1.1
The benefits of meeting Millennium Development Goal 4 –
and the cost of failing to reach the goal
* Number of additional deaths among children under age five that will occur in the year 2015 if
current annual rates of reduction in the under-five mortality rate persist.
** Number of deaths among children under five that will be averted in the year 2015 alone,
compared with the number of deaths in 2006, by reaching the MDG 4 target of a two-thirds reduction
in the under-five mortality rate observed in 1990.
Source: UNICEF estimates based on data in Statistical Tables 1 and 10, pp. 114 and 150 of this report.
The under-five mortality rate: The indispensable gauge of child health
The under-five mortality rate, often known by its
acronym U5MR or simply as the child mortality rate,
indicates the probability of dying between birth and
exactly five years of age, expressed per 1,000 live
births, if subject to current mortality rates. It has several advantages as a barometer of child well-being in
general and child health in particular.
First, it measures an ‘outcome’ of the development
process rather than an ‘input’, such as per capita
calorie availability or the number of doctors per
1,000 population – all of which are means to an end.
Second, the U5MR is known to be the result of a wide
variety of inputs: the nutritional status and the health
knowledge of mothers; the level of immunization and
oral rehydration therapy; the availability of maternal
and child health services (including prenatal care);
income and food availability in the family; the availability of safe drinking water and basic sanitation; and
2
the overall safety of the child’s environment, among
other factors.
Third, the U5MR is less susceptible to the fallacy of the
average than, for example, per capita gross national
income (GNI per capita). This is because the natural
scale does not allow the children of the rich to be
1,000 times as likely to survive, even if the humanmade scale does permit them to have 1,000 times as
much income. In other words, it is much more difficult
for a wealthy minority to affect a nation’s U5MR, and it
therefore presents a more accurate, if far from perfect,
picture of the health status of the majority of children
(and of society as a whole).
See References, page 104.
T H E S TAT E O F T H E W O R L D ’ S C H I L D R E N 2 0 0 8
The report begins by examining the
state of child survival and primary
health care for children, with a
strong emphasis on trends in child
mortality. It then appraises the lessons from failures and successes in
child survival over the past century.
The centrepiece of the report looks at
several of the most promising
approaches – community partnerships,
the continuum of care framework and
health-system strengthening for outcomes – to reach those mothers, newborns and children who are currently
excluded from essential interventions.
By highlighting examples from countries and districts where these have
been successful, as well as exploring
the main challenges to their expansion, this report offers practical ways
to jump-start progress.
Why child survival matters
Investing in the health of young
children makes sense for a number
of reasons beyond the pain and
suffering caused by even one child’s
death. Depriving infants and young
children of basic health care and
denying them the nutrients needed
for growth and development sets
them up to fail in life. But when children are well nourished and cared for
and provided with a safe and stimulating environment, they are more
likely to survive, to have less disease
and fewer illnesses, and to fully
develop thinking, language, emotional and social skills. When they enter
school, they are more likely to succeed. And later in life, they have a
greater chance of becoming creative
and productive members of society.
Investing in children is also wise from
an economic perspective. According
to the World Bank, immunization
and vitamin A supplementation are
two of the most cost-effective public
health interventions available today.
Improving vitamin A status can
strengthen a child’s resistance to
disease and decrease the likelihood
of childhood mortality.2 For only a
small sum, a child can be protected
from vitamin A deficiency and a
number of deadly diseases, including
diphtheria, pertussis, tetanus, polio,
measles, childhood tuberculosis,
hepatitis B and Hib (Haemophilus
influenzae type b), which is a major
cause of pneumonia and meningitis.3
Providing cotrimoxazole, a low-cost
antibiotic, to HIV-positive children
dramatically reduces mortality from
opportunistic infections.
Improvements in child health and survival can also foster more balanced
population dynamics. When parents
are convinced that their children will
survive, they are more likely to have
fewer children and provide better care
to those they do have – and countries
can invest more in each child.4
Underlying and structural causes of maternal and child mortality
Maternal, newborn and under-five deaths and undernutrition
have a number of common structural and underlying causes,
including:
• Poorly resourced, unresponsive and culturally
inappropriate health and nutrition services.
• Food insecurity.
• Inadequate feeding practices.
• Lack of hygiene and access to safe water or adequate
sanitation.
• Female illiteracy.
• Early pregnancy.
• Discrimination and exclusion of mothers and children
from access to essential health and nutrition services and
commodities due to poverty and geographic or political
marginalization.
These factors result in millions of unnecessary deaths
each year. Their wide-ranging nature and interrelatedness
require them to be addressed at different levels –
community, household, service provider, government
and international – in an integrated manner to maximize
effectiveness and reach.
The solutions to these impediments are well known,
particularly those relating to the direct causes of maternal,
neonatal and child deaths. The necessary interventions
involve the provision of packages of essential primaryhealth-care services for children across a continuum of care
that spans pregnancy, childbirth and after delivery, leading
to care for children in the crucial early years of life (see
Panel, page 17, for a full definition of the continuum
of care).
See References, page 104.
C H I L D S U R V I VA L : W H E R E W E S TA N D
3
Newborn survival
Until the mid to late 1990s, estimates of the number of child
deaths occurring during the neonatal period (the first month
of life) were drawn from rough historical data rather than
from specific surveys. More rigorous estimates for newborn
deaths emerged in 1995 and 2000, as data from reliable
household surveys became available. Analysis of these
data made it evident that previous estimates had seriously
understated the scale of the problem. Although the global
neonatal mortality rate has decreased slightly since 1980,
neonatal deaths have become proportionally much more
significant because the reduction of neonatal mortality has
been slower than that of under-five mortality: Between 1980
and 2000, deaths in the first month of life declined by a
quarter, while deaths between one month and five years
declined by a third.
The latest evidence is that 4 million babies die each year in
their first month of life, and up to half of these die in their
first 24 hours – a child is about 500 times more likely to die
in the first day of life than at one month of age. Neonatal
Figure 1.2
Global rates of neonatal mortality, 2000
mortality accounts for almost 40 per cent of all under-five
deaths and for nearly 60 per cent of infant (under-one)
deaths. The largest absolute number of newborn deaths
occurs in South Asia – India contributes a quarter of the
world total – but the highest national rates of neonatal mortality occur in sub-Saharan Africa. A common factor in these
deaths is the health of the mother – each year more than
500,000 women die in childbirth or from complications during
pregnancy, and babies whose mothers have died during
childbirth have a much greater chance of dying in their first
year than those whose mothers remain alive.
Even these figures understate the vast scale of the problems
that affect child health during the neonatal period. For example, more than a million children who survive birth asphyxia
each year go on to suffer such problems as cerebral palsy,
learning difficulties and other disabilities. For every newborn
baby who dies, another 20 suffer birth injury, complications
arising from preterm birth or other neonatal conditions.
Significant improvements in the early neonatal period will
depend on essential interventions for mothers and babies
before, during and immediately after birth. According to the
latest estimates for 2000–2006, at present in the developing
world, one quarter of pregnant women do not receive even
a single visit from skilled health personnel (doctor, nurse,
midwife); only 59 per cent of births take place with the
assistance of a skilled attendant; and just over half take
place in a health facility.
Averting neonatal deaths is pivotal to reducing child mortality. The Lancet Neonatal Survival Series, published in 2005,
estimated that 3 million of the 4 million deaths could be prevented each year if high coverage (90 per cent) is achieved
for a package of proven, cost-effective interventions that are
delivered through outreach, families and communities, and
facility-based clinical care across a continuum of neonatal
care (antenatal, intrapartum and postpartum). While increasing skilled care is essential, the Neonatal Survival Series
underlines the importance of interim solutions that can save
almost 40 per cent of newborn lives in community settings.
Expanding programmes that prevent mother-to-child transmission of HIV is also crucial.
Source: World Health Organization, using vital registration systems and
household surveys. Country and regional data for neonatal mortality
rates in 2000 can be found in Statistical Table 1, p. 114 of this report.
4
Actions required to save newborns include setting evidencebased, results-oriented plans at the national level with specific strategies to reach the poorest, greater funding, agreed
targets for neonatal mortality reduction, and promotion of
greater harmonization and accountability on the part of
stakeholders at the international level.
T H E S TAT E O F T H E W O R L D ’ S C H I L D R E N 2 0 0 8
Figure 1.3
High-impact, simple interventions to save newborn lives within the
continuum of maternal and child health care
* Additional interventions for settings with stronger health systems and lower mortality.
** Situational interventions necessary in certain settings, such as areas of high malaria prevalence.
Note: This figure includes 16 interventions with proven efficacy in reducing neonatal mortality. Other important interventions are delivered
during this time period but are not shown here because their primary effect is not on neonatal deaths (e.g., prevention of mother-to-child
transmission of HIV). For some of the interventions listed, the service delivery mode may vary between settings.
Source: The Lancet Series Team, 'The Lancet Series on Neonatal Health Executive Summary', The Lancet, 3 March 2005, p. 3.
See References, page 104.
C H I L D S U R V I VA L : W H E R E W E S TA N D
5
© UNICEF/HQ04-0675/Giacomo Pirozzi
Immunization and micronutrient supplementation provide cost-effective and life-saving
protection against disease and illness. A
boy receives a dose of vitamin A, Tajikistan.
The numbers
Far fewer children are dying today
than in 1960, the earliest year for
which the annual number of child
deaths is currently available. In
fact, over the past 46 years, the
annual number of child deaths has
halved, from roughly 20 million in
1960 to under 10 million in 2006.
Recent years have seen important
and, in some cases, remarkable
advances in child survival. Despite
considerable impediments, most
notably the onslaught of AIDS in
Eastern and Southern Africa and
internecine conflict in many highmortality countries, the global
child mortality rate has been
steadily reduced since 1990. In
2006, it was estimated at 72 deaths
per 1,000 live births, 23 per cent
lower than the 1990 level.
In a number of regions, the rate of
reduction in child mortality since
1990 has been striking. Child mortality rates have been roughly halved
in East Asia and the Pacific, Central
and Eastern Europe and the
Commonwealth of Independent
States (CEE/CIS), and Latin America
and the Caribbean – bringing the
under-five mortality rate for each of
these regions below 30 per 1,000 live
births in 2006. Although much more
progress would be needed to match
the low average rate of industrialized
countries (6 per 1,000 live births in
2006), only about 1 in every 36 children born in these three regions now
dies before the age of five.
Other regions are following behind.
The Middle East and North Africa
region has seen steady progress in
Figure 1.4
Figure 1.5
The global child mortality rate declined
by almost one quarter between 1990
and 2006
Fewer than 10 million children under five
died in 2006
0
50
100
150
200
250
Source: UNICEF, World Health Organization, United Nations Population Division and United Nations Statistics Division. Country and regional data can
be found in Statistical Tables 1 and 10, pages 114 and 150 of this report.
6
T H E S TAT E O F T H E W O R L D ’ S C H I L D R E N 2 0 0 8
child mortality by only 14 per cent
between 1990 and 2006. A number
of countries in the region are still
registering increases in under-five
mortality rates. In 2006, 49 per cent
of all deaths of children under age
five occurred in sub-Saharan Africa,
despite the fact that only 22
per cent of the world’s children
are born there.
reducing rates but still had an underfive mortality rate of 46 per 1,000
live births in 2006 – equivalent to 1
in every 22 children dying before age
five. South Asia is also making headway, although among the regions it
has the second highest number of
deaths among children under five,
accounting for 32 per cent of the
global total. In 1990, 1 in every
8 South Asian children died before
age five; by 2006, the ratio had
decreased to 1 in 12.
Child survival and the
Millennium Development Goals
Half of the world’s regions are
making insufficient progress
towards MDG 4
Sub-Saharan Africa remains the
most troubling geographic area. In
addition to having by far the highest
rate of child mortality – on average,
1 in every 6 children dies before age
five – the region as a whole has
shown the least progress since 1990,
managing to reduce the burden of
Although overall gains in child survival have been impressive, they have
not been nearly sufficient in several
regions to achieve MDG 4. Four
regions are on track to meet the goal,
but progress in reducing child mortality in the Middle East and North
Africa, South Asia and sub-Saharan
Africa (both Eastern and Southern
Africa and the West and Central
subregions) is currently insufficient.
On a country-by-country basis, the
prospects are mixed. Globally, of the
191 countries with adequate data
for the 1990–2006 comparison in
child mortality, UNICEF estimates
that 129 are on track – having
reduced the under-five mortality
rate to below 40 per 1,000 live
births or achieved an average annual
reduction rate of 3.9 per cent or
more since 1990 – or they have
already met the 2015 goal for
reducing child mortality. Around
18 per cent, or 35 countries, are
making progress but at a rate that
Figure 1.6
Global progress in reducing child mortality is insufficient to reach MDG 4*
Average annual rate of reduction (AARR) in the under-five mortality rate (U5MR) observed for 1990–2006
and required during 2007–2015 in order to reach MDG 4
U5MR
No. of deaths per
1,000 live births
1990
2006
Sub-Saharan Africa
AARR
Observed %
1990–2006
Required %
2007–2015
187
160
1.0
10.5
Eastern and Southern Africa
165
131
1.4
9.6
West and Central Africa
208
186
0.7
11.0
Middle East and North Africa
South Asia
East Asia and Pacific
Progress towards the MDG target
Insufficient progress
Insufficient progress
No progress
79
46
3.4
6.2
Insufficient progress
123
83
2.5
7.8
Insufficient progress
55
29
4.0
5.1
On track
Latin America and Caribbean
55
27
4.4
4.3
On track
CEE/CIS
53
27
4.2
4.7
On track
On track
Industrialized countries/territories
10
6
3.2
6.6
Developing countries/territorries
103
79
1.7
9.3
Insufficient progress
93
72
1.6
9.4
Insufficient progress
World
*Progress towards MDG 4, with countries classified according to the following thresholds:
On track – U5MR is less than 40, or U5MR is 40 or more and the average annual rate of reduction (AARR) in under-five mortality rate observed from
1990 to 2006 is 4.0 per cent or more.
Insufficient progress – U5MR is 40 or more and AARR observed for the 1990–2006 period is between 1.0 per cent and 3.9 per cent.
No progress – U5MR is 40 or more and AARR observed for 1990–2006 is less than 1.0 per cent.
Source: UNICEF estimates based on the work of the Interagency Child Mortality Estimation Group.
C H I L D S U R V I VA L : W H E R E W E S TA N D
7
Figure 1.7
Least developed country
Almost one third of the 50 least developed countries have managed to reduce
their under-five mortality rates by 40 per cent or more since 1990
Percentage reduction in U5MR, 1990–2006
Source: UNICEF, World Health Organization, United Nations Population Division and United Nations Statistics Divisions. Country and regional data
can be found in Statistical Tables 1 and 10, pages 114 and 150 of this report.
The main proximate causes of child deaths
The countries and regions in which children under five
are dying in large numbers are well known, and the main
proximate causes of premature deaths and ill health are
also well established.
Almost 40 per cent of all under-five deaths occur during
the neonatal period, the first month of life, from a variety
of complications (see Panel, page 4). Of these neonatal
deaths, around 26 per cent – accounting for 10 per cent of
all under-five deaths – are caused by severe infections. A
significant proportion of these infections is caused by pneumonia and sepsis (a serious blood-borne bacterial infection
that is also treated with antibiotics). Around 2 million children under five die from pneumonia each year – around
1 in 5 deaths globally. In addition, up to 1 million more
infants die from severe infections including pneumonia,
during the neonatal period. Despite progress since the
1980s, diarrhoeal diseases account for 17 per cent of
under-five deaths. Malaria, measles and AIDS, taken
together, are responsible for 15 per cent of child deaths.
Many conditions and diseases interact to increase child mortality beyond their individual impacts, with undernutrition
contributing up to 50 per cent of child deaths. Unsafe water,
poor hygiene practices and inadequate sanitation are not
8
Figure 1.8
Global distribution of cause-specific
mortality among children under five
Undernutrition is implicated in up to 50 per cent of all
deaths of children under five.
Source: World Health Organization and UNICEF.
only the causes of the continued high incidence of diarrhoeal diseases, they are a significant contributing factor
in under-five mortality caused by pneumonia, neonatal
disorders and undernutrition.
See References, page 104.
T H E S TAT E O F T H E W O R L D ’ S C H I L D R E N 2 0 0 8
is insufficient to meet MDG 4 in
full and on time.
Of most concern are the 27 countries
that have registered scant progress
since 1990 or have an under-five
mortality rate that is stagnant or
higher than it was in 1990. Of the 46
countries in sub-Saharan Africa, only
Cape Verde, Eritrea and Seychelles
are on track to meet MDG 4, and
nearly half the countries have registered either no change or an increase
in child mortality rates since 1990.
The region as a whole only managed
to reduce child mortality at an average annual rate of 1 per cent from
1990–2006, and double-digit reductions will be needed during each
of the remaining years if it is to
meet MDG 4.5
Individual countries face different
challenges in child survival, without
doubt some greater than others. But
the notable achievements suggest that
geography is no barrier to saving children’s lives. Perhaps most important,
these gains are evident in some of the
world’s poorest countries and across
the developing regions, as illustrated
in Figure 1.7. These gains suggest
that remarkable progress is possible,
despite such obstacles as geographic
location or socio-economic disadvantage, when evidence, sound strategies,
sufficient resources, political will and
an orientation towards results are
consciously harnessed to improve
children’s lives.
Furthermore, dramatic improvements
in child mortality and health can be
rapidly attained. Since 1990, more
than 60 countries have managed to
reduce their under-five mortality rate
by 50 per cent.
Figure 1.9
Health and the Millennium Development Goals
Goal
Health Targets
GOAL 1
Eradicate
extreme poverty
and hunger
Target 2
Halve, between 1990 and
Prevalence of underweight
2015, the proportion of peo- children under five
ple who suffer from hunger
Proportion of population below
minimum level of dietary energy
consumption
Target 5
Under-five mortality rate
Reduce by two thirds,
between 1990 and 2015, the
Infant mortality rate
under-five mortality rate
GOAL 4
Reduce child
mortality
Health Indicators
Proportion of one-year-olds
immunized against measles
GOAL 5
Target 6
Maternal mortality ratio
Improve maternal Reduce by three quarters,
health
between 1990 and 2015, the
Proportion of births attended by
maternal mortality ratio
skilled health personnel
GOAL 6
Combat HIV and
AIDS, malaria and
other diseases
Target 7
Halt and begin to reverse,
by 2015, the spread of HIV
and AIDS
HIV prevalence among pregnant
women aged 15–24
Condom use rate of the contraceptive prevalence rate
Ratio of school attendance of
orphans to school attendance of
non-orphans aged 10–14
Target 8
Halt and begin to reverse,
by 2015, the incidence of
malaria and other major
diseases
Prevalence and death rates
associated with malaria
Proportion of population in malariarisk areas using effective malaria
prevention and treatment measures
Prevalence and death rates
associated with tuberculosis
Proportion of tuberculosis cases
detected and cured under Directly
Observed Treatment Short-Course
(DOTS)
GOAL 7
Ensure
environmental
sustainability
GOAL 8
Develop a global
partnership for
development
Target 10
Halve, by 2015, the propor- Proportion of population using
tion of people without sus- an improved water source, urban
tainable access to safe drink- and rural
ing water and basic sanitation
Target 10
By 2020, achieve a significant improvement in the
lives of at least 100 million
slum dwellers
Target 17
In cooperation with pharmaceutical companies, provide
access to affordable essential
drugs in developing countries
Proportion of population using
improved sanitation, urban and
rural
Proportion of population with
access to affordable essential
drugs on a sustainable basis
Source: Adapted from World Health Organization, Health and the Millennium Development Goals,
WHO, Geneva, 2005, p. 11.
C H I L D S U R V I VA L : W H E R E W E S TA N D
9
Pneumonia: The forgotten killer of children
Pneumonia kills more children than any other disease –
more than AIDS, malaria and measles combined. It is a
major cause of child deaths in every region. Children
with pneumonia may exhibit a wide range of symptoms,
depending on age and cause of the infection. Common
symptoms include rapid or difficult breathing, cough, fever,
chills, headaches, loss of appetite and wheezing. In young
infants, severe cases of pneumonia can cause convulsions,
hypothermia, lethargy and feeding problems.
In childhood, pneumonia and malaria have major overlaps
in terms of symptoms, the requirements for their effective
management and the feasibility of providing care in the
community. In effect, especially in very young children, it
may be impossible to tell whether a high fever, coughing
and fast breathing is evidence of either pneumonia or
malaria, and in such cases children often receive treatment
for both. Once a child develops pneumonia, a caregiver
must recognize the symptoms and seek appropriate care
immediately.
Healthy children have natural defences that protect
their lungs from the pathogens that cause pneumonia.
Undernourished children, particularly those who are not
exclusively breastfed or have inadequate zinc intake, or
those with compromised immune systems, run a higher
risk of developing pneumonia. Children suffering from
other illnesses, such as measles, or those living with HIV,
are more likely to develop pneumonia. Environmental factors, such as living in crowded homes and being exposed
to parental smoking or indoor air pollution, may also play
a role in increasing children’s susceptibility to pneumonia
and its consequences.
Prevention is as important as cure in reducing child deaths
from pneumonia. The key preventive measures for children
are adequate nutrition (including exclusive breastfeeding, vitamin A supplementation and zinc intake), reduced indoor air
pollution and increased immunization rates with vaccines that
help prevent children from developing infections that directly
cause pneumonia, such as Haemophilus influenzae type b
(Hib), and with those immunizations that prevent infections
that can lead to pneumonia as a complication (e.g., measles
and pertussis). Vaccines to protect against Streptococcus
pneumoniae – the most common cause of severe pneumonia
among children in the developing world – will be increasingly
becoming available for infants and young children.
Since a large proportion of severe pneumonia cases in children of the developing world are bacterial in origin – mostly Streptococcus pneumoniae or Haemophilus influenzae –
they can be effectively treated using inexpensive antibiotics
at home, provided that families and caregivers follow the
advice they receive and treat the child correctly, including
returning for help as necessary. If these conditions are in
place, evidence from across the developing world suggests
that community-based management of pneumonia can be
very effective. A meta-analysis of results from nine studies
in seven countries, including the United Republic of Tanzania,
that investigated the impact of community-based case
management of pneumonia revealed substantial reductions
not only in pneumonia mortality but in child mortality more
generally. Trials resulted in a reduction of child mortality of
26 per cent and a 37 per cent reduction in mortality from
pneumonia.
See References, page 104.
Figure 1.10
More than half of children under five with suspected pneumonia are taken to an
appropriate health provider
* Excludes China.
** Data refer to the most
recent year available during
the period specified.
Source: Demographic and
Health Surveys, Multiple
Indicator Cluster Surveys and
other national surveys.
10
T H E S TAT E O F T H E W O R L D ’ S C H I L D R E N 2 0 0 8
Progress towards the other
health-related MDGs is mixed
Although advancements on all eight
Millennium Development Goals are
important to the survival and wellbeing of children, MDGs 1, 5, 6, 7
and 8, as well as MDG 4, have
targets that directly affect children’s
health. Progress in the areas targeted
by these goals could have a dramatic
effect on the lives and prospects
of children.
Figure 1.11
South Asia has the highest level of undernutrition among
the regions
Enhancing nutritional status
(MDG 1)
Undernutrition is the main underlying
factor for up to half of all deaths of
children under five. Improving nutrition and achieving MDG 1, which
aims to reduce poverty and hunger,
would help avert child deaths from
diarrhoea, pneumonia, malaria, HIV
and measles, and it would reduce
neonatal mortality. In other words,
improving maternal and child nutrition
is a prerequisite for achieving MDG 4.
The standard indicators used to measure MDG 1, however, do not reveal
the full extent of undernutrition
among children in the developing
world. One of the indicators focuses
on hunger, as measured by the proportion of children under five who
are underweight. But that captures
only one dimension of nutrition.
A child may die from a weakened
immune system when vitamin A is
lacking, for example, without being
apparently hungry or underweight.
Adequate nutrition needs to begin
during a mother’s pregnancy and continue when a child is born. Immediate
and exclusive breastfeeding is the best
source of nutrition for a child, providing physical warmth and strengthen-
*Data refer to the most recent year available during the period specified.
Source: Demographic and Health Surveys, Multiple Indicator Cluster Surveys, World Health
Organization and UNICEF. Country and regional data can be found in Statistical Table 2, p. 118 of
this report.
ing immune systems. Micronutrients
such as iron, vitamin A and iodine
can also have a profound impact on
a child’s development and a mother’s
health. In cases of severe acute undernutrition, specific therapeutic foods
are advised. Although these remedies
are low-cost and highly effective, millions of children and mothers still do
not have access to or are not adopting
them. More than 30 per cent of
households in the developing world
do not consume iodized salt. More
than 60 per cent of infants were not
exclusively breastfed during the first
six months of life, and 28 per cent
lacked full coverage (two doses) of
vitamin A supplementation in 2005.
Improving maternal health (MDG 5)
To reduce child mortality, improving
the health of pregnant women and
new mothers is critical. More than
half a million women die each year
due to pregnancy-related causes, and
many more suffer debilitating longterm effects, such as fistula, that
could be easily avoided through adequate maternal care. Furthermore,
improving maternal health is vitally
important for a child’s prospects
of survival. Evidence shows that a
motherless child is more likely to
die before reaching age two than
infants whose mothers survive.6
Improving the health and nutrition
of mothers-to-be and providing quality reproductive health services are
pivotal to addressing many underlying causes of child mortality. Poor
nutrition in women can result in
preterm births and babies with low
weight at birth. Visits to, or from, a
trained health-care provider during
pregnancy can help avert early deliveries and neonatal tetanus, which
is almost always fatal. A skilled
C H I L D S U R V I VA L : W H E R E W E S TA N D
11
Figure 1.12
The probability of maternal mortality is far higher in the
developing world than in industrialized countries
* These estimates reflect periodic adjustments made by UNICEF, WHO, UNFPA and the World Bank to national
data to account for the well documented problems of under-reporting and misclassification of maternal deaths
and to develop estimates for countries with no data. Consequently, they may differ markedly from reported
national estimates.
Figure 1.13
Low levels of maternal care contribute to high rates of
maternal death in South Asia and sub-Saharan Africa
attendant present at delivery, backed
by emergency obstetric care, decreases the risk of a woman dying in
childbirth and can help prevent and
treat infections and complications.
Postnatal care has a central role
in encouraging new mothers to
breastfeed, in the resuscitation of
newborns, if necessary, and in averting hypothermia and pneumonia.
Despite the importance of maternal
health, the available data reflect
woefully inadequate access to care.
Across the countries and territories,
1 in 4 pregnant women receives
no antenatal care, and more than
40 per cent give birth without the
assistance of a skilled attendant.
Combating AIDS, malaria and
other major diseases (MDG 6)
Millennium Development Goal 6
focuses on reducing the enormous
burdens caused by HIV and AIDS,
malaria and other major diseases.
While few of the indicators focus on
children specifically, the direct and
indirect impact of major diseases on
children can be profound. Half of
the infants who are infected with
HIV will die before age two,7 and
more than 15 million children
under age 18 have lost one or both
parents to AIDS or related causes.
Malaria accounts for 8 per cent of
deaths in children under five and
measles for another 4 per cent.
HIV and AIDS
* Data refer to the most recent year available in the period specified.
Antenatal care coverage – Percentage of women 15–49 years old attended at least once during pregnancy by
skilled health personnel (doctors, nurses or midwives).
Skilled attendant at delivery – Percentage of births attended by skilled health personnel (doctors, nurses or midwives).
Institutional deliveries – Percentage of women 15–49 years old who gave birth in the two years preceding the
survey and delivered in a health facility.
Source: Table 8, Women, p.142 of this report.
12
T H E S TAT E O F T H E W O R L D ’ S C H I L D R E N 2 0 0 8
Worldwide, 2.3 million children
under age 15 are living with HIV,
and 530,000 children were newly
infected with the virus in 2006 –
mostly through mother-to-child
transmission. Girls are at particular
risk of contracting HIV, both because
Once a pregnant woman is infected
with HIV, there is a 35 per cent
chance that without intervention she
will pass the virus on to her newborn
during pregnancy, birth or breastfeeding.8 Antiretroviral drug therapy can
greatly reduce the chances that transmission will occur and is essential to
stemming the rise in child mortality
rates in countries where AIDS has
reached epidemic levels. With the
appropriate drugs and proper care,
infants who are HIV-positive can
remain healthy indefinitely, though
their long-term prospects for survival
are unknown.9 Yet despite the obvious
benefits of drug therapy and its relatively low cost, only 11 per cent of
pregnant women in low- and middleincome countries who were HIVpositive were receiving services to
prevent transmission of the virus to
their newborns in 2005. Preliminary
estimates for 2006, which were not
yet released when this report went to
press, indicate that coverage rates
rose to 20 per cent in 2006.10 The
vast majority of these women live
in sub-Saharan Africa.
© UNICEF/HQ06-2770/Bruno Brioni
of their physiology and because of
social and cultural power imbalances
in their relationships with men and
boys. Preventing new infections is the
first line of defence against AIDS. It
is also the best way to protect the
next generation.
Malaria sickens and kills many children every year. A mother sleeps with her infant under
an insecticide-treated mosquito net, Côte d’Ivoire.
Figure 1.14
Sub-Saharan Africa accounts for almost 90 per cent of
paediatric HIV infections
CEE/CIS
Industrialized countries
Middle East and North Africa
East Asia and Pacific
Latin America and Caribbean
Malaria
Malaria causes more than a million
deaths each year, up to 80 per cent
of them in children under five.11
Pregnant women and their unborn
children are particularly vulnerable
to the disease, which is a prime
cause of low birthweight in newborns, anaemia and infant deaths.
Source: UNAIDS, Report on the Global AIDS Epidemic, 2006.
C H I L D S U R V I VA L : W H E R E W E S TA N D
13
Figure 1.15
Around 80 per cent of the developing world has access to
improved water sources
Figure 1.16
Only half of the population in the developing world has
access to adequate sanitation
In sub-Saharan Africa alone, more
than 2,000 children under-five a
day die from malaria.12 For those
who survive, episodes of fever and
anaemia can inhibit a child’s mental
and physical development.
Preventing and treating malaria
requires several basic interventions,
including sleeping under an insecticide treated mosquito net (ITN) and
providing antimalarial drugs for
pregnant women and children with
evident signs of the disease. ITN
coverage is growing rapidly, albeit
from a low base, in part due to a
tenfold rise in international funding
for malaria control. Trend data for
sub-Saharan Africa show a rise in
use of ITNs across all countries,
and in 16 of 20 countries where
such data is available coverage rates
have at least tripled since 2000.
Notwithstanding these recent gains,
overall levels are still low, and most
countries are falling short of global
malaria goals.
Just over one third of children
with fever in sub-Saharan Africa
use antimalarial drugs. Furthermore, resistance to established antimalarial drugs is increasing. A
potential breakthrough in treatment
is artemisinin-based combination
therapy, or ACT. A safe, effective
and fast-acting treatment for strains
of malaria that are multi-drug resistant, ACT also helps prevent recurrence of the disease.13
Increasing use of safe water and
basic sanitation (MDG 7)
Source: UNICEF, WHO, Multiple Indicator Cluster Surveys, and Demographic and Health Surveys.
14
T H E S TAT E O F T H E W O R L D ’ S C H I L D R E N 2 0 0 8
According to the most recent data,
the world as a whole is on track to
meet the MDG target for safe water,
with only 23 developing countries
© UNICEF/HQ06-1450/Ninfa Bito
lagging behind. Progress towards
improved sanitation, however, has
been insufficient, with 41 countries
unlikely to meet the goal.14
In developing countries, 1 in 5 people
do not use safe water, and roughly
half are without adequate sanitation.
The repercussions are often deadly.
The number of children under five
worldwide dying from diarrhoea
is estimated at almost 2 million
per year; in many countries the
proportion of child deaths due
primarily to diarrhoea is around
20 per cent.15 An estimated 88
per cent of diarrhoeal deaths are
attributed to poor hygiene practices,
unsafe drinking-water supplies and
inadequate access to sanitation.16
Accelerating progress on the
health-related MDGs
The key interventions needed to
address the major causes of child
deaths are well established and
accepted. In fact, research reveals
that only about 1 per cent of deaths
among children under five have
unknown causes and that two thirds
of them are entirely preventable.17
The most basic, yet important, services and practices identified include:
skilled attendants at delivery and
newborn care; care of low birthweight infants; hygiene promotion;
prevention of mother-to-child transmission of HIV and paediatric
treatment of AIDS; adequate nutrition, particularly in the form of
early and exclusive breastfeeding
during the first six months of life;
complementary feeding combined
with continued breastfeeding for at
least two more years; micronutrient
Access to adequate sanitation helps to combat diarrhoea, a prevalent killer of children
worldwide. Practising good hygiene at school, Philippines.
supplementation to boost immune
systems; immunization to protect
children against the six major
vaccine-preventable diseases; oral
rehydration therapy and zinc to
combat diarrhoeal disease; antibiotics to fight pneumonia; and
insecticide-treated mosquito nets
and effective medicines to prevent
and treat malaria.18
Although much has been achieved
so far, implementing these seemingly
simple solutions has proved far more
arduous than experts predicted at the
start of the child survival revolution,
and the results have been more elusive. Increasingly, the development
community is coalescing around several priorities, organized according to
the following categories, which could
provide the impetus needed to
achieve the health-related MDGs:
• Focusing on 60 countries where
the burden of child mortality is
highest.
• Providing a continuum of care for
mothers, newborns and children by
packaging interventions for delivery at key points in the life cycle.
• Strengthening community
partnerships and health systems.
As the subsequent section shows,
action on the first priority is well
under way. Progress has been made
on the second priority, but much
more needs to be done. On the third
priority, despite many pilot projects
C H I L D S U R V I VA L : W H E R E W E S TA N D
15
Figure 1.17
The 60 priority countries for child survival targeted by Countdown to 2015
Source: Countdown to 2015, Tracking Progress in Child Survival: The 2005 report, UNICEF Health Section, New York, 2006, p. 37.
and proven programmes, further
scaling up is urgently required.
Priority 1: Focusing on countries
where the burden of child
mortality is highest
In 2003, concerned that progress on
child survival was behind schedule, a
group of technical experts working
on diverse aspects of child health
came together for a workshop on
child survival in Bellagio, Italy,
sponsored by the Rockefeller
Foundation. Later that year, the
Bellagio Child Survival Group published a series of articles on maternal, newborn and child survival and
health in the British medical journal
16
The Lancet. Called The Child
Survival series, the articles helped
to spur awareness and called for
immediate action to translate knowledge into practice. The group’s work
is now being continued by a new
coalition of scientists, policymakers,
activists and health-programme
managers participating in the Countdown to 2015: Tracking Progress
in Maternal, Newborn and Child
Mortality. The Countdown initiative
is sponsoring a series of conferences
that began in December 2005 and
will take place approximately every
two years until 2015 (the next one
will be held in April 2008 in Cape
Town, South Africa).19
T H E S TAT E O F T H E W O R L D ’ S C H I L D R E N 2 0 0 8
The Countdown gathers data on the
progress countries are making as they
broaden coverage of interventions
that have proved effective in reducing
the deaths of children under five.
Early on it was recognized that
although every region of the world
needed to accelerate progress, countries with the greatest number or
the highest rates of under-five deaths
should be prioritized. To this end,
Countdown to 2015 partners, including UNICEF, have identified 60 priority countries for child survival initiatives, based on two criteria: countries
with more than 50,000 deaths of
children under five and countries with
an annual under-five mortality rate
The continuum of maternal, newborn and child health care across
time and place
The continuum of maternal, newborn and
child health care emphasizes the interrelationship between undernutrition and the
deaths of mothers, newborns and children.
The continuum consists of a focus on two
dimensions in the provision of packages of
essential primary-health-care services:
Figure 1.18
Connecting caregiving across the continuum for
maternal, newborn and child health
• Time: The need to ensure essential services for mothers and children during pregnancy, childbirth, the postpartum period,
infancy and early childhood (see Figure
1.18). The focus on this element was
engendered by the recognition that the
Source: Partnership for Maternal, Newborn & Child Health, <www.who.int/
birth period – before, during and after –
pmnch/about/continuum_of_care/en/index.html>, accessed 30 September 2007.
is the time when mortality and morbidity
risks are highest for both mother and child.
The projected impact of achieving a high rate of coverage
with a continuum of health care could be profound. In subSaharan Africa, achieving a continuum of care that covered
• Place: Linking the delivery of essential services in a
dynamic primary-health-care system that integrates home,
90 per cent of mothers and newborns could avert two
community, outreach and facility-based care (see Figure
thirds of newborn deaths, saving 800,000 lives each year.
1.19). The impetus for this focus is the recognition that
gaps in care are often most prevalent at the locations – the
The paradigm is increasingly being adopted in international
household and community – where care is most required.
public health policies and programmes, and forms the
foundation of the work of the Partnership for Maternal,
The continuum of care concept has emerged in recognition
Newborn & Child Health (see Chapter 2, page 43, for details
of the fact that maternal, newborn and child deaths share a
of the Partnership).
number of similar and interrelated structural causes with
undernutrition. These causes include such factors as: food
See References, page 104.
insecurity, female illiteracy, early pregnancy and poor birth
Figure 1.19
outcomes, including low birthweights; inadequate feeding
practices, lack of hygiene and access to safe water or
Connecting caregiving between houseadequate sanitation; exclusion from access to health and
holds and health facilities to reduce
nutrition services as a result of poverty, geographic or politmaternal, newborn and child deaths
ical marginalization; and poorly resourced, unresponsive
and culturally inappropriate health and nutrition services.
The continuum of care also reflects lessons learned from
evidence and experience in maternal, newborn and child
health during recent decades. In the past, safe motherhood
and child survival programmes often operated separately,
leaving disconnections in care that affected both mothers
and newborns. It is now recognized that delivering specific
interventions at pivotal points in the continuum has multiple
benefits. Linking interventions in packages can also increase
their efficiency and cost-effectiveness. Integrating services
can encourage their uptake and provide opportunities to
enhance coverage. The primary focus is on providing universal coverage of essential interventions throughout the
life cycle in an integrated primary-health-care system.
Source: Partnership for Maternal, Newborn & Child Health,
<www.who.int/pmnch/about/continuum_of_care/en/index.html>,
accessed 30 September 2007.
C H I L D S U R V I VA L : W H E R E W E S TA N D
17
of at least 90 per 1,000 live births.
In 2005, these 60 countries accounted
for 93 per cent of all deaths of children under five worldwide. Of these,
only seven – Bangladesh, Brazil,
Egypt, Indonesia, Mexico, Nepal and
the Philippines – are considered to be
on track to meet MDG 4. In contrast,
19 of the priority countries will need
to achieve annual reductions of 10
per cent or more per year to achieve
the 2015 target.20
Priority 2: Providing a
continuum of care by packaging
interventions and delivering them
at key points in the life cycle
Astonishing results have been
achieved by some child health programmes that target specific diseases
and conditions. These ‘vertical’
interventions, as they are known, are
usually one-time events or diseasespecific in nature, such as immunization campaigns covering one
disease. Lessons from the past,
explored in greater detail in Chapter
2, show that such programmes are
ill-suited to providing the more
comprehensive and sustained care
that mothers, newborns and children
need. More recent experience suggests that even greater progress is
possible if these life-saving interventions were combined into ‘packages’
of care and administered at key
points in the life cycle.
Child health in complex emergencies
Meeting the health needs of children, women and families
presents considerable challenges in peacetime. These
challenges are compounded many times during emergencies, natural or human-made. Yet delivery of health services to populations in general and to children in particular is
especially critical in these contexts. In effect, a significant
proportion of the children who are not currently being
reached through existing interventions live in countries
where the delivery of health services has been severely
disrupted. Between 1989 and 2000, 110 recorded conflicts
took place; 103 of them were civil wars, many of them
protracted, accompanied by institutional collapse and
violence directed against civilians. At present, more than
40 countries, 90 per cent of them low-income nations, are
dealing with armed conflict. UNICEF’s Humanitarian Action
Report 2006 highlighted 29 emergency situations affecting
children and women.
A complex emergency is defined broadly as a situation
of armed conflict, population displacement and/or food
insecurity with associated increases in mortality and malnutrition. Most of the major causes of child mortality in
complex emergencies are the same as the top killers of
children in general. They include measles, malaria, diarrhoeal diseases, acute respiratory infections and malnutrition. These are often compounded by outbreaks of other
communicable diseases, such as meningitis, and nutritional deficiencies that can contribute substantially to child
morbidity and mortality. The highest mortality rates in
refugee populations, for example, tend to occur among
children under five.
Child mortality rates are usually highest during the acute
early phase of a complex emergency. By contrast, in post-
18
emergency settings, where children have remained in stable
refugee camps for prolonged periods, child mortality might
be lower in the refugee population than among neighbouring resident children. Obstacles to the provision of health
care to children in complex emergencies include limited
access, cultural barriers, insecurity, limitations in resources
such as drugs and supplies, and a lack of communication
among the various organizations providing relief.
Community leadership and engagement is especially
critical in these contexts. Contrary to the assumption that
communities in situations of crisis are fragile and tend to
fragment under the stress of war, famine or mass dislocation, research increasingly suggests that some form of
community mobilization is almost always possible and that
important elements of community remain intact and even
gain in importance under conditions of stress. Evidence
from Ethiopia, Malawi and Southern Sudan focusing on
the challenges of treating severe malnutrition in complex
emergencies suggests that the success of an intervention
depends critically on involving key community figures
(such as traditional leaders, teachers and community
health workers), as well as community organizations, volunteer networks and women’s organizations. In addition,
involving traditional heath practitioners can be equally
important, because in many cases they are the first to be
consulted in health-seeking behaviour and can therefore
play a critical role in identifying severely malnourished
children at an early stage.
See References, page 105.
T H E S TAT E O F T H E W O R L D ’ S C H I L D R E N 2 0 0 8
Packaging and integrating proven,
cost-effective interventions – for
example, immunization and vitamin
A supplementation – is efficacious.
It also ensures more comprehensive
care for the children served.
Recently, a package of 16 proven
interventions was identified that
could avert up to 72 per cent of
all newborn deaths. These include
tetanus toxoid immunization,
skilled attendants at birth, access
to obstetric care, immediate and
exclusive breastfeeding, drying and
keeping newborns warm, access to
resuscitation, if needed, special care
of low-birthweight infants and
treatment of infection.21
The timing of these packaged interventions can be crucial. More than
half of all maternal and newborn
deaths occur at birth and during the
first few days of life, but this is also
the period when health coverage is
lowest. An effective continuum of
care (see Panel, page 17) connects
essential maternal, newborn and
child health packages through pregnancy, childbirth, postnatal and
newborn periods, and into childhood
and adolescence. The advantage is
that each stage builds on the success
of the previous stage. For example,
providing integrated services to adolescent girls means fewer unintended
or poorly timed pregnancies. Visits
to a health-care practitioner can
prevent problems during pregnancy
and make it more likely that mothers
will get the appropriate care at birth.
Skilled care before, during and immediately after birth reduces the risk
of death or disability for both the
mother and the baby. Continued
care for children supports their
right to health.
An effective continuum of care also
addresses the gaps in care, whether in
the home, community, health centre or
hospital. Babies with birth asphyxia,
sepsis or complications from a
preterm birth can die within hours
or even minutes if appropriate care
is not provided. Because more than
60 million women in the developing
world deliver at home,22 it is critical
that a skilled attendant be present at
birth with strong backup by a local
health clinic or other first-level facility and the hospital, should complications arise. Quality of care at all of
these levels is crucial.
Priority 3: Strengthening health
systems and community
partnerships
Delivering comprehensive health care
for children requires preventive measures, as well as treatment of illness.
Prevention typically requires behaviour changes that start in the household and can gain support through
the community. Improvements in
nutrition, for example, are often the
result of better infant feeding practices by mothers or other caregivers,
whether through breastfeeding or,
later, by providing a diversified diet
through kitchen or community gardens. Such practices must be learned
by an individual and reinforced by
the community. Wells, pumps and
toilets are important to good hygiene.
But their effectiveness depends on a
community primed to maintain them
and to use them. Children must learn
to wash their hands and practise good
hygiene, habits that are cultivated in
the home, in school and among
neighbours and friends.
As an integral part of the larger
health system, community partner-
ships in primary health care can
serve a dual function: actively
engaging community members as
health workers and mobilizing the
community in support of improved
health practices. They can also
stimulate demand for quality
health services from governments.
Community involvement fosters
community ownership. It can also
add vitality to a bureaucracy-laden
health system and is essential in
reaching those who are the most isolated or excluded. As the following
chapters in this report will show,
many countries, including some
of the poorest in the world, have
implemented successful communitybased health programmes. The
challenge now will be to learn
from their experiences, take the
programmes to scale and reach
the millions of children whom the
health system, so far, has passed by.
Creating a supportive
environment for child
survival strategies
Prospects for child survival are shaped
by the institutional and environmental
context in which children and their
families live. It comes as no surprise,
for example, that infant and child
mortality rates are highest in the
poorest countries, among the most
impoverished, isolated, uneducated
and marginalized districts and communities, and in countries ravaged by civil
strife, weak governance and chronic
underinvestment in public health
systems and physical infrastructure.
Of the 11 countries where 20 per cent
or more of children die before age five
– Afghanistan, Angola, Burkina Faso,
Chad, the Democratic Republic of the
Congo, Equatorial Guinea, Guinea-
C H I L D S U R V I VA L : W H E R E W E S TA N D
19
Empowering women to advance maternal, newborn and child health
Empowering women, especially at the community level,
is essential both to lowering the number of deaths among
children under five and to reaching Millennium
Development Goal 5, which aims to reduce maternal
mortality by three quarters by 2015. Yet the low status
of women in many societies and their limited decisionmaking power within the household often present serious
challenges to achieving significant progress in either area.
Analysis of the data from recent Demographic and Health
Surveys in 30 countries, for example, suggests that in
many households, especially in South Asia and subSaharan Africa, women have little influence in healthrelated decisions in households, whether concerning their
own health or that of their children. In Burkina Faso, Mali
and Nigeria, almost 75 per cent of women respondents
reported that husbands alone make decisions about
women’s health care. In the two countries surveyed in
South Asia, Bangladesh and Nepal, this ratio was around
50 per cent.
This exclusion compromises the health and well-being of
all family members, particularly women and children, and
is often linked to high maternal and child mortality rates –
all five countries mentioned above are among the 60 selected as priority countries for child survival by the Countdown
to 2015 (see Figure 1.17, page 16, for further details). The
situation is often most severe in rural areas or in urban
slums, where women are largely illiterate and suffer from
socio-cultural barriers to accessing health services, such as
restrictions on leaving their homes or on interacting with
strangers, and frequently do not have access to a health
centre or a health clinic.
For example, in Afghanistan, women are prohibited
from receiving health care at hospitals staffed exclusively
by male health personnel, while cultural norms restrict
women from working and receiving advanced medical
training.
Bissau, Liberia, Mali, Niger and Sierra
Leone23 – more than half have suffered
a major armed conflict since 1989.
Similarly, fragile states, characterized
by weak institutions with high levels
of corruption, political instability and
a shaky rule of law, are often incapable of providing basic services to
their citizens.
20
A number of community health worker programmes that
train primarily women have successfully circumvented
gender-based barriers to utilization of health services. In
Bangladesh, the community health workers trained by BRAC
are married, middle-aged women, and their `doorstep’ health
services allow women to circumvent purdah restrictions that
prevent them from leaving their homes to access health facilities on their own. In Pakistan, where in 1999 only about half
the women of childbearing age were immunized against
tetanus, a campaign initiated by the Ministry of Health
succeeded in raising that proportion to 80 per cent of a
target group of 5 million women by relying on home visits
by the Lady Health Workers, who were more acceptable to
women than male vaccinators.
Furthermore, interventions that have enhanced women’s
empowerment and leadership at the community level have
been equally important in improving the health status of
women and children. In Ghana, the prevalence of Guinea
worm disease, which is spread by water and can incapacitate
an infected person for months, required a comprehensive
eradication campaign. Women volunteers, who were more
familiar with the improved water sources than men, conducted door-to-door surveillance, distributed filters, identified
potentially contaminated water supplies and provided community education. As a result, incidence of the disease fell by
36 per cent between 2002 and 2003. Similarly, in Puerto Rico,
a programme to prevent dengue fever, carried out by WHO
and the US Centers for Disease Control and Prevention,
relied on community-nominated women to act as promoters.
The women made house-to-house visits, interviewing heads
of households and inspecting the premises for vector breeding sites. They also engaged in community-awareness activities, including the creation of a dengue prevention exhibit at
the local supermarket. Through this strategy, 20 per cent of
households joined the campaign.
See References, page 105.
Institutional and environmental factors can sometimes be the dominant
factor in child survival. In countries
where AIDS has reached epidemic
levels, for example, combating the
syndrome is the main challenge for
child survival. The scale and nature
of the epidemic is such that all
other interventions will prove
T H E S TAT E O F T H E W O R L D ’ S C H I L D R E N 2 0 0 8
ineffective unless AIDS is addressed.
Countries that suffer from food
insecurity or are prone to droughts
are also at risk of having poorer
child survival outcomes. The inability to diversify diets leads to chronic
malnutrition for children, increasing
their vulnerability to ill health and,
ultimately, death.
© UNICEF/HQ06-2640/Tom Pietrasik
Giving women a voice in making health-related decisions translates into better care for their children. Discussing health care at a
meeting, India.
The challenge of reaching children in
countries with such intractable problems is daunting. Nevertheless, if the
political will is there, there are steps
these countries can take to create a
supportive environment for child
survival and development.
Create laws to protect children
from violence, and see that they
are enforced
Data from countries in the Organisation for Economic Co-operation
and Development (OECD) indicate
that among children under 18,
infants less than a year old face the
second-highest risk of dying by homi-
cide. The risk of death is about three
times greater for children under one
than for those aged one to four, and
the younger the child, the more likely
that death will be caused by a close
family member. Where deaths are not
recorded or investigated, the extent
of fatal violence to children is not
accurately known and may become
obscured by the generally high rates
of under-five mortality. It is assumed
that violence in one form or another
– including neglect – may often play
a part in infant and young child
deaths that are not recorded as homicides or perhaps not recorded at all.
It is widely agreed that violence
against children by family members
results in deaths far more often than
official records suggest.24
Forced marriage is another form
of violence inflicted on children –
and often socially condoned – with
implications for child survival.
When girls give birth before their
bodies are fully developed, there is a
much higher risk of death for both
mother and child. Pregnancy-related
deaths are the leading cause of
mortality for girls 15–19 years old
worldwide, whether they are married or not.25 Those younger than
15 are five times more likely to
C H I L D S U R V I VA L : W H E R E W E S TA N D
21
die in childbirth than women in
their twenties.26 Their children are
also less likely to survive. If a mother is under 18, her baby’s chances of
dying during the first year of life are
60 per cent higher than those
of a baby born to a mother older
than 19.27
In addition to laws that prohibit child
marriage and other forms of violence
against children, a policy of zero
tolerance should be adopted by countries seeking to create an environment
in which children can survive and
thrive. Another essential form of
protection is birth registration of all
children. This legal acknowledgement
of the child’s existence is often required
to access essential services, such as
vaccinations and vitamin A supplementation. It also establishes family
ties where inheritance is an issue.28
Educate and empower women
The latest estimates indicate that,
on average, almost 1 out of every
4 adults (defined here as those age
15 and over) is illiterate. Almost
two thirds are women, according
to the most recent data from the
UNESCO Institute for Statistics.29
Research shows that less-educated
caregivers generally have poorer
access to information on basic
health care than their better-educated
peers.30 This, in turn, can lead to
ill-informed decisions about when
and how to seek care for sick children.31 In contrast, evidence from
Bangladesh shows that a child born
to a mother with primary education
Birth registration: An important step towards accessing essential services
The right to a name and a nationality is well established
by the Convention on the Rights of the Child, which
explicitly calls in article 7 for the registration of a child
immediately after birth. Yet every year the births of
around 51 million children go unregistered. These
children are almost always from poor, marginalized or
displaced families or from countries where systems of
registration are not functional, and the consequences
for their health and well-being are often severe and
long-lasting.
Figure 1.20
Levels of birth registration* are low in South Asia and sub-Saharan Africa
0
20
40
60
80
* Birth registration refers to the percentage of children under five who were registered at the moment of the survey. The
numerator of this indicator includes children whose birth certificate was seen by the interviewer or whose mother or caretaker
says the birth has been registered. Multiple Indicator Cluster Survey data refer to children alive at the time of the survey.
Source: Multiple Indicator Cluster Surveys, Demographic and Health Surveys, other national surveys and vital registration systems.
Country and regional data can be found in Statistical Table 9, page 146 of this report.
22
T H E S TAT E O F T H E W O R L D ’ S C H I L D R E N 2 0 0 8
100
is about 20 per cent more likely to
survive compared to a child born
to a mother with no education; the
odds increase to 80 per cent when
the mother has obtained a secondary education.32
Empowering women socially and
economically can establish another
path towards improving child survival. In many countries, women are
deprived of basic decision-making
responsibilities, even concerning their
own health or that of their children.
It is also well known that when
women are in charge of household
finances, they tend to spend a larger
portion of the household budget on
food and other necessities for children. For these reasons, giving
women the means to become more
economically self-reliant will likely
have positive spin-offs for children.
Promote social equity
Because they are poor and disenfranchised, millions of women and
children have been excluded from
Although sub-Saharan Africa has the highest proportion
(66 per cent) of children not registered at birth, South Asia,
with a corresponding ratio of 64 per cent, has the highest
number. The challenges are particularly daunting in some
countries, such as Afghanistan, Bangladesh, the United
Republic of Tanzania and Zambia, where birth registration
rates are very low due to the absence of effective and
functioning birth registration systems. In Bangladesh and
Zambia, UNICEF estimates that only 10 per cent of births
are registered, while in the United Republic of Tanzania
the registration rate is just 8 per cent.
Birth registration and access to health care in particular are
closely linked, especially for children under five. For instance,
data from several African countries suggest a close correlation between the presence of a skilled attendant at birth and
child registration. In Benin, for example, 74 per cent of children who were delivered by a skilled attendant were registered, as compared to 28 per cent of those who were not.
Furthermore, the data also suggest that birth registration levels are associated with the number of vaccinations received
and with the provision of vitamin A supplementation, as well
as with the level of medical care available. For example, in
Chad, 38 per cent of children receiving vitamin A supplementation have been registered, compared to 15 per cent of those
not receiving supplementation. Conversely, in the absence of
birth registration, in many countries children are denied
access to vital interventions or programmes.
The challenges encountered by parents in registering the
birth of their children often signal and overlap with broader
progress in recent decades. The disparities in child survival prospects
between poor and better-off children
are stark, not only among countries
but within them. For example, in
every country where data are available, children living in the poorest
20 per cent of households are far
more likely to die before their fifth
birthday than children living in the
richest quintile of the population; in
some countries the risk is up to five
times higher.33 Policy interventions to
eliminate these inequalities – that is,
patterns of social exclusion and lack of access to social
services. Thus, particularly in remote areas, parents often
do not see the benefits of their own citizenship, let alone
the benefits that birth registration would confer on their
children. Furthermore, even when parents do plan to register a birth, the high cost of registration and long distances
to registration centres often act as powerful deterrents.
High cost in particular was revealed by a recent UNICEF
analysis to be the primary reason for the lack of birth registration in no fewer than 20 developing countries, resulting
in large registration disparities between rich and poor
children. In the United Republic of Tanzania, where overall
birth registration is very low, there is a strong disparity
between rich and poor, with only 2 per cent of the poorest
fifth of children being registered compared to 25 per cent
of the richest fifth.
Achieving universal birth registration requires governments,
parents and communities to work together to make birth
registration a priority, and an integrated approach – such
as combining national immunization campaigns with birth
registration campaigns – often provides the best strategy.
Where such cooperation has been achieved, it has led to
remarkable results even in the most trying circumstances.
In Afghanistan, in 2003, a nationwide campaign to register
all children under the age of one was combined with the
country’s National Polio Immunization Days. The campaign
was expanded in 2004 and had reached 2 million children
under five by mid-October of that year.
See References, page 105.
C H I L D S U R V I VA L : W H E R E W E S TA N D
23
Child survival in post-conflict situations: Liberia’s challenges
and triumphs
by Ellen Johnson-Sirleaf, President of Liberia
According to the Women’s Commission for Refugee
Women and Children, based in New York, a society’s treatment of children is a reflection of its worth. In the case of
post-conflict Liberia, the country’s fate is inextricably tied to
the fate of its most vulnerable population. The survival of
children in Liberia is a fundamental underpinning of our
development agenda because it shapes how we progress
as a nation.
The impact of conflict on the survival of Liberia’s children
is stark: At 235 deaths per 1,000 live births, Liberia’s underfive mortality rate is the fifth highest in the world; its infant
mortality is the third highest and maternal mortality the
twenty-first highest. Maternal mortality trends are an
important benchmark for achieving Millennium Development
Goal 4 and other health-related MDG targets for children
because maternal health bolsters child survival – and
without a sound policy on women’s development and
empowerment, children in any post-conflict situation will
ultimately be neglected reminders of a nation’s failures.
It is disconcerting that, despite all the improvements in
modern medicine, children under five in Liberia still perish
because of malaria (18 per cent of total deaths), diarrhoea
and vaccine-preventable diseases, such as measles, neonatal tetanus, diphtheria, whooping cough and acute respiratory infections. Underlying these conditions are chronic
malnutrition and vitamin and mineral deficiencies, which
are common in children under five. Fifty-one per cent of
the population is food insecure. HIV infection in pregnant
women is estimated at 5.7 per cent in 2007 compared to
4 per cent in 2004 – another example of the impact of 15
years of conflict and the structural problems in the economy that disadvantage women and girls.
serve as the ‘road map’ to reducing maternal mortality are
under way. Peace has allowed immunization for young
children and pregnant women to increase significantly.
The challenges remain, however.
Safe water, essential for survival, had been available in
the large population centres, including Monrovia, Liberia’s
capital, prior to the conflict, but most of the piped systems
were destroyed. Currently, other than Monrovia, where the
piped water system is being gradually rehabilitated, urban
centres are without access to pipe-borne water. Children
cannot survive, much less thrive, without safe, potable
drinking water, which stands at a low 32 per cent currently
in Liberia.
Health and education are the pillars of any sound child survival strategy. The two are opposite sides of the same coin
and must be tackled simultaneously in Liberia to ensure
MDG 4. Illiteracy is high in the population, estimated at
68 per cent (male 55 per cent and female 81 per cent);
literacy and education, especially of girls, are closely associated with improved child survival rates. The 2006 Girls’
Education Policy aims to provide education to all girls. In
order to ensure child survival, girl children also need to
be protected. The conflict left many young girls pregnant
or already mothers. Special efforts are needed to protect
adolescent girls from sexual exploitation and abuse, from
pregnancy and AIDS, both to ensure they enjoy their own
rights to survival and to guarantee the rights of their children.
There needs to be renewed momentum around the issue
of child survival, and Liberia is leading that clarion call. We
want to ensure that our children move beyond survival and
into a phase of development that enables them to thrive
and transform into productive citizens.
Access to basic health care is improving, but coverage and
distribution remain inadequate, especially in the rural areas.
The task of achieving universal access is enormous, owing
to such devastating effects of armed conflict as the destruction of health infrastructure, low availability of trained
health workers and low public sector resources for health.
The Government of Liberia is making strenuous efforts to
significantly reduce child morbidity and mortality by 2011. A
national health policy and plan of action leading to universal
access have been developed and are being implemented,
while a national strategy and plan to accelerate child survival has been developed. A strategy and plan of action to
24
T H E S TAT E O F T H E W O R L D ’ S C H I L D R E N 2 0 0 8
bringing child mortality rates in the
poorest 80 per cent of the population
up to par with those of the richest
20 per cent – would have a dramatic
effect on the under-five mortality
rate for a country as a whole.34
Worldwide, about 40 per cent of
under-five deaths could be prevented
in this way.35
Children are also excluded from
health services by discrimination,
geographic isolation, low levels of
parental education, AIDS at epidemic
levels and complex emergencies, such
as armed conflict and natural disasters. Many children are affected by
these circumstances simultaneously,
which further decreases the likelihood that life-saving interventions
will reach them.
Successful approaches used to
tackle these inequities include programmes that bring health interven-
tions to those who are hardest to
reach. Subsidizing health care for
the poor and directing social marketing to those who have been
excluded are other options. Perhaps
most crucial is ensuring that equity
is a priority in the design of child
survival interventions and delivery
strategies. Doing so will require
a thorough knowledge of the situation through the collection of
survey data, which can also be
used for education and advocacy.
Regular monitoring must be instituted along with mechanisms to
ensure accountability, both at
national and international levels.
Rising to the challenge of
providing a continuum of care
for mothers, newborns and
children
children currently excluded from
essential services. The main challenge
to child survival no longer lies in
determining the proximate causes
of or solutions to child mortality but
in ensuring that the services and education required for these solutions
reach the most marginalized countries and communities. As the rest
of this report will show, many countries, including some of the poorest
in the world, have made significant
strides in reaching large numbers of
children and families with essential
services. Effective scale-up, however,
requires that we learn from the
lessons of recent decades – with a
particular emphasis on strengthening
integrated approaches to child health
at the community level.
These are the types of challenges that
health-care providers face in reaching
C H I L D S U R V I VA L : W H E R E W E S TA N D
25
The marked decline
in deaths among
infants and children in many parts
of the world during the past century
is one of the greatest success stories
in international public health. It has
also had a profound positive effect
on life expectancy. A closer look at
these generally favourable trends,
however, reveals that progress has
been unevenly distributed. In some
countries and regions, advances
have sharply decelerated since the
1990s. In Southern Africa, infant and
under-five mortality have increased
as AIDS reduces life expectancy and
increases mortality from opportunistic infections, tuberculosis, malaria
and undernutrition. Maternal mortality, meanwhile, remains unacceptably high in Africa and South Asia,
with scant advances registered over
the past decades.
SUMMARY
With the 2015 target date of the
Millennium Development Goals
(MDGs) drawing near, and with
many countries making insufficient
progress on all of the targets, critical questions arise, namely: How
can momentum on maternal, newborn and child survival be recaptured and progress accelerated in
the next eight years? What levels
of maternal mortality reduction can
be realistically achieved in this
same time period? How should
countries set priorities in maternal,
newborn and child health?
An examination of different approaches to the delivery of essential
services from the beginning of the
20th century to the present demonstrates that a range of effective
interventions and policies holds
the most potential for accelerated
More focus is needed on strategies to
accelerate progress in the continuum of
health care for mothers, newborns and
children. A clinic at a refugee camp, The
former Yugoslav Republic of Macedonia.
progress. These life-saving measures include applying proven, cost
effective health, nutrition, water,
sanitation and hygiene, and HIV and
AIDS interventions across a wider
range of settings in order to deliver
quality health care to women and
children. They also include reducing
barriers to access and mobilizing
additional financial and human
resources. A focus on results
requires strategies that build on
the collective knowledge on maternal, newborn and child survival
and health in order to identify the
solutions that work best for each
country and community.
T H E S TAT E O F T H E W O R L D ’ S C H I L D R E N 2 0 0 8
Lessons learned from evolving
health-care systems and practices
results-oriented, evidencebased approach to formulating a continuum of
quality primary health
care for mothers, newborns and children necessitates reviewing the best
information, data and analysis to
arrive at the most useful lessons
that can inform current and future
actions. A requisite step involves a
closer examination of the diverse
approaches currently employed to
deliver essential health services for
children and mothers.
© UNICEF/HQ99-0390/Mark Thomas
A
ences between any two of these
strategies are far from sharp, since
each one of them has emerged partly
as a response to the limitations of the
previous strategy. The subsequent historical review of the accomplishments
and the remaining and emerging challenges of health-care systems and
public health practices during the
past century, even though brief, provides important perspectives on the
current situation and helps guide
the way forward.
The colonial period: 1900–1949
These range from initiatives targeted
towards a single disease or condition,
such as measles or undernutrition, to
the ideal of providing a continuum
of comprehensive primary health
services that integrate hospital and
clinical facilities, outpatient and
outreach services, and household
and community-based care.
Until the dawn of the 20th century,
deaths of infants and children were
very common worldwide. High mortality and disability from such causes as
diarrhoea, malaria, measles, pneumonia, smallpox, tuberculosis and various
forms of undernutrition affected a large
proportion of the world’s population.
Intense debate on the relative merits
of each of the major interventions
and policy changes, particularly on
the benefits and constraints of the
most comprehensive strategies compared with more selective ones, has
taken place over the years, resulting
in an extensive literature. The differ-
By 1900, the world population
numbered around 1.65 billion. At
that point, although some gains in life
expectancy had already been observed
in several places – such as England
and the Scandinavian countries – the
estimated global average life expectancy was only about 30 years.1
2
Early in the 20th century, efforts to
control infectious diseases, such as
hookworm, malaria and yellow fever,
would set the basis of future disease
control interventions. In the first half
of the century, a few key malaria
programmes were developed, linking
research into the disease with control
of it on the African continent. These
preliminary efforts were fragmented,
undertaken by colonial governments
focusing on colonial territories and
workforces. Despite their narrow
focus, some of the initiatives – for
example, malaria control from 1930–
1950 in and around copper mines in
what is present-day Zambia – were
quite successful.
All the colonial health services had
sharply segregated health facilities that
gave priority to their expatriates and
military. In anglophone Africa and
India, research on exotic diseases led
to tropical specialties and programmes.
Few medical schools admitted local
students, and then only as part of the
‘golden handshake’ that accompanied
independence for many developing
countries in the 1950s and 1960s.
Health services for the people were
pioneered mostly by missions and
27
mostly consisted of facility-based
care. Training of local staff started
with nursing schools. Because of the
overwhelming workload, male and
female nurses were soon running
most peripheral services. District
governments in some countries started clinics and small district hospitals,
but in most countries mission hospitals provided 50–80 per cent of
hospital beds. Public health focused
on environmental protection, in
particular on early efforts to provide
safe water and improved sanitation
facilities in urban areas.
Health services in francophone
and other European colonies were
uniquely different from those in
anglophone countries, since the
latter placed great emphasis on
the Grandes Endémies programme.
In this, separate levels of a national
network focused on a single disease,
such as sleeping sickness, elephantiasis, leprosy and other high-prevalence
conditions affecting the capacity
to work. Mass care was provided
by mobile units, often generously
equipped with complete travelling
facilities. The rationale was that
relying on outreach to treat patients
at mass gatherings was more effective
in reaching larger numbers of people
than investing in static facilities.
Repetitive cycles of treatment focused
on simple curative interventions rather
than on prevention and control.
As in Africa, the early Chinese
hospitals were mainly established by
missions. A national public health
system began in the 1920s with
efforts to control the rapidly spreading pneumonic plague in the province
of Manchuria.
An important historical footnote is
that the first published case study
of successful community-based primary health care concerns a project
of this period. The project took
place in Ding Xian (formerly Ting
Hsien), about 200 kilometres south
of Beijing. In this province of about
half a million people, health care
was provided by health workers
who were the forerunners of
China’s ‘barefoot doctors’. For a
quarter of a century and for more
than a fifth of the world’s population, China had one of the most
equitable health systems ever
The Measles Initiative
The Measles Initiative shows how a well resourced, targeted
and managed global vertical initiative can reach scale rapidly
and produce dramatic results. The initiative is a partnership
that groups UNICEF and WHO with other leading international
agencies and prominent private organizations. Launched in
2001, the Measles Initiative adopted the goal set at the UN
General Assembly Special Session on Children in May 2002 to
reduce deaths due to measles among children between 1999
and 2005. It has been the main sponsor of the mass campaign to boost measles vaccination, which has resulted in
vaccinating more than 217 million children between 2001
and 2005 – mostly in Africa.
The results have exceeded the UN target: Measles deaths
fell by 60 per cent between 1999–2005. Africa contributed
72 per cent of the absolute reduction in deaths. Estimates
concluded that immunization helped avert almost 7.5 million
deaths from the disease.
The reduction in measles deaths reflects support and commitment by the Measles Initiative to boosting immunization
coverage and by national governments to following the
WHO/UNICEF comprehensive strategy for reducing measles
mortality. The strategy consists of four key components:
28
• Provide at least one dose of measles vaccine, administered
at nine months of age or shortly after, through routine
vaccination coverage of at least 90 per cent of children in
each district and nationally.
• Give all children a second opportunity for measles vaccination.
• Establish effective surveillance.
• Improve clinical management of complicated cases –
including vitamin A supplementation.
Measles control activities are contributing to health-system
development in several ways – for example, through
promoting safe injection practices, developing enhanced
cold chain capacity for vaccination storage and establishing
the development of a global public health laboratory
network. In addition, vaccination campaigns are often
combined with such other essential interventions as
vitamin A supplementation, deworming medicines and
the distribution of insecticide-treated mosquito nets.
A new global goal was set at the World Health Assembly in
May 2005 – to reduce measles deaths by 90 per cent by 2010,
T H E S TAT E O F T H E W O R L D ’ S C H I L D R E N 2 0 0 8
designed. This experience provided
important lessons for planning the
1978 International Conference on
Primary Health Care that took
place in Alma-Ata, Union of Soviet
Socialist Republics (now Almaty,
Kazakhstan).
Mass disease control
campaigns: 1950–1977
ogy delivered by dedicated health
workers.3
By 1950, the population of the
world exceeded 2.5 billion, and
global average life expectancy had
risen to 47 years.
Early in the century, such countries
as Denmark, the Netherlands,
Norway and Sweden managed to
reduce maternal mortality very
quickly. The way in which skilled
attendance at birth was organized
appears to have been the major factor contributing to these gains. In the
case of these four countries, efforts
focused on providing professional
care close to where women lived,
mainly by enhancing the skills of
community midwives.2
The 1950s, 1960s and 1970s witnessed a number of disease control
efforts, often termed ‘mass campaigns’
or ‘disease-focused responses’. These
efforts employed scientifically sound,
epidemiologically proven interventions
through free-standing programmes
designed to combat a specific disease
or condition. Often characterized
by clearly defined goals, they included time-delineated targets for either
the reduction or the eradication of
the disease, using a specific technol-
The most successful of these campaigns was the smallpox eradication
initiative, which reported its last
case of human-to-human transmission in 1977. Other mass campaigns
have been successful in eradicating
or substantially reducing such
illnesses as Guinea worm disease,
trachoma and yaws.
Figure 2.1
Global burden of measles deaths*
The success of the smallpox eradication campaign was a key element
informing the design of possibly the
most successful preventive public
health programme in history – the
Expanded Programme on Immunization (EPI), launched in 1974. EPI
initially aimed to vaccinate children
and Pakistan. There is some way to go in the fight against
measles – 345,000 people died of the disease in 2005, and
90 per cent of them were children under five. This highly
contagious disease remains an important cause of under-five
deaths, accounting for about 4 per cent of the global burden.
It weakens children’s immunity to other life-threatening diseases and conditions, including pneumonia, diarrhoea and
acute encephalitis, and remains one of the leading causes
of vaccine preventable deaths among children.
Source: World Health Organization estimates published in The Lancet,
vol. 369, 20 January 2007, p. 194
The success of efforts to reduce measles in 1999–2005 has
shown what can be done if political will, financial commitment
and sound strategies on the part of international partners and
national governments are implemented to deliver proven,
cost-effective treatments. Provided that this degree of commitment is sustained, there is every reason to believe that the
new target can be met, helping advance progress towards
Millennium Development Goal 4.
compared to 2000 data. The target is challenging, and its
attainment will require sustaining the progress made in those
countries that performed well and making large inroads in
countries with high numbers of measles deaths, such as India
See References, page 106.
* Regions refer to World Health Organization regions.
L E S S O N S L E A R N E D F R O M E V O LV I N G H E A LT H - C A R E S Y S T E M S A N D P R A C T I C E S
29
against six target diseases – diphtheria,
tetanus, pertussis (whooping cough),
polio, measles and tuberculosis – during their first year of life. When the
programme began, less than 5 per cent
of the world’s children were immunized
against these diseases. The most recent
statistics show that global immunization rates, as measured by coverage
of the diphtheria, tetanus and pertussis vaccines, now exceed 75 per cent.
Early in the history of mass campaigns, the various approaches used
to deliver health services were often
described as either ‘vertical’ (or ‘categorical’) or ‘horizontal’ approaches.
These distinctions were measures,
in essence, of two dimensions in
programme structure:
• The degree to which programme
management was integrated into
general health-system management,
especially at lower management
levels (horizontal), as opposed
to strictly separate management
positions (vertical).
• The degree to which health workers had one function (vertical),
as opposed to many functions
(horizontal).4
The relative merits and constraints of
vertical and horizontal approaches
are well documented, and a comprehensive review of the debate is
beyond the scope of this retrospective. In many ways the merits of one
reflect the constraints of the other.
Primary health care:
1978–1989
The International Conference on
Primary Health Care held in Alma-
30
Ata in 1978 came about as a result
of successful innovations in community health care developed after
World War II in resource-poor
settings. These included under-five
clinics in Nigeria, community health
workers in Indonesia, barefoot
doctors in China, and the health
systems of Cuba and Viet Nam.5
The Alma-Ata conference and its
accompanying declaration were
milestones of major importance.
The conference was, at the time, the
largest conference ever held on a
single theme in international health
and development – 134 nations
and representatives from 67 nongovernmental organizations and the
United Nations attended. By crystallizing innovative concepts that
were to become conventional wisdom it paved the way to such major
global commitments as Health for
All by the Year 2000, agreed to
at the Alma-Ata conference, the
commitments made at the World
Summit for Children in 1990 and,
more recently, the Millennium
Declaration and the Millennium
Development Goals.
The primary-health-care approach
that emerged from Alma-Ata
encompasses the tenets of equity,
community involvement, intersectoral collaboration, use of appropriate technology, affordability
and health promotion. These have
become guiding principles in the
development of health systems that
take into account broader population health issues, reflecting and
reinforcing public health functions;
that emphasize the integration of
care across time and place; that
link prevention, acute care and
chronic care across all components
T H E S TAT E O F T H E W O R L D ’ S C H I L D R E N 2 0 0 8
of the system; that evaluate and
strive to improve performance; and
that return to the population health
criteria as the basis for decisionmaking affecting how health-care
services are organized, financed
and delivered to individuals and
communities.6
The Alma-Ata Declaration recommended that primary health care
include, at a minimum, the following
activities:
• Health education.
• Promotion of adequate supplies of
food and proper nutrition.
• Safe water and basic sanitation.
• Maternal and child care.
• Immunization against the major
childhood diseases.
• Appropriate treatment of common
diseases and injuries.
• Prevention and control of locally
endemic diseases.
• Provision of essential drugs.
The district health system concept,
also known as ‘catchment area focus’
or the ‘small area’ or ‘intermediate
group’ approach in Europe and other
countries, was subsequently developed
by the World Health Organization as
a model for the implementation of
primary health care.7
Despite the many benefits of primary
health care, its implementation suffered from unfavourable economic
climates – particularly in the 1980s –
Selective primary care and the
child survival revolution: 1980s
At the outset of the 1980s, child
health continued to constitute a
‘silent’ emergency, as close to 15
million children were still dying
annually before their fifth birthday.
In the late 1970s, two scientists,
Julia Walsh and Kenneth Warren,
published ‘Selective Primary Health
Care: An interim strategy for disease
control in developing countries’ – a
milestone paper that proposed an
alternative strategy for rapidly reducing infant and child mortality at a
reasonable cost.9 After breaking
down the relative role of each major
cause of child mortality and listing
the existing interventions proved to
be effective in addressing them, they
concluded that a small number of
causes (diarrhoea, malaria, respiratory diseases and measles, among
others) were responsible for the vast
majority of under-five deaths and
that these deaths could be easily
prevented by immunization (only
15 per cent of the world’s children
were immunized at the time), oral
rehydration therapy, breastfeeding
and antimalarial drugs.10 Their
research came at a critical moment
in the debate on the relative merits
of horizontal versus vertical approaches and on whether the principles
of comprehensive primary health
care could translate into effective
programmes.
The result was a new strategy known
as ‘selective primary health care’.11
Introduced a year after the Alma-Ata
Declaration, this strategy was initially seen as a first step towards the
implementation of comprehensive
primary health care, but it quickly
became a model in its own right.
Integrating key elements of vertical
approaches by targeting the diseases
identified as the most important contributors to high infant and child
mortality rates, it was intended to be
more focused and more feasible than
primary health care.12
The ‘child survival revolution’, spearheaded by UNICEF and launched in
1982, was based on this framework.
It focused on four low-cost interventions collectively referred to as GOBI
– growth monitoring for undernutrition, oral rehydration therapy to treat
childhood diarrhoea, breastfeeding to
ensure the health of young children
and immunization against six deadly
childhood diseases. GOBI was supported by major programmes led
by WHO, including the Expanded
Programme on Immunization and
programmes to control diarrhoeal diseases and acute respiratory infections.
Subsequently, GOBI added three more
components – food supplementation,
family spacing and female education –
and became GOBI FFF.13 Global
advocacy efforts concerning the
importance of these basic interventions for child survival were successful
in encouraging a large number of
countries to create their own national
systems to promote and deliver key
interventions.14 From the outset, selec-
© UNICEF/HQ06-2765/Bruno Brioni
that triggered a significant withdrawal by states from provision of such
public services as health care, water
distribution, waste disposal and food
quality control. This situation led to
the near collapse of peripheral health
services in many developing countries, as well as to a decline in support for community health work.8
Immunization has proved to protect children from major childhood diseases. A
child receives DPT3 vaccine, Côte d’Ivoire.
tive primary health care received solid
support from donors keen on channelling resources into ‘child survival’
programmes. These initiatives retained
their community-oriented primaryhealth-care roots, but at the same time
held the appeal of using relatively
inexpensive medical technologies to
reach specific objectives.
Selective primary care initiatives have
proved relatively successful in recent
decades. GOBI FFF and the World
Health Organization’s initiatives are
credited with contributing to notable
improvements in primary-health-care
coverage, particularly immunization
and oral rehydration therapy. These
efforts undoubtedly contributed to
L E S S O N S L E A R N E D F R O M E V O LV I N G H E A LT H - C A R E S Y S T E M S A N D P R A C T I C E S
31
the sharp fall in the global under-five
mortality rate, from 115 per 1,000
live births in 1980 to 93 in 1990 –
a reduction of 19 per cent over the
course of the decade.
Focusing on integrated,
sector-wide approaches
and health systems: 1990s
Despite the gains of selective primary
health care, by the late 1980s, health
systems in many developing countries
were under severe stress. Population
growth, the debt crisis in many Latin
American and sub-Saharan African
countries, and political and economic
transition in the former Soviet Union
and Central and Eastern Europe were
but three of the contributing factors.
In response, a number of countries
embarked on efforts to reform deteriorating, under-resourced health
systems, raise their effectiveness,
efficiency and financial viability,
and increase their equity.
The Bamako Initiative
One such approach used by many
countries was the Bamako Initiative,
which was launched in 1987 at the
World Health Organization meeting of
African health ministers in Bamako,
Mali. This strategy focused on increasing access to primary health care and
meeting basic community needs in
sub-Saharan Africa by delivering an
integrated minimum health-care package through health centres. A strong
emphasis was placed on access to
drugs and regular contact between
health-care providers and communities. (See Panel, page 36, for further
details on the Bamako Initiative.)
Integration
The emphasis on integrating essential
services that was a central feature of
the Bamako Initiative was to become
the driving force of approaches in the
1990s. Integrated approaches sought
to combine the merits of selective primary care and primary health care.
Like selective approaches, they placed
a strong emphasis on providing a core
group of cost-effective solutions in a
timely way to address specific health
challenges; like primary health care,
they also focused attention on community participation, intersectoral
National immunization days and child health days
National immunization days (NIDs) originated as one-day
mass polio vaccination campaigns across the developing
world. NIDs, which still take place in many countries, are
supplementary and do not replace routine immunization.
Their original aim was to prevent the spread of polio by
immunizing all children under the age of five, regardless
of their previous polio vaccination history.
The concept of setting aside a day for mass interventions
on child health is not new. Successful trials of days
took place in the 1980s in such places as Burkina Faso,
Colombia and Turkey. More recently, active civil wars have
been halted to provide days of tranquility that allow children to be safely vaccinated in such countries as Angola,
Sierra Leone and Somalia. Mass vaccinations allow for
economies of scale, as skilled professionals can supervise
a cadre of volunteers, especially for oral polio vaccine,
which does not require a needle and syringe.
Child health days have expanded the scope of interventions beyond polio immunization to include vitamin A
supplementation, and in the case of Zimbabwe, distribution of insecticide-treated mosquito nets and other
immunizations. Other countries that conduct similar
events include Nepal and Nigeria.
32
Nepal’s national vitamin A programme is particularly
noteworthy because it employs an existing network
of female community health volunteers to deliver the
supplements. The programme is found to be highly
cost-effective, with a cost per death averted estimated
at US$327–$397, while the cost per disability-adjusted
life year (DALY) gained was approximately US$11–$12.
The programme was steadily expanded, from the original 32 priority districts to cover all 75 districts, in annual
increments of 8–10 districts over an eight-year period.
Expansion was assisted by using national immunization
days to advance coverage.
Integrating the delivery of a range of interventions in
a single location and at a single point in time, child
health days are efficient for both households and
health service providers. Related concepts, such as
child health weeks, are enhancing the opportunities to
reach a large number of usually excluded children with
essential interventions.
See References, page 106.
T H E S TAT E O F T H E W O R L D ’ S C H I L D R E N 2 0 0 8
collaboration and integration in the
general health-delivery system.
facilities, let alone those with more
challenging circumstances.
A long-standing example of the
greater emphasis on integration during the 1990s is IMCI, the Integrated
Management of Childhood Illness.
Developed in 1992 by UNICEF and
WHO, and employed in more than
100 countries since then, IMCI
adopts a broad, cross-cutting
approach to case management of
childhood illness, acknowledging
that there is usually more than one
contributing cause.15 Indeed, in
many cases, sick children exhibit
overlapping symptoms of disease,
complicating efforts to arrive at a
single diagnosis even in communities
with adequate first-level examination
IMCI strategies have three primary components, each of which
requires adaptation to the country
context:
• Improving health worker performance: This involves training health
workers to assess symptoms of
diseases, correct mapping of illness
to treatment, and provision of
appropriate treatment to children
and information to the caregivers.
Through provision of locally
adapted guidelines, health staff are
taught case management skills for
five major causes of childhood
mortality: acute respiratory
infections, especially pneumonia;
diarrhoeal diseases; measles;
malaria; and undernutrition.
• Improving health systems: This
component seeks to strengthen
health systems for effective management of childhood illnesses.
Measures employed include supporting drug availability, enhancing
supervision, strengthening referral
and deepening health information
systems. Planning guides are provided for managers at the district
and national levels.
• Improving community and family
practices: The final component is
often referred to as Community
Integrated Management of
Health sector financing: Sector-wide approaches and the Heavily
Indebted Poor Countries Initiative
During the 1990s, concerns escalated about the potential
predominance of vertical approaches, which tend to create and utilize managerial, operational and logistical
structures separate from those of the national health
system to address disease control. These concerns contributed to the development of a new mode of health
financing: sector-wide approaches (SWAps). Under
SWAps, the major funding contributions for the health
sector support a single plan for sector policy, strategy and
expenditure backed by government leadership. Common
approaches to health service delivery are adopted across
the sector, and government procedures increasingly control the disbursement and accounting of funds.
SWAps were created for several purposes: to address the
limitations of project-based forms of donor assistance,
ensure that overall health reform goals were met, reduce
large transaction costs for countries and establish genuine partnerships between donors and countries in
which both had rights and responsibilities. SWAps are
a dynamic process rather than an end point, and they
display considerable variation across countries. SWAps
have led to greater dialogue and trust, a sharper focus on
a select number of key sector priorities and closer links
between policy and implementation. However, constraints include an overemphasis on details in planning
and the development of procedures; limited civil society
participation; weak performance management; and a
slow shift from emphasizing donor coordination to
considering service improvement and results.
At the end of the 1990s, in the context of the Heavily
Indebted Poor Countries Initiative implemented by the
International Monetary Fund and the World Bank, the
focus on the health sector and financing reform in many
low-income countries broadened to include Poverty
Reduction Strategy Papers (PRSPs). Medium-term
expenditure frameworks, the multi-annual public planning instruments associated with PRSPs, are used to plan
future budget requirements for public services and to
assess the resource implications of policy changes and
new programmes.
See References, page 106.
L E S S O N S L E A R N E D F R O M E V O LV I N G H E A LT H - C A R E S Y S T E M S A N D P R A C T I C E S
33
© UNICEF/HQ06-2720/Shehzad Noorani
Approaches to the delivery of primary health care must be tailored to the needs and
resources of each individual country and community. A nurse measures the blood pressure
of a pregnant woman, Bangladesh.
Childhood Illness (C-IMCI). It
is based on the basic household
practices for families and communities outlined in the Panel in
Chapter 3, page 47.16
The integration of case management
seeks to protect children from, and
offer treatment for, all major diseases,
not just one or two. It also emphasizes adapting curative solutions to
the capacity and functions of local
health systems, along with promoting
disease prevention by educating
health workers and caregivers on
the importance of essential services.
The role of parents and other primary
34
caregivers in detecting common
symptoms of ill health, taking children
to health facilities and implementing
such preventive measures as appropriate feeding and hygiene practices
is critical.
Integrated Management of
Childhood Illness has been rigorously evaluated since its inception in
the mid-1990s. Several agencies –
including WHO, UNICEF, the
United Kingdom’s Department for
International Development (DFID)
and the United States Agency for
International Development (USAID)
– conducted multicountry evalua-
T H E S TAT E O F T H E W O R L D ’ S C H I L D R E N 2 0 0 8
tions in the early 2000s. In 2004
and 2005, UNICEF also reviewed
the community and family component (C-IMCI).17 Although initial
results were disappointing, mainly
because of incomplete implementation of the three core IMCI components, later results have demonstrated some notable successes.
According to studies, IMCI case
management has enhanced the
quality of health care delivered
in first-level facilities, motivated
health workers and managers, and
improved health worker performance. And it has been implemented
at costs equivalent to or lower than
those of existing services.18
Positive results for IMCI have been
noted in several countries in subSaharan Africa. A study conducted in
rural districts of the United Republic
of Tanzania, for example, found that
those districts implementing a healthsystem-strengthening initiative and
IMCI demonstrated a 13 per cent
greater reduction in child mortality
than control districts.19
Survey results in Malawi, South
Africa, the United Republic of
Tanzania and Uganda indicated
that wide-scale implementation of
the C-IMCI strategy can result in significant improvement in some of the
key family practices, such as steps to
improve nutrition and early survival,
disease prevention, home care or careseeking for sick children, and provision of a supportive environment for
child growth and development.20
Successes such as these have led
health policy experts to recommend
the development of national policies
based on country priorities, with
Integrated Management of Neonatal and Childhood Illnesses in India
During the 1990s, India experienced marked reduction in
the under-five mortality and infant mortality rates. These
trends were not been matched by declines in the rate of
neonatal deaths. By 2000, neonatal deaths were around
two thirds of all infant deaths in the country, and around
45 per cent of under-five deaths. Close to half of neonatal
deaths occur in the first week of life. Many of these deaths
could be averted if parents recognized warning signs,
undertook appropriate feeding practices or had access
to skilled health workers and facility-based care.
health workers and promoting community participation – all
with additional emphasis on neonatal health and survival.
In 2000, the Government of India adapted the Integrated
Management of Childhood Illness (IMCI) strategy to focus
greater attention on neonatal care. The resulting approach,
Integrated Management of Neonatal and Childhood
Illnesses (IMNCI), modifies IMCI with specific actions taken
to promote neonatal health and survival. Like IMCI, IMNCI
supports three pillars for the effective delivery of essential
services to neonates, infants and young children: strengthening health-system infrastructure, enhancing the skills of
IMNCI is incorporated as part of the government’s
Reproductive and Child Health II programme, an integrated
approach to women’s health that aims to provide a continuum of care from birth until adulthood. The additional cost
of adding the newborn component, mostly the home visits,
is just US$0.10 per child.
clearly defined roles for IMCI and
other child health interventions, and
the need to critically analyse and
address the system constraints.21
Stimulated by a series of studies on
maternal, newborn and child survival
published by The Lancet, integrated
models of health care have been
developed within the context of the
maternal, newborn and child health
continuum of care (see Chapter 1,
page 17 for further details on the
continuum of care and the partnership). In effect, the continuum of
care concept expands IMCI to
include integrated management
of neonatal illness.22 Successful
preliminary experience with the
new approach, called the Integrated
Management of Neonatal and
Childhood Illnesses (IMNCI) has
been pioneered and fully implemented in India (see Panel above).
In practice, IMNCI consists of three home visits in the first
10 days after birth to promote best practices for the young
child; a special provision at the village level for follow-up of
infants with low birthweights; reinforcement of messages
through meetings of women’s groups and establishing a
linkage between the village and the home; and assessment
of the child at local health facilities based on referral.
See References, page 106.
Figure 2.2
Selective primary health care and trends in immunization
rates since 1980
Source: Data provided by Strategic Information Section, United Nations Children’s Fund.
L E S S O N S L E A R N E D F R O M E V O LV I N G H E A LT H - C A R E S Y S T E M S A N D P R A C T I C E S
35
The Bamako Initiative
The Bamako Initiative, sponsored by UNICEF and WHO
and adopted by African ministers of health in 1987, was
based on the realization that, despite accepting in principle the core tenets of comprehensive primary health
care, by the late 1980s many countries – especially in
sub-Saharan Africa – were burdened by a lack of
resources and practical implementation strategies. In
particular, many health facilities lacked the resources
and supplies to function effectively. As a result, health
workers were sometimes merely prescribing drugs to
be bought from private outlets, often unlicensed and
unsupervised, while many patients had lost confidence
in the inefficient and under-resourced public health facilities. All of these developments threatened to reverse the
gains of the 1980s. The core challenges were to promote
additional donor investment, stop and reverse the
decline of government expenditure on social spending in
general and health in particular, and attract the money
spent in the private and informal sectors back into the
public system.
The Bamako Initiative aimed to increase access to primary health care by raising the effectiveness, efficiency,
financial viability and equity of health services. Bamako
health centres implemented an integrated minimumhealth-care package in order to meet basic community
health needs, focusing on access to drugs and regular
contact between health-care providers and communities.
Based on the concept that communities should participate
directly in the management and funding of essential drug
supplies, village committees engaged in all aspects of
health-facility management, with positive results for child
health in West Africa in particular.
The purpose of community financing was to capture a
fraction of the funds households were already spending
in the informal sector and combine them with government
and donor funding to revitalize health services and
improve their quality. The most effective interventions
were priced below private sector charges and crosssubsidized through higher markup and higher co-payments
on lower priority interventions. Immunization and oral
rehydration therapy were supplied free of charge. Local
criteria for exempting the poor were established by the
communities.
Although countries followed different paths in implementing the Bamako Initiative, in practice they had a common
core objective: providing a basic package of integrated
services through revitalized health centres that employ
user fees and community co-management of funds. A
36
number of common support structures were organized
around this core agenda, including the supply of essential
drugs, training and supervision, and monitoring.
‘Going to scale’ was a critical step in the implementation
process. The pace of expansion varied depending on
the availability of internal and external resources, local
capacity, the need to work at the speed of community
needs and pressure from governments and donors.
Most of the sub-Saharan countries that adopted the
Bamako Initiative employed some form of phased
scaling up, and several countries – most notably Benin,
Mali and Rwanda – achieved significant results.
In essence, implementing the Bamako Initiative was a
political process that involved changing the prevailing
patterns of authority and power. Community participation in the management and control of resources at
the health-facility level was the main mechanism for
ensuring accountability of public health services to
users. Health committees representing communities
were able to hold monitoring sessions during which
coverage targets, inputs and expenditures were set,
reviewed, analysed and compared. It is estimated that
the initiative improved the access, availability, affordability and use of health services in large parts of
Africa, raised and sustained immunization coverage,
and increased the use of services among children and
women in the poorest fifth of the populace.
The Bamako Initiative was not without its limitations. The
application of user fees to poor households and the principles of cost recovery drew strong criticism, and though
many African countries adopted the approach, only in a
handful were initiatives scaled up. Even in those countries where Bamako has been deemed a success, poor
people viewed price as a barrier in the early 2000s, and a
large share did not use essential health services despite
exemptions and subsidies. The challenge that Benin,
Guinea and Mali still face, along with other African
nations that adopted the Bamako Initiative, is to protect
the poorest and ensure that costs do not prevent access
to essential primary health-care services for poor and
marginalized communities.
See References, page 106.
T H E S TAT E O F T H E W O R L D ’ S C H I L D R E N 2 0 0 8
The Millennium Development
Goals and results-based
approaches: 2000 and beyond
By 2000, global life expectancy had
increased from 47 years in the early
1950s to around 65 years. However,
many countries had failed to share in
the health gains that contributed to
this increase in longevity, and the AIDS
pandemic threatened to reverse the
gains in high-prevalence areas. This
prompted the inclusion of three healthrelated goals in the eight Millennium
Development Goals that were adopted
by 189 countries in 2000, with the
target deadline of 2015 (See Figure
1.9, page 9, for the full list of the
health-related MDGs and their
associated indicators.)
Figure 2.3
IMCI case management in the outpatient health facility,
first-level referral facility and at home for the sick child
from age two months up to five years
As Chapter 1 explained, progress
towards the health-related MDGs has
been less rapid than the architects of
the MDGs had hoped. There are serious concerns that without a concerted, sustained drive to expand access
to essential interventions to the millions of mothers and children who
are currently missing out, the goals,
particularly in sub-Saharan Africa,
will be missed by a wide margin.
In recent years, a number of high-level
meetings have taken place to identify
opportunities for achieving the MDGs,
explore best practices, make commitments to measurable results at the
country level and support the pertinent
institutional adjustments required at
country, regional or global levels. A key
concern of these meetings is progress in
sub-Saharan Africa, the region with the
highest rates of maternal, newborn and
child mortality and the one making
the least progress towards the healthrelated Millennium Development
Source: World Health Organization and United Nation Children’s Fund, Model Chapter for
Textbooks: Integrated Management of Childhood Illness. WHO and UNICEF, Geneva and
New York, 2001, p. 6.
L E S S O N S L E A R N E D F R O M E V O LV I N G H E A LT H - C A R E S Y S T E M S A N D P R A C T I C E S
37
Goals. At the current pace, most of
the 46 countries in sub-Saharan Africa
– along with Sudan – will fail to meet
most of the MDGs. Current projections indicate that sub-Saharan Africa’s
poverty rate as measured by the proportion of people living on less than a
dollar a day will reach almost 40
per cent in 2015.23 In some countries,
under-five mortality rates have stagnated or even reversed, and paediatric
AIDS deaths continue to increase.
Despite this rather bleak outlook,
there is hope from the experience of
other countries, whose targetted
approaches have brought about significant declines in under-five mortal-
ity rates.24 In recent years, several
comprehensive reviews of evidencebased child survival interventions
have reaffirmed that existing lowcost interventions can avert up to
two thirds of under-five mortality
and over half of neonatal mortality.25
In addition, 88 up to 98 per cent of
maternal deaths are preventable.26
Diagonal approaches: The Mexican way
According to one of its leading proponents, Jaime
Sepulveda of Mexico’s National Institute of Health,
the diagonal approach is a “proactive, supply-driven
provision of a set of highly cost-effective interventions
on a large scale bridging health clinics and homes.”
Vertical interventions are often the starting point of
diagonal approaches, with the caveat that the number of
these interventions be expanded over time with support
from existing facilities and field workers. The diagonal
approach stresses the importance of integration and
coordination between vertical interventions, communitybased initiatives and health facilities or extension services.
It addresses a number of key issues by applying specific
intervention priorities, including drug supply, facility
planning, financing, human resources development,
quality assurance and rational prescription.
In the 25 years from 1980–2005, Mexico implemented
a number of successful vertical programmes that were
subsequently scaled up. These programmes targeted
diarrhoeal diseases (the distribution of oral rehydration
salts and the Clean Water programme); vaccine preventable diseases (national vaccination days, measles vaccination campaigns, the Universal Vaccination Programme,
national health weeks); vitamin A supplementation and
anthelmintic therapy (national health weeks).
PROGRESA – a conditional cash transfer programme
designed to engage the country’s poorest families – provided financial incentives for improved health and nutrition practices, and for keeping children in school. Benefits
are contingent on regular attendance at health clinics that
supply essential health and nutrition services. Food supplements are distributed to all children aged 6–23 months
and underweight children aged 2–4 years in targeted
households. The programme has been associated with
a strong positive impact on children’s nutritional status.
38
A more comprehensive package covering the continuum of maternal, neonatal and child health has been
introduced since 2001, when the Ministry of Health
launched Arranque Parejo en la Vida (Equal Start in
Life). This initiative promotes social and community
participation, strengthens and expands antenatal and
neonatal care, and provides folic acid supplementation
for women, among other factors. It has reached a high
level of coverage. Through Seguro Popular, a public
health insurance initiative, maternal and child health
became entitlements.
In part, the diagonal approach has emerged as a
result of research into Mexico’s health system and its
development during the past 25 years. Unlike other
approaches, its genesis appears to have emerged as a
practical response to the growing complexity of disease profiles and the pressure faced by the country to
develop health interventions and systems that provide
quality services, are affordable, and reach the poorest
and most marginalized populations.
Its implementation has led to Mexico being one of
only seven countries on track to reach the Millennium
Development Goals among the 60 nations selected
in 2005 for priority attention by the Child Survival
Countdown to 2015. The diagonal approach is now
formalized and being championed by Mexico’s former
Minister of Health, Julio Frenk, who considers that the
framework should be integrated into a broader health
policy. It aims to bridge the dichotomies between
horizontal and vertical approaches, intersectoral and
sectoral policies, and national and international efforts
by offering a ‘third way’ through which effective
interventions become the drivers for health-system
development.
See References, page 106.
T H E S TAT E O F T H E W O R L D ’ S C H I L D R E N 2 0 0 8
Figure 2.4
Conceptual framework for achieving health-related Millennium Development Goals
Towards a unified framework
for ensuring health outcomes
for mothers, newborns and
children
In recent years, governments and
development partners have renewed
their commitment to achieving the
health-related MDGs and ensuring
that their renewed resolve would
translate effectively into joint or
coordinated regional strategies. At
the same time, experts in maternal,
newborn and child health are increasingly coalescing around a set of
strategic principles based on the
lessons of the past century. These
principles are threefold, namely:
A renewed recognition of the principles of primary health care, which
emphasize the primacy of family and
community partnership in the survival, growth and development of
children.27 This has triggered a
renewed interest in another principle
of primary health care, namely the
need for community partnerships to
support families in improving their
care practices for children and to
hold health systems accountable for
providing quality affordable services.
(Chapter 3 examines community
partnerships in support of maternal,
newborn and child health and familycare practices.)
The ‘health systems development for
outcomes’ approach to health-service
delivery combines the strengths of
selective/vertical and comprehensive/
horizontal approaches. This new
approach is being adopted as the
framework for scaling up cost-effective
intervention packages and integrating
them into a continuum of care for
mothers, newborns and children. It
emphasizes the expansion of evidencebased, high-impact health, nutrition,
HIV and AIDS, and water, sanitation
and hygiene interventions and practices, and underlines the importance of
removing system-wide bottlenecks to
health-care provision and usage. If
L E S S O N S L E A R N E D F R O M E V O LV I N G H E A LT H - C A R E S Y S T E M S A N D P R A C T I C E S
39
Accelerated Child Survival and Development in West Africa
A more recent example of an integrated approach to primary health care is the Accelerated Child Survival and
Development (ACSD) initiative, which was launched by
national governments in cooperation with UNICEF in West
and Central Africa and aims to reduce infant (under-one),
under-five and maternal mortality rates. The programme
originated when the Canadian International Development
Agency (CIDA) asked UNICEF to develop an innovative
project that would reduce child mortality. It was initiated in
2002 in four countries, covering 16 districts and 3 million
people. Since then, ACSD has grown rapidly and by 2004
was targeting more than 16 million people in selected
districts in 11 countries of West and Central Africa that
have high rates of under-five mortality. ACSD concentrates
on three service-delivery strategies to augment coverage
for women and children:
• Community-based promotion of a package of family health
and nutrition practices, employing mostly volunteers.
• Outreach and campaigns to provide essential services and
products, such as immunization, vitamin A, anthelmintic
treatment and selected prenatal services.
• Facility-based delivery of an integrated minimum-care package consisting of all the selected priority interventions.
These priority interventions are also organized around three
areas that build on the strengths of existing programmes
and approaches:
• Antenatal Care plus (ANC+), which provides intermittent
preventive treatment of malaria during pregnancy, iron
and folic acid supplementation, tetanus vaccine and prevention of mother-to-child transmission of HIV.
• Expanded Programme on Immunization plus (EPI+), which
includes immunization, vitamin A supplementation and
deworming.
• Integrated Management of Childhood Illness plus (IMCI+),
which covers promotion of insecticide-treated mosquito
nets, oral rehydration therapy, antimalarial drugs, exclusive breastfeeding and complementary feeding.
The ‘three by three’ delivery and intervention framework is
supported by cross-cutting strategies to address behavioural, institutional and environmental constraints. These strategies include:
40
• Advocacy, social mobilization and communication for
behavioural change.
• A results-based approach to service delivery at the
community level.
• District-based monitoring and micro-planning.
• Integrated training.
• Improved supply systems.
Accelerated Child Survival and Development adopts an
integrative framework, building on existing interventions
with international and local partners. The programme
strongly emphasizes bringing the framework into the
mainstream of national policies and programmes, such
as health sector-wide approaches, poverty reduction
strategies and associated medium-term expenditure
frameworks, basket funding and budget support. It also
emphasizes building capacity at regional, district and
community levels.
ACSD has a strong community-based component and is
considered a ‘behaviour-centred’ programme because the
majority of interventions – such as utilizing insecticidetreated nets in communities where malaria is endemic,
improving care of sick children and newborns, and
encouraging breastfeeding and complementary feeding –
promote behaviour change. ACSD also includes active
outreach and mobile strategies that are essential to
reaching the most remote areas.
Based on preliminary data presented by district health
teams in Ghana, this integrated approach, which includes
immunization, infant and young child feeding, integrated
management of childhood illness, and antenatal care, is
already having a positive impact on routine immunization
coverage. Subsidized insecticide-treated mosquito nets
are being distributed in conjunction with immunizationplus activities.
See References, page 106.
T H E S TAT E O F T H E W O R L D ’ S C H I L D R E N 2 0 0 8
This approach defies the longstanding dichotomy between vertical
approaches to achieve outcomes and
integrated approaches to strengthen
systems, arguing that both aims can
be realized by adapting health systems
to achieve results. It also recognizes
that optimal child survival, growth
and development are more likely to be
achieved and sustained if preventive
measures are available to future mothers (i.e., adolescent girls and young
women) before their children are born
and if they benefit from a continuum
of care that is part of an evolving
integrated approach to reproductive,
maternal, newborn and child health.
(Chapter 4 elaborates on how to take
these strategies to scale.)
Enhance ways of working at the
national and international levels, with
a strong focus on coordination, harmonization and results. A new way of
working for the global community is
needed to support countries in going
to scale with diagonal approaches to
primary health care. Harmonization
of the multitude of health-related
global initiatives and partnerships,
and of donor support to healthrelated MDGs, is pivotal to a unified
paradigm. Other requisites include:
© UNICEF/HQ05-2059/Donna DeCesare
jointly scaled up and widely applied,
these interventions are expected to
have a dual and synergistic impact
not only on child survival but also on
children’s growth and development.
Young children need adequate nutrition to have a healthy start in life. Eating a meal
together, Honduras.
provide predictable long-term funding for health-related MDGs.
• Strengthening health systems and
other sectors for MDG outcomes.
• Improving the effectiveness and
efficiency of multilateral support in
a context of UN harmonization by
stimulating a global collective sense
of urgency for reaching the healthrelated MDGs.
• Changing institutional ways of
doing business so as to achieve the
MDGs; developing a more systematic and robust approach to knowledge management and learning.
• Stronger support to developing
countries in national planning, policy and budgeting frameworks for
the health-related MDGs.
• Seizing the opportunity presented
by the renewed interest in health
outcomes.
• Aligning donors to support countries’ own priorities and plans and
• Recognizing that the role played
by civil society and the private
sector will be critical for success.
(Chapter 5 discusses this new way
of working.)
Figure 2.4 demonstrates the complementarity of these new strategic principles to achieve the health-related
Millennium Development Goals. It
makes clear that though the MDGs
will be primarily determined at the
household and community level, their
attainment requires that families and
communities receive support from
health systems and other sectors.
Policies and financing at both global
and national levels are needed to
enable health systems and other sectors
to support families and communities
and ensure accountability for results.28
Building on the lessons learned
As this brief review has shown, the
public health community is continually learning and evolving. There is
L E S S O N S L E A R N E D F R O M E V O LV I N G H E A LT H - C A R E S Y S T E M S A N D P R A C T I C E S
41
HIV and AIDS in Africa and its impact on women and children
Elizabeth N. Mataka, United Nations Special Envoy of the
Secretary-General for HIV/AIDS in Africa
It is disheartening to observe that nearly half of all adults living with HIV around the word are women. In sub-Saharan
Africa alone, out of the 23 million adults aged 15–49 and
infected with HIV, 13.1 million, or 57 per cent, are women. In
Zambia for example, women and girls are highly vulnerable
to HIV and AIDS, and women aged 15–24 are three times
more likely to be infected than males in the same age group.
The toll that HIV has taken on women, especially those in
Africa, has been largely underestimated. Children have also
not been spared from the effects of AIDS, and the impact is
devastating. It is estimated that at the end of 2006 there were
2.3 million children less than 15 years old living with HIV.
Many children continue to lose parents as a result of AIDS,
and this has led to an escalating number of orphans and
vulnerable children, with predictions that by 2010 there will
be around 15.7 million children orphaned by AIDS in subSaharan Africa alone. Children suffer long before their parents die, especially girls, who may be drawn out of school to
look after sick parents, particularly their mothers. Children
lose the opportunity for education and for the maximum
development of their potential due to lack of support. When
parents die, children may have to relocate – losing their
friends, as well as the familiar surroundings and environment
they are comfortable with. The real trauma suffered by these
children remains unknown because child counselling services
are not developed in Africa. I would guess that emphasis has
been put on physical, visible needs to the neglect of the more
complex and challenging psychological needs of children.
Children can no longer rely on the support of the traditional
extended family system, which provided care and support
for the aged, orphans and any vulnerable and disadvantaged
family member. This coping mechanism has been overstretched by poverty and by the sheer numbers of children
to be cared for, given the fact that AIDS affects the most
productive family members in the prime of their productive
and reproductive lives. As a result, children have sometimes
gone into homes that are already overstretched and where
they are really not welcome. Some become homeless and
have to live on the streets of major capital cities in Africa.
All children need a roof over their heads, proper nutrition,
parenting and support structures that will help in nurturing
them and giving them a renewed hope for the future.
Without the education and socialization that parents and
guardians provide, children cannot acquire the skills and
knowledge they need to become fully productive adult
42
members of society. HIV and AIDS are leaving behind a
generation of children being raised by grandparents, who
in most cases also need support by virtue of their age.
The rates of infection among women and girls are a cause
for deep concern, and when combined with the workload
that women take on as well – in caring for AIDS patients,
AIDS orphans and their own families – the situation
becomes untenable, especially in southern Africa.
The socio-economic status disparity between men and
women has a great impact in fuelling the spread of HIV,
among women and girls in particular. Cultural norms and
early marriages further increase the vulnerability of young
girls to infection. Poor communication around sex issues
limits their ability to negotiate safer practices and may force
women to remain in risky relationships. And socio-economic
problems may limit women’s access to counselling and
treatment. In this kind of set-up, women do not own property or have access to financial resources and are dependent
on their husbands, fathers, brothers and sons for support.
Without resources, women are susceptible to sexual violence, and the threat of this violence also limits women’s
ability to protect themselves from HIV and AIDS.
The crisis is far from being over. African governments must
commit to strengthening initiatives that increase capacities of
individuals, especially women and children, to protect themselves. Empowerment of women should no longer be dealt
with under the general heading of ‘Mainstreaming Gender in
All Aspects of Development’. Empowerment of women, as
well as support for orphans and vulnerable children, must
move to the next level of well targeted, time-bound and well
funded programmes with measurable results.
There is need for increased support of ‘beyond awareness’
initiatives that focus on skills development, communitybased health promotion, positive living, gender equity and
universal access to prevention, care and treatment.
The ramifications of the AIDS pandemic are multiple and
impact negatively on every aspect of development. There
is much to be done in Africa to ensure that the response is
commensurate to the human and financial challenges that
are posed by HIV and AIDS. There is a need for long-term
sustained prevention, care and support programmes, and
for consistent, predictable and sustained resource provision.
There is also a need for the empowerment of women and for
change in cultural practices that discriminate against women.
Long-term sustainable responses are essential and can only
be achieved if all relevant stakeholders work together.
T H E S TAT E O F T H E W O R L D ’ S C H I L D R E N 2 0 0 8
Partnership for Maternal, Newborn & Child Health
The Partnership for Maternal, Newborn & Child Health
(PMNCH), launched in September 2005, brings together
180 member maternal, newborn and child communities in
an alliance to reduce mortality and morbidity. The PMNCH
is the product of an alliance between the three leading
partnerships on maternal, newborn and child health: the
Partnership for Safe Motherhood and Newborn Health,
hosted by WHO in Geneva; the Healthy Newborn Partnership,
based at Save the Children USA; and the Child Survival
Partnership, hosted by UNICEF in New York.
plans, strengthen health systems and improve equity
in coverage.
• Monitoring and evaluation of coverage of priority interventions, progress towards MDGs 4 and 5, and equity in
coverage, to hold stakeholders accountable.
PMNCH members are divided into six constituency groups:
academic and research institutions, health-care professionals, UN agencies, non-governmental organizations, donors
and foundations, and governments.
The partnership focuses on four key areas of work:
• Promotion and assessment of effective, evidence-based
interventions for scaling up, with a focus on reducing
inequity in access to health care.
The partnership aims to place at least 50 per cent of the
60 countries identified by Child Survival Countdown to
2015 on track to achieve MDGs 4 and 5 by 2010. A defining
principle of its work is to engender a continuum of care to
address maternal, newborn and child care in an integrated
manner, across both time (pregnancy, birth, newborn and
young child periods) and location (home, community and
health facilities).
• Country support to include maternal, newborn and child
health care in national development and investment
See References, page 106.
• Advocacy, its central mission, to raise the profile of
maternal, newborn and child health on political agendas
and press for more financial and other resources.
a need to focus on proven strategies
targeted towards relieving the major
causes of child deaths, and to do so
effectively, interventions must be provided within a continuum of
care that engages communities and
households, as well as outreach and
facility-based care. Health systems
must be strengthened and expanded
to support new initiatives, including
community partnerships, and they
must be backed by strong national
and international leadership and commitment. In addition, the many institutions involved in maternal and child
survival, health and nutrition must
work together effectively.
One overarching principle that has
emerged from the review of six
decades of approaches to child
survival and health is that no single
approach is applicable in all circumstances. The organization, delivery
and intervention orientation of
health-care services must be tailored
to meet the constraints of human
and financial resources, the socioeconomic context, the existing capacity of the health system and, finally,
the urgency of achieving results.
be done – and there is a great deal
more to be learned – about scaling up
these approaches to reach the millions
of mothers, newborns and children
who currently live or die without
access to quality health care.
Chapter 3, which highlights the
imperative of developing health systems to provide a continuum of quality care and focuses on the benefits
of employing community partnerships in countries with weak healthsystem capacity, will show how the
knowledge gleaned is being used. The
results are often promising and sometimes impressive, but much more can
L E S S O N S L E A R N E D F R O M E V O LV I N G H E A LT H - C A R E S Y S T E M S A N D P R A C T I C E S
43
Reaching the healthrelated Millennium
Development Goals will necessitate
strengthening health systems at all
levels – facility-based services, formal
public health programmes and community partnerships. A growing body
of evidence shows that improved
health practices in the community
and household, combined with
opportunities for health-system referrals, can have a powerful impact on
reducing under-five mortality. As a
result, integrated health systems and
community-based primary health
care are once again receiving greater
attention and emphasis in national
policies and international health
partnerships and programmes.
SUMMARY
Experience shows that successful
community partnerships are based
on several common factors: cohe-
sive and inclusive community
organization and participation;
support and incentives for community health workers; adequate
programme supervision and support; effective referral systems
to facility-based care; cooperation
and coordination with other
programmes and sectors; secure
financing; and integration with
district and national programmes
and policies.
National leadership and ownership
of community partnerships are
essential to ensure sustainability
and foster expansion. Governments
have a critical role in developing
and implementing policies to lower
barriers to primary health care, in
improving the quality and efficiency
of service providers and in increasing public accountability.
Community partnerships are essential to
reducing maternal, newborn and under-five mortality. A community development motivator, India.
Developing effective, child-focused
health policies and building strong
institutions that link communities
and health systems are crucial steps
towards achieving the health-related
Millennium Development Goals,
because, in many countries, increases in health expenditure will need
to be accompanied by substantial
improvements in the policy environment to achieve significant progress.
Donors, in turn, need to rally behind
national polices and strategies
for improved maternal and child
survival, health and nutrition, and
together with governments, they
must invest sufficient human and
financial resources to scale up and
strengthen community partnerships.
T H E S TAT E O F T H E W O R L D ’ S C H I L D R E N 2 0 0 8
Community partnerships in
primary health care for mothers,
newborns and children
© UNICEF/HQ06-2052/Pablo Bartholomew
The role and importance
of community partnerships
When infants and children become
sick, it is their families, especially
parents and other primary caregivers,
who form the first line of care.
Household members, particularly
mothers, undertake the primary
diagnosis of illness, assess the severity
and probable outcomes, select treatment and care options – including
home treatment – and procure and
administer drugs and other remedies.
Families and caregivers make the
decisions to seek formal health care
for pregnant women or children
who have fallen ill, and they decide
whether to adopt diverse feeding
and hygiene practices.
Empowering communities and households to participate in the health care
and nutrition of mothers, newborns
and children is a logical way of
enhancing the provision of care, especially in countries and communities
where basic primary health care and
environmental services are lacking.
The imperative of community participation in health care and nutrition
for individuals and families was
established almost three decades ago,
along with the movement that led to
the concept of comprehensive primary health care embodied in the
Declaration of Alma-Ata in 1978.1
It has long been clear that without
the participation of communities,
the goal of “health care for all”
will remain severely constrained,
particularly in the most marginalized
and impoverished areas.2
The known benefits of community
partnerships form part of the learning experience required to improve
health care over the longer term.
Community participation is viewed
as a mechanism to reduce and
eventually eliminate profound disconnections between knowledge, policy
and action that impede efforts to
address both the supply and demand
sides of care.3
The importance of participation in
health care, hygiene practices, nutrition, and water and sanitation services
goes beyond the direct benefits to
community members as they engage
in activities that can impact positively
on their health. It forms the heart
of a rights-based approach to human
3
progress. Participation is critical to
enable people to achieve their full
capabilities, exercise their rights to
engage in public and community
affairs, and foster equity, equality and
empowerment – characteristics that
are fundamental to sustainable human
development and to the objectives
of such compacts as the Universal
Declaration of Human Rights, the
Convention on the Rights of the Child,
the Convention on the Elimination
of All Forms of Discrimination
against Women and the Millennium
Declaration, among many others.
A multiplicity of community
partnerships
There is no universal definition of
community in the literature on public
health, and it can be broadly or narrowly defined, depending on circumstances. Intuitively and in practice,
however, ‘community’ often refers
to a group of people residing in a
specific geographic area who have
common interests, heritage and shared
assets. They may also experience
similar deprivations of their rights
to quality health care, adequate nutrition, and safe water and sanitation.4
45
© UNICEF/ HQ05-2186/Giacomo Pirozzi
Based on this broad definition of
community, community partnerships
are approaches and strategies that
seek to actively engage community
members in their own health care
and well-being, along with those of
their children and other dependants.
ers include payment in kind, in part
or in cash. Some community-based
programmes are nationally supported
and integrated into sector-wide policies and the broader health system,
while others have yet to be fully or
partially incorporated.5
Community partnerships in maternal,
newborn and child health are rich in
diversity. Some are small-scale, involving only a few thousand or even a few
hundred people; other initiatives, such
as the Brazilian community health
workers network or the Lady Health
Workers programme in Pakistan,
encompass thousands of workers
covering millions of children and
women. Some programmes emphasize
supply-side elements, such as service
provision through community health
workers, while others focus more on
demand-side initiatives to mobilize
social demand for accountability and
results from governments. Some community health worker initiatives rely
on voluntary participation, while oth-
The multiplicity of programmes and
approaches to community participation
in health care reflects, in part at least,
the diversity of communities. Each
one has its own social characteristics,
organizational structure and links with
other groups. To be effective, programmes and approaches directed
towards communities must therefore
adapt to the local needs and context
and be owned by the community.
46
Adaptation of strategies for individual settings is a complex process
because communities, like countries
and regions, are often heterogeneous
entities. Not only are there marked
differences between communities in a
particular country or district, there
T H E S TAT E O F T H E W O R L D ’ S C H I L D R E N 2 0 0 8
Supporting pregnant women through
community outreach enhances care for
both mother and child. HIV counselling for
pregnant women at a local health centre,
the Democratic Republic of the Congo.
are likely to be disparities within
them as well. Members of communities may share common heritage and
interests and experience similar deprivations, discrimination and disempowerment, but different members
will have specific needs, concerns
and expectations regarding health
care. Communities are likely to
comprise powerful individuals with
the potential to help or hinder a
health programme, depending on
their viewpoint or interests.
Despite these variations, evidence and
observation allow for the identification
of common factors in communitybased approaches to health care and
nutrition. An overarching aim is
that community-based programmes
increase the potential of the local
population to access health services
and interventions. In addition, they
are perceived as having the potential
to accelerate advances in behaviour
change, care practices and care seeking, and to empower communities
and households to demand quality
services.6 Other common aspects
of community-based approaches
to health care and nutrition are
illustrated in the panel on page 48.
Success factors in community
partnerships
Several factors are commonly found
in successful community-based
approaches. Implementation in any
setting depends on the local context.
Identifying successful factors is not
only a positive way of assessing
Basic practices for community-based health-care interventions
A number of agencies, including UNICEF and WHO, have
agreed on 12 key household practices for neonates and
infants that can help to promote child survival, health and
nutrition in communities:
• Exclusive breastfeeding: Exclusive breastfeeding from birth
to six months. (Mothers found to be HIV-positive require
counselling about possible alternatives to breastfeeding.)
•
Complementary feeding: Starting at about six months old,
feeding children energy- and nutrient-rich complementary
foods while continuing to breastfeed for at least two years
could prevent more than 10 per cent of deaths from diarrhoea and acute respiratory infections, particularly pneumonia; and increase resistance to measles and other illnesses.
• Micronutrient supplementation: Improving the intake
of vitamin A through diet or supplements in communities
where it is deficient could reduce mortality among children
aged 6 months to five years by 20 per cent.
• Hygiene: Better hygiene practices, particularly hand
washing with soap (or ashes) and the safe disposal of
excreta could reduce the incidence of diarrhoea by
35 per cent.
• Immunization: Vaccination against measles for children
under age one could prevent most of the measles-related
deaths each year. Caregivers should make sure children
complete a full course of immunizations (bacille CalmetteGuérin; diphtheria, pertussis and tetanus vaccine; oral polio
vaccine; and measles vaccine) before their first birthday.
• Malaria prevention: The use of insecticide-treated mosquito
nets in households in malaria-endemic areas could lower
malaria-related child deaths by as much as 23 per cent.
• Feeding and fluids for sick children: Continue to feed and
offer more fluids, including breast milk, to children when
they are sick.
• Home treatment: Give sick children appropriate home
treatment for infections.
• Care seeking: Recognize when sick children need treatment outside the home, and seek care from appropriate
providers.
• Appropriate practices: Follow the health worker’s advice
about treatment, follow-up and referral.
• Antenatal care: Every pregnant woman should have
adequate antenatal care. This includes having at least four
antenatal visits with an appropriate health-care provider
and receiving the recommended doses of tetanus toxoid
vaccination. The mother also deserves support from her
family and community in seeking care at the time of
delivery and during the postpartum and lactation period.
Further important practices that protect children include:
providing appropriate care for those who are affected by
HIV and AIDS, especially orphans and vulnerable children;
protecting children from injury and accident, abuse and
neglect; and involving fathers in the care of their children.
Many of these practices can be undertaken by community
health workers or by community members themselves,
given the appropriate support and distribution of products
and services. The direct involvement of the community is
perhaps most appropriate for those aspects of health care
and nutrition that most closely affect members on a daily
basis. These include infant and young child feeding, other
caring practices, and water and sanitation.
• Psychosocial care and development: Promote mental and
social development by responding to a child’s need for
care and by talking, playing and providing a stimulating
environment.
programmes and ‘learning by
doing’, it is far easier than trying to
disaggregate the elements that did
not work in a community-based
programme from the contextual factors. Consequently, while the panel
on page 48 lists several of the common challenges to community part-
See References, page 107.
nerships in primary health care, the
chapter will concentrate mostly on
identifying and explaining the common tenets of successful initiatives.
Success factors drawn from evidence
and experience are identified as follows
and summarized below. They include:
• Cohesive, inclusive community
organization and participation.
• Support and incentives for
community health workers.
• Adequate programme supervision
and support.
C O M M U N I T Y PA RT N E R S H I P S I N P R I M A R Y H E A LT H C A R E
47
• Effective referral systems to
facility-based care.
• Cooperation and coordination with
other programmes and sectors.
• Secure financing.
• Integration with district and
national programmes and policies.
Each of these tenets is briefly summarized in the following pages.
Cohesive, inclusive community
organization and participation
Cohesive, inclusive organization
is a fundamental feature of successful community partnerships.
Communities function under
established norms and practices
that are often deeply entrenched in
social, religious or cultural heritage.
Programmes that respect this heritage have been found to be among
the most successful communitybased approaches to health care
and nutrition. In Asia, for example,
the large-scale initiatives undertaken in Bangladesh (BRAC), India
(Jamkhed and others), Pakistan
(Lady Health Workers) and other
countries have been led by local
organizations – often women’s
groups. These groups have built on
the established structures within
communities that extend to other
areas of development, including
education and credit, as well
as health.7
Common aspects and challenges of community partnerships in
health and nutrition
Overarching aim
• Reduce maternal, newborn and child mortality and morbidity.
Objectives
and sanitation, and agricultural interventions – are part of
the programme.
• Improve access to basic preventive and curative services.
Additional features common to some, but not
all, community partnerships
• Foster direct and more frequent contact between health
• Referral to facility-based care.
workers and caregivers, mothers and children.
• Encourage sustainable behaviour change.
• Support caring practices.
• Stimulate social mobilization by the community to
demand better services and accountability.
Central features
• Health care and nutrition activities take place outside
formal health facilities.
• Community health workers, often volunteers or part-time
workers, are frequently key participants in dispensing
essential services and promoting better caring practices.
• Training, support and supervision for community health
workers are common features of programmes.
• There is often a central point within the geographical
vicinity for the delivery of services or home visits.
• A community organization supports the programme and
contributes not only administration and implementation,
but often design and evaluation as well.
48
• Other aspects of primary health care – especially water
• Support from outreach workers.
• Integration of the programmes into the wider health sector.
• Integration into national development programmes and
policies.
• Measures to strengthen the supportive environment, e.g,
gender equality initiatives.
Common constraints on community partnerships
• Lack of community health workers to deliver quality services.
• Inadequate coordination of diverse participants.
• Insufficient funding for community-based activities.
• Irregular supply of drugs and commodities.
• Poor support and supervision of community health workers.
• Entrenched traditional childcare practices.
• Low economic status of women.
See References, page 107.
T H E S TAT E O F T H E W O R L D ’ S C H I L D R E N 2 0 0 8
Even when communities have
respected, socially inclusive organizations, their participation in
programmes is not automatic.
Advocacy and communication are
required to allow community organizations to state their preferences and
needs for health care, nutrition, and
water and sanitation services. Once
a programme is launched and implemented, community members need
to see that it is progressing towards
their stated objectives, both individually and collectively. As programmes
progress, their ongoing relevance
should also be regularly assessed.9
Programmes that limit community
participation to implementation run
the risk of weak local ownership,
with the result that participation
will be tentative and tenuous.10
Periodic meetings of community
organizations involved with community programmes are an important
component of participation. At these
meetings, the results and evidence
can be discussed as part of planning,
monitoring and evaluation.
© UNICEF/HQ07-0463/Christine Nesbitt
Organization alone is not sufficient
to bring lasting change. To be truly
effective and universal in scope, community participation must be socially
inclusive. Given that communities are
often heterogeneous in composition
and structure, establishing a socially
inclusive community partnership may
be challenging. Long-held patterns of
exclusion and discrimination by gender, religion, ethnicity or disability
can impede the reach of interventions. Divisions among community
members may also be rooted in more
recent events and circumstances, such
as civil strife and the stigma attached
to HIV and AIDS.8
Village leaders can be strong advocates for promoting essential health interventions within
communities. A district chief vaccinates his son against polio, Nigeria.
Support and incentives for
community health workers
Community health workers are
established as an integral part of
community-based programmes, serving as a bridge between professional
health staff and the community, and
helping communities identify and
address their own health needs.
Community health workers are generally the main agents of communitybased treatment, education and
counselling, usually through household visits. They also attend local
health facilities, obtain and dispense
supplies of drugs and other essential
products, participate in community
meetings and fulfil their responsibilities in programme management.
Other duties often include attending
local district and regional meetings
for training and feedback, and repre-
senting the community in dialogue
with other communities and government health personnel.
Because they can reach vulnerable
children who may otherwise lack
access to basic health services,
community health workers have been
particularly effective in improving
child survival outcomes at project
level in countries as diverse as
Ecuador, Ethiopia, Colombia and
Nepal. Successful scale-up efforts
across the developing world confirm
the potential of community health
workers to deliver equitable health
services to children living in remote
areas and to help fill the unmet
demand for regular health services in
countries with weak health systems.
Efforts to scale up community
health worker programmes,
C O M M U N I T Y PA RT N E R S H I P S I N P R I M A R Y H E A LT H C A R E
49
addressed in greater depth in
Chapter 4, can face obstacles and
bottlenecks. In fact, just being able
to maintain adequate participant
numbers and structure is often one
of the greatest challenges. Existing
programmes, regardless of their
scale, grapple with poor training,
inadequate supervision, lack of supplies and poor relationships with the
communities they intend to serve.
Attrition rates in community health
worker programmes are often high.
One review, for example, found
attrition rates of 30 per cent over
nine months in Senegal and 50 per
cent over two years in Nigeria.
Similar challenges have been identi-
fied in India, Sri Lanka and the
United Republic of Tanzania.11
Attrition is related to multiple factors. Fulfilling the responsibilities of
a community health worker takes
time and financial resources, and
may involve significant opportunity
costs. Community health workers,
particularly those who are volunteers
or paid in kind or part, may have
obligations to meet and require
income to support their families.
If the demands on their time and
resources prove overwhelming, there
is a risk they will not function effectively as health workers or will drop
out of community partnerships.
The sustainability of community
health worker programmes depends
on creating a package of incentives
that is sufficiently attractive to
prevent attrition. These packages
will vary among settings, reflecting
the different functions community
health workers undertake in different communities. But all need to
focus on priorities that include
compensating community health
workers for lost economic opportunities; providing adequate supervision and peer support; offering
personal growth and development
opportunities; and creating a
strong support system within the
community.12
India: Reducing undernutrition through community partnerships
Challenge
Despite vast improvements in the country’s economy, undernutrition continues to be a problem in India. In 1999, the
National Family Health Survey found that 47 per cent of
all children under age three were underweight – a higher
average prevalence than in sub-Saharan Africa. Data from
the most recent round of the survey, completed in 2006,
show only a very small decline, with undernutrition levels
remaining around 45 per cent for children under three; in several states, such as Madhya Pradesh and Bihar, undernutrition levels have increased since the previous survey. Reasons
for this high prevalence include the inadequate knowledge
of caregivers concerning correct infant and young child
feeding, frequent infections worsened by bad hygiene, high
population pressure, the low status of women and girls, and
suboptimal delivery of social services.
To combat undernutrition in young children, the Government
of India relies largely on the Integrated Child Development
Scheme (ICDS). Begun in 1975, the scheme provides health
and nutrition education for mothers of infants and young children, along with other services, such as supplementary nutrition, basic health and antenatal care, growth monitoring and
promotion, preschool non-formal education, micronutrient
supplementation and immunization. These services are
delivered through a network of some 700,000 community
anganwadi workers. The effectiveness of ICDS has been
limited, however, by a variety of factors, ranging from the
50
limited skill and knowledge of anganwadi workers to a lack
of supervision, vacancies and flaws in programme policy,
such as inadequate focus on very young children.
Strategy and approach
UNICEF is collaborating with the Government of India to
increase the effectiveness of ICDS. The specific interventions
supported include: strengthening the management and supervision system; improving the knowledge and skills of anganwadi
workers and increasing the time and attention they give to
infants; improving community involvement through joint village
situation analysis, identifying village volunteers and providing
them with basic training in infant care; and increasing the number of home visits made by anganwadi workers and volunteers
in order to increase the caring behaviour of parents and
improve the outreach of health services.
Results
The strategy described above was carried out in six states, in
each of which at least 1,000 villages were covered, affecting
more than a million people per state. After the interventions
had been operational for about three years, impact assessments were conducted in several of the states, using representative household-based surveys to compare intervention
villages with socially, economically and geographically similar control villages. In Rajasthan, for instance, it was found
that early initiation of breastfeeding was higher and the
prevalence of stunting significantly lower in intervention
T H E S TAT E O F T H E W O R L D ’ S C H I L D R E N 2 0 0 8
The incentives required to retain and
motivate community health workers
are not necessarily monetary. The
disappointing results of evaluations
of post Alma-Ata large-scale training
and deployment of community health
workers underscore the fact that
sound programme management and
refresher training are more efficacious at sustaining workers’ effectiveness than initial training. Active community participation and support is a
vital element of successful and sustainable community health worker
programmes throughout the world.
In the Philippines, for example,
health workers at the barangay level,
the smallest political unit in the
country, have become a significant
driving force behind improved child
survival. This success has been
encouraged by the Barangay Health
Workers’ Benefits and Incentives
Act of 1995, which includes such
provisions as subsistence allowances,
career enrichment and special training programmes, and preferential
access to loans. Similarly, in Ceara,
Brazil, a programme using a decentralized approach that allows community health workers to earn a
substantial monthly income (twice
the local average) has led to dramatic
improvements in child health, including a 32 per cent reduction in
child mortality.13
villages than in control villages (see Figure 3.1). In West
Bengal, early initiation of breastfeeding (76 per cent in
intervention villages versus 44 per cent in control villages),
vitamin A supplementation (50 per cent versus 33 per cent)
and immunization rates (89 per cent versus 71 per cent for
measles) were higher in intervention villages than in control
villages, and undernutrition rates were lower (27 per cent
stunting versus 32 per cent). The cost of these ‘add-on’
interventions is modest: US$150–$200 per village per year,
Figure 3.1
Prevalence of stunting by age (months)
Adequate programme supervision
and support
Supervision and support systems for
community partnerships in primary
health care can diminish the community health workers’ sense of isolation
and help sustain interest and motivation, reducing the risk of attrition.
Skilled health workers based in, or
closely linked to, health facilities generally undertake the supervisory function, which can add to their already
heavy workloads. Supervisors themselves require training to acquire the
appropriate skills for oversight of community-based programmes. Resource
constraints – human, financial or organizational – can limit the breadth and
representing 9–10 per cent of the government’s ongoing
ICDS costs per village per year.
Lessons learned
Considering the continued high level of childhood undernutrition in India, it is important to demonstrate that low-cost
changes can be made to the existing ICDS to significantly
improve health care for infants and young children and that
these changes can lead to nutritional improvements in a
limited period of time. India has approximately 43 per cent
underweight children under age five, so the success of lowcost solutions to undernutrition in the high-priority states of
this country will have a global impact.
Remaining challenges
The governments of the states where these interventions are
being implemented have decided to take them to larger scale
using their own resources. UNICEF will continue to collaborate in order to assure that the quality of implementation
remains adequate, as well as to address some behaviours
that have been more difficult to change, such as the tendency
of caregivers to delay the start of complementary feeding
(much later than six months of age). Although the nutritional
status of infants and children in the states involved has
improved, it is clear there remains ample room for further
improvement in the future.
Source: UNICEF India, Annual Report 2006, p. 47.
See References, page 107.
C O M M U N I T Y PA RT N E R S H I P S I N P R I M A R Y H E A LT H C A R E
51
depth of training, leaving both supervisors and community health workers at
a considerable disadvantage in implementing and managing programmes.
Visits by supervisors to communities,
in particular, are important for on-site
training and learning by doing for
both parties, but these visits are frequently compromised by constraints
on financial resources or by poor
transportation infrastructure.
Efficient administration of community programmes aids evaluation, and
monitoring can help ensure that
coverage is as universal as possible.
Records of patients, treatments and
outcomes should be kept up to date,
and regular meetings should be
held to build cooperative relationships between health workers and
supervisors and to inform programme assessment and modification. Employing technology, such
as computer-based databases, email
and cellphones, can streamline the
process of information gathering
and dissemination while freeing time
for workers and supervisors to visit
communities and households and
meet together.
Other types of support to programmes
include logistics, supplies and equip-
ment. Community health workers
require sufficient tools, including
training and products, to be able to do
their job and maintain their standing
in the community. The previously cited
evaluations of large-scale community
health worker programmes undertaken
in the 1980s show that when these
tools and products – especially drugs –
are inappropriate or not resupplied
regularly, the effectiveness of health
workers is compromised. When
communities are located far from
supporting health facilities, evidence
shows that programmes are more
effective if there is a clear schedule of
visits by supervisors and community
Preventing mother-to-child transmission of HIV: Impact of
mothers2mothers programmes in eastern and southern Africa
52
The urgency of preventing mother-to-child transmission
(PMTCT) of HIV is clear. An estimated 530,000 children were
newly infected in 2006, mostly through mother-to-child transmission. Without treatment, half of the infants born with the
virus will die before age two.
transmission of HIV, combat stigma within families and
communities, and keep mothers alive through treatment
adherence. Founded by Dr. Mitch Besser in 2001, m2m is
based on the premise that mothers themselves are among
the strongest mentors and supporters of expectant mothers.
Significant reductions in mother-to-child transmission, however, can occur through implementation of basic but critical
actions, such as identifying HIV-infected pregnant women
by offering routine HIV testing, enrolling them in PMTCT
programmes, ensuring that health systems are fully able to
deliver effective antiretroviral regimens both for prophylaxis
and for treatment, and supporting women in adhering to
optimal and safe infant feeding.
Even when these services and interventions are available,
many pregnant women do not access them because they
do not receive the necessary information, they are afraid of
attached stigma, or health-care workers are overextended.
Lack of participation in programmes related to postpartum
PMTCT is common in many countries, even if women have
received PMTCT services during their pregnancy.
The aim of m2m is to bring women in antenatal care together
with peer counsellors and mentors to discuss health, HIV prevention and postpartum childcare. The programme trains and
employs HIV-infected mothers who have already benefited by
participating in PMTCT programmes as peer educators or
‘mentor mothers’, and is working with local health-care facilities and non-governmental organizations to implement a
model that can be integrated with national PMTCT efforts in
sub-Saharan Africa. Mentor mothers are peer educators for
pregnant women. Their training allows them to counsel on
HIV infection and antiretroviral treatment, promote behaviours to help prevent mother-to-child transmission, discuss
the importance of appropriate follow-up for the mother and
child after birth, and offer approaches for negotiating safer
sexual practices and nutritional guidelines for women living
with HIV.
mothers2mothers (m2m) is an innovative, facility-based programme currently operating in 73 sites in South Africa and 15
sites in Lesotho. The programme adopts an approach using
education and empowerment to prevent mother-to-child
The organization is expanding rapidly. It already has
international partnerships in Botswana and Ethiopia and
is in the process of rolling out new programmes in Kenya,
Rwanda and Zambia.
T H E S TAT E O F T H E W O R L D ’ S C H I L D R E N 2 0 0 8
health workers and preparations are
in place for transportation to and
from both locations.
Supervision should not be limited
to the official health authorities,
however, and community organizations have a role in oversight of
health workers and programme
outcomes. In principles widely
accepted by practitioners, it is
recommended that the community
be involved in the initial selection
of health workers, and that health
workers accept community members’ participation in identifying
priorities and planning projects.14
Effective referral systems
Effective referral systems are an
essential complement to successful
community-based programmes to
ensure a continuum of care (see
Chapter 4). Hospitals provide
services that cannot be safely
replicated elsewhere, such as
Caesarian sections and other
emergency obstetric care. However, in the poorest countries with
the highest maternal and child
mortality rates, health-care
resources are often limited and
access to referral hospitals frequently low. In these situations,
millions of children can be assisted
The importance of programmes like m2m cannot be overstated, given the growing escalation of treatment regimens
and the stretched resources of many health facilities in settings of high HIV prevalence. New PMTCT guidelines from
the World Health Organization are calling for introduction of
more complex antiretroviral regimens in an effort to further
reduce rates of transmission from mother to child. There
is greater emphasis on increasing access of HIV-infected
pregnant women to treatment for their own health, and a
push to ensure that more children coming from PMTCT
programmes receive early diagnostic testing. Programmes
such as m2m, which involve committed, knowledgeable
members of the community to promote the success of
PMTCT initiatives, are increasingly vital in supporting health
providers in the prevention and treatment of AIDS.
m2m strongly believes that mentor mothers should be
appropriately recognized for their significant contributions.
According to Dr. Besser, “Mentor mothers who have gone
through PMTCT services themselves are recruited locally
and paid a stipend for the work they do, making them
professional members of the health-care team.”
An independent evaluation of m2m was recently conducted
by the Population Council’s Horizons Programme. Several
encouraging results associated with programme participation
were noted, including the following:
very rapidly by scaling up of
proven, cost-effective interventions
in primary health care, particularly
those that are community-based.
At the same time, there is a need to
invest in strengthening district health
systems to provide basic referral
care and to support expansion of
essential primary-health-care services. Community health workers have
proved to be effective in managing
many serious childhood illnesses, such
as diarrhoea, malaria, acute undernutrition and pneumonia; supervision
and access to referral services
strengthen the quality of this activity.
• Postpartum women who had two or more contacts with
m2m were significantly more likely to have disclosed their
serostatus to someone than non-participants (97 per cent
for participants against 85 per cent for non-participants;
p-value <.01).
• Postpartum programme participants were significantly more
likely to have received nevirapine to prevent mother-to-child
transmission of HIV than non-participants (95 per cent for
participants against 86 per cent for non-participants;
p-value <.05).
• m2m programme participants were significantly more likely
to report an exclusive method of feeding (either exclusive
breastfeeding or infant formula but no breast milk) than
non-participants.
• m2m participants were significantly more likely to undergo
CD4 testing during their last pregnancy than non-participants
(79 per cent vs. 57 per cent; p-value <.01). (CD4 cells are
white blood cells that form a key part of the human immune
system. They are also those most vulnerable to HIV infection. The lower the CD4 cell count, the weaker the immune
system and the higher the risk of opportunistic infection.)
See References, page 107.
C O M M U N I T Y PA RT N E R S H I P S I N P R I M A R Y H E A LT H C A R E
53
Leadership brings change for mothers and children in Ethiopia
by Tedros Adhanom, Minister of Health, Ethiopia
Ethiopia’s experience with child survival shows that
strong political leadership can bring about dramatic
results. In 2004, Prime Minister Meles Zenawi challenged
the Government and its partners to join him in charting
a road map for universal health care, despite the enormous obstacles that stood in its path. While more than
80 per cent of child deaths are preventable, coverage and
utilization of preventive services remained low, with less
than 30 per cent of women receiving antenatal care and
only 49 per cent of children receiving a full course of
immunizations by their first birthday.
The Health Extension Program
The Government and its partners are tackling these challenges head-on through the Health Extension Program, a
national strategy designed to promote community-based
child and maternal health. Grounded in the philosophy that
health is a product that can be produced by individuals, the
Health Extension Program empowers communities to make
informed decisions about their own health by equipping
them with appropriate skills and knowledge.
To make this plan a success, the Government is deploying
30,000 female Health Extension Workers (HEWs) – a huge
commitment of financial and human resources – to promote 16 basic interventions that address the major causes
of child and maternal mortality. More than 17,000 HEWs
have been employed to date, and an additional 7,000 are
in training. Each kebele (the lowest administrative unit) is
staffed by HEWs, who are locally recruited and trained
by the Ministry of Health. The Government has also put
in place an Enhanced Outreach Strategy, a transitional
programme that delivers emergency and basic care to
communities while they await the arrival of trained
health workers.
At the same time, initiatives are under way to strengthen
the infrastructure that supports referral-level hospitals.
The Government is investing in a Health Management
Information System designed to collect data at all levels,
including the health post. In October 2006, the Government
adopted a national Health Commodities Supply System to
ensure that vaccines, essential drugs and other health commodities are readily available to public sector health facilities. These initiatives are vital to ensuring the sustainability
of the progress made to date with vertical and communitybased health initiatives.
54
Lessons learned
The Health Extension Program has taught a number of
valuable lessons. The first is that scaling-up requires
speed, volume, and quality. Robust planning processes
have helped to ensure speed and volume. For instance,
when the Government organized a national campaign for
the distribution of insecticide-treated mosquito nets, donor
partners, particularly the Carter Center, the Global Fund,
UNICEF and the World Bank, coordinated their support for
the national campaign, helping to achieve the target of 20
million nets within two years. Each household received
two bed nets, which are used to protect primarily women
and children against malaria.
The second lesson is that speed and volume do not necessarily ensure quality. Extra effort is needed to ensure that
households know when and how to use health resources,
including mosquito nets. The female HEWs are working to
bridge communication gaps between the health sector and
the communities it serves by winning the confidence of
communities and talking directly to mothers.
The third, and perhaps most vital, lesson learned is the
paramount importance of political leadership. Genuine
political leadership requires active and meaningful engagement in every step of the process – from identifying the
problem and setting targets, to mobilizing resources, and
fostering community participation. Public discussion on
health-care needs and priorities, and cooperation among all
stakeholders, including donors, health-care providers, and
communities, has helped foster broad ownership of the
Health Extension Program.
Our partners, including UNICEF and other donors, support
the national planning process, harmonizing their activities
and support for Ethiopia’s priorities. It is a tremendous
achievement that all donor partners have signed a code of
conduct and endorsed a single harmonization manual, which
aims to create one plan, one budget and one final report.
This is an ambitious objective that we are working together
to achieve over the long term.
Ethiopia’s road map to achieving MDG 4 still faces a number
of hurdles, but the progress made to date demonstrates that
our vision for universal access to affordable health care can
be a reality.
T H E S TAT E O F T H E W O R L D ’ S C H I L D R E N 2 0 0 8
© UNICEF/HQ06-1855/Josh Estey
Positive behavioural changes in the household and community lead to improvements in maternal, newborn and child health. A community
health worker demonstrates the use of water-treatment supplies, Indonesia.
Community health workers have been
less effective in identifying and managing complications during childbirth.
Reducing maternal mortality therefore requires the scaling up of skilled
attendance at birth with referral systems for emergency obstetric care.
District health systems also serve
as a focal point for public health
programme coordination, integrating
direct care for patients with population-based campaigns and supervision
and coordination of communitybased care and other lower level
health services. At higher referral levels (regional or national hospitals)
this role is often broadened to include
such functions as training and
research, and technical support and
quality assurance for lower levels.
An essential component of an effective
referral system is good communication
between the community programme
participants and facility-based staff.
Reinforcing points made in the previous sections, referral hospitals should
engage with community programmes,
provide strong support for community
health workers and spend a significant
proportion of time providing advice
through person-to-person contact
or other modes of communication.
Upgrading information and communications technology can facilitate
dialogue and referral, even in lowincome countries.15
Coordination and cooperation with
other essential services and sectors
Just as referral systems are essential
to support and coordinate activities
at the community level, cooperation
and communication between programmes at the district level and
intersectoral collaboration are also
important. Coordination with other
health services can take many forms.
The possible benefits are multiple,
including the sharing of new ideas,
training, resources and evaluation
skills; and early warning, management and containment of disease
outbreaks.16
In Cambodia, for example, nongovernmental organizations share
C O M M U N I T Y PA RT N E R S H I P S I N P R I M A R Y H E A LT H C A R E
55
© UNICEF/MENA06218/Shehzad Noorani
nets, from 25 per cent of households
in the Nicaraguan areas to 90 per cent
in the Peruvian Amazon. In four of
the study areas, local women’s clubs
manufactured the nets, which were
then sold by village health workers
in the communities, who placed the
earnings in a revolving fund.19
59 are also being employed in
Cambodia, Malawi and Rwanda.18
An integrated approach to maternal,
newborn and child health necessitates
collaborative action between programmes and sectors addressing
health, nutrition, hygiene, major
diseases and food security, as well
as initiatives to address the lack of
transportation infrastructure and
access to water and sanitation
facilities.20
Within communities, linkages
between groups can also be important
for health programme sustainability.
A series of large-scale household
surveys in seven areas of Colombia,
Ecuador, Nicaragua and Peru was
carried out to assess the practical
operational issues in the distribution
and usage of insecticide-treated mosquito nets. The surveys revealed wide
variation in usage of treated mosquito
Another crucial reason for intersectoral collaboration is the high
prevalence of co-morbidity in sick
children. Although this is addressed
in part through Community
Integrated Management of
Childhood Illness, actions to fight
disease are strengthened by simultaneously improving environmental
conditions. For instance, in the
case of diarrhoeal disease – which
Community health workers are the driving forces of community partnerships in primary health
care. A health worker weighs a child and monitors his growth in a rural community, Iraq.
resources through a national Child
Survival NGO Group that meets
regularly in Phnom Penh. Members
of this group and representatives
from the Ministry of Health visit each
other’s projects to examine and learn
from advances and adaptations in
approaches to maternal, newborn
and child health care.17 Through such
groups, international organizations
have been able to share best practices
around the world. For example, the
Care Group methods mentioned in
the panel on Mozambique on page
56
Intersectoral collaboration involves
working with all sectors that influence household and community
health outcomes. Not only does such
cooperation provide an integrated
and potentially more sustainable basis
for advances in health outcomes, it
can also empower communities by
structuring a platform for their
input on a broader range of issues
that affect their health. Without collaborative action, sectors may work
in isolation or at cross purposes,
possibly overlooking synergies that
will allow for multiplier effects.
T H E S TAT E O F T H E W O R L D ’ S C H I L D R E N 2 0 0 8
remains a major cause of child mortality – the child may also suffer
from undernutrition. Intersectoral
collaboration between community
health workers and those responsible for the improvement of water
and sanitation facilities is therefore
imperative. Measures to improve
feeding practices – through, for
example, greater attention to food
hygiene – are often undermined
by poor and contaminated water
supplies and inadequate sanitation
facilities.21 Similarly, measures to
strengthen referral systems would
benefit from improved road infrastructure, facilitating transport
to and from health facilities for
patients, health workers and essential medical and food supplies.
Secure financing
Financing for community-based
health programmes may come
from a variety of sources, including
community members themselves;
municipal or district governments
via local health facilities; private
patrons or community organizations; and national governments or
non-governmental organizations at
higher administrative levels within
the country or overseas.
Securing financing for communitybased programmes is a complex
and sometimes contentious process,
and an in-depth review of the arguments is beyond the scope of this
report. Much of the financing for
child health in low-income countries, however, will continue to be
provided by external donors. For a
community-based programme to be
successful, it must be sustainable
over the longer term, with the concurrent assumption that it requires
a firm financing base once donor
funding is withdrawn.
This is far from easy. Countries
and districts with low health-system
capacity and limited financial means
may struggle to maintain even mediumsized programmes in the absence of
donor funding. In addition, there are
no simple answers to developing financial structures that are sound and
self-sufficient. In particular, health
workers at the community level
require some type of financial incentives to feed their families and secure
their continued participation and motivation in the programme. Similarly,
skilled but often underpaid professionals may require financial compensation for work in deprived areas and
with community programmes.
Considerations of sustainability and
equity mean that the issue of costsharing in the form of user fees for
health care and other essential services within the community should be
addressed by communities themselves.
When fees are charged, they should
be set at levels that do not hamper
attendance for important services.
Such services as immunizations and
emergency care should be free. It
is desirable that any cost-sharing
schemes charged for services within
the community be retained and managed by the communities themselves
and used for activities that directly
benefit them, such as purchasing
drugs or performance incentives for
health workers. Community health
committees, ideally comprising community members, health workers and
local health-facility managers, should
be the conduit for payment of community health workers. When the
community decides to charge fees for
health services, a system should be set
up so those who cannot afford to pay,
as determined by the community, will
receive all services at no cost.22
Integration of community
programmes into district services
and national policies
Community partnerships in health,
nutrition, water and sanitation and
AIDS abound across the developing
world. Their potential is not in
doubt, though there are clearly many
elements involved in making them a
success and, correspondingly, many
threats to their sustainability and
reach. Two key elements that can
help sustain and support communitybased initiatives are active support
from provincial and central governments, and integration into government policies, plans and budgets.
Maternal and child survival, health
and nutrition should feature prominently in national and decentralized
plans and budgets, with clear goals
and concrete benchmarks. Strategies
for child survival must be formulated
through consultative processes,
involving representatives from the
community, district and national
levels, as well as the donor community. Understanding variations in the
epidemiological profiles that exist
within a country is an essential first
step towards developing a targeted
strategy. Equally important are
detailed assessments of financial realities and existing levels of infrastructure at the community, district and
national levels of health-care delivery.
These aspects are vital to the successful execution of a national strategy
for child and maternal health and
must, therefore, be considered at the
outset of any planning exercise.
C O M M U N I T Y PA RT N E R S H I P S I N P R I M A R Y H E A LT H C A R E
57
© UNICEF/HQ97-1086/Giacomo Pirozzi
Community-based programmes are strengthened when there is access to facility-based
care. A health worker prepares a solution of oral rehydration salts, Eritrea.
National strategies must give priority
attention to the removal of obstacles
to effective scaling up and implementation at different levels of the health
systems (see Chapter 4 for further
details on measures to address bottlenecks in health-service delivery). Well
known bottlenecks include irregular
immunization sessions, negative
experiences with the health system,
distance to health centres and lack
of information. At the family and
community level, effective coverage
of primary-health-care services is
often impeded by lack of basic
affordable supplies, low demand
and other fundamental challenges,
such as mosquito nets not being
treated with insecticide.23
Both the short-term, disease-specific
initiatives – increasingly supported
by new international donor partner-
58
ships – and longer-term, healthsector development programmes
are likely to continue to coexist.
Sufficient human and financial
resources must be invested in both
sets of initiatives to produce sustainable gains for child health. Donordriven, disease-specific partnerships
should consider adapting their
approaches into multisectoral frameworks that align with national health
priorities, with equitable benefits for
the whole national health system.24
The ultimate responsibility for ensuring children’s rights to health and
nutrition lies with national governments in partnership with civil society. Governments have an important
role in developing and implementing
policies to lower the barriers to primary health care, in improving the
quality and efficiency of service
T H E S TAT E O F T H E W O R L D ’ S C H I L D R E N 2 0 0 8
providers and in increasing public
accountability. At the same time,
health policies must be accountable
to the communities and districts they
serve. Governments and health systems must be closely attuned to the
needs and interests of the population.
Developing effective, child-focused
health policies and building strong
institutions between communities
and health systems is critical; in most
countries, increases in health expenditures will need to be accompanied
by substantial improvements in
the policy environment to achieve
significant progress towards the
health-related Millennium
Development Goals.25
Finding the appropriate mix of
solutions for enhanced health
and nutrition outcomes
Each developing country has a
unique mix of opportunities for,
and constraints on, the development
of its health system, owing to differing levels of economic progress,
environmental and institutional circumstances, political situation and
current health-system capacity. As
a result, there is no universally
applicable method of fostering
improvement. Some may find that
their greatest challenge lies not
in scaling up community-based
approaches to essential health-care
packages nationwide, but in strengthening and expanding service delivery
through facility-based programmes,
decentralizing health services, and
addressing non-communicable
diseases and conditions, such as
diabetes and obesity.26
For low-income countries, particularly those where large proportions
Focus
On
Mozambique: Reducing under-five mortality through
a community-based programme
Context and challenge: Mozambique is one of the world’s
poorest countries, with gross national income per capita of
just US$340 in 2006 and an under-five mortality rate of 138
deaths per 1,000 live births. Life expectancy at birth is just
42 years, more than 40 per cent of children under five are
suffering from moderate or severe stunting, and only one
third of the population is using adequate sanitation facilities. Access to essential health-care services is limited, with
23 per cent of infants lacking a measles vaccine. Only 10
per cent of children sleep under a mosquito net (treated or
untreated). And almost two thirds of the population live
in rural areas, where only 1 in every 4 has access to an
improved source of drinking water.
ing, use of oral rehydration therapy and insecticide-treated
mosquito nets. The programme strengthened referral to
local health facilities and case management of common
illnesses at the facilities.
The challenge was to deliver an effective communitybased child survival programme to rural communities
with poor physical and environmental health infrastructure, and verify that the community programme contributed to mortality reduction.
Results: The project also implemented a community-based
vital registration and health information system through
the 2,300 community volunteers who collected data on
births, deaths and childhood illnesses every month. These
data were aggregated during the monthly meetings and
the registers sent to health posts operated by community
providers, or socorristas, who were trained by the district
Ministry of Health. The collated information was sent back
to local village health committees, health centres and the
Ministry of Health.
Approach: The Chokwe Ministry of Health and World Relief
partnership project in operation during 1999–2003 used
the ‘Care Group’ approach to implement a child survival
programme that aimed to address three elements of
Community Integrated Management of Childhood
Illness (C-IMCI):
• Improved partnerships between the health system and
the community.
• Increased accessible care for community-based providers.
• Promotion of essential household practices for child health.
The Care Group approach trains community educators
through group interaction. One volunteer Women’s Health
Educator provides peer-to-peer health education to 15 surrounding households, and 10 Women Health Educators
form a Care Group that meets once a month with a paid
supervisor. During monthly Care Group meetings, a health
field staff member or a Women’s Health Educator supervisor presents health messages about child survival and
women’s health. The Care Group members then practise
training with each other, sharing the information presented.
Before the next Care Group meeting, each volunteer is
responsible for visiting the households under her jurisdiction to relay the messages she has just learned.
The child survival programme was designed to be comprehensive, integrating breastfeeding, complementary feed-
Partnerships with UNICEF and the International Committee
of the Red Cross facilitated the provision of free insecticide-treated nets, vaccines and vitamin A supplements.
Close cooperation with village health committees and local
pastors provided support for the volunteers in carrying out
health promotion and community mobilization for such as
activities as distribution of insecticide-treated mosquito
nets and conducting immunization campaigns.
Data from the community-based vital registration and
health information system showed a 66 per cent reduction
in infant mortality and a 62 per cent reduction in under-five
mortality. To check the reliability of these findings, an independent mortality assessment was carried out by experienced researchers using a pregnancy history survey based
on standard methodologies applied in the Demographic
and Health Survey. This mortality survey found reductions
of 49 per cent and 42 per cent in infant mortality and underfive mortality, respectively.
These results demonstrated the effectiveness of the
Community IMCI and validated the fact that community
health workers can collect reliable health data for monitoring mortality.
See References, page 107.
C O M M U N I T Y PA RT N E R S H I P S I N P R I M A R Y H E A LT H C A R E
59
Community partnerships in water systems and school sanitation
Safe water systems in Afghanistan
The provision of safe water has been prioritized for many
years in both emergency and ongoing development programmes throughout the world. Improving the quality of
drinking water at the household level through point-of-use
treatment and improved storage has been hailed by many
as a simple and low-cost approach to preventing waterborne diseases. A development partnership has emerged
between the Centers for Disease Control and Prevention,
Population Services International, UNICEF, United States
Agency for International Development (USAID) and WHO,
as well as other institutions, to produce and distribute
the products families need to achieve safe water in the
household; together, these products are called safe water
systems (SWS).
Safe water systems incorporate three elements:
• Point-of-use water treatment by consumers with a locally
partnerships and market-based approaches, with community
mobilization implemented by non-government organizations
to encourage correct and consistent use and reach high-risk
populations.
Safe water systems are being promoted and introduced in 23
countries worldwide, and have been shown to reduce the incidence of diarrhoeal disease by 25–84 per cent. They have been
particularly effective in protecting the most vulnerable populations: infants, immunocompromised individuals and their families, and communities experiencing outbreaks of cholera.
In Afghanistan, a country with high maternal mortality
and low ante- and postnatal attendance at health facilities,
SWS have been introduced as part of the maternal health
programmes. In order to attract greater attendance at health
facilities, pregnant women and new mothers have been
offered SWS and hygiene kits and taught how to use these
simple technologies to protect themselves and their families.
manufactured dilute sodium hypochlorite (bleach) solution.
Bangladesh: School sanitation and hygiene education
• Safe storage of treated water in containers designed to
prevent recontamination.
• Behaviour change with respect to improved water and food
handling, sanitation and hygiene practices in the home and
in the community.
Combining the skills and resources of various partners, SWS
products are produced and distributed through public-private
of mothers and children remain
excluded from facility-based programmes, and whose health system
capacity has been undermined by
years of underinvestment and mismanagement, weak governance,
mass migration of professional
health workers, complex emergencies
or the AIDS epidemic, determining
the best strategy is neither straightforward nor without risks. In such
countries, an important and perhaps
overriding consideration is feasibility, under the guise of the following
question: What is the most appropri-
60
A water, sanitation and hygiene project in a remote village in
Bangladesh, combined with a school sanitation and hygiene
education (SSHE) component in the secondary school,
demonstrate the importance of community participation and
action and the positive impacts on the community. The village of Gava is located in south-western Bangladesh. NGO
Forum decided to rethink its approach to water, sanitation
and hygiene education at village level. One approach that
seemed promising was to start with the village schools.
ate, cost-effective, timely and sustainable strategy for improving
maternal, newborn and child survival and health and increasing coverage of essential services and commodities, given the current strength
of a country’s health, nutrition and
environmental health systems?27
The feasibility paradigm aims to
address the urgent needs of the
poorest and most marginalized societies – where maternal, newborn and
child mortality rates are highest –
that are most lacking in basic preven-
T H E S TAT E O F T H E W O R L D ’ S C H I L D R E N 2 0 0 8
tive services, such as immunization
and access to drugs and emergency
care. In countries with relatively
weak health, nutrition and water and
sanitation systems and low healthsystem capacity, community-based
approaches that rely less on health
facilities and outreach services can
help expand coverage of essential
services, products and practices –
particularly if basic preventive services such as immunizations are already
in place.28 It must be stressed,
however, that in order to underpin
sustainability, the expansion of
Young people of school age are open to new information
and can be easily motivated, and the organization was keen
to utilize this potential.
‘WatSan’ Committees were formed at the level of the school
and for each class. The school headmaster was selected as
the chairperson of the School WatSan Committee. The class
committees consisted of teachers and students, both girls
and boys, for each class of the school. A number of orientation sessions were organized for these committees, covering
such issues as the promotion and use of safe water, better
sanitation and hygiene practices, effective interpersonal communication between students and parents, and community
mobilization. Motivational film shows were organized, and
different behavioural change information, education and
communication materials were distributed among the teachers and students for use in conducting group discussions in
the community.
The students organized rallies and processions using
different types of promotional posters and banners, chanting
slogans on the importance of using safe water and hygienic
latrines, and practising improved personal hygiene. This
raised mass awareness throughout the village. Along with
the committees, student brigades consisting of five boys and
girls were formed in each class. These groups monitored the
use of safe WatSan and hygiene practices at the household
level. They also provided help with non-technical primaryhealth-care services, such as oral rehydration. The brigades
also made plans to respond to natural disasters. Another
community partnerships must be
conducted in conjunction with efforts
to overcome system-wide bottlenecks
in facility-based maternal and child
health and nutrition services, and
address other behavioural, institutional and environmental constraints.
committee, the ‘Teachers’ and Parents’ Forum’, was created
and held quarterly meetings to review progress.
A review of the project demonstrated that SSHE can
contribute to the well-being and performance of students,
for example, in helping to keep girls in school. Involving
schools and students as community motivators is a powerful tool in improving WatSan and hygiene practices. In
Gava village, before-and-after studies show greater knowledge of related diseases, an increase in the construction
and use of hygienic latrines, higher usage of safe drinking
water and increased hand washing by heads of households. The process of motivation started from the top and
continued to the bottom.
NGO Forum is expanding from a few pilot villages to working in many more, each needing a programme approach. It
is faced with two major issues. One is to refine the finances
of such village projects so that maintenance becomes selfsustainable, and the other is to achieve the same impact
in many villages with far fewer inputs. Nevertheless, there
are great potential benefits from such programmes to the
students and the communities they live in. Pilot projects
such as this one in Gava demonstrate that the benefits are
achievable.
See References, page 107.
The next chapter focuses on scaling
up community partnerships in health,
nutrition and environmental health
care. Although many of the arguments
cited are perhaps most applicable to
low-income countries and marginalized or impoverished communities,
much of the discourse is also relevant
to countries and communities in less
challenged circumstances.
C O M M U N I T Y PA RT N E R S H I P S I N P R I M A R Y H E A LT H C A R E
61
Accelerating
progress in child
survival will require applying the
lessons learned from a century of
health-sector development and
taking effective approaches to
strengthen community partnerships, the continuum of care and
health systems.
SUMMARY
This chapter brings together two
strands – action and partnerships –
into a framework for effective
scale-up of a continuum of care for
maternal, newborn and child health
as the primary means to ensure
health- system development for
outcomes. It outlines five distinct
yet related actions required in programmes, policies and partnerships
in the coming decade.
Action I: Realign programmes from
disease-specific interventions to
evidence-based, high-impact,
integrated packages to ensure a
continuum of care.
Action II: Make maternal and child
health a central tenet of integrated
national planning processes for
scaling up essential services.
Action III: Improve the quality
and consistency of financing for
strengthening health systems.
Action IV: Foster and sustain political commitment, national and international leadership and sustained
financing to develop health systems.
Action V: Create conditions
for greater harmonization of
global health programmes and
partnerships.
For governments, donors and
international agencies and global
Scaling up essential health-care
interventions and approaches requires
a comprehensive understanding of both
the strategies that accelerate progress
and the challenges that hinder it. A
health worker weighs a baby for
growth monitoring, Philippines.
health partnerships, effective
scale-up will require a new way
of working in primary health care
among the key stakeholders. The
central theme of this paradigm
is unity. Initiatives and partnerships directed towards improving
aspects of maternal and child
health abound and continue to
proliferate, but they will require
greater coherence and harmonization to meet the health-related
Millennium Development Goals
for mothers and children.
T H E S TAT E O F T H E W O R L D ’ S C H I L D R E N 2 0 0 8
© UNICEF/HQ96-1005/Shehzad Noorani
Strengthening community
partnerships, the continuum
of care, and health systems
The review of community partnerships
presented in Chapter 3 underlines
their potential to accelerate improvements in maternal, newborn and
child health. Evidence shows, for
instance, that using a combination
of community outreach programmes
and family-community care strategies
at 90 per cent coverage could reduce
neonatal mortality by 18–37 per cent,
even in the absence of improvements
in facility-based care services.1 What
is needed, therefore, are innovative
strategies for exploiting the full
potential of community partnerships
in primary health care on a large
scale, ideally as part of an overall
effort to strengthen national health
systems.
The lessons learned from taking effective approaches to scale are being
applied in an increasingly collaborative manner. The key international
agencies working for maternal and
child survival and health – UNICEF,
United Nations Population Fund,
World Health Organization and
World Bank – are working with
donors, governments and other leading
international organizations, such as the
African Union, around frameworks
and strategies to scale up access to primary health care.
‘Going to scale’: What will
it take?
Scaling up existing interventions is
critical to accelerating progress on the
health-related Millennium Development Goals for children and women –
particularly in sub-Saharan Africa
and South Asia, which together
accounted for more than 80 per cent
of all child deaths in 2006.
There is consensus on expanding the
provision of essential services and
practices on a grand scale, but it is
evident that this may be easier said
than done. Scaling up involves a complex range of actions, many of which
are interrelated, to both achieve
breadth and ensure the long–term
sustainability of the expansion.
At the programmatic and policy levels,
it is not enough simply to expand
the delivery of packages of low-cost,
proven interventions: Behavioural,
institutional and environmental impediments that can impede access must
also be addressed as part of the
4
scaling-up process. Success requires
an in-depth understanding of these
obstacles, as well as of the strategies
for circumventing them.
For governments, donors and international agencies and global health
partnerships, effective scale-up will
require a new way of working in
primary health care among the key
stakeholders. Initiatives and partnerships directed towards improving
aspects of maternal and child health
abound and continue to proliferate,
but without greater coherence and harmonization, these disparate efforts risk
falling short of achieving the healthrelated MDGs in the coming years.
This chapter brings together these
two strands – action and partnerships
– into a framework for effective
scale-up of a continuum of care for
maternal, newborn and child health.
It outlines five distinct yet related
actions that are required in programmes, policies and partnerships
in the coming decade:
• Action I: Realign programmes
from disease-specific interventions
to evidence-based, high-impact,
63
integrated packages to ensure a
continuum of care across time
and place.
• Action II: Ensure that maternal,
newborn and child health are a
central part of an improved and
integrated national strategic planning process for scaling up services
and strengthening health systems.
• Action III: Improve the quality
and consistency of financing for
strengthening health systems.
• Action IV: Foster and sustain the
political commitment, national and
international leadership and sustained financing for guaranteeing
access to the continuum of care.2
• Action V: Create conditions
for greater harmonization of
global health programmes and
partnerships.
I. Realigning programmes
From interventions to a
continuum of care
To date, much of the work and
support of the international health
community for maternal, newborn
and child health has focused on
disease-specific approaches, which
have a strong evidence base and
track record in scaling up. When
well resourced, targeted, managed,
funded and implemented at scale,
specific interventions have often
contributed to reductions in disease
incidence and child mortality.
These interventions are not without
their limitations, however – not
least because they have often failed
to consider upstream constraints,
such as governance, management
and human resource limitations.
In addition, the targeted focus of
disease-specific approaches may
limit synergies that could strengthen
the broader health system.
Scaling up to achieve a continuum of
care across time and place is increasingly viewed as one of the most promising ways to accelerate progress
towards the health-related MDGs.
However, the evidence base on the
effectiveness and feasibility of the continuum of care is much less developed
than for disease-specific interventions,
and there is a growing need to gather
evidence on how the latter approach
can function in practice. It will require
new frameworks and processes, especially with regards to the organization
of programmes. These will call for
several changes, namely:
• Specifying the intervention packages.
• Identifying benchmarks and targets
• Integrating delivery strategies.
Figure 4.1
Conceptual framework for scaling up primary health care in developing countries
Source: Derived from UNICEF, ‘Joint Health and Nutrition Strategy for 2006-2015’, UNICEF, New York, November 2005. p.10.
64
T H E S TAT E O F T H E W O R L D ’ S C H I L D R E N 2 0 0 8
Scaling up the continuum of care will
also require adapting programme
management structures to reflect
the integration of the various components of the intervention packages.
This will necessitate enhancing institutional and individual capacities,
overcoming resistance to change, and
integrating and coordinating fragmented funding streams, particularly
those coming from international
donors and partnerships.3
Packaging interventions by
service delivery mode
Packaging a range of evidence-based,
cost-effective interventions has the
potential to be among the most
effective methods to accelerate
improvements in maternal, newborn
and child health. Scaling up requires
that countries identify a continuum
of care based on the following three
service delivery modes:
• Family-oriented, community-based
services: Provided on a regular
basis by community health/nutrition promoters, with periodic oversight from skilled professionals.
• Population-oriented scheduled
services: Provided by skilled or
semi-skilled health staff, such as
auxiliary nurses or birth attendants
and other paramedical staff,
through outreach or in facilities.
• Individually oriented clinical
services: Interventions that require
the attention of health workers
with advanced skills, such as
midwives, nurses or physicians,
available on a permanent basis.4
The services delivered will depend on
the country context and the capacity
of its health system. The removal of
bottlenecks can provide the scope for
increased coverage.
Combining the delivery of interventions according to age-specific contacts
with health and nutrition services can
generate economies of scale in terms
of both cost and time and enhance
the number of services that are accessible to children and mothers. Packaging
low-cost interventions, such as vaccines, antibiotics, insecticide-treated
mosquito nets and vitamin A supplementation, and adding the promotion
of improved feeding and hygiene
practices, the packaged approach can
markedly increase service coverage.5
Community partnerships are vital to
the success of integrated packages.
One effective intervention can often
provide the entry point for successful
integration of several measures into a
child health package.
In Nepal, for example, the national
vitamin A campaign trained community volunteers to build their capacities, creating a respected and credible
cadre. By the time the volunteers
were trained to assess and treat children for acute respiratory infections,
they had already earned the trust of
parents and developed the confidence
necessary to perform this more complex task.
A similar experience is seen in
Madagascar, where families are introduced to the importance of adopting
several different improved health
practices simultaneously, with immunization serving as the entry point for
other services. An extensive community mobilization programme draws
sustained attention to the essential
actions required of families to promote children’s health.6
Special attention to equity is needed
when delivering packaged interventions to reach the poorest and most
marginalized mothers and children.
Although the packaged approach will
indeed increase access to a greater
range of services for many mothers
and children at each point of delivery, it may also result in a growing
gap in coverage between those with
access to services and those who
remain excluded.7
II. National strategic planning
for scaling up services and
strengthening health systems
Realigning primary health care from
disease-specific interventions to a
continuum of care and expanding the
coverage of packaged interventions
will require a sound policy base. This
fact has been increasingly recognized
in a series of high-level forums held
since 2003 to assess ways of accelerating progress towards the healthrelated MDGs.8 Over time, these
gatherings have identified critical
upstream constraints at the policy
level that need to be urgently tackled
to support effective scale-up. One of
their main conclusions is that weak
health systems and a lack of funding
for health-system development risk
limiting the impact of expanded
efforts to fight specific diseases, as
well as leaving mothers and children
particularly vulnerable to a country’s
overall burden of disease.
Scaling up services and systems will
require practical, effective strategies
at the national level that take into
account not only the potential for
S T R E N G T H E N I N G C O M M U N I T Y PA R T N E R S H I P S , T H E C O N T I N U U M O F C A R E , A N D H E A LT H S Y S T E M S
65
Scaling up: Adequate nutrition for mothers, newborns and children
Undernutrition is the underlying factor in up to 50 per
cent of under-five deaths, and there is evidence of links
between a mother’s nutritional status and the risk of
maternal and child death. Among the developing countries and territories, more than one quarter of children
under age five were moderately or severely underweight
or stunted in 2000–2006, and 28 per cent of children
aged 6–59 months were still not receiving vitamin A
supplementation in 2005.
low birthweights and of children under five who are moderately or severely underweight, wasted or stunted – and
the lowest rates of vitamin A supplementation. Although
sub-Saharan Africa has moderately better numbers for
these indicators, it is the region with the lowest rates of
exclusive breastfeeding for infants under six months, and
severe acute undernutrition remains a pressing problem.
The country examples below illustrate ways in which these
issues are successfully being addressed in the region.
Food security, though necessary, is insufficient by itself to
avert undernutrition, as evidenced by the many children
who have been found to be underweight or stunted in
food-secure or non-poor environments. Undernutrition
results from an array of interrelated factors, including
inappropriate feeding and care practices, inadequate
sanitation, disease, poor access to health services, and
weak knowledge of the benefits of exclusive breastfeeding, complementary feeding practices and the role of
micronutrients. Diarrhoea, which often results from poor
sanitation facilities and hygiene practices, is a contributing factor to undernutrition. Another contributing factor to
undernutrition among infants and young children is the
lack of supportive environments for many mothers, who
may have limited time to care for themselves during pregnancy, or for their infants, due to household demands and
insufficient access to health services.
Benin: Teaching mothers about the importance
of breastfeeding
Scaling up effective nutrition strategies across a continuum of care for mothers, newborns and children demands
an integrated approach. It requires the sustained engagement of parents and communities, supported by local and
national development of primary health care and environmental health services, particularly water and sanitation.
When these prerequisites are in place, they can lead to
remarkable results in a relatively short time. In Thailand,
for example, moderate and severe undernutrition were
reduced through such means by 75 per cent or more in
a decade. And, in spite of considerable economic setbacks, many developing countries have made impressive
progress in providing essential vitamins and minerals to
their citizens. Nearly 70 per cent of households in developing countries consume iodized salt, about 450 million
children now receive vitamin A capsules, and health
strategies, particularly community partnerships, are
employing new and innovative ways to promote and
support breastfeeding.
Undernutrition in the developing regions is highest in
South Asia, which has the highest rates of infants with
66
In Benin, the 1996 Demographic and Health Survey
(DHS) reported that only about 16 per cent of newborns
in the Borgou Region were breastfed within the first hour,
and in 1998 less than 1 in 5 infants under four months old,
or 14 per cent, benefited from exclusive breastfeeding.
To address this challenge, as well as some of the broader
nutritional challenges associated the high rates of
malnutrition and infant mortality, the Essential Nutrition
Actions programme was introduced in 1997. In order
to reinforce essential nutrition-related behaviours, the
programme emphasized six measures in health facilities
and communities:
• Exclusive breastfeeding for infants up to 6 months.
• Appropriate complementary feeding with continued
breastfeeding from 6–24 months.
• Vitamin A supplementation for children.
• Iron and folic acid supplementation for pregnant
women.
• Iodized salt supplementation.
• Support and counselling for undernourished and sick
children.
Essential Nutrition Actions has effectively combined
measures designed to strengthen the health system, such
as training for health workers, with community mobilization and a large-scale communications campaign tailored
to the specific conditions of the target populations.
Community leaders were actively involved in selecting
community volunteers, known as relais communautaires,
who provided the link between communities and health
facilities and were trained in nutrition activities. Youth,
traditional singers, community theatre groups, and
women’s and other community groups participated
T H E S TAT E O F T H E W O R L D ’ S C H I L D R E N 2 0 0 8
in workshops to develop messages and materials.
Community theatre groups performed dramas in villages
and neighbourhoods, while community radio stations
broadcast spots, games and dramas developed in the
workshops.
three quarters of the severely undernourished children
who presented were treated solely as outpatients.
Furthermore, initial data indicate these programmes
are affordable, with costs varying between US$12 and
US$132 per year of life gained.
This vast community mobilization led to a genuine
change in breastfeeding behaviour among mothers.
In 2001, nearly 50 per cent of mothers with infants under
four months old in these areas reported that their babies
were exclusively breastfed. Furthermore, in 2002, selected
communities in Borgou reported exclusive breastfeeding
of infants under four months of 61 per cent, compared to
40 per cent in 1999.
Community-based therapeutic care programmes use new,
ready-to-use therapeutic foods that in many cases are
made locally from local crops. Their implementation is
based on three premises:
Community-based management of severe acute
undernutrition in Ethiopia, Malawi and Sudan
Severe acute undernutrition remains a major killer of children under five years of age. Until recently, treatment has
been restricted to facility-based approaches, greatly limiting its coverage and impact, because in many poor countries children who are severely malnourished are never
brought to a health facility. New evidence suggests, however, that large numbers of these children can be treated in
their communities without being admitted to a health facility or a therapeutic feeding centre. The community-based
approach involves timely detection of severe acute undernutrition in the community and provision of treatment for
those without medical complications with ready-to-use
therapeutic foods or other nutrient-dense foods at home.
If properly combined with a facility-based approach for
those undernourished children with medical complications and implemented on a large scale, communitybased management of severe acute undernutrition could
prevent the deaths of hundreds of thousands of children.
Recent evidence from Ethiopia, Malawi and Sudan
illustrates the high impact and cost-effectiveness of community-based management of severe acute malnutrition.
In contrast to treatment in health facilities – where in
most developing countries fatality rates have remained
largely unchanged for the past five decades – communitybased therapeutic care has brought about a fundamental
shift in the understanding of the disease and the implementation of treatment. To date, data from more than 20
programmes implemented in Ethiopia, Malawi, and North
and South Sudan between 2000 and 2005 indicate these
programmes achieved recovery rates of almost 80 per
cent and reduced mortality rates to as little as 4 per cent.
Coverage rates reached 73 per cent, while more than
• Underlying all programmes is a strong emphasis on the
importance of early care in the evolution of malnutrition
and the need for patients to remain in a nutritional
programme until recovery.
• Programmes start from the assumption that in order to
present early and comply with treatment, families and
communities must understand, accept and participate in
the programmes.
• Programmes focus on the involvement of key stakeholders who can benefit from the feedback and attention
successful programmes generate and thus have a stake
in their long-term sustainability.
The results of community-based programmes to address
severe acute undernutrition suggest that, even though
they cannot eliminate the need for external assistance,
scaled-up treatment can have a major public health
impact, preventing hundreds of thousands of child deaths.
See References, page 108.
S T R E N G T H E N I N G C O M M U N I T Y PA R T N E R S H I P S , T H E C O N T I N U U M O F C A R E , A N D H E A LT H S Y S T E M S
67
expansion of interventions but also
the constraints and obstacles that
might impede advances, outlining
ways to overcome the latter. Key
measures required in national strategic plans to scale up the packaged
interventions outlined in the previous
section include:
• Identify and remove health-system
bottlenecks.
• Monitor progress and problems in
coverage.
• Phase in intervention packages and
health-system strengthening.
• Address the human resource crisis
in health care.
• Develop health systems for
outcomes.
• Strengthen health systems at the
district level.
Identify and address
health-system bottlenecks
Functional service delivery networks
are necessary to provide a continuum
of care, based on the three levels of
service delivery outlined in the previous section: family and community;
decentralized, close-to-client primary
services; and facility-based referral
care and specialized preventive services. An initial step involves gathering
data and qualitative information on
all existing service providers (public,
private and informal) and organizations (including non-governmental
organizations) that can be mobilized
in support of the scaling-up effort.
One example of this process is provided by upper eastern Ghana, where
68
there are many non-governmental
organizations supporting different
health interventions. Collaboration
between the Ghana Red Cross
Mothers Clubs, the national health
services and UNICEF under the
Accelerated Child Survival and
Development programme has succeeded in integrating the efforts
of all these organizations and focusing their support on scaling up an
evidence-based package of highimpact, low-cost interventions.9
Chapter 3 can play a unique and vital
role in enhancing contact between
dedicated health workers – including
community health workers – and
services, and households and communities that are currently lacking
essential interventions. But facilitybased care and outreach workers
will be required both to support
community health workers and to
provide services for many health
interventions that require more
specialized assistance.11
Other important steps are to identify
and analyse system-wide bottlenecks
and constraints and to formulate
strategies to remove or overcome
them.10 These may originate at the
level of facilities, outreach or communities and households, or from the
strategic and bureaucratic apparatus
that sets policies, controls logistics
and supplies, and drafts and implements regulations. Figure 4.2, page
69, illustrates the main potential bottlenecks to service delivery at each
level of a country’s health system,
and the policy and governance context in which it operates. A new tool
for analysing these constraints is
Marginal Budgeting for Bottlenecks,
outlined in the panel on page 70.
Improving the performance and motivation of health workers and ensuring
that facilities are adequately equipped
and drugs are readily available are
essential second-line requirements to
support community partnerships in
health and nutrition and to enhance
the quality of service delivery. Part
of the solution to improving service
delivery undeniably involves increasing resources – human, financial and
managerial – and providing training,
but other incentives and better
human resource management may
also be needed.
Many bottlenecks will demand a specific solution that involves addressing
constraints at various levels of service
delivery. For example, low demand
for quality health services among
community members or the limited
capacity of health facilities and extension workers to deliver essential
services may restrict the coverage
of intervention packages, as may
financial, social and physical barriers
to access. Here, appropriately, the
community partnerships elaborated in
T H E S TAT E O F T H E W O R L D ’ S C H I L D R E N 2 0 0 8
Higher-level determinants of healthsystem performance – policy and
strategic management, multi-sectoral
public policies and environmental and
contextual change – are among the
most complex challenges for healthsystem development, for they form part
of a political and institutional context
that may not change readily or easily.12
Nonetheless, sound leadership, advocacy, technical assistance and partnerships can help to prompt change.
Monitor progress and constraints
in expanding coverage
Regular monitoring, feedback and
adaptation of programmes on the
basis of evaluation and evidence are
widely recognized as integral components of a well functioning health
system. Without these, rigorous
assessment of programmes’ effectiveness is not possible. Sound, evidence-based public health calls for
a solid knowledge base on disease
frequency and distribution, on the
determinants and consequences of
diseases and conditions, and on the
safety, efficacy and effectiveness of
interventions and their costs. Health
surveys and research on the impact
of approaches and strategies are
imperative to collating essential
evidence, learning key lessons and
developing best practices.
Monitoring coverage is also vital
to enabling rapid adjustments in policies and interventions to be made.
Measurements of the health-based
MDGs depend considerably on
such large-scale instruments as
Demographic and Health Surveys
(DHS) and Multiple Indicator Cluster
Surveys (MICS). The MDG indicators
provide core parameters by which
progress towards the health-related
goals can be measured. Many of these
are provided as part of the minimum
set of high-priority indicators for
child survival that have been agreed
upon by UNICEF and WHO in collaboration with partners in the context of the Countdown for Maternal,
Newborn and Child Survival process.
MICS and DHS provide periodic data
for determining effective coverage with
the minimum package of essential
interventions. To enhance surveillance,
the interval between these surveys is
being reduced from five to three years.
In addition, national, subnational and
community-based monitoring processes are pivotal to analyse progress and
problems in scaling up high-impact
interventions.
Several developing countries are
using innovative measures to monitor
the impact of health programmes
on populations and collate vital
health information. One such country is Bolivia, where a census-based
approach was used to identify the
entire programme population
through biannual visits to all homes.
This census was then used to target
selected high-impact interventions
to those children at greatest risk of
mortality. As a result of this approach,
the mortality level of under-fives in
areas where health programmes were
Figure 4.2
Ways of addressing bottlenecks in health-service delivery
ACTION
IMPACT
Select proven interventions.
Lower infant and maternal mortality.
Supervise training.
Improve quality of health-care provision
(effective coverage).
Track defaulters and conduct home
visits.
Improve the range and extent of healthcare provision (adequate coverage).
Mobilize families and communities.
Enhance initial utilization of services
(enhanced demand and affordability).
Implement health extension and
micro-planned outreach.
Broaden geographic access to services.
Implement training and deployment of
new staff by community promoters.
Increase availability of human resources
in health-care provision.
Rationalize supply systems.
Bolster availability of drugs and other
essential medical supplies.
Source: UNICEF, World Bank and World Health Organization, 'A Strategic Framework for Reaching the Millennium Development
Goals in Africa through health system strengthening and implementing at scale of integrated packages of high-impact and
low-cost health and nutrition interventions', draft prepared on request of the African Union by UNICEF, WHO and the World Bank,
September 2006, p. 25.
S T R E N G T H E N I N G C O M M U N I T Y PA R T N E R S H I P S , T H E C O N T I N U U M O F C A R E , A N D H E A LT H S Y S T E M S
69
'Marginal Budgeting for Bottlenecks'
‘Marginal Budgeting for Bottlenecks’ is a result-based planning and budgeting tool that utilizes knowledge about the
impact of interventions on child and maternal mortality in a
country, identifies implementation constraints and estimates
the marginal costs of overcoming these constraints. This
tool, which has been employed in the preparation of key
strategic frameworks for maternal, newborn and child health
in sub-Saharan Africa, was jointly developed by UNICEF, the
World Bank and WHO. It is being used to assist in setting
targets for proven high-impact interventions, and the estimation of their expected impact, cost per life saved and additional funding requirements, as well as a projection of the
required fiscal space to finance these extra costs. (Fiscal
space can be defined as the availability of budgetary room
that allows a government to provide resources for a desired
purpose, e.g., overcoming barriers to maternal, newborn and
child health care without any prejudice to the sustainability
of a government’s financial position.)
Marginal Budgeting for Bottlenecks consists of five key steps:
• An assessment of the key indicators, trends in and cause
of maternal, newborn and child mortality and morbidity
and access to essential services, and the selection and
packaging of evidence-based, high-impact interventions
to address the proximate causes by service delivery mode,
i.e., family/community-based care, schedulable populationoriented services and mobile strategies, or individually
oriented clinical care at primary- and referral-level facilities.
operating was one third to one half
of the average under-five mortality
rate in the control districts.13
Phase in intervention packages
and strengthen health systems
It is increasingly recognized that
actions to scale up packages of interventions may need to be phased,
depending on such contingencies
as budget availability, logistical constraints, technical capacity or socioeconomic and cultural factors. While
some interventions may be rapidly
expanded, others will require a longer
70
• Identification of system-wide supply and demand bottlenecks to adequate and effective coverage of essential
primary-health-care services, and obstacles to the application of high-impact intervention packages in each of the
main service delivery modes. Adequate coverage includes
such factors as the availability of essential drugs and supplies, access to health services and health workers, initial
utilization of health-care services and continuity of usage
of service. Subsequent examination of underlying causes
of bottlenecks and the development of promising strategies
to overcome them allows for the setting of ‘frontiers’ –
coverage levels of intervention packages that are adequate,
effective and achievable once bottlenecks are removed.
• Estimation of the expected impact on survival rates for each
of the interventions. These estimations are based on recent,
in-depth analysis of the evidence on the efficacy of highimpact interventions and packages in determining maternal
and child survival and health outcomes. They are calculated
in a residual way to avoid double counting survival rates.
• Selection of the types, quantities and costs of additional inputs,
such as salaries, drugs and training, which are needed to
implement the actions to overcome bottlenecks and to lift the
effective coverage of intervention packages to their frontiers.
• Analysis of budgetary implications, the identification of
likely sources of funding and the comparison of the marginal costs and additional funding needs to the ’fiscal space’
time frame. Scaling up minimum packages of essential interventions forms a
key component of the new strategies,
with the aim of achieving specific
coverage targets. Intervention packages
are being prepared to meet these
agreed targets through the three core
service delivery modes discussed previously, delivered in three phases.14
A phased approach to health service
delivery will allow each country to
define and implement an initial
package of interventions that can
then be expanded over time. Both
T H E S TAT E O F T H E W O R L D ’ S C H I L D R E N 2 0 0 8
the packaging and the delivery of
the priority interventions will
depend on the country’s healthsystem capacity. The gradual removal
of bottlenecks will facilitate the
expansion of service delivery –
including in situations of complex
emergencies. Since the packaged
approach is results-oriented, the
implementation of priority interventions at scale can be planned and
monitored in a phased manner.
The three phases recommended for
expanding service delivery coverage
for health spending. (The fiscal space for health spending
in each country is projected by the World Bank and the
International Monetary Fund.)
Country examples of bottleneck analysis
Bottleneck analysis has been undertaken in around 25
developing countries and across the range of service delivery
modes. Proxies used to assess the coverage determinants
for each of the three modes of service delivery include the
following parameters (the list is not exhaustive):
improved drinking water, less than half of households
consumed water that had been treated to make it safe.
Strategies selected to address these bottlenecks include
scaling up water treatment and providing information,
education and communication initiatives to promote the
exclusive use of safe drinking water.
As reported at recent workshops:
Guinea: In 2000, 70 per cent of villages in the districts where
the Accelerated Child Survival and Development (ACSD)
programme was under way had a community health and
nutrition promoter, 50 per cent of families owned a mosquito
net, and 25 per cent of pregnant women slept under a net.
However, effective coverage was found to be far lower than
adequate coverage levels, since less than 5 per cent of individuals slept under a mosquito net that had been recently
treated with insecticide. This bottleneck to protection against
malaria was addressed through the free treatment of all existing mosquito nets with insecticide, combined with a heavily
subsidized distribution of insecticide-treated mosquito nets
that focused on pregnant women who were utilizing antenatal care and had completely immunized their children. By
2004, this integrated approach to removing bottlenecks had
increased the effective coverage of insecticide-treated mosquito nets by 40 per cent, while also increasing the effective
coverage of immunization (full course for children under five)
and antenatal care (at least three visits) from 40 per cent in
2002 to 70 per cent two years later.
Honduras: A bottleneck analysis of water, sanitation and
hygiene services revealed that despite ample access to
See References, page 108.
• Family and community care: Indicators include use of safe
water and sanitation facilities, and of insecticide-treated
mosquito nets; infant feeding and care for sick children
and newborns.
• Population-oriented schedulable services: Indicators include
levels of immunization and antenatal care.
• Clinical care: Indicators include skilled attendance at birth
and emergency obstetric and neonatal care.
Results from countries where the tool has been used have
revealed bottlenecks that were not immediately evident from
the examination of levels or trend data.
for countries with low health-system
capacity are as follows:
Phase one: The initial phase
focuses on reducing by half
system-wide bottlenecks for family/community-based care and
population-oriented outreach
services, fostering demand for
quality clinical services and providing a minimum package of
high impact, low-cost interventions that can be implemented
given the current policy, human
resources and capacity conditions.
Operational strategies include
the training and deployment of
community health and nutrition
promoters for improved family
care practices. The minimum
package of interventions typically
includes the following components:
• Antimalaria interventions
by measles mortality reduction
campaigns
• Integrated Management of
Neonatal and Childhood
Illnesses
• Skilled delivery and
newborn care and
emergency obstetric care
• Nutrition
• Hygiene promotion
• HIV and AIDS prevention and
treatment
• Immunization complemented
• Facility-based care
S T R E N G T H E N I N G C O M M U N I T Y PA R T N E R S H I P S , T H E C O N T I N U U M O F C A R E , A N D H E A LT H S Y S T E M S
71
Phase two: The second phase comprises an expanded package that includes
further neonatal and maternal interventions, improved water supplies and
adequate sanitation through national
policies and the mobilization of additional funding. This phase aims to
sustain and strengthen all three service
delivery modes by reducing supply
and demand bottlenecks.
Phase three: The final phase involves
the introduction and scaling up of
innovative interventions, such as
rotavirus and pneumococcal vaccines,
and enhancing the supply and
demand for this maximum package.15
Address the human resource
crisis in health care across
developing countries
In many countries, economic hardship and financial crises have destabilized and undermined health staff,
creating a vicious circle of demotivation, low productivity and underinvestment in human resources.
Tackling the health worker crisis
in developing countries will require
a mix of measures across various
time frames.
Short term: An immediate priority is
to ensure that expanding national and
global initiatives for maternal and
child health do not result in further
disruptions to the health system or
further significant loss of personnel.
Short to medium term: The productivity and morale of existing health-care
professionals need to be restored,
including through such incentives as
increased pay and improved supervision. The health workforce – including
community health workers – also
72
needs to be expanded within the
confines of the country’s overall
macroeconomic framework and
poverty reduction strategies.
Longer term: Tackling the health
worker crisis will also demand
massive increases in education and
training for health-care professionals.
Without improved training for medical professionals and increased
funding, the crisis may worsen, with
devastating implications for maternal, newborn and child survival
and health.
that will decrease attrition rates.
Several countries, including India,
Kenya, South Africa and Uganda
are considering national programmes
for community health workers,
while Ethiopia is training 30,000
community-based female health
extension workers to focus on
maternal, newborn and child health,
malaria, and HIV and AIDS.16
Programmes for community health
workers are also under way in
countries as diverse as Afghanistan,
Indonesia, Mozambique, Nepal
and Pakistan.
These measures will require strong
national leadership, based on a
broad consensus within society
that prioritizes quality health care.
Comprehensive plans to address the
health worker crisis are required to
move countries towards universal
access to the continuum of care.
Moreover, these plans must extend
beyond the health sector to include
such issues as civil service reform,
decentralization and the macroeconomic environment.
Strengthening health worker
programmes would initially focus
on community health and nutrition
providers to enhance service delivery
in three areas:
The scale of this challenge should
not be underestimated. Addressing
the health worker crisis in subSaharan Africa alone will require an
unprecedented surge in staffing levels
in the coming decade. Of the almost
860,000 estimated additional workers
needed to scale up health-care provision to the level required to meet the
health-related MDGs in that region,
more than half would be community
health and nutrition promoters.
• Provide first-line care for sick
children.
Efforts are under way to expand the
number of community health workers in many developing countries, as
well as to devise incentive packages
T H E S TAT E O F T H E W O R L D ’ S C H I L D R E N 2 0 0 8
• Improve family care practices
through home visits.
• Distribute essential health and
nutrition commodities for household use in communities with low
access to facility-based care.
Performance-based incentives, such
as payments based on successful
behaviour changes in their communities, could be used to motivate workers, instead of fixed remuneration.
Evidence suggests that multiple
incentive packages – often combining
small monetary incentives or ‘in kind’
payments with a strong emphasis on
community recognition and supervision, as well as personal growth and
development opportunities – tend to
have a significant effect on reducing
© UNICEF/ HQ03-0459/Shehzad Noorani
The effectiveness of health-care interventions is recognized through regular monitoring and assessment. Children being screened for
malnutrition prior to a distribution of high-protein biscuits, Iraq.
attrition rates among community
health workers. In Guatemala, for
example, supervised community
health workers had attrition rates
two to three times lower than those
who were unsupervised because their
link with outside experts gave them a
higher status.17
Upgrading the skills of existing
health workers is an integral part
of effective scale-up. Improved
supervision and monitoring, in
addition to results-based performance incentives and contracts, have
the potential to motivate existing
health workers, as well as being
attractive features to prospective
employees.
Developing health systems for
outcomes
Efforts to improve harmonization
of aid and to scale up activities,
particularly in Africa, have increasingly focused on utilizing the
health-related MDGs and other
indicators as the benchmark for
health-system strengthening outcomes. The emphasis on outcomes
is intended to create a synergy
between the outcomes and inputs.
Health-system development is
increasingly being framed as part
of the process of achieving the
goals, not distinct from them.
This linkage between systems and outcomes has been stressed in the strategic
framework for reaching MDGs 4 and
5 through health-system strengthening,
prepared jointly by UNICEF, WHO
and the World Bank at the request of
the African Union. The framework
analyses system bottlenecks for 16
African countries and simulates the
potential impact on the MDG of
removing these bottlenecks country
by country. Based on this framework,
more than 10 countries in Africa are
currently revising plans and budgetary
mechanisms such as Poverty Reduction
Strategy Papers, health-sector development plans, sector-wide approaches
and medium-term expenditure frameworks to strengthen health systems
with the aim of concrete health outcomes for mothers and children.
S T R E N G T H E N I N G C O M M U N I T Y PA R T N E R S H I P S , T H E C O N T I N U U M O F C A R E , A N D H E A LT H S Y S T E M S
73
Scaling up: Safe water, adequate sanitation and improved
hygiene practices
Clean water and safe toilets have the potential to transform children’s lives. More than any other group, young
children are vulnerable to the risks posed by contaminated water, poor sanitation and inadequate hygiene. Unsafe
drinking water, inadequate availability of water for washing and cooking, and lack of access to sanitation together
contribute to about 88 per cent of deaths from diarrhoeal
diseases, or more than 1.5 million each year.
Better sanitation alone could reduce diarrhoea-related
morbidity by more than a third; improved sanitation
combined with better hygiene behaviours could reduce
it by two thirds. Hand washing with soap or ashes
would prevent 0.5 million to 1.4 million deaths per year.
Improved household practices include consistent use of
a toilet or latrine by each person in the household, safe
disposal of young children’s faeces, hand washing with
soap or ash after defecation and before eating, and the
installation of safe water sources in households and
communities. Providing communities with the knowledge and resources to implement these basic household practices is a vital first step towards improving
sanitation and hygiene.
Nicaragua and Peru: Promoting better hygiene
to reduce diarrhoea
Like South Asia, Latin America and the Caribbean
has experienced significant progress in the areas
of water and sanitation, with 16 of the region’s 33
countries on track to meet their MDG targets. Yet
persistent disparities remain, especially between
urban and rural areas.
In 2002, the joint Environmental Health ProjectPan American Health Organization ‘Hygiene Behavior
Change Project’ initiated community-based strategies for
the region suffering a combined total of 15,000 deaths
and 75,000 hospitalizations due to rotavirus diarrhoea
every year, despite enjoying a sound infrastructure of
latrines and piped water. In Peru, reported cases of diarrhoea after implementation fell to 9 per cent, while in
Nicaragua there were almost no reported cases of diarrhoea among children aged three and none in children
aged four and five. Many of the hygiene practices promoted as part of the interventions in both countries,
such as better hand washing and safe use and storage
of water, showed statistically significant improvements
from pre-intervention to midterm.
74
Mozambique: The child-to-child sanitation
committees
Children can often serve as powerful advocates for change
in their communities. In Mozambique, the child-to-child
sanitation committees serve as a basis for child-centred
hygiene education programmes in school and also aim to
operate as an entry point to local communities for the
adoption of hygiene practices at the household level
through child-to-child and child-to-parent channels. A
child-to-child sanitation committee consists of a group of
15 girls and boys trained in participatory hygiene education, including the dissemination of information on routes
and barriers for water and sanitation-related disease transmission, appropriate hand washing with soap (or ashes),
and proper use of latrines. The inclusion of girls in the
committees is especially important because girls’ school
attendance is affected by inadequate water and sanitation
facilities and by time spent travelling long distances
to drinking-water sources. In combination with youth
participatory strategies, these efforts helped increase the
enrolment rates of girls 15–20 per cent nationwide since
2002–2003.
To get the other children’s attention, the committees use
focus group discussions, posters, expressive songs, theatre,
dance, interviews, drawings and competitions. Following
this approach, child-to-child sanitation committees have
been established and are operational in 251 schools.
Southern Sudan: Community-based water and
sanitation in complex environments
It is often assumed that community-based approaches are
difficult if not impossible to implement in areas that have
been affected by armed conflict, natural disasters or other
complex emergencies. Yet evidence from South Sudan
suggests that when they are successfully implemented,
community-based approaches can play a crucial role
in difficult environments. In South Sudan, a water and
sanitation project involves local water teams who specialize in hand drilling. Each team has 10 members, usually
selected from the local communities; of these, seven are
usually drillers and three are responsible for handpump
maintenance, including a team supervisor. Hand drilling
provides a low-tech, low-cost approach of providing
access to water. The rigs can be dismantled and transported between sites by the communities themselves.
Their portability allows them to be transported even
over difficult terrain and, critically, enables the drilling
T H E S TAT E O F T H E W O R L D ’ S C H I L D R E N 2 0 0 8
to continue during the wet season. Furthermore, the low
cost and portability of the rigs is essential in insecure
areas. By working together with communities, this project
has successfully extended tube wells across large areas of
northern Bahr el Ghazal.
Bangladesh and India: Community-led ‘total sanitation’
Although investment in toilet construction is an important
prerequisite of increasing sanitation coverage, evidence
from South Asia suggests it is not always sufficient in order
to achieve improved public health outcomes. Studies of
state-wide sector assessments in India, for example, show
that most people continue to defecate in the open not due
to a lack of access to toilets but primarily because they
see no reason to change their behaviour, as awareness of
associated health risks is limited or ignored. In fact, usage
of toilets is highest where households recognize the need
for a toilet and therefore build one of their own.
In Rajshahi district, Bangladesh, a unique community mobilization approach was piloted in 2001 to achieve 100 per
cent sanitation coverage. Community-led ‘total sanitation’
is based on the principle of triggering collective behaviour
change. This approach helps communities understand the
negative effects of poor sanitation and empowers them to
collectively find solutions. In Rajshahi, this approach led the
community to achieve a total ban on open defecation within
the village. The ban was achieved without any external subsidy and was based entirely on community mobilization.
Communities used their own resources, established action
committees, developed innovative low-cost technologies
and monitored progress.
The Rajshahi initiative represented a paradigm shift in promoting improved sanitation practices through a communityfocused strategy, but scale-up in the area was limited to a
village-by-village approach. The Rajshahi experience generated interest in India, however, leading to visits from
policymakers, including representatives from the State
Government of Maharashtra. Building on the Bangladeshi
experience, the State Government of Maharashtra formulated a strategy to end open defecation in the state. The key
features of this strategy were to bring local governments to
the fore, provide fiscal support to the poor, and put in place
strong monitoring and evaluation systems. The campaign
included a strong emphasis on information, education and
communication activities and exposure visits to the bestperforming villages. As a result, between 2002 and 2006,
Maharashtra went from having not even one open
defecation-free village to having more than 3,800,
with more than 5 million households now living in
an environment free of open defecation.
Maharashtra’s success in turn led to a revision of national
sanitation guidelines in India and to establishment of the
Nirmal Gram Puraskar, or ‘Clean Village Prize’, introduced
by the Government of India in 2004. The scheme offers cash
rewards to local governments that achieve 100 per cent sanitation. The response has been tremendous: In February
2005, 38 gram panchayats (the lowest tier of elected rural
local government) received the prize; by February 2006, the
number went up to 760 gram panchayats and 9 block panchayats (an intermediate tier of elected rural government).
Ghana: Bridging the urban-rural divide
Among the largest disparities in safe water and basic
sanitation are those between urban and rural populations.
Globally, access to improved drinking-water sources is
95 per cent in urban areas, compared with 73 per cent in
rural areas. The urban-rural divide in drinking water is
at its widest in sub-Saharan Africa, where 81 per cent
of people in urban areas are served, compared with
41 per cent in rural areas.
In Ghana, coverage of rural water and sanitation was, until
recently, behind the average for sub-Saharan Africa but is
currently expanding at a rate of about 200,000 people, or
more than 1 per cent of the population, a year. The change
has been dramatic and reflects a sweeping reform programme introduced by the government in the early 1990s
in order to address the inefficiencies of a top-down system
that was unresponsive and failed to deliver, especially in
rural areas. As a result of the reform process, responsibilities for water supplies were transferred to local governments and rural communities, and new political structures
for water governance have been developed. Village structures are now part of the new system. To apply for capital
grants, communities must form village water committees
and draw up plans detailing how they will manage their
systems, contribute the cash equivalent of 5 per cent
of the capital costs and meet maintenance costs. This
participatory approach has resulted in a dramatic increase
in access to water, from 55 per cent in 1990 to 75 per cent
in 2004, and access is currently accelerating.
See References, page 108.
S T R E N G T H E N I N G C O M M U N I T Y PA R T N E R S H I P S , T H E C O N T I N U U M O F C A R E , A N D H E A LT H S Y S T E M S
75
These countries are also consolidating
their bottlenecks, startegies, expected
health outcomes and additional funding needs into ‘investment cases’ to
leverage political and financial support
for their national plans.
Strengthen health systems at the
district level
Strengthening health systems remains
a daunting and complex task, especially in many of countries that are
making insufficient progress towards
the health-related MDGs. The decentralization of health systems and an
increasing focus on the district level
can be seen as an effective vehicle
for delivering primary health care to
marginalized children and families at
the community level.18 But decentralization is not without risks: It can
have unintended consequences, such
as deepening existing inequalities in
communities, based on factors such
as poverty, gender, language and
ethnicity.19 Furthermore, even where
decentralization efforts have been
successful, experience suggests that
transforming an administrative district into a functional health system
takes time. In 2000, for example,
only 13 of Niger’s district hospitals
were equipped to perform a
Caesarean section. Only 17 of the
53 district hospitals in Burkina Faso
had appropriate facilities 10 years
after districts had been established;
moreover, only 5 of those 17 hospitals had the three doctors required
to ensure continuity of care throughout the year.20
Nevertheless, the experience of decentralization during the past decade
suggests that, on balance, health districts remain a rational way for governments to roll out primary health
care through networks of health cen-
The urgent need to address the health worker crisis in Africa
The lack of adequate human resources represents a
major barrier to scaling up integrated approaches to
maternal, newborn and child survival, health and nutrition at the community level. The current experience suggests that limited effectiveness, high staff turnover and
inadequate supervision characterize most programmes in
developing countries. The massive migration of health
professionals, the impact of AIDS, which in some highprevalence countries has decimated the workforce, as
well as the presence of armed conflict, serve to undermine the national health workforce in many developing
countries currently making slow or no progress in reducing child mortality. Within these contexts, community
health workers can have an important role in improving
community health in general and child health in particular. It should be emphasized, however, that community
health workers are intended to complement, not substitute for, trained health professionals.
Health workers at the district and community levels
The number of health workers per 1,000 children, in
particular nurses and doctors, is a significant determinant
of variations in rates of infant, under-five and maternal
mortality across countries. For example, research reveals
that the prospects for achieving 80 per cent coverage of
measles immunization and skilled attendants at birth are
greatly enhanced where the health worker density exceeds
2.5 per 1,000 inhabitants. Yet many developing countries,
particularly in sub-Saharan Africa, face overwhelming
shortages of health personnel.
76
The migration of skilled health professionals is a cause of
grave concern in many developing countries. A point of
particular alarm is the massive migration of health professionals from poor countries to rich countries (the so-called
‘brain drain’). But other forms of movements of health professionals within a country – from rural areas to zones of
conurbation, from the public domain to the private sector,
and from the health sector to other sectors – are also
limiting the pool of skilled health professionals involved
in primary health care in developing countries.
The reasons doctors and nurses leave the health sector altogether appear to be similar in places as diverse as the Pacific
Islands and the European Union. They include low remuneration, inflexible hours with many extra duties, lack of continuing educational opportunities, difficult working conditions,
demanding patients and shortages of supplies and equipment. Recent statistics indicate, for example, that half of
medical school graduates from Ghana emigrate within 4.5
years of graduation, and 75 per cent leave within a decade.
In South Africa, more than 300 specialist nurses leave every
month – many never to return. The main destinations for
migrant health workers are Europe and North America. This
is particularly true for the United Kingdom, where one third
of the health workforce originates from other countries.
Research suggests that the density of health workers
(doctors, nurses, midwives) is more than 10 times higher
in Europe and North America than in sub-Saharan Africa.
The negative impact of migration on the delivery of health
services in developing countries is often severe, since this
T H E S TAT E O F T H E W O R L D ’ S C H I L D R E N 2 0 0 8
tres, family practices or equivalent
decentralized structures, backed by
referral hospitals. Where districts
have become stable and viable
structures, they have demostrated
notable results, even under situations
of complex emergencies, as in the
Democratic Republic of the Congo
and Guinea. Similarly, Mali has
broadened its health-centre networks
and services for mothers and
children.21 In countries where decentralization has been accompanied by
reforms of public administration,
there has been significant progress
within a few years. Examples include
Mozambique, Rwanda and Uganda,
all countries that experienced many
years of conflict and economic collapse but have since made significant
progress in reforming government
institutions and performance, including their health systems.22
In recent decades, evidence on
the performance of district health
systems has grown. However, the
evidence base is still relatively small,
the study coverage is inconsistent,
and the approaches advocated by
practitioners do not enjoy the same
level of consensus and visibility
movement of human capital affects the most highly trained
professionals, in whom the government has invested heavily through training and professional development.
In addition to these general causes, the AIDS epidemic
and armed conflict have also been powerful causes
underlying the loss of health personnel in sub-Saharan
Africa in particular.
In situations of conflict and post-conflict reconstruction,
qualified health providers are vital to provide general and
specialized services to vulnerable populations that may
have been displaced and injured as a result of the strife.
However, in many conflict-affected countries years and
sometimes decades of conflict have led to an acute
shortage of trained health-care personnel.
To address these shortages of skilled health personnel, at
least in the short to medium term, national health systems
must build incentives for practising health care at home.
While this remains an ongoing challenge, a number of
countries have been successful in recruiting and retaining
heath workers, including in rural areas, where shortages are
often most severe. Incentive packages to retain health workers or reverse migration are being devised to address the
crisis. One such example is taking place in Mali, where the
Ministry of Health encourages newly graduated doctors to
serve in rural areas by offering them training, accommodation, equipment and transport if needed.
within the scientific community as
those on essential interventions.
Work on the district approach to
delivering the continuum of maternal, newborn and child health care
requires a new impetus and more
rigorous systematization. In particular, a key focus of research should
be on the reorientation of national
health systems to create the conditions in which district health and
nutrition systems providing a continuum of care can thrive. Systematic
analysis and case studies from countries that have tried this approach
Training that is focused on local conditions can also help
limit workforce attrition. Longstanding efforts to expand the
numbers of health workers in rural areas suggest that training local workers – in local languages and in skills relevant
to local conditions – facilitates retention. Such approaches
to training often lead to credentials that do not have international recognition, which further limits migration. Success,
however, is contingent on providing incentives and support
at the local level.
There is a growing concern that affluent countries are benefiting from the brain drain at Africa’s expense. As a result,
there has been a growing movement calling for an end to
the recruitment of health workers from Africa, or, if that
proves unrealistic, as is likely to be the case, to conduct
recruitment only in a way that is mutually beneficial. In the
past five years, about a dozen international instruments
have emerged from national authorities, professional associations and international bodies that have set norms for
behaviour among the key stakeholders involved in the
international recruitment of health workers, and similar
concerns have been the focus of bilateral agreements.
See References, page 108.
S T R E N G T H E N I N G C O M M U N I T Y PA R T N E R S H I P S , T H E C O N T I N U U M O F C A R E , A N D H E A LT H S Y S T E M S
77
The investment case for child survival and other health-related
Millennium Development Goals in sub-Saharan Africa
The strategies outlined in ‘A Strategic Framework for
Reaching the Millennium Development Goals on Child
Survival in Africa’ – prepared for the African Union in July
2005 – are expected to create, in a relatively short time
frame, the minimal conditions needed to increase effective
coverage of primary health care in sub-Saharan Africa –
including a minimum package of evidence-based, highimpact, low-cost services that can be delivered through
family and community-based care and through populationoriented services and clinical care. The key interventions are
expected to be antibiotics to combat pneumonia and neonatal infections; antimalarial combination drugs; infant feeding and hygiene promotion; insecticide-treated mosquito
nets; oral rehydration therapy; skilled attendance at birth;
and vitamin A supplementation, prevention and care of paediatric AIDS, and emergency obstetric and neonatal care.
These strategies and interventions are expected to have a
substantial impact on improving child nutrition, maternal
mortality, women’s status and poverty reduction through
women’s empowerment. (The three implementation phases
are outlined on pages 71-72.)
In phase one, it is estimated that this strategy could reduce
Africa’s under-five mortality rate by more than 30 per cent
and provide initial reductions of 15 per cent in maternal
mortality at an incremental estimated annual cost of
US$2–$3 per capita, or around US$1,000 per life saved.
In phase two, implementation at scale of an expanded package would lead to an estimated reduction in the region’s
under-five mortality rate in excess of 45 per cent and would
diminish maternal mortality by 40 per cent and neonatal
mortality by around 30 per cent. The incremental annual
economic cost is estimated at around US$5 per capita, or
less than US$1,500 per life saved.
In phase three, it is estimated that reaching the effective
coverage frontiers with the maximum package of interven-
Figure 4.3
Estimated impact and cost of minimum, expanded and maximum packages for the
Strategic Framework for Africa
78
T H E S TAT E O F T H E W O R L D ’ S C H I L D R E N 2 0 0 8
tions would allow countries to meet or approach key
targets for MDGs 1, 4, 5 and 6 by reducing the under-five
mortality and maternal mortality rates by more than 60
per cent, cutting the neonatal mortality rate by 50 per cent
and halving the incidence of malaria and undernutrition.
The incremental annual economic cost to achieve phase
three is estimated at US$12–$15 per capita, or around
US$2,500 per life saved.
Assuming an incremental pace of implementation, the additional annual funding required for the proposed phased
acceleration will increase between US$2 and US$3 per
capita and per year to take the minimum package to scale
in Phase one; it will increase by more than US$12–$15 per
capita and per year to take the maximum package to scale
by 2015 in Phase three. It is noteworthy that these additional costs have recently been estimated using different costing tools, each of which has generated similar projections,
suggesting that the estimates are robust. The cost is for
commodities, drugs and supplies. Insecticide-treated
mosquito nets represent a very sizeable share of this cost,
as do drugs. The cost is apportioned to human resources,
health facilities and equipment, and for promotion, demand
creation, monitoring and evaluation.
In the context of the Strategic Framework, the following cofinancing scenario is proposed: In all three phases, almost
half of the additional funding to scale up the minimum
package would come from national budgets, including
budget support, with 15 per cent coming from out-of-pocket
expenditures, and one third from the Global Fund to Fight
AIDS, Tuberculosis and Malaria (GFATM), UNICEF, the World
Bank, WHO and other donors.
See References, page 108.
Figure 4.4
Funding sources 2007–2015
Sources Figures 4.3 and 4.4, pp. 78-79: Preliminary estimates based on the revised version of UNICEF, World Bank and World Health
Organization, ‘A Strategic Framework for Reaching the Millennium Development Goals in Africa through health systems strengthening and
implementing at scale of integrated packages of high-impact and low-cost health and nutrition interventions’, draft prepared on request of the
African Union by UNICEF, WHO and the World Bank. Revised in October 2007.
S T R E N G T H E N I N G C O M M U N I T Y PA R T N E R S H I P S , T H E C O N T I N U U M O F C A R E , A N D H E A LT H S Y S T E M S
79
© UNICEF/HQ04-0689/Giacomo Pirozzi
nance of the health sector as a whole,
as well as the organization of a continuum of maternal, newborn and
child care at the district level.
III. Improving the quality and
consistency of financing for
strengthening health systems
Finding the money to finance health
care is a significant obstacle to
scaling up in low-income countries,
where health-care sectors already
face huge budget shortfalls. Policies
determining government healthfinancing can have a profound effect
on health outcomes for children
and women, through subsidizing
or taxing critical services affecting
maternal, newborn and child survival, health and nutrition or by
supporting equitable cost-sharing
mechanisms.
The shortage of health workers in developing countries must be addressed in national
plans to reverse its negative impact on the
health of mothers, newborns and children.
A health worker examines a child at the
regional centre for AIDS prevention and
protection, Russian Federation.
could yield important insights into
the ways that current policy processes function and might be improved.
Some significant problems – such as
building institutional capacity and
obtaining strategic intelligence for
steering and monitoring resource
flows and health-system performance – are already well recognized
by practitioners.
It is clear that there is much work
to be done in gathering evidence and
knowledge on ways to build capacities for policy formation, regulation
and steering that can inform gover-
80
Adequate financing of the health
sector, in addition to fighting specific
diseases, is imperative for effective,
sustainable scale-up. The less than
optimal outcomes from earlier and
current support to the health sector
have largely been attributed to
several factors, namely:
A lack of evidence and country-based
budgeting for health outcomes. Given
the predominance of disease-specific
initiatives, national strategies for
maternal, newborn and child health
often do not give sufficient attention
to a multi-sectoral approach to
achieving health outcomes, removing
systemic bottlenecks to service delivery or adequately budgeting for
health strategies – including the
costs of removing bottlenecks to the
supply of and demand for primary
health-care services.
T H E S TAT E O F T H E W O R L D ’ S C H I L D R E N 2 0 0 8
Slow progress and weak alignment to
country processes and harmonization. Linkages between the health
sector and broader development
processes at country level (public
sector and budget reform, poverty
reduction strategies, macroeconomic
and fiscal planning, etc.) often
remain tenuous in low-income
countries. Monitoring systems for
tracking resource flows, progress
and outcomes are often largely inadequate, and there is limited progress
in translating global commitments on
aid effectiveness into concrete action
at country level – most particularly
in relation to the provision of predictable long-term financing and
the reduction of fragmented aid
leading to high transaction costs,
in line with the Paris Declaration
on Harmonization and Aid
Effectiveness.
Insufficient focus of funding in
addressing obstacles to strengthening health systems. Despite an
increasing commitment by the
global community to health goals,
countries still experience critical
shortages in funding to build up
their health systems – including
financing for producing and retaining key human resources, providing
incentives for performance, building
procurement and logistics systems
and facilitating transfers to poorer
households to address demand-side
obstacles to better health. As more
and more funds are mobilized for
specific diseases such as HIV, an
increased imbalance is often
observed at country level, with
health service delivery and financing
mechanisms required to absorb the
funds made available for special
initiatives often absent. As a result,
low levels of execution and effectiveness of disease control programmes are observed. Absent or
weak control of government over
the behaviour of health service
providers, and of beneficiaries of
health services over the use of
public funds, undermine effective
implementation.23
Recent international health partnerships propose to leverage greater
resources for scaling up for the
MDGs. These initiatives seek a focus
on results and a clear link between
resources allocated and health outcomes. Doing this requires strengthening health systems as a means of
achieving development outcomes –
Focus
On
both directly and by influencing other
donors – and call for greater coherence in the health aid architecture.24
There is a growing agreement
about the importance of supporting
robust sectoral plans, and about
the desirability of ensuring full coherence with existing efforts on health
systems strengthening. Key issues
related to these new initiatives
include development and quality
of scaling-up plans, monitoring
processes and selection of countries,
as well as flow and management
of funds.25
In this context, a consensus is
emerging on five principles for aid:
• Rewarding performance in a
predictable way through compacts.
• Aligning development assistance to
country systems.
• Results-based financing.
• Establishing benchmarks and outcome indicators for health-systems
development.
• Developing innovative and
equitable financing strategies.
Rewarding performance in a
predictable way through compacts
Along with the renewed emphasis on
results, there is an emerging consensus
Botswana: Going to scale with HIV prevention and
treatment using community partnerships
Context and challenge: AIDS is a foremost cause of
maternal, newborn and child death in southern Africa.
In Botswana, almost 1 in every 4 people aged 15–49 is
infected with HIV. The risk to children begins before birth;
one third of pregnant women aged 15–24 in Botswana are
HIV–positive. Maternal HIV-positive status leads to an
increased rate of stillbirths and deaths in the neonatal
period and infancy, even if HIV is not transmitted to the
child. Women who contract HIV during pregnancy or while
breastfeeding have a high risk of passing the infection to
their newborn. Moreover, mothers are increasingly at risk
of death, leaving behind babies with diminished chances
of survival. AIDS is a significant cause of disability and
death in babies and children beyond one month.
Interventions and approaches: In Botswana, prevention of
mother-to-child transmission of HIV (PMTCT) was initiated
in 1999 with strong political commitment and high resource
allocation. From the outset, the Government of Botswana
planned for national coverage of interventions. Services
are provided free of charge to women and children and
integrated into existing maternal and child health services.
These interventions include safe obstetric practices,
counselling, HIV testing, prophylaxis or treatment for
HIV infection as indicated, and testing of babies for HIV
infection at six weeks of age. Antiretroviral therapy is
also provided to qualifying mothers and their families.
Rigorous monitoring and evaluation is implemented and
supply chains closely managed.
One of the central success factors in Botswana was the
unified coordination mechanism around a single national
scale-up plan. PMTCT was fully integrated with maternal
and child health services, but ongoing adjustments were
made to increase quality and service uptake. Political
commitment was important, as was cohesive programme
management. Community participation and male involvement were also crucial elements to support women
who chose not to breastfeed and to facilitate follow-up
paediatric care and support.
Results: In Botswana, the programme expanded to
nationwide coverage by 2004. By 2005, 54 per cent of
HIV-positive mothers were receiving antiretroviral drugs
during pregnancy.
See References, page 108.
S T R E N G T H E N I N G C O M M U N I T Y PA R T N E R S H I P S , T H E C O N T I N U U M O F C A R E , A N D H E A LT H S Y S T E M S
81
© UNICEF/HQ05-1876/Donna DeCesare
Enhanced political commitment and adequate financing by governments are necessary to
guarantee access to the continuum of care for mothers, newborns and children. A child
holds his baby sister, Guatemala.
that resources should be allocated on
the basis of such criteria as: need
(based on such factors as population
size, poverty levels and current state
of national health) and peformance
(health outcomes and capacity to
absorb funds effectively). Performance
would be related to key results and
policy measures agreed at the country
level in a ‘compact’ that builds on
existing results-oriented frameworks,
such as those developed by the
European Commission, World Bank
and African Development Bank
and bilateral donors.26
These compacts constitute mutual
agreements between developing
countries and donors based on
accountabilities and meeting performance criteria by recipients
and provision of predictable financing by donors.
82
Aligning development assistance
to country systems
Alignment of disbursement and
implementation to country systems
is pivotal to enhancing aid effectiveness. In countries with fiduciary
environments (public financial
management and procurement) that
are considered adequate overall by
multilateral and bilateral donors
and jointly monitored by partners
through the public expenditure and
financial accountability mechanism,
funding for effective scale-up could
flow as sector budget support – providing incremental funding for the
implementation of the health-sector
component of the national budget, as
well as related activities. Monitoring
the effectiveness of these funds would
be integrated into the monitoring of
the existing general and sector budget
support. A similar mechanism could
T H E S TAT E O F T H E W O R L D ’ S C H I L D R E N 2 0 0 8
be used in countries with sector-wide
approaches and basket fund mechanisms, complementing existing
evaluation methods.
There is a growing consensus that
resources for the health sector should
be channelled through institutions
that aim to provide universal coverage, rather than through projects and
programmes. Maternal, newborn and
child health services must be part of
the basket of core health interventions that are covered in any benefit
package funded through these institutions. Enhancing resources spent on
maternal, newborn and child health
may require trade-offs in government
expenditures, either within the health
budget itself or within the national
budget. Such trade-offs need to be
negotiated in the context of the
overall macroeconomic environment,
which can allow for incremental
sector spending if health-care requirements are well argued. At the country level, resources also need to be
mobilized outside of the public sector
through the involvement of the
private sector, civil society organizations, communities and households.
Results-based financing
One of the key areas supported by the
new scaling-up initiatives is resultsbased financing. This is an important
complement to existing funding flows
and a potentially promising approach
to surmounting existing obstacles within health systems to achieve health,
nutrition and population results.
Recent experiences in Afghanistan,
Argentina, Cambodia and Rwanda
(see Panel, page 84, on performancebased financing in Rwanda) have
shown positive results, and more rigorous evaluation for the latter is planned.
Strengthening accountability and governance in health-service delivery
Accountability in service delivery may be conceived of as
processes through which communities and households can
hold providers responsible for the adequacy and effectiveness of the services they offer. For poor and marginalized
communities and households, public accountability can be
achieved through giving them both voice and suffrage; for
policymakers, accountability can be demanded through the
social compact in which governments assist, finance and
regulate providers of health care, nutrition and environmental health services. When communities are empowered
to demand adequate and effective services, families are
informed of which services the State has committed to
provide and the minimum standards that apply.
Embedding participation in public life and civic education in
all maternal, newborn and child survival and development
programmes ensures that families are empowered with
knowledge of the measures they can take to protect their
child’s life and enhance the child’s early development.
Household and community knowledge of available services
and the standards of quality required for these services
enhance their ability to hold governments and service
providers accountable.
Results-based financing offers several
advantages over traditional, inputbased approaches, including:
• An emphasis on achieving outputs
and outcomes relatively quickly
within a well defined time period.
• Incentives for performance at
key junctures in the service
delivery chain.
• Addresses important funding gaps,
provides governments with flexible
financing to counterbalance funding distortions and gives them the
opportunity to focus on priorities,
such as targeting the poor.
• By design, results-based financing
is essentially a monitoring and
Social compacts between governments and providers
can also be effective tools for accountability in maternal,
newborn and child survival and health when governments
make these issues a priority in legislation, budgets, programmes and research – and adequately compensate
providers for essential services, while monitoring their
performance in delivery.
Strengthening accountability must be tailored to different
modes of service delivery. At the primary level of community and family services – including such factors as information and social support for promoting breastfeeding or
newborn care services – the ability of households to purchase commodities, access information on services and
transform both into better health outcomes is central to
increasing demand-side accountability. Community and
civil society organizations and commercial networks are
often well placed to provide mechanisms for poor and
marginalized households that can directly monitor the
efficacy of services and exert accountability.
See References, page 108.
evaluation tool, built on a measurable and targeted strategy that
requires baseline, target and
progress data at the relevant levels.
Consequently, results-based efforts
will allow regular review of successes, shortfalls and bottlenecks,
enabling midstream adjustments
to implementation plans.
• In addition, it supports a broaderrange of solutions to health problems beyond those that are officially under the control of the health
sector, such as improving roads,
water supplies and sanitation.
• Perhaps most importantly, results
based financing creates an opportunity to consolidate fragmented aid,
thereby reducing high transaction
costs to countries. This can be
accomplished through results-based
financing arrangements that focus
on outputs to which many donors
can simultaneously contribute.27
Establishing benchmarks
and outcome indicators for
health-system development
Indicators associated with the healthrelated MDGs can serve as appropriate tracers or proxy measures for the
performance of health systems. New
initiatives plan to provide support
to governments to achieve agreed
outcomes in selected target areas
through results-based financing,
establishing appropriate incentive
frameworks. The objective is to
achieve defined output targets for
coverage of services that are strongly
S T R E N G T H E N I N G C O M M U N I T Y PA R T N E R S H I P S , T H E C O N T I N U U M O F C A R E , A N D H E A LT H S Y S T E M S
83
correlated with positive maternal,
newborn and child health and survival outcomes – for example: the
proportion of deliveries in an accredited facility; immunization coverage
of three doses of diphtheria, tetanus
toxoid and pertussis vaccine; or
coverage of insecticide-treated
mosquito nets in malaria-endemic
areas. These outputs and targets
would be selected based on the risk
factors contributing to mortality and
morbidity for each country.
Key outcome indicators can be set in
various forms. These parameters can
measure either direct outputs, such as
the absolute number of children
immunized; coverage, such as the
percentage of the target population
vaccinated, by antigen, in a defined
catchment area; or trends, such as
increases in the number of children
vaccinated or coverage levels
achieved over time. A set of core
indicators can also be defined for
all projects to allow for some crosscountry comparison and learning.
Countries could also include additional indicators that monitor important elements of their maternal, child
and newborn health programmes.
Developing innovative and
equitable financing strategies
Investment in human resources and
health-system strengthening requires
significant resources. Countries where
donor support plays a critical role in
funding these programmes cannot
plan for long-term activities unless
financing is secure. Yet, research
tracking donor assistance to maternal,
newborn and child health found that
the 60 priority countries that account
for more than 90 per cent of child
deaths received only US$1.4 billion
in official development assistance in
2004, or just US$3.10 per child.28
Performance-based financing in Rwanda
The Government of Rwanda, with support from donors,
has recently scaled up several innovative programmes that
transfer conditional grants from the central government to
municipalities for the purchase of essential health outputs.
The health programme includes three principal elements:
Community partnerships in health: This transfers resources
(about US$0.25 per capita) directly to municipalities to
engage, via a performance-based contract, communitybased institutions, non-governmental organizations, health
promoters, private health-care providers and other related
services to deliver essential interventions at the household
and community levels. A performance contract called
IMIHIGO – a traditional word that has become synonymous
with accountability in government services throughout the
country – is signed between the President of Rwanda and
district mayors on behalf of their constituencies every year.
The services delivered under this approach are simple and
low cost, focusing on the promotion of improved health
and hygiene practices, behaviour-change interventions,
and such preventive services as distribution of insecticidetreated mosquito nets, oral rehydration therapy, nutritional
supplementation and safe water systems.
These partnerships were introduced in several districts
during 2005 and have been scaled up at the national level
since 2006 using treasury funds. The central government
signed performance contracts with the 30 municipalities in
April 2006 and selected coverage of insecticide-treated nets
84
as the lead performance indicator. Marked results have
been achieved since its inception. An evaluation undertaken in June 2007 found that utilization of mosquito nets
by children under age five had increased from 4 per cent
in 2004 to more than 70 per cent in 2007. The number of
cases of malaria has decreased dramatically, emptying paediatric wards, and population-based surveys using blood
tests show a dramatic decrease in malaria prevalence.
Policymakers rate the situation as unprecedented and are
working now at a strategy to eliminate malaria altogether.
Health centres: This strand transfers resources (about US$1
per capita in 2007, or about 15 per cent of government
resources apportioned to health) to primary care centres
through a performance-based contract. The scheme was
initially piloted in two provinces, Butare and Cyangugu,
with the support of non-governmental organizations and
bilateral aid from 2002. The performance-based contract
includes indicators related to adequate coverage (quantity),
as well as effective coverage (quality) of services. An
evaluation has shown a significant increase in utilization
of health services, including immunization and assisted
deliveries, in the provinces where the contracts had been
implemented compared with provinces that were not
covered by the contracts.
The Government of Rwanda subsequently decided to
gradually expand the programme to other provinces,
incorporating lessons from the pilots. In 2005, budget
T H E S TAT E O F T H E W O R L D ’ S C H I L D R E N 2 0 0 8
While the Strategic Framework
suggests that it is possible to fill the
gap between present levels and nearuniversal coverage by 2015, it also
shows that scaling up interventions
will not be possible without massively
increasing investment in maternal,
newborn and child health.29
Moving towards universal access to a
continuum of quality maternal, newborn and child health care, however,
is not merely a question of finding
money to expand the supply of services or to pay providers. Reaching
the health-related MDGs will require
that financing strategies focus on
overcoming financial barriers to
women and children’s access to services and give users predictable protection against the financial hardship
that may result from paying for care.
This has important implications.
Calls for the immediate and universal elimination of user fees for
health-care services may prove overly simplistic or unrealistic. Policy
decisions regarding user fees should
be addressed within the broader
context of the health sector budget
and the national budgetary frame-
allocations for the programmes were apportioned to two
provinces that had undertaken the pilot schemes. The following year, the programme was expanded nationwide and
fully transferred to the national budget, and it directly
linked service delivery, results and payment.
A steering committee has been established in each
province to independently monitor the performance of the
health centres using lot quality sampling and satisfaction
survey techniques. The results of the independent verification directly affect the amount of funding received by each
centre. Again, results from the centres were impressive,
with immunization coverage rates of 95 per cent and
increases in the annual utilization of services from 0.4 visits
per capita in 2004 to 0.7 per capita in 2006 and in assisted
deliveries from 29 per cent in 2000 to 52 per cent in 2006.
The full impact of these schemes on health outcomes is
being evaluated through a randomized controlled prospective design. The programme has also been expanded to all
district hospitals of the country.
Health micro-insurance schemes: Mutuelles – informal
micro-insurance schemes that pool funds from community
members to cover a package of basic health services provided by health centres and for the transfer of patients, if
needed, to referral hospitals – have been piloted successfully during the past decade. Their aim is to smooth the cost
of health services for members, eliminating the hardship
of making out-of-pocket payments.
work. Over time, user fees may be
phased out in favour of prepayment
and pooling schemes, on condition
that this is accompanied, from its
inception, by structural changes to
ensure the long-term sustainability
of health financing.
IV. Obtaining national political
commitment
Given the level of resources required
to ensure access to quality primary
health-care services and financial protection, scaling up is as much a political challenge as it is a technical one.
Mutuelles have an important role in intermediating
between health centres, district hospitals and the general
population. Evaluations show they are more effective when
they have strong community participation in their governance structures and make payments to the health centres
on a per capita basis, essentially transferring all insurance
risk to the health centres.
Initially, the focus was on building administrative and
management support and technical capacity, including
training and development of appropriate tools. But since
2006, the Rwandan Government has transferred funds
(about US$0.15 per capita) to cover premiums for the
poorest people in the community, who are identified on
the basis of a participatory poverty assessment called
Ubudehe. Rwanda has systematically supported the
expansion of mutuelles, which covered about 70 per cent
of the population in 2007, up from 7 per cent in 2003.
Enrolment of the poor in mutuelles is a key indicator
in the performance-based contract signed by the mayor
and the president. The Government is also engaged in
creating municipal pooled funds, as well as a national
fund for reinsurance financed by contributions from
formal workers.
See References, page 108.
S T R E N G T H E N I N G C O M M U N I T Y PA R T N E R S H I P S , T H E C O N T I N U U M O F C A R E , A N D H E A LT H S Y S T E M S
85
Sustained improvements in maternal, newborn and child health
will necessitate long-term commitments that go well beyond the
political lifespan of many decision
makers. Countries including Brazil,
Sri Lanka and Thailand have
rooted their impressive results
in a step-by-step extension of
health-system coverage and nutri-
Focus
On
tion services over many years.
During recent decades, Latin
America’s performance in enhancing health-service coverage,
despite periodic economic crises,
institutional deficiencies and
wide socio-economic disparities,
has been noteworthy. All of
the countries mentioned went
through several distinct phases:
• Developing an accessible network
of community-based, primary and
referral-level services.
• Consolidating advances by improving the quality of care, all
Brazil: Creating a national community-based health-system
network
Context and challenge: Brazil is one of 60 countries selected
by the Countdown to 2015 group as a priority for child
survival in the run-up to the deadline for the Millennium
Development Goals. (For a more detailed explanation of
Countdown to 2015, see Chapter 1, page 16.) These countries
represent those with at least 50,000 child deaths or with a
rate of under-five mortality of 90 deaths or more per 1,000
live births. In 2006, 74,000 children died before reaching their
fifth birthday, according to the latest estimates published
by UNICEF.
Although Brazil has made strong and steady progress in
reducing mortality rates for children under five, there are
clear geographical and ethnic disparities in death rates for
infants. According to 2002 data, the aggregate infant mortality rate for the north-east region is twice as high as rates
in south, south-east and central-west provinces. In Alagoas,
the worst affected state in the north-east region, the infant
mortality rate in 2002 was 58 per 1,000 live births, compared to a national average of around 28 per 1,000 births
that year. Racial and ethnic disparities in child mortality
risks are also evident, and children whose mothers are
of indigenous or African descent are threatened by a
much higher risk of mortality than children of Europeandescendent mothers.
The challenge facing Brazil, therefore, is to maintain the
downward trend in overall child mortality while simultaneously adopting a strong regional and ethnic focus to
health-care provision.
Approach and interventions: After pilot projects in Brazilian
cities during the early 1980s, a community health worker
network was created with UNICEF support as part of a
86
• Building up a cadre of professional health workers as the
foundation.
comprehensive primary-health-care initiative, the Programa
Saúde da Família (Family Health Programme). Each community health worker is responsible for visiting families in the
community, providing up-to-date information on health,
hygiene and childcare, and monitoring and evaluating the
growth and health of children under 6 years old, as well
as pregnant women. Community health workers also refer
residents to local health units and alert family health teams –
which usually include a doctor, a nurse, a nurse technician,
a social assistant and a dentist – regarding local conditions
or crises. Doctors and nurses participating in the Family
Health Programme receive competitive salaries to encourage
them to work in poor and rural areas. Each team is responsible for around 1,000 families. The teams are jointly financing
by federal, state and municipal governments.
The activities of community health workers in the
Programa da Saúde include providing education on
child development and protection. UNICEF equips workers
with Family Information Kits that include flip charts about
breastfeeding and the role of all family members in promoting healthy lives for mothers and children. More than 222,280
community health workers cover nearly 110 million people
across Brazil, making this network one of the largest in the
world. The network is integrated within the national system,
and federal, state and municipal governments are fully
responsible for funding and administering the programme
throughout Brazil.
The use of field trials before implementation of the programme established that it had the potential to generate
marked improvements in health. Political commitment to the
network ensured its viability. Roles for the community health
workers are well defined, including their designation as part
T H E S TAT E O F T H E W O R L D ’ S C H I L D R E N 2 0 0 8
in conjunction with improvements
in living conditions and the status
of women.
• Prioritizing broad social safety
nets that ensured equitable
access to health, nutrition and
education, making health
and nutrition services widely
available.
• Reducing barriers to key services
and providing primary and secondary schooling to all children.
Even in some of the poorest countries in Latin America, where
economic crises, institutional deficiencies and wide socio-economic
disparities continue to hinder
advances, there has been marked
Figure 4.5
Brazil: Wide disparities in infant
mortality rates between and within
selected regions, by family income
and by mother’s ethnicity, 2002
Infant mortality rate
(per 1,000 live births)
2000
Disparities by family income
20 per cent richest households
20 per cent poorest households
15.8
34.9
Disparities by mother's ethnicity
White
Afro-descendent
Indian
22.9
38
94
National Average
30.2
progress towards generalized access
to quality health care.
Country ownership and public sector
leadership can vastly increase the
prospects for successful scaling up.
Time and again, it has been shown
that when governments take the lead
and are committed to expanding successful pilot and small-scale projects,
of local health units. Lines of referral and supervision
are clear: The unit supports the health workers, and they,
in turn, perform outreach for the health system in the
communities. The community health workers become a
central part of their local communities, and the integration
of the network within national, state and municipal governments helps ensure both the sustainability of the programme and its extension into new areas of the national
health system.
Results: The introduction of the community health worker
programme has contributed to a reduction in infant deaths
across the country since 1990. Moreover, the government
has focused on the north-east region and on marginalized
ethnic groups during recent years. It has also adopted a
strong regional focus to child and maternal health care, and
almost half of the participants who receive cash benefits
from Programa da Saúde live in the north-east.
2002
Regions/selected states
Central-West
Federal District
Northeast
Alagoas
North
Southeast
Sao Paolo
South
Rio Grande do sol
20.4
17.5
41.4
57.7
27.7
20.2
17.4
17.9
15.4
National Average
28.4
Source: United Nations Children’s Fund, ‘The State of Brazil's
Children 2006: The right to survival and development,
UNICEF, Brasilia, 2005, pp. 10-11.
See References, page 108.
S T R E N G T H E N I N G C O M M U N I T Y PA R T N E R S H I P S , T H E C O N T I N U U M O F C A R E , A N D H E A LT H S Y S T E M S
87
these initiatives can rapidly gain
nationwide coverage. Brazil’s community health worker programme (see
Panel page 86) and the Bolsa Familia
initiative, Mexico’s health, nutrition
and education programme, PROGRESA, and Seguro Popular de Salud
health insurance scheme, Indonesia’s
community health workers and
Egypt’s oral rehydration initiatives,
along with many other examples,
show the potential for scale-up when
governments are willing to commit
even scarce funding to health and
social welfare programmes.
Ownership is more than just funding,
however. Governments must also be
committed to creating and sustaining
the required technical and administration capacity. Support at each level
of health-system administration –
federal, provincial and district – is
required to coordinate and supervise
the expansion. Sustainability issues
must also be addressed at the national level, and the programme fully
endorsed by the political system –
including the legislature – to ensure
that it outlasts political transitions
and changes.
Governments can provide the
capacity and will to creating a
national network based on community health. When this has happened, the results are often significant. In the case of China, for
example, the Government set itself
a tremendous challenge with the
launch of the National Iodine
Deficiency Disorders Elimination
Program, a strategy for ensuring a
nationwide supply of commercially
marketed iodized salt and promoting universal compliance. At that
time, China had the highest number
A new way of working together for multilateral institutions
In New York, 19 July 2007, global health leaders from eight
international organizations met informally to discuss ways
of strengthening their collaboration to achieve better health
outcomes in developing countries. Capitalizing on the recent
appointments of several leaders, the objective of the meeting
was to review progress made during recent years, assess current trends and future challenges for global health, and agree
to collective action, in the context of current opportunities.
Several key commitments were recommended, including:
• Stimulate a global collective sense of urgency for reaching the health-related MDGs. Participants agreed that,
despite important advances in health care for mothers,
newborns and children in some countries and for some
indicators, the international community – in partnership
with national governments – must accelerate and intensify efforts dramatically in order to reach all of the healthrelated Millennium Development Goals. The eight organizations represented have an important role in stimulating
this action. Participants agreed to hold themselves
accountable for providing the necessary support to
countries to reach the goals and to accelerate action
at all levels within each of their own organizations.
88
and teamwork. Emphasis was placed on clarifying the core
responsibilities of each agency; the need for a coordinated
inter-agency approach to providing high-quality, demanddriven technical assistance; and implementation of a collectively supported and robust monitoring and evaluation
system. Such approaches need to build on existing structures and programmes at the global, regional and country
levels. Each of the organizations agreed to evaluate their
personnel, training programmes and incentives structure
to reflect this new, collaborative way of doing business,
recognizing that new skills will need to be developed,
particularly at the country level. The development of a
framework for mutual accountability would ensure more
clarity on roles, responsibilities and milestones, and a
system for monitoring commitments.
Action: The global health leaders agreed to work together to
better define their individual and collective accountabilities
for better and faster results.
Action: The global health leaders agreed to catalyse a greater
sense of urgency in their own organizations and support it
through budgetary and human resources decisions.
• Foster a more systematic and robust approach to knowledge management and learning. Given the significant new
investments in global health, opportunities are available
to capture knowledge and lessons learned in health programmes. The participants emphasized the opportunity to
conduct more systematic mapping of the health sector at the
country level, including the role played by the private sector.
• Modify institutional ways of doing business. Achieving the
health-related MDGs will require increased collaboration
Action: The global health leaders agreed to explore means
to systematically capture knowledge gained in health
T H E S TAT E O F T H E W O R L D ’ S C H I L D R E N 2 0 0 8
of children unprotected from iodine
deficiency, the leading cause of
preventable intellectual impairment
in the world. Iodine deficiency
disorders can be prevented with
a single teaspoon of iodine spread
over a lifetime. The challenge was
to raise public awareness of the
vital importance of iodized salt,
especially in salt-producing regions
where local residents resisted the
idea of paying for salt.
With political support from provincial governors, rigorous monitoring
and enforcement of iodized salt regulations, as well as a nationwide public health campaign that used posters
on buses, newspaper editorials and
television documentaries to inform
consumers and create demand for
fortified salt, adequately iodized salt
reached 90 per cent of the households around 2005, up from 51
per cent around 1995.30
Addressing the political dimension
in creating sustainable continuums
of quality care requires more than
compelling technical arguments.
programmes and to develop a more robust and coordinated approach to knowledge management in general.
Finally, the group agreed to pool resources when their
organizations conduct mapping exercises and health
sector assessments.
• Recognition of the important opportunity presented by
the renewed interest in health systems. Participants welcomed the commitment to the health-related MDGs as
articulated in several new global initiatives being developed
around health-system strengthening. Such support is well
aligned with the priorities of the participating organizations.
There was strong agreement for adopting a ‘systems for
outcomes’ approach whereby strengthening would be
evaluated by its ability to deliver against health outcomes.
In addition, the group recognized the key brokering role of
the UN agencies in bridging the need for accountability and
countries’ desires to lead their own development processes.
The urgent need for benchmarking health system performance was emphasized. Finally, with the growing number of
stakeholders working in global health, the need for closer
alignment around an overarching health-sector strategy at
the country level was emphasized. In this regard, the global
health leaders discussed the experience of programming
for HIV and AIDS, which may offer learning opportunities.
Action: The global health leaders agreed to engage emerging
global initiatives in a coordinated manner to ensure their
organizations effectively support countries through funding
and/or technical and policy assistance. In addition, WHO and
It also necessitates a broad understanding of the constraints and
opportunities for fostering will
and commitment among key
political players.
Politicians may need to be convinced that actions in support of the
continuum of care satisfy several
expedient criteria, including
that they:
• Demonstrate visible and tangible
results within a relatively short
time frame.
the World Bank committed to fast-track the benchmarking of
health system performance.
• Recognition that the role of civil society and the private
sector will be critical for success. The private sector has
several roles to fulfil in delivering health services, in financing health care and in bringing new technologies to market.
Innovations can help accelerate progress, whether they are
technologically driven or new programme models, such
as micro-venture and performance-based financing.
Non-governmental organizations have a long history of
delivering services in developing countries, and their field
experience is a source of important lessons. Support to
developing countries in reaching the health-related MDGs
will require strengthening integrated delivery systems
across the public and private sectors, and creating opportunities for private sector involvement and investment.
Action: The global health leaders expressed their commitment to involve the private sector and civil society more
systematically as the work on the health-related MDGs
expands at global, regional and country levels.
The group has agreed to monitor progress towards
achieving the commitments made at this meeting.
See References, page 108.
S T R E N G T H E N I N G C O M M U N I T Y PA R T N E R S H I P S , T H E C O N T I N U U M O F C A R E , A N D H E A LT H S Y S T E M S
89
Human rights, community-based health care and child survival
by Paul Farmer and Jim Yong Kim
identified five key components for a comprehensive,
community-based child survival programme.
With 20 years of experience in rural Haiti introducing
modern medical care to millions who had not previously
enjoyed it, we now know many of the requirements for a
successful health-care programme in areas devastated by
disease and poverty. To provide primary care alongside
specialized treatment for infectious disease, while promoting women’s and children’s health, community health-care
workers must be trained and mobilized to prevent illness
and to deliver quality health care. With recent expansion
to Lesotho, Malawi and Rwanda, we now see that many of
the lessons learned in Haiti are universal in improving the
health of children and adults worldwide.
In each of the settings in which Partners In Health works,
our goal is to ‘do whatever it takes’ to improve the health
and well-being of those we serve, almost all of whom live
in poverty. In each setting, we have learned that health
problems do not occur in isolation from other basic
needs, such as adequate nutrition, clean water, sanitation, housing and primary education. We have also
learned that non-governmental organizations cannot
work in isolation but must collaborate with members of
the communities served and with local health authorities
to strengthen public health so that future generations
may come to regard these services as rights rather
than privileges.
This rights-based, community-based approach to
promoting health leads to a clear vision regarding
the health of children
In Haiti, Lesotho, Malawi and Rwanda, Partners In Health –
in collaboration with local communities and a wide range
of partner organizations, including the Clinton Foundation,
ministries of health, UNICEF and the François-Xavier
Bagnoud Center for Health and Human Rights – has
• Are affordable and cost-effective
at scale.
• Fit within existing structures
and hierarchies and have the
support of professional groups
and lobbies.
90
First, we work with public health authorities to roll out
the interventions shown to be crucial to improved child
survival. These include expanded vaccination campaigns;
vitamin A distribution; the use of oral rehydration salts to
treat diarrhoeal disease and safe-water programmes to
prevent it; an aggressive programme for prevention of
mother-to-child transmission of HIV; malaria prevention
with mosquito nets, backed by improved communitybased and clinical care; nutritional assistance for children
suffering from or at risk of malnutrition; and the provision of high-quality in-patient and ambulatory paediatric
services for those children who do fall ill. Currently, we
are working with the Government of Rwanda and other
partners to show how an integrated package of key child
survival interventions, including prevention of mother-tochild transmission of HIV, can be rapidly deployed under
the Government’s strengthened rural-health-care model.
With support from the international Joint Learning
Initiative on Children and HIV/AIDS, a cross-sectoral,
interdisciplinary exercise in collaboration between leading practitioners, policymakers and scholars, practitioners
scaling up child survival interventions in rural districts
are sharing innovations and results through a collaborative network that will enable them to improve service
quality, even as they reach greater numbers of children
and families in previously underserved areas.
Second, since the health and well-being of mothers are
key determinants of child survival, our efforts promote
integrated maternal and child health. Our work on behalf
of children is linked to efforts on behalf of their mothers
and other family members through family planning programmes, prenatal care and modern obstetrics as part
of women’s health programmes, efforts to promote adult
literacy and poverty alleviation in general.
These political considerations are
likely to constrain some of the technical choices that advocates of the
continuum prefer, but unless such
political concerns are acknowledged
and addressed, the strategies they
promote are unlikely to succeed.
T H E S TAT E O F T H E W O R L D ’ S C H I L D R E N 2 0 0 8
Stability, in political and macroeconomic terms, and sound budgeting are prerequisites for mobilizing
the institutional, human and financial
resources required to strength health
systems and nutrition services.
Many of the countries struggling
Third, we initiate and/or strengthen paediatric AIDS
prevention and control programmes. As part of an upcoming campaign, and in the manner outlined above, we are
launching a major paediatric AIDS initiative in Rwanda in
concert with the Clinton Foundation and Rwandan health
officials and providers. This initiative will establish a national centre of excellence for paediatric AIDS care. Quality
paediatric services will be linked to community-based care
for children with HIV and also to prevention efforts within
primary and secondary schools in rural Rwanda.
Fourth, we need to launch operational research and training programmes designed to improve the quality of care
afforded to rural children. Such research will examine the
programmatic features of successful efforts to prevent
HIV transmission from mother to child; the diagnosis and
management of HIV among infants; paediatric tuberculosis diagnosis and care; the role of community health
workers in improving care for chronic paediatric conditions, including AIDS and tuberculosis, and in preventing,
diagnosing and providing home-based treatment for such
common ailments as malaria and diarrhoea; and assessing the impact of social interventions, including those
designed to curb food insecurity and illiteracy, on the
health and well-being of children worldwide.
Fifth, we work to advance these efforts in tandem with
those designed to promote the basic rights, in particular,
the social and economic rights, of the child. The Partners
In Health Program on Social and Economic Rights
(POSER) disseminates, through tangible projects and
through advocacy, a rights-based model of poverty alleviation, using access to health care as a means of meeting
and working with the poorest children and families in the
communities we serve. POSER backs education, agriculture, housing and water projects to guarantee basic
social and economic rights for every child and every
family. If we know that hunger and malnutrition are the
to meet the MDGs, particularly in
sub-Saharan Africa, do not enjoy
political or economic stability. Under
such circumstances, it is important
to mobilize all forms of effective
leadership in society, whether at the
national level where broad sectoral
underlying cause of millions of child deaths each year –
and we do – then we must face up to the challenge of prescribing food as an essential medicine for immunization
and paediatric care. Similarly, if studies show that education reduces the risk of infection with HIV – as they do –
then we must be prepared to invest in access to schooling
as a potent and cost-effective element in our formulary for
combating HIV and other diseases of poverty.
We now know that without a community-based, comprehensive strategy, efforts to treat children – and subsequently mothers, fathers and siblings – fail to provide the desired
outcomes. Working in conjunction with ministries of health,
international institutions and other non-profit organizations,
we are committed to stemming the tide of childhood death
and disease in the areas we serve. From experience in Haiti
and now around the world, we know that community-based
services to improve health and reduce poverty, linked,
when necessary, to excellent clinical resources, offer the
highest standard of care in the world today and the key to
improving child survival.
Drs. Paul Farmer and Jim Yong Kim are co-founders of
Partners In Health, an international health and social justice
organization that works in Haiti, Lesotho, Malawi, Peru, the
Russian Federation, Rwanda and the United States. Paul
Farmer is the Presley Professor of Medical Anthropology at
Harvard University and an attending physician at Brigham
and Women’s Hospital in Boston. Jim Yong Kim is Chair of
the Department of Social Medicine at Harvard Medical
School, Chief of the Division of Social Medicine and Health
Inequalities at Brigham and Women's Hospital, Director of
the François-Xavier Bagnoud Center for Health and Human
Rights and a former director of the World Health
Organization’s HIV/AIDS Department.
decisions are made or at various subnational levels (provincial, district)
where the interaction with communities takes place.
In contrast to the extensive knowledge of the technical and contextual
interventions required to improve
maternal, newborn and child health,
there is less known on how political
commitment to a result-oriented
approach to health services delivery
is both effected and sustained, particular in settings of low health systems
S T R E N G T H E N I N G C O M M U N I T Y PA R T N E R S H I P S , T H E C O N T I N U U M O F C A R E , A N D H E A LT H S Y S T E M S
91
capacity. The international community knows how to set the agenda –
witness how the MDGs were derived
from the Millennium Declaration and
have become the benchmark for
human development in the early
years of the millennium. But, at the
midpoint of the goals, there is still a
gap between the intention and action.
Strong leadership and
champions are often pivotal
to successful scale-up
One of the most intriguing findings
of a study on scaling up conducted
by the Disease Control Priorities
Project, an ongoing effort by many of
the world’s leading health specialists
to assess disease control priorities, is
the important role of national champions in generating and sustaining
the political will and commitment to
take health programmes to scale.
These champions are not only strong
backers of initiatives, they have also
been able to bring together key stakeholders, coordinate activities and sustain momentum for scaling up.
Leadership can come in many different forms: from an individual, such
as Fazle Hasan Abed, the founder of
BRAC, a successful community health
programme that provides essential
health-care services to millions in
Bangladesh; from the highest levels of
national government, as was the case
in Mexico, whose PROGRESA programme was championed by President
Ernesto Zedillo de Leon, and maintained and expanded by his successors, Vicente Fox and Felipe Calderón;
and from international quarters,
such as the Expanded Programme on
Immunization, the child survival revolution and GOBI (growth monitoring,
oral rehydration therapy, breastfeed-
92
ing and immunization), the multiplicity of global partnerships and programmes for various diseases over
the past six decades, and most recently, the Integrated Management of
Childhood Illness (IMCI) and the
Accelerated Child Survival and
Development initiative.
One of the points that emerges from
the review of evidence and experience
on scaling up is that championing
takes time and commitment. Sustained investment in both time and
resources is required over many years
to steadily take programmes to scale.
Key examples of such commitment
include Sri Lanka’s 50-year project
to create a rural health network and
Nepal’s long-standing campaigns on
micronutrient supplementation.31
Enshrining national commitments in
a legal framework can provide the
necessary continuity in support of
scaling up the continuum of care
beyond the political lifespan of its
initial champions. Such a framework
makes it possible to translate political
commitment into resource mobilization and budgetary measures. This
longer-term political agenda requires
partnerships between government,
civil society organizations and development agencies to maintain the
political momentum, overcome
resistance to change and mobilize
resources. It also requires accountability mechanisms and checks and
balances to keep the system on track.
V. Greater harmonization of
global health partnerships and
programmes
Over the past decade, the aid architecture in health has become even
T H E S TAT E O F T H E W O R L D ’ S C H I L D R E N 2 0 0 8
more complex with the emergence
of large global health partnerships
(GHPs). Depending on the definition
used, it is estimated that there are
over 100 GHPs.32 They are a diverse
group, with functions ranging from
advocacy to implementation, and are
different in nature, scale and scope.
The vast majority focus on communicable diseases – particularly AIDS,
tuberculosis and malaria. Some
GHPs also promote nutrition interventions, such as early and exclusive
breastfeeding and vitamin A supplementation, or improved water and
sanitation. In recent years, increasing
attention has been given to activities
focused on achieving MDG 1, which
aims to halve hunger and poverty
by 2015, through such initiatives
as Ending Child Hunger and
Undernutrition Initiative, Global
Alliance for Improved Nutrition,
Micronutrient Initiative and Flour
Fortification Initiative.
Although there are a large number of
GHPs, only a handful have a major
impact on health financing – notably,
the GAVI Alliance and the Global
Fund to Fight Aids, Tuberculosis and
Malaria. Global health partnerships
have mobilized important new
resources for major health threats,
and brought much needed political
and technical focus to priority diseases
or interventions. They have injected
new energy into development assistance by supporting the private sector
and encouraging community partnerships to take a more prominent role
in the provision of health care.
The rapid creation of new institutions
in health is proving challenging for
developing countries to keep track of,
let alone to manage and coordinate.
Furthermore, new initiatives have the
potential to complicate efforts at harmonizing and coordinating actions at
the global level in support of maternal, newborn and child survival and
health. Given their strong focus on
achieving rapid, cost-effective and
measurable results, the proliferation
of GHPs risks entrenching the ‘vertical’ nature of health financing by
focusing large amounts of new funding on disease-specific programmes
and interventions, creating separate
financing and delivery silos, and leaving recipient governments with little
flexibility to reallocate funds according to their own priorities or to fund
health-system costs and investments
such as salaries and facilities.
Creating conditions for
increased unity in global health
programmes and partnerships
In response to the proliferation of
global health partnerships and initiatives, a set of best practice principles
for global health partnerships has
been developed. Based on the Paris
Declaration on Aid Effectiveness, the
principles were endorsed by participants and have now been adopted by
the boards of a number of GHPs. In
addition, the OECD Development
Assistance Committee has reviewed a
‘Good Practice Guidance for aligning
global programs at the country level’.
This responds to the need identified
in the Paris Declaration for taking
concrete and effective action to
address insufficient integration of
global programmes and initiatives
into partner countries’ broader
development agendas. On governance
and implementation of global programmes, the good practices address
the interlinked roles of financiers
(bilateral donors, multilateral institu-
tions and private foundations), partner countries and global programmes.
Global programmes in health,
whether in partnerships or through
individual actions of single organizations and donors, have become
an important tool of development
assistance, with bilateral donors,
multilateral institutions and private
foundations providing rapidly
increasing levels of financing for
service delivery at the country level.
These programmes, which also
attract strong public support, call
international attention to issues of
global importance, encourage innovation and the dissemination of
best practices, and provide pooled
multi-donor funding (upstream
harmonization).
effectiveness of global programmes,
current or proposed, that provide
significant country-level financing.
However, some of the good practices,
including those on selectivity and
governance, have implications for
global programmes in general.
Financiers, partner countries, global
programmes and private donors are
being invited to apply the guidance
on a trial basis. Monitoring of a pilot
of good practice application will be
carried out as part of the use of health
as a tracer sector to monitor the
effective implementation of the Paris
Declaration on Aid Effectiveness and
will be reported at the High Level
Forum on Aid Effectiveness to be held
in Accra, Ghana, September 2008.
The principles of the Paris Declaration
on Aid Effectiveness – with their focus
on country ownership, harmonization
and alignment, and mutual accountability – apply to global as well as
country-based programmes. Country
studies confirm that issues of implementation are similar for the two,
but that many global programmes face
specific challenges. These include lack
of field representation and related
absence from donor harmonization
efforts, inconsistency with government
priorities and budgets, parallel mechanisms for coordination, as well as for
implementation, and a centrifugal pull
on human and financial resources
from related national programmes.
The good practices take as their base
the principles and related indicators of
the Paris Declaration, applying and
extending them to reflect the specific
case of global programmes. They are
intended primarily to improve the
S T R E N G T H E N I N G C O M M U N I T Y PA R T N E R S H I P S , T H E C O N T I N U U M O F C A R E , A N D H E A LT H S Y S T E M S
93
The Millennium
Development Goals
are not a series of utopian targets.
They are the product of tough thinking and hard calculations by some
of the world’s leading politicians,
development specialists, economists
and scientists, and they currently
represent the world’s best hope to
accelerate human progress.
SUMMARY
Achieving the goals will result in
hundreds of millions of children,
men and women being relieved
of hunger, utilizing safe water
and basic sanitation, obtaining
an education, and enjoying the
same economic advantages and
political opportunities that are
available to others. Although
several regions and countries are
lagging behind, the targets are all
reachable in the time remaining
if the political will, the necessary
resources and the required
strategies are put in place.
Can the political will be mustered?
Can frameworks, strategies,
actions and resources be galvanized into a unified drive to meet
the MDGs on time and in full? The
short answer is ‘yes’ – but only if
governments, donors, civil society
Meeting the health-related MDGs will
require unified actions and partnerships in
support of maternal, newborn and child
survival and health. Children wait in line at
a vaccination site, Bangladesh.
and other stakeholders unite
for child survival and commit
themselves to ensuring that the
health-related MDGs are met.
The challenge is to shake off cynicism and lethargy and put aside
the broken promises of the past.
In the end, no enterprise is more
essential or reward more satisfying than saving the life of a child.
T H E S TAT E O F T H E W O R L D ’ S C H I L D R E N 2 0 0 8
© UNICEF/HQ06-0963/Shehzad Noorani
Uniting for child survival
The world will not be a perfect place
even if the Millennium Development
Goals are achieved. Poverty will still
exist. Children and their mothers will
still die needlessly. And the environment will continue to demand our
attention. Nevertheless, according to
the estimates from the Millennium
Project, the independent advisory
body that introduced recommendations for achieving the MDGs to the
2005 World Summit, reaching the
goals will mean that the lives of up
to 30 million children and 2 million
mothers will have been spared. More
than 300 million people will no
longer go hungry. Hundreds of millions of people will gain access to
safe drinking water and basic sanitation facilities. Millions more children
will go to school and millions more
women will enjoy economic and
political opportunities.1
The MDGs were not dreamed up by
a group of utopians. They are the
result of tough thinking and hard
calculations by some of the world’s
leading politicians, development specialists, economists and scientists,
and they currently represent humankind’s best hope to steer the world on
a more sustainable course. They are
5
reachable targets, well within the
realm of possibility – if the political
will, the necessary resources and
the required strategies are put in
place. Making the decision to
achieve the goals is the essential
first step. Action on the additional
steps needed to achieve the healthrelated MDGs – outlined below –
can then be accomplished mostly
within the framework of existing
approaches to maternal, newborn
and child health care.
• Develop and strengthen the
continuum of care across time
and location.
Can this political will be mustered?
Can individual and collective
frameworks, strategies, actions
and resources be galvanized into a
unified drive to meet the health-related
MDGs in full and on time? The State
of the World’s Children 2008 has
identified six pivotal actions at the
macro level that urgently require
unified engagement to intensify
efforts for maternal, newborn and
child survival and fulfil the right of
women and children to health and
well-being. These are:
• Make maternal, newborn and child
survival a global imperative.
• Work towards creating a supportive environment for maternal,
newborn and child survival
and health.
• Scale up packages of essential
services by strengthening health systems and community partnerships.
• Expand the data, research and
evidence base.
• Leverage resources for mothers,
newborns and children.
Create a supportive environment
for child survival and health
While The State of the World’s
Children 2008 has focused mainly
on the essential interventions and
approaches that have proved effective
in saving children’s lives, more farreaching and systemic changes are
needed. Providing quality health care
to women and children demands an
environment in which they can survive and thrive. The most obvious
requirement is the absence of conflict.
Peace and security are essential for
the proper functioning of health
programmes, whether they are
95
© UNICEF/HQ05-1173/Roger LeMoyne
Healthy and secure environments are vital conditions for the survival and well-being of
mothers and their children. A woman receives a diploma for completing a child-rearing
course, Turkey.
facility-based services, extensionbased services or community partnerships. If paths to conflict resolution
cannot be found, it is vitally important to reach and protect children
and their families caught in complex
emergencies. Although incorporating
the concept of children as ‘zones of
peace’ into international law has not
been realized, ‘days of tranquility’,
when fighting stops and brigades of
health-care workers are able to
administer vaccines, have been
declared in recent decades in countries as diverse as Afghanistan,
Angola, the Democratic Republic
96
of the Congo, El Salvador, Lebanon,
Somalia, Sri Lanka and Sudan.2
Equally important is a child’s sense of
inner security, which can be disrupted
by armed conflict, high levels of violence and crime within communities
or by living in an embattled home.
Infants and young children are acutely
sensitive to the world around them.
Anticipation of the next crisis, whether
it is a landmine explosion or sexual
assault by a relative or family friend,
can be almost as traumatic and destabilizing as the act itself. Acknowledging
children’s right to a protective environ-
T H E S TAT E O F T H E W O R L D ’ S C H I L D R E N 2 0 0 8
ment is essential in preventing violence
against them, and it must be followed
by appropriate legislation and effective
enforcement.
Equity is another critical aspect of a
supportive environment for children.
In far too many countries, to be
poor automatically means to be neglected and marginalized by the
health system. Others are excluded
from essential services and practices
on the grounds of gender, disability,
race or ethnic origin. Ensuring that
health systems and maternal and
child survival programmes are
rights-based and seek to rectify such
inequities is imperative. Moreover,
to effectively reach those currently
missing out, health programmes
must be integrated into strategies
that address the root causes, as well
as the effects, of marginalization and
social exclusion.
Sustained improvements in the health
of women and children will also
demand greater gender equality and
the empowerment of women. No matter how or which health services are
provided, many children will miss out
unless women have wider decisionmaking powers within the household.
Numerous studies have confirmed the
powerful and positive effects of education and economic opportunities on
women’s well-being, which translate
into better care and improved survival
prospects for their children.
Develop and strengthen the
continuum of care across time
and location
Children are most vulnerable at birth
and during the first few days of life.
Health care, therefore, is crucial during pregnancy, at birth and in the
neonatal period. This continuum of
care should extend through infancy
and early childhood, with packages
of essential services delivered to both
mother and child at key points during
the life cycle. The life cycle approach
acknowledges that the continuum
will require education, empowerment,
knowledge and reproductive health
services for girls in adolescence, since
many of them will also become mothers – around 13 per cent of babies
were born to mothers aged 15–19
in 20053 – and on into womanhood.
To be effective, the continuum of care
must forge strong links between the
household, the community and quality outreach and clinical services at
primary health facilities, which, in
turn, have strong connections to a
district hospital. Establishing these
links often results in greater use of
services. It also means that fewer
women and children are likely to
fall through the cracks.
The household and community are
where childcare practices and careseeking behaviours are learned and
supported. These are often introduced
in visits to a health clinic during pregnancy, which can be a woman’s first
contact with the formal health system.
Antenatal care is important because it
helps women identify potential risks
and plan for a safe pregnancy. If a
health clinic is not located nearby,
extension services must be provided
through staff from outlying and
district facilities. Such services
typically provide a mix of antenatal,
postnatal and child health care.
The district hospital is at the top of
the health system for communities
and households and must be adequately staffed and equipped to
manage any complications during
childbirth. At the level of primary
care, facilities and staff should be
prepared to assist uncomplicated
births and offer basic emergency
obstetric care and immediate newborn care, including resuscitation.
The quality of care provided at all
three levels, and strong connections
between them, is key to ensuring
a continuum of care across time
and location.4
Scale up packages of essential
services by strengthening health
systems and community
partnerships
The health systems in many of the
poorest countries are fragile and
fragmented, beset with problems
ranging from an acute shortage of
skilled staff to lack of financing,
equipment and supplies and the
inability to generate and use information. Over the medium to long
term, the surest way to achieve
the health-related Millennium
Development Goals is to strengthen
national health systems. Community
partnerships in primary health care
can be effective in scaling up services
in areas of a country that are hard
to access, and in strengthening
health systems. As this report shows,
there is a growing body of evidence
that packaged interventions can be
effectively delivered at the community level throughout the life cycle.
Moreover, empowering individuals
to assume a measure of responsibility for their own health – and that of
their families – can have a profound
and lasting impact on development.
Providing community members with
the information they need to make
changes in their lives can be greatly
enhanced by the mass media, which
can deliver key health messages at
low cost. Moreover, civil society
organizations that specialize in
participatory approaches can be
recruited to promote specific aspects
of child survival and health, if given
the proper guidelines and carefully
monitored. Community mobilization
need not be the sole responsibility
of overstretched ministries of health.
Indeed, local governments and ministries for women’s development
can play a pivotal role, along with
women’s organizations and domestic
civil society leaders, if brought into
the process from the outset.
Although current programmes for
child survival emphasize low-tech
solutions, cutting-edge technologies
could provide an unexpected boon
in reaching the hard to reach. For
example, simple diagnostic tools
have been developed to diagnose
malaria, test for HIV, and analyse
water quality. With basic training,
such tests can be administered out
of even the most rudimentary health
clinic. Biotechnology is producing
safer recombinant vaccines, and
research is ongoing to provide vaccines that do not require refrigeration
and may be delivered by skin patches,
nasal spray or other techniques,
rather than by injection. Both of these
potential breakthroughs could have
enormous repercussions for expanding immunization services.5
Although its application to this area
is still in the early stages, information
technology, too, has a role in child
survival and health in developing
countries. The growing use of mobile
phones, email and the Internet means
that eHealth and telemedicine can
U N I T I N G F O R C H I L D S U R V I VA L
97
© UNICEF/HQ06-2402/Susan Markisz
An integrated approach to health systems development is pivotal to advancing child survival and health. This family participates in the Trio
por la Vida (‘Trio for Life’) programme, which promotes birth registration, breastfeeding and immunization, Venezuela.
already reach people in remote areas
and could have much broader applications. In addition, health-care
workers can more easily connect to
primary care facilities and, if needed,
to departments and referral centres
in hospitals.6
Expand the evidence base
Understanding a problem is often
half the solution. While the broad
outlines of the situation of children
around the world are clearly defined,
the specifics are sometimes vague.
The dearth of reliable statistics in
many countries makes it difficult for
policymakers to establish priorities,
measure the effectiveness of pro-
98
grammes or monitor progress. Even
vital registration systems – which
record key life events, including
birth and death – sometimes cover
only portions of a country, if they
are available at all. Birth registration,
in particular, is essential to protecting
children’s rights and to generating
accurate information about a country’s population (see Chapter 1,
page 22).
Accurate information and situation
analysis on the state of health,
nutrition, water, sanitation and
hygiene, and HIV and AIDS among
the world’s children are pivotal to
formulating strategies to scale up
T H E S TAT E O F T H E W O R L D ’ S C H I L D R E N 2 0 0 8
community partnerships, the continuum of care and health systems for
outcomes. The basis for data dissemination, results assessment and strategic planning in developing countries
is being provided by a rich array of
resources, including: household surveys, such as the Multiple Indicator
Cluster Surveys; statistical reviews,
such as the Progress for Children
report card series produced by
UNICEF; The Lancet series that have
covered child, newborn and maternal
survival and health; and publications
assessing progress towards the
Millennium Development Goals that
have been produced by the United
Nations Development Programme,
resources, will require substantial
help from richer nations to achieve
the MDGs. According to estimates by
the Millennium Project, the total official development assistance (ODA)
required for the MDGs was US$135
billion in 2006, but the actual ODA
delivered in 2006 totalled US$104
billion7 (see Figure 5.1). On current
trends, ODA looks set to rise to
around US$200 billion by 2015.
These estimated figures are equivalent to about 0.5 per cent of the
gross national product (GNP) of
donor countries – 0.44 per cent in
2006 and 0.54 per cent in 2015,
respectively. When additional costs –
for major infrastructure projects,
adjusting to climate change and postconflict reconstruction, for example –
are factored in, a more likely target
is 0.7 per cent of donor country
GNP. The irony is that this amount
is completely affordable within commitments already made by donor
countries. More than 35 years ago,
the World Bank and the World
Health Organization, among others.
These initiatives are complementing
national efforts across the developing
world to produce, analyse and disseminate key health data and information related to maternal, newborn
and child inputs and outcomes.
With increasing demands for accountability, as a result of both the MDGs
and new global health initiatives, the
need for a strong base of evidence is
imperative. Although there is more
than enough information to act, it is
also true that there is still a need for
more rigorous research and evaluation
of what works, systematic sharing
of good practices and greater sharing
of new information.
Leverage resources for mothers,
newborns and children
It is widely acknowledged that the
poorest countries, in addition to
mobilizing their own domestic
major industrialized nations promised to allocate 0.7 per cent of their
GNP for ODA.8 In 2002, the 0.7
per cent target was reconfirmed by
all countries in the Monterrey
Consensus.
How are we doing? Sixteen of the
22 member countries of the OECD
Development Assistance Committee
met the 2006 targets for ODA they
set in Monterrey. But the remaining
six countries must be encouraged to
deliver on their promises.9
Of course, the needs of countries
seeking to achieve the MDGs are
different. Based on the best evidence
available, UNICEF is currently developing a country-specific list of policy
options for achieving the healthrelated MDGs for consideration by
governments and their partners in
maternal and child health. It is also
helping countries to identify and fill
gaps in financial support.
Figure 5.1
Selected financial flows to developing countries
0
50
100
150
200
250
300
350
400
450
500
550
600
* Refers to official development assistance provided by the members of the OECD Development Assistance Committee.
650
700
**Estimate.
Source: World Bank, Global Development Finance 2007: The globalization of corporate finance in developing countries, Washington, D.C., 2007,
pp. 37, 55.
U N I T I N G F O R C H I L D S U R V I VA L
99
In sub-Saharan Africa, where the situation of young children is most dire,
UNICEF, WHO and the World Bank
collaborated in 2006 on an analysis
of what it would cost to reduce child
mortality there (see Panel, Chapter 4,
page 78). By scaling up the existing
interventions highlighted in this
report, deaths of children under five
could be reduced by 35 per cent by
2009 at an additional cost of about
US$2.50 per capita (or about US$800
per life saved). To fully achieve MDG
4, a reduction in under-five mortality
by two thirds by 2015, would require
additional strengthening of Africa’s
health systems, as well as the introduction of new interventions, such
as vaccines against rotavirus and
pneumococcal infections. The analy-
sis found that it is entirely feasible to
save the lives of more than 5 million
children and nearly 200,000 mothers
a year. What would saving these lives
cost? An additional US$10 per capita
per year (or less than US$2,000 per
life saved).10
At the 2005 G8 Summit in
Gleneagles, Scotland, the major
Strengthening data collection and monitoring for public health
decisions
“It is not because countries are poor that they cannot
afford good health information; it is because they are
poor that they cannot afford to be without it.” – Health
Metrics Network, World Health Organization
Sound information is central to public health decisions,
informing policy, programmes, budgets and evaluations
and forming the basis of accountability for governments
to their commitments and to their citizens. In many developing countries, however, underinvestment in health
information systems has left gaps in data collection, dissemination and analysis. With health challenges on the
rise and the deadline for the health-related Millennium
Development Goals drawing ever closer, fulfilling the
demand for sound information is imperative.
Before the mid-1990s, critical gaps in data hindered
accurate and effective analysis for making such public
health decisions. For example, only 38 developing countries had data on whether undernutrition rates among
children were rising or falling – a basic indicator of child
health and well-being. To help fill these important data
gaps and to facilitate monitoring of the 1990 World
Summit for Children goals, UNICEF initiated the Multiple
Indicator Cluster Surveys (MICS) in 1995. MICS are
designed to provide quantitative data on a wide range of
topics, including child health and nutrition, child protection, education, HIV and AIDS, and maternal health.
Since 1995, nearly 200 MICS have been conducted in
approximately 100 countries and territories. The current
round of surveys, implemented in more than 50 countries
during 2005–2006, provides data for 21 of 53 MDG subindicators. Together with the Demographic and Health
Surveys, a complementary initiative sponsored by the
United States Agency for International Development
100
(USAID) with which data are harmonized, this is the
largest single source of information for MDG monitoring.
Monitoring progress towards the Millennium Development Goals has also stimulated the formation of a series
of interagency groups that address specific technical and
methodological issues, including standardizing indicators
and monitoring tools, building statistical capacity at the
country level, developing joint estimates and harmonizing
monitoring work between partners. These groups focus
on such areas as under-five and maternal mortality, water
and sanitation, immunization, malaria, and HIV and AIDS.
There is also an urgent need to improve overall data
systems at the national level so they may more reliably
report robust and timely data that can be used for informing public health decisions. This is a long-term effort, and
the World Health Organization and the Health Metrics
Network (HMN), among others, are working closely with
countries and other initiatives to improve health information systems. Specifically, the objective is to develop a
comprehensive system that would incorporate all the
multiple subsystems and data sources that, taken together,
contribute to generating health information: surveys, vital
registration, censuses, disease surveillance and response,
service statistics, health management information, financial
data and resource tracking. The development of such a
comprehensive system would require enhanced coordination and cooperation between countries and international
partners, working together based on one harmonized plan
for a unified system. This comprehensive data system
would thereby reduce duplication, fragmentation and
overlap in data collection and reporting.
See References, page 108.
T H E S TAT E O F T H E W O R L D ’ S C H I L D R E N 2 0 0 8
The resources are available to
meet the health-related MDGs. The
world is richer than it has ever been.
Financial flows to developing countries are at record levels, in terms of
private debt inflows, foreign direct
investment, portfolio equity and
remittances. And yet, while official
development assistance has doubled
since 2000, its increase has lagged
marginally behind other financial
flows (see Figure 5.1, page 99).
Donors have yet to make good on
their promise to increase assistance
to Africa and will need to step up
efforts markedly in the coming years.
Make maternal, newborn and
child survival a global imperative
Many have heard the cry for child
and maternal survival. Since the early
years of the child survival revolution,
global partnerships for health, often
financed through private sources,
have proliferated and reinvigorated
the field: including, for example,
the Flour Fortification Initiative,
the Global Alliance for Improved
Nutrition, the GAVI Alliance, the
Partnership for Maternal, Newborn
& Child Health, Roll Back Malaria
© UNICEF/ HQ00-0001/Giacomo Pirozzi
industrialized nations pledged to
double their aid to Africa by 2010.
Yet, as of mid-2007, there is little
advance in this direction.11 African
countries, too, have been remiss in
demonstrating their commitment
to their own children. In the Abuja
Declaration, adopted at the
Organization of African Unity’s
special summit on AIDS in 2001,
African leaders included a commitment to devote 15 per cent of their
national budgets to health. Yet six
years later, only a few countries
have managed to do so.12
Partnerships and renewed commitment on the part of all stakeholders are required to realize
the health needs of all mothers, newborns and children. A health worker discusses immunization with a mother, United Republic of Tanzania.
and the Special Programme for
Research and Training in Tropical
Diseases, among many others.
As a consequence of these and other
alliances, public attention to global
health issues is at an all-time high.
Research and development sponsored
by these partnerships are beginning
to yield results, with 25 drugs, 8
microbicides and 50 vaccines in the
pipeline to address diseases predominantly affecting the poor. A number
of these partnerships have proved
remarkably effective in offering
communities free or reduced-cost
medicines whose quality is assured,
along with vaccines. Others are
improving national policymaking
and supporting institutional reforms.
Still others are contributing to the
establishment of norms and standards in treatment protocols.13
Yet, in their single-mindedness to
produce results, it has been argued
that global partnerships are often
donor- and commodity-driven rather
than country- and people-centred.
Moreover, a frequent focus on single
diseases has sometimes meant an
over-reliance on vertical interventions and insufficient emphasis on
integrating services and strengthening national health systems.14 The
message that has been widely heard
– and heeded – is that developing
countries must take the lead and
‘own’ the solutions to their health
problems. This will require greater
harmonization and alignment with
developing countries’ own priorities,
systems and procedures. Indeed, this
was the position adopted in the Paris
Declaration on Aid Effectiveness in
March 2005, which is providing a
framework through which donor
U N I T I N G F O R C H I L D S U R V I VA L
101
The other side of the mat: Uniting for maternal, newborn and child
survival and health
by Melinda French Gates, Co-chair,
Bill & Melinda Gates Foundation
When Bill and I meet people in the developing countries
we visit, it’s easy to see what we have in common with
them, in spite of our different circumstances. Like us, they
have hopes for the future. They have parents who love
them and children who need them. They have intellectual
curiosity, an entrepreneurial spirit and a determination to
make life better for themselves and their children.
I am especially moved by the mothers I meet. They invite
me into their homes, and we sit on the floor, often on
opposite sides of a small mat, talking. I have young children myself, and I try to put myself in their position. What
would I do if I were on the other side of the mat? What
would I want for my children?
If I were a pregnant mother in Bangladesh, I would want
a skilled attendant who knew how to help me deliver my
baby safely. If I were a young mother in India, I would want
to know the facts: that breastfeeding instead of using formula is one of the best ways to save my newborn from
cholera. If I were a mother in Malawi and my daughter got
sick with diarrhoea, I would hope that she could get the
electrolytes she needed before it was too late.
Those would be my hopes, my dreams, my wishes. But for
many, they are not the reality of their daily lives. The reality
is this: In 2006, 9.7 million children died before they turned
five – most from easily preventable or treatable causes.
and developing country partnerships
can fully exploit their potential.
So, where does the world find itself
today, just past the midway point
to the target date for achieving the
Millennium Development Goals? On
balance, half of the world’s regions
are on track to meet MDG 4 and
reduce child mortality rates by two
thirds between 1990 and 2015. This
is without doubt an unprecedented
scenario, reflecting advances in
maternal and child health in the
102
In some countries I’ve visited, mothers don’t give their
children names for weeks or even months because they
don’t want to start caring about them. The chance that
their children will die in those first weeks is just too high.
When I hear such stories, I am jolted back to my side of
the mat. How can such widespread tragedy be so common in the developing world?
On my side of the mat, when my kids are sick, they
get antibiotics. On the other side of the mat, when
their children get sick, they may be receiving a death
sentence. Those of us in wealthy countries must try to
put ourselves on the other side of the mat.
Fortunately, the story is starting to change. Governments
around the world are doing more for children’s health.
Efforts to treat and prevent the world’s most devastating
diseases are improving the lives of millions of children.
To keep this momentum going, we must remember that
these mothers love their children just as much as we love
ours. We must see that these children have boundless
potential. And we must help them realize their potential
by bringing more governments, more businesses and
more individuals to this work – to unite for maternal,
newborn and child survival and health. When we do, all
mothers will have a chance to see their children grow up
happy and strong, and all children will have a chance to
make their dreams come true.
past century and the commitment
of both donors and national governments to unite to ensure that children survive and thrive.
Many developing countries and
several regions have managed to
make great strides in reducing child
mortality, and a few have managed
to reduce mortality rates to levels
approaching those in some industrialized countries, despite having
far lower levels of per capita income.
Three regions – Latin America and
T H E S TAT E O F T H E W O R L D ’ S C H I L D R E N 2 0 0 8
the Caribbean, East Asia and the
Pacific, and Central and Eastern
Europe and the Commonwealth of
Independent States (CEE/CIS) – have
reduced child mortality substantially
since 1960, despite bouts of economic
and political instability. This success
provides a source of hope that
child mortality rates will continue
to decline at an even faster rate
globally if ways can be found to
enhance access to quality care for
mothers, newborns and children in
the developing world.
The challenge is to build on the
progress achieved across the
developing world in preventive
interventions delivered by outreach
services, particularly in recent years.
Expanded interventions delivered
by outreach – notably expanded
immunization programmes,
enhanced distribution of insecticidetreated mosquito nets, greater distribution of oral rehydration therapy
and a broadening of vitamin A
supplementation – have enhanced
the input side of the child and maternal health balance sheet. Analysis of
these results, together with the
enhanced frequency of data collection, promises to show a marked
impact on child and maternal survival outcomes in the coming years.
Notwithstanding the many initiatives, programmes and policies
that have proliferated since the first
year of the new millennium, the
opportunity to reduce deaths among
children under five has never been
clearer. What needs to be done for
progress in child survival is clear.
When it needs to be done, and who
needs to be involved is also clear.
The need to be united – in both
word and deed – to ensure the right
of mothers, newborns and children
to quality primary health care is
clearest of all.
The challenge is, therefore, to shake
off any cynicism and lethargy and
put aside the broken promises of the
past. At the midpoint between the
inauguration of the MDGs in 2000
and their target date for fulfilment
in 2015, much has already been
achieved. The basis for action – data,
research, evaluation – is already well
established. It is time to rally behind
the goals of maternal, newborn
and child survival and health with
renewed energy and sharper vision,
and to position these goals at the
heart of the international agenda to
fulfil the tenets of social justice and
honour the sanctity of life.
The means are at hand. It is now a
question of will and of action – for
there is no enterprise more noble, or
reward more precious than saving
the life of a child.
U N I T I N G F O R C H I L D S U R V I VA L
103
References
CHAPTER 1
1
UNICEF estimates, based on the work of the
Inter-agency Child Mortality Estimation Group.
2
World Health Organization and United Nations
Children’s Fund, ‘Integration of Vitamin A
Supplementation with Immunization: Policy and
programme implications, Meeting report (WHO/
EPI/GEN/98.07)’ WHO, Geneva, 1998, pp. 4-12.
3
Darmstadt, Gary L., et al., ‘Evidence-Based,
Cost-Effective Interventions: How many newborn
babies can we save?’, The Lancet, vol. 365,
no. 9463, 12 March 2005, pp. 977-988.
4
5
6
7
8
9
10
Phillips, James F., Ayaga A. Bawah and Fred N.
Binka, ‘Accelerating Reproductive and Child Health
Programme Impact with Community-Based
Services: The Navrongo experiment in Ghana’,
Bulletin of the World Health Organization, vol. 84,
no. 12, Dec. 2006, pp. 949-953.
United Nations Children’s Fund, Progress for
Children: A World Fit for Children statistical review,
Number 6, UNICEF, New York, Dec. 2007, p. 19.
WHO Regional Office for Africa, The Health of the
People: The African regional health report, WHO
Press, Geneva, 2006, p. 19.
Newell, Marie-Louise, et al., ‘Mortality of Infected
and Uninfected Infants Born to HIV-Infected
Mothers in Africa: A pooled analysis’, The Lancet,
vol. 364, no. 9441, 2 Oct. 2004, pp. 1236-1243.
De Cock, Kevin M., et al., ‘Prevention of Motherto-Child HIV Transmission in Resource-Poor
Countries: Translating research into policy and
practice’, Journal of the American Medical
Association, vol. 283, no. 9, 1 March 2000,
pp. 1175-1182.
World Health Organization, Joint United Nations
Programme on HIV/AIDS and United Nations
Children’s Fund, Towards Universal Access:
Scaling up priority HIV/AIDS interventions in the
health sector – Progress report, April 2007, WHO,
Geneva, 2007, pp. 6, 30.
Ngongo, Ngashi, ‘PMTCT Report Card 2005:
Monitoring progress on the implementation of programs to prevent mother to child transmission of
HIV’, UNICEF, New York, p. 5.
11
United Nations Children’s Fund, Progress for
Children: A World Fit for Children statistical review,
Number 6, UNICEF, New York, Dec. 2007, p. 36.
12
United Nations Children’s Fund and Roll Back
Malaria Partnership, ‘Malaria & Children: Progress
in intervention coverage’, UNICEF and RBM, New
York, 2007, pp. 1, 7.
16
United Nations Children’s Fund, Progress for
Children: A report card on water and sanitation,
Number 5, UNICEF, New York, Sept. 2006, p. 3.
17
Black, Robert E., Saul S. Morris and Jennifer
Bryce, ‘Where and Why Are 10 Million Children
Dying Every Year?’, The Lancet, vol. 361, no. 9376,
28 June 2003, p. 2230.
18
World Health Organization, ‘Improving Child Health
in the Community’, WHO, Geneva, Dec. 2002, p. 7.
19
Countdown to 2015: Child Survival, Tracking
Progress in Child Survival: 2005 report, UNICEF
Health Section, New York, 2005, p. 9.
20
UNICEF estimate, based on data provided by the
Inter-agency Child Mortality Estimation Group.
21
Darmstadt, Gary L., et al., ‘Evidence-Based, CostEffective Interventions: How many lives of newborn babies can we save?’, The Lancet,
<www.thelancet.com>, 3 March 2005, p. 11.
22
World Health Organization, Making a Difference in
Countries: Strategic approach to improving maternal and newborn survival and health, WHO,
Geneva, 2006, p. 9.
23
‘Table 1. Basic Indicators’, pp. 114-117 of this
report.
24
Pinheiro, Paulo Sérgio, World Report on Violence
Against Children, UN Secretary-General’s Study on
Violence against Children, New York, 2006, p. 51.
25
United Nations Children’s Fund, ‘Early Marriage:
Child spouses’, Innocenti Digest, no. 7, UNICEF
Innocenti Research Centre, Florence, March 2001,
p. 11.
26
Ibid.
27
Ibid.
28
United Nations Children’s Fund, The ‘Rights’ Start
to Life: A statistical analysis of birth registration,
UNICEF, New York, 2005, pp. 1, 13.
29
United Nations Educational, Scientific and Cultural
Organization, EFA Global Monitoring Report 2007:
Strong foundations – Early childhood care and education, UNESCO, Paris, 2006, p. 2.
30
Porterfield, Shirley L., and Timothy D. McBride, ‘The
Effect of Poverty and Caregiver Education on
Perceived Need and Access to Health Services
among Children with Special Health Care Needs’,
American Journal of Public Health, vol. 97, no. 2,
Feb. 2007, p. 323.
31
Ibid.
32
White, Howard, Maintaining Momentum to 2015?
An impact evaluation of interventions to improve
maternal and child health and nutrition in
Bangladesh, World Bank, Washington, D.C., Sept.
2005, p. 25.
13
Global Fund to Fight AIDS, Tuberculosis and
Malaria, HIV/AIDS, Tuberculosis and Malaria: The
status and impact of the three diseases, GFATM,
Geneva, 2005, p. 39.
33
14
United Nations Children’s Fund, Progress for
Children: A World Fit for Children statistical review,
Number 6, UNICEF, New York, Dec. 2007, pp. 39-41.
United Nations Children’s Fund, The State of the
World’s Children 2006: Excluded and invisible,
UNICEF, New York, Dec. 2005, p. 18.
34
15
World Health Organization, ‘Health Status:
Mortality’, World Health Statistics 2006, WHO,
Geneva, 2007, pp. 29-31.
Victora, Cesar G., et al., ‘Applying an Equity Lens to
Child Health and Mortality: More of the same is not
enough’, The Lancet, vol. 362, no. 9379, 19 July
2003, p. 234.
35
104
Ibid.
T H E S TAT E O F T H E W O R L D ’ S C H I L D R E N 2 0 0 8
CHAPTER 1 PANELS
The under-five mortality rate: The indispensable
gauge of child health
United Nation’s Children’s Fund, The State of the
World’s Children 2007: Women and children – The
double dividend of gender equality, UNICEF, New
York, Dec. 2006, pp. 137, 141.
Underlying and structural causes of maternal and
child mortality
United Nations Children’s Fund, ‘UNICEF Joint Health
and Nutrition Strategy for 2006-2015 (E/ICEF/
2006/8)’, UN Economic and Social Council, New York,
15 Nov. 2005, pp. 3-4.
Newborn survival
Darmstadt, Gary L., ‘Evidence-Based, Cost-Effective
Interventions: How many newborn babies can we
save?’, The Lancet, vol. 365, no. 9463, 12 March 2005,
pp. 977-988; The Lancet Series Team, ‘Executive
Summary of The Lancet Neonatal Survival Series’, The
Lancet, 3 March 2005, p. 1; Lawn, Joy E., Simon
Cousens and Jelka Zupan, ‘4 Million Neonatal Deaths:
When? Where? Why?’, The Lancet, 5 March 2005, vol.
365, no. 9462, pp. 891-900; Save the Children, State of
the World’s Mothers 2006: Saving the lives of mothers
and newborns, Save the Children, Westport, CT, May
2006, pp. 3, 8; ‘Table 8. Women’, pp. 142-145 of this
report; World Health Organization, World Health Report
2005: Make every mother and child count, WHO,
Geneva, 2005, pp. 9-10.
The main proximate causes of child deaths
Mulholland, Kim, ‘Childhood Pneumonia Mortality: A
permanent global emergency’, The Lancet, vol. 370,
no. 9583, 21 July 2007, pp. 285-289; United Nations
Children’s Fund, Progress for Children: A report card
on water and sanitation, Number 5, UNICEF, New
York, Sept. 2006, p. 2, and Progress for Children: A
World Fit for Children statistical review, Number 6,
Dec. 2007, pp. 19, 24; UNICEF and World Health
Organization, Pneumonia: The forgotten killer of children, UNICEF and WHO, New York and Geneva,
2006, p. 5.
Pneumonia: The forgotten killer of children
Mulholland, Kim, ‘Childhood Pneumonia Mortality: A
permanent global emergency’, The Lancet, vol. 370,
no. 9583, 21 July 2007, pp. 285-289; Sazawal, Sunil,
and Robert E. Black, ‘Effect of Pneumonia Case
Management on Mortality in Neonates, Infants, and
Preschool Children: A meta-analysis of communitybased trials’, The Lancet Infectious Diseases, vol. 3,
no. 9, Sept. 2003, pp. 547-556; United Nations
Children’s Fund and World Health Organization,
Pneumonia: The forgotten killer of children, UNICEF
and WHO, New York, and Geneva, 2006, p. 5, 7-9,
14, 26, 27; World Health Organization, ‘Evidence
Base for the Community Management of Pneumonia
(WHO/FCH/CAH/02.23)’, WHO Dept. of Child and
Adolescent Health and Development, Stockholm,
June 2002, pp. 2, 5-6.
The continuum of maternal, newborn and child
health care across time and place
Lawn, Joy, and Kate Kerber, editors, Opportunities for
Africa’s Newborns: Practical data, policy and programmatic support for newborn care in Africa, Partnership
for Maternal, Newborn & Child Health, Geneva, 2006,
p. 3, 5, 9, 24; Le Galès-Camus, Catherine, ‘UNICEF
Joint Health and Nutrition Strategy for 2006-2015’,
statement at Executive Board meeting first regular
session, New York, 17 Jan. 2006, pp. 3-4; United
Nations Children’s Fund, UNICEF Joint Health and
Nutrition Strategy for 2006-2015 (E/ICEF/ 2006/8), UN
Economic and Social Council, New York, 15 Nov.
2005, p. 3.
Child health in complex emergencies
CIEDRS Working Group, ‘Building the Evidence Base
on the Provision of Health Care to Children in
Complex Emergencies, Draft 4.0’, Center for
International Emergency, Disaster and Refugee
Studies, Johns Hopkins Bloomberg School of Public
Health, Baltimore, MD, Sept. 2003, pp. 3-4, 11, 1415; Collins, Steve, ‘Community-Based Therapeutic
Care: A new paradigm for selective feeding in nutritional crises – Network paper no. 48’, Humanitarian
Practice Network, Overseas Development Institute,
London, Nov. 2004, p. 24; Collins, Steve, et. al., ‘Key
Issues in the Success of Community-Based
Management of Severe Malnutrition’, Food and
Nutrition Bulletin, vol. 27, no. 3 (suppl.), Sept. 2006,
p. 58; UN Millennium Project Task Force on Child
Health and Maternal Health, Who’s Got the Power?
Transforming health systems for women and
children, Earthscan, London, 2005, p. 77; World
Health Organization, Guide to Health Work-Force
Development in Post-Conflict Environments, WHO,
Geneva, 2005, p. 2.
Empowering women to advance maternal,
newborn and child health
Perry, Henry, et al., ‘Barriers to Immunization among
Women and Children in Slums of Zone 3 of Dhaka
City, Bangladesh: A qualitative assessment’,
International Centre for Diarrhoeal Disease Research,
Dhaka, April 2007, pp. 16-19; Seidel, Renata,
Behavior Change Perspectives and Communication
Guidelines on Six Child Survival Interventions,
Academy for Educational Development and Johns
Hopkins Bloomberg School of Public Health,
Washington, D.C., Dec. 2005, p. 20; UN Millennium
Project Task Force on Child Health and Maternal
Health, Who’s Got the Power? Transforming health
systems for women and children, Earthscan, London,
2005, p. 36; WHO Centre for Health Development, ‘A
Toolkit for Women’s Empowerment and Leadership
in Health and Welfare’, Kobe, Japan, 2005, pp. 26-28;
World Health Organization, ‘Women’s Health in
Afghanistan’, WHO Dept. of Gender and Women’s
Health, Family and Community Health Cluster,
Geneva, March 2002, pp. 1-2.
Birth registration: An important step towards
accessing essential services
‘Table 9. Child Protection’, pp. 146-147 of this
report; UNICEF Innocenti Research Centre, ‘Birth
Registration and Armed Conflict’, Innocenti Insight,
UNICEF IRC, Florence, 2005, p. vii; United Nations
Children’s Fund, ‘Birth Registration’, Child Protection
Information Sheets, UNICEF, New York, May 2007,
pp. 13-14; United Nations Children’s Fund, Progress
for Children: A World Fit for Children statistical
review, Number 6, UNICEF, New York, Dec. 2007, p.
42, and The ‘Rights’ Start to Life: A statistical analysis
of birth registration, 2005, pp. 2, 15-16.
3
4
5
2
Lee, Ronald, ‘The Demographic Transition: Three
centuries of fundamental change’, Journal of
Economic Perspectives, vol. 17, no. 4, 2003,
pp. 167-190.
Van Lerberghe, Wim, and Vincent De Brouwere,
‘Of Blind Alleys and Things that Have Worked:
History’s lessons on reducing maternal mortality’,
Safe Motherhood Strategies: A review of the
evidence, edited by Wim Van Lerberghe and
Vincent De Brouwere, Studies in Health Services
Organisation & Policy, vol. 17, 2001, pp. 7-34.
Mills, Anne, Fawzia Rasheed and Stephen Tollman,
‘Strengthening Health Systems’, Chapter 3,
Disease Control Priorities in Developing Countries,
2nd ed., edited by Dean T. Jamison, et al., Oxford
University Press and the World Bank, Washington,
D.C., 2006, p. 88.
Green, Andrew, An Introduction to Health Planning
in Developing Countries, 2nd ed., Oxford
University Press, New York, 1999; and Morley,
David, ‘Under-Five Clinics’, Medical Care in
Developing Countries: A primer on the medicine of
poverty and a symposium from Makerere, edited
by Maurice H. King, Oxford University Press, New
York, 1966.
6
Basch, Paul F., Textbook of International Health,
2nd ed., Oxford University Press, New York,
July 1999.
7
Thieren, Michel, ‘Background Paper on the
Concept of Universal Access’, Technical Meeting
for the Development of a Framework for
Universal Access to HIV/AIDS Prevention,
Treatment and Care in the Health Sector’, WHO,
Geneva, Oct. 2005; and Vaccine Safety Datalink
Group, ‘The Use of a Computerized Database to
Monitor Vaccine Safety in Viet Nam’, Bulletin of
the World Health Organization, vol. 83, no. 8,
Aug. 2005, p. 605.
8
9
Knippenberg, Rudolf, et al., ‘Implementation of the
Bamako Initiative: Strategies in Benin and Guinea’,
The International Journal of Health Planning and
Management, vol. 12, no. S1, 12 June 1997,
pp. S29-S47.
Walsh, J. A., and K. S. Warren, ‘Selective Primary
Health Care: An interim strategy for disease control
in developing countries’, New England Journal of
Medicine, vol. 301, no. 18, 1 Nov. 1979, pp. 967-974.
10
Ibid.
11
Claeson, Mariam, and Ronald J. Waldman,
‘The Evolution of Child Health Programmes in
Developing Countries: From targeting diseases to
targeting people’, Bulletin of the World Health
Organization, vol. 78, no. 10, 2000, p. 1235.
12
Ibid.
13
Black, Maggie, ‘Children First: The story of
UNICEF, past and present’, Oxford University
Press, New York, 1996, p. 19.
14
Claeson, Mariam, and Ronald J. Waldman,
‘The Evolution of Child Health Programmes in
Developing Countries: From targeting diseases to
targeting people’, Bulletin of the World Health
Organization, vol. 78, no. 10, 2000, p. 1235.
CHAPTER 2
1
Claeson, Mariam, and Ronald J. Waldman,
‘The Evolution of Child Health Programmes in
Developing Countries: From targeting diseases to
targeting people’, Bulletin of the World Health
Organization, vol. 78, no. 10, 2000, p. 1235;
Oliveira-Cruz, Valeria, Christoph Kurowski and
Anne Mills, ‘Delivery of Priority Health Services:
Searching for synergies within the vertical versus
horizontal debate’, Journal of International
Development, vol. 15, 2003, p. 68; and United
Nations Children’s Fund, 1946-2006: Sixty Years for
Children, UNICEF, New York, 2006, pp. 7-9.
15
16
UNICEF Statistics, ‘Integrated Management of
Childhood Illness: An initiative for effective case
management’, UNICEF End Decade Databases:
IMCI, <www.childinfo.org/eddb/imci/>, accessed
15 Nov. 2007.
World Health Organization and UNICEF,
‘Management of Childhood Illness in Developing
Countries: Rationale for an integrated strategy’,
IMCI Information (WHO/CHS/CAH/98.1A Rev. 1),
WHO, Geneva, 1999, p. 3.
17
Bryce, Jennifer, et al., ‘The Multi-Country Evaluation
of the Integrated Management of Childhood Illness
Strategy: Lessons for the evaluation of public health
interventions’, American Journal of Public Health,
vol. 94, no. 3, March 2004, pp. 406-415; Lucas,
Jane E., et al., Implementing the Household and
Community Component of IMCI in the Eastern and
Southern Africa Region (ESAR): A state-of-the art
review of the human-rights-based approach to
programming in the context of accelerated child
survival, UNICEF New York and UNICEF ESARO,
2005, p. xii.
18
Victora, Cesar G., et al., ‘Integrated Management of
the Sick Child’, Chapter 63, Disease Control Priorities
in Developing Countries, 2nd ed., edited by Dean T.
Jamison, et al., Oxford University Press and the
World Bank, Washington, D.C., 2006, p. 1189.
19
Armstrong Schellenberg, Joanna R. M., et al.,
‘Effectiveness and Cost of Facility-Based
Integrated Management of Childhood Illness
(IMCI) in Tanzania’, The Lancet, vol. 364, no. 9445,
30 Oct. 2004, p. 1583.
20
Lucas, Jane E., et al., Implementing the Household
and Community Component of IMCI in the Eastern
and Southern Africa Region (ESAR): A state-of-the
art review of the human-rights-based approach to
programming in the context of accelerated child
survival, UNICEF New York and UNICEF ESARO,
2005, p. 86.
21
Victora, Cesar G., et al., ‘Integrated Management
of the Sick Child’, Chapter 63, Disease Control
Priorities in Developing Countries, 2nd ed., edited
by Dean T. Jamison, et al., Oxford University Press
and the World Bank, Washington, D.C., 2006,
pp. 1188-1189.
22
Martines, Jose, et al., ’Neonatal Survival: A call for
action’, The Lancet, vol. 365, no. 9465, 26 March
2005, p. 1191.
23
Chen, Shaohua, and Martin Ravallion, ‘Absolute
Poverty Measures for the Developing World, 19812004’, Development Research Group, World Bank,
Washington, D.C., March 2007, p. 12.
24
Bryce, Jennifer, et al., ‘Countdown to 2015:
Tracking intervention coverage for child survival’,
The Lancet, vol. 368, no. 9541, 23 Sept. 2006,
pp. 1070-1071.
25
Jones, Gareth, et al., ‘How Many Child Deaths Can
We Prevent this Year?’, The Lancet, vol. 362, no.
9377, 5 July 2003, p. 65; and Lawn, Joy E., et al.,
‘Newborn Survival’, Chapter 27, Disease Control
Priorities in Developing Countries, 2nd ed., edited by
Dean T. Jamison, et al., Oxford University Press and
the World Bank, Washington, D.C., 2006, p. 547.
26
Campbell, Oona M. R., and Wendy J. Graham,
‘Strategies for Reducing Maternal Mortality:
Getting on with what works’, The Lancet, vol. 368,
no. 9543, 28 Sept. 2006, p. 1297.
27
Hill, Zelee, Betty Kirkwood and Karen Edmond,
Family and Community Practices that Promote
Child Survival, Growth and Development: A review
of the evidence, World Health Organization,
Geneva, 2004, p. 1.
28
Wagstaff, Adam, et al., ‘Millennium Development
Goals for Health: What will it take to accelerate
progress?’, Chapter 9, Disease Control Priorities in
Developing Countries, 2nd ed., edited by Dean T.
Jamison, et al., Oxford University Press and the
World Bank, Washington, D.C., 2006, pp. 181-194.
REFERENCES
105
CHAPTER 2 PANELS
The Measles Initiative
United Nations Children’s Fund, A World Fit for
Children, UNICEF, New York, 2006, p. 29; Wolfson,
Lara J., et al., ‘Has the 2005 Measles Mortality
Reduction Goal Been Achieved?: A natural history
modelling study’, The Lancet, vol. 369, no. 9557, 20
Jan. 2007, pp. 191-192; World Health Organization,
‘World Health Assembly Resolution WHA 52.20:
Reducing global measles mortality’, WHO, Geneva,
28 May 2003; World Health Organization and United
Nations Children’s Fund, Measles: Mortality
Reduction and Regional Elimination – Strategic plan
2001-2005, WHO, Geneva, 2001, pp. 6-7.
National immunization days and child health days
Levine, Ruth, ‘Case 4: Reducing Child Mortality with
Vitamin A in Nepal’, Chapter 4, Case Studies in
Global Health: Millions saved, Jones and Bartlett
Publishers, Sudbury, MA, 2007; Global Polio
Eradication Initiative, ‘National Immunization Days’,
<www.polioeradication.org/content/fixed/national.
shtml>, accessed 24 Aug. 2007; United Nations
Children’s Fund, Annual Report 2006, UNICEF, New
York, June 2007, p. 12, and 1946–2006: Sixty Years
for Children, Nov. 2006, pp. 18-19.
Health sector financing: Sector-wide approaches
and the Heavily Indebted Poor Countries Initiative
Gottret, Pablo, and George Schieber, Health
Financing Revisited: A practitioner’s guide, World
Bank, Washington, D.C., 2006; Schieber, George, et
al., ‘Financing Health Systems in the 21st Century’,
Chapter 12, Disease Control Priorities in Developing
Countries, 2nd ed., edited by Dean T. Jamison, et al.,
Oxford University Press and the World Bank,
Washington, D.C., 2006, pp. 225-242; World Bank,
‘Health and Nutrition Services’, Chapter 8, World
Development Report 2004: Making services work for
poor people, World Bank and Oxford University
Press, Washington, D.C., 2003, pp. 133-156.
Integrated management of Neonatal and
Childhood Illnesses in India
Ramji, Siddarth, ‘Integrated Management of Neonatal
and Childhood Illness (IMNCI): Implementation challenges in India’, Indian Pediatrics, vol. 43, no. 12, 17
Dec., 2006, pp. 1029-1031; Sines, Erin, Anne Tinker
and Julia Ruben, ‘The Maternal-Newborn-Child Health
Continuum of Care: A collective effort to save lives’,
Policy Perspectives on Newborn Health, Save the
Children and Population Reference Bureau,
Washington, D.C., March 2006, p. 2.
The Bamako Initiative
Ebrahim, G. J., ‘The Bamako Initiative’, Journal of
Tropical Pediatrics, vol. 39, no. 2, 1993, pp. 66-67;
Knippenberg, Rudolf, et al., ‘Implementation of the
Bamako Initiative: Strategies in Benin and Guinea’,
International Journal of Health Planning and
Management, vol. 12, no. S1, 1997, pp. S29-S47;
Küchler, Von Felix, ‘Manageable Bamako Initiative
Schemes’, Bulletin von Medicus Mundi Schweiz, no.
84, April 2002; Paganini, Agostino, ‘The Bamako
Initiative Was Not about Money’, Health Policy and
Development, vol. 2, no. 1, 2004, pp. 11-13; World
Bank, World Development Report 2004: Making
services work for poor people, World Bank and
Oxford University Press, Washington, D.C., 2003,
pp. 72-73, 76-77.
Diagonal approaches: The Mexican way
Frenk, Julio, ‘Bridging the Divide: Comprehensive
reform to improve health in Mexico’, Commission on
Social Determinants of Health, Nairobi, 29 June 2006,
pp. 4-5; Frenk, Julio, ‘Bridging the Divide: Global lessons from evidence-based health policy in Mexico’,
The Lancet, vol. 368, no. 9539, 9 Sept. 2006, pp.
954, 957; Sepúlveda, Jaime, et al., ‘Improvement of
Child Survival in Mexico: The diagonal approach’,
The Lancet, vol. 368, no. 9551, 2 Dec. 2006,
pp. 2017-2027.
106
Accelerated Child Survival and Development in
West Africa
Bryce, Jennifer, et al., ‘A Retrospective Evaluation of
the Accelerated Child Survival and Development
Project in West Africa: Inception Report’, submitted
to UNICEF and Canadian International Development
Agency, 15 Jan. 2007; Bryce, Jennifer, et al.,
‘Independent Evaluation of Accelerated Child Survival
and Development (ACSD)’, presentation to the 2nd
Global Immunization Meeting, New York, 13-15 Feb.
2007; United Nations Children’s Fund, Accelerated
Child Survival and Development in Ghana, UNICEF
Ghana, March 2005, pp. 1-2.
HIV and AIDS in Africa and its impact on women
and children
Joint United Nations Programme on HIV/AIDS, United
Nations Children’s Fund and United States Agency
for International Development, Children on the Brink
2004: A joint report of new orphan estimates and a
framework for action, USAID, Washington, D.C.,
2004, p. 10; Joint United Nations Programme on
HIV/AIDS, United Nations Population Fund and United
Nations Development Fund for Women, Women and
HIV/AIDS: Confronting the crisis, UNAIDS, UNFPA
and UNIFEM, Geneva and New York, 2004, p. 2; Joint
United Nations Programme on HIV/AIDS and World
Health Organization, ‘AIDS Epidemic Update’,
UNAIDS and WHO, Geneva, Dec. 2006, p. 1.
Partnership for Maternal, Newborn & Child Health
Partnership for Maternal, Newborn & Child Health,
<www.who.int/pmnch/en>, accessed 24 Aug. 2007.
WHO Europe, Health Evidence Network,
Copenhagen, Feb. 2006, p. 5.
10
Rifkin, Susan B., ‘Paradigms Lost: Toward a new
understanding of community participation in health
programmes’, Acta Tropica, vol. 61, 1996, pp. 88-90.
11
Bhattacharyya, Karabi, et al., Community Health
Worker Incentives and Disincentives: How they
affect motivation, retention and sustainability,
Basic Support for Institutionalizing Child Survival
Project (BASICS II), United States Agency for
International Development, Arlington, VA, Oct.
2001, pp. 1-3, 20-21.
12
Haines, Andy, et al., ‘Achieving Child Survival
Goals: Potential contribution of community health
workers’, The Lancet, vol. 369, no. 9579, 23 June
2007, p. 2121.
13
Bhattacharyya, Karabi, et al., Community Health
Worker Incentives and Disincentives: How they
affect motivation, retention and sustainability,
Basic Support for Institutionalizing Child Survival
Project (BASICS II), United States Agency for
International Development, Arlington, VA,
Oct. 2001, p. 6.
14
Lehmann, Uta, and David Sanders, ‘Community
Health Workers: What do we know about them?’
World Health Organization, Geneva, Jan. 2007,
pp. 21-22.
15
Hensher, Martin, Max Price and Sarah Adomakoh,
‘Referral Hospitals’, Chapter 66, Disease Control
Priorities in Developing Countries, 2nd ed., edited
by Dean T. Jamison et al., Oxford University Press
and the World Bank, New York, 2006, p. 1233.
16
Seidel, Renata, Behavior Change Perspectives
and Communication Guidelines on Six Child
Survival Interventions, Academy for Educational
Development and Johns Hopkins Bloomberg
School of Public Health, Washington, D.C.,
Dec. 2005.
17
Adventist Development and Relief Agency
International, Final Evaluation Child Survival XVII
Baray-Santuk Operational District Kampong Thom
Province, ADRA, Silver Spring, MD, 2006, p. 26.
18
Laughlin, Megan, The Care Group Difference: A
guide to mobilizing community-based volunteer
health educators, World Relief, Baltimore, MD,
2004, p. 5.
19
Kroeger, A., et al., ‘Operational Aspects of Bednet
Impregnation for Community-Based Malaria
Control in Nicaragua, Ecuador, Peru and Colombia’,
Tropical Medicine & International Health, vol. 2,
no. 6, June 1997, pp. 590, 593.
20
Perlman, Daniel, Bertha Pooley and Alejandra
Villafuerte, ‘Como Sera, Pues?: The NGO contribution to neonatal health in Bolivia’, The CORE
Group, Washington, D.C., April 2006, pp. 1-26.
21
Perry, Henry B., David S. Shanklin and Dirk G.
Schroeder, ‘Impact of a Community-based
Comprehensive Primary Healthcare Programme on
Infant and Child Mortality in Bolivia,’ Journal of
Health, Population and Nutrition, vol. 21, no. 4,
Dec. 2003, p. 386.
22
England, Sarah, et al., ‘Practice and Policies on
User Fees for Immunization in Developing
Countries’, Department of Vaccines and
Biologicals, World Health Organization, Geneva,
2001, pp. 10-11.
23
UN Millennium Project, Investing in Development:
A practical plan to achieve the Millennium
Development Goals, United Nations Development
Programme, New York, p. 34; and United Nations
Children’s Fund, World Bank and World Health
Organization, ‘A Strategic Framework for Reaching
the Millennium Development Goal on Child
CHAPTER 3
1
Declaration of Alma-Ata, articles 6-8, International
Conference on Primary Health Care, Alma-Ata, USSR,
6-12 Sept. 1978, <www.who.int/hpr/NPH/docs/
declaration_almaata.pdf>, accessed 15 Oct. 2007.
2 Adapted from Claeson, Mariam, et al., ‘Health,
Nutrition and Population’, Chapter 18, A
Sourcebook for Poverty Reduction Strategies, vol.
2, edited by Jeni Klugman, World Bank,
Washington, D.C., 2002, pp. 211-212.
3
4
5
6
7
8
9
Zakus, J. David L., and Catherine L. Lysack,
‘Revisiting Community Participation’, Health Policy
and Planning, vol. 13, no. 1, Oxford University
Press, New York, 1998, pp. 1-12.
Gryboski, Kristina, et al., ‘Working with the
Community for Improved Health’, Health Bulletin
No. 3, Population Reference Bureau, Washington,
D.C., June 2006, pp. 1-3.
Lehmann, Uta, and David Sanders, ‘Community
Health Workers: What do we know about them?’,
World Health Organization, Geneva, Jan. 2007, p. 26.
Mason, John B., et al., ‘Community Health and
Nutrition Programs’, Chapter 56, Disease Control
Priorities in Developing Countries, 2nd ed., edited
by Dean T. Jamison et al., Oxford University Press
and the World Bank, New York, 2006, pp. 1053.
BRAC, <www.brac.net/history.htm>, accessed 22
Oct. 2007; Comprehensive Rural Health Project:
Jamkhed, <www.jamkhed.org>, accessed 22 Oct.
2007; and World Health Organization, ‘Pakistan’s
experience in Lady Health Workers (LHWs)
Programme (EM/RC51/12)’, 51st session,
WHO Regional Committee for the Eastern
Mediterranean, Cairo, 3-6 Oct. 2004.
Wallerstein, Nina B., and Bonnie Duran, ‘Using
Community-Based Participatory Research to
Address Health Disparities’, Health Promotion
Practice, vol. 7, no. 3, July 2006, pp. 312-323.
World Health Organization, ‘What Is the
Effectiveness of Empowerment to Improve Health?’
T H E S TAT E O F T H E W O R L D ’ S C H I L D R E N 2 0 0 8
Survival in Africa’, Draft prepared on request of the
African Union, 27 Sept. 2006, pp. 25, 26.
24
Claeson, Mariam, and Ronald J. Waldman,
‘The Evolution of Child Health Programmes in
Developing Countries: From targeting diseases
to targeting people’, Bulletin of the World Health
Organization, vol. 78, no. 10, 2000, p. 1238.
25
Wagstaff, Adam, and Mariam Claeson, The
Millennium Development Goals for Health: Rising
to the challenges, World Bank, Washington, D.C.,
2004, p. 132.
26
27
28
Tollman, Stephen, Jane Doherty and Jo-Ann
Mulligan, ‘General Primary Care’, Chapter 64,
Disease Control Priorities in Developing Countries,
2nd ed., edited by Dean T. Jamison et al., Oxford
University Press and the World Bank, New York,
2006, p. 1195.
United Nations Children’s Fund, ‘UNICEF Joint
Health and Nutrition Strategy for 2006-2015
(E/ICEF/20006/8)’, UN Economic and Social
Council, New York, 15 Nov. 2005, pp. 1-13.
Mason, John B., et al., ‘Community Health and
Nutrition Programs’, Chapter 56, Disease Control
Priorities in Developing Countries, 2nd ed., edited
by Dean T. Jamison et al., Oxford University Press
and the World Bank, New York, 2006, p. 1056.
Community partnerships in water systems and
school sanitation
Rashid, S. M. A., ‘Bangladesh: School sanitation and
hygiene education – The story of its impact on one village and its school’, NGO Forum, <www.schools.watsan.net/redir/content/download/219/1923/file/Banglades
h.doc>, accessed 2 Nov. 2007; ‘Safe Water System: A
low-cost technology for safe drinking water’, March
2006, World Water Forum 4 update, Centers for
Disease Control and Prevention, U.S. Department of
Health and Human Services, Washington, D.C., pp. 1-2;
‘Safe Water System (SWS): Where has the SWS been
used? – Afghanistan’, Centers for Disease Control and
Prevention, U.S. Department of Health and Human
Services, <www.cdc.gov/safewater/where_pages/
where_afghanistan.htm>, accessed 23 Sept. 2007;
Snel, Marielle, The Worth of School Sanitation and
Hygiene Education (SSHE), IRC International Water
and Sanitation Centre, Delft, the Netherlands, 2004,
pp. 57-64.
Common aspects and challenges of community
partnerships in health and nutrition
Mason, John B., et al., ‘Community Health and
Nutrition Programs’, Chapter 56, Disease Control
Priorities in Developing Countries, 2nd ed., edited by
Dean T. Jamison, et al., Oxford University Press and
the World Bank, New York, 2006, pp. 1054-1055.
India: Reducing undernutrition through
community partnerships
UNICEF India, Annual Report 2006, pp. 46-47.
Preventing mother-to-child transmission of
HIV: Impact of mothers2mothers programmes
in eastern and southern Africa
Baek, Carolyn, et al., Key Findings from an Evaluation
of mothers2mothers in KwaZulu-Natal, South Africa,
Horizons/Population Council, Washington, D.C., 2007,
p. 4; mothers2mothers, <www.m2m.org/programmes/where-we-work.html>, accessed 11 Sept.
2007; Population Council, ‘Helping Mothers Saving
Babies: mothers2mothers initiative,’ <www.popcouncil.org/pdfs/m2m/m2mDescription.pdf>, accessed 15
Oct. 2007; United Nations Children’s Fund, Children
and AIDS: A stocktaking report, Joint United Nations
Programme on HIV/AIDS, UNICEF and World Health
Organization, New York, 2007, p. 6; United Nations
Children’s Fund, Children: The missing face of AIDS,
UNICEF, New York, 2005, p. 7.
Focus on Mozambique: Reducing under-five
mortality through a community-based programme
Bradbury, Kathryn, and Anbrasi Edward, ‘CommunityBased Solutions for Effective Malaria Control:
Lessons from Mozambique’, World Relief, The CORE
Group and United States Agency for International
Development, Washington, D.C., 2005, p. 7; Edward,
Anbrasi, et al., ‘Examining the Evidence of Under-Five
Mortality Reduction in a Community-Based
Programme in Gaza, Mozambique’, Transactions of
the Royal Society of Tropical Medicine and Hygiene,
vol. 101, no. 8, Aug. 2007, pp. 816-819; ‘Table 1.
Basic Indicators’, ‘Table 2. Nutrition’, ‘Table 3. Health’
and ‘Table 6. Demographic Indicators’, pp. 114-117,
120-121, 122-125 and 134-137 of this report.
14
United Nations Children’s Fund, World Bank and
World Health Organization, ‘A Strategic Framework
for Reaching the Millennium Development Goals
on Child Survival in Africa’, Draft prepared on
request of the African Union, 27 Sept. 2006, p. 5.
15
Ibid., pp. 5, 28-30.
16
Haines, Andy, et al., ‘Achieving Child Survival
Goals: Potential contribution of community health
workers’, The Lancet, vol. 369, no. 9579, 23 June
2007, p. 2121.
17
Bhattacharyya, Karabi, et al., ‘Community Health
Worker Incentives and Disincentives: How they
affect motivation, retention and sustainability’,
Basic Support for Institutionalizing Child Survival
Project (BASIC II) for USAID, Arlington, VA, Oct.
2001, p. 19.
18
World Health Organization, World Health Report
2005: Make every mother and child count, WHO,
Geneva, 2005, pp. 21-22.
19
Ibid., pp. 25-30.
20
Bodart, Claude, ‘The Influence of Health Sector
Reform and External Assistance in Burkina Faso’,
Health Policy and Planning, vol. 16, no. 1, March
2001, p. 74.
21
World Health Organization, World Health Report
2005: Make every mother and child count, WHO,
Geneva, 2005, p. 33.
22
Mills, Anne, Fawzia Rasheed and Stephen Tollman,
‘Strengthening Health Systems’, Chapter 3,
Disease Control Priorities in Developing Countries,
2nd ed., edited by Dean T. Jamison, et al., Oxford
University Press and the World Bank, Washington,
D.C., p. 91.
23
United Nations Population Fund, United Nations
Children’s Fund, World Bank and World Health
Organization, ‘Building Strategies to Scale-up
Access: A discussion paper for the Oslo debate
on the Global Business Plan’, UNFPA, UNICEF,
World Bank and WHO, New York, 24 March 2007,
pp. 4-8.
24
World Bank, The Millennium Development Goals
for Health: Rising to the challenges, World Bank,
Geneva, 2004, p. ix.
25
United Nations Children’s Fund, World Bank and
World Health Organization, ‘A Strategic Framework
for Reaching the Millennium Development Goals
on Child Survival in Africa’, Draft prepared on
request of the African Union, 27 Sept. 2006, p. 40.
26
‘International Health Partnership: A global ‘
compact’ for achieving the health Millennium
Development Goals’, agreement signed by all
partners at the launch of the International Health
Partnership, London, 5 Sept. 2007.
27
Soeters, Robert, Christian Habineza and Peter Bob
Peerenboom, ‘Performance-Based Financing and
Changing the District Health System: Experience
from Rwanda’, Bulletin of the World Health
Organization, vol. 84, no. 11, Nov. 2006,
pp. 885, 887.
28
Powell-Jackson, Timothy, et al., ‘Countdown to
2015: Tracking donor assistance to maternal,
newborn, and child health‘, The Lancet, vol. 368,
no. 9541, Sept. 2006, p. 25.
29
United Nations Children’s Fund, World Bank and
World Health Organization, ‘A Strategic Framework
for Reaching the Millennium Development Goals
on Child Survival in Africa’, Draft prepared on
request of the African Union, 27 Sept. 2006.
30
Center for Global Development, ‘Case 15:
Preventing iodine deficiency disease in China’,
CHAPTER 4
1
2
CHAPTER 3 PANELS
Basic practices for community-based health-care
interventions
World Health Organization, Improving Child Health in
the Community, WHO, Geneva, 2002, pp. 7-8.
child health in Bolivia’, Health Policy and Planning,
vol. 13, no. 2, 1998, p. 140.
Dormstadt, Gary, et al, ‘Evidence-Based, CostEffective Interventions: How many newborn
babies can we save?’, The Lancet, vol. 265,
no. 9463, 12 March 2005, p. 977.
United Nations Population Fund, United Nations
Children’s Fund, World Bank and World Health
Organization, ‘Building Strategies to Scale-up
Access: A discussion paper for the Oslo debate on
the Global Business Plan’, UNFPA, UNICEF, World
Bank and WHO, New York, 24 March 2007,
pp. 4-5, 10-11.
3
Ibid., p. 5.
4
United Nations Children’s Fund, World Bank and
World Health Organization, ‘A Strategic Framework
for Reaching the Millennium Development Goals
on Child Survival in Africa’, Draft prepared on
request of the African Union, 27 Sept. 2006 , p. 18.
5
Ibid., p. 24.
6
Seidel, Renata, Behavior Change Perspectives
and Communication Guidelines on Six Child
Survival Interventions, Academy for Educational
Development and Johns Hopkins Bloomberg
School of Public Health, Washington, D.C.,
Dec. 2005, p. 10.
7
8
9
10
11
United Nations Children’s Fund, World Bank and
World Health Organization, ‘A Strategic Framework
for Reaching the Millennium Development Goals
on Child Survival in Africa’, Draft prepared on
request of the African Union, 27 Sept. 2006, p. 24.
High-Level Forum Secretariat, ‘High-Level Forum
on the Health MDGs’, World Health Organization
and World Bank, Geneva and Washington, D.C.,
<www.hlfhealthmdgs.org>, accessed 16 Nov. 2007.
United Nations Children’s Fund, Accelerated Child
Survival and Development in Ghana, UNICEF
Ghana, Accra-North, March 2005, pp. 1-2.
United Nations Children’s Fund, World Bank and
World Health Organization, ‘A Strategic Framework
for Reaching the Millennium Development Goals
on Child Survival in Africa’, Draft prepared on
request of the African Union, 27 Sept. 2006,
pp. 24-28.
Mills, Anne, Fawzia Rasheed and Stephen
Tollman, ‘Strengthening Health Systems’, Chapter
3, Disease Control Priorities in Developing
Countries, 2nd ed., edited by Dean T. Jamison, et
al., Oxford University Press and the World Bank,
Washington, D.C., 2006, p. 101.
12
Ibid., p. 90.
13
Perry, Henry, et al., ‘The Census-Based ImpactOriented Approach: Its effectiveness in promoting
REFERENCES
107
Millions Saved: Proven successes in global health,
<www.cgdev.org> accessed 16 Nov. 2007; and
United Nations Children’s Fund, Progress for
Children: A World Fit for Children statistical review,
UNICEF, New York, Dec. 2007, p. 8.
31
32
Levine, Ruth, ‘Case 6: Saving mothers’ lives in
Sri Lanka’, Case Studies in Global Health: Millions
saved, Jones and Bartlett Publisher, Sudbury,
MA, 2007, pp. 41-48; and MOST: The USAID
Micronutrient Program, Cost Analysis of the
National Vitamin A Supplementation Programs in
Ghana, Nepal, and Zambia: Synthesis of three
studies, USAID, Washington, D.C., 2004, p. 4.
Overseas Development Institute, ‘Global Health:
Making partnerships work’, Briefing paper no. 15,
ODI, London, Jan. 2007, p. 1.
CHAPTER 4 PANELS
Scaling up: Adequate nutrition for mothers,
newborns and children
Basic Support for Institutionalizing Child Survival
Project, Basics II Country Report: Benin, BASICS II,
United States Agency for International Development,
Arlington, VA, 2004, pp. 7-15; Collins, Steve, et al.,
‘Key Issues in the Success of Community-Based
Management of Severe Malnutrition’, Food and
Nutrition Bulletin, vol. 27, no. 3, 2006, pp. S49-S51;
Collins, Steve, et al., ‘Management of severe acute
malnutrition in children’, The Lancet, vol. 368, no.
9551, 2 Dec. 2006, p. 1992; World Bank,
Repositioning Nutrition as Central to Development:
A strategy for large-scale action, World Bank,
Washington, D.C., 2006, pp. 10-11; and World Health
Organization, World Food Programme, United Nations
System Standing Committee on Nutrition and United
Nations Children’s Fund, ‘Community-Based
Management of Severe Acute Malnutrition’, WHO,
WFP, SCN and UNICEF, Geneva, Rome, New York,
May 2007, p. 2.
‘Marginal Budgeting for Bottlenecks’
United Nations Children’s Fund, World Bank and
World Health Organization, ‘A Strategic Framework
for Reaching the Millennium Development Goals on
Child Survival in Africa’, draft prepared on request of
the African Union, 27 Sept. 2006, p. 25.
Scaling up: Safe water, adequate sanitation and
improved hygiene practices
Black, Robert E., Saul S. Morris and Jennifer Bryce, ’
Where and why are 10 million children dying every
year?’, The Lancet, vol. 361, 28 June 2003, p. 2227;
Curtis, Val, and Sandy Cairncross, ‘Effect of Washing
Hands with Soap on Diarrhoea Risk in the
Community: A systematic review’, The Lancet
Infectious Diseases, vol. 3, no. 5, May 2003, p. 275;
Favin, Michael, Promoting Hygiene Behavior Change
within C-IMCI: The Peru and Nicaragua experience,
Activity Report 143, Environmental Health Project,
Washington, D.C., Oct. 2004, p. xi; IRC International
Water and Sanitation Centre and United Nations
Children’s Fund, Water, Sanitation and Hygiene
Education for Schools, final report from Oxford
Roundtable, 24-26 Jan. 2005, UNICEF and IRC, New
York, p. 32; Lane, Jon, ‘Ghana, Lesotho and South
Africa: Regional expansion of water supply in rural
areas’, case study from ‘Reducing Poverty, Sustaining
Growth: What works, what doesn’t, and why – A
global exchange for scaling up success’, paper
offered at Scaling Up Poverty Reduction conference
in Shanghai, 25-27 May 2004, World Bank Group,
2004, pp. 1-10; Pan American Health Organization,
‘Rotavirus Update’, Immunization Newsletter, vol. 27,
no. 3, June 2005, pp. 1-2; Slaymaker, Tom, and Karin
Christiansen, ‘Community- Based Approaches and
108
Service Delivery: Issues and options in difficult environments and partnerships’, Overseas Development
Institute, London, Feb. 2005, p. 26; United Nations
Children’s Fund, Progress for Children: A report card
on water and sanitation, Number 5, UNICEF, New
York, Sept. 2006, pp. 3, 22, 30; Water and Sanitation
Program, ‘Community-Led Total Sanitation in Rural
Areas: An approach that works’, WSP, New Delhi,
Feb. 2007, pp. 4, 6-9.
The urgent need to address the health worker
crisis in Africa
The Health Workforce in Africa, Challenges and
Prospects, ‘ A Report of the Africa Working Group
of the Joint Learning Initiative on Human Resources
for Health and Development’, Sept. 2006, p. 3; UN
Millennium Project Task Force on Child Health and
Maternal Health, Who’s Got the Power? Transforming
health systems for women and children, Earthscan,
London, 2005, p. 77; World Health Organization,
‘Guide to Health Work-Force Development in PostConflict Environments’, WHO, Geneva, 2005, pp.
6-13, 52- 77, 119-122; World Health Organization,
‘Working together for health’, The World Health
Report 2006, WHO, Geneva, 2006.
The investment case for child survival and other
health-related Millennium Development Goals in
sub-Saharan Africa
United Nations Children’s Fund, World Bank and
World Health Organization, ‘A Strategic Framework
for Reaching the Millennium Development Goals on
Child Survival in Africa’, Draft prepared on request of
the African Union, 27 Sept. 2006, pp. 5-6, 38-43.
Focus on Botswana: Going to scale with HIV
prevention and treatment using community
partnerships
Botswana Progress Report, ‘A World Fit for Children
2007’, Government of Botswana, July 2007, pp. 1112, 15, 18; Kak, Lily, et al., ‘Prevention of Mother-toChild transmission of HIV/AIDS Programmes’,
Chapter 7, Opportunities for Africa’s Newborns,
Partnership for Maternal, Newborn & Child Health,
Cape Town, 2006, pp. 113-127; and United Nations
Children’s Fund, Progress for Children: A statistical
review, Number 6, UNICEF, New York, Dec. 2007,
pp. 30, 34, 60.
Strengthening accountability and governance
in health-service delivery
World Bank, World Development Report 2004:
Making services work for poor people, World Bank,
Washington, D.C., 2003, pp. 133-156.
Performance-based financing in Rwanda
Sekabaraga, Claude, Louis Rusa and Agnes Soucat,
’What it Takes to Scale up for Better Health: The
experience of Rwanda 2004-2007’, Background paper
to ‘Innovations in service delivery’, 2007.
Focus on Brazil: Creating a national community
based health system network
United Nations Children’s Fund, The State of Brazil’s
Children 2006: The right to survival and development,
UNICEF, Brasilia, 2005, pp. 10-11.
A new way of working together for multilateral
institutions
United Nations Children’s Fund, ‘Informal Meeting of
Global Health Leaders: Final summary’, UNICEF, New
York, July 2007.
CHAPTER 5
1
UN Millennium Project, Investing in Development:
A practical plan to achieve the Millennium Development Goals, Earthscan, London, 2005, pp. 1-2.
T H E S TAT E O F T H E W O R L D ’ S C H I L D R E N 2 0 0 8
2
United Nations Children’s Fund, The State of the
World’s Children 2005: Childhood under threat,
UNICEF, New York, 2004, pp. 57-58; UNICEF,
Children Affected by Armed Conflict: UNICEF
actions, May 2002, p. 15; and UNICEF, Outlook
Special Edition: Crisis in Middle East, Aug. 2006, p. 2.
3
Derived from UN Department of Economic and
Social Affairs, Population Division databases,
World Population Prospects: The 2006 revision and
World Urbanization Prospects: The 2005 revision,
<http://esa.un.org/unpp>, accessed 30 Sept. 2007.
4
World Health Organization, World Health Report
2006: Working together for health, WHO, Geneva,
2006, p. 119; Sines, Erin, Anne Tinker and Julia
Ruben, ‘The Maternal-Newborn-Child Health
Continuum of Care: A collective effort to save
lives’, Policy Perspectives on Newborn Health,
Save the Children and Population Reference
Bureau, Washington, D.C., March 2006, pp. 2-3.
5
Juma, Calestous, and Lee Yee-Cheong,
‘Reinventing Global Health: The role of science,
technology, and innovation’, The Lancet, vol. 365,
no. 9464, 19 March 2005, pp. 1105-1106; Acharya,
Tara, Abdallah S. Daar and Peter A. Singer,
‘Biotechnology and the UN’s Millennium
Development Goals’, Nature Biotechnology,
vol. 21, no. 12, Dec. 2003, pp. 1434-1436.
6
Department of Essential Health Technologies,
World Health Organization, ‘Strategy for 20042007: eHealth for health-care delivery’, WHO,
Geneva, 2004, p. 2.
7
UN Millennium Project, Investing in Development: A
practical plan to achieve the Millennium Development Goals’, Earthscan, London, 2005, p. 240;
United Nations, The Millennium Development Goals
Report 2007, UN, New York, June 2007, p. 28.
8
United Nations, Report on the World Social
Situation 2005: The inequality predicament, UN,
New York, 2005, p. 114.
9
United Nations, The Millennium Development Goals
Report 2007, UN, New York, June 2007, p. 28.
10
Gautum, Kul C., ‘Pre-Conference Report on
Diseases of Poverty, Child Survival and MDGs’,
presented at the BioVision 2007 Pre-Conference
on Diseases of Poverty, Lyon, France, 12 March
2007.
11
United Nations, The Millennium Development Goals
Report 2007, UN, New York, June 2007, p. 29.
12
Martines, Jose, et al., ‘Neonatal Survival: A call for
action’, The Lancet, vol. 365, no. 9465, 26 March
2005, pp. 1193-1194.
13
Buse, Kent, and Andrew M. Harmer, ‘Seven Habits
of Highly Effective Global Public-Private Health
Partnerships: Practice and potential’, Social Science
& Medicine, vol. 64, no. 2, Jan. 2007, p. 261.
CHAPTER 5 PANEL
Strengthening data collection and monitoring
for public health decisions
United Nations Children’s Fund, Progress for Children:
A World Fit for Children statistical review, Number 6,
UNICEF, New York, Dec. 2007, p. 68; Health Metrics
Network, Framework and Standards for Country
Health Information Systems, 2nd ed., WHO, Geneva,
2007, pp. 5, 17, 60.
STATISTICAL TABLES
Economic and social statistics on the countries and territories of the world, with
particular reference to children’s well-being.
General note on the data ....................................................................................page
Explanation of symbols ......................................................................................page
Under-five mortality rankings..............................................................................page
Summary indicators..............................................................................................page
Measuring human development:
An introduction to Table 10 ..............................................................................page
TABLES
1
2
3
4
5
6
7
8
9
10
110
112
113
148
149
Basic indicators............................................................................page 114
Nutrition ......................................................................................page 118
Health ..........................................................................................page 122
HIV/AIDS ......................................................................................page 126
Education ....................................................................................page 130
Demographic indicators ............................................................page 134
Economic indicators ..................................................................page 138
Women ........................................................................................page 142
Child protection ..........................................................................page 146
The rate of progress ..................................................................page 150
T H E S TAT E O F T H E W O R L D ’ S C H I L D R E N 2 0 0 8
109
STATISTICAL TABLES
Economic and social statistics on the countries and territories of the world,
with particular reference to children’s well-being.
General note on the data
The data presented in the following statistical tables are
based on internationally comparable and statistically sound
data, and are accompanied by definitions, sources and explanations of symbols. Data from the responsible United
Nations organization have been used wherever possible,
such as for the economic and demographic indicators. In
the absence of such internationally standardized estimates,
the tables draw on other sources, particularly data received
from the appropriate UNICEF field office. More detailed
information on methodology and sources of the data
presented is available at <www.childinfo.org>.
Several of the indicators, such as the data for life expectancy, total fertility rates, and crude birth and death
rates, are part of the regular work on estimates and
projections undertaken by the United Nations Population
Division. These and other internationally produced estimates are revised periodically, which explains why some
data will differ from earlier UNICEF publications. This
report includes the latest estimates and projections from
the World Population Prospects 2006.
Data quality is likely to be adversely affected for countries
that have recently suffered from human-caused or natural
disasters. This is particularly true where basic country
infrastructure has been fragmented or major population
movements have occurred.
Mortality estimates
Each year, UNICEF includes in The State of the World’s
Children mortality estimates, such as the infant mortality
rate, under-five mortality rate and under-five deaths, for at
least two reference years, if possible. These figures represent the best estimates available at the time the report is
produced and are based on the work of the Inter-agency
Group for Child Mortality Estimation, which includes
UNICEF, the World Health Organization (WHO), the World
Bank and the United Nations Population Division. This
group updates these estimates every year, undertaking a
detailed review of all newly available data points. At times,
this review will result in adjustments to previously reported estimates. Therefore, estimates published in consecutive editions of The State of the World’s Children may
not be comparable and should not be used for analysing
mortality trends over time. It is important to note that
comparable under-five mortality estimates for the periods
1970, 1990 and the latest year are available in Table 10. In
110
addition, the full time series for all countries is published at
<www.childinfo.org>. This time series is based on the most
recent estimates produced by the Inter-agency Group for
Child Mortality Estimation.
In addition, updated maternal mortality estimates for the
year 2005 are presented in this report. These estimates,
based on the work of a WHO/UNICEF/United Nations
Population Fund UNFPA/World Bank inter-agency group,
were jointly published by the group in Maternal Mortality
in 2005, WHO, Geneva, 2007. These model-based estimates
use a dual approach to adjust these data to take into account the frequent under-reporting and misclassification
of maternal deaths.
Multiple Indicator Cluster Surveys (MICS)
For more than a decade, UNICEF has supported countries in
collecting statistically sound and internationally comparable
data through the Multiple Indicator Cluster Surveys (MICS).
Since 1995, nearly 200 surveys have been conducted in
approximately 100 countries, and the latest round of MICS
surveys was conducted in over 50 countries in 2005–2006,
allowing for a new and more comprehensive assessment of
the situation of children and women globally. The UNICEFsupported MICS, along with the Demographic and Health
Surveys, are among the largest sources of data for monitoring progress towards the Millennium Development Goals
and may be used for reporting on 21 of the 53 MDG indicators. These data are also used for monitoring other internationally agreed commitments, such as the World Fit for
Children Plan of Action and the global goals on AIDS and
malaria. They have been incorporated into the statistical
tables appearing in this report and have also been used to
inform the report’s analyses. More information on these
data is available at <www.childinfo.org>.
Revisions
Several statistical tables have been revised this year.
Table 2. Nutrition: The vitamin A supplementation
coverage rate is now reported for children aged 6–59
months receiving two high-dose vitamin A supplements,
in addition to the previously reported indicator of children
aged 6–59 months receiving at least one dose in the last
six months. Full coverage is defined as receiving two highdose vitamin A supplements in the previous calendar year.
T H E S TAT E O F T H E W O R L D ’ S C H I L D R E N 2 0 0 8
Table 3. Health: There are two major changes in this year’s
child health indicators.
Immunization – A new methodology has been developed
by WHO and UNICEF to estimate protection at birth (PAB)
against tetanus, and the figures presented in this year's
report are therefore not comparable to estimates published
in previous editions.
This new methodology tracks cohorts of women from infancy through life, using both WHO/UNICEF estimates of
coverage by three doses of diphtheria, pertussis and tetanus
vaccine (DPT3) and reported and survey-based estimates of
the proportion of pregnant women who are routinely vaccinated with tetanus toxoid (TT). Adjustments are then made
to account for the proportion of women who were reached
with TT in supplementary immunization activities. Reported
data may also be adjusted to take into account coverage
patterns in other years and/or results available through
surveys. The duration of protection is then calculated based
on published WHO estimates of the duration of protection
by all doses ever received. The end result is the probability
that a child is protected against tetanus as a result of maternal immunization if she or he is born in a given year.
Antibiotic use for suspected pneumonia – Data now include estimates of the percentage of children under five
with suspected pneumonia who receive antibiotics, in
addition to the previously reported estimates of children
with suspected pneumonia taken to appropriate health
providers. The recently implemented Multiple Indicator
Cluster Surveys have provided a wealth of new data on
antibiotic use for childhood pneumonia.
Table 4. HIV and AIDS: The data on estimated adult HIV
prevalence and the estimated number of people living with
HIV are based on Joint United Nations Programme on
HIV/AIDS (UNAIDS) and WHO estimates generated in 2005.
These estimates were scheduled to be updated at the end
of 2007, but the new figures were not available at the time
of publishing this report.
Global surveillance of HIV and AIDS and sexually transmitted infections is a joint effort of WHO and UNAIDS.
In countries with a generalized epidemic, national estimates of HIV prevalence are based on data generated by
surveillance systems that focus on pregnant women attending selected sentinel antenatal clinics. More recently,
an increasing number of countries are implementing HIV
testing as part of their nationally representative population-based surveys. When available, the results of this
population survey are included in the estimation of a
country’s adult HIV prevalence. In countries with a lowlevel or concentrated epidemic, national estimates of
HIV prevalence are primarily based on surveillance data
collected from populations at high risk (commercial sex
workers, men who have sex with men, injecting drug
users) and on estimates of the size of populations at high
and low risk. More information on these estimates is
available at <www.epidem.org>.
Table 5. Education: The adult literacy rate has been
replaced by the youth literacy rate (ages 15–24 years),
disaggregated by gender.
Table 8. Women: There are three major changes to this
year’s table:
Female primary and secondary school enrolment/attendance – Previously, this table reported the gross enrolment
ratio (females as a percentage of males) for both primary
and secondary education. This year, those figures have
been replaced by the net attendance ratio (females as a
percentage of males) for both levels of education, and
these data are presented alongside the net enrolment ratio
(females as a percentage of males) for both levels. The net
enrolment/attendance ratios better reflect levels of school
participation in both primary and secondary education.
Institutional deliveries – In addition to presenting the
proportion of births attended by skilled health personnel,
this year’s table presents the proportion of births taking
place in health facilities.
Maternal mortality – As mentioned above, updated maternal mortality estimates for the year 2005 presented in this
report are based on the work of the WHO/UNICEF/UNFPA/
World Bank inter-agency group and are published in
Maternal Mortality in 2005, WHO, Geneva, 2007. These
maternal mortality estimates are adjusted to take into
account the under-reporting and misclassification of
maternal deaths. More information is available at
<www.childinfo.org>.
Table 9. Child Protection: Three new indicators have been
included in this table, which is largely based on the wealth
S TAT I S T I C A L TA B L E S
111
STATISTICAL TABLES
Economic and social statistics on the countries and territories of the world,
with particular reference to children’s well-being.
General note on the data (continued)
of new child protection data that has recently become available through MICS, DHS and other national-level surveys.
Attitudes towards domestic violence – This indicator is
defined as the percentage of girls and women aged 15–49
who responded that a husband or partner is justified in
hitting or beating his wife under certain circumstances.
Respondents were asked whether a husband or partner
is justified in hitting or beating his wife under certain
circumstances, i.e., if his wife neglects the children, goes
out without telling him, argues with him, refuses sexual
relations, or burns the food.
Child disability – This indicator is defined as the percentage
of children aged 2–9 years who screened positive on at least
one of the questions on disability (i.e., cognitive, motor,
seizure, vision or hearing). Questions on disability are addressed to the parent or caretaker of the child, who is asked
to provide a personal assessment of the child’s physical and
mental development and functioning. Data on the prevalence of disability refer to the percentage of children who
screened positive on these questions and therefore must be
considered an indication of the percentage of children who
are likely to have a disability and who may require further
medical and developmental assessment.
Child discipline – This indicator is defined as the percentage of children aged 2–14 years who experience any
psychological or physical punishment. Psychological
punishment includes shouting, yelling and screaming
at the child, and addressing him or her with offensive
names. Physical or corporal punishment comprises actions intended to cause physical pain or discomfort but
not injury. Minor physical punishment includes shaking
the child and slapping or hitting him or her on the hand,
arm, leg or bottom. Severe physical punishment includes
hitting the child on the face, head or ears, or hitting the
child hard or repeatedly.
Explanation of symbols
Because the aim of these statistical tables is to provide a broad picture of the situation of children and women worldwide,
detailed data qualifications and footnotes are seen as more appropriate for inclusion elsewhere. The following symbols are
common across all tables; symbols specific to a particular table are included in the table footnotes.
-
Data are not available.
x
Data refer to years or periods other than those specified in the column heading, differ from the standard definition or
refer to only part of a country. Such data are not included in the calculation of regional and global averages.
y
Data refer to years or periods other than those specified in the column heading, differ from the standard definition or
refer to only part of a country. Such data are included in the calculation of regional and global averages.
*
Data refer to the most recent year available during the period specified in the column heading.
§
Includes territories within each country category or regional group. Countries and territories in each country category or
regional group are listed on page 148.
112
T H E S TAT E O F T H E W O R L D ’ S C H I L D R E N 2 0 0 8
Under-five mortality rankings
The following list ranks countries and territories in descending order of their estimated 2006 under-five mortality
rate (U5MR), a critical indicator of the well-being of children. Countries and territories are listed alphabetically in
the tables on the following pages.
Under-5
mortality
rate (2006)
Value Rank
Sierra Leone
Angola
Afghanistan
Niger
Liberia
Mali
Chad
Equatorial Guinea
Congo, Democratic Republic of the
Burkina Faso
Guinea-Bissau
Nigeria
Zambia
Burundi
Central African Republic
Swaziland
Guinea
Rwanda
Cameroon
Benin
Somalia
Mozambique
Uganda
Lesotho
Djibouti
Côte d’Ivoire
Congo
Mauritania
Botswana
Ethiopia
Kenya
Ghana
Malawi
Tanzania, United Republic of
Senegal
Madagascar
Gambia
Togo
Zimbabwe
Myanmar
Yemen
Pakistan
Sao Tome and Principe
Gabon
Sudan
Azerbaijan
Cambodia
Haiti
India
Lao People’s Democratic Republic
Eritrea
Papua New Guinea
Solomon Islands
Bhutan
Bangladesh
South Africa
Comoros
Tajikistan
Kiribati
Guyana
Bolivia
Namibia
Nepal
Marshall Islands
Korea, Democratic People’s Republic of
Timor-Leste
270
260
257
253
235
217
209
206
205
204
200
191
182
181
175
164
161
160
149
148
145
138
134
132
130
127
126
125
124
123
121
120
120
118
116
115
113
108
105
104
100
97
96
91
89
88
82
80
76
75
74
73
73
70
69
69
68
68
64
62
61
61
59
56
55
55
1
2
3
4
5
6
7
8
9
10
11
12
13
14
15
16
17
18
19
20
21
22
23
24
25
26
27
28
29
30
31
32
32
34
35
36
37
38
39
40
41
42
43
44
45
46
47
48
49
50
51
52
52
54
55
55
57
57
59
60
61
61
63
64
65
65
Under-5
mortality
rate (2006)
Value Rank
Turkmenistan
Iraq
Mongolia
Uzbekistan
Guatemala
Kyrgyzstan
Micronesia (Federated States of)
Suriname
Algeria
Trinidad and Tobago
Tuvalu
Morocco
Nicaragua
Vanuatu
Egypt
Mexico
Cape Verde
Indonesia
Iran (Islamic Republic of)
Georgia
Philippines
Jamaica
Lebanon
Maldives
Nauru
Dominican Republic
Kazakhstan
Samoa
Honduras
Turkey
El Salvador
Jordan
Peru
Saudi Arabia
Armenia
China
Ecuador
Tonga
Ukraine
Panama
Tunisia
Occupied Palestinian Territory
Paraguay
Colombia
Qatar
Venezuela (Bolivarian Republic of)
Brazil
Grenada
Saint Vincent and the Grenadines
Cook Islands
Moldova, Republic of
Saint Kitts and Nevis
Fiji
Libyan Arab Jamahiriya
Romania
Albania
The former Yugoslav Republic of Macedonia
Viet Nam
Argentina
Belize
Russian Federation
Bosnia and Herzegovina
Dominica
Bahamas
Bulgaria
Mauritius
51
46
43
43
41
41
41
39
38
38
38
37
36
36
35
35
34
34
34
32
32
31
30
30
30
29
29
28
27
26
25
25
25
25
24
24
24
24
24
23
23
22
22
21
21
21
20
20
20
19
19
19
18
18
18
17
17
17
16
16
16
15
15
14
14
14
67
68
69
69
71
71
71
74
75
75
75
78
79
79
81
81
83
83
83
86
86
88
89
89
89
92
92
94
95
96
97
97
97
97
101
101
101
101
101
106
106
108
108
110
110
110
113
113
113
116
116
116
119
119
119
122
122
122
125
125
125
128
128
130
130
130
Under-5
mortality
rate (2006)
Value Rank
Saint Lucia
Syrian Arab Republic
Belarus
Seychelles
Sri Lanka
Barbados
Costa Rica
Malaysia
Oman
Uruguay
Antigua and Barbuda
Kuwait
Palau
Bahrain
Montenegro
Brunei Darussalam
Chile
Latvia
Lithuania
Serbia
Slovakia
Thailand
United Arab Emirates
United States
Cuba
Estonia
Hungary
Poland
Australia
Canada
Croatia
Malta
New Zealand
United Kingdom
Austria
Denmark
Ireland
Israel
Korea, Republic of
Netherlands
Portugal
Switzerland
Belgium
Cyprus
Czech Republic
Finland
France
Germany
Greece
Italy
Japan
Luxembourg
Monaco
Norway
Slovenia
Spain
Andorra
Iceland
Liechtenstein
San Marino
Singapore
Sweden
Holy See
Niue
14
14
13
13
13
12
12
12
12
12
11
11
11
10
10
9
9
9
8
8
8
8
8
8
7
7
7
7
6
6
6
6
6
6
5
5
5
5
5
5
5
5
4
4
4
4
4
4
4
4
4
4
4
4
4
4
3
3
3
3
3
3
-
S TAT I S T I C A L TA B L E S
130
130
135
135
135
138
138
138
138
138
143
143
143
146
146
148
148
148
151
151
151
151
151
151
157
157
157
157
161
161
161
161
161
161
167
167
167
167
167
167
167
167
175
175
175
175
175
175
175
175
175
175
175
175
175
175
189
189
189
189
189
189
-
113
TABLE 1. BASIC INDICATORS
Countries and
territories
Afghanistan
Albania
Algeria
Andorra
Angola
Antigua and Barbuda
Argentina
Armenia
Australia
Austria
Azerbaijan
Bahamas
Bahrain
Bangladesh
Barbados
Belarus
Belgium
Belize
Benin
Bhutan
Bolivia
Bosnia and Herzegovina
Botswana
Brazil
Brunei Darussalam
Bulgaria
Burkina Faso
Burundi
Cambodia
Cameroon
Canada
Cape Verde
Central African Republic
Chad
Chile
China
Colombia
Comoros
Congo
Congo, Democratic
Republic of the
Cook Islands
Costa Rica
Côte d’Ivoire
Croatia
Cuba
Cyprus
Czech Republic
Denmark
Djibouti
Dominica
Dominican Republic
Ecuador
Egypt
El Salvador
Equatorial Guinea
Eritrea
Estonia
Ethiopia
Fiji
Finland
France
Gabon
Gambia
114
Under-5
mortality
rate
Infant
mortality
rate
(under 1)
Annual
no. of
under-5
deaths
(thousands)
2006
Total
Life
adult
GNI
expectancy
literacy
per capita
at birth
rate
(US$)
(years)
2006
2006
2000-2005*
Primary
school net
enrolment/
attendance
(%)
2000-2006*
% share
of household
income
1995-2004*
2006
Neonatal
mortality
rate
2000
Total
population
(thousands)
2006
Annual
no. of
births
(thousands)
2006
168
37
54
5
154
25
47
8
8
84
22
15
100
15
20
8
35
111
107
89
18
45
48
10
14
123
114
85
85
7
45
114
120
18
36
26
88
67
165
15
33
3
154
10
14
21
5
4
73
13
9
52
11
12
4
14
88
63
50
13
90
19
8
12
122
109
65
87
5
25
115
124
8
20
17
51
79
60
12
20
4
54
8
10
17
3
3
36
10
11
36
8
5
3
18
38
38
27
11
40
15
4
8
36
41
40
40
4
10
48
45
6
21
14
29
32
26088
3172
33351
74
16557
84
39134
3010
20530
8327
8406
327
739
155991
293
9742
10430
282
8760
649
9354
3926
1858
189323
382
7693
14359
8173
14197
18175
32577
519
4265
10468
16465
1320864
45558
818
3689
1272
52
694
0
792
0
690
36
255
77
129
6
13
4013
3
91
110
7
358
12
264
35
47
3720
8
69
641
381
377
649
338
15
157
482
249
17309
884
28
132
327
1
26
0
206
0
11
1
2
0
11
0
0
277
0
1
0
0
53
1
16
1
6
74
0
1
131
69
31
97
2
1
27
101
2
415
19
2
17
250x
2960
3030
d
1980
11210
5150
1930
35990
39590
1850
14920x
14370x
480
d
3380
38600
3650
540
1410
1100
2980
5900
4730
24100x
3990
460
100
480
1080
36170
2130
360
480
6980
2010
2740
660
950x
43
76
72
42
75
72
81
80
67
73
75
63
77
69
79
76
56
65
65
75
49
72
77
73
52
49
59
50
80
71
44
50
78
73
73
65
54
28
99
70
67
97
99
99x
87
48
100x
70x
35
87
97
81
89
93
98
24
59
74
68
81
49
26
96
91
93
85
53s
94
97
80
58s
99
99s
97
97
85
91
97
81s
98
89
99
95
54s
70s
78s
91s
85
95
93
93
45
71s
75s
84s
100
90
59s
36s
90
99
87
72
86s
21
19
11
21
18x
22
19
21
22
21
19
7
24
7x
9
22
18
15
17
15
20
7x
11
13
9
-
40
43
55
43
41x
38
45
43
38
41
44
63
36
70x
61
38
47
48
50
51
40
65x
60
52
63
-
129
26
16
105
10
11
11
11
7
116
15
50
43
67
47
103
88
12
122
19
6
7
60
103
129
16
11
90
5
5
3
3
4
86
13
25
21
29
22
124
48
5
77
16
3
4
60
84
47
12
7
65
5
4
4
2
4
38
7
19
16
21
16
40
25
6
51
9
2
3
31
46
60644
14
4399
18914
4556
11267
846
10189
5430
819
68
9615
13202
74166
6762
496
4692
1340
81021
833
5261
61330
1311
1663
3026
0
80
684
41
121
10
93
62
24
0
231
285
1828
159
19
186
14
3159
18
58
763
34
60
620
0
1
87
0
1
0
0
0
3
0
7
7
64
4
4
14
0
389
0
0
3
3
7
130
4980
870
9330
1170x
18430x
12680
51700
1060
3960
2850
2840
1350
2540
8250
200
11410
180
3300
40650
36550
5000
310
46
79
48
76
78
79
76
78
54
72
75
71
72
51
57
71
52
69
79
80
56
59
67
95
49
98
100
97
87
91
71
81
87
100
36
84
-
52s
77
92
62s
87
97
99
92
95
79s
84
88
98
94
93
81
67s
95
45s
96
98
99
94s
61s
12
14
21
25
23
12
11
21
10
18
22
24
20
13
54
51
40
36
36
57
58
44
56
43
39
37
40
53
Under-5
mortality
rank
1990
2006
1990
3
122
75
189
2
143
125
101
161
167
46
130
146
55
138
135
175
125
20
54
61
128
29
113
148
130
10
14
47
19
161
83
15
7
148
101
110
57
27
260
45
69
6
260
29
56
10
10
105
29
19
149
17
24
10
43
185
166
125
22
58
57
11
18
206
190
116
139
8
60
173
201
21
45
35
120
103
257
17
38
3
260
11
16
24
6
5
88
14
10
69
12
13
4
16
148
70
61
15
124
20
9
14
204
181
82
149
6
34
175
209
9
24
21
68
126
9
116
138
26
161
157
175
175
167
25
128
92
101
81
97
8
51
157
30
119
175
175
44
37
205
32
18
153
12
13
12
13
9
175
17
65
57
91
60
170
147
16
204
22
7
9
92
153
205
19
12
127
6
7
4
4
5
130
15
29
24
35
25
206
74
7
123
18
4
4
91
113
T H E S TAT E O F T H E W O R L D ’ S C H I L D R E N 2 0 0 8
lowest highest
40%
20%
…TABLE 1
Georgia
Germany
Ghana
Greece
Grenada
Guatemala
Guinea
Guinea-Bissau
Guyana
Haiti
Holy See
Honduras
Hungary
Iceland
India
Indonesia
Iran (Islamic Republic of)
Iraq
Ireland
Israel
Italy
Jamaica
Japan
Jordan
Kazakhstan
Kenya
Kiribati
Korea, Democratic
People’s Republic of
Korea, Republic of
Kuwait
Kyrgyzstan
Lao People’s
Democratic Republic
Latvia
Lebanon
Lesotho
Liberia
Libyan Arab Jamahiriya
Liechtenstein
Lithuania
Luxembourg
Madagascar
Malawi
Malaysia
Maldives
Mali
Malta
Marshall Islands
Mauritania
Mauritius
Mexico
Micronesia
(Federated States of)
Moldova, Republic of
Monaco
Mongolia
Montenegro
Morocco
Mozambique
Myanmar
Namibia
Nauru
Nepal
Primary
school net
enrolment/
attendance
(%)
2000-2006*
% share
of household
income
1995-2004*
2006
Neonatal
mortality
rate
2000
Total
population
(thousands)
2006
Annual
no. of
births
(thousands)
2006
Annual
no. of
under-5
deaths
(thousands)
2006
39
7
76
9
30
60
139
142
64
105
45
15
5
82
60
54
42
8
10
8
28
5
33
51
64
65
28
4
76
4
16
31
98
119
46
60
23
6
2
57
26
30
37
4
4
4
26
3
21
26
79
47
25
3
27
4
13
19
48
48
25
34
18
6
2
43
18
22
63
4
4
3
10
2
17
32
29
27
4433
82641
23008
11123
106
13029
9181
1646
739
9446
1
6969
10058
298
1151751
228864
70270
28506
4221
6810
58779
2699
127953
5729
15314
36553
94
48
683
700
103
2
445
374
82
13
269
199
93
4
27195
4427
1407
937
66
137
544
55
1087
152
289
1447
0
2
3
84
0
0
18
60
16
1
22
5
1
0
2067
151
48
43
0
1
2
2
4
4
8
175
0
1560
36620
520
21690
4420
2640
410
190
1130
480
1200
10950
50580
820
1420
3000
2170x
45580
18580x
32020
3480
38410
2660
3790
580
1230
71
79
59
79
68
70
55
46
66
60
70
73
82
64
70
71
58
79
80
80
72
82
72
66
53
-
58
96
69
30
80
61
90
82
74
98
80
91
100x
74
-
93
96
75s
99
84
94
51s
54s
96s
50s
79s
89
99
84s
96
95
88
96
97
99
97s
100
99s
98s
79
97
16
22
16
19
10
18
14x
14
9
11
23
19
20
15
20
16
18
14
25x
18
19
16
-
46
37
47
41
59
46
53x
50
63
58
37
45
43
50
42
45
42
52
36x
46
41
49
-
55
5
11
41
42
8
14
63
42
5
9
36
22
3
6
31
23708
48050
2779
5259
321
455
50
113
18
2
1
5
a
17690
30630x
490
67
78
77
66
93
99x
100
87
92s
21
22
37
39
163
18
37
101
235
41
10
13
10
168
221
22
111
250
11
92
133
23
53
75
9
30
132
235
18
3
8
4
115
120
12
30
217
6
56
125
14
35
120
14
32
81
157
35
9
10
8
103
131
16
78
140
10
63
85
21
42
59
8
26
102
157
17
3
7
4
72
76
10
26
119
5
50
78
13
29
35
7
20
28
66
11
5
4
33
40
5
37
55
5
26
70
12
15
5759
2289
4055
1995
3579
6039
35
3408
461
19159
13571
26114
300
11968
405
58
3044
1252
105342
156
21
74
59
184
144
0
30
5
714
566
556
7
579
4
0
102
19
2109
12
0
2
8
43
3
0
0
0
82
68
7
0
126
0
0
13
0
74
500
8100
5490
1030
140
7380
d
7870
76040
280
170
5490
2680
440
13610x
3000
740
5450
7870
64
72
72
42
45
74
73
79
59
47
74
68
54
79
64
73
76
69
100
82
52
84
100
59
64x
89
96
24
88x
51
84
92
84
88
92
87
66
88
89
95
76s
87s
95
79
51
86
90
72
95
98
20
18
6
18
21
13
18
13
16
17
13
43
45
66
43
39
54
47
54
47
46
55
58
37
9
109
16
89
235
130
86
142
41
19
4
43
10
37
138
104
61
30
59
45
30
7
79
15
69
158
91
60
99
33
16
3
34
9
34
96
74
45
25
46
12
16
3
26
21
48
40
25
14
40
111
3833
33
2605
601
30853
20971
48379
2047
10
27641
3
44
0
49
8
635
856
897
53
0
791
0
1
0
2
0
23
118
93
3
0
47
2380
1100
d
880
3860
1900
340
220x
3230
290
68
69
66
74
71
42
61
52
63
99
98
96
52
39x
90
85
49
92
86
97s
97s
86
60s
84s
72
60
87
20
20
17
15
4x
15
41
40
47
54
79x
55
Under-5
mortality
rate
Infant
mortality
rate
(under 1)
Under-5
mortality
rank
1990
2006
1990
86
175
32
175
113
71
17
11
60
48
95
157
189
49
83
83
68
167
167
175
88
175
97
92
31
59
46
9
120
11
37
82
235
240
88
152
58
17
7
115
91
72
53
10
12
9
33
6
40
60
97
88
32
4
120
4
20
41
161
200
62
80
27
7
3
76
34
34
46
5
5
4
31
4
25
29
121
64
65
167
143
71
55
9
16
75
50
148
89
24
5
119
189
151
175
36
32
138
89
6
161
64
28
130
81
71
116
175
69
146
78
22
40
61
89
63
Total
Life
adult
GNI
expectancy
literacy
per capita
at birth
rate
(US$)
(years)
2006
2006
2000-2005*
lowest highest
40%
20%
S TAT I S T I C A L TA B L E S
115
TABLE 1. BASIC INDICATORS
116
Annual
no. of
births
(thousands)
2006
Annual
no. of
under-5
deaths
(thousands)
2006
Total
Life
adult
GNI
expectancy
literacy
per capita
at birth
rate
(US$)
(years)
2006
2006
2000-2005*
Primary
school net
enrolment/
attendance
(%)
2000-2006*
% share
of household
income
1995-2004*
1990
2006
1990
2006
Neonatal
mortality
rate
2000
167
161
79
4
12
175
9
11
68
320
230
9
5
6
36
253
191
4
7
9
52
191
120
7
4
5
29
148
99
3
4
4
18
43
53
13
3
16379
4140
5532
13737
144720
2
4669
188
57
139
683
5909
0
56
1
0
5
173
1129
0
42670
27250
1000
260
640
66530
79
80
72
56
47
80
77
29
69
-
99
99
87
40
68
90
98
21
18
15
10
15
24
39
44
49
53
49
37
108
138
42
143
106
52
108
97
86
157
167
110
119
125
18
116
130
40
32
130
21
34
94
41
78
62
18
14
26
31
27
176
36
21
22
12
97
11
23
73
22
25
32
7
5
21
18
16
160
19
14
34
25
100
18
27
69
33
58
41
16
11
21
23
23
106
30
17
20
10
78
10
18
54
19
21
24
6
3
18
16
14
98
17
12
6
57
14
11
32
16
16
15
6
3
5
9
9
45
12
10
3889
2546
160943
20
3288
6202
6016
27589
86264
38140
10579
821
21532
143221
9464
50
163
143
57
4358
0
70
191
153
584
2295
358
113
13
213
1506
420
1
3
3
1
423
0
2
14
3
15
73
3
1
0
4
24
67
0
0
1230x
9070x
770
7990
4890
770
1400
2920
1420
8190
18100
12000x
4850
5780
250
8840
5110
73
75
65
75
57
71
71
71
75
78
75
72
65
46
73
92
81
50
92
57
94
88
93
94
89
97
99
65
-
80
73
68
96
99
88
97
94
96
98
96
93
92
86s
93
97
22
9
12
9
11
15
19
17
21
17
14
15
40
60
57
62
57
51
42
46
39
47
53
48
113
94
189
43
97
35
151
135
1
189
151
175
52
21
55
175
135
45
74
16
189
167
130
57
34
151
25
50
14
100
44
149
19
290
9
14
10
121
203
60
9
32
120
48
110
7
9
38
115
161
31
20
28
3
96
25
116
8
13
270
3
8
4
73
145
69
4
13
89
39
164
3
5
14
68
118
8
20
40
13
65
35
72
17
169
7
12
8
86
121
45
7
26
74
35
78
6
7
31
91
102
26
17
23
3
63
21
60
7
12
159
2
7
3
55
90
56
4
11
61
29
112
3
4
12
56
74
7
11
13
2
38
12
31
9
56
1
5
4
12
49
21
3
11
29
18
38
2
3
9
38
43
13
120
185
31
155
24175
12072
9851
86
5743
4382
5388
2001
484
8445
48282
43887
19207
37707
455
1134
9078
7455
19408
6640
39459
63444
2
5
0
5
612
435
126
3
262
37
53
18
15
371
1102
468
295
1225
9
33
101
69
529
185
1589
936
0
0
0
0
15
50
1
0
71
0
0
0
1
54
76
2
4
109
0
5
0
0
7
13
188
7
3930
2270
d
780
12510x
750
3910
8650
240
29320
9870
18890
680
130x
5390
27570
1300
810
3200
2430
43580
57230
1570
390
350
2990
71
71
65
72
63
74
42
80
74
78
63
47
50
81
72
58
70
40
81
81
74
66
52
70
99
85
83
39
96
92
35
89x
100
82x
97x
91
61
90
80
81
100
69
93
90
90
97
78
58s
96
99
69s
92
98
63
22s
87
99
97
58s
94
80
96
93
95
89s
73s
98s
17
3x
14
24
23
10
19
17
13
23
20
20
19
16
48
63x
49
35
36
62
42
48
56
37
41
41
42
49
122
65
38
101
75
106
96
67
75
23
101
38
177
149
32
34
52
82
99
54
160
25
17
55
108
24
38
23
26
51
38
134
24
33
133
88
26
30
41
67
81
42
93
22
15
47
69
20
33
19
24
45
31
78
20
9
40
40
10
13
14
22
35
22
32
9
2036
1114
6410
100
1328
10215
73922
4899
10
29899
46557
23
46
242
3
20
172
1378
108
0
1406
417
0
3
26
0
1
4
36
6
0
188
10
3060
840
350
2170
13340
2970
5400
1340x
300
1950
74
60
58
73
69
74
72
63
50
68
96
53
99x
98
74
87
99x
67
99
92
75s,y
78
95
98s
97
89
99s
100
82s
97s
17
16x
16
15
16
15
23
46
46x
47
50
47
53
38
Under-5
mortality
rank
Netherlands
New Zealand
Nicaragua
Niger
Nigeria
Niue
Norway
Occupied Palestinian
Territory
Oman
Pakistan
Palau
Panama
Papua New Guinea
Paraguay
Peru
Philippines
Poland
Portugal
Qatar
Romania
Russian Federation
Rwanda
Saint Kitts and Nevis
Saint Lucia
Saint Vincent and
the Grenadines
Samoa
San Marino
Sao Tome and Principe
Saudi Arabia
Senegal
Serbia
Seychelles
Sierra Leone
Singapore
Slovakia
Slovenia
Solomon Islands
Somalia
South Africa
Spain
Sri Lanka
Sudan
Suriname
Swaziland
Sweden
Switzerland
Syrian Arab Republic
Tajikistan
Tanzania, United Republic of
Thailand
The former Yugoslav
Republic of Macedonia
Timor-Leste
Togo
Tonga
Trinidad and Tobago
Tunisia
Turkey
Turkmenistan
Tuvalu
Uganda
Ukraine
Under-5
mortality
rate
Infant
mortality
rate
(under 1)
Total
population
(thousands)
2006
T H E S TAT E O F T H E W O R L D ’ S C H I L D R E N 2 0 0 8
lowest highest
40%
20%
…TABLE 1
Under-5
mortality
rate
Infant
mortality
rate
(under 1)
Total
Life
adult
GNI
expectancy
literacy
per capita
at birth
rate
(US$)
(years)
2006
2006
2000-2005*
Primary
school net
enrolment/
attendance
(%)
2000-2006*
% share
of household
income
1995-2004*
2006
Neonatal
mortality
rate
2000
Total
population
(thousands)
2006
13
8
10
20
61
48
8
5
6
11
38
30
5
4
5
7
27
19
4248
60512
302841
3331
26981
221
69
715
4248
51
619
6
1
4
34
1
27
0
23950x
40180
44970
5310
610
1710
78
79
78
76
67
70
89
97x
74
71
99
92
93
100s
94
18
16
14
19
-
44
46
50
45
-
21
17
100
182
105
27
38
98
101
52
18
15
75
102
68
12
15
37
40
33
27191
86206
21732
11696
13228
595
1654
839
470
372
12
28
84
86
39
6070
690
760
630
340x
73
74
62
41
42
93
90x
54
68x
89
91
94s
75
57s
82
12
20
20
11
13
52
44
41
55
56
160
131
186
46
83
29
27
27
6
79
142
72
111
102
119
58
87
41
43
43
9
70
113
64
95
83
107
36
62
23
22
24
5
54
90
49
44
40
48
26
44
20
15
18
4
33
43
30
748886
370361
378525
382048
1542571
1968675
559525
405584
969949
5358223
785444
6577236
29889
14074
15815
9617
37942
29764
11418
5529
11003
121685
28661
135163
4786
1844
2942
442
3149
863
308
149
66
9614
4070
9733
50
50
50
69
64
72
73
68
79
66
55
68
58
60
57
73
58
91
90
97
76
55
78
66
70
62
85
82
97
93
92
96
84
65
86
13
11
16
17
19
17
12
20
21
15
15
20
55
58
49
46
46
46
56
42
40
50
50
42
Under-5
mortality
rank
1990
2006
1990
151
161
151
138
69
79
15
10
12
23
74
62
8
6
8
12
43
36
110
122
41
13
39
33
53
139
180
76
United Arab Emirates
United Kingdom
United States
Uruguay
Uzbekistan
Vanuatu
Venezuela
(Bolivarian Republic of)
Viet Nam
Yemen
Zambia
Zimbabwe
Annual
no. of
births
(thousands)
2006
Annual
no. of
under-5
deaths
(thousands)
2006
lowest highest
40%
20%
SUMMARY INDICATORS
Sub-Saharan Africa
Eastern and Southern Africa
West and Central Africa
Middle East and North Africa
South Asia
East Asia and Pacific
Latin America and Caribbean
CEE/CIS
Industrialized countries§
Developing countries§
Least developed countries§
World
187
165
208
79
123
55
55
53
10
103
180
93
851
1171
553
2104
777
2371
4847
4264
37217
1967
438
7406
§ Also includes territories within each country category or regional group. Countries and territories in each country category or regional group are listed on page 148.
DEFINITIONS OF THE INDICATORS
MAIN DATA SOURCES
Under-five mortality rate – Probability of dying between birth and exactly five years of age,
expressed per 1,000 live births.
Infant mortality rate – Probability of dying between birth and exactly one year of age, expressed
per 1,000 live births.
Neonatal mortality rate – Probability of dying during the first 28 completed days of life, expressed
per 1,000 live births.
GNI per capita – Gross national income (GNI) is the sum of value added by all resident producers,
plus any product taxes (less subsidies) not included in the valuation of output, plus net receipts of
primary income (compensation of employees and property income) from abroad. GNI per capita is
gross national income divided by midyear population. GNI per capita in US dollars is converted
using the World Bank Atlas method.
Life expectancy at birth – Number of years newborn children would live if subject to the mortality
risks prevailing for the cross section of population at the time of their birth.
Adult literacy rate – Number of literate persons aged 15 and above, expressed as a percentage of
the total population in that age group.
Primary school net enrolment/attendance ratios – Number of children enrolled in or attending
primary school, expressed as a percentage of the total number of children of primary school age.
The indicator is either the primary school net enrolment ratio or the primary school net attendance
ratio. In general, if both indicators are available, the primary school net enrolment ratio is
preferred unless the data for primary school attendance is considered to be of superior quality.
Definitions for both the primary school net enrolment ratio and the primary school net attendance
ratio are given in Table 5, p. 130.
Income share – Percentage of income received by the 20 per cent of households with the highest
income and by the 40 per cent of households with the lowest income.
NOTES
a: low income ($905 or less).
b: lower-middle income ($906 to $3,595).
c: upper-middle income ($3,596 to $11,115).
d: high income ($11,116 or more).
Under-five and infant mortality rates – UNICEF, World Health Organization, United Nations
Population Division and United Nations Statistics Division.
Neonatal mortality rate – World Health Organization using vital registration systems and
household surveys.
Total population – United Nations Population Division.
Births – United Nations Population Division.
Under-five deaths – UNICEF.
GNI per capita – World Bank.
Life expectancy – United Nations Population Division.
Adult literacy – UNESCO Institute for Statistics (UIS), including the Education for All 2000
Assessment.
School enrolment/attendance – UIS, Multiple Indicator Cluster Surveys (MICS) and Demographic
and Health Surveys (DHS).
Household income – World Bank.
- Data not available.
x Data refer to years or periods other than those specified in the column heading, differ from the standard definition
or refer to only part of a country. Such data are not included in the calculation of regional and global averages.
y Data refer to years or periods other than those specified in the column heading, differ from the standard definition or
refer to only part of a country. Such data are included in the calculation of regional and global averages.
* Data refer to the most recent year available during the period specified in the column heading.
s National household survey data.
S TAT I S T I C A L TA B L E S
117
TABLE 2. NUTRITION
% of children (2000-2006*) who are:
Countries and territories
Afghanistan
Albania
Algeria
Andorra
Angola
Antigua and Barbuda
Argentina
Armenia
Australia
Austria
Azerbaijan
Bahamas
Bahrain
Bangladesh
Barbados
Belarus
Belgium
Belize
Benin
Bhutan
Bolivia
Bosnia and Herzegovina
Botswana
Brazil
Brunei Darussalam
Bulgaria
Burkina Faso
Burundi
Cambodia
Cameroon
Canada
Cape Verde
Central African Republic
Chad
Chile
China
Colombia
Comoros
Congo
Congo, Democratic Republic of the
Cook Islands
Costa Rica
Côte d’Ivoire
Croatia
Cuba
Cyprus
Czech Republic
Denmark
Djibouti
Dominica
Dominican Republic
Ecuador
Egypt
El Salvador
Equatorial Guinea
Eritrea
Estonia
Ethiopia
Fiji
Finland
France
118
% of infants
with low
birthweight
1999-2006*
7
6
12
5
7
8
7
7
12
7
8
22
13
4
8
6
16
15
7
5
10
8
10
10
16
11
11
11
6
13
13
22
6
2
9
25
13
12
3
7
17
6
5
7
5
10
10
11
16
14
7
13
14
4
20
10
4
7
exclusively
breastfed
(< 6 months)
2
7
11
33
7
34x,k
37
9
24x,k
70
54
18
34
7
45
60
21
57x,k
23
2
63
51
47
21
19
24
19x,k
35x,k
4
23x
41
1
4
40
38
24
24
52
49
47x,k
-
% of under-fives (2000-2006*) suffering from:
breastfed with
complementary
food
(6-9 months)
still
breastfeeding
(20-23 months)
moderate
& severe
29
38
39
77
57
39
65x
52
38
54x
50
74
29
57
30x
50
88
82
64
64x
55
77
47
32
65
34
78
79
47x
54
42
23
36
77
67
76
43
54
-
54
20
22
37
15
16
41x
89
4
23x
57
46
10
11
17x
85
54
21
13x
47
65
15
32
45
21
52
12x
37
9
18
15
23
37
43
62
-
39
8
4
31
4
4
7
9x
48
1
7
23
19x
8
2
13
6x
37
39
36
19
29
37
1
7
7
25
14
31
10x
5x
20
1x
4
29
5
9
6
10
19
40
38
-
underweight
T H E S TAT E O F T H E W O R L D ’ S C H I L D R E N 2 0 0 8
severe
12
1
1
8
0
1
2x
13
0
5
3x
1
0
2
1x
14
14
7
5
8
14
1
3
9
0x
4
0
10
1
1
1
1
4
12
11
-
wasting
stunting
moderate
& severe
moderate
& severe
7
7
3
6
1
5
2
5x
13
1
1
7
3x
1
3
5
2x
23
7
7
6
10
14
0
1
8
7
13
2x
7
1x
2
21
1
2
4
1
7
13
11
-
54
22
11
45
4
13
13
10x
43
3
18
38
40x
27
7
23
11x
35
53
37
30
38
41
1
11
12
44
26
38
6x
34
1x
5
33
7
23
18
19
39
38
47
-
Vitamin A
supplement
coverage rate
(6-59 months)
2005
% of
households
consuming
full
at least one
iodized salt
dose‡ (%) coverageΔ (%) 2000-2006*
95
79
29
83
94
39
95
69
79
95
95
90
92
95
52
57
59
-
91
65
29w
82
92
39
95
17
65
95
93
9
87
89
0
50
59
-
28
62
61
35
90x
97
26
84
55
90x
72
96
90
62
66
88
100
34
98
73
49
0x
62
56
100
90
92x
82
82
72
97x
84
90x
88
0
19
99x
78
62
33
68
20
31x
-
…TABLE 2
% of children (2000-2006*) who are:
% of infants
with low
birthweight
1999-2006*
Gabon
Gambia
Georgia
Germany
Ghana
Greece
Grenada
Guatemala
Guinea
Guinea-Bissau
Guyana
Haiti
Holy See
Honduras
Hungary
Iceland
India
Indonesia
Iran (Islamic Republic of)
Iraq
Ireland
Israel
Italy
Jamaica
Japan
Jordan
Kazakhstan
Kenya
Kiribati
Korea, Democratic People’s Republic of
Korea, Republic of
Kuwait
Kyrgyzstan
Lao People’s Democratic Republic
Latvia
Lebanon
Lesotho
Liberia
Libyan Arab Jamahiriya
Liechtenstein
Lithuania
Luxembourg
Madagascar
Malawi
Malaysia
Maldives
Mali
Malta
Marshall Islands
Mauritania
Mauritius
Mexico
Micronesia (Federated States of)
Moldova, Republic of
Monaco
Mongolia
Montenegro
Morocco
Mozambique
Myanmar
Namibia
14
20
7
7
9
8
9
12
12
24
13
25
10
9
4
30
9
7
15
6
8
6
12
8
12
6
10
5
7
4
7
5
14
5
6
13
7
4
8
17
13
9
22
23
6
12
14
8
18
6
6
4
15
15
15
14
exclusively
breastfed
(< 6 months)
6
41
18x,k
54
39x,k
51
27
16
11
41
30
46
40
44
25
15
27
17
13
80x,k
65
12x,k
32
23
27k
36
35
67
56
29x,k
10
25
63x,k
20
21k
38x,k
60x,k
46
57
19
31
30
15k
19
% of under-fives (2000-2006*) suffering from:
breastfed with
complementary
food
(6-9 months)
still
breastfeeding
(20-23 months)
moderate
& severe
62
44
12x
58
67
41
35
42
87
69
56
75
51
36
70
39
84
31
26x
49
10
35
79
70
78
89
85
32
78
36x
18
57
35
66
80
66
57
9
53
12x
56
47
71
61
31
35
48
59
0
36
24
12
16
57
37
9x
26
47
11
60
45
23x
64
73
12x
69
57
21x
2
65
13
15
65
67
37
12
20
3x
18
23
26
19
14
22
11
43
28
11x
8
4
4
4
20
13x
23
10x
3
40
4
20
26
5x
42
19
8
30
33
32
15x
5
15x
4
6
3
10
24
32
24
underweight
severe
2
4
0x
3
4
7
4
3
6
1
16
9
2x
1
1
1
4
8
3x
0
13
4
8
1x
11
3
1
7
11
10
2x
1
1
1
2
6
7
5
wasting
stunting
moderate
& severe
moderate
& severe
3
6
2x
5
2
9
7
11
9
1
20
5x
5
4
2
4
6
7
11x
4
15
5
4
6
3x
13
3
13
11
13
14x
2
4
2
3
9
4
9
9
21
22
12x
22
49
35
41
11
24
25
48
15x
21
3
9
13
30
37
24x
14
42
11
38
39
15x
48
46
25
38
35
10x
13
8
21
5
18
41
32
24
Vitamin A
supplement
coverage rate
(6-59 months)
2005
% of
households
consuming
full
at least one
iodized salt
dose‡ (%) coverageΔ (%) 2000-2006*
95
95
44
95
42
40
64
76
69
62
95
88
63
9
95
95
94
66
6
96
68
89
92
95
95
68
16
95
36w
95
42
40
64w
76
69
60
95
87
62
2
79
95
86
66
6
57
63
73
92
16
95
0
S TAT I S T I C A L TA B L E S
36
7
91
32
67
51
1
3
80x
51
73
99
28
100x
88
92
91
40
76
75
92
91
90x
75
48
44
74
2
0x
91
60
83
71
59
54
60
63
119
TABLE 2. NUTRITION
% of children (2000-2006*) who are:
% of infants
with low
birthweight
1999-2006*
Nauru
Nepal
Netherlands
New Zealand
Nicaragua
Niger
Nigeria
Niue
Norway
Occupied Palestinian Territory
Oman
Pakistan
Palau
Panama
Papua New Guinea
Paraguay
Peru
Philippines
Poland
Portugal
Qatar
Romania
Russian Federation
Rwanda
Saint Kitts and Nevis
Saint Lucia
Saint Vincent and the Grenadines
Samoa
San Marino
Sao Tome and Principe
Saudi Arabia
Senegal
Serbia
Seychelles
Sierra Leone
Singapore
Slovakia
Slovenia
Solomon Islands
Somalia
South Africa
Spain
Sri Lanka
Sudan
Suriname
Swaziland
Sweden
Switzerland
Syrian Arab Republic
Tajikistan
Tanzania, United Republic of
Thailand
The former Yugoslav Republic of Macedonia
Timor-Leste
Togo
Tonga
Trinidad and Tobago
Tunisia
Turkey
Turkmenistan
Tuvalu
120
21
6
12
13
14
0
5
7
8
19
9
10
11
9
11
20
6
8
10
8
6
6
9
12
5
4
8
11
19
5
24
8
7
6
13
11
15
6
22
31
13
9
4
6
9
10
10
9
6
12
12
3
19
7
16
4
5
exclusively
breastfed
(< 6 months)
53
31
14
17
27
16x,k
59x,k
25x
59x
22
64
34
12x,k
16
88
56x,k
60
31x,k
34
15
8
65k
9
7y
53
16
9
24
29
25
41
5
37x
31
28
62x,k
13
47
21
11
-
% of under-fives (2000-2006*) suffering from:
breastfed with
complementary
food
(6-9 months)
still
breastfeeding
(20-23 months)
moderate
& severe
75
68
62
64
92
31x
38x
74x
60
81
58
48x
41
69
60
60x
61
39
52
15
46y
47
25
60
37
15
91
43
8x
82
35
43
38
54
-
95
39
62
34
73
56x
21x
66x
41
32
21x
77
18
30x
42
8
57
35
73
40
11
25
16
34
55
19
10x
35
44
22
22
24
37
-
39
10
44
29
3
18x
38
8x
5
8
28
6x
3
3x
23
9
14x
17
2
30
3
36
12x
29
41
13
10
10
17
22
9
2
46
26
6
4
4
11
-
underweight
T H E S TAT E O F T H E W O R L D ’ S C H I L D R E N 2 0 0 8
severe
11
2
15
9
0
1x
13
1x
0
0
1x
4
1
3x
3
0
8
0
12
2x
15
2
2
2
4
4
0
0
15
7
1
1
1
2
-
wasting
stunting
moderate
& severe
moderate
& severe
13
2
10
9
1
7x
13
1x
1
1
6
2x
2
4x
4
8
11x
8
3
9
2
11
3x
14
16
7
1
9
7
3
4
2
12
14
4
2
1
6
-
49
20
50
38
10
10x
37
18x
14
24
30
8x
10
13x
45
23
20x
16
6
40
2
38
25x
14
43
10
30
22
27
38
12
9
49
24
4
12
12
15
-
Vitamin A
supplement
coverage rate
(6-59 months)
2005
% of
households
consuming
full
at least one
iodized salt
dose‡ (%) coverageΔ (%) 2000-2006*
96
98
94
73
95
4
90
85
100
33
95
95
33
64
90
59
98
95
91
95
-
96
0
94
73
95
4
0
85
99
28
86
95
29
61w
90
40
98
95
35
92
-
63
83x
97
46
97
86
61x
17
95x
88
91
56
74
35
88
37
41
73
45
1
62x
94
1
59
79
46
43
58
94
72
25
28
97
64
87
-
…TABLE 2
% of under-fives (2000-2006*) suffering from:
% of children (2000-2006*) who are:
% of infants
with low
birthweight
1999-2006*
Uganda
Ukraine
United Arab Emirates
United Kingdom
United States
Uruguay
Uzbekistan
Vanuatu
Venezuela (Bolivarian Republic of)
Viet Nam
Yemen
Zambia
Zimbabwe
exclusively
breastfed
(< 6 months)
breastfed with
complementary
food
(6-9 months)
still
breastfeeding
(20-23 months)
moderate
& severe
underweight
severe
wasting
stunting
moderate
& severe
moderate
& severe
Vitamin A
supplement
coverage rate
(6-59 months)
2005
% of
households
consuming
full
at least one
iodized salt
dose‡ (%) coverageΔ (%) 2000-2006*
12
4
15
8
8
8
5
6
9
7
32
12
11
60
6
34x,k
26
50x,k
7x,k
17
12
40
22
80
83
52x
45
50x
70
76
87
79
54
11
29x
38
31x
23
58
28
20
1
14x
2
5
5
5
25
46
20
17
5
0
3x
0
1
1
1
3
15
3
5
0
15x
0
2
3
4
7
12
6
6
32
3
17x
1
11
15
13
30
53
50
29
78
82
99
15
66
81
78
82
99w
15w
66
81
95
18
53
90x
93
30
77
93x
14
14
14
16
29
6
9
6
7
16
17
15
30
39
21
28
45
43
19
38
35
38
67
71
63
57
55
45
44
56
64
56
50
56
46
25
27
23
40
63
39
28
28
28
17
42
14
7
5
26
35
25
8
7
9
5
15
1
10
10
9
9
7
10
8
18
2
2
11
10
11
38
41
36
25
46
16
16
12
32
42
31
79
73
85
71
84
75
82
75
73
64
82
71
82**
72**
77
72**
64
54
72
64
51
84
85
50
69
55
68
SUMMARY INDICATORS
Sub-Saharan Africa
Eastern and Southern Africa
West and Central Africa
Middle East and North Africa
South Asia
East Asia and Pacific
Latin America and Caribbean
CEE/CIS
Industrialized countries§
Developing countries§
Least developed countries§
World
§ Also includes territories within each country category or regional group. Countries and territories in each country category or regional group are listed on page 148.
DEFINITIONS OF THE INDICATORS
Low birthweight – Weight less than 2,500 grams at birth.
Underweight – Moderate and severe: below minus two standard deviations from median weight
for age of reference population; severe: below minus three standard deviations from median
weight for age of reference population.
Wasting – Moderate and severe: below minus two standard deviations from median weight for
height of reference population.
Stunting – Moderate and severe: below minus two standard deviations from median height for age
of reference population.
MAIN DATA SOURCES
Low birthweight – Demographic and Health Surveys (DHS), Multiple Indicator Cluster Surveys
(MICS), other national household surveys and data from routine reporting systems.
Breastfeeding – DHS, MICS and UNICEF.
Underweight, wasting and stunting – DHS, MICS, World Health Organization (WHO) and UNICEF.
Vitamin A – UNICEF and WHO.
Salt iodization – MICS, DHS and UNICEF.
Vitamin A – Percentage of children aged 6-59 months who received vitamin A supplements in 2005.
Iodized salt consumption – Percentage of households consuming adequately iodized salt (15 parts
per million or more).
NOTES
x
Data not available.
Data refer to years or periods other than those specified in the column heading, differ from the standard definition or refer to only part of a country.
Such data are not included in the calculation of regional and global averages.
y Data refer to years or periods other than those specified in the column heading, differ from the standard definition or refer to only part of a country.
Such data are included in the calculation of regional and global averages.
* Data refer to the most recent year available during the period specified in the column heading.
k Refers to exclusive breastfeeding for less than four months.
w Identifies countries with national vitamin A supplementation programmes targeted towards a reduced age range. Coverage figure is reported as targeted.
‡ Refers to the percentage of children who received at least one dose in 2005 (the most recent coverage point at the time of reporting).
Δ
The percentage of children reached with two doses in 2005 is reported as the lower percentage of two coverage points. ‘0’ (zero) indicates that only one dose was delivered in 2005.
** Excludes China.
S TAT I S T I C A L TA B L E S
121
TABLE 3. HEALTH
% underfives with
diarrhoea
receiving
oral rehydration and
continued
feeding
% of population
using improved
drinking-water
sources
2004
% of population
using adequate
sanitation facilities
2004
% of routine
EPI
vaccines
financed by
government
2006
Countries and territories
total urban rural
total urban rural
total
% underfives with
suspected % underpneumonia fives with
%
1-year-old children immunized against:
taken to an suspected
newappropriate pneumonia
TB
DPT
Polio Measles HepB Hib
borns
health-care receiving
protected provider± antibiotics±
corresponding vaccines:
against
β
β
2000-2006*
BCG DPT1 DPT3 polio3 measles HepB3 Hib3 tetanusλ
2000-2006*
%
underfives
sleeping
under a
mosquito
net
Afghanistan
Albania
Algeria
Andorra
Angola
Antigua and Barbuda
Argentina
Armenia
Australia
Austria
Azerbaijan
Bahamas
Bahrain
Bangladesh
Barbados
Belarus
Belgium
Belize
Benin
Bhutan
Bolivia
Bosnia and Herzegovina
Botswana
Brazil
Brunei Darussalam
Bulgaria
Burkina Faso
Burundi
Cambodia
Cameroon
Canada
Cape Verde
Central African Republic
Chad
Chile
China
Colombia
Comoros
Congo
Congo, Democratic
Republic of the
Cook Islands
Costa Rica
Côte d’Ivoire
Croatia
Cuba
Cyprus
Czech Republic
Denmark
Djibouti
Dominica
Dominican Republic
Ecuador
Egypt
El Salvador
Equatorial Guinea
Eritrea
Estonia
Ethiopia
Fiji
Finland
France
39
96
85
100
53
91
96
92
100
100
77
97
74
100
100
91
67
62
85
97
95
90
99
61
79
41
66
100
80
75
42
95
77
93
86
58
63
99
88
100
75
95
98
99
100
100
95
98
100
82
100
100
100
100
78
86
95
99
100
96
100
94
92
64
86
100
86
93
41
100
93
99
92
84
31
94
80
100
40
89
80
80
100
100
59
86
72
100
100
82
57
60
68
96
90
57
97
54
77
35
44
99
73
61
43
58
67
71
82
27
34
91
92
100
31
95
91
83
100
100
54
100
39
100
84
47
33
70
46
95
42
75
99
13
36
17
51
100
43
27
9
91
44
86
33
27
49
99
99
100
56
98
92
96
100
100
73
100
100
51
99
93
71
59
65
60
99
57
83
100
42
47
53
58
100
61
47
24
95
69
96
41
28
29
84
82
100
16
94
83
61
100
100
36
100
35
100
61
25
11
70
22
92
25
37
96
6
35
8
43
99
19
12
4
62
28
54
29
25
0
100
67
100
30
88
70
100
100
63
100
100
100
10
69
85
100
100
17
1
0
20
90
0
55
100
100
0
75
90
98
99
65
99
91
99
96
99
97
99
92
93
97
99
99
96
98
99
84
87
85
70
70
40
98
92
88
84
84
90
98
98
97
66
96
93
95
97
94
97
95
99
96
81
99
98
96
99
98
94
94
98
99
99
97
99
86
85
87
97
74
65
45
95
94
95
78
81
77
98
95
93
44
99
91
87
92
83
95
95
98
88
84
99
97
98
93
95
81
87
97
99
99
95
95
74
80
81
94
72
40
20
94
93
86
69
79
77
97
95
93
44
99
92
87
92
83
97
94
98
88
85
97
97
98
93
96
79
91
97
99
99
96
94
64
80
78
94
72
40
36
94
94
86
69
79
68
97
91
91
48
99
97
92
94
80
96
88
99
81
92
97
88
99
89
90
81
90
90
99
97
96
88
75
78
73
94
65
35
23
91
93
88
66
66
98
80
84
99
84
78
94
83
93
96
98
88
84
98
78
98
93
95
81
82
85
97
99
96
76
74
80
81
14
69
94
91
86
69
-
93
99
91
94
83
95
97
84
95
98
93
81
85
99
99
76
74
94
94
86
-
88
87
70
80
65
92
92
94
80
84
88
85
71
84
92
65
84
80
52
82
74
60
88
77
84
28
45
53
58
36
36
30
90
66x
35
52
91
14
46x
39
38
48
35
32
12
62
49
48
38
59
11
22
67
73
15x
15
26
38
39
-
48
50
24
32
59
40
49
54
42
54
53
7
28x
42
23
59
22
47
27
39
31
39
12x
47
18
13
88
27
33
27x
24x
36x
68
1x
20
10
8
4
13
15
1x
9x
6
1x
54
48
30
0
58
57
32x
63x
48
46
94
97
84
100
91
100
100
100
73
97
95
94
98
84
43
60
100
22
47
100
100
82
98
100
97
100
95
100
100
100
76
100
97
97
99
94
45
74
100
81
43
100
100
29
88
92
74
100
78
100
100
100
59
90
91
89
97
70
42
57
99
11
51
100
100
30
100
92
37
100
98
100
98
82
84
78
89
70
62
53
9
97
13
72
100
-
42
100
89
46
100
99
100
99
88
86
81
94
86
77
60
32
97
44
87
100
-
25
100
97
29
100
95
100
97
50
75
73
82
58
39
46
3
96
7
55
100
-
0
100
28
100
99
36
100
100
69
100
100
100
0
10
100
0
100
100
-
87
99
88
77
98
99
99
88
99
95
99
99
93
73
99
99
72
93
98
84
87
99
89
95
96
96
99
98
93
76
99
93
99
98
98
65
99
98
80
84
99
98
77
99
91
77
96
89
97
98
93
72
95
81
98
98
96
33
97
95
72
81
97
98
78
99
91
76
96
99
97
98
93
72
88
85
97
98
96
39
96
95
69
83
97
98
73
99
89
73
96
96
87
97
99
67
99
99
97
98
98
51
95
96
63
99
97
87
99
90
77
89
93
98
7
74
98
98
96
97
95
81
29
89
96
97
90
97
93
7
69
98
96
88
81
98
87
77
77
85
66
86
91
59
79
80
93
-
36
35
62
63
63
62
44
19
-
19
43
-
17
45
33
42
27
36
54
15
-
12x
17
9
15x
12x
2
-
1x
6
1
1x
4x
2
-
52x
36
10
49x
4x
3
-
122
Immunization 2006
T H E S TAT E O F T H E W O R L D ’ S C H I L D R E N 2 0 0 8
Malaria 2003-2006*
% under- % underfives fives with
sleeping
fever
under a receiving
treated
antimosquito malarial
net
drugs
…TABLE 3
Gabon
Gambia
Georgia
Germany
Ghana
Greece
Grenada
Guatemala
Guinea
Guinea-Bissau
Guyana
Haiti
Holy See
Honduras
Hungary
Iceland
India
Indonesia
Iran (Islamic Republic of)
Iraq
Ireland
Israel
Italy
Jamaica
Japan
Jordan
Kazakhstan
Kenya
Kiribati
Korea, Democratic People’s
Republic of
Korea, Republic of
Kuwait
Kyrgyzstan
Lao People’s Democratic Republic
Latvia
Lebanon
Lesotho
Liberia
Libyan Arab Jamahiriya
Liechtenstein
Lithuania
Luxembourg
Madagascar
Malawi
Malaysia
Maldives
Mali
Malta
Marshall Islands
Mauritania
Mauritius
Mexico
Micronesia (Federated States of)
Moldova, Republic of
Monaco
Mongolia
Montenegro
Morocco
Mozambique
Myanmar
Namibia
% underfives with
diarrhoea
receiving
oral rehydration and
continued
feeding
% of population
using improved
drinking-water
sources
2004
% of population
using adequate
sanitation facilities
2004
total urban rural
total urban rural
total
% underfives with
suspected % underpneumonia fives with
%
1-year-old children immunized against:
taken to an suspected
newappropriate pneumonia
TB
DPT
Polio Measles HepB Hib
borns
health-care receiving
protected provider± antibiotics±
corresponding vaccines:
against
β
β
2000-2006*
BCG DPT1 DPT3 polio3 measles HepB3 Hib3 tetanusλ
2000-2006*
%
underfives
sleeping
under a
mosquito
net
88
82
82
100
75
95
95
50
59
83
54
87
99
100
86
77
94
81
100
93
100
97
86
61
65
95
95
96
100
88
97
99
78
79
83
52
95
100
100
95
87
99
97
100
100
98
100
99
97
83
77
47
77
67
100
64
93
92
35
49
83
56
81
98
100
83
69
84
50
100
88
100
91
73
46
53
36
53
94
100
18
96
86
18
35
70
30
69
95
100
33
55
79
80
100
93
72
43
40
37 30
72 46
96 91
100 100
27 11
96 97
90 82
31 11
57 23
86 60
57 14
87 54
100 85
100 100
59 22
73 40
95 48
100
91 69
100 100
94 87
87 52
46 41
59 22
100
35
71
100
40
100
100
100
100
87
100
100
100
100
100
100
80
100
89
99
95
99
88
96
90
87
96
75
90
99
78
82
99
91
93
90
95
99
92
99
69
95
99
96
87
96
87
93
99
85
95
83
95
99
97
78
88
99
83
97
98
97
86
99
99
99
90
98
38
95
87
90
84
88
91
80
71
77
93
53
87
99
97
55
70
99
60
91
95
96
85
99
98
99
80
86
31
95
88
96
84
87
91
81
70
74
92
52
87
99
97
58
70
99
63
91
93
97
86
97
98
99
77
86
55
95
95
94
85
88
98
95
67
60
90
58
91
99
95
59
72
99
60
86
95
87
87
99
99
99
77
61
38
95
83
86
84
88
91
80
93
87
6
70
99
75
95
96
87
98
99
80
88
95
94
84
88
91
80
93
87
99
97
91
96
95
87
98
80
-
63
94
87
69
91
79
91
31
94
86
83
87
89
52
72
86
74
-
48
69
99
59
64
42
57
78
31
56
69
61
93
82
75
78
71
49
-
61
33
42
3
54
82
52
32
-
44
38
29
22x
38
25
40
43
49
32
56
64
39
44
48
33
-
63
33
6x
12
73
74
32x
7x
15
-
49
22
1x
0
39
6
0x
0x
5
-
63
61
44
46
1
5
1
12x
1
1x
27
-
100
92
77
51
99
100
79
61
100
50
73
99
83
50
100
87
53
100
97
94
92
100
62
81
43
78
87
100
97
98
79
100
100
92
72
100
77
98
100
98
78
100
82
59
100
100
95
97
100
87
99
72
80
98
100
71
66
43
96
100
76
52
100
35
68
96
76
36
100
96
44
100
87
94
88
30
56
26
77
81
59
59
30
78
98
37
27
97
34
61
94
59
46
82
34
94
79
28
68
100
59
73
32
77
25
58
75
67
82
100
61
49
97
48
62
95
100
59
100
93
49
95
91
61
86
100
75
88
53
88
50
40
0
100
100
1
0
100
100
18
20
100
75
77
70
100
100
100
100
100
100
100
100
96
98
99
61
99
96
89
99
99
72
99
99
99
85
92
86
97
99
55
99
90
98
98
95
87
85
88
91
98
99
96
68
99
98
95
99
98
98
99
71
99
88
99
95
85
90
85
96
99
86
97
99
99
95
99
88
86
90
89
98
99
92
57
98
92
83
88
98
94
99
61
99
96
98
85
85
74
68
97
98
67
97
99
99
90
97
72
82
74
98
98
99
93
56
98
92
80
87
98
94
99
63
99
96
98
83
83
95
68
98
98
81
98
99
98
90
97
70
82
74
96
99
99
97
48
95
96
85
94
98
97
95
59
85
90
97
86
94
96
62
99
96
83
96
99
99
90
95
77
78
63
96
99
99
90
57
97
88
85
98
95
95
61
99
87
98
90
86
97
68
97
98
84
98
99
98
90
95
72
75
-
99
99
92
94
98
99
89
16
83
60
96
98
59
99
56
90
10
-
90
82
52
72
72
67
84
88
85
62
94
87
87
85
85
87
81
93
62
36
74
59
70
48
51
22
36
41
60
63
89
38
55
66
53
45
29
71
57
-
22
37
53
47
26
45
9
48
47
64
46
47
65
39
82x
11
30x
29
31
10
7x
18x
3
0x
23
2
-
9x
34
24
33
15
14x
60
51
20
71
87
32
7
96
26
61
93
42
39
58
8
94
41
14
52
37
52
19
72
13
% of routine
EPI
vaccines
financed by
government
2006
Immunization 2006
Malaria 2003-2006*
% under- % underfives fives with
sleeping
fever
under a receiving
treated
antimosquito malarial
net
drugs
S TAT I S T I C A L TA B L E S
123
TABLE 3. HEALTH
Nauru
Nepal
Netherlands
New Zealand
Nicaragua
Niger
Nigeria
Niue
Norway
Occupied Palestinian Territory
Oman
Pakistan
Palau
Panama
Papua New Guinea
Paraguay
Peru
Philippines
Poland
Portugal
Qatar
Romania
Russian Federation
Rwanda
Saint Kitts and Nevis
Saint Lucia
Saint Vincent and the Grenadines
Samoa
San Marino
Sao Tome and Principe
Saudi Arabia
Senegal
Serbia
Seychelles
Sierra Leone
Singapore
Slovakia
Slovenia
Solomon Islands
Somalia
South Africa
Spain
Sri Lanka
Sudan
Suriname
Swaziland
Sweden
Switzerland
Syrian Arab Republic
Tajikistan
Tanzania, United Republic of
Thailand
The former Yugoslav Republic
of Macedonia
Timor-Leste
Togo
Tonga
Trinidad and Tobago
Tunisia
Turkey
Turkmenistan
Tuvalu
124
% underfives with
diarrhoea
receiving
oral rehydration and
continued
feeding
% of population
using improved
drinking-water
sources
2004
% of population
using adequate
sanitation facilities
2004
% of routine
EPI
vaccines
financed by
government
2006
total urban rural
total urban rural
total
% underfives with
suspected % underpneumonia fives with
%
1-year-old children immunized against:
taken to an suspected
newappropriate pneumonia
TB
DPT
Polio Measles HepB Hib
borns
health-care receiving
protected provider± antibiotics±
corresponding vaccines:
against
β
β
2000-2006*
BCG DPT1 DPT3 polio3 measles HepB3 Hib3 tetanusλ
2000-2006*
%
underfives
sleeping
under a
mosquito
net
90
100
79
46
48
100
100
92
91
85
90
39
86
83
85
100
57
97
74
100
98
88
79
76
88
57
100
100
70
29
88
100
79
70
92
62
100
100
93
59
62
99
35
100
47
13
44
100
73
59
80
73
44
80
63
72
100
87
42
95
89
100
25
57
39
100
99
31
26
65
100
91
34
94
48
100
100
90
51
47
99
30
100
34
4
36
100
61
41
52
51
41
61
32
59
100
70
38
96
89
96
100
20
34
100
30
98
18
14
46
100
89
24
76
44
100
100
81
45
43
99
0
18
100
100
83
19
100
100
100
100
100
100
100
100
96
100
100
100
28
100
100
100
0
100
37
100
100
70
0
100
100
68
0
100
5
100
5
83
100
99
93
99
64
69
99
99
99
89
99
75
75
99
91
94
89
99
99
97
98
99
94
99
84
98
95
99
99
99
82
98
98
84
50
97
99
77
78
17
99
94
99
99
98
93
98
92
94
58
72
99
97
98
98
90
98
99
85
90
98
90
99
94
99
98
99
99
99
94
99
80
94
99
97
99
97
99
77
96
99
98
96
40
99
98
99
91
94
73
99
98
99
93
94
99
72
89
98
89
87
39
54
99
93
96
98
83
98
99
75
73
94
88
99
93
96
97
99
99
99
85
99
56
95
99
96
89
92
99
64
95
99
97
91
35
99
98
99
78
84
68
99
95
99
86
90
98
45
91
98
89
88
55
61
99
93
96
98
83
98
99
75
72
95
88
99
93
95
97
99
99
99
85
99
57
95
97
96
89
97
99
64
95
99
97
91
35
99
98
98
77
84
67
99
94
99
81
91
98
99
85
96
82
99
47
62
99
91
99
96
80
98
94
65
88
99
92
99
93
99
95
99
95
99
94
99
54
94
85
95
80
88
99
67
93
98
96
84
35
85
97
99
73
83
57
95
86
98
87
93
96
99
69
87
87
41
99
97
99
83
98
99
70
73
94
77
98
94
96
99
98
99
99
85
99
56
95
75
96
89
93
99
94
99
93
99
81
98
60
84
68
98
86
90
96
97
80
87
99
94
98
98
99
73
94
31
93
96
99
99
85
99
95
96
89
42
99
97
99
98
84
99
92
99
-
83
94
53
71
94
80
81
82
64
57
82
56
86
4
73
74
74
88
72
93
86
93
87
88
-
43
57
27
33
65
66x
75x
51x
68
55
28
47
47
93
48
13
75x
57
58
60
77
64
59
84
25
16x
29x
57
21
32
71
41
65
43
49
43
28
57
76
24
63
43
31
31
7
37x
38
43
24
34
22
53
46
15
6
16
53
14
20
18
23x
77x
0x
2
31
-
7
1
13
42
7
5
9
0x
3x
0x
1
16
-
2x
33
34
12
25
27
52
8
50x
26x
2
58
-
36 66 33
35 71 15
96 98 96
100 100 100
85 96 65
88 96 72
62 77 50
90 93 84
0
100
75
100
100
10
92
72
96
99
99
88
99
99
95
75
91
99
93
99
92
99
99
93
67
87
99
92
99
90
98
97
92
66
87
99
89
99
90
98
97
94
64
83
99
89
98
98
99
84
89
99 99
89 89
99
82
98
97
-
88
63
84
89
67
-
93
24
23
74
43
41
83
-
74
26
34
50
-
45
22
32
19x
25
-
48x
41
-
8x
38
-
47x
48
-
96
100
100
90
80
67
100
100
94
96
79
99
88
99
89
87
100
91
100
92
99
98
90
89
97
92
100
75
100
100
94
32
99
100
98
78
98
87
100
100
98
92
85
98
89
100
63
36
31
100
100
88
89
94
79
32
68
65
82
100
16
88
69
99
98
93
87
73
60
75
46
99
65
27
73
100
74
64
73
54
100
100
87
48
49
100
58 77 56
52 80 36
100 100 100
91 92 88
93 99 82
96 98 93
72 93 54
100 94 92
62
100
56
43
53
100
78
97
92
96
89
67
94
74
80
100
89
93
56
96
89
100
32
100
79
53
100
100
98
48
79
100
98
50
99
59
100
100
99
70
53
98
Immunization 2006
T H E S TAT E O F T H E W O R L D ’ S C H I L D R E N 2 0 0 8
Malaria 2003-2006*
% under- % underfives fives with
sleeping
fever
under a receiving
treated
antimosquito malarial
net
drugs
…TABLE 3
Uganda
Ukraine
United Arab Emirates
United Kingdom
United States
Uruguay
Uzbekistan
Vanuatu
Venezuela (Bolivarian Republic of)
Viet Nam
Yemen
Zambia
Zimbabwe
% of population
using improved
drinking-water
sources
2004
% of population
using adequate
sanitation facilities
2004
% of routine
EPI
vaccines
financed by
government
2006
total urban rural
total urban rural
total
% underfives with
suspected % underpneumonia fives with
%
1-year-old children immunized against:
taken to an suspected
newappropriate pneumonia
TB
DPT
Polio Measles HepB Hib
borns
health-care receiving
protected provider± antibiotics±
corresponding vaccines:
against
β
β
2000-2006*
BCG DPT1 DPT3 polio3 measles HepB3 Hib3 tetanusλ
60
96
100
100
100
100
82
60
83
85
67
58
81
43 54 41
96 98 93
98 98 95
100 100 100
100 100 99
67 78 61
50 78 42
68 71 48
61 92 50
43 86 28
55 59 52
53 63 47
8
99
100
100
64
100
80
100
85
0
85
97
98
99
98
92
83
95
70
94
99
89
98
97
97
99
99
96
90
78
94
92
94
95
80
98
94
92
96
95
95
85
71
94
85
80
90
81
99
94
92
92
95
94
85
73
94
85
80
90
89
98
92
85
93
94
95
99
55
93
80
84
90
80
96
92
92
95
97
85
71
93
85
80
90
80
11
94
92
94
95
71
85
80
-
88
87
52
88
61
90
80
67
68
72
71
47
69
50x
49
43
55
88
91
96
78
33
78
82
85
79
92
82
91
96
95
86
85
87
83
86
81
95
82
92
96
96
98
88
87
89
72
78
67
91
63
89
92
95
96
78
77
79
74
77
70
91
66
89
92
95
94
79
77
80
72
76
68
89
65
89
93
97
93
78
74
80
48
58
38
88
25
86
89
92
64
59
50
60
24
36
13
24
2
90
3
82
17
17
22
77
81
72
81
84
84
80
82
80
40
44
36
66
62
64**
57
56**
40
56**
87
99
100
100
100
100
95
86
85
99
71
90
98
56
91
100
100
100
100
75
52
70
80
65
40
72
Immunization 2006
56
-
% underfives with
diarrhoea
receiving
oral rehydration and
continued
feeding
Malaria 2003-2006*
2000-2006*
%
underfives
sleeping
under a
mosquito
net
29
28
51
65
18x
48
80x
22
94
27
7
10
5
23
3
62
3
58
5
30
32
29
38
35
61**
38**
37
38**
15
15
16
-
8
9
7
-
34
28
40
-
% under- % underfives fives with
sleeping
fever
under a receiving
treated
antimosquito malarial
net
drugs
SUMMARY INDICATORS
Sub-Saharan Africa
Eastern and Southern Africa
West and Central Africa
Middle East and North Africa
South Asia
East Asia and Pacific
Latin America and Caribbean
CEE/CIS
Industrialized countries§
Developing countries§
Least developed countries§
World
55 81 41
56 86 42
55 76 40
88 95 78
85 94 81
79 92 70
91 96 73
91 98 79
100 100 100
80 92 70
59 79 51
83 95 73
37 53
38 58
36 49
74 90
37 63
51 73
77 86
84 93
100 100
50 73
36 55
59 80
28
30
26
53
27
36
49
70
99
33
29
39
-
§ Also includes territories within each country category or regional group. Countries and territories in each country category or regional group are listed on page 148.
MAIN DATA SOURCES
DEFINITIONS OF THE INDICATORS
Government funding of vaccines – Percentage of vaccines that are routinely administered in a country to protect children and are financed by the national government (including loans).
EPI – Expanded programme on immunization: The immunizations in this programme include those against tuberculosis (TB), diphtheria, pertussis (whooping cough) and tetanus (DPT), polio
and measles, as well as vaccination of pregnant women to protect babies against neonatal tetanus. Other vaccines, e.g., against hepatitis B (HepB), Haemophilus influenzae type b (Hib) or
yellow fever, may be included in the programme in some countries.
BCG – Percentage of infants who received bacille Calmette-Guérin (vaccine against tuberculosis).
DPT1 – Percentage of infants who received their first dose of diphtheria, pertussis and tetanus vaccine.
DPT3 – Percentage of infants who received three doses of diphtheria, pertussis and tetanus vaccine.
HepB3 – Percentage of infants who received three doses of hepatitis B vaccine.
Hib3 – Percentage of infants who received three doses of Haemophilus influenzae type b vaccine.
% under-fives with suspected pneumonia receiving antibiotics – Percentage of children (aged 0-4) with suspected pneumonia in the two weeks preceding the survey who are receiving
antibiotics.
% under-fives with suspected pneumonia taken to an appropriate health-care provider – Percentage of children (aged 0-4) with suspected pneumonia in the two weeks preceding
the survey who were taken to an appropriate health-care provider.
% under-fives with diarrhoea receiving oral rehydration and continued feeding – Percentage of children (aged 0-4) with diarrhoea in the two weeks preceding the survey who
received either oral rehydration therapy (oral rehydration solutions or recommended home-made fluids) or increased fluids and continued feeding.
Malaria:
% under-fives sleeping under a mosquito net – Percentage of children (aged 0-4) who slept under a mosquito net.
% under-fives sleeping under a treated mosquito net – Percentage of children (aged 0-4) who slept under an insecticide-treated mosquito net.
% under-fives with fever receiving antimalarial drugs – Percentage of children (aged 0-4) who were ill with fever in the two weeks preceding the survey and received any appropriate
(locally defined) antimalarial drugs.
NOTES
x
*
β
±
λ
**
Use of improved drinking-water sources
and adequate sanitation facilities –
UNICEF, World Health Organization (WHO),
Multiple Indicator Cluster Surveys (MICS) and
Demographic and Health Surveys (DHS).
Government funding of vaccines – UNICEF
and WHO.
Immunization – UNICEF and WHO.
Suspected pneumonia – DHS, MICS and
other national household surveys.
Oral rehydration – DHS and MICS.
Malaria – DHS and MICS.
Data not available.
Data refer to years or periods other than those specified in the column heading, differ from the standard definition or refer to only part of a country. Such data are not included in the calculation of regional and global averages.
Data refer to the most recent year available during the period specified in the column heading.
Coverage for DPT1 should be at least as high as DPT3. Discrepancies where DPT1 coverage is less than DPT3 reflect deficiencies in the data collection and reporting process. UNICEF and WHO are working with national and
territorial systems to eliminate these discrepancies.
In this year’s report, as in last year’s, we use the term ‘suspected pneumonia’ instead of ‘acute respiratory infections (ARI)’, which was employed in previous editions. However, the data collection methodology has not
changed, and estimates presented here are comparable to those in previous reports. For a more detailed discussion regarding this update, please see the General note on the data on page 110.
In this year’s report, WHO and UNICEF have employed a model to calculate the percentage of births that can be considered to be protected against tetanus because pregnant women were given two doses or more of tetanus
toxoid (TT) vaccine. The model aims to improve the accuracy of this indicator by capturing or including other potential scenarios where women might be protected (e.g., women who receive doses of TT in supplemental
immunization activities). A fuller explanation of the methodology can be found in the General note on the data, page 110.
Excludes China.
S TAT I S T I C A L TA B L E S
125
TABLE 4. HIV/AIDS
Mother-to-child transmission
Countries and territories
Afghanistan
Albania
Algeria
Andorra
Angola
Antigua and Barbuda
Argentina
Armenia
Australia
Austria
Azerbaijan
Bahamas
Bahrain
Bangladesh
Barbados
Belarus
Belgium
Belize
Benin
Bhutan
Bolivia
Bosnia and Herzegovina
Botswana
Brazil
Brunei Darussalam
Bulgaria
Burkina Faso
Burundi
Cambodia
Cameroon
Canada
Cape Verde
Central African Republic
Chad
Chile
China
Colombia
Comoros
Congo
Congo, Democratic
Republic of the
Cook Islands
Costa Rica
Côte d’Ivoire
Croatia
Cuba
Cyprus
Czech Republic
Denmark
Djibouti
Dominica
Dominican Republic
Ecuador
Egypt
El Salvador
Equatorial Guinea
Eritrea
Estonia
Ethiopia
Fiji
Finland
France
Gabon
Gambia
126
Estimated
Estimated number of people
adult HIV
(all ages) living with HIV,
prevalence
2005 (thousands)
rate
(aged 15-49),
low
high
end-2005 estimate estimate - estimate
HIV prevalence
rate in young
Estimated
pregnant
number of
women
women
(aged 15-24)
(aged 15+)
living with in capital city
HIV, 2005
(thousands) year median
Prevention among young people
Paediatric
infections
Estimated
number of
children
(aged 0-14)
living with
HIV, 2005
(thousands)
% who
used
condom
at last
high-risk
sex,
2000-2006*
HIV prevalence
among young
people
(aged 15-24),
2005
% who
have
comprehensive
knowledge
of HIV,
2000-2006*
male
male female male female
female
Orphans
Children (aged 0-17)
orphaned Orphan
orphaned due to all
school
by AIDS, causes, attendance
2005
2005
ratio
estimate
estimate
(thousands) (thousands)
2000-2006*
<0.1
0.1
3.7
0.6
0.1
0.1
0.3
0.1
3.3
<0.1
1.5
0.3
0.3
2.5
1.8
<0.1
0.1
<0.1
24.1
0.5
<0.1
<0.1
2.0
3.3
1.6
5.4
0.3
10.7
3.5
0.3
0.1
0.6
<0.1
5.3
<1.0
19
320
130
2.9
16
12
5.4
6.8
<1.0
11
2.7
20
14
3.7
87
<0.5
7.0
<0.5
270
620
<0.1
<0.5
150
150
130
510
60
250
180
28
650
160
<0.5
120
<2.0
<1.0
9.0 - 59
200 - 450
80 - 220
1.8 - 5.8
9.7 - 27
7.2 - 20
2.6 - 17
3.3 - 22
<2.0
6.4 - 18
1.5 - 4.2
11 - 47
8.1 - 22
2.0 - 5.7
57 - 120
<2.0
3.8 - 17
<1.0
260 - 350
370 - 1000
<0.2
<1.0
120 - 190
130 - 180
74 - 210
460 - 560
48 - 72
110 - 390
88 - 300
17 - 56
390 - 1100
100 - 320
<1.0
75 - 160
<0.1
4.1
170
36
<1.0
<1.0
2.3
<1.0
3.8
1.4
<1.0
5.1
5.4
1.0
45
<0.1
1.9
140
220
<0.1
80
79
59
290
9.6
130
90
7.6
180
45
<0.1
61
2004
2.8
2003 1.7 - 2.1
2005
33.5
2005
1.8
2004
8.6
2002
2.7
2002
7.0
2002
14.0
2005
3.6
2002
3.0
35
<0.5
<0.1
<0.1
9.8
14
17
20
43
24
16
<0.1
15
0.9
0.4
5.7
0.5
0.8
0.1h
1.4h
2.5
0.9
<0.1
1.2
2.5
1.1
15.3
1.4
2.3
0.3h
4.8h
7.3
2.2
<0.1
3.7
15
14
18
33
67
15
23
45
34
20
22
6
13
23
2
16
34
8
15
48
40
67
17
19r
30
50
32r
17
8
10
10
86
44
37
88
71
70
67
84
57
25
38
17
20
71
75
58
57
64r
25
62r
41
17
30
20
160
62
120
120
120
240
140
57
110
1600
1200
690
8
4400
3
5
370
78
310
150
3700
4
710
600
470
1000
330
600
200
20600
870
33
270
90
74
99
71
86
80
87
96
105
59
90
3.2
0.3
7.1
<0.1
0.1
0.1
0.2
3.1
1.1
0.3
<0.1
0.9
3.2
2.4
1.3
0.1
0.1
0.4
7.9
2.4
1000
7.4
750
<0.5
4.8
<0.5
1.5
5.6
15
66
23
5.3
36
8.9
59
10
<1.0
1.9
130
60
20
560 - 1500
3.6 - 24
470 - 1000
<1.0
2.3 - 15
<1.0
0.9 - 2.5
3.4 - 9.3
3.9 - 34
56 - 77
11 - 74
2.9 - 13
22 - 72
7.3 - 11
33 - 95
4.8 - 32
420 - 1300
0.3 - 2.1
1.1 - 3.1
78 - 210
40 - 87
10 - 33
520
2.0
400
2.6
<1.0
1.3
8.4
31
12
<1.0
9.9
4.7
31
2.4
<0.5
<1.0
45
33
11
2003
2002
2002
2003
-
120
74
1.2
3.6
<1.0
6.6
3.9
1.2
0.8
0.3h
0.7
0.4h
0.7
0.6
0.3h
1.8
0.6
2.2
2.4h
2.1
0.7h
2.3
1.6
1.2h
5.4
1.7
28
22
33
22
-
18
52
18
36
4
4
37
21
24
39
53
50
52
50
48
-
39
26
29
28
33
54
680
450
6
5
36
20
4
4200
44
1400
120
48
220
230
150
29
280
4800
25
65
64
72
121
82
93
95
83
60
98
87
3.2
5.2
5.2
11.5
-
T H E S TAT E O F T H E W O R L D ’ S C H I L D R E N 2 0 0 8
…TABLE 4
Mother-to-child transmission
Estimated
Estimated number of people
adult HIV
(all ages) living with HIV,
prevalence
2005 (thousands)
rate
(aged 15-49),
low
high
end-2005 estimate estimate - estimate
Georgia
Germany
Ghana
Greece
Grenada
Guatemala
Guinea
Guinea-Bissau
Guyana
Haiti
Holy See
Honduras
Hungary
Iceland
India#
Indonesia
Iran (Islamic Republic of)
Iraq
Ireland
Israel
Italy
Jamaica
Japan
Jordan
Kazakhstan
Kenya
Kiribati
Korea, Democratic
People’s Republic of
Korea, Republic of
Kuwait
Kyrgyzstan
Lao People’s Democratic
Republic
Latvia
Lebanon
Lesotho
Liberia
Libyan Arab Jamahiriya
Liechtenstein
Lithuania
Luxembourg
Madagascar
Malawi
Malaysia
Maldives
Mali
Malta
Marshall Islands
Mauritania
Mauritius
Mexico
Micronesia
(Federated States of)
Moldova, Republic of
Monaco
Mongolia
Montenegro
Morocco
Mozambique
Myanmar
Namibia
Nauru
Nepal
HIV prevalence
rate in young
Estimated
pregnant
number of
women
women
(aged 15-24)
(aged 15+)
living with in capital city
HIV, 2005
(thousands) year median
Prevention among young people
Paediatric
infections
Estimated
number of
children
(aged 0-14)
living with
HIV, 2005
(thousands)
% who
used
condom
at last
high-risk
sex,
2000-2006*
HIV prevalence
among young
people
(aged 15-24),
2005
% who
have
comprehensive
knowledge
of HIV,
2000-2006*
male
male female male female
female
0.2
0.1
2.3
0.2
0.9
1.5
3.8
2.4
3.8
1.5
0.1
0.2
0.9
0.1
0.2
0.2
0.5
1.5
<0.1
0.1
6.1
-
5.6
49
320
9.3
61
85
32
12
190
63
3.2
<0.5
2500
170
66
5.0
4.0
150
25
17
<1.0
12
1300
-
2.7 - 18
29 - 81
270 - 380
5.6 - 15
37 - 100
69 - 100
18 - 50
4.7 - 23
120 - 270
35 - 99
1.9 - 5.3
<1.0
2000 - 3100
100 - 290
36 - 160
3.0 - 8.3
2.2 - 9.8
90 - 250
14 - 39
10 - 29
<2.0
11 - 77
1100 - 1500
-
<1.0
15
180
2.0
16
53
17
6.6
96
16
<1.0
<0.1
1600
29
11
1.8
50
6.9
9.9
6.8
740
-
2003
2004
2000
-
3.9
4.4
3.7
-
25
7.0
3.2
<1.0
17
2.4
<0.5
150
-
0.1h
0.6h
0.9
0.6h
1.3h
-
1.2h
1.2h
2.5
1.5h
5.9h
-
<0.1
0.1
13
<1.0
4.0
7.9 - 25
<2.0
1.9 - 13
7.4
<1.0
-
-
-
-
-
0.1
0.8
0.1
23.2
0.2
0.2
0.5
14.1
0.5
1.7
0.1
0.7
0.6
0.3
3.7
10
2.9
270
3.3
<1.0
49
940
69
130
<0.5
12
4.1
180
1.8 - 12
6.1 - 17
1.4 - 9.2
250 - 290
1.6 - 10
<1.0
16 - 110
480 - 1400
33 - 220
96 - 160
<1.0
7.3 - 23
1.9 - 13
99 - 440
<1.0
2.2
<1.0
150
<1.0
13
500
17
66
6.3
<1.0
42
2004
2001
2002
-
27.3
15.0
2.5
-
18
1.6
91
16
1.1
-
6.0h
0.6
2.1h
0.4
0.2
-
1.1
<0.1
0.1
16.1
1.3
19.6
0.5
29
<0.5
19
1800
360
230
75
15 - 69
<2.0
12 - 38
1400 - 2200
200 - 570
110 - 360
41 - 180
16
<0.1
4.0
960
110
130
16
2002
2004
-
14.7
7.5
-
140
17
-
3.6
4.4
-
Orphans
Children (aged 0-17)
orphaned Orphan
orphaned due to all
school
by AIDS, causes, attendance
2005
2005
ratio
estimate
estimate
(thousands) (thousands)
2000-2006*
44
23
47
40
43
47
-
34r
17
18
53
32
30
24
7
3
60
22
34
-
52
37
68
43
37
65
47
-
42r
26
39
62
29
24
22
32
25
-
170
28
11
1100
-
1000
370
370
100
26
490
180
25700
5300
1500
55
2300
-
-
20
-
56
-
450
-
-
15.4h
0.3
9.1h
1.2
0.5
-
18
16
36
15
-
26
19
41r
9
-
53
12
47
35
-
53
5
40r
17
-
97
13
550
94
7
-
290
150
250
900
950
480
710
170
23
1600
95
76
96
104
-
10.7
13.4
-
54
33
41
44
42
35
30
12
20
31
28
63
33
69
78
44
66
29
48
-
510
85
-
79
1500
1700
140
970
96
80
92
-
S TAT I S T I C A L TA B L E S
79p
98
73
97
86
84
82
84
101
98
95
-
127
TABLE 4. HIV/AIDS
Mother-to-child transmission
Estimated
Estimated number of people
adult HIV
(all ages) living with HIV,
prevalence
2005 (thousands)
rate
(aged 15-49),
low
high
end-2005 estimate estimate - estimate
Netherlands
New Zealand
Nicaragua
Niger
Nigeria
Niue
Norway
Occupied Palestinian
Territory
Oman
Pakistan
Palau
Panama
Papua New Guinea
Paraguay
Peru
Philippines
Poland
Portugal
Qatar
Romania
Russian Federation
Rwanda
Saint Kitts and Nevis
Saint Lucia
Saint Vincent and the
Grenadines
Samoa
San Marino
Sao Tome and Principe
Saudi Arabia
Senegal
Serbia
Seychelles
Sierra Leone
Singapore
Slovakia
Slovenia
Solomon Islands
Somalia
South Africa
Spain
Sri Lanka
Sudan
Suriname
Swaziland
Sweden
Switzerland
Syrian Arab Republic
Tajikistan
Tanzania, United Republic of
Thailand
The former Yugoslav
Republic of Macedonia
Timor-Leste
Togo
Tonga
Trinidad and Tobago
Tunisia
Turkey
Turkmenistan
Tuvalu
Uganda
Ukraine
128
HIV prevalence
rate in young
Estimated
pregnant
number of
women
women
(aged 15-24)
(aged 15+)
living with in capital city
HIV, 2005
(thousands) year median
Prevention among young people
Paediatric
infections
Estimated
number of
children
(aged 0-14)
living with
HIV, 2005
(thousands)
% who
used
condom
at last
high-risk
sex,
2000-2006*
HIV prevalence
among young
people
(aged 15-24),
2005
% who
have
comprehensive
knowledge
of HIV,
2000-2006*
male
male female male female
female
Orphans
Children (aged 0-17)
orphaned Orphan
orphaned due to all
school
by AIDS, causes, attendance
2005
2005
ratio
estimate
estimate
(thousands) (thousands)
2000-2006*
0.2
0.1
0.2
1.1
3.9
0.1
18
1.4
7.3
79
2900
2.5
11 - 29
0.8 - 2.3
3.9 - 18
39 - 130
1700 - 4200
1.5 - 4.1
5.9
1.7
42
1600
<1.0
-
-
8.9
240
-
0.1h
0.9
-
0.5h
2.7
-
16
21
-
13
18
-
37
46
-
17
18
24
-
46
930
-
130
800
8600
-
64p
-
0.1
0.9
1.8
0.4
0.6
<0.1
0.1
0.4
<0.1
1.1
3.1
-
85
17
60
13
93
12
25
32
7.0
940
190
-
46 - 210
11 - 34
32 - 140
6.2 - 41
56 - 150
7.3 - 20
15 - 41
19 - 53
3.4 - 22
560 - 1600
180 - 210
-
14
4.3
34
3.5
26
3.4
7.5
1.3
210
91
-
2003
-
10.3
-
27
-
0.4h
-
1.5h
-
3
54
-
6
51
-
40
-
32
26
-
210
-
4400
53
350
150
660
2000
820
-
85p
82
-
0.9
1.6
0.3
<0.1
<0.1
0.9
18.8
0.6
<0.1
1.6
1.9
33.4
0.2
0.4
0.1
6.5
1.4
61
48
5.5
<0.5
<0.5
44
5500
140
5.0
350
5.2
220
8.0
17
4.9
1400
580
29 - 100
27 - 73
3.1 - 14
<1.0
<1.0
23 - 81
4900 - 6100
84 - 230
3.0 - 8.3
170 - 580
2.8 - 8.1
150 - 290
4.8 - 13
9.9 - 27
2.4 - 16
1300 - 1600
330 - 920
33
26
1.5
23
3100
32
<1.0
180
1.4
120
2.5
5.9
<0.5
710
220
2005
2003
2004
2004
2003
-
0.9
3.2
25.2
37.3
8.2
-
5.0
5.2
4.5
240
30
<0.1
15
110
16
0.2h
0.4
0.2
4.4h
7.7
3.0h
-
0.6h
1.1
0.6
16.9h
22.7
4.0h
-
24
52
40
-
44
19
42
17
4
41
52
7
2
45
46
52
70
46
-
56
36
74
20
49
54
34
-
25
31
23
1200
63
1100
-
560
340
26
630
2500
310
1700
10
95
2400
1200
109
83p
83
87
96
97
97
106
102
99
<0.1
3.2
2.6
0.1
<0.1
6.7
1.4
<0.5
110
27
8.7
<2.0
<0.5
1000
410
<1.0
65 - 160
15 - 42
4.7 - 21
<5.0
<1.0
850 - 1200
250 - 680
61
15
1.9
520
200
2004
2005
-
9.3
5.2
-
9.7
<1.0
110
-
0.8
1.1h
-
2.2
4.3h
-
35
-
27
28
54
5
30
28
55
-
70
50
51
53
-
88
1000
-
280
28
2300
-
94
101
94
98
T H E S TAT E O F T H E W O R L D ’ S C H I L D R E N 2 0 0 8
…TABLE 4
Prevention among young people
Mother-to-child transmission
Estimated
Estimated number of people
adult HIV
(all ages) living with HIV,
prevalence
2005 (thousands)
rate
(aged 15-49),
low
high
end-2005 estimate estimate - estimate
United Arab Emirates
United Kingdom
United States
Uruguay
Uzbekistan
Vanuatu
Venezuela (Bolivarian
Republic of)
Viet Nam
Yemen
Zambia
Zimbabwe
HIV prevalence
rate in young
Estimated
pregnant
number of
women
women
(aged 15-24)
(aged 15+)
living with in capital city
HIV, 2005
(thousands) year median
Paediatric
infections
Estimated
number of
children
(aged 0-14)
living with
HIV, 2005
(thousands)
% who
used
condom
at last
high-risk
sex,
2000-2006*
HIV prevalence
among young
people
(aged 15-24),
2005
% who
have
comprehensive
knowledge
of HIV,
2000-2006*
male
male female male female
female
0.2
0.6
0.5
0.2
-
68
1200
9.6
31
-
41 - 110
720 - 2000
4.6 - 30
15 - 99
-
21
300
5.3
4.1
-
-
-
-
-
0.7
0.5
17.0
20.1
110
260
1100
1700
54 - 350
150 - 430
1100 - 1200
1100 - 2200
31
84
570
890
2004
2004
20.7
18.6
130
160
0.8h
3.0h
4.2h
24500
17500
6900
510
5900
2300
1900
1500
2000
35100
11700
38600
21600 - 27400
15800 - 19200
5300 - 8700
320 - 830
3600 - 9700
1800 - 3200
1500 - 2800
1000 - 2300
1400 - 3000
30300 - 41900
10100 - 13500
33400 - 46000
13200
9400
3700
210
1600
750
640
450
530
16400
6000
17300
-
9.7
13.5
4.0
7.5
-
2000
1400
650
33
130
50
54
9
13
2300
1100
2300
1.4
2.1
0.7
1.1
-
-
Orphans
Children (aged 0-17)
orphaned Orphan
orphaned due to all
school
by AIDS, causes, attendance
2005
2005
ratio
estimate
estimate
(thousands) (thousands)
2000-2006*
7
-
31r
-
50
-
61r
-
-
55
-
-
0h
11.1h
11.0h
50
46
46
42r
41
44
68
38
68
26
42
710
1100
480
1800
1200
1400
84
103
95
4.3
6.2
2.3
2.9
-
31
37
24
43
-
25
31
19
23
25
24
25
47
46
47
38
-
31
32
31
22
47
-
12000
8700
3300
15200
46600
24300
22200
37500
34800
10700
132700
80
84
76
84
82
-
SUMMARY INDICATORS
Sub-Saharan Africa
Eastern and Southern Africa
West and Central Africa
Middle East and North Africa
South Asia#
East Asia and Pacific
Latin America and Caribbean
CEE/CIS
Industrialized countries§
Developing countries§
Least developed countries§
World
6.1
8.6
3.5
0.2
0.7
0.2
0.6
0.6
0.4
1.1
2.7
1.0
§ Also includes territories within each country category or regional group. Countries and territories in each country category or regional group are listed on page 148.
DEFINITIONS OF THE INDICATORS
Estimated adult HIV prevalence rate – Percentage of adults (aged 15-49) living with HIV as of end-2005.
Estimated number of people (all ages) living with HIV – Estimated number of people (all ages) living with
HIV as of end-2005.
Estimated number of women (aged 15+) living with HIV – Estimated number of women (aged 15+) living
with HIV as of end-2005.
HIV prevalence rate in young pregnant women (aged 15-24) in capital city – Percentage of blood
samples taken from pregnant women (aged 15-24) who test positive for HIV during ‘unlinked anonymous’
sentinel surveillance at selected antenatal clinics.
Estimated number of children (aged 0-14) living with HIV – Estimated number of children (aged 0-14)
living with HIV as of end-2005.
HIV prevalence among young men and women – Percentage of young men and women (aged 15-24) living
with HIV as of end-2005.
Comprehensive knowledge of HIV – Percentage of young men and women (aged 15-24) who correctly
identify the two major ways of preventing the sexual transmission of HIV (using condoms and limiting sex to
one faithful, uninfected partner), who reject the two most common local misconceptions about HIV
transmission and who know that a healthy-looking person can be HIV-infected.
Condom use at last high-risk sex – Percentage of young men and women (aged 15-24) who say they used a
condom the last time they had sex with a non-marital, non-cohabiting partner, of those who have had sex with
such a partner during the past 12 months.
Children orphaned by AIDS – Estimated number of children (aged 0-17) as of end-2005 who have lost one or
both parents to AIDS.
Children orphaned due to all causes – Estimated number of children (aged 0-17) as of end-2005 who have
lost one or both parents due to any cause.
Orphan school attendance ratio – Percentage of children (aged 10-14) who have lost both biological parents
and who are currently attending school as a percentage of non-orphaned children of the same age who live
with at least one parent and who are attending school.
NOTES
*
p
#
r
h
MAIN DATA SOURCES
Estimated adult HIV prevalence rate – Joint United Nations Programme on HIV/AIDS
(UNAIDS), Report on the Global AIDS Epidemic, 2006.
Estimated number of people (all ages) living with HIV – UNAIDS, Report on the
Global AIDS Epidemic, 2006.
Estimated number of women (aged 15+) living with HIV – UNAIDS, Report on the
Global AIDS Epidemic, 2006.
HIV prevalence rate in young pregnant women (aged 15-24) in capital city –
UNAIDS, Report on the Global AIDS Epidemic, 2006.
Estimated number of children (aged 0-14) living with HIV – UNAIDS, Report on the
Global AIDS Epidemic, 2006.
HIV prevalence among young men and women – UNAIDS, Report on the Global
AIDS Epidemic, 2006, AIDS Indicator Surveys (AIS), Demographic and Health Surveys
(DHS), 2001-2006.
Comprehensive knowledge of HIV – AIS, Behavioural Surveillance Surveys (BSS), DHS,
Multiple Indicator Cluster Surveys (MICS) and Reproductive Health Surveys (RHS),
2000-2006; ‘HIV/AIDS Survey Indicators Database’, <www.measuredhs.com/hivdata>.
Condom use at last high-risk sex – AIS, BSS, DHS and RHS, 2000-2006; ‘HIV/AIDS
Survey Indicators Database’, <www.measuredhs.com/hivdata>.
Children orphaned by AIDS – UNAIDS, UNICEF and United States Agency for
International Development (USAID), Africa’s Orphaned and Vulnerable Generations, 2006.
Children orphaned due to all causes – UNAIDS, UNICEF and USAID, Africa’s
Orphaned and Vulnerable Generations, 2006.
Orphan school attendance ratio – AIS, DHS and MICS, 2000-2006; ‘HIV/AIDS Survey
Indicators Database’, <www.measuredhs.com/hivdata>.
Data not available.
Data refer to the most recent year available during the period specified in the column heading.
Proportion of orphans (aged 10-14) attending school is based on small denominators (typically 25-49 unweighted cases).
The revised adult HIV prevalence data for India were not available at the time of publication; India's most recent data on the ‘Estimated number of people (all ages) living with HIV’
are excluded from the regional summaries.
Refers to year of female data more recent than male.
Data are from DHS and AIS conducted between 2001 and 2006.
S TAT I S T I C A L TA B L E S
129
TABLE 5. EDUCATION
Number per 100
population
2005
Countries and territories
Afghanistan
Albania
Algeria
Andorra
Angola
Antigua and Barbuda
Argentina
Armenia
Australia
Austria
Azerbaijan
Bahamas
Bahrain
Bangladesh
Barbados
Belarus
Belgium
Belize
Benin
Bhutan
Bolivia
Bosnia and Herzegovina
Botswana
Brazil
Brunei Darussalam
Bulgaria
Burkina Faso
Burundi
Cambodia
Cameroon
Canada
Cape Verde
Central African Republic
Chad
Chile
China
Colombia
Comoros
Congo
Congo, Democratic
Republic of the
Cook Islands
Costa Rica
Côte d’Ivoire
Croatia
Cuba
Cyprus
Czech Republic
Denmark
Djibouti
Dominica
Dominican Republic
Ecuador
Egypt
El Salvador
Equatorial Guinea
Eritrea
Estonia
Ethiopia
Fiji
Finland
France
130
Youth (15-24 years)
literacy rate
2000-2006*
phones Internet
male
female
users
Primary school enrolment ratio
2000-2006*
gross
net
Primary school
attendance
ratio
(2000-2006*)
net
% of primary school
entrants reaching
grade 5
2000-2006*
gross
net
Secondary school
attendance
ratio
(2000-2006*)
net
male
female
male
female
male
male
female
male
female
male
female
51
99
94
84
99
100
100x
97
67
100x
76x
59
99
100
92
96
99
98
40
77
88
96
70
56
99
99
98
98
18
100
86
63
99
100
100x
97
60
100x
77x
33
96
100
96
98
99
98
27
70
79
97
47
23
99
99
98
97
4
60
49
149
11
150
82
30
142
152
40
112
130
7
127
76
135
57
11
9
33
66
54
68
85
113
5
2
8
14
117
32
3
2
90
57
65
4
13
1
6
6
33
1
36
18
5
70
49
8
32
21
0
59
35
46
14
6
3
5
21
3
21
36
21
0
1
0
2
68
6
0
0
29
8
10
3
1
108
106
116
89
69x
113
92
104
106
97
101
105
107
108
103
104
130
107
113
107
146
108
103
64
91
139
126
100
111
67
92
106
114
113
91
91
64
105
107
85
59x
112
96
104
106
96
101
104
111
108
100
104
125
85
113
105
135
107
102
51
78
129
107
99
105
44
62
101
112
111
80
84
94
98
82
99
77
96
96
85
90
97
93
98
91
99
93
86
80
94
85
95
93
94
50
63
93
99
91
44
72
91
99
87
80
40
94
95
79
98
81
97
98
84
92
97
96
98
88
99
96
70
79
96
84
95
94
93
40
58
90
100
89
37
50
89
99
87
65
48
66
92
97
58
99
91
86
79
93
60
74
78
92
83
95
49
72
73
86
97
64
41
90
31
86
40
92
96
59
98
91
87
84
94
47
67
77
89
86
95
44
70
76
81
96
54
31
92
31
87
90y
96
97
99y
98y
99
99
65
98
99y
91
52
93
85
91
81y
100
92y
76
67
56
64
93
78
33
100
81
80
66
92
9
95
75
100
99
99
94
100
92
50
100
96y
84x,y
91
87
95
91
73
64y
89
25
95
24
79
80
84
19
83
87
152
105
84
90
96
47
113
95
112
84
41
90
72
101
94
106
16
16
35
49
119
65
23
90
74
74
40
42
8
77
86
93
15
89
89
145
100
81
91
102
48
113
96
108
85
23
87
75
111
98
101
12
12
24
39
116
70
8
91
75
82
30
35
75
65
73
76
83
86
79
83
87
44
96
88
97
71
23
73
57
75
85
89
13
27
55
13
16
53
-
73
68
80
82
86
87
76
85
93
45
97
89
98
72
11
72
62
81
90
87
9
22
60
9
5
58
-
18
79
57
22
93
87
77
36
95
19
57
89
36
42x
17
8
24
45
16
13
64
10
39
6
77
65
20
95
84
85
41
97
12
56
89
44
50x
15
6
21
42
10
7
72
11
42
78
97
71
100
100
100
93
96
90
87
95
100
62
-
63
98
52
100
100
100
95
97
79
90
95
100
39
-
5
58
14
122
9
136
147
162
8
88
51
60
34
49
21
2
142
1
37
141
135
0
21
1
32
2
39
27
53
1
17
7
7
9
1
2
52
0
8
53
43
69
83
110
80
95
104
101
102
98
44
93
116
117
104
115
117
71
102
107
107
100
112
54
81
109
63
94
99
101
100
99
36
92
110
117
97
111
111
57
99
94
105
99
110
78
91
62
88
98
99
91
95
37
83
87
97
96
93
85
51
95
71
97
98
99
77
93
50
87
96
99
93
96
30
85
88
98
91
93
77
43
95
66
96
98
99
55
87
66
80
84
96
61
69
45
-
49
89
57
78
88
94
60
64
45
-
87
88
100y
97
99
98
93
77x
93
86
76
95
69
33
79
99
68y
99
100
98x
54
92
99y
96
91
99
72y
82y
78
-
28
72
77
32
88
94
96
95
122
29
109
64
61
89
62
38
40
100
41
85
108
116
16
73
82
18
89
94
98
97
126
19
106
78
61
82
64
22
23
101
28
91
113
116
62
58
26
84
87
93
91
27
92
47
52
85
52
30
90
38
80
95
98
68
64
15
86
88
95
93
18
92
59
53
79
54
20
93
26
85
95
100
18
59
32
50
27
72
23
23
30
-
15
65
22
42
39
67
22
21
23
-
T H E S TAT E O F T H E W O R L D ’ S C H I L D R E N 2 0 0 8
female admin. data
Secondary school enrolment ratio
2000-2006*
survey data
…TABLE 5
Number per 100
population
2005
Youth (15-24 years)
literacy rate
2000-2006*
phones Internet
male
female
users
Gabon
Gambia
Georgia
Germany
Ghana
Greece
Grenada
Guatemala
Guinea
Guinea-Bissau
Guyana
Haiti
Holy See
Honduras
Hungary
Iceland
India
Indonesia
Iran (Islamic Republic of)
Iraq
Ireland
Israel
Italy
Jamaica
Japan
Jordan
Kazakhstan
Kenya
Kiribati
Korea, Democratic
People’s Republic of
Korea, Republic of
Kuwait
Kyrgyzstan
Lao People’s
Democratic Republic
Latvia
Lebanon
Lesotho
Liberia
Libyan Arab Jamahiriya
Liechtenstein
Lithuania
Luxembourg
Madagascar
Malawi
Malaysia
Maldives
Mali
Malta
Marshall Islands
Mauritania
Mauritius
Mexico
Micronesia
(Federated States of)
Moldova, Republic of
Monaco
Mongolia
Montenegro
Morocco
Mozambique
Primary school enrolment ratio
2000-2006*
gross
net
Primary school
attendance
ratio
(2000-2006*)
net
Secondary school enrolment ratio
2000-2006*
% of primary school
entrants reaching
grade 5
2000-2006*
female admin. data
gross
net
Secondary school
attendance
ratio
(2000-2006*)
net
male
female
male
female
male
male
female
male
female
male
female
97
76
99
86
59
87
84
99
98
89
100
99
100x
80
-
95
66
99
78
34
91
68
99
97
81
100
99
100x
81
-
50
19
39
162
14
149
72
46
3
8
52
8
25
126
169
13
27
38
6
152
155
167
118
121
66
55
14
-
5
4
6
43
2
18
19
8
1
2
21
7
4
30
62
5
7
11
0
34
24
48
46
67
13
4
3
2
130
79
93
101
94
101
94
118
88
84
133
113
99
101
123
119
100
108
108
109
103
95
100
96
110
114
111
129
84
94
101
93
101
91
109
74
56
131
113
97
98
116
115
122
89
106
110
102
94
100
96
108
110
113
77
78
93
96
69
99
84
96
70
53
90
90
100
92
97
91
94
96
97
99
90
100
88
92
78
96
77
77
93
96
70
99
83
92
61
38
92
88
97
86
94
100
81
96
98
98
90
100
90
90
79
98
94
60
99y
75
80
55
54
96
48
77
84
94
94
91
97
99
99
79
-
94
62
100y
75
76
48
53
96
51
80
85
95
91
80
98
99
98
79
-
69
98y
99y
63
99
79
68
76
64
70
98y
100
73
90
88
81
100
100
100
90
96
100y
83
82
91y
97
90
73x,y
97
80
97
89
83
95y
96y
95
99
99y
100
98
-
49
51
82
101
50
103
99
54
39
23
101
59
97
107
63
64
83
54
108
93
100
86
102
87
100
50
82
42
42
83
99
43
101
102
49
21
13
103
73
96
109
50
63
78
36
118
92
99
89
102
88
97
48
93
49
81
40
90
78
35
31
11
90
87
59
79
44
85
89
92
77
99
77
92
42
65
41
81
36
92
80
32
17
6
90
89
58
75
31
91
89
93
80
100
80
91
42
71
34
39
45
23x
27
8
66
18
29
64
54
46
88
85
97
12
-
36
34
45
24x
17
7
73
21
36
58
56
34
92
89
97
13
-
100
100x
100
100x
135
108
19
68
26
5
105
99
98
104
97
97
100
87
87
99
86
86
91
93
99
99y
97y
99
96
92
86
96
98
87
94
76
80
94
80
81
90
92
83
100
65
100
100
59
82x
97
98
32x
94x
68
94
98
75
100
70
97
100
57
71x
97
98
17x
98x
56
95
98
12
113
46
17
20
137
150
207
3
4
92
8
131
9
26
81
62
0
45
20
3
4
63
26
68
1
0
42
1
32
1
24
17
123
94
108
132
115
106
106
95
100
141
121
96
95
74
101
105
93
102
110
108
90
105
132
83
105
107
95
100
136
124
96
93
59
95
101
94
102
108
86
86
93
84
74
87
89
95
93
92
96
79
56
88
90
72
94
98
81
89
92
89
58
89
89
95
92
97
95
79
45
84
89
72
96
98
81
97
82
74
86
45
46
97
77
97
88
77
88
33
42
97
63
98y
93
73
98y
92
43
42
98
92
87
99
57
97
94
92
96
91
93
87
93
69y
-
53
98
85
34
37
96
120
97
91
14x
31
72
68
29
98
75
22
89
78
40
99
93
43
27
115
104
96
97
14x
25
81
78
18
101
78
19
88
83
41
19
22
62
91
79
11x
25
71
60
84
72
17
81
64
35
30
12
69
91
85
11x
22
81
66
83
77
14
82
66
40
61
16
17
27
15
15
-
33
68
27
21
26
11
9
-
100
97
81
60x
100
98
61
37x
24
48
145
27
45
8
13
13
51
10
15
1
116
93
92
98
111
111
113
92
94
98
99
94
86
83
89
81
86
85
83
74
84
96
98
91
63
85
98
97
87
57
91y
91y
79
62
100
96
97
86y
84
83
80
86
88
54
16
88
83
98
89
46
11
75
79
38
8
77
90
32
6
82
85
90
39
8
85
91
92
36
7
survey data
S TAT I S T I C A L TA B L E S
131
TABLE 5. EDUCATION
Number per 100
population
2005
Youth (15-24 years)
literacy rate
2000-2006*
phones Internet
male
female
users
Myanmar
Namibia
Nauru
Nepal
Netherlands
New Zealand
Nicaragua
Niger
Nigeria
Niue
Norway
Occupied Palestinian Territory
Oman
Pakistan
Palau
Panama
Papua New Guinea
Paraguay
Peru
Philippines
Poland
Portugal
Qatar
Romania
Russian Federation
Rwanda
Saint Kitts and Nevis
Saint Lucia
Saint Vincent
and the Grenadines
Samoa
San Marino
Sao Tome and Principe
Saudi Arabia
Senegal
Serbia
Seychelles
Sierra Leone
Singapore
Slovakia
Slovenia
Solomon Islands
Somalia
South Africa
Spain
Sri Lanka
Sudan
Suriname
Swaziland
Sweden
Switzerland
Syrian Arab Republic
Tajikistan
Tanzania, United Republic of
Thailand
The former Yugoslav
Republic of Macedonia
Timor-Leste
Togo
Tonga
Trinidad and Tobago
Tunisia
Turkey
132
Primary school enrolment ratio
2000-2006*
gross
net
Primary school
attendance
ratio
(2000-2006*)
net
% of primary school
entrants reaching
grade 5
2000-2006*
gross
net
male
female
male
female
male
male
female
male
female
96
91
81
84
52
87
99
98
77
97
69
96
98
94
100
95
98
100
79
-
93
94
60
89
23
81
99
97
53
96
64
96
96
97
100
98
98
100
77
-
1
31
3
144
131
23
2
15
149
39
62
12
67
2
36
28
45
106
149
119
82
112
3
83
-
0
4
1
74
68
2
0
4
58
7
11
7
6
2
3
16
5
26
27
28
22
15
1
34
99
99
84
129
108
102
113
54
111
78
98
89
81
99
108
113
80
106
113
113
98
117
107
108
129
119
97
111
101
100
83
123
106
102
110
39
95
97
98
88
82
75
101
109
70
103
112
112
98
112
106
106
129
121
102
107
89
69
90
99
99
88
46
72
98
80
73
77
98
99
87
96
93
96
98
96
93
92
72
91
98
91
74
83
98
99
86
33
64
98
80
74
59
95
98
88
97
95
97
98
96
92
93
75
96
96
83
78
86
77
36
66
91
62
95
94
88
84
-
84
78
82
84
25
58
92
51
96
94
89
87
-
70
86
31
79
99
54
65
73
100
98y
100
70
85
68
81
90
75
99
95y
46
87
96
100
95
95
63
89
97
99
90
90x,y
95
93
84
-
41
52
46
46
120
119
62
10
37
104
114
96
90
31
97
68
29
63
91
81
100
94
101
85
93
15
95
71
40
60
50
40
117
127
71
7
31
94
114
103
86
23
105
73
23
64
92
90
99
104
99
86
91
13
93
85
38
33
86
90
40
9
29
91x
97
92
77
24
61
70
55
92
79
91
79
11
87
61
37
44
88
93
46
6
25
96x
97
98
77
18
67
69
66
94
87
89
82
10
85
76
99
96
97
59
99
60
99x
100
94x
100x
95
85
96
87
95
100
81
98
99
95
95
41
99
37
99x
100
94x
100x
96
71
94
90
90
100
76
98
78
24
12
73
17
97
143
106
131
3
7
82
142
22
7
70
23
171
161
31
8
9
59
8
3
15
12
5
26
0
40
35
55
1
1
11
40
2
8
7
4
76
51
6
0
1
11
117
100
135
91
80
98
115
171
99
102
99
106
108
102
65
120
111
97
102
127
103
112
98
105
100
132
91
77
98
116
139
98
101
94
102
105
101
56
120
104
97
101
121
99
109
94
92
90
97
77
70
99
91
99
65
87
100
99
47
93
80
96
93
97
99
99
90
88
91
96
79
67
100
92
98
62
87
99
98
39
96
81
96
93
92
96
97
86
94
58
98
69
24
80
60
94
73
97
89
71
98
95
59
98
69
20
83
57
93
72
96
88
75
98
88
94
76
96
73
99
97y
99y
56y
82
100
100
79
77
92
98y
85
-
87
95
100
92
92
98x,y
71
93
89
99
99
96
99
67
76
43
89
24
88
106
35
94
100
32
90
121
82
35
75
46
103
98
70
89
7x
69
83
85
46
86
18
89
105
26
95
100
27
97
127
83
33
100
44
103
91
65
74
5x
72
57
62
30
63
19
94
94
28
58
97
63
31
99
87
64
86
62
99
84
99x
100
96
98
99
64
99x
100
92
93
88
10
44
86
69
86
8
6
3
12
9
15
98
157
109
118
102
111
96
98
145
92
112
99
108
91
92
84
97
90
97
92
92
72
93
90
97
87
97
76y
82
98
95
91
93
74y
76
98
93
87
98y
75
89
91
97
97
100
92
99
92y
97x,y
85
52
54
94
79
80
83
83
52
27
102
82
88
68
83
30
61
68
62
72
T H E S TAT E O F T H E W O R L D ’ S C H I L D R E N 2 0 0 8
female admin. data
Secondary school enrolment ratio
2000-2006*
survey data
Secondary school
attendance
ratio
(2000-2006*)
net
male
female
51
29
46
35
6
38
23
81
70
55
5
-
48
40
38
47
6
33
18
80
70
70
5
-
71
70
34
68
15
100
95
24
65
100
87
35
100
81
60
73
66
39
20
90
22
8
41x
19
55
24
64
89
8
77
41
16
93
17
4
48x
20
66
33
65
74
8
84
81
14
75
70
68
61
79
45
84
53
78
32
90
47
…TABLE 5
Number per 100
population
2005
Youth (15-24 years)
literacy rate
2000-2006*
phones Internet
male
female
users
Turkmenistan
Tuvalu
Uganda
Ukraine
United Arab Emirates
United Kingdom
United States
Uruguay
Uzbekistan
Vanuatu
Venezuela
(Bolivarian Republic of)
Viet Nam
Yemen
Zambia
Zimbabwe
Primary school enrolment ratio
2000-2006*
gross
net
male
female
Primary school
attendance
ratio
(2000-2006*)
net
male
Secondary school enrolment ratio
2000-2006*
% of primary school
entrants reaching
grade 5
2000-2006*
male
female
100x
83
100
98
98x
-
100x
71
100
96
99x
-
10
5
90
128
167
130
66
9
9
1
2
10
29
54
66
21
3
3
95
119
107
85
107
100
110
100
120
102
119
107
82
107
99
108
99
116
83
71
99
92
92
95
83
70
99
93
93
93
99
82
96
100
-
female admin. data
99
81
98
100
-
70
48
97
91
96y
78
96
94x
91
73x
98
98
94x
59
66x
98
60
30
14
9
8
13
13
1
3
8
106
98
102
114
97
104
91
75
108
95
91
97
87
89
81
92
92
63
89
82
91
94
68
55
85
93
94
41
58
87
91
87
73
94
70
14
17
11
37
12
52
61
84
138
35
6
53
3
3
2
9
5
10
16
14
55
8
1
15
102
110
95
100
118
112
120
105
102
111
100
110
91
104
79
94
109
110
115
102
101
105
91
104
75
83
68
86
90
98
95
91
95
90
80
91
70
81
59
81
83
97
94
89
96
86
75
87
64
66
62
89
81
91
90
93
80
65
80
60
67
55
86
79
92
91
91
78
63
78
70
69
71
88
72
84**
85
97
77**
67
78**
gross
net
male
female
Secondary school
attendance
ratio
(2000-2006*)
net
survey data
male
female
male
female
100
100
89
100
100
-
87
21
92
62
104
94
98
96
44
81
17
85
66
107
96
113
93
38
16
82
56
94
88
42
14
77
59
97
90
36
84
16
90
91
-
84
16
93
90
-
96
98
88x,y
88
88
70
77
62
31
38
79
75
31
25
35
59
71
46
29
35
68
68
21
23
33
30
77
35x
17
45
43
78
13x
19
45
86
87
86
91
94
96**
92**
85
92**
37
41
34
74
56
72
85
90
102
63
36
68
30
35
25
68
46
72
92
86
103
59
29
64
30
35
26
67
61**
67
80
92
52**
33
59**
25
30
20
62
62**
71
75
93
50**
28
58**
25
20
30
54
55
60**
80
50**
26
50**
22
19
25
52
50
63**
78
46**
24
47**
SUMMARY INDICATORS
Sub-Saharan Africa
Eastern and Southern Africa
West and Central Africa
Middle East and North Africa
South Asia
East Asia and Pacific
Latin America and Caribbean
CEE/CIS
Industrialized countries§
Developing countries§
Least developed countries§
World
76
75
76
92
81
99
96
99
90
74
91
64
64
64
83
65
98
97
98
84
59
85
§ Also includes territories within each country category or regional group. Countries and territories in each country category or regional group are listed on page 148.
DEFINITIONS OF THE INDICATORS
Youth literacy rate – Number of literate persons aged 15-24, expressed as a percentage of the total population in
that age group.
Primary school gross enrolment ratio – Number of children enrolled in primary school, regardless of age,
expressed as a percentage of the total number of children of official primary school age.
Secondary school gross enrolment ratio – Number of children enrolled in secondary school, regardless of age,
expressed as a percentage of the total number of children of official secondary school age.
Primary school net enrolment ratio – Number of children enrolled in primary school who are of official primary
school age, expressed as a percentage of the total number of children of official primary school age.
Secondary school net enrolment ratio – Number of children enrolled in secondary school who are of official
secondary school age, expressed as a percentage of the total number of children of official secondary school age.
Primary school net attendance ratio – Number of children attending primary or secondary school who are of
official primary school age, expressed as a percentage of the total number of children of official primary school
age.
Secondary school net attendance ratio – Number of children attending secondary or tertiary school who are of
official secondary school age, expressed as a percentage of the total number of children of official secondary
school age.
Primary school entrants reaching grade five – Percentage of children entering the first grade of primary school
who eventually reach grade five.
NOTES
MAIN DATA SOURCES
Youth literacy – UNESCO Institute for Statistics (UIS).
Phone and Internet use – International Telecommunications Union, Geneva.
Primary and secondary school enrolment – UIS.
Primary and secondary school attendance – Demographic and Health Surveys
(DHS) and Multiple Indicator Cluster Surveys (MICS).
Reaching grade five – Administrative data: UIS. Survey data: DHS and MICS.
- Data not available.
x Data refer to years or periods other than those specified in the column heading, differ from the standard definition or refer to only part of a country.
Such data are not included in the calculation of regional and global averages.
y Data refer to years or periods other than those specified in the column heading, differ from the standard definition or refer to only part of a country.
Such data are included in the calculation of regional and global averages.
* Data refer to the most recent year available during the period specified in the column heading.
** Excludes China.
S TAT I S T I C A L TA B L E S
133
TABLE 6. DEMOGRAPHIC INDICATORS
Population
(thousands)
2006
Countries and territories
Afghanistan
Albania
Algeria
Andorra
Angola
Antigua and Barbuda
Argentina
Armenia
Australia
Austria
Azerbaijan
Bahamas
Bahrain
Bangladesh
Barbados
Belarus
Belgium
Belize
Benin
Bhutan
Bolivia
Bosnia and Herzegovina
Botswana
Brazil
Brunei Darussalam
Bulgaria
Burkina Faso
Burundi
Cambodia
Cameroon
Canada
Cape Verde
Central African Republic
Chad
Chile
China
Colombia
Comoros
Congo
Congo, Democratic Republic of the
Cook Islands
Costa Rica
Côte d’Ivoire
Croatia
Cuba
Cyprus
Czech Republic
Denmark
Djibouti
Dominica
Dominican Republic
Ecuador
Egypt
El Salvador
Equatorial Guinea
Eritrea
Estonia
Ethiopia
Fiji
134
under
18
under
5
13982
1003
11870
14
8797
28
12277
789
4803
1584
2604
106
226
64194
67
1936
2138
123
4437
252
4131
842
784
62408
131
1331
7573
4249
6261
8791
6948
240
2107
5528
4897
348276
16233
395
1788
32671
5
1490
9179
859
2630
202
1857
1210
368
23
3760
5064
29263
2685
241
2330
261
41299
321
4823
250
3213
4
3082
8
3346
164
1267
394
547
28
65
18951
17
455
561
36
1488
61
1243
195
216
18092
40
341
2605
1461
1690
2851
1716
73
668
1943
1233
84390
4438
129
587
11843
2
393
2849
205
652
49
466
321
107
6
1110
1414
8634
775
81
808
67
13439
90
Population
annual
growth rate
(%)
Crude
death rate
1970-1990 1990-2006
1970 1990 2006
0.3
2.2
3.0
3.9
2.7
-0.6
1.5
1.7
1.4
0.2
1.7
2.0
4.0
2.4
0.6
0.6
0.2
2.1
3.0
3.0
2.3
0.9
3.3
2.2
3.4
0.2
2.4
2.4
1.7
2.9
1.2
1.4
2.4
2.5
1.6
1.6
2.2
3.3
3.0
3.1
-0.9
2.6
4.4
0.4
1.0
0.5
0.2
0.2
6.2
0.3
2.3
2.7
2.2
1.8
0.8
2.7
0.7
2.7
1.6
4.5
-0.2
1.7
2.1
2.8
1.9
1.1
-1.0
1.2
0.5
1.0
1.6
2.5
2.0
0.5
-0.3
0.3
2.6
3.3
1.1
2.1
-0.6
1.9
1.5
2.5
-0.9
3.0
2.3
2.4
2.5
1.0
2.4
2.2
3.4
1.4
0.9
1.7
2.8
2.6
2.9
-1.7
2.2
2.5
0.1
0.4
1.4
-0.1
0.3
2.4
-0.1
1.7
1.6
1.9
1.8
2.4
2.5
-1.0
2.9
0.9
29
8
16
27
9
5
9
13
7
7
9
20
9
7
12
8
22
23
20
7
13
10
7
9
24
20
20
19
7
12
22
21
10
8
9
18
14
20
7
18
10
7
10
12
10
21
11
12
17
12
25
21
11
21
8
23
6
7
24
8
8
7
11
7
6
4
12
8
11
11
5
15
14
11
7
7
7
3
12
17
19
12
13
7
8
16
16
6
7
6
11
11
18
4
13
11
7
8
12
12
14
6
6
9
7
19
16
13
18
6
T H E S TAT E O F T H E W O R L D ’ S C H I L D R E N 2 0 0 8
Crude
birth rate
20
6
5
21
8
9
7
9
7
6
3
8
7
15
10
4
12
7
8
9
15
6
3
15
15
16
9
15
7
5
19
16
5
7
6
7
12
18
4
16
12
8
7
11
10
12
6
5
6
6
15
10
14
13
7
Life
expectancy
1970 1990 2006
52
33
49
52
23
23
20
15
29
31
40
45
22
16
14
40
47
47
46
23
45
35
36
16
51
44
42
45
17
40
42
46
29
33
38
50
44
48
33
51
15
29
19
16
16
49
42
42
41
44
41
47
15
49
34
52
24
32
53
22
21
15
12
27
24
29
35
16
14
12
35
47
38
36
15
35
24
28
12
49
48
44
42
14
39
42
48
23
21
27
41
39
49
27
45
12
17
19
12
12
42
29
29
32
30
42
41
14
47
29
49
16
21
48
18
12
12
9
15
17
18
26
11
9
11
26
41
19
28
9
25
20
22
9
45
46
26
36
10
30
37
46
15
13
19
34
36
50
18
36
9
11
12
9
11
29
24
22
25
23
39
40
11
39
22
1970 1990 2006
35
67
53
37
66
70
71
70
65
66
62
44
69
71
71
66
46
41
46
66
55
59
67
71
42
44
44
46
73
56
42
45
62
62
61
48
54
45
67
49
69
70
71
70
73
43
58
58
50
57
40
43
71
43
60
41
72
67
40
71
68
77
76
66
70
72
54
75
71
76
72
53
52
59
72
64
66
74
71
50
46
55
55
77
65
50
52
73
68
68
56
57
47
75
54
72
74
76
72
75
51
67
68
62
65
47
48
69
47
67
43
76
72
42
75
72
81
80
67
73
75
63
77
69
79
76
56
65
65
75
49
72
77
73
52
49
59
50
80
71
44
50
78
73
73
65
54
46
79
48
76
78
79
76
78
54
72
75
71
72
51
57
71
52
69
Total
fertility
rate
2006
% of
population
urbanized
2006
7.2
2.1
2.4
6.5
2.3
1.3
1.8
1.4
1.7
2.0
2.4
2.9
1.5
1.2
1.6
3.0
5.6
2.3
3.6
1.2
3.0
2.3
2.4
1.3
6.1
6.8
3.3
4.5
1.5
3.5
4.7
6.3
1.9
1.7
2.3
4.5
4.6
6.7
2.1
4.6
1.3
1.5
1.6
1.2
1.8
4.1
2.9
2.6
3.0
2.7
5.4
5.2
1.5
5.4
2.8
23
46
64
91
54
38
90
64
88
66
52
91
97
25
53
73
97
48
40
11
65
46
58
85
74
70
19
10
20
56
80
58
38
26
88
41
73
38
61
33
73
62
45
57
75
69
73
86
87
73
68
63
43
60
39
20
69
16
51
Average
annual
growth rate
of urban
population (%)
1970-1990 1990-2006
2.9
2.9
4.4
3.8
7.3
-0.3
2.0
2.3
1.4
0.2
2.0
3.1
4.3
7.2
1.0
2.7
0.3
1.7
6.7
6.1
4.0
2.8
11.8
3.7
3.7
1.4
6.8
7.3
2.0
6.4
1.3
5.5
3.9
5.5
2.1
3.9
3.2
5.1
4.7
2.6
-0.5
4.0
6.1
1.9
2.0
3.0
2.1
0.5
7.3
2.1
3.9
4.4
2.4
2.9
2.0
3.8
1.1
4.6
2.5
6.0
1.2
3.0
1.9
5.2
2.4
1.4
-1.4
1.4
0.5
0.7
2.1
3.1
3.6
1.6
0.2
0.4
2.7
4.3
4.0
3.1
0.5
4.0
2.3
3.2
-0.5
4.9
5.4
5.4
4.4
1.3
4.1
2.4
4.7
1.7
3.4
2.0
4.6
3.3
3.9
-0.2
3.5
3.3
0.4
0.5
1.6
-0.2
0.4
3.2
0.3
3.0
2.4
1.8
3.0
3.1
3.9
-1.2
4.4
2.2
…TABLE 6
Population
(thousands)
2006
under
18
under
5
Finland
1097
286
France
13555
3834
Gabon
554
158
Gambia
784
261
Georgia
1043
237
Germany
14517
3548
Ghana
10452
3195
Greece
1917
513
Grenada
43
10
Guatemala
6463
2066
Guinea
4576
1544
Guinea-Bissau
889
322
Guyana
268
73
Haiti
4190
1244
Holy See
Honduras
3235
943
Hungary
1935
475
Iceland
78
21
India
445361 126843
Indonesia
76870 21720
Iran (Islamic Republic of)
24682
6270
Iraq
13691
4223
Ireland
1047
315
Israel
2231
679
Italy
9886
2729
Jamaica
1011
277
Japan
21393
5622
Jordan
2460
718
Kazakhstan
4595
1253
Kenya
18155
6161
Kiribati
35
10
Korea, Democratic People’s Republic of 6744
1606
Korea, Republic of
10616
2369
Kuwait
769
236
Kyrgyzstan
1959
504
Lao People’s Democratic Republic
2682
715
Latvia
427
102
Lebanon
1367
363
Lesotho
952
272
Liberia
1922
690
Libyan Arab Jamahiriya
2154
676
Liechtenstein
7
2
Lithuania
713
151
Luxembourg
101
27
Madagascar
9613
3142
Malawi
7286
2425
Malaysia
9623
2758
Maldives
123
30
Mali
6528
2247
Malta
85
20
Marshall Islands
22
6
Mauritania
1415
456
Mauritius
360
94
Mexico
37911 10445
Micronesia (Federated States of)
50
14
Moldova, Republic of
975
213
Monaco
6
2
Mongolia
918
233
Montenegro
145
38
Population
annual
growth rate
(%)
Crude
death rate
1970-1990 1990-2006
1970 1990 2006
0.4
0.6
2.8
3.5
0.7
0.1
2.7
0.7
0.1
2.5
2.3
2.8
0.1
2.1
3.0
0.0
1.1
2.2
2.1
3.4
3.0
0.9
2.2
0.3
1.2
0.8
3.5
1.2
3.7
2.5
1.7
1.5
5.3
2.0
2.3
0.6
1.0
2.2
2.2
3.9
1.5
0.8
0.6
2.8
3.7
2.6
2.9
2.3
0.9
4.2
2.6
1.2
2.4
2.2
1.0
1.2
2.8
0.6
0.3
0.5
2.2
3.4
-1.3
0.2
2.4
0.6
0.6
2.4
2.6
3.0
0.1
1.8
2.2
-0.2
1.0
1.8
1.4
1.3
2.7
1.1
2.6
0.2
0.8
0.2
3.5
-0.5
2.8
1.7
1.0
0.7
1.6
1.1
2.2
-0.9
1.9
1.4
3.2
2.0
1.2
-0.5
1.2
2.9
2.3
2.3
2.1
2.8
0.7
1.3
2.8
1.1
1.4
0.9
-0.8
0.5
1.0
0.1
10
11
20
28
9
12
16
8
9
15
27
29
11
18
15
11
7
16
17
14
12
11
7
10
8
7
16
9
15
7
9
6
11
19
11
9
17
22
16
9
12
21
24
9
17
26
9
18
7
10
9
10
14
3
10
9
11
15
9
11
11
9
10
9
19
23
9
13
7
14
7
10
9
7
8
9
6
10
7
7
6
9
10
6
6
2
8
13
13
7
11
21
5
11
11
15
18
5
9
20
8
11
6
5
7
10
9
5
Crude
birth rate
10
9
12
11
12
10
10
10
8
6
12
19
9
10
6
13
6
8
6
5
10
7
5
10
7
9
4
10
12
10
6
2
8
7
14
7
19
19
4
12
9
10
16
4
6
15
8
8
7
5
6
12
7
9
Life
expectancy
1970 1990 2006
14
17
34
50
19
14
45
17
28
44
50
49
38
39
47
15
21
38
41
43
46
22
27
17
35
19
52
26
51
35
31
48
31
44
14
33
43
49
49
17
13
47
56
37
40
52
17
45
28
44
41
18
42
10
13
13
36
43
16
11
40
10
28
39
47
50
25
37
38
12
17
32
26
35
39
15
22
10
25
10
36
23
42
21
16
24
31
43
14
26
36
50
26
15
13
44
50
30
40
52
15
40
20
28
34
19
33
11
11
12
26
36
11
8
30
9
18
34
41
50
18
28
28
9
14
24
19
20
33
16
20
9
20
9
26
19
39
14
9
18
21
27
9
18
30
50
24
9
12
37
42
21
23
48
10
33
15
20
27
11
19
13
1970 1990 2006
70
72
47
37
67
71
49
72
64
52
38
36
60
47
52
69
74
49
48
54
56
71
71
72
68
72
54
62
52
62
60
66
60
46
70
65
49
42
51
71
70
44
41
61
50
39
70
47
62
61
62
65
53
69
75
77
61
51
71
75
57
77
66
62
47
42
62
54
66
69
78
59
61
64
63
75
76
77
72
79
67
67
60
71
71
75
66
54
69
69
59
43
68
71
75
51
49
70
60
47
76
57
69
70
66
68
61
75
79
80
56
59
71
79
59
79
68
70
55
46
66
60
70
73
82
64
70
71
58
79
80
80
72
82
72
66
53
67
78
77
66
64
72
72
42
45
74
73
79
59
47
74
68
54
79
64
73
76
68
69
66
74
Total
fertility
rate
2006
% of
population
urbanized
2006
1.8
1.9
3.1
4.8
1.4
1.4
4.0
1.3
2.3
4.3
5.6
7.1
2.4
3.7
3.4
1.3
2.0
2.9
2.2
2.0
4.4
2.0
2.8
1.4
2.5
1.3
3.2
2.2
5.0
1.9
1.2
2.2
2.5
3.3
1.3
2.2
3.5
6.8
2.8
1.3
1.7
4.9
5.7
2.7
2.6
6.6
1.4
4.5
1.9
2.3
3.9
1.4
1.9
1.8
61
77
84
55
52
75
49
59
31
48
33
30
28
39
47
67
93
29
49
67
67
61
92
68
53
66
83
58
21
50
62
81
98
36
21
68
87
19
59
85
22
66
83
27
18
68
30
31
96
67
41
42
76
22
47
100
57
-
Average
annual
growth rate
of urban
population (%)
1970-1990 1990-2006
1.4
0.8
6.6
6.8
1.5
0.1
3.9
1.3
0.1
3.2
5.1
5.9
0.2
4.1
4.6
0.5
1.4
3.5
5.0
4.9
4.1
1.3
2.6
0.4
2.1
1.7
4.8
1.7
6.5
4.0
2.1
4.5
6.0
2.0
4.7
1.3
2.7
5.7
4.9
6.7
1.6
2.4
1.0
5.3
7.0
4.5
6.8
4.7
0.9
4.3
7.6
1.4
3.4
2.4
2.9
1.2
4.0
-
S TAT I S T I C A L TA B L E S
0.3
0.7
3.5
5.7
-1.6
0.4
4.2
0.6
0.3
3.3
3.7
3.3
-0.2
3.6
3.2
-0.1
1.1
2.6
4.4
2.5
2.4
1.6
2.7
0.3
1.3
0.5
4.4
-0.3
3.7
4.0
1.4
1.3
1.6
0.8
4.1
-1.1
2.2
2.0
4.9
2.5
1.5
-0.6
1.3
3.8
4.8
4.3
3.0
4.6
1.1
1.5
2.9
0.8
1.7
0.0
-0.8
0.5
1.0
-
135
TABLE 6. DEMOGRAPHIC INDICATORS
Population
(thousands)
2006
under
18
under
5
Morocco
11135
Mozambique
10674
Myanmar
15772
Namibia
942
Nauru
4
Nepal
12487
Netherlands
3592
New Zealand
1066
Nicaragua
2446
Niger
7455
Nigeria
73703
Niue
1
Norway
1092
Occupied Palestinian Territory
2039
Oman
1014
Pakistan
70673
Palau
8
Panama
1172
Papua New Guinea
2899
Paraguay
2522
Peru
10318
Philippines
36430
Poland
7684
Portugal
1996
Qatar
204
Romania
4276
Russian Federation
27839
Rwanda
4844
Saint Kitts and Nevis
17
Saint Lucia
55
Saint Vincent and the Grenadines
42
Samoa
88
San Marino
6
Sao Tome and Principe
75
Saudi Arabia
9671
Senegal
5888
Serbia
2222
Seychelles
44
Sierra Leone
2827
Singapore
1010
Slovakia
1114
Slovenia
349
Solomon Islands
226
Somalia
4261
South Africa
18349
Spain
7671
Sri Lanka
5576
Sudan
17697
Suriname
160
Swaziland
536
Sweden
1925
Switzerland
1500
Syrian Arab Republic
8342
Tajikistan
3090
Tanzania, United Republic of
20171
Thailand
16522
The former Yugoslav Republic of Macedonia 486
Timor-Leste
570
Togo
3192
2978
3670
4146
248
1
3626
987
284
671
2713
24503
0
284
673
269
19012
2
344
898
731
2815
11027
1765
557
64
1058
7195
1617
5
15
12
25
2
23
2879
1913
605
15
999
207
259
89
70
1507
5254
2268
1483
5483
45
147
499
362
2500
858
6953
4514
117
190
1045
136
Population
annual
growth rate
(%)
Crude
death rate
1970-1990 1990-2006
1970 1990 2006
2.4
1.8
2.1
3.0
1.7
2.3
0.7
1.0
2.7
3.1
2.8
0.4
3.4
4.5
3.2
1.4
2.4
2.4
2.7
2.5
2.6
0.8
0.7
7.2
0.7
0.7
3.3
-0.5
1.4
0.9
0.6
1.2
2.3
5.2
2.9
0.8
1.6
2.1
1.9
0.7
0.7
3.3
3.1
2.4
0.7
1.6
2.9
0.4
3.2
0.3
0.5
3.5
2.9
3.1
1.9
1.0
1.0
3.1
1.4
2.7
1.2
2.3
0.6
2.3
0.6
1.2
1.8
3.5
2.7
0.6
3.7
2.0
2.2
1.9
1.9
2.5
2.2
1.5
2.1
0.0
0.4
3.5
-0.5
-0.2
1.6
1.3
1.1
0.6
0.9
1.5
1.8
2.5
2.7
0.2
1.1
2.1
2.3
0.2
0.2
2.7
1.4
1.7
0.8
0.7
2.3
0.8
1.7
0.4
0.5
2.6
1.4
2.7
1.0
0.4
2.6
3.0
17
25
15
15
21
8
9
13
26
22
10
19
17
16
8
19
7
14
11
8
11
13
9
9
20
8
11
10
13
18
21
9
29
5
10
10
10
24
14
9
8
20
8
18
10
9
13
10
18
10
8
22
18
8
20
11
9
13
9
8
7
22
18
11
7
4
11
5
11
6
7
7
10
10
3
11
12
33
7
7
7
10
5
12
10
26
5
10
10
12
22
8
8
7
14
6
10
11
9
5
8
15
7
8
18
12
T H E S TAT E O F T H E W O R L D ’ S C H I L D R E N 2 0 0 8
Crude
birth rate
6
20
10
13
8
9
7
5
14
17
9
4
3
7
5
10
6
6
5
10
11
2
12
16
17
7
7
5
8
4
9
11
23
5
10
10
7
17
16
9
7
10
7
20
10
8
3
6
13
9
9
9
10
Life
expectancy
1970 1990 2006
47
48
40
43
42
17
22
47
58
47
17
49
50
43
38
42
37
42
40
17
21
34
21
14
53
41
40
39
47
48
48
18
47
23
19
17
46
51
38
20
31
47
37
50
14
16
47
40
48
37
24
46
48
30
43
27
42
39
13
17
37
56
47
14
46
38
42
26
37
33
30
33
15
12
23
14
14
49
25
25
34
38
36
43
15
48
18
15
11
40
46
29
10
21
41
24
41
14
12
37
39
44
19
17
43
44
21
41
19
26
29
12
14
25
50
41
12
37
22
27
21
31
25
21
27
9
11
17
10
11
44
19
20
26
33
25
36
13
46
9
10
9
31
44
23
11
15
32
20
29
11
9
27
28
40
15
11
42
38
1970 1990 2006
52
39
51
53
43
74
71
54
40
42
74
54
49
51
65
43
65
53
57
70
67
60
68
69
44
64
61
55
55
52
45
68
35
69
70
69
54
40
53
72
65
44
63
48
74
73
55
60
47
59
66
40
48
64
43
59
62
54
77
75
64
46
47
77
68
70
60
72
54
68
65
65
71
74
69
69
68
33
71
69
65
62
68
57
71
39
75
72
73
57
42
62
77
70
53
68
59
78
78
68
63
51
67
71
46
58
71
42
61
52
63
79
80
72
56
47
80
73
75
65
75
57
71
71
71
75
78
75
72
65
46
73
71
71
65
72
63
74
42
80
74
78
63
47
50
81
72
58
70
40
81
81
74
66
52
70
74
60
58
Total
fertility
rate
2006
% of
population
urbanized
2006
2.4
5.2
2.1
3.3
3.4
1.7
2.0
2.8
7.3
5.5
1.8
5.3
3.1
3.6
2.6
4.0
3.2
2.5
3.3
1.2
1.5
2.7
1.3
1.3
6.0
2.2
2.2
4.1
4.0
3.5
4.9
1.8
6.5
1.3
1.2
1.3
4.0
6.2
2.7
1.4
1.9
4.4
2.5
3.6
1.8
1.4
3.2
3.5
5.3
1.8
1.5
6.7
5.0
59
35
31
36
100
16
81
86
59
17
49
37
77
72
71
35
68
72
13
59
73
63
62
58
96
54
73
20
32
28
46
23
89
59
81
42
50
41
100
56
51
17
36
60
77
15
42
74
24
84
76
51
25
25
33
70
27
41
Average
annual
growth rate
of urban
population (%)
1970-1990 1990-2006
4.1
8.3
2.5
4.1
1.7
6.3
1.2
1.2
3.3
5.9
5.3
0.9
4.5
9.3
4.2
2.2
3.0
3.9
4.0
3.4
4.5
1.6
1.8
7.4
2.2
1.5
5.9
-0.4
2.4
3.0
0.8
3.1
4.2
7.5
4.2
4.8
4.8
1.9
2.3
2.3
5.5
4.5
2.9
1.4
1.0
5.3
2.4
7.5
0.4
1.6
4.1
2.2
7.5
3.6
2.0
3.4
4.9
2.6
5.9
2.6
3.9
0.6
6.1
1.6
1.3
2.5
4.1
4.8
1.1
4.0
2.6
3.1
1.8
3.7
2.7
3.4
1.8
3.8
0.1
1.6
3.7
-0.5
-0.3
9.9
0.7
0.7
1.4
1.3
1.4
3.7
2.8
3.1
1.2
4.1
2.3
0.1
0.3
4.2
2.6
2.6
0.9
-0.1
5.1
1.3
2.1
0.5
1.2
2.9
-0.2
4.4
1.6
1.6
4.1
4.9
…TABLE 6
Population
(thousands)
2006
Tonga
Trinidad and Tobago
Tunisia
Turkey
Turkmenistan
Tuvalu
Uganda
Ukraine
United Arab Emirates
United Kingdom
United States
Uruguay
Uzbekistan
Vanuatu
Venezuela (Bolivarian Republic of)
Viet Nam
Yemen
Zambia
Zimbabwe
Population
annual
growth rate
(%)
Crude
death rate
1970-1990 1990-2006
1970 1990 2006
Crude
birth rate
Life
expectancy
Total
fertility
rate
2006
% of
population
urbanized
2006
Average
annual
growth rate
of urban
population (%)
under
18
under
5
44
365
3225
24632
1865
4
16828
8676
976
13155
75757
943
10673
102
10052
30570
11482
6164
6199
12
93
823
6630
491
1
5840
2001
315
3467
20776
254
2861
31
2880
8101
3639
2012
1703
-0.2
1.2
2.4
2.3
2.6
1.3
3.2
0.4
10.6
0.1
1.0
0.5
2.7
2.8
3.0
2.2
3.3
3.2
3.5
0.3
0.5
1.4
1.6
1.8
0.7
3.2
-0.6
5.1
0.3
1.0
0.4
1.7
2.4
2.0
1.7
3.6
2.3
1.5
6
7
14
12
11
16
9
11
12
9
10
10
14
7
18
27
17
13
6
7
6
8
8
15
13
3
11
9
10
7
7
5
8
13
16
8
6
8
6
6
8
14
16
1
10
8
9
7
5
5
5
8
20
19
37
27
39
39
37
49
15
36
16
16
21
36
43
37
41
56
49
48
30
21
27
26
35
50
13
27
14
16
18
35
37
29
31
51
44
37
25
15
17
19
22
47
9
16
12
14
15
23
29
22
19
38
40
28
65
66
54
56
58
50
71
61
72
71
69
63
53
65
49
38
49
55
70
70
69
65
63
51
70
73
76
75
72
67
64
71
65
54
49
63
73
69
74
72
63
50
68
78
79
78
76
67
70
73
74
62
41
42
3.8
1.6
1.9
2.2
2.6
6.6
1.2
2.3
1.8
2.1
2.1
2.6
3.9
2.6
2.2
5.6
5.3
3.3
24
13
66
68
47
57
13
68
77
90
81
92
37
24
94
27
28
35
36
0.4
-0.5
3.8
4.5
2.3
4.6
5.7
1.4
10.5
0.8
1.1
0.9
3.1
4.9
3.8
2.7
5.5
4.5
6.1
0.7
2.9
2.0
2.4
2.0
2.7
4.1
-0.5
5.0
0.4
1.5
0.7
1.2
4.0
2.7
3.4
5.3
1.6
2.9
125254
60197
65057
44126
174830
144870
55715
26218
54768
559069
122114
625781
2.9
2.9
2.9
3.0
2.3
1.8
2.2
1.0
0.7
2.2
2.5
1.8
2.6
2.5
2.7
2.0
1.9
1.1
1.5
0.2
0.6
1.6
2.5
1.4
20
19
22
16
17
10
10
9
10
13
21
12
16
15
17
8
11
7
7
11
9
9
16
9
15
15
16
6
8
7
6
12
9
8
13
9
48
47
48
45
39
35
37
20
17
38
47
32
45
43
47
35
33
22
27
18
13
29
42
26
40
38
42
25
25
15
20
14
11
23
36
21
45
46
43
51
49
59
60
67
71
55
44
59
50
51
49
63
59
67
68
68
76
63
51
65
50
50
50
69
64
72
73
68
79
66
55
68
5.3
5.0
5.6
3.1
3.0
1.9
2.4
1.7
1.7
2.8
4.7
2.6
35
29
42
58
29
43
78
62
76
43
27
49
4.7
4.7
4.8
4.4
3.8
3.9
3.3
2.0
1.0
3.8
4.9
2.7
4.1
3.7
4.3
2.8
2.8
3.4
2.1
0.2
0.9
2.9
4.1
2.2
1970 1990 2006
1970 1990 2006
1970-1990 1990-2006
SUMMARY INDICATORS
Sub-Saharan Africa
Eastern and Southern Africa
West and Central Africa
Middle East and North Africa
South Asia
East Asia and Pacific
Latin America and Caribbean
CEE/CIS
Industrialized countries§
Developing countries§
Least developed countries§
World
376047
183232
192816
152632
612647
566804
197134
101837
204920
1958948
376727
2212024
§ Also includes territories within each country category or regional group. Countries and territories in each country category or regional group are listed on page 148.
DEFINITIONS OF THE INDICATORS
Life expectancy at birth – Number of years newborn children would live if subject to the mortality
risks prevailing for the cross section of population at the time of their birth.
Crude death rate – Annual number of deaths per 1,000 population.
Crude birth rate – Annual number of births per 1,000 population.
Total fertility rate – Number of children who would be born per woman if she lived to the end of
her childbearing years and bore children at each age in accordance with prevailing
age-specific fertility rates.
MAIN DATA SOURCES
Child population – United Nations Population Division.
Crude death and birth rates – United Nations Population Division.
Life expectancy – United Nations Population Division.
Fertility – United Nations Population Division.
Urban population – United Nations Population Division.
Urban population – Percentage of population living in urban areas as defined according to the
national definition used in the most recent population census.
NOTES
-
Data not available.
S TAT I S T I C A L TA B L E S
137
TABLE 7. ECONOMIC INDICATORS
Countries and territories
1970-1990
Afghanistan
Albania
Algeria
Andorra
Angola
Antigua and Barbuda
Argentina
Armenia
Australia
Austria
Azerbaijan
Bahamas
Bahrain
Bangladesh
Barbados
Belarus
Belgium
Belize
Benin
Bhutan
Bolivia
Bosnia and Herzegovina
Botswana
Brazil
Brunei Darussalam
Bulgaria
Burkina Faso
Burundi
Cambodia
Cameroon
Canada
Cape Verde
Central African Republic
Chad
Chile
China
Colombia
Comoros
Congo
Congo, Democratic Republic of the
Cook Islands
Costa Rica
Côte d’Ivoire
Croatia
Cuba
Cyprus
Czech Republic
Denmark
Djibouti
Dominica
Dominican Republic
Ecuador
Egypt
El Salvador
Equatorial Guinea
Eritrea
Estonia
Ethiopia
Fiji
Finland
France
250x
2960
3030
d
1980
11210
5150
1930
35990
39590
1850
14920x
14370x
480
d
3380
38600
3650
540
1410
1100
2980
5900
4730
24100x
3990
460
100
480
1080
36170
2130
360
480
6980
2010
2740
660
950x
130
4980
870
9330
1170x
18430x
12680
51700
1060
3960
2850
2840
1350
2540
8250
200
11410
180
3300
40650
36550
1.6x
-0.7x
2
0.4x
6.5x
-1
2
2
2
-1.3x
1
2
2
3
0
4.7x
-1
8
2
-2.1x
3.4x
1
1
3
2
-1
-1
2
7
2
0.1x
3
-2
1
-2
5.9x
2
4.7x
2
1
4
-2
1.5x
0.6x
3
2
138
1990-2006
Average
annual
rate of
inflation
(%)
1990-2006
% of
population
below
US$1
a day
1995-2005*
health
education
5.2
1.3
2.1
1.8
1.3
5.2
2.5
1.9
1.5
0.4x
2.3x
3
1.5x
2.8
1.8
2.3
1.4
4.8
1.3
11.6x
4.8
1.1
-0.8x
2
1.5
-2.6
5.8x
0.7
2.2
3.3
-0.6
2.4
3.7
8.8
0.8
-0.4
-0.8
-4.7
2.4
-0.5
2.8
3.5x
2.3x
2.1
1.9
-2.4
1.4
3.7
1
2.4
1.6
21.6
0x
4.9
1.9
1.4x
2.6
1.6
20
13
361
2
6
78
2
1
78
3x
2x
4
3x
180
2
1
6
8
7
5x
8
81
0x
55
5
12
3x
4
2
4
3
7
6
5
15
4
8
385
13
6
37
4x
4x
8
2
3
2
11
5
7
5
13
12x
26
4
3x
2
1
<2
<2
7
<2
4
41
<2
31
23
28x
8
<2
27
55
34
17
67x
<2
10
7
3
15
<2
<2
3
18
3
19
<2
23
-
4
4
6x
5
15
14
1
16
8
7
3
16
8
6x
9
10
5
6
12
7x
2
3
9
8x
14
0
9
4
0
21
4x
13
23x
6
16
1
10
11x
3
13
16
1
9
3
16x
2
24
15x
5
10
10
4
20
15
17
4
3
20
31x
13
21
26
6
5
17x
15
12
2
8x
17
2
20
4
0
22
21x
8
10x
12
10
12
13
18x
15
15
7
5
18
10
7x
GDP per capita
average annual
growth rate (%)
GNI per
capita
(US$)
2006
T H E S TAT E O F T H E W O R L D ’ S C H I L D R E N 2 0 0 8
% of central government
expenditure (1995-2005*)
allocated to:
defence
ODA inflow
in millions
US$
2005
ODA inflow
as a % of
recipient
GNI
2005
4
17
34x
3
6
2
12
3
14
10
3
3
5
17x
5
8
3
6
14x
23
10
6
7
12
13
10
18
0
4x
4
4
4
5
4
13x
9
3
5
17
6
4
6x
2775
319
371
442
7
100
193
223
0
1321
-2
54
13
349
90
583
546
71
192
660
365
538
414
161
95
380
152
1757
511
25
1449
1828
8
30
119
125
88
79
15
77
210
926
199
39
355
1937
64
-
40
4
0
2
1
0
4
2
0
2
0
0
1
8
11
6
5
1
0
13
50
9
3
16
7
10
0
0
0
6
38
26
0
0
1
0
0
10
5
0
1
1
1
1
47
17
2
-
Debt service
as a % of
exports of
goods and services
1990
2005
4x
62
7
30
17
14
5
7
5x
31
4
19
19
6
41
18
5
8
2
20
10
39
2
32
5x
21
26
4
7
27
18
14
2
33
12
-
2x
19x
9
12
5x
4x
5
5
1x
34
6x
5x
13
3x
1
26
28
10x
41
0x
11x
6
12x
7x
15
3
34
3x
2
0x
5
4
27x
10x
4x
13
6
28
6
7
0x
13x
15x
4
6x
-
…TABLE 7
Gabon
Gambia
Georgia
Germany
Ghana
Greece
Grenada
Guatemala
Guinea
Guinea-Bissau
Guyana
Haiti
Holy See
Honduras
Hungary
Iceland
India
Indonesia
Iran (Islamic Republic of)
Iraq
Ireland
Israel
Italy
Jamaica
Japan
Jordan
Kazakhstan
Kenya
Kiribati
Korea, Democratic People’s Republic of
Korea, Republic of
Kuwait
Kyrgyzstan
Lao People’s Democratic Republic
Latvia
Lebanon
Lesotho
Liberia
Libyan Arab Jamahiriya
Liechtenstein
Lithuania
Luxembourg
Madagascar
Malawi
Malaysia
Maldives
Mali
Malta
Marshall Islands
Mauritania
Mauritius
Mexico
Micronesia (Federated States of)
Moldova, Republic of
Monaco
Mongolia
Montenegro
Morocco
Mozambique
Myanmar
Namibia
1990-2006
Average
annual
rate of
inflation
(%)
1990-2006
% of
population
below
US$1
a day
1995-2005*
health
education
defence
-1
0.3
1
1.4
2.1
2.7
2.3
1.2
1.3
-2.5
3
-2
0.6
3.2
2.3
4.4
2.2
2.5
6
1.5x
1.3
0.7
0.9
1.8
2.6
0
1.9
4.5
0.6x
-0.9
4.1
4.2
2.5
2.3
2.2
2.5
3.3
-0.5
1.1
3.2
4.2x
2.2
2.7x
-2.2
0.5
3.7
1.5
-0.2
-2
3.3x
2.6x
1.6
4.4
6.6x
1.5
6
8
116
1
25
6
2
9
8
17
8
19
14
14
4
6
15
23
4
7x
3
16
-1
2
83
11
2
4
4x
51
26
23
9
8
44
32
2
15
28
3
1x
5
3x
5
8
6
14
2
57
11x
2
21
24x
9
59
7
45
14
<2x
54
15
<2
34
8
<2
<2
<2
<2
23
<2
<2
27
<2
36
36x
<2
61
21
<2
36
26
3
<2
11
<2
36
35x
7x
3
19
7x
7
10x
11x
3x
1x
10x
6
26
2
1
6
16
13
3
7
2x
10
4
7
0
6
11
11
2
6
5x
10
13
8
7x
6
9
2x
14
4x
9
5
13
6
3
5x
5
10x
12x
4
1
22x
11
17x
17x
11x
3x
19x
5
10
2
4
7
14
15
10
15
6x
16
4
26
14
12
20
6
7
25
11x
7
10
13
12x
23
14
9x
13
23x
16
25
9
9
18
10x
15
22x
4x
9
4
5x
8
11x
29x
4x
7x
3
13
7
14
3
19
3
2
4x
19
5
6
10
15
10
4
11
5
9x
4
1
5
5x
11
10
8x
2
1
3
1
9
13
35x
22
7x
GDP per capita
average annual
growth rate (%)
GNI per
capita
(US$)
2006
1970-1990
5000
310
1560
36620
520
21690
4420
2640
410
190
1130
480
1200
10950
50580
820
1420
3000
2170x
45580
18580x
32020
3480
38410
2660
3790
580
1230
a
17690
30630x
490
500
8100
5490
1030
140
7380
d
7870
76040
280
170
5490
2680
440
13610x
3000
740
5450
7870
2380
1100
d
880
3860
1900
340
220x
3230
0
1
3
2.2x
-2
1
4.9x
0
0.3x
0
-2
0
1
3
3
2
5
-2
-4.3x
3
2
3
-1
3
2.5x
1
-5
6
-6.8x
3
3
-4
-4.8x
3
-2
0
4
-1
7
-1
5.1x
2
1.8x
2
-1x
2
-2.3x
% of central government
expenditure (1995-2005*)
allocated to:
ODA inflow
in millions
US$
2005
54
58
310
1120
45
254
182
79
137
515
681
1724
2524
104
21654
36
622
229
768
28
81
268
296
243
69
236
24
929
575
32
67
691
0
57
190
32
189
106
192
212
652
1286
145
123
ODA inflow
as a % of
recipient
GNI
2005
1
13
5
11
9
1
5
28
18
13
8
0
1
0
0
0
5
1
4
22
0
12
12
1
4
54
0
17
28
0
9
13
0
31
11
0
0
42
6
12
1
21
0
2
Debt service
as a % of
exports of
goods and services
1990
2005
4
18
21
2
11
18
21
5
30
30
25
31
1
20
18
18x
26
10x
8
1x
4
32
23
12
4
8
0x
24
6
16
18
21
17
12
11x
11
8x
6
6
5
17x
11x
5x
3
7
30
18x
20x
4x
16
5
7x
38x
4
22x
10x
11x
8x
18x
63x
5
0x
13x
14
6x
5
7
5x
3x
20x
6
17
10x
2x
11
3
3x
4
S TAT I S T I C A L TA B L E S
139
TABLE 7. ECONOMIC INDICATORS
Nauru
Nepal
Netherlands
New Zealand
Nicaragua
Niger
Nigeria
Niue
Norway
Occupied Palestinian Territory
Oman
Pakistan
Palau
Panama
Papua New Guinea
Paraguay
Peru
Philippines
Poland
Portugal
Qatar
Romania
Russian Federation
Rwanda
Saint Kitts and Nevis
Saint Lucia
Saint Vincent and the Grenadines
Samoa
San Marino
Sao Tome and Principe
Saudi Arabia
Senegal
Serbia
Seychelles
Sierra Leone
Singapore
Slovakia
Slovenia
Solomon Islands
Somalia
South Africa
Spain
Sri Lanka
Sudan
Suriname
Swaziland
Sweden
Switzerland
Syrian Arab Republic
Tajikistan
Tanzania, United Republic of
Thailand
The former Yugoslav Republic of Macedonia
Timor-Leste
Togo
Tonga
Trinidad and Tobago
Tunisia
Turkey
Turkmenistan
Tuvalu
140
1990-2006
Average
annual
rate of
inflation
(%)
1990-2006
% of
population
below
US$1
a day
1995-2005*
health
education
1.9
1.8
2.1
1.9
-0.5
0.7
2.6
-2.8x
1.8x
1.4
2.3
0.2
-0.5
2.3
1.7
4.3
1.9
2
0.6
0.3
2.8
1.1
1.7
2.5
0.5x
0.1x
1.2
1.4
-0.8
3.7
2.9
3.3
-2.3
0.8
2.5
3.8
3.7
1.4
0.4
2.2
0.7
1.4
-3.1
1.6
2.8
0.2
-0.1
1.9
4.7
3.3
1.9
-6.8x
-
6
2
2
22
4
22
3
4x
1x
10
3x
2
8
11
14
7
14
4
62
78
9
3
2
3
6
34x
3x
4
2
20
0
8
16
8
9
4
9
37
55
11
2
1
7
109
15
3
34
4
4
5
4
57
408x
-
24
45
61
71
17
7
14
11
15
<2
<2x
<2
<2
60
17
57x
<2
<2
11
6
48
7
58
<2
<2
12x
<2
3
12x
-
5
10
18
13x
1x
16
7
1
18
7
7x
13
2
11
16
14
9
5x
12
18
6x
3
10
10x
6
18
15
1x
15
6
1
8
3
0
2
2
6x
8
5x
7x
8
5
3
-
18
11
20
15x
3x
6
15
1
16
22
22x
7
19
12
16
7
4
26x
16
9
14x
14
9
13x
22
4
13
2x
2
10
8
20
6
4
9
4
8x
20
20x
13x
17
20
10
-
GDP per capita
average annual
growth rate (%)
GNI per
capita
(US$)
2006
1970-1990
290
42670
27250
1000
260
640
66530
1230x
9070x
770
7990
4890
770
1400
2920
1420
8190
18100
12000x
4850
5780
250
8840
5110
3930
2270
d
780
12510x
750
3910
8650
240
29320
9870
18890
680
130x
5390
27570
1300
810
3200
2430
43580
57230
1570
390
350
2990
3060
840
350
2170
13340
2970
5400
1340x
-
1
2
1
-4
-2
-1
3
3
3
0
-1
3
-1
1
3
0.9x
1
6.3x
5.3x
3
-0.1x
-2
0
3
0
6
3
-1
0
2
3
0
-2.2x
2
2
1
2
5
-1
1
3
2
-
T H E S TAT E O F T H E W O R L D ’ S C H I L D R E N 2 0 0 8
% of central government
expenditure (1995-2005*)
allocated to:
defence
ODA inflow
in millions
US$
2005
ODA inflow
as a % of
recipient
GNI
2005
11
4
3
6x
3x
5
33
20
4
11x
5
4
3
5
13
36x
7
4
10x
29
5
3
38x
4
18
28
8
5
6
24
9
16x
6
11x
2
5
8
-
9
428
740
515
6437
21
1102
31
1666
23
20
266
51
398
562
576
4
11
5
44
32
26
689
19
343
0
198
236
700
1189
1829
44
46
78
241
1505
-171
230
185
87
32
-2
376
464
28
9
0
6
15
15
9
0
25
0
2
15
0
6
1
1
1
28
1
1
1
12
47
0
8
3
28
0
67
0
0
5
8
4
2
0
11
12
0
4
31
4
14
0
1
0
0
0
Debt service
as a % of
exports of
goods and services
1990
2005
12x
2
12
22
12
16
3
37
12
6
23
4
0
10
3
2
3
5
28
14
7
8
10x
10
25x
10
4
6
20
25
14
8
2
18
22
27
-
5x
6
6x
16
7
9
17
9
11
25
16
28
17
9x
7
23
6
11
5
31x
9x
6
8
13x
16x
7x
6x
4
6
2
2
6x
2
14
9x
0x
2x
4x
12
29
30x
-
…TABLE 7
Uganda
Ukraine
United Arab Emirates
United Kingdom
United States
Uruguay
Uzbekistan
Vanuatu
Venezuela (Bolivarian Republic of)
Viet Nam
Yemen
Zambia
Zimbabwe
1990-2006
Average
annual
rate of
inflation
(%)
1990-2006
% of
population
below
US$1
a day
1995-2005*
health
education
3.1
-1.5
-0.9x
2.5
2.1
1.2
0.7
-0.3
-0.6
6
1.5
0
-2.4
8
104
3x
3
2
20
117
3
36
10
18
35
76
85x
<2
<2
<2
19
<2x
16
64
56
2x
3
7
15
24
7
8
4
4
13
8
15x
6
17
4
3
8
21
14
22
14
24
1.1
1.2
1
2.2
3.9
6.7
1.4
1.1
1.9
4.1
2.3
2.3
35
38
29
15
6
5
37
74
2
19
62
8
43
34
52
4
32
9
9
2
20
38
19
5
2
1
7
7
18
3
5
14
13
3
7
15
6
4
9
14
5
GDP per capita
average annual
growth rate (%)
GNI per
capita
(US$)
2006
1970-1990
300
1950
23950x
40180
44970
5310
610
1710
6070
690
760
630
340x
-4.8x
2
2
1
-0.5x
-2
-2
0
851
1171
553
2104
777
2371
4847
4264
37217
1967
438
7406
0
2
6
1
2
3
2
% of central government
expenditure (1995-2005*)
allocated to:
Debt service
as a % of
exports of
goods and services
defence
ODA inflow
in millions
US$
2005
ODA inflow
as a % of
recipient
GNI
2005
1990
2005
26x
3
30
7
20
4
5
19
4
7
1198
410
15
172
39
49
1905
336
945
368
15
1
0
1
12
0
4
3
16
8
47
31
2
22
7x
4
13
19
7
10x
27
21x
1
9
3x
2
22x
6x
15
14
11
4
9
12
10
14
11
28779
12571
16208
28451
9260
8968
5363
4006
82952
25979
84828
5
4
9
3
1
0
0
0
1
10
0
11
6
20
21
21
16
20
18
13
18
10
6
15
14
6
18
18
13
8
14
SUMMARY INDICATORS
Sub-Saharan Africa
Eastern and Southern Africa
West and Central Africa
Middle East and North Africa
South Asia
East Asia and Pacific
Latin America and Caribbean
CEE/CIS
Industrialized countries§
Developing countries§
Least developed countries§
World
§ Also includes territories within each country category or regional group. Countries and territories in each country category or regional group are listed on page 148.
DEFINITIONS OF THE INDICATORS
MAIN DATA SOURCES
GNI per capita – Gross national income (GNI) is the sum of value added by all resident producers
plus any product taxes (less subsidies) not included in the valuation of output plus net receipts of
primary income (compensation of employees and property income) from abroad. GNI per capita is
gross national income divided by midyear population. GNI per capita in US dollars is converted
using the World Bank Atlas method.
GDP per capita – Gross domestic product (GDP) is the sum of value added by all resident producers
plus any product taxes (less subsidies) not included in the valuation of output. GDP per capita is
gross domestic product divided by midyear population. Growth is calculated from constant price
GDP data in local currency.
% of population below US$1 a day – Percentage of the population living on less than US$1.08 a
day at 1993 international prices (equivalent to US$1 a day in 1985 prices, adjusted for purchasing
power parity). As a result of revisions in purchasing power parity exchange rates, poverty rates for
individual countries cannot be compared with poverty rates reported in previous editions.
GNI per capita – World Bank.
GDP per capita – World Bank.
Rate of inflation – World Bank.
% of population below US$1 a day – World Bank.
Expenditure on health, education and defence – International Monetary Fund (IMF).
ODA – Organisation for Economic Co-operation and Development (OECD).
Debt service – World Bank.
ODA – Net official development assistance.
Debt service – Sum of interest payments and repayments of principal on external public and
publicly guaranteed long-term debts.
NOTES
a: low income ($905 or less).
b: lower-middle income ($906 to $3,595).
c: upper-middle income ($3,596 to $11,115).
d: high income ($11,116 or more).
- Data not available.
x Data refer to years or periods other than those specified in the column heading, differ from the standard definition
or refer to only part of a country. Such data are not included in the calculation of regional and global averages.
* Data refer to the most recent year available during the period specified in the column heading.
S TAT I S T I C A L TA B L E S
141
TABLE 8. WOMEN
Maternal mortality ratio†
Countries and territories
Life
expectancy:
females as a
% of males
2006
Afghanistan
Albania
Algeria
Andorra
Angola
Antigua and Barbuda
Argentina
Armenia
Australia
Austria
Azerbaijan
Bahamas
Bahrain
Bangladesh
Barbados
Belarus
Belgium
Belize
Benin
Bhutan
Bolivia
Bosnia and Herzegovina
Botswana
Brazil
Brunei Darussalam
Bulgaria
Burkina Faso
Burundi
Cambodia
Cameroon
Canada
Cape Verde
Central African Republic
Chad
Chile
China
Colombia
Comoros
Congo
Congo, Democratic Republic of the
Cook Islands
Costa Rica
Côte d’Ivoire
Croatia
Cuba
Cyprus
Czech Republic
Denmark
Djibouti
Dominica
Dominican Republic
Ecuador
Egypt
El Salvador
Equatorial Guinea
Eritrea
Estonia
Ethiopia
Fiji
Finland
France
142
100
109
104
108
111
110
106
107
112
108
104
103
108
119
108
108
104
105
107
107
101
111
106
110
106
106
109
102
106
109
106
106
108
105
111
107
105
106
106
104
110
105
106
109
106
105
109
108
107
109
105
109
117
105
107
108
109
Adult
literacy rate:
females as a
% of males
2000-2006*
30
99
75
65
100
99
98x
94
76
99x
100x
48
87
95
103
101
95
99
55
78
75
78
86
52
32
100
92
100
87
67
100
64
98
100
96
100
98
71
96
87
100
46
-
Enrolment and attendance ratios:
females as a % of males
net
net
Contraceptive
primary school
secondary school
prevalence
2000-2006*
2000-2006*
(%)
enrolled attending enrolled attending
2000-2006*
100
97
96
99
105
101
102
99
102
100
103
100
97
100
103
81
99
102
99
100
101
99
80
92
97
101
98
84
69
98
100
100
81
120
99
102
81
99
98
100
102
101
81
102
101
101
95
100
91
84
100
93
99
100
100
61
100
99
102
99
100
101
106
101
78
91
99
97
104
100x
90
97
104
94
99x
84
76
102
100
101
89
102
86
98
105
98
98
93
100
-
97
105
110
108
104
101
96
102
107
102
101
101
101
101
48
99
109
108
106
98
69
81
109
69
31
109
110
110
58
102
101
102
102
67
100
126
102
93
104
67
103
68
106
100
102
33
97
114
91
102
97
110
114
102
63
98
100
122
119x
88
75
88
93
63
54
113
110
108
83
110
69
84
144
93
96
91
77
-
T H E S TAT E O F T H E W O R L D ’ S C H I L D R E N 2 0 0 8
10
60
61
6
53x
53
51x
55
62x
58
55x
73
78x
56x
17
31
58
36
48
77x
86x
17
9
40
29
75x
53x
19
3
56x
87
78
26
44
31
44
96
13
77
69x
9
50x
61
73
59
67
8
70x
15
44
75x
Antenatal
care
coverage
(%)
2000-2006*
16
97
89
66
100
99
93
100x
100x
70
97x
48
100
99
96
88
51
79
99
97
97
100x
85
92
69
82
99
69
39
95x
90
94
75
86
68
92
85
100
99x
67
100
99
84
70
86
86
70
28
100x
99x
Skilled
attendant Institutional
at delivery
deliveries
(%)
(%)
2000-2006* 2000-2006*
14
100
95
45
100
99
98
100x
100x
100
99
98x
20
100
100
84x
78
56
67
100
94
88x
99x
99
54
34
44
63
98
89x
53
14
100
98
96
62
83
61
98
99
57
100
100
100
61
100
96
99x
74
92
65
28
100
6
99
100x
99x
13
98
95
16x
99
97
74
98x
16
100
77
78
37
57
100
80x
97
51
29
22
61
49x
51
13
100
83
92
43x
82
94
54
74
95
74
65
69
26
5
100
-
2005
2000-2006*
reported
adjusted
Lifetime
risk of
maternal
death. 1 in:
1600
17
120x
0
39
27
26
46x
320
0x
10
130
500x
260
230
3
330x
76
0x
10
480x
620
470
670
76
540
1100
17
48
78
380
780
1300
6x
36
540
7
37
0x
5
10x
74x
0
92
110
84
71
1000x
29
670
38x
6x
10x
1800
92
180
1400
77
76
4
4
82
16
32
570
16
18
8
52
840
440
290
3
380
110
13
11
700
1100
540
1000
7
210
980
1500
16
45
130
400
740
1100
30
810
7
45
10
4
3
650
150
210
130
170
680
450
25
720
210
7
8
8
490
220
12
530
980
13300
21500
670
2700
1300
51
4400
4800
7800
560
20
55
89
29000
130
370
2900
7400
22
16
48
24
11000
120
25
11
3200
1300
290
52
22
13
1400
27
10500
1400
6400
18100
17800
35
230
170
230
190
28
44
2900
27
160
8500
6900
…TABLE 8
Maternal mortality ratio†
Life
expectancy:
females as a
% of males
2006
Gabon
Gambia
Georgia
Germany
Ghana
Greece
Grenada
Guatemala
Guinea
Guinea-Bissau
Guyana
Haiti
Holy See
Honduras
Hungary
Iceland
India
Indonesia
Iran (Islamic Republic of)
Iraq
Ireland
Israel
Italy
Jamaica
Japan
Jordan
Kazakhstan
Kenya
Kiribati
Korea, Democratic People’s Republic of
Korea, Republic of
Kuwait
Kyrgyzstan
Lao People’s Democratic Republic
Latvia
Lebanon
Lesotho
Liberia
Libyan Arab Jamahiriya
Liechtenstein
Lithuania
Luxembourg
Madagascar
Malawi
Malaysia
Maldives
Mali
Malta
Marshall Islands
Mauritania
Mauritius
Mexico
Micronesia (Federated States of)
Moldova, Republic of
Monaco
Mongolia
Montenegro
Morocco
Mozambique
Myanmar
Namibia
102
104
112
107
101
106
105
111
106
107
109
106
111
112
104
105
106
105
107
106
105
108
108
109
105
118
104
106
110
105
113
104
116
106
101
104
107
117
108
106
101
107
102
109
105
106
110
107
102
111
110
106
106
103
111
102
Adult
literacy rate:
females as a
% of males
2000-2006*
91
76
96
84
42
100
66
93
88
76
99
116
92
99x
90
97
99x
79
100
122
79
81
100
87
72x
92
100
48x
103x
72
92
97
99
100
95
61
45x
91
97
Enrolment and attendance ratios:
females as a % of males
net
net
Contraceptive
primary school
secondary school
prevalence
2000-2006*
2000-2006*
(%)
enrolled attending enrolled attending
2000-2006*
100
99
100
100
101
100
99
96
87
72
102
98
97
93
97
110
86
100
101
99
100
100
102
98
101
102
99
99
99
94
103
99
106
78
102
100
100
99
105
99
100
80
95
99
100
102
100
100
102
93
91
102
107
100
103
101x,y
100
95
87
98
100
106
104
101
101
97
88
101
100
99
100
102
95
100
107
104
102
73
91
100
101
102
99
96
90
101
100
84
100
90
102
103
91
55
55
100
102
98
95
70
107
100
101
104
101
104
99
100
109
100
105
101
85
158
55
111
100
108
100x
88
114
110
99
107
82
101
103
103
114
84
75
97
133
106
87
100
104x
63
88
111
117
124
91
104
74
105
105
100
108
102
83
111
169
124
96
73
60
104
107
102
92
88
94
138
33
18
47
75x
17
54
43
9
10
35
32
65
77x
56
57
74
50
60x
69
56
56
51
39
21x
62x
81x
50x
48
32
48x
58
37
10
45x
47x
27
42
55x
39
8
34
8
76
74
45x
68
66
39
63
17
34
44
Antenatal
care
coverage
(%)
2000-2006*
94
98
94
92
100
84
82
78
90
85
92
74
92
77x
84
91
99
100
88
88x
95x
97
27
96
90
85
81x
80
92
79
81
57
64
86x
98
99
97
68
85
76
91
Skilled
attendant Institutional
at delivery
deliveries
(%)
(%)
2000-2006* 2000-2006*
86
57
99
50
100
41
38
39
94
26
67
100
47
72
90
89
100
97
100x
100
100
42
85x
97
100x
98x
98
19
100
98x
55
51
94x
100
100
51
54
98
84
41
98x
95x
57
98
86x
88
100
99
99
63
48
57
76
85
55
92
49
42
31
36
25
67
41
40
84
63
100
94
97
100
40
98x
97
52
36
32
54
98
38
49
98
86
99
99
100
61
48
16
75
2005
2000-2006*
reported
adjusted
Lifetime
risk of
maternal
death. 1 in:
520
730
23
8x
210x
1x
0
150
980
410
120
630
110x
4
300
310
37x
290x
6x
5x
7x
95
8x
41x
70
410
56
110x
20x
5x
100
410
10
100x
760
580x
77x
16
0x
470
980
28
140
580
74
750
22
62
270x
19
93
230
410
320
270
520
690
66
4
560
3
290
910
1100
470
670
280
6
4
450
420
140
300
1
4
3
170
6
62
140
560
370
14
4
150
660
10
150
960
1200
97
11
12
510
1100
62
120
970
8
820
15
60
22
46
240
520
380
210
53
32
1100
19200
45
25900
71
19
13
90
44
93
13300
12700
70
97
300
72
47600
7800
26600
240
11600
450
360
39
140
6100
9600
240
33
8500
290
45
12
350
7800
5000
38
18
560
200
15
8300
22
3300
670
3700
840
150
45
110
170
S TAT I S T I C A L TA B L E S
143
TABLE 8. WOMEN
Maternal mortality ratio†
Nauru
Nepal
Netherlands
New Zealand
Nicaragua
Niger
Nigeria
Niue
Norway
Occupied Palestinian Territory
Oman
Pakistan
Palau
Panama
Papua New Guinea
Paraguay
Peru
Philippines
Poland
Portugal
Qatar
Romania
Russian Federation
Rwanda
Saint Kitts and Nevis
Saint Lucia
Saint Vincent and
the Grenadines
Samoa
San Marino
Sao Tome and Principe
Saudi Arabia
Senegal
Serbia
Seychelles
Sierra Leone
Singapore
Slovakia
Slovenia
Solomon Islands
Somalia
South Africa
Spain
Sri Lanka
Sudan
Suriname
Swaziland
Sweden
Switzerland
Syrian Arab Republic
Tajikistan
Tanzania, United Republic of
Thailand
The former Yugoslav
Republic of Macedonia
Timor-Leste
Togo
Tonga
Trinidad and Tobago
Tunisia
Turkey
144
Enrolment and attendance ratios:
females as a % of males
net
net
Contraceptive
primary school
secondary school
prevalence
2000-2006*
2000-2006*
(%)
enrolled attending enrolled attending
2000-2006*
Antenatal
care
coverage
(%)
2000-2006*
Skilled
attendant Institutional
at delivery
deliveries
(%)
(%)
2000-2006* 2000-2006*
Life
expectancy:
females as a
% of males
2006
Adult
literacy rate:
females as a
% of males
2000-2006*
101
106
105
109
97
102
106
104
104
101
107
111
106
107
106
112
108
102
110
123
107
105
56
100
35
77
91
85
55
98
81
99
88
102
96
100
98
99
85
-
92
99
100
98
72
89
100
100
101
77
97
99
101
101
102
101
100
100
99
101
104
105
98
95
109
69
88
101
82
101
100
101
104
-
102
103
115
67
86
105x
100
107
100
75
110
99
120
102
110
98
104
91
98
125
83
134
100
87
78
99
100
127
100
-
48
79x
75x
69
11
13
50
32
28
17
26x
73
71
49
49x
43x
70
17
54
47x
44
95x
86
46
58
99
100
36
72
78x
94
92
88
94
94
100
99
19
100x
100x
67
33
35
100
99
95
31
100
93
41
77
73
60
100
100
99x
99
99
39
100
100
106
109
106
106
107
107
108
105
111
110
103
105
104
109
111
105
110
101
106
107
105
108
104
114
99
85
86
57
95
101
51
87x
100
96x
97x
97
73
95
96
84
99
79
96
96
101
99
103
96
101
101
99
95
100
99
99
83
103
101
100
100
95
97
98
96
101
102
100
100
83
104x
95
99
99
99
99
106
100
125
113
113
108
79
106
101
86
112
103
138
113
101
93
94
85
106
105
80
103
77
50
117x
105
120
138
102
83
100
109
48
43x
30
32x
12
41
5
62x
74x
74x
7
15
60
81x
70
7
42
48
82x
58
38
26
77
95
97
90x
87
98
81
98x
26
92
95
60
91
90
84
77
78
98
107
103
106
103
106
106
107
96
57
100x
99
78
84
100
86
96
100
100
95
96
97y
93
100
98
96
98
47
123
103
110
85
99
71
107
89
10
17
33
43
66
71
81
61
84
96
92
81
T H E S TAT E O F T H E W O R L D ’ S C H I L D R E N 2 0 0 8
2005
2000-2006*
reported
adjusted
Lifetime
risk of
maternal
death. 1 in:
18
66
17
33
97
94
28
92
74
70
38
98x
98
28
-
280
7x
15x
87
650
6x
15
530x
0x
40
370x
170
190
170x
4
8x
10x
17
23
750
0
35
830
6
9
170
1800
1100
7
64
320
130
470
150
240
230
8
11
12
24
28
1300
-
31
10200
5900
150
7
18
7700
420
74
270
55
170
140
140
10600
6400
2700
3200
2700
16
-
100
100x
81
91x
52
99
43
100x
100
100
85x
33
92
96
87
85
74
93
83
43
97
78
91x
62
99
19
9
97
70
62
47
97
0
29
150
430
57
1800
6x
6
17x
140x
1000
150x
6x
43
550x
150
230x
5x
5x
65
97
580
24
18
980
2100
14
6
6
220
1400
400
4
58
450
72
390
3
5
130
170
950
110
1400
21
8
6200
13800
14200
100
12
110
16400
850
53
530
120
17400
13800
210
160
24
500
99
18
62
95
98
90
83
98
10
63
97
89
78
13
480x
78
45x
69x
29
10
380
510
45
100
44
6500
35
38
1400
500
880
…TABLE 8
Maternal mortality ratio†
Life
expectancy:
females as a
% of males
2006
Turkmenistan
Tuvalu
Uganda
Ukraine
United Arab Emirates
United Kingdom
United States
Uruguay
Uzbekistan
Vanuatu
Venezuela (Bolivarian Republic of)
Viet Nam
Yemen
Zambia
Zimbabwe
115
102
119
106
106
107
110
110
106
108
105
105
101
97
Adult
literacy rate:
females as a
% of males
2000-2006*
Enrolment and attendance ratios:
females as a % of males
net
net
Contraceptive
primary school
secondary school
prevalence
2000-2006*
2000-2006*
(%)
enrolled attending enrolled attending
2000-2006*
Antenatal
care
coverage
(%)
2000-2006*
Skilled
attendant Institutional
at delivery
deliveries
(%)
(%)
2000-2006* 2000-2006*
99x
75
99
99
101x
100
93x
48
79x
92
100
99
100
101
101
98
101
95
72
100
101
100
99
102
100
102
100
60x
105
102
88
94
105
103
102
86
115
96
46
79
94
100
100
103
99
143
101
37x
112
100
48
32
24
66
28x
84
76x
84x
65
28
77x
76
23
34
60
99
94
99
97x
94x
99
94
91
41
93
95
100
100
42
100
99x
99x
99x
100x
100
88x
95
88
27
43
80
98
41
100
99x
97
95
64
20
44
68
72
74
69
77
66
92
99
96
83
68
86
93
98
87
94
92
99
99
98
101
96
94
96
95
101
89
97
98
101**
101
98
98**
97
98**
84
88
78
93
102**
106
94
102
97**
85
98**
87
91
85
96
90
105**
97
93**
93
94**
23
30
17
55
53
79
70
63
61
30
61
69
71
67
72
65
89
94
90
75
61
75
43
40
46
79
41
87
95
99
59
38
63
36
32
39
68
36
69
86
89
53
27
53
2005
2000-2006*
reported
adjusted
Lifetime
risk of
maternal
death. 1 in:
14
510
13
3x
7x
8x
26x
28
68x
60
160
370
730
560
130
550
18
37
8
11
20
24
57
150
430
830
880
290
25
5200
1000
8200
4800
2100
1400
610
280
39
27
43
920
760
1100
210
500
150
130
46
8
450
870
400
22
29
17
140
59
350
280
1300
8000
76
24
92
SUMMARY INDICATORS
Sub-Saharan Africa
Eastern and Southern Africa
West and Central Africa
Middle East and North Africa
South Asia
East Asia and Pacific
Latin America and Caribbean
CEE/CIS
Industrialized countries§
Developing countries§
Least developed countries§
World
104
104
104
105
104
106
109
115
108
105
105
106
-
§ Also includes territories within each country category or regional group. Countries and territories in each country category or regional group are listed on page 148.
DEFINITIONS OF THE INDICATORS
Life expectancy at birth – Number of years newborn children would live if subject to the mortality risks prevailing
for the cross section of population at the time of their birth.
Adult literacy rate – Number of literate persons aged 15 and above, expressed as a percentage of the total
population in that age group.
Enrolment and attendance ratios: females as a % of males – Girls’ net enrolment and attendance ratios divided
by those of boys, as a percentage.
Primary or secondary school net enrolment ratio – Number of children enrolled in primary or secondary school
who are of official primary or secondary school age, expressed as a percentage of the total number of children of
official primary or secondary school age.
Primary school net attendance ratio – Number of children attending primary or secondary school who are of
official primary school age, expressed as a percentage of the total number of children of official primary school age.
Secondary school net attendance ratio – Number of children attending secondary or tertiary school who are of official
secondary school age, expressed as a percentage of the total number of children of official secondary school age.
Contraceptive prevalence – Percentage of women in union aged 15-49 currently using contraception.
Antenatal care – Percentage of women 15-49 years old attended at least once during pregnancy by skilled health
personnel (doctors, nurses or midwives).
Skilled attendant at delivery – Percentage of births attended by skilled health personnel (doctors, nurses or midwives).
Institutional deliveries – Proportion of women 15-49 years old who gave birth in the two years preceding the survey
and delivered in a health facility.
Maternal mortality ratio – Annual number of deaths of women from pregnancy-related causes per 100,000 live births.
This ‘reported’ column shows country-reported figures that are not adjusted for under-reporting and misclassification.
Lifetime risk of maternal death – Lifetime risk of maternal death takes into account both the probability of
becoming pregnant and the probability of dying as a result of that pregnancy accumulated across a woman’s
reproductive years.
NOTES
x
y
*
**
MAIN DATA SOURCES
Life expectancy – United Nations Population Division.
Adult literacy – UNESCO Institute for Statistics (UIS).
Primary and secondary school enrolment – UIS.
Primary and secondary school attendance – Demographic and Health Surveys
(DHS) and Multiple Indicator Cluster Surveys (MICS).
Contraceptive prevalence – DHS, MICS, United Nations Population Division and UNICEF.
Antenatal care – DHS, MICS, World Health Organization (WHO) and UNICEF.
Skilled attendant at delivery – DHS, MICS, WHO and UNICEF.
Institutional deliveries – DHS, MICS, WHO and UNICEF.
Maternal mortality – WHO and UNICEF.
Lifetime risk – WHO and UNICEF.
† The maternal mortality data in the column headed ‘reported’ are those reported
by national authorities. Periodically, UNICEF, WHO, UNFPA and the World Bank
evaluate these data and make adjustments to account for the well-documented
problems of under-reporting and misclassification of maternal deaths and to
develop estimates for countries with no data. The column with ‘adjusted’
estimates for the year 2005 reflects the most recent of these reviews.
Data not available.
Data refer to years or periods other than those specified in the column heading, differ from the standard definition or refer to only part of a country.
Such data are not included in the calculation of regional and global averages.
Data refer to years or periods other than those specified in the column heading, differ from the standard definition or refer to only part of a country.
Such data are included in the calculation of regional and global averages.
Data refer to the most recent year available during the period specified in the column heading.
Excludes China.
S TAT I S T I C A L TA B L E S
145
TABLE 9. CHILD PROTECTION
daughtersb
Attitude
towards
domestic
violence
1999-2006*
Child
disability
1999-2006*
Child
discipline
2005-2006*
Female genital mutilation/cutting 2000-2006*
Child labour
(5-14 years) 1999-2006*
Countries and territories
Afghanistan
Albania
Algeria
Angola
Argentina
Armenia
Azerbaijan
Bahrain
Bangladesh
Belarus
Belize
Benin
Bhutan
Bolivia
Bosnia and Herzegovina
Botswana
Brazil
Burkina Faso
Burundi
Cambodia
Cameroon
Cape Verde
Central African Republic
Chad
Chile
China
Colombia
Comoros
Congo
Congo, Democratic Republic of the
Costa Rica
Côte d’Ivoire
Cuba
Djibouti
Dominican Republic
Ecuador
Egypt
El Salvador
Equatorial Guinea
Eritrea
Ethiopia
Gabon
Gambia
Georgia
Ghana
Guatemala
Guinea
Guinea-Bissau
Guyana
Haiti
Honduras
India
Indonesia
Iraq
Jamaica
Jordan
Kazakhstan
Kenya
Korea, Democratic People’s Republic of
Kyrgyzstan
Lao People’s Democratic Republic
Lebanon
Lesotho
Liberia
Madagascar
Malawi
Maldives
Mali
Mauritania
Mexico
Moldova, Republic of
Mongolia
Montenegro
Morocco
Mozambique
Myanmar
Namibia
Nepal
Nicaragua
Niger
Nigeria
Occupied Palestinian Territory
Pakistan
146
total
male
female
30
12
5
24
7y
11
5
13
5
40
26y
19y
22
5
6y
47y
19
45y
31
3y
47
53
3
5
27
32
5
35
8
10
12
7
6y
28
53
25
34
29
25
39
19
16
12
4y
11
6
2
26
4
25
7
23
32
29
34
4y
16y
32
18
10
11y
13y
31y
15
38y
13y
-
28
14
6
22
8y
11
6
18
6
39
23y
16y
22
7
8y
46y
19
45y
31
4y
44
54
3
6
26
29
6
36
8
12
12
8
9y
28
59
20
34
25
26
41
21
16
5y
12
7
2
27
4
24
8
25
36
28
35
5y
15y
32
19
12
13y
15y
30y
18
39y
-
33
9
4
25
5y
11
3
8
4
42
29y
22y
22
4
4y
48y
19
45y
30
3y
49
51
2
4
28
34
3
34
8
7
13
5
4y
28
46
29
34
32
24
37
17
15
4y
9
5
2
25
3
26
6
21
28
29
33
3y
16y
33
17
8
9y
12y
33y
11
38y
-
Child marriage
1987-2006*
Birth registration
1999-2006◊
total urban rural
total urban rural
43
8
2
10
64
7
37
26
6
10
24
48
18
23
36
61
72
23
30
31
35
5
41
26y
17
27
47
49
34
36
16
22
34
63
24
30
39
45
24
17
9
11
7
25
10
11
23
40
39
51
65
37
28y
19
9
5
16
56
10
51
43
75
43
19
32
7
2
7
58
6
25
22
2
13
22
29
14
23
57
65
19
23
24
27
5
21y
31
27
30
24
15
25
45
14
33
28
15
16
7
11
6
19
7
13
29
38
46
32
31y
16
7
5
12
41
9
36
27
21
8
2
16
69
10
45
37
7
9
30
61
18
57
64
73
38
33
40
43
13
34y
60
55
49
45
28
44
75
32
46
53
33
19
11
12
9
27
14
26
42
53
74
42
21y
22
12
5
21
66
10
55
52
37
6
98
99
29
91y
96
97
10
93y
70
82
100
58
89y
64
60
66
70
49
9
96y
90
83
81y
34
55
100y
89
78
32
7
89
55
93y
51
43
39
97
81
94
41
55
95
89
99
48y
99
94
59
26
75
73
47y
55
98
98
98
85
65y
71
35
81
32
33y
96y
-
12
4
97
98
99
99
34
19
97
95
98
96
13
9
92y 94y
78
66
83
79
99 100
66
52
86
58
62
60
71
66
86
58
72
36
36
3
97
77
87
83
88y 75y
30
36
79
41
100y 100y
90
82
82
70
43
24
29
5
90
87
57
54
97y 89y
69
42
78
33
53
33
99
96
95
93
59
35
69
43
95
96
88
89
99
99
64y 44y
99
99
96
93
71
56
39
24
87
72
84y 34y
72
42
98
98
98
99
98
99
92
80
66y 64y
82
64
90
73
71
25
52y 25y
97y 96y
-
T H E S TAT E O F T H E W O R L D ’ S C H I L D R E N 2 0 0 8
womena (15-49 years)
total
urban
rural
total
total
total
total
17
73
1
26
45
36
93
96
89
74
78
4
96
45
32
92
71
2
19
-
13
76
1
21
47
34
93
92
86
69
72
2
94
39
21
90
65
2
28
-
20
71
2
29
44
39
96
98
91
76
83
6
96
48
36
93
77
2
14
-
6
25
1
7
21
9
49
28y
63
38
64
1
57
35
21
73
66
1
10
-
30
68
22
60
5
71
55
56
76
65
9
50
81
74
30y
47
86
52
29
16
54
25
59
6
10
68
38
28
28
89
21
20
11
23
17
70
65
-
11
1y
18
7
23
31
3y
3y
35
8y
16
15
15
17
13
-
49
86
83
36
83
92
88
90
70
92y
84
89
80
84
87
52
51
79
61
95y
-
…TABLE 9
daughtersb
Attitude
towards
domestic
violence
1999-2006*
Child
disability
1999-2006*
Child
discipline
2005-2006*
Female genital mutilation/cutting 2000-2006*
Child labour
(5-14 years) 1999-2006*
Countries and territories
Child marriage
1987-2006*
Birth registration
1999-2006◊
total urban rural
total urban rural
total
male
female
Panama
3
Paraguay
15
Peru
19
Philippines
12
Portugal
3y
Romania
1
Rwanda
35
Sao Tome and Principe
8
Senegal
22
Serbia
4
Sierra Leone
48
Somalia
49
South Africa
Sri Lanka
8
Sudan
13
Suriname
Swaziland
9
Syrian Arab Republic
4
Tajikistan
10
Tanzania, United Republic of
36
Thailand
8
The former Yugoslav Republic of Macedonia 6
Timor-Leste
4
Togo
29
Trinidad and Tobago
1
Tunisia
Turkey
5
Turkmenistan
Uganda
36
Ukraine
7
Uzbekistan
2
Venezuela (Bolivarian Republic of)
8
Viet Nam
16
Yemen
11y
Zambia
12y
Zimbabwe
13y
5
17
20
13
4y
1
36
8
24
5
49
45
9
14
9
5
9
37
8
7
4
29
1
4
37
8
2
9
15
11y
11y
12y
2
12
19
11
3y
1
35
7
21
4
48
54
7
12
9
3
11
34
8
5
4
30
1
6
36
7
2
6
16
12y
12y
14y
24
17
14
13
33
39
6
56
45
8
12y
27y
13
13
41
20
4
24
8
10y
18
7
54
6
7
10
37
42
29
18
13
10
9
31
23
4
34
35
5
19y
15
13
23
12
3
15
7y
9
34
6
9
3
32
21
32
30
22
14
37
55
8
66
52
12
34y
12
13
49
23
4
36
14y
6
59
10
7
13
49
36
36
38
33
10
11**
12
5
19**
31
-
34
33
34
8
10**
10
5
17**
28
-
40
36
44
17
45
19**
26
11
34**
49
-
24
20
27
11
30
12**
24
7
23**
37
-
47
44
53
19
53
25**
31
9
45**
57
-
93
83
82
69
55
99
48
3
64
95
53
95
88
8
99
94
53y
78
96
96
4
100
100
92
87
10
42
93
87
79
70
75
99
62
6
82
94
72
96
85
22
100
95
93
96
11
100
100
94
16
56
92
78
83
67
44
99
44
2
46
94
50
95
90
4
99
93
69
95
3
100
100
85
6
35
womena (15-49 years)
total
urban
rural
total
total
total
total
28
94
98
90
15
6
23
1
-
22
86
97
92
7
4
26
1
-
34
97
98
88
18
7
22
1
-
20
35
46
58
4
1
20
-
24
48
32
65
6
85
76y
74y
60
21
53
8
39
38y
77
5
70
64
85
51
2y
16
11
23
12
10
2
-
73
92
87
74
69
90
75
70
93
-
36
28
-
31
29
-
40
29
-
19
15
-
66
66
65
53
34**
31
51**
-
-
SUMMARY INDICATORS
Sub-Saharan Africa
Eastern and Southern Africa
West and Central Africa
Middle East and North Africa
South Asia
East Asia and Pacific
Latin America and Caribbean
CEE/CIS
Industrialized countries§
Developing countries§
Least developed countries§
World
35
36
34
9
13
10**
11
5
16**
29
-
34
24
41
36
72**
89
49**
30
-
52
39
58
52
80**
93
64**
43
-
28
21
35
30
67**
83
37**
24
-
-
§ Also includes territories within each country category or regional group. Countries and territories in each country category or regional group are listed on page 148.
MAIN DATA SOURCES
DEFINITIONS OF THE INDICATORS
Child labour – Percentage of children 5-14 years old involved in child labour at the moment of the survey. A child is considered to be involved in child labour under the
following conditions: (a) children 5-11 years old who, during the week preceding the survey, did at least one hour of economic activity or at least 28 hours of domestic
work, or (b) children 12-14 years old who, during the week preceding the survey, did at least 14 hours of economic activity or at least 28 hours of domestic work.
Child labour background variables – Sex of the child; urban or rural place of residence; poorest 20 per cent or richest 20 per cent of the population
constructed from household assets (a more detailed description of the household wealth estimation procedure can be found at www.childinfo.org); mother’s
education reflecting mothers with and without some level of education.
Child marriage – Percentage of women 20-24 years old who were married or in union before they were 18 years old.
Birth registration – Percentage of children less than five years old who were registered at the moment of the survey. The numerator of this indicator includes
children whose birth certificate was seen by the interviewer or whose mother or caretaker says the birth has been registered. MICS data refer to children alive
at the time of the survey.
Female genital mutilation/cutting – (a) Women – the percentage of women 15-49 years old who have been mutilated/cut. (b) Daughters – the percentage of
women 15-49 years old with at least one mutilated/cut daughter. Female genital mutilation/cutting (FGM/C) is the cutting or alteration of the female genitalia
for social reasons.
Attitudes towards domestic violence – Percentage of women 15-49 years old who consider a husband to be justified in hitting or beating his wife for at
least one of the specified reasons. Women were asked whether a husband is justified in hitting or beating his wife under a series of circumstances, i.e., if his
wife burns the food, argues with him, goes out without telling him, neglects the children or refuses sexual relations.
Child disability – Percentage of children 2-9 years old with at least one reported disability (i.e., cognitive, motor, seizure, vision or hearing).
Child discipline – Percentage of children 2-14 years old that experience any psychological or physical punishment.
NOTES
Child labour – Multiple Indicator Cluster
Surveys (MICS) and Demographic and
Health Surveys (DHS).
Child marriage – MICS, DHS and other
national surveys.
Birth registration – MICS, DHS, other national
surveys and vital registration systems.
Female genital mutilation/cutting –
MICS, DHS and other national surveys.
Attitudes towards domestic violence –
MICS, DHS and other national surveys.
Child disability – MICS, DHS and other
national surveys.
Child discipline – MICS, DHS and other
national surveys.
y
Data not available.
Data refer to years or periods other than those specified in the column heading, differ from the standard definition or refer to only part of a country.
Such data are included in the calculation of regional and global averages.
* Data refer to the most recent year available during the period specified in the column heading.
◊ The global and regional estimates for birth registration included in this table are based on the sub-set of countries for which data are available for the period 1999-2006. Global and regional
estimates for a wider set of countries are available for the period 1997-2006 and can be found at www.childinfo.org/areas/birthregistration.
** Excludes China.
S TAT I S T I C A L TA B L E S
147
Summary indicators
Averages given at the end of each table are
calculated using data from the countries and
territories as grouped below.
Sub-Saharan Africa
Angola; Benin; Botswana; Burkina Faso;
Burundi; Cameroon; Cape Verde; Central
African Republic; Chad; Comoros; Congo;
Congo, Democratic Republic of the; Côte
d’Ivoire; Equatorial Guinea; Eritrea; Ethiopia;
Gabon; Gambia; Ghana; Guinea; GuineaBissau; Kenya; Lesotho; Liberia; Madagascar;
Malawi; Mali; Mauritania; Mauritius;
Mozambique; Namibia; Niger; Nigeria;
Rwanda; Sao Tome and Principe; Senegal;
Seychelles; Sierra Leone; Somalia; South
Africa; Swaziland; Tanzania, United Republic
of; Togo; Uganda; Zambia; Zimbabwe
Middle East and North Africa
Algeria; Bahrain; Djibouti; Egypt; Iran
(Islamic Republic of); Iraq; Jordan; Kuwait;
Lebanon; Libyan Arab Jamahiriya; Morocco;
Occupied Palestinian Territory; Oman; Qatar;
Saudi Arabia; Sudan; Syrian Arab Republic;
Tunisia; United Arab Emirates; Yemen
South Asia
Afghanistan; Bangladesh; Bhutan; India;
Maldives; Nepal; Pakistan; Sri Lanka
East Asia and Pacific
Brunei Darussalam; Cambodia; China; Cook
Islands; Fiji; Indonesia; Kiribati; Korea,
Democratic People’s Republic of; Korea,
Republic of; Lao People’s Democratic
Republic; Malaysia; Marshall Islands;
Micronesia (Federated States of); Mongolia;
Myanmar; Nauru; Niue; Palau; Papua New
Guinea; Philippines; Samoa; Singapore;
Solomon Islands; Thailand; Timor-Leste;
Tonga; Tuvalu; Vanuatu; Viet Nam
Latin America and Caribbean
Antigua and Barbuda; Argentina; Bahamas;
Barbados; Belize; Bolivia; Brazil; Chile;
148
Colombia; Costa Rica; Cuba; Dominica;
Dominican Republic; Ecuador; El Salvador;
Grenada; Guatemala; Guyana; Haiti; Honduras;
Jamaica; Mexico; Nicaragua; Panama;
Paraguay; Peru; Saint Kitts and Nevis; Saint
Lucia; Saint Vincent and the Grenadines;
Suriname; Trinidad and Tobago; Uruguay;
Venezuela (Bolivarian Republic of)
CEE/CIS
Albania; Armenia; Azerbaijan; Belarus;
Bosnia and Herzegovina; Bulgaria; Croatia;
Georgia; Kazakhstan; Kyrgyzstan; Moldova,
Republic of; Montenegro; Romania; Russian
Federation; Serbia; Tajikistan; the former
Yugoslav Republic of Macedonia; Turkey;
Turkmenistan; Ukraine; Uzbekistan
Industrialized countries/territories
Andorra; Australia; Austria; Belgium;
Canada; Cyprus; Czech Republic; Denmark;
Estonia; Finland; France; Germany; Greece;
Holy See; Hungary; Iceland; Ireland; Israel;
Italy; Japan; Latvia; Liechtenstein; Lithuania;
Luxembourg; Malta; Monaco; Netherlands;
New Zealand; Norway; Poland; Portugal; San
Marino; Slovakia; Slovenia; Spain; Sweden;
Switzerland; United Kingdom; United States
Developing countries/territories
Afghanistan; Algeria; Angola; Antigua and
Barbuda; Argentina; Armenia; Azerbaijan;
Bahamas; Bahrain; Bangladesh; Barbados;
Belize; Benin; Bhutan; Bolivia; Botswana;
Brazil; Brunei Darussalam; Burkina Faso;
Burundi; Cambodia; Cameroon; Cape Verde;
Central African Republic; Chad; Chile; China;
Colombia; Comoros; Congo; Congo, Democratic
Republic of the; Cook Islands; Costa Rica;
Côte d’Ivoire; Cuba; Cyprus; Djibouti;
Dominica; Dominican Republic; Ecuador;
Egypt; El Salvador; Equatorial Guinea;
Eritrea; Ethiopia; Fiji; Gabon; Gambia;
Georgia; Ghana; Grenada; Guatemala;
Guinea; Guinea-Bissau; Guyana; Haiti;
Honduras; India; Indonesia; Iran (Islamic
Republic of); Iraq; Israel; Jamaica; Jordan;
T H E S TAT E O F T H E W O R L D ’ S C H I L D R E N 2 0 0 8
Kazakhstan; Kenya; Kiribati; Korea, Democratic
People’s Republic of; Korea, Republic of;
Kuwait; Kyrgyzstan; Lao People’s Democratic
Republic; Lebanon; Lesotho; Liberia; Libyan
Arab Jamahiriya; Madagascar; Malawi;
Malaysia; Maldives; Mali; Marshall Islands;
Mauritania; Mauritius; Mexico; Micronesia
(Federated States of); Mongolia; Morocco;
Mozambique; Myanmar; Namibia; Nauru;
Nepal; Nicaragua; Niger; Nigeria; Niue;
Occupied Palestinian Territory; Oman;
Pakistan; Palau; Panama; Papua New
Guinea; Paraguay; Peru; Philippines; Qatar;
Rwanda; Saint Kitts and Nevis; Saint Lucia;
Saint Vincent/Grenadines; Samoa; Sao Tome
and Principe; Saudi Arabia; Senegal; Seychelles;
Sierra Leone; Singapore; Solomon Islands;
Somalia; South Africa; Sri Lanka; Sudan;
Suriname; Swaziland; Syrian Arab Republic;
Tajikistan; Tanzania, United Republic of;
Thailand; Timor-Leste; Togo; Tonga; Trinidad
and Tobago; Tunisia; Turkey; Turkmenistan;
Tuvalu; Uganda; United Arab Emirates;
Uruguay; Uzbekistan; Vanuatu; Venezuela
(Bolivarian Republic of); Viet Nam; Yemen;
Zambia; Zimbabwe
Least developed countries/territories
Afghanistan; Angola; Bangladesh; Benin;
Bhutan; Burkina Faso; Burundi; Cambodia;
Cape Verde; Central African Republic; Chad;
Comoros; Congo, Democratic Republic of the;
Djibouti; Equatorial Guinea; Eritrea; Ethiopia;
Gambia; Guinea; Guinea-Bissau; Haiti;
Kiribati; Lao People’s Democratic Republic;
Lesotho; Liberia; Madagascar; Malawi;
Maldives; Mali; Mauritania; Mozambique;
Myanmar; Nepal; Niger; Rwanda; Samoa;
Sao Tome and Principe; Senegal; Sierra
Leone; Solomon Islands; Somalia; Sudan;
Tanzania, United Republic of; Timor-Leste;
Togo; Tuvalu; Uganda; Vanuatu; Yemen;
Zambia
Measuring human development
An introduction to Table 10
If development is to be measured by a comprehensive and inclusive assessment, then
the need arises for a method of measuring
human as well as economic progress. From
UNICEF’s point of view, there is a need for an
agreed method of measuring the level of
child well-being and its rate of change.
The under-five mortality rate (U5MR) is used
in Table 10 (pages 150–153 ) as the principal
indicator of such progress. In 2006, for the
first time since records have been kept, the
number of children dying before their fifth
birthday fell below 10 million, to 9.7 million –
an important milestone in child survival.
Around 1960, approximately 20 million children were dying every year – highlighting
an important long-term decline in the global
number of under-five deaths.
The U5MR has several advantages. First, it
measures an end result of the development
process rather than an ‘input’, such as school
enrolment level, per capita calorie availability
or the number of doctors per thousand population – all of which are means to an end.
Second, the U5MR is known to be the result
of a wide variety of inputs: antibiotics to treat
pneumonia; insecticide-treated mosquito nets
to prevent malaria; the nutritional health and
the health knowledge of mothers; the level of
immunization and oral rehydration therapy use;
the availability of maternal and child health
services, including prenatal care; income and
food availability in the family; the availability of
safe drinking water and basic sanitation; and
the overall safety of the child’s environment.
Third, the U5MR is less susceptible to the
fallacy of the average than, for example, per
capita gross national income (GNI). This is
because the natural scale does not allow the
children of the rich to be one thousand times
as likely to survive, even if the human-made
scale does permit them to have one thousand times as much income. In other words,
it is much more difficult for a wealthy minor-
ity to affect a nation’s U5MR, and it therefore
presents a more accurate, if far from perfect,
picture of the health status of the majority of
children and of society as a whole.
The speed of progress in reducing the U5MR
can be measured by calculating its average
annual rate of reduction (AARR). Unlike the
comparison of absolute changes, the AARR
reflects the fact that the lower limits to
U5MR are approached only with increasing
difficulty. As lower levels of under-five mortality are reached, for example, the same
absolute reduction obviously represents a
greater percentage reduction. The AARR
therefore shows a higher rate of progress for
a 10-point reduction, for example, if that
reduction happens at a lower level of underfive mortality. A fall in the U5MR of 10 points
from 100 to 90 represents a reduction of
10 per cent, whereas the same 10-point fall
from 20 to 10 represents a reduction of 50
per cent. (A negative value for the percentage reduction indicates an increase in the
U5MR over the period specified.)
When used in conjunction with gross domestic product (GDP) growth rates, the
U5MR and its rate of reduction can therefore
give a picture of the progress being made by
any country, territory or region, and over any
period of time, towards the satisfaction of
some of the most essential of human needs.
As Table 10 shows, there is no fixed relationship between the annual reduction rate of
the U5MR and the annual rate of growth in
per capita GDP. Such comparisons help to
shed light on the relationship between economic advances and human development.
Finally, the table gives the total fertility rate
for each country and territory and the corresponding average annual rate of reduction.
It is clear that many of the nations that have
achieved significant reductions in their
U5MR have also achieved significant
reductions in fertility.
S TAT I S T I C A L TA B L E S
149
TABLE 10. THE RATE OF PROGRESS
Countries and
territories
Afghanistan
Albania
Algeria
Andorra
Angola
Antigua and Barbuda
Argentina
Armenia
Australia
Austria
Azerbaijan
Bahamas
Bahrain
Bangladesh
Barbados
Belarus
Belgium
Belize
Benin
Bhutan
Bolivia
Bosnia and Herzegovina
Botswana
Brazil
Brunei Darussalam
Bulgaria
Burkina Faso
Burundi
Cambodia
Cameroon
Canada
Cape Verde
Central African Republic
Chad
Chile
China
Colombia
Comoros
Congo
Congo, Democratic
Republic of the
Cook Islands
Costa Rica
Côte d’Ivoire
Croatia
Cuba
Cyprus
Czech Republic
Denmark
Djibouti
Dominica
Dominican Republic
Ecuador
Egypt
El Salvador
Equatorial Guinea
Eritrea
Estonia
Ethiopia
Fiji
Finland
France
150
Under-5
mortality
rate
Average annual
rate of reduction (%)Θ
GDP per capita
average annual
growth rate (%)
Total
fertility rate
Average annual
rate of reduction (%)
Under-5
mortality
rank
1970
1990
2006
1970
1990
2006
3
122
75
189
2
143
125
101
161
167
46
130
146
55
138
135
175
125
20
54
61
128
29
113
148
130
10
14
47
19
161
83
15
7
148
101
110
57
27
320
109
220
300
71
20
33
49
82
239
54
29
252
267
243
82
142
136
78
32
287
244
215
23
232
98
118
105
215
142
260
45
69
6
260
29
56
10
10
105
29
19
149
17
24
10
43
185
166
125
22
58
57
11
18
206
190
116
139
8
60
173
201
21
45
35
120
103
257
17
38
3
260
11
16
24
6
5
88
14
10
69
12
13
4
16
148
70
61
15
124
20
9
14
204
181
82
149
6
34
175
209
9
24
21
68
126
1.0
4.4
5.8
0.7
4.5
3.5
6.0
2.6
7.3
2.4
5.8
5.3
1.5
2.4
3.3
6.6
4.5
4.3
9.8
2.9
1.7
1.3
2.2
5.3
1.5
7.7
4.8
5.5
2.9
1.6
0.1
6.1
3.7
4.3
0.0
3.7
5.3
3.2
4.3
1.1
4.6
4.0
4.8
2.2
3.8
5.7
6.2
1.4
5.4
4.5
2.4
-4.7
6.5
1.3
1.6
0.1
0.3
2.2
-0.4
1.8
3.5
-0.1
-0.2
5.3
3.9
3.2
3.5
-1.3
1
62
45
50
0
45
57
40
50
16
52
47
54
29
46
60
63
20
58
51
32
-114
65
18
22
1
5
29
-7
25
43
-1
-4
57
47
40
43
-22
1.6x
-0.7x
2
0.4x
6.5x
-1
2
2
2
-1.3x
1
2
2
3
0
4.7x
-1
8
2
-2.1x
3.4x
1
1
3
2
-1
-1
2
7
2
0.1x
3
5.2
1.3
2.1
1.8
1.3
5.2
2.5
1.9
1.5
0.4x
2.3x
3
1.5x
2.8
1.8
2.3
1.4
4.8
1.3
11.6x
4.8
1.1
-0.8x
2
1.5
-2.6
5.8x
0.7
2.2
3.3
-0.6
2.4
3.7
8.8
0.8
-0.4
-0.8
7.7
4.9
7.4
7.3
3.1
3.2
2.7
2.3
4.6
3.6
6.5
6.4
3.1
2.3
2.2
6.3
7.0
6.7
6.6
2.9
6.6
5.0
5.7
2.2
7.6
6.8
5.9
6.2
2.2
7.0
5.7
6.5
4.0
5.6
5.6
7.1
6.3
8.0
2.9
4.7
7.2
3.0
2.5
1.9
1.5
3.0
2.6
3.7
4.4
1.7
1.9
1.6
4.5
6.8
5.9
4.9
1.7
4.7
2.8
3.2
1.7
7.3
6.8
5.8
5.9
1.7
5.5
5.7
6.7
2.6
2.2
3.0
6.1
5.4
7.2
2.1
2.4
6.5
2.3
1.3
1.8
1.4
1.7
2.0
2.4
2.9
1.5
1.2
1.6
3.0
5.6
2.3
3.6
1.2
3.0
2.3
2.4
1.3
6.1
6.8
3.3
4.5
1.5
3.5
4.7
6.3
1.9
1.7
2.3
4.5
4.6
-0.2
2.6
2.3
0.1
0.1
1.2
1.9
2.3
2.2
1.6
2.8
1.9
3.1
1.0
1.7
1.7
0.2
0.6
1.5
2.6
1.7
2.9
2.8
1.2
0.2
0.0
0.1
0.2
1.5
1.2
0.0
-0.1
2.1
4.7
3.1
0.7
0.8
0.6
2.0
4.2
0.6
1.7
4.0
0.3
0.2
3.4
1.5
2.9
2.5
0.7
2.8
-0.2
2.4
1.2
5.8
1.9
2.1
2.9
1.3
2.0
1.7
1.1
0.0
3.6
1.7
0.6
2.8
1.2
0.3
1.9
1.6
1.7
2.0
1.0
9
116
138
26
161
157
175
175
167
25
128
92
101
81
97
8
51
157
30
119
175
175
245
83
237
42
43
33
24
19
127
140
235
162
237
26
241
65
16
24
205
32
18
153
12
13
12
13
9
175
17
65
57
91
60
170
147
16
204
22
7
9
205
19
12
127
6
7
4
4
5
130
15
29
24
35
25
206
74
7
123
18
4
4
0.9
7.6
2.2
6.3
6.0
5.1
3.1
3.7
3.3
4.5
4.7
5.0
2.4
2.4
0.8
5.4
4.1
4.9
0.0
3.3
2.5
1.2
4.3
3.9
6.9
7.4
3.7
1.9
0.8
5.0
5.4
6.0
5.5
-1.2
4.3
5.2
3.2
1.3
3.5
5.1
0
41
33
17
50
46
67
69
44
26
12
55
58
62
58
-21
50
56
40
18
43
56
-2
1
-2
5.9x
2
4.7x
2
1
4
-2
1.5x
0.6x
3
2
-4.7
2.4
-0.5
2.8
3.5x
2.3x
2.1
1.9
-2.4
1.4
3.7
1
2.4
1.6
21.6
0x
4.9
1.9
1.4x
2.6
1.6
6.4
5.0
7.4
2.0
4.0
2.6
2.0
2.1
7.4
6.2
6.3
6.2
6.4
5.7
6.6
2.1
6.8
4.5
1.9
2.5
6.7
3.2
6.6
1.7
1.8
2.4
1.8
1.7
6.2
3.3
3.7
4.4
3.7
5.9
6.2
1.9
6.8
3.4
1.7
1.8
6.7
2.1
4.6
1.3
1.5
1.6
1.2
1.8
4.1
2.9
2.6
3.0
2.7
5.4
5.2
1.5
5.4
2.8
1.8
1.9
-0.3
2.3
0.5
0.9
4.2
0.4
0.5
1.2
0.9
3.1
2.7
1.7
2.7
-0.2
0.3
0.4
0.0
1.5
0.3
1.7
0.0
2.5
2.2
1.4
0.8
2.6
2.5
-0.5
2.5
0.9
2.0
2.4
1.9
0.5
1.1
1.8
1.4
1.2
-0.2
-0.5
1970-1990 1990-2006
T H E S TAT E O F T H E W O R L D ’ S C H I L D R E N 2 0 0 8
Reduction
since 1990
(%)Θ
1970-1990 1990-2006
1970-1990 1990-2006
…TABLE 10
Gabon
Gambia
Georgia
Germany
Ghana
Greece
Grenada
Guatemala
Guinea
Guinea-Bissau
Guyana
Haiti
Holy See
Honduras
Hungary
Iceland
India
Indonesia
Iran (Islamic Republic of)
Iraq
Ireland
Israel
Italy
Jamaica
Japan
Jordan
Kazakhstan
Kenya
Kiribati
Korea, Democratic
People’s Republic of
Korea, Republic of
Kuwait
Kyrgyzstan
Lao People’s Democratic
Republic
Latvia
Lebanon
Lesotho
Liberia
Libyan Arab Jamahiriya
Liechtenstein
Lithuania
Luxembourg
Madagascar
Malawi
Malaysia
Maldives
Mali
Malta
Marshall Islands
Mauritania
Mauritius
Mexico
Micronesia (Federated
States of)
Moldova, Republic of
Monaco
Mongolia
Montenegro
Morocco
Mozambique
Under-5
mortality
rate
Average annual
rate of reduction (%)Θ
GDP per capita
average annual
growth rate (%)
Total
fertility rate
Average annual
rate of reduction (%)
Under-5
mortality
rank
1970
1990
2006
1970
1990
2006
44
37
86
175
32
175
113
71
17
11
60
48
95
157
189
49
83
83
68
167
167
175
88
175
97
92
31
59
311
26
183
54
168
338
222
170
39
14
192
172
191
125
27
27
33
62
21
107
156
-
92
153
46
9
120
11
37
82
235
240
88
152
58
17
7
115
91
72
53
10
12
9
33
6
40
60
97
88
91
113
32
4
120
4
20
41
161
200
62
80
27
7
3
76
34
34
46
5
5
4
31
4
25
29
121
64
3.5
5.3
2.1
8.0
3.6
1.8
1.9
5.4
4.2
3.5
2.6
3.2
4.9
4.3
5.0
4.1
6.5
3.2
6.3
4.9
2.4
-
0.1
1.9
2.3
5.1
0.0
6.3
3.8
4.3
2.4
1.1
2.2
4.0
4.8
5.5
5.3
2.6
6.2
4.7
0.9
4.3
5.5
5.1
0.4
2.5
2.9
4.5
-1.4
2.0
1
26
30
56
0
64
46
50
31
17
30
47
53
59
57
34
63
53
13
50
58
56
6
33
38
52
-25
27
0
1
3
2.2x
-2
1
4.9x
0
0.3x
0
-2
0
1
3
3
2
5
-2
-4.3x
3
2
3
-1
3
2.5x
1
-5
-1
0.3
1
1.4
2.1
2.7
2.3
1.2
1.3
-2.5
3
-2
0.6
3.2
2.3
4.4
2.2
2.5
6
1.5x
1.3
0.7
0.9
1.8
2.6
0
1.9
4.8
6.7
2.6
2.0
6.7
2.4
4.6
6.2
7.0
6.8
5.6
5.8
7.3
2.0
3.0
5.4
5.5
6.6
7.2
3.9
3.8
2.4
5.5
2.1
7.9
3.5
8.1
-
4.8
6.0
2.1
1.4
5.8
1.4
3.7
5.6
6.7
7.1
2.6
5.4
5.1
1.8
2.2
4.0
3.1
5.0
5.9
2.1
3.0
1.3
2.9
1.6
5.5
2.8
5.9
-
3.1
4.8
1.4
1.4
4.0
1.3
2.3
4.3
5.6
7.1
2.4
3.7
3.4
1.3
2.0
2.9
2.2
2.0
4.4
2.0
2.8
1.4
2.5
1.3
3.2
2.2
5.0
-
0.0
0.5
1.0
1.9
0.7
2.5
1.1
0.6
0.2
-0.2
3.8
0.3
1.7
0.6
1.6
1.5
2.8
1.3
1.0
3.1
1.2
3.1
3.1
1.3
1.8
1.1
1.6
-
2.6
1.4
2.5
0.1
2.3
0.5
3.0
1.6
1.1
0.0
0.6
2.5
2.6
2.2
0.4
2.0
2.1
5.6
1.8
0.4
0.4
-0.2
1.0
1.4
3.4
1.5
1.1
-
65
167
143
71
70
54
59
-
55
9
16
75
55
5
11
41
1.2
9.0
6.5
-
0.0
3.7
2.3
3.8
0
44
31
45
6
-6.8x
-
4.5
0.6x
-0.9
4.0
4.5
7.2
4.9
2.4
1.6
3.5
3.9
1.9
1.2
2.2
2.5
2.6
5.2
3.6
1.2
1.6
1.9
3.0
2.8
50
148
89
24
5
119
189
151
175
36
32
138
89
6
161
64
28
130
81
218
26
54
186
263
160
28
26
180
341
70
264
400
32
250
86
110
163
18
37
101
235
41
10
13
10
168
221
22
111
250
11
92
133
23
53
75
9
30
132
235
18
3
8
4
115
120
12
30
217
6
56
125
14
35
1.5
1.8
1.9
3.1
0.6
6.8
3.8
4.8
0.3
2.2
5.8
4.3
2.4
5.3
3.2
6.6
3.7
4.9
4.3
1.3
-1.7
0.0
5.1
7.5
3.0
5.7
2.4
3.8
3.8
8.2
0.9
3.8
3.1
0.4
3.1
2.6
54
50
19
-31
0
56
70
38
60
32
46
45
73
13
45
39
6
39
34
3
3
-4
-4.8x
3
-2
0
4
-1
7
-1
5.1x
2
4.1
4.2
2.5
2.3
2.2
2.5
3.3
-0.5
1.1
3.2
4.2x
2.2
2.7x
-2.2
0.5
3.7
1.5
6.4
1.9
5.1
5.8
6.9
7.6
2.3
2.0
6.8
7.3
5.6
7.0
7.5
2.1
6.6
3.7
6.7
6.2
1.9
3.1
4.9
6.9
4.8
2.0
1.6
6.2
7.0
3.7
6.2
7.4
2.0
5.8
2.2
3.4
3.3
1.3
2.2
3.5
6.8
2.8
1.3
1.7
4.9
5.7
2.7
2.6
6.6
1.4
4.5
1.9
2.3
0.2
0.0
2.4
0.8
0.0
2.3
0.7
1.1
0.4
0.2
2.0
0.6
0.0
0.0
0.6
2.5
3.4
4.0
2.5
2.2
2.2
0.1
3.4
2.9
-0.4
1.5
1.2
2.1
5.4
0.8
2.5
1.6
1.1
2.5
71
116
175
69
146
78
22
65
184
278
58
37
9
109
16
89
235
41
19
4
43
10
37
138
2.8
3.6
0.8
2.2
4.2
5.1
5.8
2.9
5.5
3.3
29
49
56
61
38
58
41
1.8x
2
-1x
-0.2
-2
3.3x
2.6x
1.6
4.4
6.9
2.6
7.5
2.4
7.1
6.6
5.0
2.4
4.1
2.0
4.0
6.2
3.9
1.4
1.9
1.8
2.4
5.2
1.7
0.3
3.0
0.9
2.8
0.3
1.5
3.3
4.8
0.6
3.3
1.1
1970-1990 1990-2006
Reduction
since 1990
(%)Θ
1970-1990 1990-2006
1970-1990 1990-2006
S TAT I S T I C A L TA B L E S
151
TABLE 10. THE RATE OF PROGRESS
Myanmar
Namibia
Nauru
Nepal
Netherlands
New Zealand
Nicaragua
Niger
Nigeria
Niue
Norway
Occupied Palestinian
Territory
Oman
Pakistan
Palau
Panama
Papua New Guinea
Paraguay
Peru
Philippines
Poland
Portugal
Qatar
Romania
Russian Federation
Rwanda
Saint Kitts and Nevis
Saint Lucia
Saint Vincent and
the Grenadines
Samoa
San Marino
Sao Tome and Principe
Saudi Arabia
Senegal
Serbia
Seychelles
Sierra Leone
Singapore
Slovakia
Slovenia
Solomon Islands
Somalia
South Africa
Spain
Sri Lanka
Sudan
Suriname
Swaziland
Sweden
Switzerland
Syrian Arab Republic
Tajikistan
Tanzania, United Republic of
Thailand
The former Yugoslav
Republic of Macedonia
Timor-Leste
Togo
Tonga
Trinidad and Tobago
152
Under-5
mortality
rate
Average annual
rate of reduction (%)Θ
GDP per capita
average annual
growth rate (%)
Total
fertility rate
Average annual
rate of reduction (%)
Under-5
mortality
rank
1970
1990
2006
1970
1990
2006
40
61
89
63
167
161
79
4
12
175
179
135
238
15
20
165
330
265
15
130
86
142
9
11
68
320
230
9
104
61
30
59
5
6
36
253
191
4
1.6
2.3
2.6
2.6
3.0
4.4
0.2
0.7
2.6
1.4
2.1
5.5
3.7
3.8
4.0
1.5
1.2
5.1
20
29
58
44
45
47
21
17
56
2
-2.3x
1
2
1
-4
-2
-1
3
6.6x
1.5
1.9
1.8
2.1
1.9
-0.5
0.7
2.6
6.1
6.5
5.9
2.4
3.1
6.9
8.1
6.9
2.5
3.4
5.8
5.2
1.6
2.1
4.8
7.9
6.8
1.9
2.1
3.3
3.4
1.7
2.0
2.8
7.3
5.5
1.8
2.8
0.5
0.6
2.2
2.0
1.9
0.1
0.1
1.5
3.1
3.6
2.7
-0.6
0.3
3.3
0.5
1.3
0.1
108
138
42
143
106
52
108
97
86
157
167
110
119
125
18
116
130
200
181
68
158
78
174
90
36
62
65
57
40
209
-
40
32
130
21
34
94
41
78
62
18
14
26
31
27
176
36
21
22
12
97
11
23
73
22
25
32
7
5
21
18
16
160
19
14
9.2
1.7
3.5
2.6
3.2
4.0
1.9
3.5
7.4
4.6
3.0
2.0
0.9
-
3.7
6.1
1.8
4.0
2.4
1.6
3.9
7.1
4.1
5.9
6.4
1.3
3.4
3.3
0.6
4.0
2.5
45
63
25
48
32
22
46
68
48
61
64
19
42
41
9
47
33
3
3
0
-1
3
-1
1
3
0.9x
1
6.3x
5.3x
-2.8x
1.8x
1.4
2.3
0.2
-0.5
2.3
1.7
4.3
1.9
2
0.6
0.3
2.8
1.1
7.9
7.2
6.6
5.3
6.2
5.7
6.3
6.3
2.2
2.8
6.9
2.9
2.0
8.2
6.1
6.4
6.6
6.3
3.0
4.8
4.5
3.9
4.3
2.0
1.5
4.4
1.9
1.9
7.6
3.3
5.3
3.1
3.6
2.6
4.0
3.2
2.5
3.3
1.2
1.5
2.7
1.3
1.3
6.0
2.2
1.0
0.4
0.2
2.8
1.2
1.2
2.4
1.8
0.4
3.0
2.3
2.0
0.3
0.4
3.0
1.3
4.7
3.5
0.9
1.2
2.2
2.7
1.7
3.2
0.3
3.0
2.4
2.1
1.5
2.6
113
94
189
43
97
35
151
135
1
189
151
175
52
21
55
175
135
45
74
16
189
167
130
57
34
151
101
106
185
276
59
368
27
29
29
34
100
172
196
15
18
128
140
218
102
25
50
14
100
44
149
19
290
9
14
10
121
203
60
9
32
120
48
110
7
9
38
115
161
31
20
28
3
96
25
116
8
13
270
3
8
4
73
145
69
4
13
89
39
164
3
5
14
68
118
8
3.5
0.3
7.2
3.1
5.7
1.2
5.5
3.6
5.3
6.6
5.7
1.8
2.9
3.8
3.5
6.1
1.0
1.5
6.0
1.4
3.6
9.6
0.3
3.5
1.6
2.4
0.4
6.9
3.5
5.7
3.2
2.1
-0.9
5.1
5.6
1.9
1.3
-2.5
5.3
3.7
6.2
3.3
1.9
8.5
20
44
79
4
43
22
32
7
67
43
60
40
29
-15
56
59
26
19
-49
57
44
63
41
27
74
3
-0.1x
-2
0
3
0
6
3
-1
0
2
3
0
-2.2x
2
2
1
2
5
1.7
2.5
0.5x
0.1x
1.2
1.4
-0.8
3.7
2.9
3.3
-2.3
0.8
2.5
3.8
3.7
1.4
0.4
2.2
0.7
1.4
-3.1
1.6
2.8
6.0
6.1
6.5
7.3
7.0
2.4
6.5
3.0
2.5
2.3
6.9
7.3
5.6
2.9
4.4
6.6
5.7
6.9
2.0
2.0
7.6
6.9
6.8
5.5
3.0
4.8
5.4
5.8
6.6
2.1
6.5
1.8
2.0
1.5
5.9
6.8
3.6
1.3
2.5
6.0
2.7
5.7
2.0
1.5
5.5
5.2
6.1
2.1
2.2
4.1
4.0
3.5
4.9
1.8
6.5
1.3
1.2
1.3
4.0
6.2
2.7
1.4
1.9
4.4
2.5
3.6
1.8
1.4
3.2
3.5
5.3
1.8
3.5
1.2
0.9
1.1
0.3
0.6
0.0
2.7
1.0
2.0
0.8
0.3
2.2
3.9
2.7
0.5
3.6
0.9
0.1
1.4
1.6
1.4
0.5
4.8
1.9
1.0
1.9
3.3
1.9
1.1
0.0
2.0
3.2
1.1
2.4
0.6
1.8
-0.1
1.8
1.9
0.6
3.0
0.8
0.5
3.5
2.5
0.9
0.8
122
65
38
101
75
119
219
50
54
38
177
149
32
34
17
55
108
24
38
5.7
1.9
2.2
2.3
5.0
7.3
2.0
1.8
-0.7
55
69
28
25
-12
-1
1
0.2
-0.1
1.9
4.7
3.2
6.3
7.0
5.9
3.5
1.9
5.3
6.4
4.6
2.4
1.5
6.7
5.0
3.8
1.6
2.4
0.8
0.5
1.3
1.8
1.8
-1.4
1.6
1.2
2.6
1970-1990 1990-2006
T H E S TAT E O F T H E W O R L D ’ S C H I L D R E N 2 0 0 8
Reduction
since 1990
(%)Θ
1970-1990 1990-2006
1970-1990 1990-2006
…TABLE 10
Tunisia
Turkey
Turkmenistan
Tuvalu
Uganda
Ukraine
United Arab Emirates
United Kingdom
United States
Uruguay
Uzbekistan
Vanuatu
Venezuela (Bolivarian
Republic of)
Viet Nam
Yemen
Zambia
Zimbabwe
Under-5
mortality
rate
Average annual
rate of reduction (%)Θ
GDP per capita
average annual
growth rate (%)
Total
fertility rate
Average annual
rate of reduction (%)
Under-5
mortality
rank
1970
1990
2006
1970
1990
2006
106
96
67
75
23
101
151
161
151
138
69
79
201
201
170
36
84
23
26
56
155
52
82
99
54
160
25
15
10
12
23
74
62
23
26
51
38
134
24
8
6
8
12
43
36
6.8
4.5
0.3
1.8
8.6
4.2
3.9
4.4
4.6
5.1
7.2
4.1
2.2
1.1
0.3
3.9
3.2
2.5
4.1
3.4
3.4
56
68
48
30
16
4
47
40
33
48
42
42
3
2
-4.8x
2
2
1
-0.5x
3.3
1.9
-6.8x
3.1
-1.5
-0.9x
2.5
2.1
1.2
0.7
-0.3
6.6
5.5
6.3
7.1
2.1
6.6
2.3
2.2
2.9
6.5
6.3
3.6
3.0
4.3
7.1
1.9
4.4
1.8
2.0
2.5
4.2
4.9
1.9
2.2
2.6
6.6
1.2
2.3
1.8
2.1
2.1
2.6
3.9
3.0
3.0
1.9
0.0
0.6
2.1
1.2
0.6
0.7
2.2
1.2
3.9
2.2
3.3
0.5
2.8
3.9
0.1
-0.2
1.0
3.1
1.5
110
122
41
13
39
62
87
303
181
135
33
53
139
180
76
21
17
100
182
105
3.2
2.5
3.9
0.0
2.9
2.8
7.1
2.1
-0.1
-2.0
36
68
28
-1
-38
-2
-2
0
-0.6
6
1.5
0
-2.4
5.4
7.0
8.6
7.4
7.4
3.4
3.7
8.1
6.5
5.2
2.6
2.2
5.6
5.3
3.3
2.2
3.2
0.3
0.7
1.8
1.8
3.2
2.3
1.2
2.9
243
220
264
195
199
121
123
91
27
164
244
145
187
165
208
79
123
55
55
53
10
103
180
93
160
131
186
46
83
29
27
27
6
79
142
72
1.3
1.4
1.2
4.5
2.4
3.9
4.0
2.7
5.0
2.3
1.5
2.2
1.0
1.4
0.7
3.4
2.5
4.0
4.4
4.2
3.2
1.7
1.5
1.6
14
21
11
42
33
47
51
49
40
23
21
23
0
2
6
1
2
3
2
1.1
1.2
1
2.2
3.9
6.7
1.4
1.1
1.9
4.1
2.3
2.3
6.8
6.8
6.8
6.8
5.7
5.6
5.3
2.8
2.3
5.8
6.7
4.7
6.3
6.0
6.6
5.0
4.3
2.5
3.2
2.3
1.7
3.6
5.8
3.2
5.3
5.0
5.6
3.1
3.0
1.9
2.4
1.7
1.7
2.8
4.7
2.6
0.4
0.6
0.1
1.5
1.4
4.1
2.5
0.9
1.3
2.3
0.7
1.9
1.1
1.1
1.1
3.1
2.2
1.7
1.8
2.1
0.2
1.6
1.3
1.4
1970-1990 1990-2006
Reduction
since 1990
(%)Θ
1970-1990 1990-2006
1970-1990 1990-2006
SUMMARY INDICATORS
Sub-Saharan Africa
Eastern and Southern Africa
West and Central Africa
Middle East and North Africa
South Asia
East Asia and Pacific
Latin America and Caribbean
CEE/CIS
Industrialized countries§
Developing countries§
Least developed countries§
World
§ Also includes territories within each country category or regional group. Countries and territories in each country category or regional group are listed on page 148.
DEFINITIONS OF THE INDICATORS
MAIN DATA SOURCES
Under-five mortality rate – Probability of dying between birth and exactly five years of age,
expressed per 1,000 live births.
Under-five mortality rate – UNICEF, United Nations Population Division and United Nations
Statistics Division.
Reduction since 1990 (%) – Percentage reduction in the under-five mortality rate (U5MR) from
1990 to 2006. The United Nations Millennium Declaration in 2000 established a goal of a twothirds (67 per cent) reduction in U5MR from 1990 to 2015. This indicator provides a current
assessment of progress towards this goal.
GDP per capita – World Bank.
Fertility – United Nations Population Division.
GDP per capita – Gross domestic product (GDP) is the sum of value added by all resident producers
plus any product taxes (less subsidies) not included in the valuation of output. GDP per capita is
gross domestic product divided by midyear population. Growth is calculated from constant price
GDP data in local currency.
Total fertility rate – Number of children who would be born per woman if she lived to the end of
her childbearing years and bore children at each age in accordance with prevailing age-specific
fertility rates.
NOTES
x
Θ
Data not available.
Data refer to years or periods other than those specified in the column heading, differ from the standard definition or refer to only part of a country.
Such data are not included in the calculation of regional and global averages.
A negative value indicates an increase in the under-five mortality rate since 1990.
S TAT I S T I C A L TA B L E S
153
Acronyms
ACSD
Accelerated Child Survival and
Development
IMNCI
Integrated Management of Neonatal and
Childhood Illnesses
ACT
artemisinin-based combination therapy
ITN
insecticide-treated mosquito net
AIDS
acquired immune deficiency syndrome
MDG
Millennium Development Goal
AIS
AIDS Indicator Surveys
MTEF
medium-term expenditure framework
AARR
average annual rate of reduction
ODA
official development assistance
BCG
anti-tuberculosis vaccine (bacille
Calmette-Guérin)
OECD
Organisation for Economic Co-operation
and Development
BSS
Behavioural Surveillance Surveys
PAB
protection at birth
C-IMCI
Community Integrated Management of
Childhood Illness
PMTCT
prevention of mother-to-child transmission
(of HIV)
DAC
Development Assistance Committee
(OECD)
PMNCH
Partnership for Maternal, Newborn &
Child Health
DALY
disability-adjusted life year
PRSP
Poverty Reduction Strategy Paper
DOTS
Directly Observed Treatment, Short-Course
SSHE
school sanitation and hygiene education
FFF
food supplementation, family spacing,
female education
SWAp
sector-wide approach
SWS
safe water system
FGM/C
female genital mutilation/cutting
TB
tuberculosis
GDP
gross domestic product
TT
tetanus toxoid vaccine
GFATM
Global Fund to Fight AIDS, Tuberculosis
and Malaria
U5MR
under-five mortality rate
GNI
gross national income
UIS
UNESCO Institute for Statistics
GNP
gross national product
UNAIDS
Joint United Nations Programme on
HIV/AIDS
GOBI
growth monitoring, oral rehydration,
breastfeeding, immunization
UNESCO
United Nations Educational, Scientific and
Cultural Organization
HepB
hepatitis B vaccine
UNFPA
United Nations Population Fund
Hib
Haemophilus influenzae type b
UNICEF
United Nations Children’s Fund
HIV
human immunodeficiency virus
USAID
HMN
Health Metrics Network
United States Agency for International
Development
IMCI
Integrated Management of Childhood
Illness
WHO
World Health Organization
154
T H E S TAT E O F T H E W O R L D ’ S C H I L D R E N 2 0 0 8
UNICEF Offices
UNICEF Headquarters
UNICEF House
3 United Nations Plaza
New York, NY 10017, USA
UNICEF Regional Office for Europe
Palais des Nations
CH-1211 Geneva 10, Switzerland
UNICEF Central and Eastern Europe,
Commonwealth of Independent
States Regional Office
Palais des Nations
CH-1211 Geneva 10, Switzerland
UNICEF Eastern and Southern Africa
Regional Office
P.O. Box 44145-00100
Nairobi, Kenya
UNICEF West and Central Africa
Regional Office
P.O. Box 29720 Yoff
Dakar, Senegal
UNICEF The Americas and Caribbean
Regional Office
Avenida Morse
Ciudad del Saber Clayton
Edificio #102
Apartado 0843-03045
Panama City, Panama
UNICEF East Asia and the Pacific
Regional Office
P.O. Box 2-154
19 Phra Atit Road
Bangkok 10200, Thailand
UNICEF Middle East and North Africa
Regional Office
P.O. Box 1551
Amman 11821, Jordan
UNICEF South Asia Regional Office
P.O. Box 5815
Lekhnath Marg
Kathmandu, Nepal
Further information is available at
our website <www.unicef.org>
THE STATE OF THE WORLD’S CHILDREN 2008
CHILD SURVIVAL
United Nations Children’s Fund
3 United Nations Plaza
New York, NY 10017, USA
Email: [email protected]
Website: www.unicef.org
US $25.00 UK £12.10 €16.80
ISBN: 978-92-806-4191-2
Sales no.: E.08.XX.1
© United Nations Children’s Fund (UNICEF)
December 2007
THE STATE OF THE WORLD’S CHILDREN 2008
Child
Survival

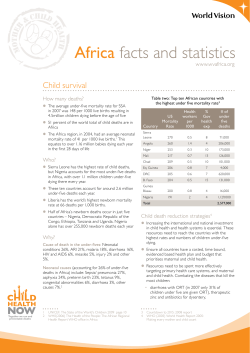
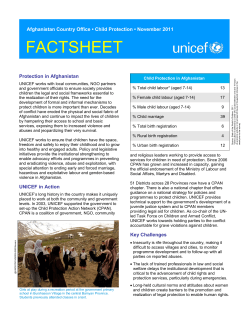

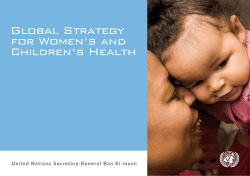
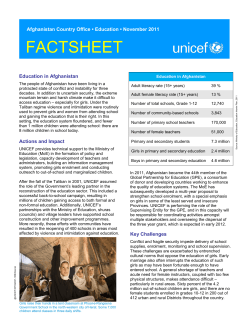

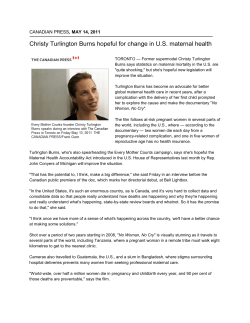
© Copyright 2026