
Booklet "Guide to Right Dose"
www.siemens.com/right-dose Guide to Right Dose Answers for life. The value of medical radiation in a general context Why Siemens? Guide to Right Dose Value orientation Powerful hardware Intelligent software and applications Foreword Foreword Dear Reader, Radiation dose, radiation dose management, and dose reduction are at the top of the list of controversial topics in medical imaging today. The need to reduce patients’ anxiety over dose is putting medical professionals under increased pressure to justify imaging procedures, and public discussions surrounding the question of dose are ongoing around the world. Instead of adding to uncertainty on patients’ side by concealing hard facts, however discomforting they may be, a culture seems to be developing in which open communication and sound reasoning is a primary characteristic. Within this context, opinion leaders have recently voiced an opinion which brings a new spin to the discussion: radiation exposure should always be minimized without compromising image quality or diagnostic performance. This is just one of many proof points for the topic’s priority in the radiological community on a global scale. As a leader in healthcare innovation, Siemens has a strong legacy in dose-managing and dose-reducing technologies. For many years we have been focused on reducing dose without compromising image quality and clinical outcomes. This history and knowledge is now bundled in our third edition of a short yet comprehensive discussion on dose. With our “Guide to Right Dose,” we want to help healthcare professionals – like you – stay up-to-date on what is new and developing in the field of diagnostic imaging. In short, dose management and dose reduction opportunities from Siemens and their benefits to patients and operators. 2 Foreword Imaging systems like the SOMATOM® Definition Flash computed tomography scanner, the Biograph mCT Flow PET•CT scanner and the Artis Q.zen angiography system are described using concise, understandable language in order to provide the latest information not only for those new to the debate about dose, but also for professionals with a long history in the field. With this information, we hope not only to help you in your daily decisions about dose application, but also to assist you in better explaining medical imaging procedures to patients who are increasingly knowledgeable and proactive about their healthcare. Sincerely, Bernd Montag CEO Imaging & Therapy Systems Siemens Healthcare 3 Contents Contents 1. Radiation Basics 6 1.1 Radiation Defined 1.1.1 Historical Development 1.1.2 Physical Background 1.1.3 Natural Radiation Sources 1.1.4 X-Rays and Working Principles of an X-Ray Tube 1.1.5 Radionuclides and Radioactive Tracers 8 8 9 13 14 16 1.2 Biological Effects of Radiation 1.2.1 Short- and Long-Term Biological Damage 1.2.2 Absorbed Radiation Dose 1.2.3 Equivalent and Effective Radiation Dose 18 18 21 21 1.3Understanding Medical Radiation – A Knowledge Resource for Patients and Caregivers 26 2. Cross-Modality Challenges and Siemens Solutions 2.1 CARE Analytics 2.2 syngo Workflow – Radiation Dose Management Solution 3. 28 28 30 Computed Tomography Modality-Specific Challenges and Siemens Solutions 32 3.1 Dose and Radiation Risk in Computed Tomography 3.2 CARE Right – Committed to the Right Dose in Computed Tomography 3.3 Dose Reduction Advances in Computed Tomography 3.4 Pediatric Computed Tomography 3.5 DoseMAP – The Siemens CT Dose Management Program 4 32 46 50 73 74 Contents 4. Molecular Imaging – Nuclear Medicine Modality-Specific Challenges and Siemens Solutions78 4.1 Dose and Radiation Risk in Molecular Imaging – Nuclear Medicine 4.2 Dose Reduction Technology for PET•CT 4.3 Dose Reduction Technology for SPECT 78 80 87 5.Angiography Modality-Specific Challenges and Siemens Solutions94 5.1 Dose and Radiation Risk in Angiography 5.2 Dose Reduction Technologies in Angiography 5.3 Radiation Protection for the Medical Staff in Angiography 6. X-Ray Products Modality-Specific Challenges and Siemens Solutions130 6.1 Dose Reduction Advances in Mammography 6.2 Dose Reduction Advances in Surgery 6.3 Dose Reduction Advances in Radiography 6.4 Dose Reduction Advances in Fluoroscopy 6.5 Dose Reduction Advances in Urology 6.6 CARE 7. Further Information 7.1 A Final Word 7.2 Glossary 94 104 123 130 140 142 143 144 146 148 148 149 5 Radiation Basics 1. Radiation Basics The topic of radiation dose in medical imaging has become the focus of an intense public and technical discussion. There is no doubt that medical imaging saves lives, and thus its utilization has increased immensely over the years. As an example, in the U.S., the annual per capita radiation dose from medical exposure rose from 0.53 mSv to 3.1 mSv over the past three decades (Figure 1). Computed tomography (CT) is under special scrutiny because it has become the single largest contributor to man-made radiation exposure. The radiation dose level from medical exposure is today in the same range as the annual natural background radiation of 3.1 mSv. The same patterns of utilization are observed in all industrialized countries, and it can be expected that other countries will follow suit as well. As an innovation leader in dose management and dose reduction, Siemens follows a comprehensive approach to all areas of diagnostic and interventional imaging: Right Dose. Today, this approach brings together a wide variety of advanced technologies and applications to meet the needs of patients and physicians for appropriate radiation dose with the best possible outcomes for diagnosis and interventions. On the other hand, we at Siemens strongly believe that education and training are equally important pillars in this area. Only with sufficient education and training will physicians be able to weigh the potential risks and benefits of using ionizing radiation and take advantage of existing dose reduction technologies to their fullest extent. Therefore, in this guide we aim to provide you with comprehensive background information on the physics of radiation, risk models for radiation dose and available dose reduction technologies. 6 Radiation Basics Radiation Basics 1980 2006 Interventional radiology 0.4 All other 0.05 Medical 0.53 All other 0.14 Diagnostic radiography 0.3 Nuclear medicine 0.8 CT scans 1.5 Natural background 2.4 Natural background 3.1 Fig. 1 Distribution and development of annual per capita dose in mSv to the population from 1980 to 2006 in the USA as an example for the development in industrialized countries.1 1 Sources and Effects of Ionizing Radiation, UNSCEAR 2008 Report. United Nations Scientific Committee on the Effects of Atomic Radiation, New York, 2010. 7 Radiation Basics 1.1 Radiation Defined This section provides a short historical background of X-rays and other ionizing radiation, as well as the working principles of an X-ray tube for medical purposes. 1.1.1 Historical Development Wilhelm Röntgen, born March 27, 1845, was a German physicist who, on November 8, 1895, discovered the radiation known today as X-rays or Röntgen rays. During 1895, Röntgen investigated the effects of radiation outside of various types of vacuum tubes (predecessors of those used in conventional TVs) when an electrical current passed through them. He repeated the experiments using a tube with a thin aluminum “window” that allowed light to exit the tube but maintained the necessary vacuum. At one point in his efforts, he covered the window with cardboard to prevent light from escaping. Yet Röntgen observed that, despite the cardboard covering, something caused fluorescence on a small screen outside the tube. Röntgen speculated correctly that some unknown kind of ray might be responsible for these observations. During the following weeks, he ate and slept in his laboratory while he investigated the various properties of the new rays. He named them X-rays. At one point, while he was investigating the ability of various materials to block the rays, Röntgen saw the world’s first radiographic image, his own flickering, ghostly skeleton on a special screen. At that moment, he decided to continue his experiments in secrecy because he feared for his professional reputation if his observations were wrong. 8 Radiation Basics Radiation Basics Finally, in December 1895, convinced of his observations, he published his paper, “On a New Kind of Rays.” 2 Today, Röntgen is considered the father of diagnostic radiology, the medical specialty that uses imaging to diagnose disease. A year later, in 1896, French physicist Henri Becquerel discovered that uranium salts emitted rays that resembled X-rays in their penetrating power. He demonstrated that this radiation did not depend on an external source of energy but seemed to be emitted spontaneously by uranium itself. Becquerel had, in fact, discovered radioactivity. Later, Marie Curie, a young Polish physicist working with Becquerel, discovered other radioactive elements (polonium and radium) and postulated the theory of radioactivity (a term coined by her3) which explains why some elements lose energy in the form of radiation, transforming themselves spontaneously and “decaying” throughout the years. She also conducted the first studies on the treatment of cancer using radioactive substances. 1.1.2 Physical Background Radiation, from the Greek “radius,” describes the phenomenon of different forms of energy that are emitted outward in all directions from a central source. When we throw a stone in a still pond, the waves (kinetic energy) expand in concentric circles to the shore of the pond, where some are reflected and others absorbed. Similarly, when we sunbathe, the light we perceive and the warmth we feel are due to electromagnetic waves that transport energy from the sun, expanding in circles in all directions and being absorbed or partially reflected by the objects they encounter in their path. 2 Röntgen W. Ueber eine neue Art von Strahlen. Sitzungsberichte der Wuerzburger Physik.-medic. Gesellschaft, Wuerzburg, 1895. 3 Robert R. Marie Curie. New American Library, New York, 1974, p. 184. 9 Radiation Basics Electromagnetic waves are among the most interesting and challenging phenomena of physics. To make it simple, we can imagine them as particles (photons) “wiggling” their way through space and matter. They carry a certain amount of energy, which is inversely related to the wavelength (Figure 2) of the wiggle. Today, we use electromagnetic waves for everyday purposes. Life without a TV, a radio or a mobile phone is almost inconceivable. The technology of these appliances (and many others) is based on electromagnetic radiation. When electromagnetic waves travel through matter, part of their energy is absorbed by the atoms within the matter. Depending on the energy and thus the wavelength of the electromagnetic radiation, the atoms may lose electrons, thereby changing their structure and becoming electrically charged (Figure 3). This phenomenon is called ionization. Not all electromagnetic radiation is ionizing – for example, visible sunlight, with a wavelength between 800 nm and 400 nm, is not ionizing. Only radiation with wavelengths shorter than 248 nm, which corresponds to an energy level of 5 eV (electron volts), such as UV light and X-rays, is ionizing, and can alter or damage living tissue by changing the DNA. Electric field Wav el Magnetic field P ro p a ga tion d i re ctio eng th n Fig. 2 Schematic illustration of an electromagnetic wave propagating through space. The smaller the wavelength, the larger the energy that the electromagnetic wave carries. 10 Radiation Basics Radiation Basics Incoming g-ray e– Photoelectron Fig. 3 Schematic illustration of the ionization of an atom by electromagnetic radiation. The energy of the incoming electromagnetic wave (incoming g-ray) is large enough to kick an electron (the photoelectron) out of the atom, which is thereby “ionized.” There are other types of ionizing radiation that have not yet been mentioned. Charged particles, such as electrons, positrons, and alpha particles, also interact strongly with electrons of atoms or molecules. Radioactive materials usually release alpha particles (nuclei of helium), beta particles (quick-moving electrons or positrons), or gamma rays (electromagnetic radiation from the atomic nucleus). Alpha and beta particles can cause damage to organic tissue but they can be easily blocked – alpha particles by a piece of paper, and beta particles by a sheet of aluminum. Remember: There are different sources and types of radiation that can be ionizing. The radiation used in computed tomography (CT), conventional radiography, and angiography, for example, is electromagnetic radiation (i.e., X-rays). Positron emission tomography (PET), single photon emission computed tomography (SPECT) and other nuclear imaging methods use radiation emitted during the decay of radioactive tracers (i.e. gamma rays). 11 Radiation Basics Radio waves AM 1 km Wavelength Frequency Energy 1 kHz 1 MHz 1 neV Visible light Microwaves FM 1m 1 GHz 1 µeV Infrared 1 mm X-rays g-rays Ultraviolet 1µm 1 nm 1 pm 1 fm 1 eV 1 keV 1 MeV 1 GeV 1 THz 1 meV a b g n Fig. 4 Alpha (α) radiation consists of fast-moving Helium-4 (4He) nuclei and can be stopped by a sheet of paper. Beta (β) radiation, consisting of electrons or positrons, can be blocked by an aluminum plate. Gamma (γ) radiation and X-rays, consisting of energetic photons, are eventually absorbed as they penetrate a dense material. Neutron (n) radiation consists of free neutrons, which can be blocked using materials composed of low atomic number elements. 12 Radiation Basics Radiation Basics 1.1.3 Natural Radiation Sources Without Radiation from the Sun, Life on Earth Would Not be Possible Sunlight, warmth, and all forms of energy (oil, gas, etc.) that we consume daily are the result of thousands of years of electromagnetic radiation from the sun, generated by atomic transformations at very high pressures and temperatures. Unfortunately for those who love sunbathing, overexposure to the sun’s UV radiation, which is ionizing, may cause skin cancer.4 There are other sources of natural radiation, such as radon, which is a colorless, odorless, tasteless, naturally occurring, radioactive gas. Radon results from the normal radioactive decay of uranium. Uranium has been present since the earth was formed and has a very long half-life (4.5 billion years). The half-life of a radioactive element is the time it takes for 50% of the atoms to decay. Thus, radon will continue to exist indefinitely at about the same levels as it does today.5 Radon is responsible for most of the mean public exposure to ionizing radiation. In fact, it is often the single biggest contributor to the amount of background radiation an individual receives. Radon gas from natural sources can accumulate in buildings, especially in confined areas such as basements. Its concentration is variable according to location, and no one can avoid exposure to radon even though this may potentially cause damage. Breathing high concentrations of radon can cause lung cancer and, according to the United States Environmental Protection Agency, may even be the second most common cause of lung cancer.6 These examples show that everyone is exposed to different sources of natural radiation in daily life, with positive and negative aspects. The additional exposure caused by medical X-rays must be viewed within this context. Without the use of X-rays, many diseases could not be diagnosed early enough for effective treatment. When properly indicated, the use of radiation for medical imaging far outweighs the additional radiation risk. 4 Wang SQ et al. Ultraviolet A and melanoma: a review. J Am Acad Dermatol. 2001 May;44(5):837-46. 5 Toxicological profile for radon. Agency for Toxic Substances and Disease Registry, U.S. Public Health Service, Atlanta, 1990. 6 A citizen’s guide to radon: the guide to protecting yourself and your family from radon. United States Environmental Protection Agency, Washington D.C., 1992. 13 Radiation Basics 1.1.4 X-Rays and Working Principles of an X-Ray Tube X-rays are electromagnetic waves, similar to visible or UV light. X-rays used in CT, for example, have a mean energy of 50–70 keV (kilo-electron volts) and a wavelength of 0.018–0.025 nm. This type of radiation is ionizing and can therefore pose a danger to organic tissue, depending on the dose. In an X-ray tube, X-rays are produced by an electron beam striking an anode “target.” The electrons that make up the beam are emitted by a heated cathode filament. The electrons are then focused and accelerated towards the focal spot by a high voltage of 40–140 kV that is applied between the cathode filament and the anode. The electron beam strikes the anode and part of its kinetic energy is converted into X-ray photons, while the remainder is converted into thermal radiation that heats up the anode. X-rays are emitted in all directions from the anode surface, the highest intensity being around 60° to 90° from the electron beam due to the angle of the anode. There is a small “window” that allows the X-rays to exit the tube with little attenuation while maintaining the vacuum seal required for X-ray tube operation. A generator is used to supply the X-ray tube with a controlled high voltage between the cathode and anode, as well as a controlled current to the cathode. If the current increases, more electrons will be beamed to the anode, producing more X-rays. If the voltage between cathode and anode is increased, the electrons will speed up, producing more X-rays and X-rays with higher energy in the anode. Hence, changing both the current (mA setting) and the high voltage (kV setting) will alter the output of the X-ray tube. The X-ray beam is then projected onto the patient. Some of the X-rays pass through the patient, while some are absorbed. The resulting radiation pattern is then detected by detectors. In earlier times, silver bromide film was used to detect the X-rays directly. Modern radiology uses mostly digital methods to detect radiation patterns. For example, modern CT scanners employ solid-state detectors in which scintillation crystals convert the X-ray energy into visible light and semiconductor photodiodes measure the light intensity. 14 Radiation Basics Radiation Basics Thermal radiation from the anode plate Anode Vacuum Cathode Cooling oil Electron beam from the cathode to the anode X-ray beam Fig. 5 Illustration of an X-ray tube. The rotating anode enables faster heat dissipation. The blue line from cathode to anode represents the electron beam; the light blue cone, the X-rays that are emitted and leave the tube through the tube window. Only part of the energy of the incoming electron beam is converted into X-rays – the rest is converted into heat. The thin red arrows represent thermal radiation due to the heating of the anode plate. 15 Radiation Basics 1.1.5 Radionuclides and Radioactive Tracers Atomic nuclei consist of neutrons and protons. An element is defined by the number of protons that its nucleus contains, while isotopes of an element vary in the number of neutrons. Nuclei are stable only when the numeric relationship between neutrons and protons is well balanced. There are three categories of nuclear radiation, namely alpha (α), beta (β), and gamma (g). Nuclei with a surplus of neutrons frequently exhibit β decay, in which a neutron is converted to a proton, an electron (β radiation), and an antineutrino. On the other hand, nuclei with a surplus of protons frequently exhibit β+ decay, in which a proton is converted to a neutron, a positron (β+ radiation), and a neutrino. Often, additional g radiation is emitted to lower the energy level of the nucleus. The resulting new isotope has a better balanced number of nucleons (protons and neutrons) than the original one. Finally, alpha radiation, which consists of helium nuclei, occurs only in the radioactive decay of heavy nuclei. For medical imaging, only isotopes with gamma or positron emission are useful. Gamma rays can penetrate human tissue and can, therefore, be detected outside the body by a medical device. Positrons have a very short range in the tissue, but upon contact with an electron, the resulting positron-electron annihilation produces two 511 keV photons (electromagnetic radiation), which can penetrate the body like gamma or X-rays. For radionuclide therapy, radiation with a short range is preferred if the isotope accumulates in the diseased tissue, in order to protect healthy tissue. This is true for isotopes emitting β radiation, α radiation, or Auger electrons. The most important properties of a radioactive isotope are its half-life (the time it takes for 50% of the atoms to decay), type, probability, and energy of the emitted radiation. 16 Radiation Basics Radiation Basics 17 Radiation Basics 1.2 Biological Effects of Radiation In this section, the differences between long- and short-term damage to biological tissue are discussed, as well as how to estimate damage in relation to the amount and type of radiation received. Different definitions of radiation dose commonly used in radiology, such as “absorbed,” “equivalent,” and “effective” dose, are introduced. 1.2.1 Short- and Long-Term Biological Damage As mentioned before, ionizing radiation may, depending on the dose, cause damage to organic tissue. The mechanisms by which radiation damages the human body are two-fold: (1) radiation directly destroys the DNA of the cells by ionizing atoms in its molecular structure, and (2) radiation creates free radicals, which are atoms, molecules, or ions with unpaired electrons. These unpaired electrons are usually highly reactive, so radicals are likely to take part in chemical reactions that eventually change or harm the DNA of the cells. The human body can repair damaged cells to a certain extent, but if exposed to a high amount of radiation beyond a given threshold in a short period of time, “deterministic” damage will occur. This term implies that radiation poisoning has definitely occurred; in addition, the damage is dependent on the amount of radiation received. Deterministic radiation damage includes changes of the blood count, hair loss, or tissue necrosis. Exposure levels of typical medical diagnostic imaging procedures are far below the threshold for deterministic radiation damage. However, deterministic effects are an important consideration in external radiation therapy and radionuclide therapy. 18 All levels of radiation may cause long-term or “stochastic” damage. In this context, “stochastic” means that the probability of suffering a disease caused by radiation is proportional to the amount of radiation received in prior years. Cellular self-repair mechanisms may fail, and some cells may experience non-lethal DNA modifications that are passed on through subsequent cell divisions. Years after exposure, diseases such as solid cancer or leukemia may occur. In fact, the effect of the very low amounts of radiation encountered under normal circumstances (from both natural and artificial sources, such as cosmic rays or medical X-rays) is subject to constant debate. There are two main models used to predict the effects of low amounts of radiation: the linear, no-threshold model and the threshold model. The linear, no-threshold model assumes that the response is linear (i.e. directly proportional to the amount) at all levels of radiation exposure. The more radiation received, the more likely a disease caused by radiation will occur. The threshold model proposes that anything below a certain level of radiation is safe, and only if this level is exceeded does the probability of radiation damage increase proportionally to the received radiation (Figure 6). Some authors even postulate that low levels of radiation have a bio-positive effect (hormetic model). Linear nothreshold model Threshold model Hormetic model Risk of solid cancer Risk of solid cancer Risk of solid cancer Dose threshold increased decreased increased Dose decreased increased Dose decreased Dose Fig. 6 Linear no-threshold model, threshold model, and hormetic model. The x-axis represents the radiation amount and the y-axis the likelihood of potential later damage, such as solid cancer. 19 Radiation Basics Radiation Basics Radiation Basics Despite the strong controversy and differing opinions of internationally recognized scientific institutions, the linear no-threshold model is currently the most accepted risk model for low levels of radiation as well. For example, the Committee to Assess Health Risks from Exposure to Low Levels of Ionizing Radiation of the National Academy of Sciences concluded in its most recent report: 7 “The committee concludes that current scientific evidence is consistent with the hypothesis that there is a linear, no-threshold dose-response relationship between exposure to ionizing radiation and the development of cancer in humans.” But they also note: “New data and analyses have reduced sampling uncertainty, but uncertainties related to estimating risk for exposure at low doses and dose rates and to transporting risks from Japanese A-bomb survivors to the U.S. population remain large. Uncertainties in estimating risks of site-specific cancers are especially large.” We all have an intuitive understanding of what “dose” is, but a radiation dose that reflects the potential damage to organic tissue cannot be defined simply as a certain amount of radiation energy per kg or cm2 of body surface. This is why three different definitions are used: absorbed, equivalent, and effective dose. In the following sections, we will define these terms as well as precisely explain why we need to differentiate between them. 7 20 Health Risks from Exposure to Low Levels of Ionizing Radiation: BEIR VII – Phase 2. Committee to Assess Health Risks from Exposure to Low Levels of Ionizing Radiation, National Research Council, National Academies Press, Washington D.C., 2006, p. 15. Radiation Basics Radiation Basics 1.2.2 Absorbed Radiation Dose The energy dose or absorbed dose characterizes the amount of energy deposited in matter after being exposed to a certain amount of radiation. The unit used to measure it is the gray (Gy) and it is defined as the amount of radiation required to deposit 1 joule (J) of energy in 1 kilogram of any kind of matter. Therefore: 1 Gy = 1 J/kg and the absorbed dose D is: D = absorbed radiation energy/kg of matter When 1 kg of water is irradiated with 1 gray, the water stores 1 joule and its temperature increases by only 0.00024 °C Unfortunately, this rather simple definition is a physical quantity and does not reflect the biological effects of radiation, since it does not take into account the type of radiation or the damage it might cause in different tissues. 1.2.3 Equivalent and Effective Radiation Dose Equivalent Dose The biological damages caused by different types of radiation are not the same; therefore, even if an absorbed dose of X-rays or α-rays is similar, the damage can be dramatically different. The equivalent dose for any type of radiation is defined as the absorbed dose D multiplied by a factor (wf) that weighs the damage caused to biological tissue by a particular type of radiation. In the case of X-rays, γ-rays, β-rays, and positrons, the weighting factor is 1; therefore the equivalent dose is the same as the absorbed dose. In the case of α-rays, which occur naturally and are emitted, for example, by some types of uranium isotopes, the absorbed dose must be multiplied by a factor of 20. This indicates that α-rays and other heavy particles such as neutrons and protons cause much more damage to biological tissue than X-rays. 21 Radiation Basics The unit used to measure the equivalent dose is the sievert (Sv) and the equivalent dose H is: H = D · wr where wr is an estimate of the amount of biological damage caused by 1 Gy of the corresponding type of radiation. Effective Dose The damage that radiation causes in different types of organic tissue is not identical; for example, red bone marrow is very sensitive to radiation, whereas the liver is much less sensitive. When estimating the stochastic damage caused by irradiation of the human body, these differences must be considered. The effective dose reflects this, because it is a weighted average of the equivalent dose received by the organs: E = ∑ wi · Horg,i where wi is a coefficient that quantifies the sensitivity of the particular organic tissue to the radiation received. Assuming that the brain and the thyroid gland are irradiated, the effective dose would be calculated as follows: wthyroid · Hthyroid + wbrain · Hbrain where wthyroid and wbrain indicate how sensitive these organs are to radiation and Hthyroid and Hbrain are the equivalent doses received by these organs. The weighting factors wi are estimated and published by the International Commission on Radiological Protection. As research and quantification technologies advance, these factors may change. 22 The Recommendations of the International Commission on Radiological Protection of 2007 (ICRP 103) lists different coefficients compared to the previous recommendations from 1990 (ICRP 60).8 In particular, the gonads are less radiosensitive and the breast is more radiosensitive than previously assumed, as shown in Table 1. Tissue or organ Gonads Red bone marrow Colon Lungs Stomach Breast Liver Esophagus Thyroid Skin Bone surface Salivary glands Brain ..... ∑wi wi according to ICRP 60 0.20 0.12 0.12 0.12 0.12 0.05 0.05 0.05 0.05 0.01 0.01 – – ..... 1.00 wi according to ICRP 103 0.08 0.12 0.12 0.12 0.12 0.12 0.04 0.04 0.04 0.01 0.01 0.01 0.01 ..... 1.00 Table 1 Weighting coefficients (wi) according to the International Commission of Radiological Protection.8 8 The 2007 Recommendations of the International Commission on Radiological Protection. ICRP publication 103. Ann ICRP. 2007;37(2-4):1-332. 1990 Recommendations of the International Commission on Radiological Protection. ICRP Publication 60. Ann ICRP. 1991;21(1-3):1-201. 23 Radiation Basics Radiation Basics Radiation Basics Please note that the effective dose E is an approximate measure that was introduced to compare the stochastic risk of nonuniform exposure to ionizing radiation with the risk caused by uniform exposure of the whole body. E depends on model assumptions that may not be valid for an individual. Hence, E is not useful for determining the specific risk of an individual after receiving a certain amount of radiation. In summary: Absorbed dose D (also called “energy dose”), measured in gray (Gy) units, characterizes the amount of energy deposited in tissue. It is defined as the amount of radiation required to deposit 1 joule (J) of energy in 1 kilogram of any kind of matter. Equivalent dose H, measured in sievert (Sv) units, takes in account the damage caused by different types of radiation. It is the absorbed dose multiplied by a weighting factor wr characteristic for the particular type of radiation. For X-rays, H = D. Effective dose E, measured in sievert (Sv) units, includes the sensitivity of different organs to radiation. It is the sum of the equivalent doses in all irradiated organs multiplied by the respective tissue weighting factors wi. 24 Radiation Basics Radiation Basics 25 Radiation Basics 1.3 Understanding Medical Radiation – A Knowledge Resource for Patients and Caregivers Interested laymen who want to know more about medical radiation used during imaging examinations are offered an information platform you might want to refer to: www.medicalradiation.com. It provides physical and historical basics on medical radiation and information about all prevalent medical imaging types. A glossary helps to deepen the understanding with short explanations of the physical and medical terms used on the website. Siemens offers business cards referring to the information platform which you may distribute to patients and interested laymen. Medicalradiation.com business cards can be ordered at www.siemens.com/medicalradiation-cards. 26 Radiation Basics Radiation Basics 27 Cross-Modality 2. Cross-Modality Challenges and Siemens Solutions In this chapter, we will discuss radiation in the context of various imaging modalities and the solutions Siemens has developed. 2.1 CARE Analytics CARE Analytics is a non-medical, free-of-charge tool that can be installed on any computer and is designed to improve dose monitoring in interventional imaging, computed tomography, radiography, fluoroscopy and urology, even a multi vendor approach is possible. The increased monitoring leads to increased transparency and helps to improve daily work practices by adjusting work protocols. With this information, it was not only intended to support daily decisions about dose application, but also to assist in better explaining medical imaging procedures to patients who are increasingly knowledgeable about medical imaging. CARE Analytics supports DICOM structured reports from the following modalities: • Computed tomography • Angiography • Radiography • Fluoroscopy • Urology 28 Cross-Modality Cross-Modality CARE Analytics allows evaluating the delivered patient dose with regards to: • Enhanced in-house dose reporting and assessment • Enhanced transparency regarding dose per case • Improved reporting on patient dose history • Improved cross-institutional reporting Fig. 7 Working principle of CARE Analytics. 29 Cross-Modality 2.2 syngo Workflow – Radiation Dose Management Solution The potential risk of exposure to ionizing radiation derived from diagnostic medical imaging tests has been actively debated in various press and journal articles. Delivering the right care to the patient with the appropriate radiation dose has always been one of the foremost goals within the healthcare community. However, whether it is a diagnostic imaging center, single hospital, or multi-hospital system, the issues surrounding radiation dose management have been complex. This is partially based on the wide variety of technology used throughout the healthcare spectrum and the need to manage different protocols and processes along with varying levels of knowledge among users. This challenge can be successfully addressed with a powerful, dedicated dose management solution. The Radiation Dose Management Solution – powered by Radimetrics9 – is a comprehensive dose tracking system. When used with Siemens’ powerful Radiology Information System (RIS) application, syngo Workflow10, the Radiation Dose Management Solution automatically captures the radiation dose information in the diagnostic report without any additional clicks or dictation. This helps to save time, enhance data accuracy, and reduce any additional overhead. Fig. 8 Patient scorecard showing estimated cumulative dose. 9 10 30 Radimetrics is only available for sale through Siemens in the US and Canada. syngo Workflow SLR is available in the US, Australia, New Zealand, and Canada Only. Cross-Modality • Cumulative dose tracking scorecard The patient scorecard enables meaningful use of a patient’s cumulative dose. This includes both size-adjusted estimates of effective dose and an estimated absorbed dose for individual organs. • Dosimetry worksheet The dosimetry worksheet incorporates an advanced Monte Carlo simulation engine that allows the user to perform “what if” scenarios with an interactive and intuitive interface. It provides a graphical display of absorbed dose by organ or body part; effects of scan length, tube voltage, and tube current on absorbed and effective doses; and an estimation of the resulting dose to patients of different age, size, and gender. • Protocol management tools Facilities often need a variety of tools to keep track of their protocols. This is why the Radiation Dose Management Solution includes protocol management tools such as support for multiple scanners, ability to illustrate protocols on diagrams, track revisions to protocols, and customize style sheets. • Reporting dashboards Easy access to data for further analysis is enabled with customizable dashboards. These dashboards feature interactive display components such as charts and tables and drill-down capabilities to deliver information in a simple and intelligent format. • Productivity and utilization The solution provides the ability to monitor the real-time utilization of equipment and productivity through the easy-to-use and customizable dashboards. Data collection is performed automatically and can even show the actual scanning activity of a modality. Some of the benefits include: • Technologists are enabled to make more informed decisions regarding the care of a patient through newly introduced clinical alert capabilities that can bring attention to potential over exposure conditions based on dose reference level thresholds defined by their organization or safety officer • Immediate feedback to technologists and radiologists on the radiation dose delivered during a study • Reduced effort and cost associated with meeting accreditation and regulatory requirements • Higher satisfaction of referring physicians and patients thanks to improved access to and analysis of current and historical dose information 31 Cross-Modality The solution provides an extensive set of features to support patient safety and regulatory reporting, including: Computed Tomography 3. Computed Tomography Modality-Specific Challenges and Siemens Solutions Because of its undoubted clinical benefits, the number of computed tomography (CT) examinations has grown over the years, and today is the biggest medical contributor of collective dose to the population. Therefore, in this first section, in-depth information is provided about dose parameters used in CT and dose-reduction features available on Siemens CT scanners. 3.1 Dose and Radiation Risk in Computed Tomography We will now discuss how radiation dose during a CT scan is estimated and the factors that affect it, including the difficulties in analyzing the real risk that can be attributed to CT scans, and some interesting comparisons with environmental influences. 32 Computed Tomography CT-Specific Dose Parameters: CTDI and DLP During a CT scan, cross-sections – or slices – of the body are irradiated. Nevertheless, the X-ray dose delivered to the body is not exactly confined to the user-defined slices, but extends outside this area due to scattering of the radiation (Figure 9). Computed Tomography X-ray focus Detector Fig. 9 Contribution of direct and scattered radiation to an axial CT slice. 33 Computed Tomography The scattering of the X-rays must be included in calculating the absorbed dose D. The Computed Tomography Dose Index (CTDI) is the sum of the absorbed dose in the slice and the contributions outside (the tails in Figures 10 and 11), normalized to the nominal slice thickness S. Nominal slice thickness S Dose Dose profile D(z) z-position Fig. 10 Absorbed dose in the slice. Nominal slice thickness S Dose z-position Fig. 11 Absorbed dose including scatter contributions from outside the slice (CTDI). 34 Computed Tomography Mathematically, the CTDI is calculated as the integral of the absorbed dose along the z-axis, divided by the nominal slice thickness S. In practice, the integration limits cannot be extended to infinity. CTDI as defined by the FDA (Food and Drug Administration, USA) requires an integration length of seven nominal slice thicknesses S on either side of the irradiated slice11. The more common definition today, CTDI100, requires an integration range of 50 mm on either side of the irradiated slice. This is more practical, since most ionization chambers used to measure CTDI are 100 mm long. The ionization chambers are placed in the center and the periphery of Perspex® dummies of 16 cm diameter for the head and 32 cm diameter for the body (Figure 12). Fig. 12 Perspex® phantoms for measuring the peripheral (B) and central (A) absorbed dose. 11 FDA October 20, 2006: Guidance for Industry, FDA Staff, and Third Parties – Provision for Alternate Measure of the Computed Tomography Dose Index (CTDI) to Assure Compliance with the Dose Information Requirements of the Federal Performance Standard for Computed Tomography. 35 Computed Tomography CTDI is the measure of the dose deposited in a single axial slice of the patient. The unit used to measure it is the mGy (1 mGy = 1/1000 Gy). Computed Tomography There are different ways to calculate the CTDI. One of them is to consider the differences between the absorbed dose in the periphery and in the center of the patient’s body by a weighted sum of the central and peripheral CTDI values. The resulting formula for the weighted CTDI (CTDIw) that takes into account this difference is: 1 2 A B CTDIw = – CTDI100 + – CTDI100 3 3 Important Parameters that Affect the Absorbed Dose in CT Volume CT scans include many sequential slices during a spiral scan. For this reason, the velocity with which the table moves must be considered: If the table moves slowly, the X-ray beam profiles will overlap (Figure 13). For a spiral scan, pitch is defined as the longitudinal distance in mm that the table travels during one revolution of the X-ray tube divided by the nominal irradiated width of the detector projected to the isocenter of the scanner. Pitch 1 = no overlap Pitch 0.5 = 50% overlap z-axis Fig. 13 If the table moves fast (pitch = 1) the X-ray beam profiles do not overlap, if the table moves slowly (pitch = 0.5) the X-ray beam profiles overlap. Please note that the overlap is measured at the isocenter of the scanner (along the z-axis). 36 Computed Tomography For a spiral examination, the CTDIvol is: CTDIvol = CTDIw · 1/pitch If the pitch is smaller than 1, the X-ray beam profiles overlap and the absorbed dose increases. If the pitch is larger than 1, the X-ray beam profiles do not overlap, there are gaps in the acquisition, and the absorbed dose decreases. This is valid for both single-detector and multidetector row CT. Computed Tomography The expected CTDIvol is displayed on the user interface of the CT scanner prior to each scan. The operator can therefore easily observe on the screen the absorbed dose according to the parameters chosen for the scan (see Figure 14). Fig. 14 CTDIvol for the chosen parameters. 37 Computed Tomography In order to calculate the total absorbed dose for a complete CT examination, the range that is being examined must be taken into account (see Figure 15). X-ray tube L Detector Fig. 15 The X-ray tube and the detector scan the patient along L (examination range) on the z-axis. The dose length product (DLP) is the product of CTDIvol and the examination range: DLP = CTDIvol · L It is measured in mGy · cm. Both CTDIvol and DLP for each CT examination are stored with the patient protocol and are therefore readily available. Another aspect to be considered is that the absorbed dose is also related to the size of the patient. If a patient is smaller than the 32 cm Perspex® phantom used to determine the body CTDI, the actual absorbed dose will be higher. If the patient is bigger, the actual absorbed dose will be lower. If the patient’s shape/cross-section is similar to that of the CTDI phantom, CTDIvol can be used as an estimate for absorbed patient dose. Remember:D=radiationenergy/kgofmatter 38 Computed Tomography Effective Dose in CT Computed Tomography The effective dose in CT takes into account the direct and scattered radiation for all organs in the scan volume. It cannot be calculated exactly for each patient, but a close estimate can be obtained by means of Monte Carlo simulations, assuming an idealized “mean” patient. Figure 16 illustrates a mathematical adult hermaphrodite phantom of the kind used for Monte Carlo simulations of effective doses by the UK National Radiological Protection Board NRPB in 1989. Fig. 16 Typical phantom used to calculate effective doses. The effective dose in CT is therefore a measure of the mean radiation burden based on a patient group, not a measure of the radiation burden of an individual patient, who normally deviates from the idealized “mean” patient as shown in Figure 16. Remember: Effective dose = ∑ Dorg · worg 39 Computed Tomography The effective dose is the sum of the doses for all organs, multiplied by the respective tissue weighting factors. For different scan ranges, the effective dose E can be calculated approximately from the DLP 12: E = DLP · f where f is a mean weighting factor (average between male and female models) for different regions of the human body: 1. Head: f = 0.0021 mSv/(mGy · cm) 2. Neck: f = 0.0059 mSv/(mGy · cm) 3. Thorax: f = 0.014 mSv/(mGy · cm) 4. Abdomen and pelvis: f = 0.015 mSv/(mGy · cm) Table 2 shows typical examples of the effective dose for different CT routines. Protocol Head routine 120 kV, 390 mAs, 12 cm Thorax routine 120 kV, 110 mAs, 30 cm Abdomen routine 120 kV, 210 mAs, 20 cm CTDIvol 59.8 mGy Effective dose 1.9 mSv 7.4 mGy 3.4 mSv 14.2 mGy 4.9 mSv Table 2 Effective dose in mSv for head, thorax and abdomen routines (without iterative reconstruction, see page 65); SOMATOM Definition Flash, syngo CT 2012B. 12 40 Jessen KA et al. EUR 16262: European Guidelines on Quality Criteria for Computed Tomography. Office for Official Publications of the European Communities, Luxembourg, 2000. Computed Tomography Radiation Risk in CT Radiation dose Damage > 1 Sv 2–10 Sv 10–15 Sv Bone marrow damage with changes to the DNA Headache, fever, infections, hair loss, vomiting, nausea Severe bowel damage Computed Tomography As listed in Table 2, the effective doses typically used during CT routines are far below the thresholds that are commonly associated with deterministic damage (Table 3). Table 3 Equivalent radiation dose for the onset of deterministic radiation damage. So What Is the Risk of Stochastic Damage after One CT Scan? The answer to this question remains uncertain. There are only a few assumptions and models to quantify this risk. The most important study that addresses this issue was conducted by Preston et al on 105,000 radiation victims in Hiroshima and Nagasaki, of which 35,000 received radiation doses between 5 and 200 mSv.13 Unfortunately, this study revealed a high statistical uncertainty in the lowdose range that applies to CT scanning. There are, according to Muirhead, uncertainties about the shape of the dose response, both for cancer and for non-cancer diseases, below about 100 mSv.14 13 Preston DL et al. Solid cancer incidence in atomic bomb survivors: 1958–1998. Radiat Res. 2007 Jul;168(1):1-64. 14 Muirhead CR. Studies on the Hiroshima and Nagasaki survivors, and their use in estimating radiation risks. Radiat Prot Dosimetry. 2003;104(4):331-5. 41 Computed Tomography As discussed earlier, the assumption today is a linear relationship between the radiation dose and the additional cancer risk with no dose threshold (linear no-threshold model, or LNT) and that risk depends strongly on the age at the time of irradiation (the younger the child, the higher the potential risk). In a publication, Brenner et al estimated the lifetime risk of death from cancer attributable to a CT scan.15 Their estimations are shown in Figure 17. A Typical head CT examination Estimated lifetime attributable risk of death from cancer (%) Total 0.08 Brain Leukemia 0.06 0.04 0.02 0.00 year 0 10 20 30 40 50 60 70 Age at time of CT study Fig. 17 Estimated risk of death by cancer attributable to a CT scan at different ages. A: Typical head CT examination. 15 42 Brenner DJ et al. Computed tomography – an increasing source of radiation exposure. N Engl J Med. 2007 Nov 29;357(22):2277-84. Computed Tomography Typical abdominal CT examination Estimated lifetime attributable risk of death from cancer (%) Total 0.14 Digestive Computed Tomography B Other 0.12 Leukemia 0.10 0.08 0.06 0.04 0.02 year 0.00 0 10 20 30 40 50 60 70 Age at time of CT study B: Typical abdominal CT examination. 43 Computed Tomography The International Commission on Radiological Protection (ICRP) of 1990 assumed an excess life-time cancer mortality risk of about 5% per Sv. Based on this assumption, a CT examination with 10 mSv may increase cancer mortality risk by about 0.05%. This value is in reasonable agreement with Brenner’s assumptions (Figure 17). However, this risk has to be framed appropriately: The average cancer mortality risk in a Western society is about 25%. After a CT examination with 10 mSv, it is increased only by 0.05% (25.05%). This is the same increase of mortality risk as living in Central London for 450 days (death caused by air pollution) or living in the same apartment with a smoker for 540 days.16 Therefore, if clinically indicated, the benefit of a CT examination may outweigh the additional radiation risk for the patient. Nevertheless, Siemens’ ultimate goal is to adhere to the ALARA (As Low As Reasonably Achievable) principle, i.e. to use the reasonably achievable dose to obtain the required diagnostic quality images. 16 44 Smith JT. Are passive smoking, air pollution and obesity a greater mortality risk than major radiation incidents? BMC Public Health. 2007 Apr 3;7:49. Computed Tomography Cause of death Estimated no. of deaths per 1,000 individuals Cancer17 Motor vehicle accident 228 11.9 Radon in home Average US exposure 3 High exposure (1–3%) 21 Arsenic in drinking water 50 μg/L (acceptable limit before 2006) 1 13 Computed Tomography 2.5 μg/L (US estimated average) Radiation-induced fatal cancer Routine abdominopelvic CT 0.5 Single phase, ~10 mSv effective dose Annual dose limit for a radiation worker 10 mSv (recommended yearly average) 0.5 50 mSv (limit in a single year) 2.5 Pedestrian accident 1.6 Drowning 0.9 Bicycling 0.2 Lightning strike 0.013 Table 4 Estimated lifetime risk of death from various sources.18 17 Levin B et al. Screening and surveillance for the early detection of colorectal cancer and adenomatous polyps, 2008: a joint guideline from the American Cancer Society, the US MultiSociety Task Force on Colorectal Cancer, and the American College of Radiology. CA Cancer J Clin. 2008 May–Jun;58(3):130-60. 18 Gerber TC et al. Ionizing radiation in cardiac imaging: a science advisory from the American Heart Association Committee on Cardiac Imaging of the Council on Clinical Cardiology and Committee on Cardiovascular Imaging and Intervention of the Council on Cardiovascular Radiology and Intervention. Circulation. 2009 Feb 24;119(7):1056-65. 45 Computed Tomography 3.2 CARE Right ‒ Committed to the Right Dose in Computed Tomography Providing sound and sustainable results is essential in medical imaging. ALARA – As Low As Reasonably Achievable – is the underlying principle when it comes to applying radiation. Especially for Computed Tomography this means applying the right dose to your patient for sound diagnostic imaging. Consequently, Siemens is committed to the right dose in CT with its holistic approach CARE Right. The Right Dose Technology, like CARE Dose4D, CARE kV, or SAFIRE19, enables clinical staff with appropriate means to effectively reduce patient radiation. To meet the Right Dose Levels according to regional regulations or to recommendations, for example from SIERRA (Siemens Radiation Reduction Alliance), Siemens CT creates standard protocols to help reduce the absolute patient radiation. Finally, for organizations to document, analyze, report, and optimize dose across their institutions Siemens offers the tools for the Right Dose Management. Therefore Siemens CT is not only adhering to the ALARA principle, but is inspired by it. With CARE Right. Committed to the Right Dose in CT. 19 46 In clinical practice, the use of SAFIRE may reduce CT patient dose depending on the clinical task, patient size, anatomical location, and clinical practice. A consultation with a radiologist and a physicist should be made to determine the appropriate dose to obtain diagnostic image quality for the particular clinical task. Computed Tomography Right Dose Technology Computed Tomography To reduce radiation to a low dose for individual patients and examinations, clinical staff first needs the Right Dose Technology. Back in the 1990s, Siemens introduced CARE – Combined Applications to Reduce Exposure. In CT scans, three aspects are crucial: individual size and stature of the patient, examination type, and, finally, applied radiation dose. The latter is the key driver for the resulting image quality. Patient habitus, for example CARE Dose4D for real-time anatomic exposure control (see page 52). CAREDose4D Examination type, for example CARE kV for automated dose-optimized selection of the X-ray tube voltage (see page 69). 70 kV 80 kV 100 kV 120 kV 140 kV CAREkV Applied radiation dose, for example SAFIRE19 for raw data-based iterative image reconstruction (see page 67). Raw data recon Image data recon Image correction SAFIRE 47 Computed Tomography Right Dose Level Next to the Right Dose Technology it is essential to know the Right Dose Levels to perform an examination according to ALARA. There is an ongoing debate about the balance between image quality and amount of radiation. On this issue, Siemens, together with key opinion leaders, founded SIERRA – the Siemens Radiation Reduction Alliance. Feedback from this panel of experts provides input for a dedicated development team that produces the various Siemens protocols needed to comply with the full range of patients, disease types, examination procedures, and with the expectations of reading physicians with regards to image quality. The result is perhaps the most sophisticated library of scan protocols focused on the ideal dose for each examination. Reference values Switzerland1 Germany2 European Union3 USA4 Head routine CTDIvol [mGy] 65 65 60 75 Thorax routine CTDIvol [mGy] 15 12 30 n.a. Abdomen routine CTDIvol [mGy] 15 20 35 25 Standard values* Standard SAFIRE values*/**/*** Study values** Default Siemens Protocol Head routine CTDIvol [mGy] 59.8 41.4 455 Thorax routine CTDIvol [mGy] 7.4 4.4 1.56 Abdomen routine CTDIvol [mGy] 14.2 10.1 6.5 7 1 Bundesamt für Gesundheit (Merkblatt R-06-06, Diagnostische Referenzwerte in der Computertomographie, 01.04.2010). 2 Bundesamt für Strahlenschutz (Bekanntmachung der aktualisierten diagnostischen Referenzwerte für diagnostische und interventionelle Röntgenuntersuchungen. Vom 22. Juni 2010). 3 European Guidelines on Quality Criteria for Computed Tomography (http://www.drs.dk/guidelines/ct/quality/htmlindex.htm). 4 American College of Radiology (CT Accreditation Program Requirements, Clinical Image Quality Guide, 2012 Apr. 13). 5 Becker HC et al. Radiation exposure and image quality of normal computed tomography brain images acquired with automated and organ-based tube current modulation multiband filtering and iterative reconstruction. Invest Radiol. 2012 Mar;47(3):202-7. 6 Baumueller S et al. Low-dose CT of the lung: potential value of iterative reconstructions. Eur Radiol. 2012 Jun 15. [Epub ahead of print] CTDIvol for the protocol using 100 kV. 7 May MS et al. Dose reduction in abdominal computed tomography: intraindividual comparison of image quality of full-dose standard and half-dose iterative reconstructions with dual-source computed tomography. Invest Radiol. 2011 Jul;46(7):465-70. CTDIvol for abdominal CT calculated according to the conclusion. * ** *** 48 Values are based on the default protocols of the SOMATOM Definition Flash with syngo CT 2012B and an average-sized patient of 1.75 m and 75 kg. Iterative Reconstruction (SAFIRE) is used. In clinical practice, the use of SAFIRE may reduce CT patient dose depending on the clinical task, patient size, anatomical location, and clinical practice. A consultation with a radiologist and a physicist should be made to determine the appropriate dose to obtain diagnostic image quality for the particular clinical task. The following test method was used to determine a 54 to 60% dose reduction when using the SAFIRE reconstruction software. Noise, CT numbers, homogeneity, low-contrast resolution, and high-contrast resolution were assessed in a Gammex 438 phantom. Low-dose data reconstructed with SAFIRE showed the same image quality compared to full dose data based on this test. Data on file. Computed Tomography Right Dose Management Organizations need to manage dose across their institutions. Regional regulations sometimes require the dose applied to all patients to be documented. Other CT administrators like to have an overview as a basis for dose optimization. All of these requirements rely on the availability of dose data as well as adequately educated personnel. This is then also the foundation for further optimizations regarding dose reduction. Computed Tomography DoseMAP: The Siemens CT Dose Management Program provides functionalities like CARE Analytics (see page 28) to report, document and analyze dose (see page 74). Dose Time Stand-alone PC CARE Analytics Other DICOM node (e.g. modality, workstation) Fig. 18 Working principle of CARE Analytics. EduCARE: Dedicated trainings from Siemens that combine a focus on key technologies with applications in clinical practice (for more information please visit: www.siemens.com/clinical-webinars). Optimize CARE CT: Cross-modality consultancy program, in which Siemens professionals work with customers on-site to analyze dose as well as define and implement improvement measures. 49 Computed Tomography 3.3 Dose Reduction Advances in Computed Tomography In this section, we discuss different technologies and algorithms that Siemens has implemented or developed to reduce the absorbed dose to a minimum. Siemens strives to implement all of the dose reduction methods available in the CT market today. As a leader in the dose reduction field, we also consistently develop our own solutions. As a result, we were the first to implement many dose-saving features into clinical routine, and for many critical features we are still the only vendor offering these leading-edge solutions. To maintain our leading position and to help improve healthcare for patients, we cooperate closely with experts from around the globe in universities, public clinics, and private radiology centers to bring research developments into practical, everyday clinical routine. In addition to the newest technology, dose reduction in CT requires training to develop familiarity with dose reduction methods and factors. We therefore attempt to make our dose savings products as transparent as possible to reading physicians and technologists and also offer on-going seminars and resources related to dose reduction. On the following page are brief descriptions of our dose reduction products and algorithms (more detailed information can be found at www.siemens.com/low-dose-ct). 50 Computed Tomography 1994 1997 1999 1999 2002 X-ray X-ray off UFC X-ray on CAREDose4D UFC Adaptive ECG-Pulsing HandCARE 2005 2007 2007 2008 Dose Shield Pediatric80kV Protocols 2008 <1sec Selective Photon Shield t Dose Shield Tube 1 Tube 2 Vol 80 kV Attenuation B 140 kV Attenuation A DSCT AdaptiveCardio Sequence Adaptive DoseShield FlashSpiral Selective PhotonShield 2008 2008 2009 2010 2010 X-ray low Image data recon 70 kV 80 kV 100 kV 120 kV 140 kV Image correction Raw data recon Image data recon Image correction X-ray on 4DNoise Reduction X-CARE 2010 2011 IRIS CAREkV SAFIRE X-ray 1 0 1 0 0 1 CAREChild 0 1 0 1 0 1 1 0 0 1 1 0 StellarDetector 51 Computed Tomography Light Computed Tomography Features pioneered by Siemens to reduce dose in CT include: 1. CARE Dose4D – Real-time anatomic exposure control 2. Adaptive ECG-Pulsing – ECG-controlled dose modulation for cardiac spiral CT 3. Adaptive Cardio Sequence – Flexible ECG-triggered sequential scan 4. Adaptive Dose Shield – Asymmetric collimator control 5. Flash Spiral – ECG-triggered Dual Source spiral CT using high-pitch values 6. X-CARE – Organ-based dose modulation 7. IRIS – Iterative reconstruction technique working in image space 8. SAFIRE – Raw data-based iterative reconstruction technique 9. CARE kV – Automated dose-optimized selection of the X-ray tube voltage 10. CARE Child – Adjustments of scan parameters dedicated to pediatric CT imaging, especially a dedicated 70 kV mode 11. Stellar Detector – Fully integrated detector with reduced electronic noise and high dynamic range CARE Dose4D – Real-Time Anatomic Exposure Control The most efficient way to reduce radiation dose in CT is through adaptation of the scan parameters to the anatomy of the patient. Centering the patient correctly, using the right protocols, and adjusting the X-ray tube output to the patient’s size and shape help to minimize radiation exposure. Many users, however, may not fully know how parameters should be modified to adjust radiation dose levels for different patients. For example, they may not be aware that, when scanning an area where the patient’s diameter has decreased by only 4 cm, the tube output can be reduced by a factor of two while still maintaining adequate image quality. Hence, in all modern Siemens CT scanners, control mechanisms are available that automatically adjust the radiation dose level to the patient’s anatomy – similar to a highly sophisticated camera’s automatic exposure mode. Siemens CARE Dose4D automatically adapts the tube current to the size and shape of the patient, achieving optimal tube current modulation in two ways.20, 21 First, tube current is varied on the basis of a topogram, by comparing the actual patient to a “standard-sized” patient. As might be expected, tube current is increased for larger patients and reduced 52 20 Greess H et al. Dose reduction in subsecond multislice spiral CT examination of children by online tube current modulation. Eur Radiol. 2004 Jun;14(6):995-9. 21 Alibek S et al. Dose reduction in pediatric computed tomography with automated exposure control. Acad Radiol. 2011 Jun;18(6):690-3. Computed Tomography for smaller patients. Differences in attenuation in distinct body regions are taken into account. For example, in an adult patient 140 mAs might be needed in the shoulder region, whereas 55 mAs would be sufficient in the thorax, 110 mAs in the abdomen, and 130 mAs in the pelvis. Attenuation Constant tube current Tube current Computed Tomography In addition, real-time angular dose modulation measures the actual attenuation in the patient during the scan and adjusts tube current accordingly – not only for different body regions, but also for different angles during rotation. This is particularly important for efficiently reducing dose in the shoulder and pelvic region, where the lateral attenuation is much higher than the anterior-posterior attenuation. Figure 19 demonstrates the working principle of CARE Dose4D. Figure 20 is a clinical example obtained with the use of CARE Dose4D. Tube current variation on the basis of a topogram Tube current including on-line anatomical modulation Tube position φ Shoulder Thorax Abdomen Pelvis Fig. 19 Illustration of the working principle of CARE Dose4D. With constant tube current, regions in the shoulder and the pelvis would be under-dosed, while the thorax and abdomen would be significantly over-dosed. On-line anatomical dose modulation efficiently adapts the tube current and hence the radiation dose to the patient’s attenuation. 53 Computed Tomography 140 mAs 55 mAs 110 mAs 130 mAs Fig. 20 CARE Dose4D for a scan from the shoulders to the pelvis produces optimized radiation dose for all anatomic regions. Clinical experience has shown that the relationship between optimal tube current and patient attenuation is not linear. Larger patients clearly need a higher dose than average-sized patients, but they also have more body fat, which increases tissue contrast. Smaller patients need a lower dose than average-sized patients, but they have less fat and less tissue contrast, which would result in noisy images if the dose were too low. Therefore, during real-time dose modulation, CARE Dose4D reduces radiation dose less than might be expected for smaller patients, while increasing the dose less than might be expected for larger patients. This maintains good diagnostic image quality while achieving an optimal radiation dose (Figure 21). 54 Computed Tomography mAs for constant image noise CARE Dose4D 180 160 140 Quality ref. mAs 120 100 mAs 80 Computed Tomography 60 40 20 75 kg reference patient Attenuation 0 0 200 400 600 800 1000 1200 1400 1600 1800 2000 Fig. 21 Dose adaptation with CARE Dose4D (the graph shows one curve as an example). When modulating the tube current in x-, y-, and z-direction with CARE Dose4D the radiation dose may be reduced. Adaptive ECG-Pulsing – ECG-Controlled Dose Modulation for Cardiac Spiral CT With this method, the radiation dose is modulated during the complete spiral CT scan by using information from the patient’s ECG. The tube current is maintained at 100% of the desired level only during a predefined “phase of interest” of the patient’s cardiac cycle. During the rest of the time the current can be reduced, thus potentially reducing the mean radiation dose (Figure 22).22 22 Jakobs TF et al. Multislice helical CT of the heart with retrospective ECG gating: reduction of radiation exposure by ECG-controlled tube current modulation. Eur Radiol. 2002 May;12(5):1081-6. 55 Computed Tomography ECG-controlled dose modulation is based on the continuous monitoring of the ECG and an algorithm that predicts when the desired ECG phase will start by calculating the mean durations of the preceding cardiac cycles. Older ECG-pulsing approaches reach their limitations with arrhythmia patient scans that cannot be predicted by simple averaging. Recently, more versatile ECG-pulsing algorithms have been introduced that react flexibly to arrhythmia and ectopic beats and have the potential to considerably enhance the clinical application spectrum of ECG-controlled dose modulation. react Fig. 22 The CT generates images only during a predefined phase of the heartbeat. During this phase, the tube current (blue line) is 100% of the necessary level to achieve adequate image quality, but between these predefined phases, the current is reduced. Recently introduced algorithms can react flexibly to arrhythmia. Adaptive Cardio Sequence – ECG-Triggered Sequential CT Prospective ECG-triggering combined with “step-and-shoot” acquisition of axial slices is a very dose-efficient way of ECG-synchronized scanning because only the very minimum of scan data needed for image reconstruction is acquired during the previously selected heart phase. The patient’s ECG signal is monitored during examination, and axial scans are started with a predefined temporal offset relative to the R-waves. With conventional approaches, the method reaches its limitations with patients with severe arrhythmia, since ECG-triggered axial scanning depends on a reliable prediction of the patient’s next cardiac cycle by using the mean length of the preceding cardiac cycles. With Adaptive Cardio Sequence, a more refined analysis of the patient’s ECG is performed. Irregularities are reliably detected, and in case of an ectopic beat, the scan can be either skipped if the ectopic beat happens earlier than the predicted scan start, thus saving unnecessary dose, or repeated at the same position. 56 Computed Tomography Hence, the application spectrum of ECG-triggered sequential scanning is extended to patients with high and irregular heart rates. move scan react scan Computed Tomography scan Fig. 23 Each slice of the heart is scanned during the same ECG phase. A B Fig. 24 Using Adaptive ECG-Pulsing, an ECG-gated spiral scan of the heart (A) can be performed at a dose of 4–9 mSv.23, 24 With the Adaptive Cardio Sequence, an ECG-triggered sequential scan of the heart (B) requires a dose of only 1–3 mSv.25 23 Stolzmann P et al. Radiation dose estimates in dual-source computed tomography coronary angiography. Eur Radiol. 2008 Mar;18(3):592-9. 24 Leschka S et al. Low kilovoltage cardiac dual-source CT: attenuation, noise, and radiation dose. Eur Radiol. 2008 Sep;18(9):1809-17. 25 Stolzmann P et al. Dual-source CT in step-and-shoot mode: noninvasive coronary angiography with low radiation dose. Radiology. 2008 Oct;249(1):71-80. 57 Computed Tomography Adaptive Dose Shield – Dynamic Collimator Control In spiral CT, it is routine to do an extra half-rotation of the gantry before and after each scan, fully irradiating the detector throughout, even though only part of the acquired data is necessary for image reconstruction. This problem is typical for spiral CT and commonly referred to as “over-ranging” (Figure 25). Conventional tube collimation Pre-spiral dose Post-spiral dose Image area Conventionaltechnology Fig. 25 Conventional pre-patient collimator. The areas marked in red are out of the necessary scan range but still irradiated with full power. The Adaptive Dose Shield, a technology based on precise, fast, and independent movement of both collimator blades, limits this over-ranging. The pre-patient collimator asymmetrically opens and closes at the beginning and end of each spiral scan, temporarily blocking those parts of the X-ray beam that are not used for image reconstruction. As a result, only the targeted tissue is irradiated (Figure 26). 58 Computed Tomography Collimator with Adaptive Dose Shield No pre-spiral dose No post-spiral dose Image area AdaptiveDoseShield A B Computed Tomography Fig. 26 Adaptive Dose Shield. When the CT scan starts, the collimator opens asymmetrically. In the center of the scan range, the collimator is fully open according to the selected beam width. At the end of the scan range the collimator closes asymmetrically. C Fig. 27 The two collimators of the Adaptive Dose Shield. A: Closed B: Open left C: Open right 59 Computed Tomography Measurements at the Institute of Medical Physics, University Erlangen-Nuernberg, Germany,26 and at the Clinical Innovation Center, Mayo Clinic, Rochester, Minnesota, USA,27 have demonstrated significant dose reductions, depending on the scanned range, without affecting image quality (Figure 28). Measured difference in dose with vs. without dynamic collimation (%) 40 35 30 25 20 15 10 Typical chest spiral scan 5 0 0 10 20 30 40 50 Nominal scan length (cm) at a pitch of 1.0 Fig. 28 Summarized dose observations with vs. without dynamic collimation for different CT scan lengths, according to Deak et al.26, 28 60 26 Deak PD et al. Effects of adaptive section collimation on patient radiation dose in multisection spiral CT. Radiology. 2009 Jul;252(1):140-7. 27 Christner JA et al. Dose reduction in helical CT: dynamically adjustable z-axis X-ray beam collimation. AJR Am J Roentgenol. 2010 Jan;194(1):W49-55. 28 This study evaluated dose reduction on a commercial CT scanner with and without adaptive section collimation to reduce pre-spiral and post-spiral radiaton. Measurements were made with thermoluminescent dosimeters in CT dose index phantoms and in an Alderson-Rando phantom for spiral cardiac and chest CT protocols and were compared with the Monte Carlo simulated dose profiles. Computed Tomography Flash Spiral – ECG-Triggered Dual Source Spiral CT Using High-Pitch Values With DSCT systems, however, data acquired with the second measurement system a quarter rotation later can be used to fill these gaps (see Figure 29). In this way, the pitch can be increased up to 3.4 in a scan field of view (SFOV) that is covered by both detectors. Since no redundant data are acquired due to the high pitch, a quarter rotation of data per measurement system is used for image reconstruction, and each of the individual axial images has a temporal resolution of a quarter of the rotation time. Tube A B Single source CT Dual Source CT Fig. 29 Sampling scheme along the z-axis for a single source CT operating above the pitch limit of 1.5 (left), and for a Dual Source CT (right). Here, the sampling gaps are filled with data acquired by the second measurement system, such that considerably increased pitch values are feasible. 61 Computed Tomography Dual Source CT (DSCT) offers a way to scan the heart within one heartbeat without using an area detector that covers the entire heart volume. With a single source CT, the spiral pitch is limited to values below 2.0 to enable gapless volume coverage along the z-axis. If the pitch is increased, sampling gaps occur (see Figure 29) that hamper the reconstruction of images with well-defined narrow slice sensitivity profiles and without excessive image artifacts. Computed Tomography The SOMATOM Definition Flash offers 38.4 mm detector z-coverage and 0.28 s gantry rotation time. At a pitch of 3.4, the table feed is 450 mm/s, which is sufficient to cover the heart (12 cm) in about 0.27 s. The scan is triggered and starts at a user-selectable phase of the patient’s cardiac cycle. Each of the images has a temporal resolution of 75 ms, and the phase of images adjacent in the z-direction is slightly shifted (Figure 30). Since no overlapping data are acquired, the radiation dose of this new mode is very low and even below the dose values of ECG-triggered sequential scanning. Initial publications have demonstrated that reliable coronary CT angiography (CTA) is feasible at radiation dose values below 1 mSv.29, 30 Continuous table feed, pitch 3.4 Fig. 30 Principle of ECG-triggered DSCT spiral scan data acquisition and image reconstruction at very high pitch. The patient table reaches a preselected z-position (e.g. the apex of the heart) at a preselected cardiac phase after acceleration to maximum table speed. Data acquisition begins at this preselected z-position. Because of the rapid movement of the table, the entire heart can be scanned in a fraction of a heartbeat. The total scan time is typically 0.25–0.27 s. The scan data for images at adjacent z-positions (indicated by short horizontal lines) are acquired at slightly different phases from the cardiac cycle. Each of the images is reconstructed using data of a quarter rotation per X-ray tube, resulting in a temporal resolution of 75 ms per image. 62 Computed Tomography Computed Tomography Figure 31 shows images reconstructed in this mode with an acquisition time of 250 ms, a temporal resolution of 75 ms, 100 kV, and a resulting effective dose of 0.8 mSv. Courtesy of University of Erlangen, Germany. Fig. 31 CT angiography of the coronary arteries acquired with the high-pitch DSCT spiral mode (Flash Spiral). The first scientific papers to be published on the SOMATOM Definition Flash demonstrated effective radiation doses of 0.88–0.9 mSv for routine coronary CTA.29, 30 29 Achenbach S et al. Coronary computed tomography angiography with a consistent dose below 1 mSv using prospectively electrocardiogram-triggered high-pitch spiral acquisition. Eur Heart J. 2010 Feb;31(3):340-6. 30 Leschka S et al. Diagnostic accuracy of high-pitch dual-source CT for the assessment of coronary stenoses: first experience. Eur Radiol. 2009 Dec;19(12):2896-903. 63 Computed Tomography X-CARE – Organ-Based Dose Modulation According to recently modified tissue weighting factors (recommendations of the International Commission on Radiological Protection of 2007, ICRP103), the female breast is more radiosensitive than previously assumed. In any CT examination of the thorax, the breast – even without being the object of interest – is irradiated and should therefore be especially protected. Siemens X-CARE, an organ-based dose modulation mode, can selectively limit the radiation exposure of sensitive organs. When using this mode, radiation intensity is reduced when the patient is irradiated from the front as shown in Figure 32. X-ray low X-ray on Fig. 32 Illustration of the X-CARE principle. With this method, the radiation exposure of the breast or the eyes is reduced, as shown in Figure 33. A B Fig. 33 A: Radiation doses without X-CARE, and B: with X-CARE. Darker areas indicate lower absorbed dose. 64 Computed Tomography IRIS – Iterative Reconstruction Technique Working in Image Space Iterative reconstruction has been a topic of interest in computed tomography for decades. In the 1980s, researchers were already attempting to improve image quality with several iterative reconstruction loops. Image imperfections were identified by comparing reconstructed images with the measured data in the raw date space. In the next reconstruction loop the images were improved based on this comparison. Computed Tomography But especially transferring the data from a reconstructed image (the so-called image space) back into the raw data space is time-consuming. In the past, long calculation times prevented the use of iterative imaging in clinical routine, as this could take up to several hours for large datasets. IRIS – Iterative Reconstruction in Image Space – is a Siemens unique approach to iterative reconstruction. It is mathematically proven that noise reduction can be completely separated from artifact reduction. Noise reduction can be achieved with iterations in image space only, without transferring the images back into raw data space. Therefore, IRIS performs iterative loops in image space (Figure 34). When acquiring CT examinations with lower dose the image noise increases. With IRIS the noise can be cleaned up (Figure 35).31, 32 31 Bulla S et al. Reducing the radiation dose for low-dose CT of the paranasal sinuses using iterative reconstruction: Feasibility and image quality. Eur J Radiol. 2011 Jun 8. [Epub ahead of print] 32 Pontana F et al. Chest computed tomography using iterative reconstruction vs filtered back projection (Part 2): image quality of low-dose CT examinations in 80 patients. Eur Radiol. 2011 Mar;21(3):636-43. 65 Computed Tomography Image data recon Image correction Fig. 34 Illustration of the working principle of IRIS. Filteredbackprojection LessnoisewithIRIS A B Fig. 35 Contrast-enhanced CT scan of the abdomen. A: Conventional reconstruction B: IRIS reconstruction of the same dataset. Note the significant decrease of image noise without loss of resolution. 66 Computed Tomography SAFIRE – Raw Data-Based Iterative Reconstruction Technique The iterations in raw data space are computationally intensive. The new image reconstruction system (IRS) is especially designed to support iterative reconstruction algorithms. The image reconstruction speed of up to 20 images per second for the SOMATOM Definition Family brings the performance to a level comparable to the processing of conventional CT examinations. With this, SAFIRE can even be used in acute care or other time-sensitive clinical applications. SAFIRE entered the U.S. market in June 2013. At the time SAFIRE entered the market, the quantitative dose reduction potential provided by SAFIRE was unique in the market. So SAFIRE reduces noise or improves image quality, and can be used in the clinical routine – for significant dose reduction and high performance (Figure 37)34. 33 Moscariello A et al. Coronary CT angiography: image quality, diagnostic accuracy, and potential for radiation dose reduction using a novel iterative image reconstruction technique – comparison with traditional filtered back projection. Eur Radiol. 2011 Oct;21(10):2130-8. 34 In clinical practice, the use of SAFIRE may reduce CT patient dose depending on the clinical task, patient size, anatomical location, and clinical practice. A consultation with a radiologist and a physicist should be made to determine the appropriate dose to obtain diagnostic image quality for the particular clinical task. The following test method was used to determine a 54 to 60% dose reduction when using the SAFIRE reconstruction software. Noise, CT numbers, homogeneity, low-contrast resolution and high contrast resolution were assessed in a Gammex 438 phantom. Low dose data reconstructed with SAFIRE showed the same image quality compared to full dose data based on this test. Data on file. 67 Computed Tomography SAFIRE is the first raw data-based iterative reconstruction from Siemens. Noise reduction, and hence dose reduction, is achieved when performing iterative loops in image space. In addition SAFIRE transfers the data back into the raw data space and also performs iterative loops there (Figure 36). Raw data are visualized in the so-called sinogram, hence the name SAFIRE, Sinogram Affirmed Iterative Reconstruction. Iterations in raw data space improve image quality with regards to artifacts, contrast, and sharpness. SAFIRE has the potential to reduce dose by up to 60% or improve image quality.33 Computed Tomography Raw data recon Image data recon Image correction Fig. 36 Illustration of the working principle of SAFIRE. The technique performs iterative loops in image space and raw data space. Courtesy of Wexford General Hospital, Wexford, Ireland. Fig. 37 CT examination of the thorax and abdomen in a patient with a diffuse B-cell lymphoma. With SAFIRE the scan could be carried out with an effective dose of 2.4 mSv. 68 Computed Tomography CARE kV – Automated Dose-Optimized Selection of the X-Ray Tube Voltage CARE kV is a fully automated feature that adjusts the tube voltage tailored to the individual patient, the system capabilities, and the clinical task. When changing the tube voltage the tube current needs to be adapted as well. This is necessary to maintain a constant contrast-tonoise ratio (CNR). CNR is the technical way to define image quality. So in combination CARE kV and CARE Dose4D allow the patient-specific adaption of both parameters, tube voltage, and tube current. Additionally, an iodine contrast agent is often administered to improve contrast and thus the visibility of organ structures in CT images (particularly in CT angiography). The contrast is best with lowered X-ray tube voltage, since the low energy X-rays are better absorbed by the dense iodine than by the surrounding tissue. So in CT angiography examinations dose can be significantly reduced by choosing 80 kV or 100 kV instead of 120 kV (Table 5).35 * Reference setting Actual settings with CARE Dose4D and CARE kV* Body CT angiography examination of the aorta Adult patient, body mass index 25.4 kg/m2 “Quality reference mAs” 110 mAs Effective mAs “Reference kV“ 120 kV kV 100 kV CTDIvol 10.59 mGy CTDIvol 6.4 mGy 143 mAs CARE Dose4D on, CARE kV on, slider position “Dose saving optimized for”:11. Table 5 This is an example of how CARE kV and CARE Dose4D optimize the parameters according to the clinical task and to the patient in the case of CT angiography examinations.33 Tube voltage and tube current are adjusted taking the reference settings into account. 35 Winklehner A et al. Automated attenuation-based tube potential selection for thoracoabdominal computed tomography angiography: improved dose effectiveness. Invest Radiol. 2011 Dec;46(12):767-73. 69 Computed Tomography Conventional dose modulation approaches control only the X-ray tube current while the X-ray tube voltage (the kV setting) is left untouched. Yet there is great potential for dose reduction by adapting the kV setting. Computed Tomography For larger patients, though, who have a higher X-ray attenuation, the output of the X-ray tube at lower kV settings may not be sufficient to produce the required contrast-to-noise ratio. For these patients, higher X-ray tube voltages will have to be selected. In a busy environment, technicians and reading physicians often have insufficient time to measure the attenuation of each patient. Automatic tools that define the optimal combination of voltage and current for each patient according to the patient’s topogram and the selected examination protocol are therefore necessary (Figure 38). Without CARE kV kV usage [%] 100% 80% 60% 40% 20% 0% 70 80 100 120 140 120 140 Tube voltage [kV] With CARE kV kV usage [%] 100% 80% 60% 40% 20% 0% 70 80 100 Tube voltage [kV] Fig. 38 Without CARE kV the kV setting used in most cases is 120 kV. CARE kV adjusts the optimal kV setting for the individual patient automatically. Based on customer usage measured with Siemens Utilization Management. Data on file. 70 Computed Tomography Choosing the parameters and setting for CT examinations of pediatric patients can be challenging. And special attention needs to be paid, as children are more sensitive to radiation than adults. With CARE Child a full package of tools is provided helping to set the right adjustments. Dedicated pediatric standard protocols are shipped with the system for a wide range of clinical questions. For CARE Dose4D (see pages 52–55), Siemens automated tube current modulation, special adjustment curves for children are implemented for different clinical tasks. These curves are designed for the imaging of smaller bodies and hence, smaller structures. While CARE Dose4D provides an optimization of the tube current, CARE kV proposes the tube voltage setting automatically, including the possibility of scanning with 70 kV. The 70 kV mode is a Siemens technology also set up for imaging of the youngest patients. Equipped with these tools pediatric patients can obtain CT examinations at a low dose with excellent image quality. 71 Computed Tomography CARE Child – Adjustments of Scan Parameters Dedicated to Pediatric CT Imaging Computed Tomography Stellar Detector – Fully Integrated Detector with Reduced Electronic Noise and High Dynamic Range Conventional solid-state detectors consist of a scintillator layer that converts the incoming X-rays into visible light, a photodiode array that converts the visible light into an electric current, and an analog-to-digital converter (ADC) which digitizes the signal on a separate electronic board. The number of electronic components and relatively long conducting paths increase power consumption, and add to the electronic noise produced by the detector. The Stellar Detector is the first fully integrated detector. The photodiode and the ADC have been integrated next to each other, reducing the path of the signal (Figure 39). The transfer of the digitized signal is done without any losses and the electronic noise produced by the detector is reduced by a factor of two (TrueSignal Technology). In clinical CT, the attenuation of the measured object varies dramatically and so do the signal levels at the detector. The dynamic range describes the range of the input signal levels that can be reliably measured simultaneously without saturation. HiDynamics has an exceptionally high dynamic range of 102 dB. Combined with the noise reduction provided by TrueSignal Technology, Stellar Detectors can measure smaller signals over a wider dynamic range which directly enhances CT image quality especially for applications with extremely low signal levels. Such extremely low signal levels play an important role when scanning large patients and in low-dose scans, as well as in the low-kV datasets of Dual Energy examinations. Conventional detector Fully integrated Stellar Detector Conventional photodiode Photodiode and ADC combined Complex board with ADC Simple board without ADC Fig. 39 The conventional detector model shows the photodiode and the analog-todigital converters (ADC) separated. Within the Stellar Detector these two tools are close to each other leading to minimized electronic noise. 72 Computed Tomography 3.4 Pediatric Computed Tomography Computed Tomography Radiographic examinations are used much less frequently for children than for adults, because their organism is still developing and because children seldom understand the cooperation (such as breath-holds, etc.) required of them. Nevertheless, computed tomography is of great importance for imaging of pediatric patients, especially for complex lung imaging, for imaging of congenital malformations, and in intensive care. As a consequence, the ALARA principle (As Low As Reasonably Achievable) is of particular importance in pediatrics. It calls for always selecting the dose that is as low as reasonably achievable, yet sufficient for a reliable diagnosis. The Siemens Dual Source CT SOMATOM Definition Flash, for example, offers effective doses below 0.5 mSv in pediatric applications, with excellent quality. Because of the fast scan speed using very-high-pitch values (Flash Spiral), even uncooperative children have the potential to be scanned quickly.36 Siemens CT scanners come with a wide range of technologies designed to reduce the dose to the patient to a minimum, including special tools developed for pediatric CT imaging (CARE Child, see page 71). Applying all these tools pediatric patients can be imaged with CT while the benefits of the examination may potentially outweigh the potential risk of the radiation exposure. 36 Lell MM et al. High-pitch spiral computed tomography: effect on image quality and radiation dose in pediatric chest computed tomography. Invest Radiol. 2011 Feb;46(2):116-23. 73 Computed Tomography 3.5 DoseMAP – The Siemens CT Dose Management Program Innovative technologies provide the base for CT examinations with low dose. For the optimization of the applied scan doses, and also for the control in daily clinical routine when time may be short, special means are available to support the dose management. Dose Structured Reports On SOMATOM scanners, the reporting of established dose parameters such as Computed Tomography Dose Index (CTDI) and dose length product (DLP) has been implemented since 1990. For each exam, the information is available in the patient protocol, and can be viewed and archived after the scan. Siemens provides the new Dose Structured Reports (Dose SR) for nearly all products within our CT portfolio. Dose SR contains comprehensive data for each irradiation event, including the accumulated dose and basic information about the context of the exposure. One radiation event is defined as one continuous irradiation applied to a patient; for example, a CT topogram and the associated spiral scan are two separate events. The details include patient demographics, study information, imaging technique and geometry, and all typical dose metrics (e.g. CTDIvol, DLP). The data is provided in electronic format that can be sent to any system which receives, stores, or processes dose information, such as conventional PACS or workstations for further analysis. 74 Computed Tomography Siemens Utilization Management Siemens Utilization Management (UM) is a proactive service offering from Siemens UPTIME Services that provides system-specific usage data which have been collected electronically using Siemens Remote Service (SRS). Access to these detailed data enables customers to leverage their systems’ full potential. Customers receive extensive equipment utilization analyses and anonymous benchmark information about comparable systems at other facilities operating in similar environments, as well as dose information on a regular basis. Computed Tomography The reports are generated by the Siemens service organization and made available through personalized access to the LifeNet UPTIME Services Portal. This is Siemens’ secure web portal that gives customers the information they need to manage the productivity of their Siemens diagnostic equipment – anywhere Internet access is available. The Dose Report The dose report is a feature of Utilization Management (UM) that keeps users aware of the data regarding total radiation exposure and dose usage on a monthly or a multi-monthly basis. With UM, dose information can be accessed in all basic and advanced reports for SOMATOM Definition systems (from SW version syngo CT 2008B). It is an easy way to track system and dose utilization details at the point of care. With these reports, users can see if any specific values have been exceeded, indicating that a significant radiation dose has been administered. With the new dose report, operators obtain an overview of the total number and the percentage split of all selected protocols, as well as the available dose information for the dedicated period. The relevant dose values for a CT examination are the CT dose index volume (CTDIvol) and the dose length product (DLP). 75 Computed Tomography Key benefits for the user include: 1. Visibility of dose usage data in a monthly or multi-monthly period; increased awareness of radiation exposure among clinicians 2. Easy way to track system and dose utilization details at the point of care 3. Increased ability to optimize clinical practice 4. Need for dose details of specific procedures is satisfied 5. Available in four languages (German, English, French, Spanish) Through customized service agreements, Siemens UPTIME Services can offer almost unlimited options, from proven service modules and freely adaptable solutions to shared service options that support in-house staff in performing individual tasks themselves. More information is available at www.siemens.com/Performanceplans. Dose Notification and Dose Alert With Dose Notification values for CTDIvol and DLP can be defined that should not be exceeded. This has to be done separately for CT examinations in adults and children. National organizations such as BfS (Bundesamt für Strahlenschutz, Federal Office for Radiation Protection, Germany) and ACR (American College of Radiology, USA) provide recommendations on reference dose levels in terms of CTDIvol and DLP. If the planned setting for the exam would result in a CTDIvol or DLP higher than these predefined values for one scan a Dose Notification message box will inform the user. Dose Alert is another dose warning tool. Here the CTDIvol values are predefined for both CT examinations of adults and children, when the system is shipped. According to recommendations by the FDA (Food and Drug Administration, USA) these two values are set to 1,000 mGy. These predefined values can be changed. In addition the definition of a DLP value is possible. A Dose Alert message box is displayed if the accumulated CTDIvol or the accumulated DLP, plus the estimated values for the next confirmed scan range exceeds the corresponding Alert Value. A diagnostic reason and the user’s name have to be entered before the scan can be performed with these settings. In many countries functionalities like Dose Notification and Dose Alert will become mandatory in the near future. 76 Computed Tomography Computed Tomography 77 Molecular Imaging 4. Molecular Imaging – Nuclear Medicine Modality-Specific Challenges and Siemens Solutions 4.1 Dose and Radiation Risk in Molecular Imaging – Nuclear Medicine Unlike in CT, the radiation burden in PET and SPECT does not directly depend on the imaging device, but on the administered radiopharmaceutical and its properties. This is independent from the number of acquired images. The effective dose is proportional to the administered activity, which indicates the amount of the isotope. Activity is measured in becquerels (Bq), where 1 Bq equals 1 decay per second, and curies (Ci), where 1 Ci equals 3.7 x 10¹⁰ decays per second. Additional physical parameters are physical half-life, and type and properties of the emitted radiation. Therefore, isotopes with a physical half-life in the range of the total examination duration should be applied in order to prevent additional unused radiation that would result from using isotopes with longer half-lives. In addition, pure gamma emitters such as 99mTc or pure positron emitters such as 18F are preferred. Additional radiation components do not contribute to the diagnostic image, but contribute to the overall effective dose. Biological parameters are the pharmacokinetic properties of the radiopharmaceutical, which influence the biological half-life and distribution pattern, and change dynamically after the application. Effective half-life combines the effects of physical decay (physical half-life) and excretion (biological half-life): 1/T1/2eff = 1/T1/2phys + 1/T1/2biol The calculation of effective dose in an individual varies due to differences in excretion time, as well as anatomical differences. Dose calculation reflects the absorbed radiation in the body both from the radiopharmaceutical residing in that region and the radiation dose from distant organs/regions. Thus, some simplifications – such as standardized anatomy – are made for the assessment of dose for diagnostic purposes, as in Organ Level INternal Dose Assessment (OLINDA). 78 Molecular Imaging Package inserts describe the effective doses per administered MBq as well as the organ doses per MBq for, at minimum, critical organs for a standard patient with respect to size, weight, distribution pattern, and excretion. The impact of the molecular imaging system on the dose is only influenced by the system’s minimum activity requirements for a given image quality and acquisition duration. There is a wide range of typical effective doses for different nuclear medicine procedures. Some are far below 1 mSv (e.g. the Schilling test), while others may exceed 10 mSv (e.g. gallium scintigraphy). The effective dose for a typical 18F-FDG injection used for a PET•CT is 5–7 mSv. Most procedures, however, result in doses between 1 and 10 mSv. 1. The usage of ionizing radiation always requires a justified indication. Can the same clinical result reasonably be achieved using any other examination? 2. Can the overall diagnostic dose be reduced by judiciously combining examination types? Good clinical planning may reduce the number of CT examinations if diagnostic CT and CT for hybrid imaging are combined in a single scan. 3. Isotopes with a shorter half-life and favorable radiation type can reduce radiation exposure dramatically. For example, the use of 123I-MIBG instead of 131I-MIBG in the diagnosis of neuroendocrine tumors improves image quality and reduces radiation exposure, due to a much shorter half-life (13 hours instead of eight days) and radiation type (gamma emitter with a main peak of 151 keV versus combined beta and gamma emitter). Another example is the use of 18F-FDG-PET instead of 67 Ga scintigraphy in lymphoma and inflammation cases. In addition to a much lower radiation exposure, image quality and precision are much better and the overall time from injection to end of scan is substantially reduced (1.5–2 hours versus 3–4 days). 4. The choice of the radiopharmaceutical can also reduce the radiation burden. 99m Tc-MAG3 shows a much higher renal uptake and clearance than 99mTc-DTPA. This allows injected activity to be reduced by a factor of two while maintaining the same image quality and precision with respect to urodynamics. 79 Molecular Imaging In hybrid devices, the burden of radiation stems not only from the use of radiopharmaceuticals but also from the CT component as well. Thus, advances in scanner technology allow the reduction of injected activity, and hence the effective dose. In addition to activity reduction, other considerations include: Molecular Imaging 5. Not every clinical question requires striving to achieve the best possible image quality through the combination of high injected activity and advanced acquisition and reconstruction tools. In some cases, a somewhat reduced image quality, which permits lower injected activity, still fulfills the clinical need. 6. Several countries have issued guidelines for maximum standard activities according to examination type. Pediatric activities can be calculated adherent to special rules. In the past, effective doses in children were rather high due to insufficient adjustments to the guidelines, which have since changed. 4.2 Dose Reduction Technology for PET•CT Features pioneered by Siemens to reduce dose in molecular imaging include: 1. 2. 3. 4. CARE Dose4D Ultra Fast Ceramic (UFC) LSO Crystal Technology TrueV 5. 6. 7. 8. Adaptive ECG Cardio Sequence Adaptive Dose Shield X-Care SMART Neuro AC 9. 10. 11. 12. 13. ultraHD•PET Single Source DE CARE kV SAFIRE FlowMotion Biograph 1994 1997 1999 2006 2007 2007 X-ray Without TrueV 2008 Dose Shield TrueV X-ray low UFC Dose Shield Light CARE Dose4D 2008 Ultra Fast Ceramic (UFC) 2008 LSO Crystal Technology 2010 2010 70 kV 80 kV 100 kV 120 kV 140 kV 80 kV Attenuation B ultraHD•PET 80 Raw data recon Image data recon 140 kV 2012 Adaptive Dose Shield 2013 Image correction No CT Attenuation A Single Source DE Adaptive ECG Cardio Sequence TrueV CARE kV SAFIRE SMART Neuro AC FlowMotion X-ray on X-Care Molecular Imaging As concern over radiation dose to patients rises, hybrid modalities are coming under intense scrutiny due to their dual imaging nature – the two components of the PET•CT scan both impose a certain radiation burden. Because of this dual nature, both modalities must maximize the diagnostic information obtained while reducing the injected radiopharmaceutical dose and the applied radiation from the CT scan. Innovations in both areas have allowed the clinician to reduce the radiation dose by 50–60%. The following sections describe some of the major innovations contained in the Siemens BiographTM family37 of PET•CT scanners. Many of the innovations are unique to Biograph, offering a wide range of flexibility in patient dose reduction and scan acquisition speed. Biograph mCT Flow offers innovative solutions that allow the lowest dose to be administered, while still scanning patients faster than ever before. Now clinicians can have it all – scans with half the dose and double the speed. And by reducing dose and increasing speed, patient safety and utilization are improved while costs are dramatically reduced. Molecular Imaging Please visit www.siemens.com/mindosemaxspeed to find out more. 2 min/bed ultraHD•PET HD•PET 3D-AWOSEM 1 min/bed Data courtesy of University of Tennessee, Knoxville, TN, USA 37 The products/features (here mentioned) are not all commercially available on all Biograph configurations and in all countries. Please contact your local Siemens organization for further details. 81 Molecular Imaging LSO Crystal Technology In the 1990s Siemens pursued the development of a new scintillator crystal for clinical PET scanning called lutetium oxyorthosilicate (LSO). This new crystal has the properties of emitting more light than previously used materials when struck with a 511 keV photon from a PET radiopharmaceutical. LSO also emits the light more rapidly and has a shorter “afterglow.” Both of these qualities enabled the PET detector system to become more efficient, without losing any necessary information or reducing image quality. This, in turn, allows the injected dose of radiopharmaceutical to be reduced while maintaining image quality and speed of the examination. Along with dose reduction, the improved characteristics of LSO allowed a second innovation, called HI-REZ, to take place within the detector configuration. The additional light output enabled changes to be made to the crystal configuration while simultaneously increasing the resolution. The detector went from 6 mm square pixels to 4 mm square pixels, enabling an increase in resolution of approximately 250%. Fig. 40 LSO Crystal Technology. 82 Molecular Imaging TrueV Without TrueV Molecular Imaging The Biograph family of PET•CT systems possesses a unique feature in the market, called TrueV, that is directly aimed at dose reduction. TrueV increases the amount of detector material and extends the field of view (FOV) of the PET detectors in the z-direction of the patient in order to capture more information in each PET bed position. Biograph mCT employs 3D acquisition technology. By applying this method, any extension of the field of view leads to tremendous benefits in data acquisition. Increasing the field of view by 34.6% actually yields an improvement in scan productivity of about 70%. Conventional PET scanning uses bed positions or stop-and-go acquisition technique in order to cover the patient’s whole body. With TrueV, it takes less bed stops to cover the same patient volume than with other systems. In addition, each bed stop is more sensitive. By combining both of these benefits, the injected dose to the patient can be reduced while keeping all the other scan parameters the same, and image quality is maintained. TrueV Fig. 41 TrueV. 83 Molecular Imaging ultraHD•PET ultraHD•PET further reduces the image noise by using the HD•PET algorithm, which improves image resolution and uniformity across the field of view (FOV), and adds time-of-flight (TOF) information in the PET data. By measuring the arrival times of both incoming photons onto the detectors, the sophisticated electronics are able to determine where the measured event took place along the line of response. Because photons travel at the speed of light, the timing resolution of the PET system must be able to measure a difference in arrival times of the photons in the picosecond range. By being able to localize the event in the body along the line of response with this time-of-flight information, the reconstruction process is able to reduce image noise further to a point where the injected dose to the patient can be reduced by half and the image quality will match a full dose scan. Biograph mCT and Biograph mCT Flow are the only PET•CT systems that combine the extended FOV of TrueV with ultraHD•PET to offer a system that can reduce the injected dose to the patient by 50% and offer improvement in scan speed at the same time, eliminating the need to choose between a fast scan or a low-dose scan. Fig. 42 ultraHD•PET. 84 Molecular Imaging FlowMotion – Eliminating Over-Scanning Furthermore, the new Biograph mCT Flow, coupled with TrueV, is the only solution that enables continuous scanning at twice the speed of conventional PET/CT. Thanks to the 34.6% wider axial FOV of 22.09 cm – the largest in the PET/CT industry,38 – a 70% increase in count rate performance is realized. When combined with ultraHD•PET, five-minute scanning becomes a reality for routine clinical performance. The arrival of high-speed, 10 mm/second FlowMotion PET scanning creates an opportunity that extends beyond providing the fastest examination. It is poised to advance future areas of research like breath-hold PET lung imaging for scans virtually free of motion. Biograph mCT Flow meets the dual mandate for high patient safety while achieving maximum efficiency. Biograph mCT Flow is capable of achieving a 5-minute diagnostic PET•CT, with flexible CT-like range planning and zero CT overscan. With FlowMotion, physicians can truly offer As Low as Reasonably Achievable (ALARA) dose to every patient39 and referring physician. Conventional Fig. 43 FlowMotion. Planning and scanning in sequential bed positions requires the PET and CT acquisition to expose an area beyond what is needed. FlowMotion With precise CT-like organ-based planning and scanning FlowMotion targets only the desired range. 38 Based on competetive literature available at time of publication. Data on file. 39 Patients up to 227 kg (500 lbs). 85 Molecular Imaging Because the CT is used for attenuation correction, the scan length must exactly match the length of the PET range. This creates a problem with conventional stop-and-go imaging, as the sequential bed dimensions often force the PET and CT acquisitions to expose an area beyond what is needed. Commonly known as over-scanning, this issue is an inherent drawback of stopand-go PET/CT systems. FlowMotion takes Siemens CARE commitment to the next level by allowing physicians to precisely and continuously plan and scan only the desired areas. As a result, only the targeted tissue is irradiated, completely eliminating over-scanning and the associated CT dose. Molecular Imaging Low-Dose CT CARE for Biograph With CARE (Combined Applications to Reduce Exposure), Siemens has been highly successful in integrating many innovations that significantly reduce CT radiation dose. STRATON™ X-ray tube features a unique Adaptive Dose Shield lowering CT dose by up to 25%. Moreover, SAFIRE (Sinogram Affirmed Iterative Reconstruction) allows up to a 60% dose reduction40 by utilizing raw-data-based iterative reconstruction. Finally CARE kV, the only automated CT voltage setting technology, optimizes the contrast-to-noise-ratio to reduce dose by up to 60%. Low-Dose CARE features have all been explained in the CT chapters of this guide. X-ray Dose Shield UFC Dose Shield Light CARE Dose4D Ultra Fast Ceramic (UFC) Adaptive ECG Cardio Sequence Adaptive Dose Shield X-ray low 70 kV 80 kV 100 kV 120 kV 140 kV X-ray on X-Care 80 kV Attenuation B Raw data recon Image data recon Image correction 140 kV Attenuation A Single Source DE CARE kV SAFIRE Fig. 44 Low-Dose CT CARE features for Biograph. 40 86 In clinical practice, the use of SAFIRE may reduce CT patient dose depending on the clinical task, patient size, anatomical location, and clinical practice. A consultation with a radiologist and a physicist should be made to determine the appropriate dose to obtain diagnostic image quality for the particular clinical task. Molecular Imaging 4.3 Dose Reduction Technology for SPECT Features pioneered by Siemens to reduce dose in molecular imaging include: 1. AUTOFORM Collimators 2. CARE Dose4D Dose Modulation 3. Ultra-Fast Ceramic Detectors (UFC) 4. SureView Spiral Algorithm 5. Pediatric kV Protocols 6. Flash 3D Iterative Reconstruction 7. Automated Quality Control (AQC) 8. IQ•SPECT Ultra Low-Dose Cardiac Imaging 9. DICOM Dose Reports 10. Dose Alerts Symbia 1990 1994 1997 1999 Molecular Imaging SPECT: HD Detectors 2002 X-ray UFC Light Competition AUTOFORM SIEMENS 2003 Flash 3D CARE Dose4D 2006 AQC UFC 2008 IQ•SPECT SureView 2009 DICOM Reports Pediatric Protocols 2010 Dose Alerts 87 Molecular Imaging SPECT•CT imaging procedures are categorized into four main clinical areas – cardiology, oncology, general purpose imaging, and neurology. Minimizing dose is equally important in all clinical segments, but – unlike CT or MRI – hybrid imaging in nuclear medicine (SPECT•CT and PET•CT), permits dose to be optimized in two ways: by reducing the dose of the injected radiopharmaceutical and by minimizing the CT dose emitted from the hybrid scanner. While pressure is increasing to minimize the CT dose, it is also critically important to reduce the injected dose in SPECT imaging to help the physician improve patient safety. Additionally, but no less importantly, there are only five nuclear reactors worldwide that produce 100% of the most commonly used SPECT tracer – technetium (99mTc). Some of these reactors have been shut down for temporary maintenance, and the availability of 99mTc, consequently, has been reduced worldwide. This limited availability has brought a need for more efficient use of technetium. Therefore, injecting less dose per patient is very important so that hospitals can continue to scan their full patient load. Siemens SymbiaTM SPECT•CT product line is pioneering dose savings in both SPECT and CT. Not only do we have the most integrated diagnostic SPECT•CT systems, but we also provide features that can save up to 75% of the dose while maintaining image quality. This section provides a short overview of the dose-saving features of Symbia. Please visit www.siemens.com/mindosemaxspeed to find out more. 88 Molecular Imaging AUTOFORM Collimators Conventional collimators have uneven septa wall thickness, which decreases sensitivity and increases the dose or scan time needed to acquire a valuable image. Siemens is the only equipment manufacturer that designs and produces its collimators inhouse. AUTOFORM collimators use a proprietary design that provides uniform septa wall thickness. The proprietary collimator design offers the industry’s highest sensitivity,41 with up to 26% more counts41, while maintaining image resolution. Siemens AUTOFORM collimators offer the highest SPECT LEHR sensitivity in the market today that enables: SPECT: HD Detectors Conventional Collimators AUTOFORM Collimators Molecular Imaging 1. Up-to 26% lower injected dose 2. Up-to 26% faster imaging NEMA Planar LEHR System Sensitivity (cpm/uCi @ 10 cm) 202 195 185 175 165 168 160 Competitor 1 Fig. 45 Competition HD Detectors. Competitor 2 Siemens SIEMENS 41 Based on competitive literature available at time of publication. Data on file. 89 Molecular Imaging Flash 3D Iterative Reconstruction Inaccurate image reconstruction impacts image quality and can result in both false positives and false negatives. Most reconstructed images are created using algorithms that do not account for the physical characteristics of the image acquisition system. Symbia SPECT•CT scanners with Flash reconstruction use a measured 3D collimator beam model in the iteration process. Correct modeling of the collimator distributes the activity over the slices for more accurate reconstruction. With Flash, the spatial resolution of the collimator is modeled to maintain the precise shape of the lesion. As a result, images are reconstructed with more counts in the correct volume, increasing image contrast. Flash enables up-to 45% higher reconstructed resolution according to NEMA specifications42 that ultimately enables: 1. Up-to 50% less injected dose 2. Up-to 50% faster imaging Conventional Filtered Back Projection Flash Reconstruction Courtesy of MD Anderson Cancer Center, Houston, Texas, USA. Fig. 46 Flash Iterative Reconstruction. 42 90 Based on competitive literature available at time of publication. Data on file. Molecular Imaging Automatic Quality Control Scanners require regular quality control (QC) tests to validate calibration of the detectors. For conventional scanners, quality control is performed manually, and typically requires 20 minutes to an hour for daily QC, and about six hours for monthly QC. Because the tests require preparation and handling of open radioactive sources, the process must be rotated among the staff to avoid overexposure. Dose spillage adds further risk to the process. With Siemens AQC, the process is performed automatically overnight, with a report provided for the technologist to review the next morning. Siemens AQC facilitates performance trending, eliminates the risk of open-source spillage and reduces staff radiation exposure. The benefits of AQC include: Molecular Imaging 1. Reliable, consistently reproducible QC 2.Eliminated risk of spillage with open sources 3.Operator dose reduction 4. Can run automatically overnight, saving time for the operator Fig. 47 Automatic Quality Control. 91 Molecular Imaging IQ•SPECT Routine cardiac studies can take up to 20 minutes, limiting the number of patient scans. To achieve the desired image quality, patients are often injected with high doses that increase radiation exposure. Siemens IQ•SPECT is the only technology that performs ultra-fast cardiac imaging with a general purpose camera. Its unique collimator design, cardio-centric image acquisition and advanced reconstruction technology acquires four-times more counts than conventional methods for the highest quality images independent of age, body shape or size. With IQ•SPECT, physicians can perform a myocardial perfusion imaging study in on of the following protocols options: 1. Up-to 75% less injected dose in 16 minutes 2. Up-to 50% less injected dose in 8 minutes 3. Up-to 25% less injected dose in 4 minutes Competetive SPECT/CT Symbia Intevo Up-to 75% less injected dose Fig. 48 IQ•SPECT. 92 Molecular Imaging Low-Dose CT AC In hybrid imaging one of the most commonly used CT protocols is attenuation correction. Highend SPECT/CT scanners that incorporate CT systems with a higher number of slices may require more energy, potentially exposing the patient to higher levels of radiation. Additionally, conventional SPECT/CT scanners do not allow selection of lower X-ray tube voltages for attenuation correction scans. Competition43 Symbia Intevo CT AC Abdomen 120 kV 4.35 mGy 130 kV 1.20 mGy 72% CT AC Cardiac 120 kV 1.59 mGy 130 kV 110 kV 80 kV 1.20 mGy 1.00 mGy 0.40 mGy 25% 37% 74% CT AC Parathyroid 120 kV 4.35 mGy 130 kV 1.80 mGy 58% Molecular Imaging Siemens high-end 16-slice CT system delivers up to 74% less radiation43 to the patient during attenuation correction and the user can adjust X-ray tube voltages to further reduce dose exposure. For the three most common nuclear medicine attenuation correction procedures, Siemens CT technology delivers the lowest dose compared to conventional scanners. Symbia Intevo Fig. 49 Low-Dose CT AC. 43 Based on competitive literature available at time of publication. Data on file. Dose values compared are based upon factory default protocols from GE NM670. 93 Angiography 5. Angiography Modality-Specific Challenges and Siemens Solutions 5.1 Dose and Radiation Risk in Angiography Angiography-Specific Dose Parameters Several dose parameters are specific to angiography: the detector dose, the patient entrance dose, the dose rate, and the DAP (dose area product), which will be covered in the following sections. Dose and Image Quality In the past, when angiography was performed using traditional photographic film technology, the general rule was the higher the dose, the better the image quality. With today’s improvements in imaging technology, is there still a trade-off between improving quality and saving dose? Yes In general, low dose goes hand in hand with less visibility, while higher image quality requires, among other factors, a higher dose. To obtain a specific image quality, it is necessary to choose the “right” dose for the tissue being penetrated. Therefore, the solution is to make best use of dose and equipment. Good image quality can be expressed in terms of detectability. Rose found: 44 Detectability ~ physical contrast · object diameter · √dose at detector (The physical contrast is the difference in X-ray absorption between rays of the beam running through the object of interest and the rays next to it.) 44 94 Rose A. Vision, human and electronic. Plenum Press, New York, 1973. Angiography What does this mean for angiography? Lesion detectability is directly related to detector dose, given a certain physical contrast and diameter of a vessel. In general good contrast, low noise, and high spatial resolution are necessary for good image quality. As a result, even fine details are visible. Fig. 50 Image example with good contrast, low noise, and high spatial resolution. Patient Entrance Dose and Safety During Fluoroscopy Angiography Modern detector systems make it easy to obtain high-quality results simply by selecting the required image quality by choosing an appropriate protocol; the requested dose at the detector entrance will automatically be kept constant (as much as possible) by adjusting the tube output dose. This automatic dose control compensates for patients of different body sizes. The dose is highest at the point where the beam enters the patient. The absorbed dose at this beam entrance is an important measure: It signifies the accumulated patient entrance dose over the length of the procedure, measured in mGy (1,000 mGy = 1 Gy). This accumulated patient entrance dose is relevant for determining the skin burn damage resulting from the intervention. Detector systems display and report only an estimate of the patient entrance dose at the interventional reference point (IRP). Values at the actual exposure entry location can be different depending on the patient’s body shape and other geometric measures, such as table and C-arm position. 95 Angiography Figure 51 shows the location of measurement for dose and dose rate. 1. The red point on the X-ray tube housing indicates the position of the focal spot. 2. The source-image distance (SID) is the distance between the focal spot and the image receptor. On the Artis systems, this receptor is the flat detector. 3. ISO Center refers to the isocenter of the C-arm; i.e. the central point around which the C-arm rotates. 4. The IRP is 15 cm beneath the isocenter and is assumed to be the skin entrance point. The calculated estimates for the displayed dose values refer to the IRP. SID = source-image distance ISO Center + IRP + 15 cm SID IRP = interventional reference point Dose chamber Focal spot Fig. 51 Schematic C-arm, detector, tube, table; location of dose and dose rate measurement. 96 Angiography The IRP is the measuring point for: 1. Dose area product (DAP) in µGy m2 2. Dose in mGy 3. Dose rate in mGy/min Note: The IRP does not change with table height. As a general rule, the closer the beam entrance to the tube, the higher the real patient entrance dose and vice versa. The Siemens Artis system has two built-in safety regulations for fluoroscopy: Angiography 1. By default, the dose rate (air kerma rate) at a specific location (30 cm in front of the detector) is limited to a certain level (e.g., 10 R/min = 87 mGy/min for the U.S. and European countries). It is assumed that this point is identical to the patient’s skin entry point. It is possible to increase the dose rate by using the “Fluoro +” button (high-contrast button). An audible warning occurs. 2. After every five minutes of fluoroscopy, a message pops up on the display and a sound is emitted to remind the user of the applied dose. If the operator does not acknowledge this signal, radiation exposure stops after the next five minutes of fluoroscopy. Dose regulation tries to keep the dose on the detector input constant Patient 30 cm Actual detector entrance dose Generator kV, mA, ms, prefiltration Fig. 52 Principle of dose regulation with constant input dose at the detector and 10 R/min dose rate limit 30 cm in front of the detector. 97 Angiography Dose Rate and Dependence of Absorption on Patient’s Thickness Mean patient entrance dose has been reported for interventions in the brain. Although head size varies little among individuals, body size varies greatly. Figure 53 shows that an increase in patient’s thickness of about 3 cm results in twice the entrance dose for a constant detector entrance dose. This rule of thumb is based on the assumption that tissue absorbs radiation in a similar manner as water and that a certain quality of beam is applied. Constant patient exit dose 20 cm water 23 cm water 26 cm water 100% 200% 400% Patient entrance dose Fig. 53 Patient entrance dose depends on patient thickness to achieve the same patient exit dose. 98 Angiography A similar effect occurs when the direction of projection is changed to an oblique position (Figure 54). Because the shape of the body is more oval than circular, the length of the X-ray beam is now longer, resulting in a higher entrance dose. True values may differ significantly since the body is not really a homogeneous ellipsoid but consists of bones, organs, etc.45 Patient exit dose 20 cm @ 0º 25.6 cm @ 45º 28.5 cm @ 55º 360% / 700% Angiography 100% Patient entrance dose Fig. 54 Simplified model showing the effect on patient entrance dose when the projection is angulated. 45 Cusma JT et al. Real-time measurement of radiation exposure to patients during diagnostic coronary angiography and percutaneous interventional procedures. J Am Coll Cardiol. 1999 Feb;33(2):427-35. 99 Angiography Dose Area Product and Inverse Square Law In air, X-rays travel in a straight line – thus, their intensity decreases as the distance from the X-ray tube focus increases along with the surface area of the beam. Figure 55 shows the following: the dose D at the distance d from the focal spot F drops to 1/4 D at the distance 2d and to 1/9 of D at three times the distance. This is the “inverse square law for radiation dose.” F d a2 D 2d 3d 4 a2 1/4 D 9 a2 1/9 D Fig. 55 Dose area product and inverse square law for radiation dose. 100 Angiography Dose Area Product (DAP) The DAP of a certain exposed area of constant dose is defined as dose times area and is independent from the distance to the source. An example for distances d1 = d and d2 = 2d and for associated doses D1 = D and D2 = 1/4 D and the irradiated areas a1 = a and a2 = a d2²/d1² = 4a proves: DAP1 = D1 · a1 = D · a DAP2 = D2 · a2 = 1/4 D · 4a = D · a = DAP1 This means that the dose area product remains constant at different distances. Angiography Inverse square law: The inverse square law for radiation dose shows that at twice the distance from the focus, the dose D is reduced by a factor of four with respect to the quadrupled surface – it is spread across a fourfold area. 101 Angiography Effective Dose in Angiography Determining the effective dose in angiography depends on several factors, primarily on the variability in organ sensitivity to radiation. Recall that bone marrow is far more sensitive to radiation than the liver (refer back to the section on “Equivalent and Effective Dose”). The degree to which organs are affected by radiation also depends on the angle of the beams. Because dose distribution in angiography is not “homogeneous” as it is for CT, these factors must be considered when estimating the damage caused by irradiation. Converting patient entrance dose and DAP to effective dose is reliable only if the X-ray parameters and the location of the beam running through the body are known. In modern angiography, the role of the effective dose is not as significant as it is, for instance, in CT. Remember: The effective dose includes the sensitivity to radiation of the different organs. It is the sum of the equivalent doses in all irradiated organs multiplied by the respective tissue weighting factors. 102 Angiography Important Parameters that Affect Dose in Angiography Several parameters affect dose in angiography: 1. Footswitch on-time: footswitch on-time controls how long the beam is on the body and thus how long the body is irradiated; less time means less radiation. 2. Frame rate: high frame rates are used to visualize fast motion without stroboscopic effects. However, the higher the frame rate, the more radiation. Therefore it is best to keep the frame rate as low as possible. 3. SID: according to the quadratic law and a constant requested dose at the detector, a greater distance between the source and the imager increases the patient entrance dose. Raising SID from 105 cm (= SID 1) to 120 cm (= SID 2) increases patient entrance dose (i.e. the dose at the IRP) by approximately 30% 46. Figure 56 illustrates the setup including the lower (SID = 105 cm) and the upper (SID = 120 cm) position of the detector. SID2 IRP + Angiography SID = source-image distance IRP = interventional reference point SID1 Fig. 56 C-arm, two different SIDs, constant table height, location of the IRP. 46 If C-arm angles, table position, patient, and requested dose at the detector do not change. 103 Angiography 5.2 Dose Reduction Technologies in Angiography This section focuses on various technologies that Siemens has implemented or developed to reduce, monitor, and report the radiation dose applied during interventional procedures. Siemens strives to implement all dose-saving, monitoring, and reduction methods available in the interventional market today. As a leader in the field of dose reduction, we consistently develop our own solutions. As such, we were the first to implement several features that save and monitor the radiation dose in the interventional routine. In addition, we are a leading vendor to offer these cutting-edge solutions for a large number of features. Our products clearly follow the ALARA principle (As Low As Reasonably Achievable) to reduce radiation dose to the lowest possible level. This desire for as little radiation exposure as possible is at the heart of the CARE (Combined Applications to Reduce Exposure) research and development philosophy. To maintain our leading position, and to improve healthcare for patients, we cooperate closely with experts at universities and at public and private radiology centers all over the world – to convert research developments into practical components of everyday clinical routine. In addition to implementing the newest technology, dose reduction efforts in angiography require training to become familiar with reduction methods and factors. We therefore attempt to make our dose-saving products as transparent as possible. We also provide a broad range of dose-monitoring products to interventionalists and technologists, and offer an ongoing selection of seminars and resources on dose reduction. Figure 57 outlines our dose-saving, monitoring, and reporting products and tools for angiography, which are all available with all Artis systems. Features pioneered by Siemens to reduce dose in AX include: 1. CARE features 2.GIGALIX 3. Crystalline silicon detector 104 1994 1994 1998 2001 CAREvision CAREfilter CAREprofile CAREwatch 2009 2009 2009 2009 CAREposition CAREreport Low-Dose Acquisition Low-Dose syngo DynaCT 2009 2010 2012 CAREguard CARE Analytics CAREmonitor Angiography Angiography Fig. 57 Timeline of Siemens innovations to reduce, monitor, and report dose in angiography. 105 Angiography Dose Saving – CARE Reducing the dose during interventional procedures is not only critical for the patient, but also for the interventionalist and staff in the examination room. By integrating a broad range of dose-saving features into the Artis systems, Siemens minimizes the dose to both patients and the interventional staff. Variable Fluoro Pulse Rates CAREvision CAREvision provides variable fluoro pulse rates. The pulsing frequency of the Artis systems can be adapted according to the clinical need: from 30 pulses per second (p/s) in various steps, down to 0.5 p/s. This is the easiest way to reduce exposure to the patient. A reduction to half pulse rate reduces the dose by about half. The reduction from 30 p/s to 7.5 p/s results in a dose saving of 75%47 (Figure 58). Patient dose 100% 80% 60% 40% 20% 30 fps 15 fps 10 fps 7.5 fps 4 fps 3 fps 2 fps 1 fps 0.5 fps Fig. 58 Reduction in patient dose by lowering the pulse rate during fluoroscopy. 47 106 Product Dose Reduction Claims for Artis Q / Q.zen. Angiography Continuous Variable Filter Adjustment CAREfilter 0.1 mm Angiography 0.9 mm Patient entrance dose Patient weight / thickness CAREfilter achieves patient entrance dose reduction by allowing adjustment of the filter thickness. Additional copper filters reduce the patient entrance dose through beam hardening. The variable filtration, 0.1 to 0.9 mm during fluoroscopy and 0.0 to 0.9 mm during digital acquisition, is adjusted automatically according to the absorption of the patient entrance dose along the path of the X-ray beam through the patient. This automatic filter insertion always maintains the lowest patient entrance dose possible without degrading perceived image quality. The filter selection is shown on the data display part of the monitor. Increasing prefiltering from 0.1 to 0.9 mm at 70 kV results in a dose saving of approximately 50%47 (Figure 59). Automatic filter insertion Fig. 59 Patient entrance dose reduction by automatic copper filtration depending on the absorption of the X-ray beam by the patient. 107 Angiography Radiation-Free Collimator and Filter Setting CAREprofile Using the last image hold (LIH) as a reference, CAREprofile allows radiation-free collimation and semitransparent filter position setting to precisely target the region of interest (Figure 60). Fig. 60 The collimator position is indicated on the LIH by a white frame. 108 Angiography Radiation-Free Positioning CAREposition CAREposition provides radiation-free object positioning. Graphic display of the outline of the upcoming image allows panning the table without fluoroscopic radiation exposure (Figure 61). Angiography Fig. 61 When panning the table top, the graphical annotation of the field moves to the new position on the LIH. Careprofile and Careposition can reduce the total fluoroscopy time by 0.5 to 3 minutes. This can results in a dose saving for normal fluoro at a SID of 100 cm and a phantom and table equivalent thickness of 207 mm at 70 kV of 12 to 70 mGy.48 48 Nickoloff et al., Cardiovasc Intervent Radiol (2007) 30:168-176. 109 Angiography Low-Dose Fluoroscopy The operator can easily reduce the radiation exposure by changing the fluoroscopy protocol – i.e. by switching tableside ECC/TSC49 from “Fluoro med” to “Fluoro low” during fluoroscopy using the touch screen; or by increasing the exposure to “Fluoro high” because of a thick object or a steep angulation (Figure 62). Fig. 62 Switching between various dose rates on the ECC/TSC. 49 110 Fig. 63 Examination Set “Cardiac” with “Fluoro Angio med 10 P/s” and “DSA 3 F/s.” ECC = Examination Control Console, TSC = Touch Screen Control. Angiography Switching between the three different fluoroscopy modes can be done tableside in the Examination tab card (see Figure 62) or in the control room in the Examination Set (see Figure 63). “Fluoro low” typically means half dose compared to “Fluoro med.” Low-Dose Acquisition For especially dose-sensitive patients, it is possible to generate a special low-dose acquisition protocol. An acquisition pedal of the footswitch can be configured as a low-dose acquisition alternative to the ECC/TSC (Figure 65). A dose saving of 67%50 can be achieved by using an acquisition dose of 80 nGy/f instead of 240 nGy/f for interventional cardiology and an acquisition dose of 0.8 μGy/f instead of 2.4 μGy/f for interventional radiology. Low-dose acquisition Angiography Acquisition Fig. 64 Low-Dose Acquisition image of the iliac artery using 67% less dose in comparison to a standard acquisition protocol. 50 Fig. 65 Pedals for generating standard acquisition and low-dose acquisition. Product Dose Reduction Claims for Artis Q / Q.zen. 111 Angiography Low-Dose syngo DynaCT The low-dose syngo DynaCT protocol achieves acceptable image quality at lowest possible dose values in a lot of cases (Figure 66). This protocol is for radiosensitive patients, such as pediatric patients, and provides adequate diagnostic image quality. In clinical practice, the balance between image quality and dose has to be considered. For the prerequisites mentioned above, a five-second high-contrast DR rotational 3D run applying 0.36 µGy/f can be reduced to 0.1 µGy/f. Switching from 0.36 µGy/f to 0.1 µGy/f results in a dose saving of up to 72%51. Low-dose syngo DynaCT can be achieved with an effective dose of 0.1 mSv. In combination with syngo InSpace3D/3D Fusion, low-dose syngo DynaCT results can be fused with diagnostic preinterventional CT, MR, or PET•CT results. These fused data sets provide an excellent basis for planning and guidance during interventional procedures. Fig. 66 Low-dose syngo DynaCT image. 51 112 Product Dose Reduction Claims for Artis Q / Q.zen. Angiography Slab Reconstruction for syngo DynaCT Slab mode allows you to collimate the image from top to bottom before doing the 3D rotational run (Figure 67). The benefits are lower dose, because of the small exposed area, with better image quality, because of less scattered radiation. Without collimation With collimation Angiography Minimum 3.5 cm Fig. 67 Slab reconstruction for syngo DynaCT. 113 Angiography Fluoro Loop – Storage of Fluoroscopic Scenes The Artis systems can store the last 1024 images from fluoroscopy to hard disk (Figure 68). This feature can be used for documentation, and can make additional digital acquisitions unnecessary. The operator only has to press one button at the ECC/TSC console. HDD storage Dynamic fluoro scene CD-R/Net Fig. 68 Fluoro scenes can be stored to disk and CD/DVD, and also sent to PACS. For specific cardiac protocols, using fluoroscopic recording instead of digital acquisition results in a dose saving by a factor of 8 to 10 per minute at 15 fps.52 52 114 Nickoloff et al., Cardiovasc Intervent Radiol (2007) 30:168-176. Angiography Removable Grid Angiography A simple way to reduce the dose in pediatric examinations, especially for babies or very thin patients, when scatter radiation can be expected to be negligible, is to remove the scatter grid in the flat detector housing (Figure 69). Fig. 69 The anti-scattering grid can be removed by simply pressing a button on the flat detector housing. The grid factor (i.e. the absorption of primary radiation due to the anti-scatter grid compared to free air) is 1.35, which translates into a dose saving of 26% when removing the grid. 115 Angiography Dose Monitoring Monitoring the patient dose is another element in controlling radiation exposure. To keep the burden of this task off the interventionalist, the Artis systems are equipped to monitor patient dose in various ways. This allows for more transparency during and after the procedure as to how much radiation was applied. The following sections discuss how to monitor dose with the Artis systems. Making dose visible CAREwatch CAREwatch displays the dose values during the patient examination on the image monitors in the examination room and also in the control room (Figure 70). 1. When radiation is off, the dose area product and the accumulated dose at the IRP (Figure 70) are displayed. 2. When radiation is on, the dose area product and dose rate at the IRP are displayed. mGy µGym A: 123 2 A: 567.8 mGy/min A: 321 µGym2 A: 567.8 Displayed when the footswitch is not pressed: Dose = 123 mGy DAP = 567.8 µGy m2 Displayed when footswitch is pressed: Dose rate = 321 mGy/min DAP = 567.8 µGy m2 Fig. 70 Displayed dose values at the Artis. 116 Angiography Multilevel Patient Entrance Dose Warning CAREguard CAREguard provides an effective way to control patient entrance dose (i.e. air kerma at the patient entrance reference point PERP53). Three dose threshold values (low, medium, and high) can be individually defined. If the accumulated patient entrance dose exceeds one of the defined thresholds: 1. An audible warning sound is given 2. A patient entrance dose indicator on the live display flashes Angiography 3. A warning popup is displayed on the ECC/touch screen (Figure 71) Fig. 71 Warning popup on ECC/TSC when a set dose threshold is exceeded. 53 PERP = Patient entrance reference point = IRP. 117 Angiography Peak Patient Entrance Dose Monitoring CAREmonitor CAREmonitor shows the accumulated peak patient entrance dose according to the current projection in the form of a fill indicator on the live monitor. Any change to the C-arm, table, SID, zoom, or collimator prompts the system to automatically update the calculation. CAREmonitor can help to avoid skin burns during long-lasting interventions. 118 Angiography Dose Reporting More and more countries and authorities require the reporting of patient exposure following an intervention. To meet current and future regulations, all Artis systems allow effective reporting of dose exposure and thus enable enhanced in-house dose reporting and analysis. Patient Examination Protocol After the patient has been examined, an examination or patient protocol is stored together with acquired images. The complete information for each run is stored. At the end of the protocol, the dose information is listed: number of exposures, total fluoro time, total dose area product, and total dose at IRP. These values are separated per plane in the lines below (Figure 72). Angiography The examination protocol can be sent to a PACS system and printed as an image. It can also be stored and sent as a DICOM structured report for further evaluation (see next section for further details). Fig. 72 Examination protocol for a biplane system (example only, not a real patient examination protocol). 119 Angiography DICOM Structured Dose Report CAREreport CAREreport, the DICOM structured dose report, contains all patient demographics, procedure and dose information. Using commercially available programs or in-house software, this information can be filtered for further processing, such as dose analysis (Figure 73). CAREreport provides consistent dose reporting and prepares for future potential legal requirements. DICOM Fig. 73 Use of the structured report for hospital statistics. 120 Angiography Focused Power – GIGALIX54 The GIGALIX X-ray tube has been designed around a unique flat emitter technology that generates powerful short pulses. Compared to filament technology, the higher maximum current of the flat emitter enables CLEARpulse and enhances image quality in challenging situations such as with obese patients or in steep angulations. The small square focal spots of the GIGALIX result in higher spatial resolution for all clinical applications and help to better visualize small devices and vessels. Together with the higher contrast resolution, this results in up to 70% better visibility of small devices55. With CLEARpulse, the pulse length can be shortened. This allows visualizing moving objects such as coronary vessels more sharply. CLEARpulse also optimizes the X-ray spectrum by lowering the required tube voltage and allowing for additional filtration. Together with small focal spots, this generates equal image quality with up to 60% less dose55. The GIGALIX X-ray tube in the Artis Q product line scores a double win: enhanced image quality at a significantly lower dose for both patients and staff. Angiography Intensity Higher peak power Lower peak power GIGALIX Filament tubes Exposure time Fig. 74 CLEARpulse – sharp images and low dose. 54 Only available with Artis Q/Q.zen. 55 Compared to previous X-ray tube technology. 121 Angiography Crystalline silicon detector56 High Sensitivity for Ultra-Low-Dose Imaging The active matrix of the Artis Q.zen detector allows the signal to be amplified directly where it is generated at each pixel of the matrix. This on-pixel amplification enhances the signal to electronic noise ratio compared to amorphous silicon detectors significantly and for the first time enables imaging with very low radiation, down to only 6 nGy per pulse. We call this new acquisition mode “ultra-low-dose imaging”. The image guidance of EP catheters can now be done with ultra-low-dose imaging. This reduces radiation to the patient and personnel in the room, which is especially important for complex, longlasting procedures such as pulmonary vein isolations. The detector delivers clear image quality even when using other systems in the room, such as mapping systems, without additional shielding. When treating babies and children, reducing radiation is of particular importance. Especially for complex interventional procedures in pediatric cardiology and radiology, ultra-low-dose imaging might help to reduce the radiation significantly. The ultra-fast readout technology of the new crystalline silicon detector allows for higher frame rates in 3D imaging, up to 99 f/s. In addition, the crystalline silicon detector provides more coverage compared to small cardiology detectors, allowing views of the entire heart. A B Courtesy of University Hospital Basel, Switzerland. Fig. 75 Comparison of fluoroscopy images of a pulmonary vein isolation procedure. A: Amorphous silicon: 39 nGy/pulse. B: Crystalline silicon: 10 nGy/pulse. 56 122 Only available with Artis Q.zen. Angiography 5.3 Radiation Protection for the Medical Staff in Angiography Distance to the X-ray Source In addition to protecting patients from excessive radiation exposure, physicians, technicians, and other medical staff should be protected from unnecessary (i.e. scattered) radiation as well. Scattered radiation does not come directly from the X-ray tube, but rather is scattered by the patient, table, or other devices within the path of the X-ray beam (Figure 76). Usually most of the scattered radiation is generated where the X-ray beam hits the patient. Operator 1 Patient Angiography Operator 2 Fig. 76 Scattered radiation decreases with distance from the source (i.e. the beam entrance location of the patient). Scattered radiation is roughly proportional to the dose area product (DAP) and decreases with distance squared to the location the scatter is generated. That is, twice the distance results in a quarter of the scattered radiation. Approaches to shielding from scattered radiation include: 1. 2. 3. 4. Lead apron Lead glasses Mobile lead walls Upper and lower body radiation protection 123 Angiography C-arm Installation on Interventional Radiology Biplane System Scattered radiation can be reduced by installing the lateral C-arm with the tube on the left side of the table when the medical staff works on the right (Figure 77). Fig. 77 Artis biplane system for interventional radiology with the X-ray tube on the left side of the table. As already mentioned in the last paragraph, scattered radiation is mainly generated at the beam entrance location of the patient, which is on the left side in this configuration. At the operator’s working position (right side), radiation exposure from scatter is much lower. This setup is possible for biplane systems used for interventional radiologic and neuroradiologic applications only; it is not applicable for cardiac use because in a cardiac setup the detector needs to be close to the heart. 124 Angiography Collimation Scattered radiation is roughly proportional to the dose area product (DAP). If the area of the irradiated field is reduced by half, scattered radiation is likewise reduced by 50% (Figure 78). Patient 100% 50% Fig. 78 Collimation should be used if possible. Upper and Lower Body Radiation Protection Angiography Radiation protection reduces medical staff exposure to scattered radiation by 99% – a highly effective method (Figure 79). Fig. 79 Lower and upper radiation protection. 125 Angiography RaySafe i2 Builds a Better Radiation Safety Culture™ RaySafe i2 dosimeter system is indispensable in creating a successful radiation safety culture. Once in place, both healthcare workers and management benefit from the radiation insight gained. Moreover, focus is returned to treating patients, versus worrying about unnecessary radiation exposure. i2 Dosimeter An active dosimeter that measures and records radiation every second. Data is transferred wirelessly to the i2 real-time display. It is maintenance-free, easy to wear and can be personalized with different colors and names. Fig. 80 RaySafe i2 dosimeter. 126 Angiography i2 Real-Time Display A 10.4” touch screen that displays dose data from all dosimeters in real-time. Green, yellow and red bars indicate the severity of individual user dose; accumulated dose is displayed next to the bars. By tapping the dosimeter name on the touch screen, more detailed information about the personal dose history can be accessed. i2 Software Fig. 81 RaySafe i2 real-time display. Angiography RaySafe i2 dose viewer is used for administrating dosimeters and viewing personal dose information. For advanced analysis, reporting and archiving of dose information, use RaySafe i2 dose manager. It manages multiple dosimeters and can retrieve dose information from multiple real-time displays throughout the hospital network or via USB storage. Fig. 82 RaySafe i2 software. © 2012.02 Unfors RaySafe 5200034-A; www.raysafe.com 127 Angiography Further Reading A comprehensive overview on dose issues and image quality can be found in the following article: Stephen Balter et al. ACCF/AHA/HRS/SCAI Clinical Competence Statement on Physician Safety and Image Quality in Fluoroscopically Guided Invasive Cardiovascular Procedures, Journal of the American College of Cardiology, Vol. 44, No. 11, 2004. 128 Angiography Angiography 129 X-Ray Products 6. X-Ray Products Modality-Specific Challenges and Siemens Solutions Ionizing radiation is used in imaging in a wide range of clinical fields, such as surgery, mammography, radiography, fluoroscopy, and urology. In this section, you will find an overview of challenges and solutions with regards to dose reduction in these fields. 6.1 Dose Reduction Advances in Mammography Breast cancer is the most common cancer in women worldwide. More than 10% can expect some manifestation of the disease during their lifetime. Although earlier detection and better treatment may have reduced mortality in recent years, 30% of women with breast cancer will still die from the disease. But several randomized controlled clinical trials have proven that mammography screening can reduce breast cancer mortality. X-ray mammography is the gold standard of investigational procedures. Digital mammography has improved diagnostics, especially in younger women and in women with dense breasts. In most countries, screening programs have been established in order to support early breast cancer detection. The right balance between low dose and high image quality for diagnostic confidence is of the utmost importance. 130 X-Ray Products Full-Field Digital Mammography Numerous clinical studies57 have shown that full-field digital mammography (FFDM) may provide some diagnostic advantages over screen/film mammography for certain population subgroups, such as young women with dense breasts and pre- and perimenopausal women. During a screening, presumed healthy women are examined for breast cancer. In these cases, low dose becomes particularly significant, as mentioned before. With courtesy of MVZ Prof. Dr. Uhlenbrock & Partners, Dortmund, Germany. Up until now, lower dose meant lower image quality. The continuous low-dose discussion challenged us to rethink technology and do what seemed impossible: develop a mammography machine with considerable dose reduction without compromising on image quality. This is possible with the MAMMOMAT Inspiration PRIME-Technology58. 57 Pisano E. et al. Diagnostic Performance of Digital versus Film Mammography for Breast-Cancer Screening. N Engl J Med 2005;353. 58 MAMMOMAT Inspiration PRIME Edition is not commercially available in all countries. Due regulatory reasons its future availability cannot be guaranteed. Please contact your local Siemens organization for further information. PRIME is an Option and is for a maximum breast thickness of 7 cm under compression. 131 X-Ray Products Fig. 83 Standard mammography screening with MAMMOMAT Inspiration. X-Ray Products Dose Reduction Advances with MAMMOMAT Inspiration in Full Field Digital Mammography 2 4 1 3 5 6 7 8 1. PRIME-Technology59 Progressive Reconstruction, Intelligently Minimizing Exposure The world’s first software based anti-scatter solution for mammography. It saves a considerable amount of dose with uncompromised image quality. 2. Tungsten/rhodium anode/filter combination Siemens is a pioneer in offering digital mammography with a bimetal X-ray tube with tungsten (W) in addition to the conventional molybdenum (Mo) target. To match the individual breast density and thickness, three anode/filter combinations (Mo/Mo, Mo/Rh, and W/Rh) are offered. Compared to film based systems, it can save up to 50% dose by using Tungsten/Rhodium combination. And, it is especially good at capturing dense breast tissue. 3. irect-to-digital amorphous selenium detector: D MAMMOMAT Inspiration provides an amorphous selenium (aSe) detector – directly converting X-ray energy into an electric charge. Compared to indirect technologies, the absorption rate of aSe is higher in the lowenergy range of mammography. And at the same time the detective quantum efficiency (DQE) is higher, which results in high image quality at a low dose. PRIME 59 132 MAMMOMAT Inspiration PRIME Edition is not commercially available in all countries. Due regulatory reasons its future availability cannot be guaranteed. Please contact your local Siemens organization for further information. PRIME is an Option and is for a maximum breast thickness of 7 cm under compression. X-Ray Products OpComp Siemens’ intelligent OpComp® function applies compression only as long as the patient’s breast is soft and pliable. For best image quality, it stops at the point of optimal compression. It works in combination with OpDose. 5. OpDose OpDose automatically selects the best anode/filter combination and selects in connection to the automatic exposure control the optimal imaging parameters. Settings can be made for every different thickness interval of 10 mm which gives a “personalized” optimal dose for each individual breast characteristic. 6. Automatic exposure control (AEC) The adaptive AEC modus reads out the complete area of the detector that is covered by the breast. The system searches the densest part of the breast tissue and selects the lowest possible exposure parameters based on the individual breast size and composition. 7. OpView60 This image processing software is especially designed for digital mammography to produce superior image quality. The algorithms provide significantly more details with higher image contrast, particularly of dense breasts. The settings can be customized for viewing preferences, providing versatility. In sum, better image quality and easier image reading can help to avoid the need for repeated images. utomated quality control60 (AQC) and Siemens Remote Service60 A (SRS) It helps to ensure the quality and security of MAMMOMAT Inspiration, since quality assurance tests including dose settings need to be performed regularly. AQC can perform these tests easily and intuitively. Thanks to Siemens Remote Service’s constant monitoring, deviating parameters are detected before problems occur. 8. 60 1 2 3 4 Report X-Ray Products 4. Option. 133 X-Ray Products It is well known that digital radiation detectors that are part of an FFDM system may have different absorption characteristics than a screen-film receptor in an analog mammography system. Therefore, the question arises whether the X-ray spectrum and the beam quality applied in screen-film mammography are also suitable for FFDM systems. In digital mammography, the radiographic technique can be optimized independently of the exposure to the image receptor, thus exploiting the wide dynamic range and the linear characteristic curve of digital detectors. Image quality and patient dose can be optimized at the same time. Anode/Filter Combinations Study Sometimes molybdenum/molybdenum (Mo/Mo) for the examination of smaller breasts and rhodium (Rh) as the filter material for thicker breasts is recommended. Other users switch from molybdenum to rhodium or tungsten (W) as the anode material for thicker breasts, or recommend the general use of rhodium or tungsten as the anode material, in combination with rhodium as the filter material for all breast thicknesses and tissue composition. A specific dose-related study was conducted to compare the average glandular dose (AGD) of Mo/Mo, Mo/Rh, and W/Rh in full-field digital mammography based on an amorphous selenium detector with clinical data.61 The main purpose of the study was to determine whether W/Rh can be used to reduce the glandular dose without loss of image quality in all breast thicknesses of the examined population. The average glandular dose corresponding to the images acquired with Mo/Mo was 2.29 ± 1.15 mGy with a mean compressed breast thickness of 46 ± 10 mm. For the Mo/Rh cases with a mean compressed thickness of 64 ± 9 mm, an AGD of 2.76 ± 1.31 mGy was obtained. The W/Rh cases with a mean compressed thickness of 52 ± 13 mm resulted in an AGD of 1.26 ± 0.44 mGy. The image quality of all mammograms in the study was evaluated visually by the readers in order to be adequate for the diagnostic task. In a few example cases that were imaged with both X-ray spectra, no degradation of the evaluated lesion’s signal-to-noise ratio was found. One such image example is shown in Figure 85. This MLO image of a 67-year-old patient with a compressed breast thickness of 72 mm had been acquired with an average glandular dose of 3.8 mGy for Mo/Mo and 2.4 mGy for W/Rh. Analysis of 4,867 images revealed that the anode/ filter combination W/Rh has advantages over Mo/Mo or Mo/Rh in terms of glandular dose, especially in patients with large breasts. Whereas the dose reduction with W/Rh is relatively small for small breasts, the effect becomes larger for increasing breast thickness, particularly 61 134 Uhlenbrock DF et al. Comparison of anode/filter combinations in digital mammography with respect to the average glandular dose. Rofo. 2009 Mar;181(3):249-54. X-Ray Products above a compression thickness of 50 mm. For the largest compression thickness, W/Rh reduces the patient dose by more than a factor of two compared to Mo/Rh. 8 Mo/Mo 7 Mo/Rh W/Rh AGD/mGy 6 5 4 3 2 1 0 20 30 40 50 60 70 80 90 Thickness/mm Fig. 84 Scatter plot of the average glandular dose (AGD) values of all 4,867 exposures as a function of the thickness. B X-Ray Products A Fig. 85 Mammograms (MLO view) of the same breast (compressed breast thickness: 72 mm) acquired with A: W/Rh, AGD: 2.4 mGy, and B: Mo/Mo, AGD: 3.8 mGy. 135 X-Ray Products A White Paper Gives the Proof The composition of low-dose efforts make MAMMOMAT Inspiration a low-dose system, and it is even the lowest of comparable systems with advanced FFDM detector technology in its class62. White Paper: Hilde Bosmans, Koen Michielsen, Kim Lemmens, Jurgen Jacobs, 2011. “Mean glandular dose survey of 2D mammograms acquired with the Siemens MAMMOMAT Inspiration system.” In a very comprehensive study (January 2009–August 2010) on 10,502 mammograms, Hilde Bosman et al. (Leuven, Belgium) evaluated the mean glandular doses from mammographic examinations performed with ten MAMMOMAT Inspiration digital mammography systems. Dose data from the Siemens systems were compared to data from nine other DR systems of other vendors and to the Diagnostic Reference Level (DRL) derived from Leuven’s regional survey results. The Siemens systems are adjusted to operate at patient dose levels significantly below the achievable levels of the European Guidelines. For breasts 5 cm thick, the doses range between 35–50% of the desirable level. Its mean glandular dose is significantly lower than film-screen data. MAMMOMAT Inspiration operates with the second-lowest dose data curve of all DR systems, but the lowest in its class of FFDM detector technology. 62 136 White Paper: Hilde Bosmans, Koen Michielsen, Kim Lemmens, Jurgen Jacobs, 2011. “Mean glandular dose survey of 2D mammograms acquired with the Siemens MAMMOMAT Inspiration system.” X-Ray Products MGD as a function of compressed breast thickness for different DR systems 7 Acceptable dose MGD (mGy) 6 Achievable dose 5 Leuven-DRL (2007) 4 Siemens 3 DR1 DR2 2 DR3 1 0 DR4 0 10 20 30 40 50 60 70 80 90 100 Compressed breast thickness (mm) X-Ray Products Fig. 86 Thickness averaged mean glandular doses as a function of compressed breast thickness for pooled data of the Siemens MAMMOMAT Inspiration systems and four other DR system types. Comparison to the achievable and acceptable levels of the European Guidelines and our local Diagnostic Reference Level (DRL) derived from dose data with film-screen systems. Note: The above results do not allow a comparative evaluation of the intrinsic performance of the systems, as image quality factors or detector characteristics are not compared. Rather, it shows how the dose levels of these different DR modalities are preprogrammed on the modalities. 137 X-Ray Products MAMMOMAT Inspiration now with PRIME-Technology63 What is behind this Progressive Reconstruction, Intelligently Minimizing Exposure? This software based anti-scatter solution for mammography saves a considerable amount of dose with uncompromised image quality. Scattered radiation decreases image contrast in mammography, so anti-scatter grids are used in analog film/screen as well as full-field digital mammography (FFDM) to attenuate the scattered radiation and improve image contrast. However, anti-scatter grids also attenuate valuable primary radiation. By removing the mechanical grid, there is no longer a fixed object between the patient and the detector that absorbs radiation. Thereby more primary radiation can be used and dose can be saved. In order to ensure the same image quality the anti-scatter correction can be performed software-based. FFDM with PRIME-Technology63, a specially developed software algorithm, the Progressive Reconstruction, replicates the effects of the missing grid. This has the effect that image quality is not compromised while necessary patient dose is clearly reduced. 63 138 PRIME-Technology is not commercially available in all countries. Due to regulatory reasons its future availability cannot be guaranteed. Please contact your local Siemens organization for further details. X-Ray Products Without PRIME63 (86 mAs) With PRIME63 (63 mAs) –26% X-Ray Products Fig. 87 The dose reduction depends on the compressed breast thickness. For compressed breast thickness of 37 mm, the X-ray dose can in this case be reduced by 26%. 139 X-Ray Products 6.2 Dose Reduction Advances in Surgery In today’s clinical environment, surgery would be unimaginable without X-ray. Surgical C-arms help to give insight into the human body before, during, and after any surgical intervention. For example, a surgeon is able to check screw placement in a complicated fracture using 2D and even 3D images during the intervention. This helps to increase safety and accuracy of the intervention and also prevents additional postoperative X-ray follow-up; thus avoiding unnecessary radiation for patients and clinical staff in the OR. Nonetheless, every radiographic exam, however necessary it might be, means exposure to X-ray for the patient as well as for the staff. This is why Siemens strives to combine the best possible image quality with the lowest possible dose for all C-arm systems. Direct and Indirect Dose Savings Dose-saving techniques can be embedded within the system itself and also enabled through easier workflows or new technologies that help to reduce dose emission throughout the entire procedure. With ARCADIS Orbic 3D, Siemens introduced the first truly isocentric C-arm with the capability to provide intraoperative 3D images. ARCADIS Orbic 3D incorporates all available dose-saving features. Its true isocentricity provides the advantage of always maintaining the central beam in the isocenter, nearly eliminating the need for repositioning. Beyond the time savings, this imparts considerable savings in dose. In addition, every ARCADIS system comes equipped with EASY (Enhanced Acquisition System), a bundle of automatic image processing features that allow ARCADIS systems to automatically analyze the images during acquisition and optimize brightness, contrast, and dose. 140 X-Ray Products Furthermore, ARCADIS Orbic 3D features NaviLink 3D, an integrated navigation interface with automatic image transfer. The open interface allows computer-assisted surgery systems to be connected to our C-arms, permitting radiation-free navigated interventions. Thus, the surgeon is able to reduce indirectly the radiation measured for the entire intervention. Dedicated CARE features have also been allocated to our other surgical C-arms. These include, for example: 1. 2. 3. 4. 5. 6. 7. Freely positionable collimators for pinpoint X-ray images Laser light localizers for positioning without dose application 3D features to minimize postoperative imaging Interface for remote surgical navigation systems Pulsed fluoroscopy for minimal dose application Detachable grid for further dose reduction Additional copper filters X-Ray Products In addition to these individual features, Siemens provides comprehensive dose monitoring and reporting for every intervention. Elements such as visualizing the air kerma rate on the display and providing a defined threshold with warning messages when a certain limit of dose application is reached, assist physicians and staff in limiting X-ray exposure. 141 X-Ray Products 6.3 Dose Reduction Advances in Radiography MAXalign64 – Get it Right with the First Shot. This innovative feature displays the angle of the detector in the MAXtouch screen of the ceiling mounted tube. This allows the tube angle to be perfectly aligned to the detector, taking the guess work out of angle setting in free exams and reducing dose by avoiding repeat exposures. With MAXalign64, you get it right with the first shot. It is available on the Ysio Max64, digital radiography system and on the Luminos Agile Max and the Luminos dRF Max when equipped with Ysio Max option64. MAXalign64 • Works for you by making positioning for free examinations easier and more accurate with MAX wi-D65 and MAX mini detectors65. • Supports you by displaying the correct detector angle on the MAXtouch screen. Eliminates guessing and enhances quality and consistency. • Protects you and your patients by avoiding repeat exposures for incorrect angles and grid cut-off. Fig. 88 MAXalign64 allows the tube angle to be perfectly aligned to the detector, taking the guess work out of angle setting in free exams and reducing dose by avoiding repeat exposures. 142 64 MAXalign is 510(k) pending. 65 MAX wi-D and MAX mini detectors are currently pending 510(k) clearance and are not yet commercially available in the United States. X-Ray Products 6.4 Dose Reduction Advances in Fluoroscopy In radiography and fluoroscopy the comprehensive CARE dose reduction program with the ability to combine several applications enables reduction in dose without compromising image quality. Further intelligent dose reduction with: • High efficiency digital flat detectors • Easy grid removal for pediatric and extremities examinations • Low absorption tabletop material and grids • Short table top to detector and wall stand front to detector distances • Wall stand top alignment for more efficient chest exam collimation • Organ programs with pre-set collimation size and Cu filters for skin dose reduction • Clinical Assurance Program (CAP) with reject analysis assists in determining the causes of repeat examinations • Exposure Index (EXI) and Deviation Index (DI) enables monitoring for under- or overexposure of digital X-ray images • DICOM Dose Reporting enables and dose documentation to be sent to PACs as a DICOM object Fig. 89 Collimation and Cu filters can be pre-set in the organ program. Fig. 90 Easy grid removal for pediatric and extremities examinations. Fig. 91 Patient-side controlled systems offer staff additional radiation protection when it is necessary to remain in the room. Fig. 92 Remote controlled systems reduce staff dose, as it is not necessary to remain in the room. 143 X-Ray Products As fluoroscopy examinations often require direct interaction with the patient during the examination, dose reduction measures are important for both patients and medical personnel. This can also influence the choice between a remote controlled or a patient-side controlled system. X-Ray Products 6.5 Dose Reduction Advances in Urology The comprehensive CARE dose reduction program with the ability to combine several applications enables reduction in dose without compromising image quality. Lithotripsy Accurate localization and monitoring of the stone during ESWL (extracorporeal shock wave lithotripsy) procedures is key. This can be performed by low-dose fluoroscopy or completely radiation-free, with ultrasound. With both methods available on Siemens systems, the choice can be made based on the clinical situation and the right dose. Endourology and Urodiagnostics The flat-detector-based urology system UROSKOP Omnia offers excellent dose-saving features. In the past, using an image intensifier technique, the urologist had to acquire two and more images in order to cover the entire urinary tract (KUB = kidneys, ureters, bladder). Now, thanks to the 43 cm x 43 cm dynamic flat detector and the large field of view, only one exposure is needed to receive a full KUB image. Compared to conventional cassette exposure technique the dose required can be significantly reduced with flat panel technology without compromising image quality. For the many daily standard cases such as documentation of a DJ stent, even more dose can be saved by using DFR exposures. Please find more on the next page. Fig. 93 UROSKOP Omnia. 144 X-Ray Products Patient Skin Dose Measurement at UROSKOP Omnia Simulation of patient thickness with polymethyl methacrylate (PMMA) Collimator format 30 cm x 30 cm FFD 115 cm; FTD 108 cm Dose measurement with Unfors XI (patient skin dose) Grid Det. dose (µGy) 2.5 2.5 Prefilteration (mm Cu) 2.5 mmAl +0.1 Cu N15 r80 f115 N15 r80 f115 2.5 1.25 0.1 0.3 N15 r80 f115 N15 r80 f115 Standard-DR 67 MCU-DR 1.39 x 0.37 1.39 x 0.37 0.1 0.3 N15 r80 f115 N15 r80 f115 Pediatrics-DR Pediatrics-DR (without grid) 0.87 x 0.37 0.87 x 0.37 0.2 0.2 N15 r80 f115 no grid 68 Program 5 cm PMMA µGy kV 28.78 66.00 22.32 66.00 Program Standard cassette exposure (400 system) 66 Organ program UROSKOP Omnia Standard-RAD MCU-RAD Standard cassette exposure (400 system) 66 Organ program UROSKOP Omnia Standard-RAD MCU-RAD 10 cm PMMA µGy kV 128.80 66.00 89.31 66.00 µGy 1817.00 1124.00 Dose Exposure: As Low as Reasonable Achievable 100 % 37,58 % 8,1 % 0,64 % 20 cm PMMA kV mAs µGym² 66.00 35.10 97.47 66.00 48.00 67.20 ”Relative dose in %” 100.00 61.86 18.19 77.00 6.10 81.00 64.02 21.48 77.00 81.00 682.90 206.30 77.00 81.00 19.50 10.90 39.68 11.91 37.58 11.35 Standard-DR 67 MCU-DR 5.68 68.00 3.68 73.00 25.01 11.20 71.00 75.00 147.10 91.31 79.00 81.00 4.10 4.90 8.58 5.33 8.10 5.03 Pediatrics-DR Pediatrics-DR (without grid) 3.56 70.00 1.56 70.00 11.06 2.75 73.00 73.00 81.33 11.66 79.00 79.00 3.40 0.60 4.76 0.76 4.48 0.64 66 Standard cassette exposure parameters: kidney/gallbladder a.p.; 19 cm 66 kV 50 mAs (see: Hoxter E. Röntgenaufnahmetechnik. Publicis Corporate Publishing, Erlangen, 1991). Simulation of cassette exposure with RAD-Mode. 67 DR-Mode: exposure parameters will automatically be calculated from fluoro parameters (1-point technique). For the actual detector dose, the indicated dose has to be multiplied with zoom factor 0.37. 68 At 20 cm PMMA image quality is not good enough for certain applications; we would recommend using a grid for such object thickness. X-Ray Products • • • • 145 X-Ray Products 6.6 CARE The CARE program combines a variety of cutting-edge applications that reduce radiation dose to patients and staff. As a result, image quality is maintained while reducing dose. CAREFILTER Automated copper filter selection that reduces the body entrance dose. CAREMATIC Automatic calculation and optimization of exposure parameters. CAREMAX Dose area measurement and monitoring. CAREVISION Pulse frequencies of 15, 7.5, and 3 pulses per second for low-dose imaging in real-time. FluoroLoop69 A background memory buffer for retrospective viewing and storage of fluoroscopic sequences, reducing the need for re-exposure. CAREPROFILE69 Radiation-free collimation is achieved using the last-image-hold for orientation. CAREPOSITION69 Radiation-free patient repositioning by using a virtual field display on the last-image-hold. Removable grid Reduces dose in extremity examinations in pediatric patients. 69 146 Option. X-Ray Products X-Ray Products Fig. 94 Radiation-free collimation with CAREPROFILE69 • Begins with the last-image-hold (LIH) • A graphic on the LIH displays changes in collimation without radiation • The defined collimated field is then visible with the next fluoroscopy activation Fig. 95 Radiation-free patient repositioning with CAREPOSITION69 • Begins with the last-image-hold (LIH) • A graphic on the LIH displays changes in the patient position without radiation • The defined patient position is then visible with the next fluoroscopy activation 147 Further Information 7. Further Information Medical Radiation Dose Management Leadership Right Dose Information Center 7.1 A Final Word We want to thank you very much for reading and familiarizing yourself with Siemens efforts and progress in dose management and dose reduction. Should you have any questions or need support or information of any kind, rest assured that the entire Siemens organization stands ready to serve you. For further information, please see the following websites: Siemens Right Dose Information Center Find training materials and education across all modalities and clinical specialties. www.siemens.com/right-dose Innovation Leadership in Dose Management Find out more about the Siemens approach in lowering dose, called Right Dose. www.siemens.com/dose-reduction-leadership Understanding Medical Radiation A knowledge resource for patients and caregivers. www.medicalradiation.com 148 Further Information 7.2 Glossary Absorbed dose Activity Acute radiation syndrome (ARS) Adaptive Cardio Sequence Adaptive Dose Shield Adaptive ECG-Pulsing Alpha (α) particles Angiography Anode Apoptosis Attenuation the amount of energy deposited in matter after being exposed to a certain amount of radiation amount of a radioactive isotope measured by number of decays per time death of a large number of cells in the organs impairing their function after exposure to radiation Modus in which the CT scanner registers in real time the ECG, analyzes whether the heartbeats are normal, and triggers the scan during a predefined phase of the ECG pre-patient collimator in which both collimator blades move asynchronously, thus reducing the radiation dose at the beginning and end of the scan range CT scan modus in which the current intensity is modulated such that the radiation is maximal during the prescribed phase of the ECG and the radiation is reduced to a minimum during the rest of the ECG fast-moving helium-4 (4He) nuclei radiographic visualization of the blood vessels after injection of a radio opaque substance (contrast agent); in CT, iodine is frequently used as a contrast agent the electron-collecting electrode of the X-ray tube a genetically determined process of cell self-destruction that is marked by the fragmentation of nuclear DNA; apoptosis can be activated by radiation reduction of the amount, force, or value of a parameter; in this context, reduction of the intensity of the radiation beam 149 Further Information A Further Information B Beam hardening Bone marrow C CARE CARE Dose4D Cathode Collimator Computed Tomography Dose Index (CTDI) – CTDIw CT slice CTDIvol D Detector Deterministic damage Dose length product (DLP) 150 increasing the energy level of the beam by filtering out low-energy photons soft highly vascular modified connective tissue that occupies the cavities of most bones and occurs in two forms: a yellowish bone marrow consisting chiefly of fat cells and predominating in the cavities of the long bones (also called yellow marrow) and a reddish bone marrow containing little fat, being the chief site of red blood cell and blood granulocyte formation, and occurring in the normal adult only in cancellous tissue, especially in certain flat bones (also called red marrow) Combined Applications to Reduce Exposure a system that not only modulates radiation intensity according to the size of the patient, but also to the anatomic region that is being irradiated as the CT scan progresses the electron-emitting electrode of the X-ray tube a thick lead sheet with thousands of small holes that allows passage of only those gamma rays that travel at right angles to the plane of the crystal the sum of the absorbed dose in the slice and outside the slice (due to scattering outside the slice) each transversal image generated by a CT scan CTDIw divided by the pitch a device for detecting the presence of electromagnetic waves or of radioactivity damage of organic tissue that is certain to occur as a result of exposure to a high amount of ionizing radiation the product of CTDIvol and the length of the examination range Further Information Ectopic beat Effective dose E Electromagnetic radiation Electron Equivalent dose Examination range F Flash Spiral Fluorescence Free radicals a heartbeat that is spurious and is not synchronized with normal heartbeats reflects the sensitivity of each organ and is a weighted average of the equivalent dose received by the organs radiation that has the properties of particles and waves (photons) an elementary particle that consists of a negative charge and spins around the atomic nucleus for any type of radiation defined as the absorbed dose multiplied by a factor (wf) that weights the radiationspecific damage caused to biological tissue; in the case of X-rays used in CTs the weighting factor is 1, therefore the equivalent dose is the same as the absorbed dose part of the body to be scanned along the longitudinal axis (z-axis) a new ECG-triggered technique that is based on a dual source spiral scan at very high pitch; enables scanning the heart in only one heartbeat luminescence that is caused by the absorption of radiation at one wavelength followed by nearly immediate re-radiation usually at a different wavelength and that ceases almost at once when the incident radiation stops atoms, molecules, or ions with unpaired electrons; these unpaired electrons are usually highly reactive, so radicals are likely to take part in chemical reactions that eventually change or harm the DNA of the cells 151 Further Information E Further Information G Gamma rays (γ-rays) H Half-life I Ionization Ionizing radiation IRP Irradiation K Kerma Kinetic energy M Modulation 152 radiation consisting of photons with a wavelength of less than 1 pm time span until only half of the initial isotope is left due to radioactive decay (physical half-life), excretion (biological half-life), or a combination of decay and excretion (effective half-life) the process by which atoms are converted into ions (electrically charged atoms) radiation that can ionize matter interventional reference point radiation emitted with a specific purpose, in this case for medical reasons kinetic energy released in matter; the energy released per unit mass of a small volume when it is irradiated by ionizing radiation. Measured in grays (Gy) energy stored in a moving object adjustment of a parameter to keep it in the desired range Further Information Neutron Noise P PET Photon Pitch Plexiglas phantoms Positron R Radiation Radioactive substances Radioactivity Radionecrosis Radon Resolution uncharged elementary particle that has a mass nearly equal to that of the proton and is present in all known atomic nuclei except the hydrogen nucleus in the context of imaging, the grainy structure of an image Positron Emission Tomography a quantum of electromagnetic radiation table feed during one revolution of the X-ray tube divided by the nominal scan width in mm dummies made of Plexiglas used to measure the radiation doses on different parts of the body a positively charged particle with the same mass as an electron the process of emitting radiant energy in the form of waves or particles substances that emit radiation of different types the property possessed by some elements (e.g. uranium) or isotopes (e.g. carbon-14) of spontaneously emitting energetic particles (such as electrons or alpha particles) by the disintegration of their atomic nuclei destruction of organic tissue by radiation a heavy radioactive gaseous element formed by the decay of radium a measure of the sharpness of an image or of the fineness with which a device (such as a video display, printer, or scanner) can produce or record such an image 153 Further Information N Further Information S Sharpness SPECT Spiral CT Stochastic damage T Topogram Tube current Tube voltage X X-CARE X-rays 154 clearness in outline or detail of an image, ability to resolve small details Single Photon Emission Computed Tomography CT scan during which the table and the X-ray tube move continuously damage that may potentially happen; involves chance or probability contour of the human body current applied to the cathode of the X-ray tube voltage between the anode and the cathode of the tube organ-based dose modulation; in this modus the radiation intensity is reduced when the patient is irradiated from the front electromagnetic radiation that has an extremely short wavelength of less than 100 angstroms and has the property of penetrating all solids to varying degrees On account of certain regional limitations of sales rights and service availability, we cannot guarantee that all products included in this brochure are available through the Siemens sales organization worldwide. Availability and packaging may vary by country and is subject to change without prior notice. Some of the features and products described herein may not be available in the United States. The information in this document contains general technical descriptions of specifications and options as well as Global Siemens Headquarters Siemens AG Wittelsbacherplatz 2 80333 Muenchen Germany standard and optional features which do not always have to be present in individual cases. Siemens reserves the right to modify the design, packaging, specifications and options described herein without prior notice. Please contact your local Siemens sales representative for the most current information. Note: Any technical data contained in this document may vary within defined tolerances. Original images always lose a certain amount of detail when reproduced. Global Siemens Healthcare Headquarters Siemens AG Healthcare Sector Henkestr. 127 91052 Erlangen Germany Phone: +49 9131 84-0 www.siemens.com/healthcare Order No. A91IM-0001-1C3-7600 | Printed in Germany | CC 1113.1 | © 11.2013, Siemens AG www.siemens.com/healthcare Legal Manufacturer Siemens AG Wittelsbacherplatz 2 80333 Muenchen Germany

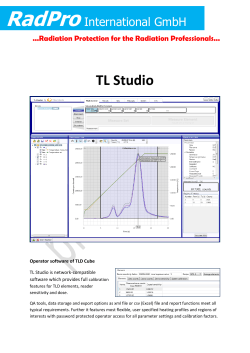


© Copyright 2026