
Synthesis of Knowledge of Extreme Fire Behavior: Volume I for Fire
United States
Department of
Agriculture
Forest Service
Pacific Northwest
Research Station
General Technical
Report
PNW-GTR-854
November 2011
Synthesis of Knowledge of
Extreme Fire Behavior:
Volume I for Fire Managers
Paul A. Werth, Brian E. Potter, Craig B. Clements, Mark A. Finney,
Scott L. Goodrick, Martin E. Alexander, Miguel G. Cruz, Jason A.
Forthofer, and Sara S. McAllister
A SUMMARY OF
KNOWLEDGE FROM THE
The Forest Service of the U.S. Department of Agriculture is dedicated to the principle of
multiple use management of the Nation’s forest resources for sustained yields of wood,
water, forage, wildlife, and recreation. Through forestry research, cooperation with the
States and private forest owners, and management of the national forests and national
grasslands, it strives—as directed by Congress—to provide increasingly greater service
to a growing Nation.
The U.S. Department of Agriculture (USDA) prohibits discrimination in all its programs and
activities on the basis of race, color, national origin, age, disability, and where applicable, sex,
marital status, familial status, parental status, religion, sexual orientation, genetic information,
political beliefs, reprisal, or because all or part of an individual’s income is derived from any
public assistance program. (Not all prohibited bases apply to all programs.) Persons with
disabilities who require alternative means for communication of program information (Braille,
large print, audiotape, etc.) should contact USDA’s TARGET Center at (202) 720-2600 (voice
and TDD). To file a complaint of discrimination, write USDA, Director, Office of Civil Rights,
Room 1400 Independence Avenue, SW, Washington, DC 20250-9410 or call (800) 795-3272
(voice) or (202) 720-6382 (TDD). USDA is an equal opportunity provider and employer.
Authors
Paul A. Werth is a fire weather meteorologist (retired), Northwest Interagency
Coordination Center, 150 SW Harrison Street, Suite 400, Portland, OR 97201. Brian E.
Potter is a research meteorologist, U.S. Department of Agriculture, Forest Service, Pacific
Wildland Fire Sciences Laboratory, 400 N 34th St., Suite 201, Seattle, WA 98103. Craig
B. Clements is an assistant professor of meteorology, San Jose State University, San José,
CA 95192. Mark A. Finney is a research forester, Jason A. Forthofer is a mechanical
engineer, and Sara S. McAllister is a research mechanical engineer, U.S. Department of
Agriculture, Forest Service, Missoula Fire Sciences Laboratory, 5775 Highway 10 West,
Missoula, MT 59808. Scott L. Goodrick is a research meteorologist, U.S. Department
of Agriculture, Forest Service, Southern Research Station, 320 Green Street, Athens,
GA 30602. Martin E. Alexander is an adjunct professor of wildland fire science and
management, Department of Renewable Resources and Alberta School of Forest Science
and Management, University of Alberta, Edmonton, AB T6G 2H1, Canada. Miguel
G. Cruz is a senior research scientist, Bush Fire Dynamics and Applications, CSIRO
Ecosystems Sciences–Climate Adaptation Flagship, GPO Box 284, Canberra, ACT 2601,
Australia.
Cover Photos
Cover photos by Rick Trembath, USDA Forest Service (retired).
Synthesis of Knowledge
of Extreme Fire Behavior:
Volume I for Fire
Managers
Paul A. Werth, Brian E. Potter,
Craig B. Clements, Mark A. Finney,
Scott L. Goodrick, Martin E. Alexander,
Miguel G. Cruz, Jason A. Forthofer,
and Sara S. McAllister
U.S. Department of Agriculture, Forest Service
Pacific Northwest Research Station
Portland, Oregon
General Technical Report, PNW-GTR-854
November 2011
Published in cooperation with:
U.S. Department of Agriculture, Forest Service
Southern Research Station
GENERAL TECHNICAL REPORT PNW-GTR-841
This page was intentionally left blank.
ii
Abstract
Werth, Paul A.; Potter, Brian E.; Clements, Craig B.; Finney, Mark A.; Goodrick,
Scott L.; Alexander, Martin E.; Cruz, Miguel G.; Forthofer, Jason A.; McAllister, Sara S. 2011. Synthesis of knowledge of extreme fire behavior: volume I for fire managers. Gen. Tech. Rep. PNW-GTR-854. Portland, OR: U.S. Department of
Agriculture, Forest Service, Pacific Northwest Research Station. 144 p.
The National Wildfire Coordinating Group definition of extreme fire behavior (EFB) indicates
a level of fire behavior characteristics that ordinarily precludes methods of direct control
action. One or more of the following is usually involved: high rate of spread, prolific crowning/spotting, presence of fire whirls, and strong convection column. Predictability is difficult
because such fires often exercise some degree of influence on their environment and behave
erratically, sometimes dangerously. Alternate terms include “blow up” and “fire storm.”
Fire managers examining fires over the last 100 years have come to understand many
of the factors necessary for EFB development. This work produced guidelines included in
current firefighter training, which presents the current methods of predicting EFB by using
the crown fire model, which is based on the environmental influences of weather, fuels, and
topography.
Current training does not include the full extent of scientific understanding. Material
in current training programs is also not the most recent scientific knowledge. National Fire
Plan funds have sponsored newer research related to wind profiles’ influence on fire behavior,
plume growth, crown fires, fire dynamics in live fuels, and conditions associated with vortex
development. Of significant concern is that characteristic features of EFB depend on conditions undetectable on the ground, relying fundamentally on invisible properties such as wind
shear or atmospheric stability.
Obviously no one completely understands all the factors contributing to EFB because of
gaps in our knowledge. These gaps, as well as the limitations as to when various models or
indices apply should be noted to avoid application where they are not appropriate or warranted. This synthesis will serve as a summary of existing extreme fire behavior knowledge
for use by fire managers, firefighters, and fire researchers.
The objective of this project is to synthesize existing EFB knowledge in a way that
connects the weather, fuel, and topographic factors that contribute to development of EFB.
This synthesis will focus on the state of the science, but will also consider how that science is
currently presented to the fire management community, including incident commanders, fire
behavior analysts, incident meteorologists, National Weather Service office forecasters, and
firefighters. It will seek to clearly delineate the known, the unknown, and areas of research
with the greatest potential impact on firefighter protection.
Keywords: Extreme fire behavior, fuels, fire behavior.
Preface
In 2008, the National Wildfire Coordinating Group (NWCG) Fire Behavior Committee
(FBC) asked the Joint Fire Science Program (JFSP) to fund a synthesis and review of the
scientific literature pertaining to extreme fire behavior (EFB). In September 2008, the JFSP
announced a call for proposals that included a request for “an examination of the state of
the science underlying predictions of extreme fire behavior, and an assessment of the appropriate uses and limits of this information.” This document is the result of that request.
In performing the review, it became progressively clearer that the concept of extreme
fire behavior (EFB) is vaguely defined and means something different to everyone. The
authors examined the official NWCG definition and solicited input from the management
community to develop a definition that was both operationally useful and scientifically
tractable. This definition and the initial stages of the review eventually led to the recognition that some relevant topics had not been included in the original outline. Other topics
from the original outline were expanded to include sections of their own.
The authors communicated these changes to both the JFSP and the FBC as they arose.
In those conversations, it became apparent that these two groups had different needs. The
JFSP needed something for fire managers and others without the technical background of
a fire behavior analyst. The FBC needed a document for fire behavior analysts that would
allow them to better understand the use and limitations of the tools they now have and
may have in the near future. To meet these two needs, this review has two parts. Volume
1 summarizes the state of the science for fire managers and firefighters with pertinent
references to scientific papers. It is intended to be of use to anyone who works at or near the
fireline. Volume 2 covers the same topics (with one exception) in more detail and includes
information necessary for fire behavior analysts to understand what is scientifically known,
what science lies behind the tools they have, and what the limitations are on scientific
knowledge and tools. It includes more references to scientific literature. The one difference
in topical content between the volumes is that volume 2 includes a chapter on fuel dynamics
and volume 1 does not. As the study progressed, the scope of this topic led to the need to
include more experts, and the short time available precluded that section from publication
in volume 1.
iv
Summary
A working definition of extreme fire behavior (EFB) was necessary for development of this
synthesis. Because the subjective nature of four of the five properties of the EFB definition
established by the National Wildfire Coordination Group makes the definition intractable
for scientific purposes, the lead authors asked the fire behavior community for input on
possible definitions of EFB and examples of phenomena they considered EFB. The only
coherent theme was that EFB is not steady state. After discussing responses, the authors
agreed on the following working definition for this project:
Fire spread other than steady surface spread, especially when it involves rapid
increases.
This definition of EFB does not emphasize any one element of the behavior triangle.
Complexity
It is imperative that fire managers understand that much of what is referred to as “extreme
fire behavior” is happening where it cannot be seen. Multiple factors come into play and not
all factors need be present for EFB to occur. No one factor must be present in every case.
A number of interactions among the elements are noted, but the number of possible
interactions between elements is practically unlimited, making research and the resulting
tool development a key step in achieving successful forest management and safety.
Myths and Lore
There are many myths and lore with limited scientific basis. Anecdotal evidence sometimes
takes the place of science and comes to be accepted as fact even when little scientific information exists to validate it. Extreme fire behavior can occur on any scale, great or small, in
any fuel type, and at any time of the day or night. There is no time or circumstance when
fire managers can safely assume EFB will not occur.
Over-Arching Gaps
The authors of this synthesis have identified areas in each chapter where understanding of
the science is lacking and more research is needed. These knowledge gaps may pertain to
just one chapter’s topic, but they are nonetheless important areas in which further research
would be of value to the operational community. There are, however, certain over-arching
gaps where additional research of one element will advance the science for other elements
as well.
• A greater recognition of the importance of plume dynamics to EFB and spotting.
• Advances in the understanding of fuel structure, especially as it relates to ember
production and crown fire.
• Better high-resolution observations on windflow in complex terrain to improve wind
models used in fire behavior and spotting tools, and to identify fire whirl potential. For
example, upper air soundings on project-size fires.
• The influence of ambient winds or topography on fire interactions.
v
•
More research beyond the Haines Index to quantify the effects of atmospheric stability
on fire behavior.
New and expanded research into these areas will increase the understanding of the
science on which they are based and are a necessary starting point for enhanced wildland
fire management and advances in firefighter training and safety.
Operational implications
Even the most advanced tools and models are limited by their design and assumptions.
They can never, nor should they be expected to, take the place of direct observations one
makes on the fireline, such as the “L” in LCES (Lookouts-Communications-Escape RoutesSafety Zones) and the concept of ”situational awareness.” Scientifically sound application of
tools and models requires that the tools/models be used within their design limitations and
in accordance with the tool assumptions.
Current training identifies circumstances that can result in extreme fire behavior,
where increased awareness of multiple factors can guide fire managers to make decisions.
Research can lead to development of additional or improved tools to help fire managers
better identify those situations where extreme fire behavior may occur. The lack of a tool
or model for a situation seen in the field does not mean EFB cannot occur. Knowing what
conditions can lead to EFB, and knowing that you do not know whether those conditions
exist, can be more important than any tools or models. Extreme fire behavior can occur on
any fire.
The state of the science at present can
be summed up as follows:
• Fire is three dimensional and is not
steady state.
• The tools available to us today are
two dimensional and are predominantly steady state.
• Additional research into EFB may
one day result in development of
three-dimensional tools.
vi
Contents
Chapter 1: Introduction
Brian E. Potter and Paul A. Werth
Definition
Methods
Liturature Cited
Chapter 2: Effects of Complex Terrain on Extreme Fire Behavior
Craig B. Clements
Introduction
Wind Systems in Mountainous Terrain
Dynamically Driven Winds
Thermally Driven Winds
16 Wind Modeling Tools: WindNinja
17 Summary
18 Future Needs
19 Literature Cited
25 Chapter 3: Critical Fire Weather Patterns
Paul A. Werth
1
1
2
3
5
5
5
6
10
25
25
27
29
30
31
32
34
37
39
42
43
43
43
45
45
45
45
45
46
49
49
50
50
Introduction
Weather Elements That Promote Extreme Fire Behavior
Critical Fire Weather Patterns
Regional Critical Fire Weather Patterns
Northern Plains, Great Lakes, and the Northeastern United States
Southeastern United States
Southwestern United States
Rocky Mountain and Intermountain Regions
Pacific Northwest Region
California Region
Alaska
Models and Predictive Tools
The National Wildland Significant Fire Potential Outlook
GACC 7-Day Significant Fire Potential
Fuel and Fire Behavior Advisories
Other GACC Products and Services
Fire Weather Watches and Red Flag Warnings
Spot Weather Forcasts/Digital Web Services
Summary/Knowledge Gaps
References
Chapter 4: Fire Interactions and Mass Fires
Mark A. Finney and Sara S. McAllister
Introduction
Background: Time-Dependent Fire Behaviors
Fire Acceleration
vii
GENERAL TECHNICAL REPORT PNW-GTR-854
51
52
53
53
54
54
56
58
59
61
62
63
63
64
73
73
74
74
75
76
78
78
81
81
81
83
85
86
89
89
89
90
91
91
92
93
93
93
93
Length of Fire Front
Flame Tilt
Spread Thresholds
Conditions Where Fire Interactions Occur
Specific Effects of Fire Interation
Burning Rate
Flame Dimensions
Flame Temperatures and Pollutants
Indraft Velocity
Pulsation
Convection Column
Summary of Interaction Effects
Needs for Further Research and Application
Literature Cited
Chapter 5: Column/Plume Dynamics
Brian E. Potter
Introduction
Plume-Dominated and Wind-Driven Fires
Adverse Wind Profiles and Low-Level Jets
Stability and Instability
Downbursts and Plume Collapse
Summary
Literature Cited
Chapter 6: Spot Fires
Brian E. Potter
Introduction
The Spotting Process
Management Tools
Knowledge Gaps
Literature Cited
Chapter 7: Vortices and Wildland Fire
Jason A. Forthofer and Scott L. Goodrick
Introduction
Vorticity Basics
Fire Whirls
Fire Whirl Physics
Vorticity Sources
Vortex Stretching
Increased Combustion Rates
Scaling Fire Whirls
Fire Whirls in the Real World: Common Features
Whirl Shedding on the Lee Side of a Plume
viii
94
94
94
95
95
96
96
99
100
101
102
107
107
108
111
115
115
116
117
119
121
121
122
124
125
126
129
130
134
135
143
143
144 L-Shaped Heat Source in Crossflow
Vorticity Associated With Cold Fronts
Multiple Interacting Plumes
Lee Side of a Hill/Mountain
Horizontal Vortices
Transverse Vortices Longitudinal Vortices
Tree Crown Streets
Summary
Knowledge Gaps
Literature Cited
Chapter 8: Crown Fire Dynamics in Conifer Forests
Martin E. Alexander and Miguel G. Cruz
Introduction
Types of Crown Fires
Crown Fire Initiation
Crown Fire Propagation
Crown Fire Rate of Spread
Crown Fire Intensity and Flame Zone Characteristics
Crown Fire Area and Perimeter Growth
Crown Fire Spotting Activity
Models, Systems, and Other Decision Aids for Predicting Crown Fire Behavior
Rothermel Guide to Predicting Size and Behavior of Crown Fires
U.S. Fire Modeling Systems
Canadian Forest Fire Behavior Prediction System
Other Empirically Based Approaches
Physically Based Models
Example of a Practical Application of Linking Empirical and Physically Based
Models
Implications for Fire and Fuel Management
Future Outlook
Literature Cited
Acknowledgments
Unit Conversion Factors
Common and Scientific Names
ix
GENERAL TECHNICAL REPORT PNW-GTR-841
This page was intentionally left blank.
ii
Synthesis of Knowledge of Extreme Fire Behavior: Volume I for Fire Managers
Chapter 1: Introduction
Brian E. Potter and Paul A. Werth1
compared to observations, and never contradicted is not
necessarily true, but the more it is tested, the more confidence scientists have that it may be, true. In the case of
EFB, hard, reliable data are rare, making it very difficult
to confidently refute a proposed explanation. Rather, it is
much more common to be able to cite scientific reasons for
greater or lesser confidence in the proposed explanation. In
this synthesis and review, the authors hope to present what
hard evidence there is, and when there is none, to provide
The idea of “extreme fire behavior” (EFB) is commonplace
in the U.S. wildland fire community. It goes back, arguably,
to the 1950s and the idea of a “blow-up” fire presented by
George Byram. Byram (1954) listed the terms “blow up,”
“conflagration” and “erratic” as descriptors of “unusual
high-intensity fires.” He also used the phrase “extreme
fire behavior” in both his 1954 paper and in his chapters
in Davis (1969). Larger fires may be more likely to display
these characteristics, he noted, but they can occur on a fire
of any size. Since then, the concept and terms have become
widely used.
In spite of this widespread use and implied understanding of what constitutes EFB, there is no documented,
critical examination of the types of fire behavior people
consider “extreme.” Furthermore, whereas there is little
question that the behavior labeled as EFB by observers
occurs, there are numerous explanations for that behavior
that are now conventional wisdom, yet without any scientific support—the phenomenon is rarely in question, but the
explanation may be. Actions based on incorrect explanations of EFB can result in death or injury.
The primary goal of this synthesis is to summarize
what is known scientifically about matters considered
EFB. That summary is presented to provide the most value
possible to the operational fire management community.
Research papers, although increasingly available to everyone, are not necessarily understandable by everyone. They
contain substantial jargon and math, and may only summarize their findings in terms of basic science. This synthesis
distills the scientific information and provides references
to the research papers. Note that science is a process of
proposing possible explanations, and subsequently ruling
out those explanations that contradict evidence. It is easy
to propose explanations, but proving them wrong can be
easy or difficult. An explanation that is repeatedly tested,
an understanding of the strong and weak points in a given
explanation.
Definition
A working definition was necessary to begin and execute
the synthesis. Without it, the task of gathering and summarizing would be unbounded and impossible to complete.
There is no single scientific paper that laid out a scientific
definition of EFB. The only official or specific definition of
EFB is established by the National Wildfire Coordination
Group (NWCG) glossary of wildland fire terminology
(NWCG, n.d.):
“Extreme” implies a level of fire behavior
characteristics that ordinarily precludes methods
of direct control action. One or more of the following
is usually involved: high rate of spread, prolific
crowning and/or spotting, presence of fire whirls,
strong convection column. Predictability is difficult
because such fires often exercise some degree of
influence on their environment and behave erratically,
sometimes dangerously.
Of the five properties “usually involved,” four are
subjectively described as “high,” “prolific,” or “strong.”
This makes the definition intractable for scientific purposes.
Furthermore, the definition implies a need to fail at direct
control in order to designate the fire behavior as “extreme.”
1
Brian E. Potter, U.S. Department of Agriculture, Forest Service,
Pacific Wildland Fire Sciences Laboratory, Seattle, WA.
Paul A. Werth, Weather Research and Consulting Services, LLC,
Battle Ground, WA.
1
GENERAL TECHNICAL REPORT PNW-GTR-854
This makes EFB a function of control success or failure, not
an objective, physical process.
At the initiation of this project, the lead authors asked
the fire behavior community for input on possible definitions of EFB and examples of phenomena they considered
EFB, whether those examples matched the NWCG definition or not. Several people responded—mostly with
examples—either via email or through MyFireCommunity.
net, and the authors used that feedback in their initial discussion of the working definition. The phenomena listed in
these responses included:
•
•
•
•
•
•
•
•
•
•
•
that there were too many individual phenomena considered
EFB for a definition to include any sort of list. Furthermore,
most tractable definitions included some level of subjectivity. In the end, the agreed definition for this project was:
Fire spread other than steady surface spread,
especially when it involves rapid increases.
This definition includes most or all of the phenomena listed
above, although admittedly indirectly in some cases. It
does include some subjectivity, as “rapid” can be a matter
of opinion. However, this is not the core of the definition—
it is included to emphasize the safety and operational
importance of increasing spread as opposed to decreasing
or unusually slow spread. Furthermore, whereas the NWCG
definition heavily leans toward atmospheric conditions and
may underrepresent the importance of fuels and topography,
this definition does not emphasize any one element of the
behavior triangle.
Mass ignition.
Actual plume dominance.
Rapid exponential growth of spot fires.
Spotting distances in miles.
Things that just made me go, “Huh ... didn't expect
that.”
Fire activity that has that momentum feedback
character, like Jimi Hendrix putting the guitar up to
the amp, and it just builds and builds feeding back
on itself.
When the fire and convection column induce high
levels of turbulence into the wind field; when the
momentum flow into the convection column is of
the same order of magnitude as the momentum in
the wind field.
Very rapid fire spread.
Three-dimensional fire.
Fire behavior in which large changes take place
rapidly.
Flame attachment (the laying over and direct contact
of flame with new fuels when there are steep slopes
and strong winds).
Methods
The authors divided the work of synthesis and review based
on expertise. The division is necessary to the synthesis,
but it is also artificial, and the various sections overlap
substantially. Many areas of overlap are explicitly noted,
and readers will undoubtedly see other areas.
The review incorporated three primary sources of
information. First and foremost was the peer-reviewed
scientific literature. This is the most authoritative source
of information to support or refute any explanation of what
causes EFB. Second was feedback from and interaction
with practitioners. The project Web site allowed reader
comments and discussion, and, when appropriate, these
guided the review. The third source was documents that are
not peer reviewed—often referred to as “grey literature.”
Peer review was the exception to the rule for many years in
the field of forest fire research, so there is an extensive body
of literature that was not peer reviewed. The problem with
grey literature is that it has not been tested or widely available, so the scientific rigor of its content is unknown. It can,
however, provide insight and information, and the authors
did not want to ignore it.
The responses made it quite clear that operational users
had thought about EFB well beyond any formal definition.
They also recognized the difficulty of creating a precise
definition that could be applied predictively, or a definition
more concrete than “I know it when I see it.” After reviewing and discussing practitioner responses, the authors felt
2
Synthesis of Knowledge of Extreme Fire Behavior: Volume I for Fire Managers
Literature Cited
Byram, G.M. 1954. Atmospheric conditions related
to blowup fires. Sta. Pap. 35. Asheville, NC: U.S.
Department of Agriculture, Forest Service, Southeastern
Forest Experiment Station. 34 p.
Davis, R.T. 1969. Atmospheric stability forecast and fire
control. Fire Control Notes. 30(3): 3–4, 15.
National Wildfire Coordinating Group [NWCG]. [N.d.].
Glossary of wildland fire terminology. http://www.nwcg.
gov/pms/pubs/glossary/index.htm. (June 1, 2011).
3
GENERAL TECHNICAL REPORT PNW-GTR-841
This page was intentionally left blank.
ii
Synthesis of Knowledge of Extreme Fire Behavior: Volume I for Fire Managers
Chapter 2: Effects of Complex Terrain on Extreme Fire
Behavior
Craig B. Clements1
Introduction
(Brode et al. 1987). These terrain effects include aerodynamic wakes, density-driven slope flows, channeling effects
of upper level winds, and flow accelerations over the crest
of mountain ridges. These flows affect the windspeed and
wind direction measurements made in mountainous regions.
For fire behavior applications, the term “complex
terrain” is used to describe regions of relative relief and, in
most cases, mountain topography.
Atmospheric processes in regions of complex terrain have
received considerable interest in the research community for
decades. Traditionally, the term “complex terrain” has been
used to differentiate mountainous terrain from relatively flat
and simple terrain. Research in mountain meteorology has
its foundation in the Alps, and our present understanding
of mountain circulations and the mountain atmosphere
in general came from the early observational studies of
Wagner (1938), Ekhart (1944), and Defant (1949).
The mountain meteorology research community most
likely adopted the term “complex terrain” from the Atmospheric Studies in Complex Terrain the (ASCOT program)
or which focused on observational campaigns of thermally
driven circulations in valleys and, in particular, Colorado’s
Brush Creek Valley (Whiteman 1990).
A new classification of mountainous terrain by Meybeck et al. (2001) provided 15 relief patterns based on relief
roughness and elevation. Relief roughness is defined as
the difference between maximum and minimum elevation
divided by half the length of cell used in the elevation
data set (e.g., digital elevation model [DEM]). This terrain
parameter is similar to the average slope typical of terrain
classifications. Although Meybeck et al. determined many
terrain types, they did not define any as complex terrain.
Meybeck et al. classified mountains as terrain with elevations higher than 500 m and relief roughness greater than
20 percent. One problem with this classification is that
high plateaus are not mountains. Major river valleys can
be incised into a high plateau such as the Grand Canyon.
Although this is not “mountainous terrain,” it is complex.
Most applicable to meteorological use of the term
“complex terrain” is when defining the effect that land
shape or topography has on meteorological measurements
Wind Systems in Mountainous Terrain
Wind systems in mountainous terrain can be classified
into two main types based on their forcing mechanisms:
dynamically driven and thermally driven winds. Although
thermally driven circulations occur more regularly in
mountain terrain and are commonly experienced by
hikers and climbers during fair weather conditions, it is
the dynamically driven winds that can play a larger role in
producing extreme fire behavior owing to their generally
stronger surface wind velocities. However, the thermally
driven circulations are subject to diurnal transition periods
where atmospheric stability changes twice daily, potentially
leading to extreme changes in observed fire behavior. This
chapter will review the main mesoscale and local-scale
wind systems observed in mountainous terrain that can
potentially lead to extreme fire behavior.
Dynamically Driven Winds
Dynamically driven winds are generally considered the
strongest of the wind systems in mountainous terrain and
include downslope windstorms such as foehn and Santa
Ana winds, strong surface winds associated with mountain
wave development, gap winds, and channeling of synopticscale winds. The factors that affect these terrain-forced
winds as summarized by Whiteman (2000) are (1) the
1
Craig B. Clements, Department of Meteorology and Climate
Science, San José State University, San José, CA.
5
GENERAL TECHNICAL REPORT PNW-GTR-854
stability of the air approaching the mountains, (2) the speed
of the airflow, and (3) the characteristics of the underlying
topography or mountain barrier.
in the San Francisco Bay area, these winds are known as
Diablo winds. Foehn winds in the Cascade Mountains of the
Pacific Northwest are called east winds as they blow from
the east of the Cascades and descend becoming warmer and
drier over the west slope of the mountain range. In Utah,
the local foehn is known as the Wasatch wind as it descends
from the higher elevations east of the Wasatch Mountains
to the Salt Lake Valley. A comprehensive review of foehn
winds of the Western United States is found in Whiteman
(2000).
Foehn Winds—
One of the most important dynamically driven winds
affecting fire behavior in mountainous terrain is the
Chinook or foehn wind. Foehn winds (pronounced “firn”)
are downslope wind events and are often associated with
extreme fire behavior because of their near-surface high
windspeeds, warm temperatures, and low relative humidities (Durran 1990, Whiteman 2000). As foehn develops,
its onset can cause rapid changes in temperature and
humidity because of adiabatic compression as air descends
the lee side of mountain ranges. Extreme fire behavior can
potentially occur during nighttime at the onset of a foehn
event; strong winds will prevent nocturnal inversions from
forming allowing nighttime temperatures to remain warmer
(Whiteman 2000). Foehn winds can also start and stop suddenly, called a foehn pause (Whiteman 2000). The alternating wind break-in and cessation during a foehn event can
cause air temperatures to oscillate sharply and can thus
affect fire behavior. The foehn pause has been associated
with changes in upstream conditions, including stability
and cross-barrier windspeed that cause the wavelength of
the waves to change (Whiteman 2000), and to lifting of
the foehn wind by other local drainage flows (BaumannStanzer and Piringer 2004).
Foehn winds are common in most mountainous regions
around the world. In the lee of the Rocky Mountains of
North America they are called Chinooks. The Chinook
is most prevalent in winter months when strong westerly
winds cross the Rockies (Whiteman 2000); however, when
the synoptic conditions are right, Chinooks do occur during
fire season (see the next chapter, “Critical Fire Weather
Patterns”).
In northern California, foehn winds that flow from the
Great Basin over the Sierra Nevada to the Central Valley
are known as north winds and in the region of Yosemite
are called mono winds (Ruscha 1976). Even more localized
Santa Ana winds—
The most notable foehn wind associated with extreme fire
events is the Santa Ana of southern California. High windspeeds and extreme dryness associated with these episodes
have been characterized as causing extreme fire behavior
during fall in southern California. Barry (2008) stated that
the Santa Ana develops as a result of high pressure over
the Great Basin and development of a surface low off the
southern California coast. An upper level trough to the east
and a ridge in the eastern North Pacific cause the development of northerly flow.
Hughes and Hall (2009) suggested that the surface
winds associated with Santa Ana events are produced by
two mechanisms. When strong mid-tropospheric winds
impinge on mountaintops in a stably stratified environment,
gravity waves transfer midlevel momentum to the surface,
causing strong lee-side surface winds. However, Hughes
and Hall (2009) found strong variability in Santa Ana events
with many days exhibiting strong offshore flow and weak
synoptic forcing. They suggested local thermodynamic
forcing must also cause offshore surface flow. When cold air
is trapped in the Great Basin by topography, a hydrostatic,
desert-ocean pressure gradient forms resulting in a negatively buoyant gravity current to flow through mountain
gaps at the surface.
Numerical modeling results by Huang et al. (2009)
showed that a coupling between the synoptic scale and
mesoscale exists leading to the development of Santa Ana
winds. The coupling effects of the synoptic scale with the
6
Synthesis of Knowledge of Extreme Fire Behavior: Volume I for Fire Managers
was that none of the fire shelters for the five firefighters that
were killed by the burnover were deployed, indicating that
the head fire must have accelerated as it came up the creek
drainage and caught all firefighters by surprise leaving them
no time to deploy their shelters.
One of the major contributing factors was the Santa
Ana winds coming into alignment with the “unnamed creek
drainage” as a channeled flow increasing the surface winds
in the canyon. Additionally, the inversion was penetrated
mesoscale are classified in three stages. During stage I,
mesoscale subsidence occurs in the exit region of the jet
stream causing an initial surge of dry air to the surface as
a result of moisture divergence behind a surface cold front
in the Southwestern United States. During stage II, anticyclonic curvature of the jet stream increases, and strong
northeasterly winds in the jet exit region advects dry air
toward the California coast. During stage III, the extremely
dry mid-tropospheric air is transported to the boundary
layer on the east side of the coast range caused by wave
breaking and strong turbulence that lead to the formation
of a hydraulic jump creating the Santa Ana winds.
There have been many studies focused on the largescale dynamics of Santa Ana events, but few studies have
investigated extreme fire behavior associated with these
events. One recent study was made by Maranghides and
Mell (2009) who conducted a postincident analysis of the
fire behavior that occurred during the Witch and Guejito
Fires near San Diego, California, in 2007. Surface winds in
the region were approximately 11 m/s with gusts of 15 m/s.
A home weather station in the region reported a maximum
windspeed of 25 m/s. Relative humidity dropped from
90 to 8 percent during the onset of the Santa Ana wind
event. Spread rates during the Guejito Fire were estimated
between 1.7 and 2.5 m/s (3.7 and 5.6 mi/h). Spotting distances were estimated to be approximately 4.5 km (2.8 mi)
from the Guejito Fire front. The surface wind measurements
were limited to just a few sites in the region of these fires,
but indicate very strong surface winds and rapid fire spread.
Better measurements of fire-atmosphere interactions during
Santa Ana events would lead to improved understanding of
extreme fire behavior during such events.
by the convection column from the fire run up the canyon,
resulting in extreme fire behavior and area ignition. Coen
and Riggan (2010) confirmed the presence of strong winds
that aligned with the canyon; however, these surface winds
were a result of atmospheric gravity waves bringing highmomentum east-northeasterly winds to the surface.
Sundowner winds—
Another foehn wind that has played a major role in observed
extreme fire behavior is the sundowner wind of Santa Barbara, California. The sundowner is a localized downslope
wind that flows from the Santa Ynez Mountains down to the
narrow coastal plain of Santa Barbara. The topography is
unique, as it is a section of coastline and mountains that are
aligned west to east. The winds are a result of perpendicular
flow at ridgetop, typically associated with warmer and drier
air near the mountaintops and cooler, higher humidity air
at the coast. The extreme effects of the winds include the
onset of severe wind velocities and abrupt warming. The
abrupt observed warming is a result of the adiabatic descent
of mid-tropospheric air to the surface and the replacement
of cooler marine air at the coast with the foehn wind (Blier
1998). The sundowner name is due to the time of onset,
typically during the later afternoon or evening hours (Ryan
1994). One synoptic regime associated with sundowner
events includes the alignment of an inverted ridge off
the California coast and inverted trough in the interior of
the Great Basin allowing for northerly winds along the
California coast (Blier 1998). Additionally, as with other
foehn events, the presence of a stable layer at ridge height
enhances the flow and formation of mountain waves (Blier
1998). Sundowners have been associated with extreme fire
Esperanza Fire—The Esperanza Fire occurred on 26
October 2006 near Cabazon, California, and was an event
where extreme fire behavior was associated with five firefighter fatalities. The extreme fire behavior was caused by
the fire spread up a narrow canyon enhanced by flow channeling created by the onset of a Santa Ana wind (Coen and
Riggan 2010, Esperanza Investigation Team 2006). One key
finding (finding 29, Esperanza Investigation Team 2006)
7
GENERAL TECHNICAL REPORT PNW-GTR-854
behavior. For example, during the Painted Rock Fire in
June 1990, an extreme sundowner event caused devastating
winds and fire spread rates. Additionally, downslope winds
can cause severe downslope fire spread as noted by Weise
and Biging (1996).
numerical modeling and climatological analyses that the
Washoe zephyr is driven by the cross-barrier pressure
gradient formed in response to the thermal low of the Great
Basin.
One incident in the lee of the Sierra Nevada that could
be attributed to a Washoe zephyr-like event occurred
during the Seven Oak Fire of the Inyo Complex (California
Department of Forestry and Fire Protection 2008). On the
afternoon of 7 July 2007 at 1400 Pacific Daylight Time
(PDT), a strike team was assigned to burn out an area in
order to protect the historical Mount Whitney Fish Hatchery
on the western side of Owens Valley near the town of Independence, California. The site was just below the eastern
escarpment of the Sierra crest. At 1430 PDT, the wind had
changed and caused the fire to cross the planned control
line. It is reported that at 1445 PDT, the fire intensified and
the winds increased and began changing directions. At this
time, the firefighters realized they were losing control and
retreated toward their designated safety zone and deployed
their shelters while waiting out the burnover in a small
pond. The entrapment resulted in burn and respiratory injuries to all nine firefighters and the total loss of one engine
and damage to another. The incident report indicated that
skies were clear with no cumulus buildup. The day before,
when the fire started, there were frequent lightning strikes
in the higher elevations of the Sierra with strong, gusty and
erratic winds. A 26 m/s (58 mi/h) wind gust was recorded
by fire personnel using a Kestrel handheld anemometer.
Daytime temperatures on July 7th ranged from low 32
to 38 °C (90s to 100 °F) at 1247 PDT. Relative humidity
(RH) values ranged from a high of 13 percent to a low of
4 percent at 1447 PDT. At the Oak Creek remote automated
weather station (RAWS), a wind gust of 22 m/s (50 mi/h )
also occurred at 1447 PDT. Winds in the afternoon were
sustained 4.5 to 6.7 m/s (10 to 15 mi/h) gusting to 13 m/s (30
mi/h). At the time of the burnover, winds were 9 to 13 m/s
(20 to 30 mi/h) out of the southwest.
Although the southeastern Sierra is not usually associated with Washoe zephyr events because of the higher terrain and fewer gaps in the crest, the observed characteristics
Washoe zephyr—
The eastern Sierra Nevada is associated with strong
Chinook wind events in the winter and spring (Zhong et al.
2008a). During the summer and fall, however, the Washoe
zephyr occurs regularly. The Washoe zephyr is a daytime,
down-canyon wind that occurs on the lee side of the Sierra
Nevada (Clements 1999, Zhong et al. 2008a) often initiating
afternoon thunderstorms in western Nevada (Hill 1980).
Zhong et al. (2008a) defined the Washoe zephyr as a westerly wind with a sustained windspeed greater than 7 m/s
starting after noon Local Standard Time (LST). Climatology of the zephyr indicates that 85 percent of the time, these
events start between 1300 and 2000 LST with 70 percent
onset between 1500 and 1800 LST. Half of the events have
a duration of 3 to 6 hr, and few events last more than 9 hr
(5 percent). Although zephyr events do occur all year, they
are most frequent during the summer months. A frequency
of less than 10 percent was observed from November to
February.
The characteristics of the Washoe zephyr are somewhat
opposite of what is generally observed in mountainous
terrain where up-valley winds dominate in the afternoon.
The zephyr develops in late afternoon during the summer
and fall, and blows strongly down canyon with velocities
regularly exceeding 5 m/s. The vertical wind profile of
the zephyr is characterized by a strong low-level jet that
produces strong wind shear and turbulence (Clements 1999,
Kingsmill 2000) at the surface. Wind shear can be defined
as the change in windspeed or wind direction with height
(vertical wind shear). The strong and gusty nature of the
zephyr lasts throughout the night and finally diminishes,
allowing thermally driven down-valley winds to persist
until morning (Clements 1999).
The dynamics of the Washoe zephyr have often been
questioned. Zhong et al. (2008a) showed through mesoscale
8
Synthesis of Knowledge of Extreme Fire Behavior: Volume I for Fire Managers
Thirtymile Fire—The Thirtymile Fire investigative report
have some similarities to the zephyr. Southwesterly winds
with recorded velocities of 4.5 to 6.7 m/s (10 to 15 mi/h)
are similar to what has been observed in Lee Vining and
Reno to the north. The onset of the stronger winds occurring between 1400 and 1500 is typical for zephyr events.
However, the Washoe zephyr typically has a more westerly
component, but this could possibly be effects of flow channeling along the foothills of the Sierra eastern escarpment
as found by Zhong et al. (2008b).
indicates that fire-induced winds were associated with the
deaths of four firefighters who deployed at a site located 30
m upslope from the valley floor. The analysis suggests that
the deployment site happened to be located at a point where
the convection column had impinged on the valley sidewall,
causing extensive convective heat to pass over the deployment site leading to the asphyxiation of the entrapped firefighters. While initially, winds in the canyon were relatively
light during the early afternoon, strong fire-induced winds
were reported to be on the order of 22 m/s (50 mi/h) during
the onset of the deployment (Brown 2002).
Tree needle heatset observations made at the deployment sites (Brown 2002) indicated that the fire-induced
winds were in the up-canyon and upslope direction suggesting that the convection column was being channeled up
the canyon rather than rising vertically from the surface.
The fact that the convection column near the surface was
being advected up canyon suggests that the surface winds
were blowing through the fire-front boundary. Additionally,
observed spread rates at this time increased and caught the
firefighters off guard (Brown 2002). The increase in fire
spread rate was a result of the fire running in the crowns,
driven by the up-canyon winds. At the same time, upper
level winds were from the southwest and in alignment
with the canyon’s axis providing a source for increased
wind velocities. The upper level winds may have been
mixed downward from aloft to the surface owing to the
dynamics of the convection plume. The downward mixing
of horizontal momentum could help explain why the fire
front accelerated and caused the burnover to happen so
quickly. These events can be surgelike and last for only a
few minutes. Another mechanism that could be responsible
for the convection column to have impinged on the canyon
sidewall might be strong downdrafts that exist in plumes or
convection columns. These downdrafts can be responsible
for the strong fire-induced winds that are often observed at
the fire front and may drive fire spread (Clark et al. 1996,
Clements et al. 2007).
Terrain channeling effects—
Forced channeling or pressure-driven channeling of upper
level, larger scale winds can cause drastic changes in
windspeed and direction to occur in valleys (Whiteman
2000). These high wind events can be produced by (1)
downward momentum transport, (2) terrain channeling, and
(3) pressure-driven channeling (Whiteman 2000, Zhong et
al. 2008b). For a more detailed review on terrain channeling
effects in mountainous regions, please refer to the paper by
Sharples (2009).
The downward transport of momentum occurs when
winds within a valley are strongly coupled to winds aloft
(Zhong et al. 2008b). For this condition to occur, there must
be vertical mixing associated with unstable or neutral stability allowing upper level winds to penetrate to the surface.
When winds in a valley are driven by this mechanism, they
are expected to align with the wind direction aloft. Downward transport of momentum in valleys occurs often.
Another channeling effect is “forced channeling,”
which occurs when strong winds aloft blow directly along
the valley’s axis (Whiteman 2000). According to Whiteman, forced channeling occurs more regularly during
daytime because the valley atmosphere is usually neutral or
unstable during the day. It typically begins in later morning
after the breakup of the nocturnal inversion, resulting in
abrupt changes in windspeed and gustiness. Forced channeling is strongest when the pressure gradient aloft is weak
in the along-valley direction. Upper level winds can also be
channeled when they blow at oblique angles to the valley
axis, either flowing up or down the valley.
9
GENERAL TECHNICAL REPORT PNW-GTR-854
Another mechanism possibly responsible for the intense
fire-induced winds could be a developing low pressure field.
This may have existed in the upper elevations of the canyon
ahead of the fire front. This type of pressure perturbation
ahead of the fire front has been found in numerical simulations done over flat terrain (Clark et al. 1996) and observed
over slopes with crosswinds (Clements and Heilman
2010). A region of low pressure develops as a result of a
hydrostatic pressure gradient that forms at the base of the
convection column (Clark et al. 1996). Within a canyon during daytime, low pressure exits owing to the solar heating of
the canyon volume causing up-canyon winds to occur. With
the additional heating caused by the advection of the plume
up the canyon, acceleration in the wind field could result
and be the cause for the extreme fire-induced winds that
blew through the fire front advecting hot gases along the
sidewalls of the canyon. Although these mechanisms could
be responsible for the plume impingement on the canyon
sidewall, none has been confirmed.
Two main circulations exist in the valley atmosphere:
valley winds and slope winds. The valley winds consist of
two diurnal regimes: the up-valley wind during the daytime
and the down-valley wind at night. The slope winds consist
of a similar diurnal structure with downslope winds occurring during the nighttime periods and upslope winds during
the daytime (Ekhart 1944; Vergeiner and Dreiseitl 1987;
Whiteman 1990, 2000). The strength of thermally driven
circulations is a function of aspect, time of day, and time of
year (Whiteman 2000). Of the two wind systems, the valley
winds play a larger role in fire behavior because of their
overall stronger velocities and horizontal extent.
Slope winds—
Slope winds are the most intermittent of the thermally
driven flows found in mountain environments (Vergeiner
and Dreiseitl 1987, Whiteman 1990). This is due to both
slope length and depth. Although there have been numerous
studies focused on the downslope flows (Horst and Doran
1986, Mahrt 1982, Manins and Sawford 1979, Papadopoulos
and Helmise 1999, Whiteman and Zhong 2008), limited
work has been focused on the upslope winds. Vergeiner and
Dreiseitl suggested that this is due to their intermittency and
overall difficulty in obtaining useful measurements. They
also concluded that any field study focused on measuring
upslope flows will “give random inconclusive results from
which representative values of mass and heat transport in
the slope layer cannot be derived” (Vergeiner and Dreiseitl
1987).
Fire behavior studies on slopes and especially field
studies are limited, and therefore it is difficult to determine
whether or not diurnal slope flows help drive the fire along
the slope rather than being dominantly driven by the fuels
and the effect of radiative and convective transfer from
the fire front to the fuels (flame attachment). However, as
will be discussed in a later section, the interaction of slope
winds and valley winds can create shear layers producing
turbulence along the slopes that can potentially lead to
extreme fire behavior scenarios.
Pressure-driven channeling—
Pressure-driven channeling occurs when there exists a
larger scale pressure gradient above the valley that is superimposed on the valley below. The direction of the winds
in the valley depends on the along-valley component of the
horizontal pressure gradient. Pressure-driven channeling
causes winds to always blow along the valley axis from
high pressure (end of valley) to low (end of valley) (Whiteman 2000, Zhong et al. 2008b). Pressure-driven channeling
is strongest when the along-valley pressure gradient is
strongest in the along-valley direction.
Thermally Driven Winds
Thermally driven wind systems are very common because
they are diurnally driven (daytime vs. nighttime) and are
probably experienced more by wildland firefighters and
backcountry hikers. These winds include the classic valley
and slope winds. There is a distinct diurnal structure to the
evolution of the thermally driven flows where their direction
typically reverses daily owing to changes in the pressure
gradient and buoyancy.
10
Synthesis of Knowledge of Extreme Fire Behavior: Volume I for Fire Managers
responsible for transporting heat and mass to the valley
atmosphere (Vergeiner and Dreiseitl 1987).
One of the more recent observations of upslope flows
was made by Reuten et al. (2005) who observed upslope
flows at the foot of a mountain range with a slope angle of
19° and a ridge height of 780 m above sea level (ASL) in
coastal British Columbia. Their observations indicate that
the daytime upslope flows were strong with velocities up
to 6 m/s and occurred over a depth of nearly 500 m AGL.
Equally strong and deep return circulations occurred within
the convective boundary layer (CBL). The transport of mass
of the upslope flow and return flow approximately balanced
during the morning period suggesting a closed-cell slope
flow circulation within the boundary layer. This is the first
observational evidence of the closed cell slope flow circulation.
The intermittency of daytime upslope flows may
influence the upslope fire behavior by possibly increasing
upslope rate of spread at random intervals. However, this
influence is more likely limited owing to the weak nature
of the upslope velocities. Valley winds may have a larger
impact on fire behavior on slopes owing to the cross-slope
wind component of the valley winds. As the valley wind
develops, the valley wind can overcome the slope wind
layer along the slope and create cross-slope flow (Whiteman 2000). Fire spread will be upslope, but depending on
the strength of the valley wind, can likely be reduced and
spread laterally along the slope. Synoptically forced winds
that penetrate the valley atmosphere would intensify this
effect.
* m/s = meters per second
Figure 2-1—Schematic diagram indicating vertical slope flow
structure for daytime upslope flows (dashed line) and nighttime
downslope flows (solid line). Adapted from Whiteman (2000).
AGL = above ground level.
Upslope winds—
According to Whiteman (2000), upslope flows have depths
of 10 to 50 m above ground level (AGL) and velocities on
the order of 1 to 5 m/s2 (fig. 2-1). Upslope flows react instantly to changes in insolation and begin immediately after
sunrise (Vergeiner and Dreiseitl 1987). Two main forcing
mechanisms drive the flow upslope: the pressure gradient
force and the buoyancy force (Atkinson 1981). The air over
a slope is heated by insolation leading an air parcel adjacent
to the slope to have a higher potential temperature and
lower density than air at the same altitude, but away from
the slope. It is this temperature perturbation that drives
the pressure gradient to force air toward the slope from the
center of the valley (at the same altitude). Buoyancy drives
the air parcel vertically above the slope, and the sum of both
buoyancy and the horizontal pressure gradient causes the
air parcel to accelerate up the slope while being replaced by
air from over the valley center. This is the classic upslope
circulation during ideal, fair weather conditions and is
Fire behavior on sloped terrain—
Slope-driven fire spread has been studied for decades
because many wildfires occur in regions of mountainous terrain, and fire spread on slopes is associated with
increased acceleration leading to extreme fire behavior
(Cheney and Sullivan 2008). Understanding of fire behavior
on slopes is derived mostly from laboratory-scale experiments conduced in wind tunnels (e.g., Weise and Biging
1996); however, recently a number of numerical simulations
have been conducted (Linn et al. 2010). The effect of slope
11
GENERAL TECHNICAL REPORT PNW-GTR-854
chamber and a fuel bed configured on a tilting, V-shaped
table to replicate a steep chimney were conducted by Viegas
and Pita (2004) and Viegas (2005). Their conclusions suggest that forest fire blowup depends mainly on fuel-bed
properties and on the initial fire spread conditions dictated
by topography or wind. Viegas (2005) also found that if
the slope is not sufficiently long, blowup may not occur;
however, a fire in the same fuel bed on a very steep slope
will start with a high rate of spread (ROS), and blowup may
be obtained quickly. These studies do provide some insight,
but they are limited by the experimental design as are most
chamber-table studies owing to the limited table length.
has been viewed as an added component of wind velocity
since 1946 (Weise and Biging 1997). There have been attempts to determine both the separate and combined effects
of wind velocity and slope angle on spread rate and flame
length (Weise and Biging 1997). Results from Weise and
Biging indicate that as slope and wind velocity increase, fire
behavior, including flame length and spread rate, increases
significantly as compared to no-wind and downslope conditions. Backing fires on slopes can result in weak to no
spread. Weise and Biging suggested that the wind acts to
cool the unburnt fuel in advance of the fire front.
Santoni et al. (1999) formulated a model to account for
upslope fire spread and compared the solution to experimental results obtained using a tilted, combustion table. They
suggested that the flame’s heat that is radiated ahead of the
fire front toward the fuel is more important under slope
conditions. They found that the rate of spread increases
with slope. They also found that the fire front shape distorts
toward the slope as the fire spreads upslope becoming more
pointed. The fire front distortion increases with increasing
slope angle.
Dold and Zinoviev (2009) and Dold (2010) suggested that
air ahead of a fire front that is spreading upslope flows up
the slope, causing plume attachment with the fuels on the
slope and leading to acceleration of fire spread upslope.
Additionally, this leads to potentially dangerous acceleration of the fireline. They suggested that the airflow is generated by the fire and is independent of the ambient wind.
Wu et al. (2000) conducted a series of laboratory experiments and successfully visualized experimental fire plumes
interacting with an inclined surface by using a grid schlieren system. They found that plumes were characterized by
two parameters, plume attachment length and plume angle,
and these were used to determine a critical inclination angle
for flame attachment to occur. Their results suggest that 24°
is a critical angle for attachment to occur. Additionally, Wu
et al. found that the critical inclination angle is not sensitive
to the heat release rate or surface conditions.
Dupuy and Maréchal (2011) conducted a series of
laboratory fire experiments to determine the contribution
of radiation and convection to fuel bed preheating on slopes
of 0°, 10°, 20°, and 30°. Their results indicate that radiative
heating is the dominant heat transfer mechanism on slopes
between 0° and 20°, but close to the fireline. Convective
heating was also found to be significant, becoming onethird of the total heat flux on the 20° slope. When the slope
angle increased from 20° to 30°, the rate of spread increased
by a factor of 2.5 owing to an increase in convective heating; also at this angle, radiative heating stopped increasing.
Chimney effects—
An important aspect of upslope wind on fire behavior would
be the effect that chimneys or steep gullies have on driving
wind up the mountainside. Gullies can help channel upslope
flows if the chimney is not lined with dense vegetation.
Within the canopy, the air is usually cooler than the free
atmosphere and can result in drainage winds flowing below
the canopy top while upslope winds occur above the canopy
(Belcher et al. 2008, Whiteman 2000). Few, if any, observations of wind velocities in steep gullies exist.
Explosive fire behavior—
Eruptive fire behavior has been reviewed by Viegas and
Simeoni (2010) where they define extreme fire acceleration
as fire blowup characterized by a sudden change of spread
rate and energy release rate. This designation was first
proposed by Viegas (2005), and such fire eruptions, especially those associated with canyons, are not rare (Viegas
and Simeoni 2010). Laboratory studies using a combustion
12
Synthesis of Knowledge of Extreme Fire Behavior: Volume I for Fire Managers
Their results also showed that far from the fireline, cooling
by convection was found to be substantial except on slopes
of 30° in angle.
Sharples et al. (2010a) suggested that the trench effect
or flame attachment phenomena observed in structure fires
of stairwells can be used as a surrogate for wildland fires
exhibiting explosive behavior. The trench effect produces
rapid fire spread in enclosed slopes such as escalator or
stairwells by the interaction of the buoyant plume and an
inclined trench of the stairwell. Plume impingement on
an inclined surface enhances preheating and pyrolysis of
the fuel resulting in accelerated fire spread. Sharples et al.
(2010a) suggested that the trench effect is a misnomer and
the effect is really due to the trenchlike configuration of the
fuels that limited lateral entrainment into the plume. They
suggested that plume attachment or flame attachment are
more appropriate to describe the phenomenon. This conceptual model applies to steep gullies or canyons, as these
terrain features can potentially limit the lateral entrainment
into the plume and result in eruptive or accelerated fire
spread up the canyon.
Sharples et al. (2010a) also noted that confined slopes
over 25° are the most prone to flame attachment and the
reason observed eruptive wildfire behavior is more prevalent on steep slopes and in steep canyons. This observation
is in agreement with the results from Wu et al. (2000) who
suggested 24° as a critical slope angle for flame attachment
to occur.
(1999), but the most significant finding from the FIRETEC
simulations was that the spread rate of all simulations is not
the same at a point near the bottom of the hill and a point
near the top, even though the slope is the same at each point.
Linn et al. (2010) remarked that this result indicates that
simply having a single value of local slope angle of a hill
and a single nominal windspeed is not adequate to predict
the spread rates on slopes.
Linn et al. (2007) also showed that under certain
conditions, the local slope had a more pronounced effect
on spread rate than ambient wind. For example, numerical
simulations showed that fire spread was dominated by the
topography at locations on the middle of a slope when ambient winds were 6 m/s, whereas at other locations upwind of
the slope, the fire behavior was strongly influenced by the
coupling between the topography and ambient wind. This
result indicates the importance of understanding the local
winds that are influenced by the topography. The local wind
field drives the fire behavior, and the topography has a more
pronounced effect on the wind field rather than directly on
the fire. Additionally, Linn et al. (2007) found a relationship among fire behavior, topography, and atmosphere that
showed importance when the topographically influenced
winds are not complementary to the slope effects such as
those reported by Weise and Biging (1997).
Because present knowledge of fire behavior on slopes
and in gullies is a result of laboratory experiments and
numerical modeling studies, there is still a large gap in
understanding the role of slope-scale winds on fire spread
on slopes. Therefore, there is an immediate need for welldesigned field experiments.
Modeling of fire behavior on slopes—
To date, most studies aimed at determining the role of slope
on fire behavior have based their models on wind tunnel
experiments. More recently there have been attempts using
physics-based, coupled fire-atmosphere modeling systems
to evaluate the role of slope on fire behavior (Linn et al.
2007, 2010). Using the FIRETEC modeling system (Linn
et al. 2002, Linn and Cunningham 2005), Linn et al. (2010)
simulated fire behavior on a 30° slope with different fuel
types and found that the slope alone has a significant effect
on spread rate and spread pattern. This result confirms
the results of Weise and Biging (1997) and Santoni et al.
Downslope winds—
Downslope winds, also known as katabatic and drainage
winds, develop once the slope becomes shaded as the sun
sets. This reversal in the heating causes a shallow layer of
cold air to develop along the slope, and this cold layer of
air is now more dense than the surrounding air. As a result,
it flows or drains downslope. As in the upslope winds,
downslope winds are driven primarily by temperature differences between the air on the surface of the slope and that
13
GENERAL TECHNICAL REPORT PNW-GTR-854
at the same elevation away from the slope. Observations of
downslope flows over simple slopes indicate that the velocities range from 1 to 4 m/s and occur within a depth of 10 to
40 m above the slope (Horst and Doran 1986, Papadopoulos
and Helmise 1999, Whiteman 2000).
Because downslope winds have limited vertical extent
and are typically much weaker in velocity, their effect on
fire behavior may be limited. The downvalley winds most
likely play a larger role on fire behavior-over the slopes in
a mountain valley. Valley winds typically “overrun” the
weaker slope flows once the down-valley winds become
established throughout the night.
Once the surface winds become decoupled owing to
the buildup of a nocturnal inversion at the valley floor, fire
behavior can change dramatically with a change in direction
or a decrease in spread rates, flame lengths, and intensity.
These changes can also be attributed to relative humidity
recovery near the surface.
can lead to changes in fire spread rate if the surface wind
accelerates to the surface. However, there have been no
quantitative studies on how the valley wind can affect fire
behavior during daytime or night.
Valley winds can sometimes be overcome by other
mesoscale wind circulations especially in regions near
coastlines. Seto and Clements (in press) observed the formation of a small fire whirl that formed during a prescribed
fire when the prevailing up-valley wind was overcome by
sea breeze. Observations from a micrometeorological measurement tower placed in the burn unit showed that the fire
whirl formed immediately after the sea breeze entered the
valley at the surface. The fire whirl was first observed in the
flaming front but moved behind the fire line as it stretched
about 200 m in the vertical. The fire whirl caused the fire
crew to quickly reposition themselves away from the fireline
to remain safe. After the fire whirl dissipated, firing operations resumed. Seto and Clements (in press) ascertained that
the fire whirl was caused by horizontal vorticity that was
generated as a result of near-surface wind shear formed by
the interaction of the sea breeze and the up-valley wind.
Valley winds—
Valley winds, also known as along-valley winds, are a
much more consistent wind regime than slope flows and
are typically associated with much stronger velocities. The
dynamic forcing is similar to that for the slope winds with
the exception that the forcing is driven by a valley volume
effect. During daytime, the air in the valley is warmer than
over the plain because its volume is less and it thus warms
faster than the air over the plain (Schmidli and Rotunno
2010, Whiteman 1990). As a result, pressure is reduced in
the valley while it is higher over the plain at an altitude that
is the same elevation as the valley. The pressure gradient
force is then directed from the plain to the valley (Whiteman 1990). During the night, the pressure gradient reverses
and the winds blow down valley. Up-valley winds have
velocities on the order of 3 to 8 m/s and down-valley winds
about 3 to 6 m/s. Typically there exists an oscillation in
the winds at night (Porch et al. 1991), which can affect fire
behavior. The oscillations are thought to be caused by the
interactions of air flowing out from tributary valleys into
the main valley causing surges in the winds to occur at
regular intervals on the order of 10 to 20 min. These surges
Inversion destruction in valleys—
The diurnal evolution of vertical temperature structure in
mountain valleys has been well established by extensive
field and modeling studies (Whiteman 1982, Whiteman
and McKee 1982). During the night, cold air forms over
the slopes and at the valley bottoms forming a temperature
inversion, where the temperature increases with altitude
(Whiteman 2000). Inversion breakup occurs in the morning
when the sun begins heating the surface, and during the
transitional period that follows, it can produce significant
changes in surface conditions such as increased windspeed,
wind direction, temperature, and humidity. Inversions
can also break up in the middle of the night when stronger
upper level winds push out the valley inversion (Clements
et al. 2003). This can occur in shallow valleys that are more
exposed to upper level winds or when upper level winds are
excessively strong. For these reasons, inversion breakup is a
period likely to produce periods of extreme fire behavior.
14
Synthesis of Knowledge of Extreme Fire Behavior: Volume I for Fire Managers
Figure 2-2—Temperature and windspeed profile evolution during valley inversion breakup in Yosemite Valley, California. Down-valley
winds are negative and up-valley winds are positive. Once inversion is destroyed, up-valley winds mix downward to the surface causing
a rapid increase in surface windspeed and direction. Times indicated are local time. Adapted from Clements and Zhong (2004). AGL =
above ground level.
The breakup of temperature inversions can occur
within 2 to 3 hr depending on valley geometry and season
(Whiteman 1990). The most dangerous situation for
increased fire behavior is when there is a strong downvalley wind that is decoupled from the surface by the surface inversion’s capping inversion top (fig. 2-2). Once
the inversion breaks, the stronger winds can mix quickly
downward to the surface bringing drier and warmer air to
the surface. Often the wind velocity can easily double and
be associated with a 180º shift in direction. This situation
is very common in valleys and can be anticipated on fires,
but the rate of the inversion breakup and the decoupling of
winds aloft should be estimated from smoke observations
or a sequence of soundings taken on site.
The inversion breakup model of Whiteman (1982) is
not observed in all valleys. During the Riviera Project in
the Swiss Alps (Rotach et al. 2004), the thermodynamic
structure and evolution was different than what was found
in the valleys of the Colorado Rockies. Rotach et al. (2004)
described a valley atmosphere that is stable throughout
the afternoon rather than being well mixed as suggested
by Whiteman (1982). However, there exists a multilayered
structure to the temperature profiles, which has been found
in other valleys of the Alps. Thus, the stability regime can
be quite different from valley to valley. To determine the
local stability for fire behavior and fire weather predictions
requires an in situ sounding at the time of interest. Inversions in valleys may or may not be horizontally homogenous in extent, but rather developing in isolated pockets
along the valley’s axis. Locations along the valley floor may
have areas of weaker surface inversions that could result in
a faster inversion breakup and could potentially lead to different fire behavior only hundreds of meters away. Another
aspect of valley inversions is the role they have on the
thermal belt. Thermal belts are areas along valley sidewalls
that are warmer than the areas below and above them. This
can have an impact on the fuel loading, moisture content,
and temperature, and resulting fire behavior.
Cross-valley winds—
Cross-valley winds can form as a result of either differential
heating of slopes or dynamically forced flows through and
over the terrain. Additionally, during the breakup of the
valley inversion, solar radiation that illuminates one side of
15
GENERAL TECHNICAL REPORT PNW-GTR-854
a valley first causes a circulation to develop in the acrossvalley direction, as air within the center of the valley flows
toward the heated sidewall and compensates for a slope
flow and convection that develops in response to the solar
heating (Colette et al. 2003, Whiteman et al. 2004). Rotach
et al. (2004) found that valleys with bends can influence
the location of the core of up-valley flow. In the Riviera
Valley, the up-valley jet core was located closer to one
valley sidewall because of the inertia of the flow as it came
around a bend in the valley. This observation suggests that
in valleys with sharp bends in the along-valley direction, the
flow maxima can occur along one side of the valley. This
characteristic can impact fire behavior in valleys by creating a stronger surface wind on one side of the valley. If the
fire were to cross the valley by spotting, then the spread rate
could potentially be much different than would be observed
on the opposite valley sidewall.
valley wind. As found in the Riviera Valley, turbulence
generation can often be dominated by wind shear. Intense
turbulence is often associated with strong wind shear generated by strong surface winds such as during foehn events
(Sharples et al. 2010b).
Wind Modeling Tools: WindNinja
Determining real-time wind characteristics on an incident
remains a challenge for sites in complex terrain. This
need has been partially addressed by the development of
wind modeling systems by the USDA Forest Service using
in-house and commercially available computational fluid
dynamics codes. The most popular modeling system is
WindNinja (http://www.firemodels.org), which is similar
to the more complex WindWizard model (Butler et al.
2006). WindNinja takes a wind observation at a location
and computes a spatially varying and high-resolution
(100 m) wind field over the terrain, attempting to account
for mechanical modification of the flow by the terrain.
WindNinja is not a forecasting tool, but rather provides
a “snapshot in time” of the wind for an area. WindNinja
is becoming widely used on fire incidents by incident
meteorologists and fire behavioral analysts. This is due
to the nature of the system—it can be run on a laptop
computer taking less than a minute to provide output. That
is a big advantage as no forecasting system can provide this
ease of use. The output from WindNinja is quite exciting for
the user, but there are some major limitations of the system
that users should be aware of. The numerics of the system
are based on solving a rather simple set of mass continuity
equations and optional slope flow equations. This simplicity
is what makes WindNinja operate so fast on a laptop. These
same simplifications are reason for caution when using it in
complex terrain. First, the model is a mass-consistent model
requiring air to flow around mountains rather than through
them. The major pitfall for this type of model is the lack of
thermodynamic fields to determine atmospheric stability,
which would cause air to flow around or over terrain, and
would limit its use for situations where thermally driven
circulations dominate. The exception to this is a simple
Turbulence in mountainous regions—
Turbulence is defined as the perturbation from the mean
of wind velocity. Little is known on the characteristics
of atmospheric turbulent processes in steep mountainous
terrain (Weigel et al. 2007). The role of turbulence on fire
behavior has been suggested as a critical driving force at the
fire front (Taylor et al. 2004) and larger ambient scales (Sun
et al. 2009). Both the background ambient turbulence and
the turbulence generated by the fire itself have an impact
on resulting fire behavior (Sun et al. 2009).
Results from the Alps (Rotach et al. 2004, Weigel et
al. 2007) found that there is a significant spatial variability
in surface turbulence characteristics throughout the valley
atmosphere, which is largely determined by local topographical features such as slope. It was also found that the
maximum in shear-induced turbulence was found to occur
on the eastern valley sidewall (sunlight) and near the center
of the valley at the core of the valley wind. The turbulenceproducing slope surfaces have a significant influence on the
turbulence structure in large parts of the valley atmosphere.
Consequently, fire behavior on slopes can be driven by a
combination of slope effects and ambient turbulence that
is generated by shear between the slope flow layer and the
16
Synthesis of Knowledge of Extreme Fire Behavior: Volume I for Fire Managers
vertical wind profile and showed much better results on the
upwind and top of the hill. Flow on the lee side was less
accurate, likely owing to the crude handling of momentum/
turbulence in WindNinja, which becomes most important
on lee slope locations.
Although there are limitations to the use of this type
of modeling system in complex terrain, a user with an
understanding of these limitations can use the model to get
a general idea of the wind field over a fire area. This can be
a benefit when there is a need to determine if the winds in
an area are terrain forced and caused solely by topography.
Because WindNinja provides a gridded wind field in under
1 minute of simulation time, it is a very capable tool, but
users should have an understanding of the issues mentioned
above. Finally, in the summer of 2010, a major field validation experiment was conducted to provide a comprehensive
data set for testing and improving the WindNinja application (Forthofer, J. 2010. Personal communication). It is no
doubt going to be an improved tool in the near future.
slope flow submodel that is included in WindNinja. The
model stability for flow computation is fixed for a neutral
atmosphere (Butler et al. 2006), except in the initialization
phase where WindNinja approximates lower atmosphere
stability based on surface heat flux and subsequently uses
a logarithmic vertical wind profile that includes adjustment
for this stability. After the initialization phase, neutral
stability is assumed for flow adjustment, but a method of
relaxing this is currently being tested (Forthofer, J. 2011.
Personal communication. Mechanical engineer, USDA
Forest Service, Missoula Fire Sciences Laboratory, Missoula,
MT), so the current version of WindNinja should not be
expected to provide accurate simulations in situations where
thermally driven flows are a dominating influence. For
example, without the ability to run the model with specific
stabilities such as a stable layer at crest height, the model
may not be able to accurately model windflow during foehn
events because the crest-level inversion is an important
criteria for the development of downslope windstorms. Also,
WindNinja may fail during inversion breakup or when a
valley atmosphere is slightly stable during the day. Another
enhancement currently being tested in WindNinja is to
initialize with available weather model forecasts from, for
example, the National Weather Service (Forthofer, J. 2011.
Personal communication). WindNinja would then become
a kind of physical downscaling of these coarse forecasts,
which might further alleviate thermal stability issues in
WindNinja because much of the thermal forcing might be
included in the initialized field from the forecast model.
Kochanski et al. (2009) used multiple meteorological
modeling systems, including WindNinja, to simulate
flow over a simple hill. The performance and accuracy of
WindNinja was much less than the other models, primarily
because the version of WindNinja used did not allow for
a user-defined vertical wind profile. Note that the other
models used were much more sophisticated and required
extensive computing time and processors in order to
complete their simulations, whereas WindNinja did not.
Forthofer (2007) simulated the same hill using a research
version of WindNinja that did specify the measured upwind
Summary
Atmospheric processes in complex and mountainous
terrain result in a variety of phenomena that can affect fire
behavior in unpredictable ways. There are two main wind
types that should be considered for better predicting fire
behavior in mountainous regions: large-scale dynamically
driven winds and thermally driven winds. The most notable
dynamically driven winds are the foehn winds that occur
in most mountain ranges in the Western United States.
Foehn winds are known for increasing the surface winds
dramatically and causing very rapid warming and drying
at the surface. The Santa Anas of southern California are
associated with extreme windspeeds and drying and have
also led to flow channeling in narrow canyons resulting
in extreme fire behavior including accelerated fire spread
down canyon. To date there are few observations of fireatmosphere interactions and resulting fire behavior during
foehn events. More systematic observations are required to
better understand extreme fire behavior during foehn.
17
GENERAL TECHNICAL REPORT PNW-GTR-854
Thermally driven winds in mountainous terrain occur
regularly as they transition from up-valley/upslope during
the daytime to down-valley/downslope at night. Thermally
driven winds have weaker windspeeds than the dynamically
driven winds and can be overcome by synoptic-scale winds
aloft when atmospheric stability permits the downward
transport of higher momentum into the valley atmosphere.
These situations lead to a rapid increase of surface winds
and fire spread rates.
One of the most critical factors affecting fire behavior in valleys is inversion breakup during the morning
transition period. During the morning transition, a stable
atmosphere at the surface quickly mixes and becomes
unstable owing to the development of a convective mixed
layer over the valley floor. When this occurs, winds aloft
above the inversion layer, that were decoupled from the
surface, can mix down quickly bringing much stronger
velocities to the surface and usually from a different direction. These situations can potentially lead to extreme fire
behavior by affecting spread rates and direction. To better
anticipate these rapid changes, vertical profiles of temperatures should be measured in real time using radiosonde
soundings or remote-sensing temperature profilers. Realtime observations would allow fire crews to know the state
of the atmosphere at a given instance.
In addition to the valley inversion breakup, valley
geometry can play a role in fire behavior. Valleys with sharp
bends can have flow maxima along one side of the valley.
This characteristic can potentially impact fire behavior in
valleys by creating a stronger surface wind on one side of
the valley. If the fire were to cross the valley by spotting,
then the spread rate could potentially be much different than
would be observed on the opposite valley sidewall.
Fire behavior on slopes is often explosive in nature as
the fire accelerates up slope. To date, most studies have used
either wind tunnel experiments or coupled atmosphere-fire
numerical modeling systems. Results from these studies
indicate that rate of spread increases with increasing slope
and the fire front shape distorts toward the slope, becoming
more pointed. The fire front distortion also increases with
increased slope angle. The increase in spread rate on slopes
is caused by flame attachment to the fuel bed because the
fuel is closer to the flame. A critical angle of 24° for flame
attachment to occur has been found from laboratory studies.
Observations in mountainous terrain confirm that slopes
with angles over 25° are most prone to flame attachment and
explains why observed eruptive fire behavior is prevalent on
steep slopes and canyons.
Because present knowledge of fire behavior on slopes
is mainly a result of laboratory experiments and numerical
modeling studies, there is still a large gap in understanding regarding the role of slope-scale winds on fire spread
on slopes. Numerical studies have shown that the terrain
has a more pronounced effect on fire spread on slopes than
the ambient wind. However, there are limited field data to
support these results. Therefore, there is an immediate need
for well-designed field experiments over sloped terrain to
obtain a data set for model development and validation.
Future Needs
Most measurements of fire behavior have been limited
to laboratory, wind-tunnel experiments and numerical
simulations. There are few, if any, field studies of fireatmosphere interactions in real fires (Clements et al.
2007). Therefore, to further the understanding of the
role of complex terrain on fire behavior, a major need is
to conduct comprehensive field experiments on slopes
and in mountainous areas. The data collected from these
experiments can be used to test and develop models.
Specific experiments that are needed include:
•
Slope experiments with head fires starting on flat
terrain and spreading upslope under various fuels
and ambient meteorological conditions.
•
Head fire experiments in chimneys and steep
canyons.
•
Experiments during inversion breakup on valley
floors to investigate fire behavior during transition
periods.
18
Synthesis of Knowledge of Extreme Fire Behavior: Volume I for Fire Managers
Bennett, E.; Brode, R.; Dicke, J. Eskridge, R.; Garrison,
M.; Irwin, J.; Koerber, M.; Lockhart, T.; Method, T.;
Perkins, S.; Wilson, R. 1987. On-site meteorological
program guidance for regulatory modeling applications.
EPA-450/4-87-013. Research Triangle Park: NC: U.S.
Environmental Protection Agency.
Idealized experiments are, however, limited to smaller
scales and do not account for true wildfire conditions. To
overcome this, measurements can be made by incident
meteorologists at incidents. The National Weather Service
incident meteorologist program has begun implementing the
use of radiosondes on incidents rather than pilot balloons.
Having profiles of temperature, humidity, and wind at high
temporal and spatial resolution (about 1 s, 2 m) will allow
the incident meteorologists and fire behavioral analysts to
determine changes in atmospheric stability on site. Additionally, the use of remote sensing technology should be
considered a priority. These sensors include Doppler wind
LIDAR and passive microwave temperature and humidity
profiles. Although the cost of these technologies is high, the
data would provide great insight into the mechanisms of
atmospheric dynamics on fire behavior in complex terrain.
Butler, B.W.; Forthofer, J.M.; Finney, M.A.; Bradshaw,
L.S.; Stratton, R. 2006. High resolution wind direction
and speed information for support of fire operations. In:
Aguirre-Bravo, C.; Pellicane, P.J.; Burns, D.P.; Draggan,
S., eds. Monitoring science and technology symposium:
unifying knowledge for sustainability in the Western
Hemisphere. Proc. RMRS-P-42CD. Fort Collins, CO:
U.S. Department of Agriculture, Forest Service, Rocky
Mountain Research Station: 595–602.
California Department of Forestry and Fire Protection.
2008. Hatchery Incident Investigation Report, CACSR-000068. Sacramento, CA.
Literature Cited
Atkinson, B.W. 1981. Meso-scale atmospheric circulations.
Maryland Heights, MO: Academic Press. 495 p.
Cheney, P.; Sullivan, A. 2008. Grassfires: fuel, weather,
nd
and fire behaviour. 2 ed. Collingwood, Victoria,
Australia: CSIRO Publishing. 150 p.
Baumann-Stanzer, K.; Piringer, M. 2004. Foehn signals
detected by sodar wind and turbulence measurements in
the Rhine Valley, Austria, during the MAP field phase.
Meteorology Atmospheric Physics. 85: 125–139.
Clark, T.L.; Jenkins, M.A.; Coen, J.; Packham, D. 1996.
A coupled atmosphere-fire model: role of the convective
froude number and dynamic fingering at the fireline.
International Journal of Wildland Fire. 6: 177–190.
Barry, R.G. 2008. Mountain weather and climate. 3rd ed.
Cambridge, United Kingdom: Cambridge University
Press. 506 p.
Clements, C.B. 1999. Mountain and valley winds of Lee
Vining Canyon, Sierra Nevada, California, U.S.A.
Arctic, Antarctic, and Alpine Research. 31: 293–302.
Belcher, S.E.; Finnigan J.J.; Harman, I.N. 2008. Flows
through forest canopies in complex terrain. Ecological
Applications. 18: 1436–1453.
Clements, C.B.; Whiteman, C.D.; Horel, J.D. 2003.
Cold-air-pool structure and evolution in a mountain
basin: Peter Sinks, Utah. Journal of Applied
Meteorology. 42(6): 752–768.
Blier, W. 1998. The sundowner winds of Santa Barbara,
California. Weather and Forecasting. 13: 702–716.
Brown, H. 2002. Thirtymile Fire: fire behavior and
management response. Fire Management Today.
62(3): 23–30.
19
GENERAL TECHNICAL REPORT PNW-GTR-854
Dold, J. 2010. Flow attachment in eruptive fire growth.
In: Viegas, D.X., ed. Proceedings of the VI international
conference on forest fire research. Coimbra, Portugal:
Associação para o Desenvolvimento da Aerodinâmica
Industrial (ADAI)/ Centro de Estudos sobre Incêndios
Florestais (CEIF). 10 p.
Clements, C.B.; Zhong, S. 2004. The role of the
topographic amplification factor in the breakup
of nocturnal inversions in Yosemite Valley, Sierra
Nevada. Unpublished poster presentation at the 11th
conference on mountain meteorology. Boston, MA:
American Meteorological Society. http://www.met.sjsu.
edu/~clements/Clements_Zhong_2004.pdf. (June 1,
2011).
Dold, J.W.; Zinoviev, A. 2009. Fire eruption through
intensity and spread rate interaction mediated by flow
attachment. Combustion Theory and Modelling.
13: 763–793.
Clements, C.B.; Zhong, S.; Goodrick, S.; Li, J.; Bian, X.;
Potter, B.E.; Heilman, W.E.; Charney, J.J.; Perna, R.;
Jang, M.; Lee, D.; Patel, M.; Street, S.; Aumann, G.
2007. Observing the dynamics of wildland grass fires:
fireflux—a field validation experiment. Bulletin of the
American Meteorological Society. 88(9): 1369–1382.
Doran, J.C.; Horst, T.W. l983b. Observations and
models of simple nocturnal slope flows. Journal of the
Atmospheric Sciences. 40: 708–717.
Doran, J.C.; Zhong, S. 2000. Thermally driven gap
winds into the Mexico City basin. Journal of Applied
Meteorology. 39: 1330–1340.
Clements, C.B.; Heilman, W.E. 2010. The grass fires
on slopes experiment. 14th conference on mountain
meteorology. Boston, MA: American Meteorological
Society.
Doyle, J.D.; Smith, R.B. 2003. Mountain waves over the
Hohe Tauern: influence of upstream diabatic effects.
Quarterly Journal of the Royal Meteorological Society.
129: 799–823.
Coen, J.L.; Riggan, P.J. 2010. A landscape-scale wildland
fire study using a coupled weather-wildland fire model
and airborne remote sensing. Proceedings of 3rd fire
behavior and fuels conference. [CD ROM]. Birmingham,
AL: International Association of Wildland Fire. 11 p.
Dupuy, J.L.; Maréchal J. 2011. Slope effect on laboratory
fire spread: contribution of radiation and convection to
fuel bed preheating. International Journal of Wildland
Fire. 20(2): 289–307.
Colette, A.; Chow, F.K.; Street, R.L. 2003. A numerical
study of inversion layer breakup in idealized valleys and
the effects of topographic shading. Journal of Applied
Meteorology. 42(9): 1255–1272.
Durran, D.R. 1990. Mountain waves and downslope winds.
In: Blumen, B., ed. Atmospheric processes over complex
terrain. Boston, MA: American Meteorological Society:
59–81.
Defant, F. 1949. Zur Theorie der Hangwinde, nebst
Bemerkungen zur Theorie der Berund Talwinde. Archiv
für Meteorologie Geophysik und Bioklimatologie, A:
421–450. (Translated as A theory of slope winds, along
with remarks on the theory of mountain winds and valley
winds. In: Whiteman, C.D.; Dreiseitl, E., eds. Alpine
meteorology. PNL-5141. ASCOT-84-3. Richland, WA:
Battelle, Pacific Northwest Laboratory: 95–120.)
Ekhart, E. 1944. Beiträge zur alpinen Meteorologie
[Contributions to alpine meteorology]. Meteorologische
Zeitschrift. 61(7): 217–231. In: Whiteman, C.D.;
Dreiseitl, E., eds. 1984. Alpine meteorology. PNL-5141,
ASCOT-84-3. Richland, WA: Battelle, Pacific Northwest
Laboratory: 45–72.
20
Synthesis of Knowledge of Extreme Fire Behavior: Volume I for Fire Managers
Esperanza Investigation Team. 2006. Esperanza
Fire accident investigation factual report, Riverside
County, California. http://www.fire.ca.gov/fire_
protection/downloads/esperanza_00_complete_final_
draft_05_01_2007.pdf. (12 December 2010).
Kochanski, A.; Jenkins, M.; Krueger, S.K.; McDermott,
R.; Mell, W. 2009. Capabilities of current wildfire
models when simulating topographical flow. Eos
Transactions of the American Geological Society. 90(52).
Fall Meet. Suppl., A41G-05.
Forthofer, J.M. 2007. Modeling wind in complex terrain
for use in fire spread prediction. Fort Collins, CO:
Colorado State University. M.S. thesis.
Linn, R.; Reisner, J.; Colman, J.J.; Winterkamp, J.
2002. Studying wildfire behavior using FIRETEC.
International Journal of Wildland Fire. 11: 233–246.
Fosberg, M.A.; Schroeder, M.J. 1966. Marine air
penetration in central California. Journal of Applied
Meterology. 5: 573–589.
Linn, R.R.; Cunningham, P. 2005. Numerical simulations
of grass fires using a coupled atmosphere-fire model:
basic fire behavior and dependence on wind speed.
Journal of Geophysical Research. 110(D13), D13107.
DOI: 10.1029/2004JD005597.
Gaberšek, S.; Durran, D.R. 2004. Gap flows through
idealized topography. Part I: Forcing by large-scale
winds in the non-rotating limit. Journal of Atmospheric
Sciences. 61: 2846–2862.
Linn, R.R.; Winterkamp, J.L.; Edminster, C.;
Colman, J.J.; Smith, W.S. 2007. Coupled influences
of topography and wind on wildland fire behaviour.
International Journal of Wildland Fire. 16: 183–195.
Hill, C.D. 1980. The effects of terrain distribution on
summer thunderstorm activity at Reno, Nevada. Tech.
Memo. NWS-WR-156. Reno, NV: National Oceanic and
Atmospheric Administration. 34 p.
Linn, R.R.; Winterkamp, J.L.; Weise, D.R.; Edminster,
C. 2010. A numerical study of slope and fuel structure
effects on coupled wildfire behaviour. International
Journal of Wildland Fire. 19: 179–201.
Horst, T.W.; Doran, J.C. 1986. Nocturnal drainage flow
on simple slopes. Boundary-Layer Meteorology.
34: 263–286.
Mahrt, L. 1982. Momentum balance of gravity flows.
Journal of Atmospheric Sciences. 39: 2701–2711.
Huang, C.; Lin, Y.L.; Kaplan, M.L.; Charney, J.J. 2009.
Synoptic-scale and mesoscale environments conductive
to forest fires during the October 2003 extreme fire event
in southern California. Journal of Applied Meteorology
and Climatology. 48: 553–579.
Manins, P.C.; Sawford, B.L. 1979. Katabatic winds:
a field case study. Quarterly Journal of the Royal
Meteorological Society. 105: 1011–1025.
Maranghides, A.; Mell, W. 2009. A case study of a
community affected by the Witch and Guejito Fires.
Tech. Note 1635. Gaithersburg, MD: National Institute
of Standards and Technology. 59 p.
Hughes, M.; Hall, A. 2009. Local and synoptic
mechanisms causing southern California's Santa Ana
winds. Climate Dynamics. 34: 847–857.
Meybeck, M.; Green, P.; Vörösmarty, C. 2001. A
new typology for mountains and other relief classes.
Mountain Research and Development. 21(1): 34–45.
Kingsmill, D. 2000. Diurnally driven summertime winds
in the lee of the Sierra: The Washoe zephyr. Preprints,
Ninth conference on mountain meteorology. Boston,
MA: American Meteorological Society: 109–112.
Papadopoulos, K.H.; Helmise, C.G. 1999. Evening and
morning transition of katabatic flows. Boundary-Layer
Meteorology. 92: 195–227.
21
GENERAL TECHNICAL REPORT PNW-GTR-854
Porch, W.M.; Clements, W.E.; Coulter, R.L. 1991.
Nighttime valley waves. Journal of Applied Meteorology.
30: 145–156.
Sharples, J.J. 2009. An overview of mountain
meteorological effects relevant to fire behaviour and
bushfire risk. International Journal of Wildland Fire.
18(7): 737–754.
Raphael, M.N. 2003. The Santa Ana winds of California.
Earth Interactions. 7: 1–13.
Sharples, J.; Gill, A.M.; Dold, J.W. 2010a. The trench
effect and eruptive wildfires: lessons from the King's
Cross Underground disaster. Proceedings of Australian
Fire and Emergency Service Authorities Council 2010
conference, Darwin, Australia. http://www.maths.
manchester.ac.uk/~jwd/articles/10-TEaEW.pdf.
(May 13, 2011).
Reuten, C.; Steyn, D.; Strawbridge, K.; Bovis, P. 2005.
Observations of the relation between upslope flows
and the convective boundary layer in steep terrain.
Boundary-Layer Meteorology. 116: 37–61.
Ruscha, C.P., Jr. 1976. Forecasting the mono wind. Tech.
Memo. WR-105. National Oceanic and Atmospheric
Administration.
Sharples, J.J.; Mills, G.A.; McRae, R.H.D.; Weber,
R.O. 2010b. Foehn-like winds and elevated fire danger
conditions in southeastern Australia. Journal of Applied
Meteorology and Climatology. 49: 1067–1095.
Ryan, G. 1994. Climate of Santa Barbara, California. Tech.
Memo. NWS WR-225. U.S. Department of Commerce,
National Oceanic and Atmospheric Administration. 86 p.
[Available from National Technical Information Service,
U.S. Department of Commerce, Sills Building, 5285 Port
Royal Rd., Springfield, VA 22161.]
Sun, R.; Krueger, S.K.; Jenkins, M.; Zulauf, A.;
Charney, J.J. 2009. The importance of fire–atmosphere
coupling and boundary-layer turbulence to wildfire
spread. International Journal of Wildland Fire. 8: 50–60.
Rotach, M.W.; Calanca, P.; Graziani, G.; Gurtz, J.;
Steyn, D.G.; Vogt, R.; Andretta, M.; Christen,
A.; Cieslik, S.; Connolly, R.; De Wekker, S.F.J.;
Galmarini, S.; Kadygrov, E.N.; Kadygrov, V.; Miller,
E.; Neininger, B.; Rucker, M.; van Gorsel, E.; Weber,
H.; Weiss, A.; Zappa, M. 2004. Turbulence structure
and exchange processes in an Alpine Valley: the Riviera
Project. Bulletin of the American Meteorological
Society. 85(9): 1367–1385.
Taylor, S.W.; Wotton, B.M.; Alexander, M.E.;
Dalrymple, G.N. 2004. Variation in wind and crown
fire behavior in a northern jack pine-black spruce forest.
Canadian Journal of Forest Research. 34: 1561–1576.
Vergeiner, I.; Dreiseitl, E. 1987. Valley winds and
slope winds-observations and elementary thoughts.
Meterology and Atmospheric Physics. 36: 264–286.
Viegas, D.X. 2005. A mathematical model for forest fire
blow-up. Combustion Science and Technology. 177: 1–25.
Santoni, P.A.; Balbi, J.H.; Dupuy, J.L. 1999. Dynamic
modeling of upslope fire growth. International Journal
of Wildland Fire. 9(4): 285–292.
Viegas, D.X.; Pita, L.P. 2004. Fire spread in canyons.
International Journal of Wildland Fire. 13: 253–274.
Schmidli, J.; Rotunno, R. 2010. Mechanisms of alongvalley winds and heat exchange over mountainous
terrain. Journal of Atmospheric Sciences. 67: 3033–3047.
Viegas, D.X.; Simeoni, A. 2010. Eruptive behaviour of
forest fires. Fire Technology. 47(2): 303.
Seto, D.; Clements, C.B. [In press]. Fire whirl evolution
observed during a valley wind-sea breeze reversal.
Journal of Combustion.
22
Synthesis of Knowledge of Extreme Fire Behavior: Volume I for Fire Managers
Wagner, A. 1938. Theorie und Beobachtungen der
periodschen Gebirgswinde. Gerlands Beiträge zur
Geophysik, 52: 408–449 (Translated as Theory and
observation of periodic mountain winds. In: Whiteman,
C.D.; Dreiseitl, E., eds. 1984. Alpine meteorology. PNL5141. ASCOT-84-3. Richland, WA, Battelle, Pacific
Northwest Laboratory: 11–44.)
Whiteman, C.D. 1990. Observations of thermally
developed wind systems in mountainous terrain.
Atmospheric processes over complex terrain.
Meteorology Monographs No. 45. Boston, MA:
American Meteorological Society: 5–42.
Whiteman, C.D. 2000. Mountain meteorology:
fundamentals and applications. New York: Oxford
University Press. 355 p.
Weigel, A.P.; Chow, F.K.; Rotach, M.W. 2007. On the
nature of turbulent kinetic energy in a steep and narrow
alpine valley. Boundary-Layer Meteorology.
123: 177–199.
Whiteman, C.D.; Pospichal, B.; Eisenbach, S.; Weihs, P.;
Clements, C.B.; Steinacker, R.; Mursch-Radlgruber,
E.; Dorninger, M. 2004. Inversion breakup in small
Weise, D.R.; Biging, G.S. 1996. Effects of wind velocity
and slope on flame properties. Canadian Journal of
Forest Research. 26(10): 1849–1858.
Rocky Mountain and Alpine basins. Journal of Applied
Meteorology. 43(8): 1069–1082.
Wu, Y.; Xing, H.J.; Atkinson, G. 2000. Interaction of
fire plume with inclined surface. Fire Safety Journal.
35: 391–403.
Weise, D.R.; Biging, G.S. 1997. A qualitative comparison
of fire spread models incorporating wind and slope
effects. Forest Science. 43(2): 170–180.
Zangl, G. 2003. Orographic gravity waves close to the
nonhydrostratic limit of vertical propagation. Journal
of Atmospheric Science. 60: 2045–2063.
Whiteman, C.D.; McKee, T.B. 1982. Breakup of
temperature inversions in deep mountain valleys. Part II.
Thermodynamic model. Journal of Applied Meteorology.
Zhong, S.; Li, J.; Clements, C.B.; DeWekker, S.; Bian,
X. 2008a. Forcing mechanisms for Washoe zephyr:
a daytime downslope wind system in the lee of the
Sierra Nevada. Journal of Applied Meteorology and
Climatology. 47: 339–350.
21: 290–302.
Whiteman, C.D.; Zhong, S. 2008. Downslope flows on
a low-angle slope and their interactions with valley
inversions. Part I. Observations. Journal of Applied
Meteorology and Climatology. 47: 2023–2038.
Zhong, S.; Li, J.; Whiteman, C.D.; Bian, X.; Yao, W.
2008b. Climate of high wind events in the Owens Valley,
California. Monthly Weather Review. 136: 3536–3552.
Whiteman, C.D. 1982. Breakup of temperature inversions
in deep mountain valleys: Part I. Observations. Journal
of Applied Meteorology. 21: 270–289.
23
GENERAL TECHNICAL REPORT PNW-GTR-841
This page was intentionally left blank.
ii
Synthesis of Knowledge of Extreme Fire Behavior: Volume I for Fire Managers
Chapter 3: Critical Fire Weather Patterns
Paul A. Werth1
Introduction
Critical Fire Weather Patterns are
defined as the atmospheric conditions
that encourage extreme fire behavior
resulting in large and destructive wildland fires.
Eyewitness accounts in journals and diaries have
documented the relationship between weather and large
wildland fire for hundreds of years. Survivor statements
after the 1871 Chicago, Peshtigo, and Michigan Fires,
and the 1894 Hinckley Fire identified hot, dry, and windy
conditions as the primary weather elements contributing to
the destruction caused by these fires.
In the early 1900s, technological advances in
meteorology permitted creditable scientific research into
weather’s influence on wildland fire, most of which was
closely tied to the study of historical wildland fires.
Even then it was recognized that there are short
periods of one or several days in every fire season when
wildland fuels are unusually susceptible to large fire, and
this was primarily dependent upon the weather. Show
(1931) referred to these as “dangerous periods.”
However, it was not until the 1960s that critical fire
weather patterns, producing high fire danger and large
wildland fires, were identified for both the United States
and Canada.
Syverson (1962) documented the first definition of
“critical fire weather patterns” as follows:
Crisis period is defined as the critical day, week
or month during which blow-up fires are experienced.
Further, we might conclude that the period of critical
fire weather is the result of that combination of weather
patterns that have given rise to this condition and might
further result in causing more fires or materially assist
their spread.
Current fire behavior training courses define critical
fire weather patterns as: the atmospheric conditions that
encourage extreme fire behavior resulting in large and
destructive wildland fires.
Understanding weather’s influence on wildland fire is
essential for safe and effective fire suppression activities.
Fire managers and firefighters should be aware of critical
fire weather patterns in their areas and how adverse weather
associated with those patterns can produce extreme fire
behavior conditions that put firefighters and the general
public at risk.
Weather Elements That Promote Extreme
Fire Behavior
Early fire weather research focused on individual weather
elements that occurred prior to and during large wildland
fires. The culmination of these studies identified four
critical weather elements common to wildland fires exhibiting extreme fire behavior: low relative humidity (or low
The four critical weather elements
common to wildland fires exhibiting
extreme fire behavior are low relative
humidity, strong surface wind, unstable
air, and drought.
atmospheric moisture), strong surface wind, unstable air,
and drought.
Munns (1921) found that “In months with high vapor
pressure (high relative humidity), very few fires occurred,
1
Paul A. Werth, Weather Research and Consulting Services,
LLC, Battle Ground, WA.
25
GENERAL TECHNICAL REPORT PNW-GTR-854
while during months of low vapor pressure (low relative
humidity) many bad fires occurred.” Separate studies by
Hofmann (1923) in Washington and Weidman (1923) in
Montana and Idaho concluded that relative humidity is the
most important factor in development of dangerous forest
fires because it significantly increases the flammability of
forest material. In a study of southern Appalachian wildfires, McCarthy (1924) found that relative humidity was
unusually low on high fire risk days, and that this dry air
was advected southward by winds from the interior of the
continent. His study was also the first to connect the occurrence of low relative humidity to specific wind directions,
and the warming and drying of air within high pressure
systems owing to subsidence. A study of Massachusetts forest fires by Stickel (1928) stated, “Relative humidity appears
to be the best single indication of forest fire hazard.” He also
indicated that “The maximum forest fire hazard occurred
between rainy periods, when the relative humidity is 40 percent or less.” Dague (1930) identified relative humidity of 20
percent as the point below which bad fire weather situations
were created east of the Cascade Mountains in Washington
and Oregon. Since that time, numerous wildland fire reports
have substantiated the importance of unusually low relative humidity in the development of extreme fire behavior.
Regional threshold values for low relative humidity can
range between 10 and 40 percent, depending on fuel model.
Low relative humidity (low atmospheric moisture)
adversely affects fire behavior by decreasing the moisture
content of fine dead fuels, making them easier to ignite and
carry fire. Fire line intensity (kW/m), rate of spread (m/s),
and the probability of spotting significantly increase when
the relative humidity is low, sometimes so rapidly that there
is little advance warning.
The relationship between strong surface wind and
large fires exhibiting extreme fire behavior has been well
documented for hundreds of years. The first scientific
research connecting the two was conducted by Beals (1914).
He researched surface atmospheric pressure patterns and
associated weather conditions during four large fires (1881
Michigan, 1884 Hinckley, 1902 Columbia, and the 1910
Great Idaho) and found that “The one striking feature of all
large forest fires is the strong winds that prevail just before,
during, and for a short period after the fire passes a given
place.”
Subsequent fire weather research (Anderson 1968;
Brotak 1979; Countryman et al. 1956; Dague 1930, 1934;
Gisborne 1927; Goens and Andrews 1998; Hoenisch 2009;
Hughs and Hall 2009; Jemison 1932; Joy 1923; Kauffman 1937; Krumm 1954; Schaefer 1957; Simard et al.
1983; USDA, USDI, and USDC 1994) has documented
strong cold front, thunderstorm, and foehn winds with the
occurrence of extreme fire behavior conditions. (Note: For
more information concerning foehn winds, see chapter 2.)
Wind affects wildland fire in a number of ways. It supplies
additional oxygen to the fire, increasing fire intensity. It
also preheats the fuels ahead of the fire and increases rate
of spread by carrying heat and burning embers to new fuels
(spotting).
Until the U.S. Weather Bureau established a national
network of radiosonde stations, fire weather research was
limited to studying only the effects of surface weather on
fire behavior. With the advent of radiosonde data, researchers were also able to investigate the influence of upper air
temperature, relative humidity, and wind on wildland fire
behavior. The concept of airmass stability was discovered
through the analysis of vertical temperature profiles. When
temperature decreases rapidly with height, the atmosphere
is classified as unstable. If there is an increase, or only a
slight decrease in temperature with height, the atmosphere
is classified as stable. Crosby (1949) was the first to study
the effect of atmospheric stability on fire behavior. He concluded that stable air dampened convection currents over a
fire, whereas unstable air increased the speed and depth of
the convection currents. Brown (1950) stated that the stability of the air at the location of a fire is as important to fire
behavior as temperature and humidity. Byram (1954) and
Byram and Nelson (1951) studied 17 severe fires around the
county and identified unstable air and certain vertical wind
profiles as being favorable for extreme fire behavior. Davis
(1969) investigated 70 fires in the Southeastern United
26
Synthesis of Knowledge of Extreme Fire Behavior: Volume I for Fire Managers
States and found that instability increases the chance of a
big fire more often than low relative humidity. Haines (1988)
developed a lower atmosphere severity index based on the
stability and moisture content of the lower atmosphere. The
drier and more unstable the airmass becomes, the higher the
Haines Index, and the greater the threat of large wildland
fire and extreme fire behavior. Brotak (1992–1993) found
that in the Eastern United States, strong surface wind in
conjunction with low fuel moisture caused more firecontrol problems than unstable air. Werth and Ochoa
(1990), Saltenberger and Barker (1993), and Goens and
Andrews (1998) found good correlation between the
Haines Index and extreme fire behavior on fires in Idaho,
central Oregon, and Arizona.
In summary, unstable air amplifies the vertical growth
of the smoke plume over a fire by enhancing the strength
of the updrafts. This increases combustion rates by supplying more oxygen to the fire. As the height and strength of
the smoke plume increases, the potential for gusty surface
winds, dust devils, and fire whirls also increases. Spotting
may become profuse all around the fire as large firebrands
are lifted in the smoke plume. (Note: For more information
concerning the effects of atmospheric stability on extreme
fire behavior, see chapters 5 through 7.) Unstable air also
increases the probability of thunderstorms and strong
downdraft winds.
Beals (1916) defined drought as “Long-continued dry
weather, especially so long continued as to cause vegetation
to wither.” Beals also stated that while “Drought and periods of hot weather contribute to the fire hazard, these alone
do not necessarily portend the occurrence of a great fire,
as without wind an incipient fire would spread slowly.” He
recognized that drought and hot weather do not necessarily
result in large fires, but a critical weather element, such as
strong wind, is also needed to produce a large fire. Today
drought is defined as a period of relatively long duration
with substantially below-normal precipitation, usually
occurring over a large area. Drought affects fuel availability by lowering the moisture content of both live and dead
fuels, making them more combustible. Drought conditions
Figure 3-1—Surface pressure map 01 September 1894 at 0800
Central Standard Time. (Adapted from Beals 1914.)
are NOT a prerequisite for large fires, but there is a close
relationship between drought conditions, large wildland
fires, and extreme fire behavior when low relative humidity
and either strong wind or unstable air are present.
Critical Fire Weather Patterns
Critical fire weather patterns occur when atmospheric
conditions combine to significantly increase the threat of
destructive wildland fires that exhibit extreme fire behavior.
Fire weather research has identified adverse atmospheric
conditions as strong wind, unusually low relative humidity,
and unstable air. Drought is also included as a significant
factor, but is the result of a lack of precipitation over a
period of weeks, months, or even years.
Beals (1914) researched the September 1, 1894, Minnesota Hinkley Fire in which 418 people perished. He was
a pioneer in studying synoptic weather maps depicting
pressure, temperature, and wind patterns associated with
large fires. On the Hinkley Fire, the weather map (fig. 3-1)
showed a surface low pressure center in North Dakota and
tightly packed isobars favoring strong wind in Minnesota. It
should be noted that his map does not depict cold and warm
fronts because frontal theory was not introduced until 1917
by Norwegian meteorologists Vilhelm and Jacob Bjerknes.
Show (1931) was the first to document weather being
largely responsible for dangerous fire conditions when he
27
GENERAL TECHNICAL REPORT PNW-GTR-854
wrote, “It was generally recognized that occasionally in
every fire season there occurred short periods of one or
several days when the forest cover was unusually flammable
and at times seemed almost explosive.” He concluded,
“Abnormal weather conditions were responsible for these
periods.”
The relationship between synoptic weather patterns and
high fire danger was further advanced by Schroeder (1950).
He noted that for the Great Lake States in May, “Nearly all
of the critical periods were associated with an area of high
pressure which developed near the western shore of Hudson
Bay and subsequently moved either southward or southeastward.”
An early definition of a critical fire weather pattern
was provided by Syverson (1962) when he described it as a
“crisis period.” He stated, “A crisis period is defined as: the
critical day, week or month during which blow-up fires are
experienced.”
Syverson (1963) expanded his concept of a crisis period
in an investigation of synoptic fire weather types of the
Northern Intermountain, Northern Rockies, and the Northwestern Plains regions. He selected synoptic weather types
(upper air 500 hPa and surface) that contributed to high fire
potential or large forest fires. The 500 hPa upper air patterns were divided into meridional, zonal, short-wave train,
and high-low block categories. The surface patterns were
classified according to the origin of the surface anticyclones
(high pressure) affecting the area. Syverson concluded,
“The greatest danger occurs just ahead of the upper trough
in the area of the low pressure at the surface.”
The most complete research of critical fire weather patterns was published by Schroeder et al. (1964) in Synoptic
Weather Types Associated With Critical Fire Weather. This
study covered all the Lower 48 States and determined:
“Periods of critical fire weather are associated with relatively few synoptic weather patterns.” They concluded that
east of the Rocky Mountains, most critical fire weather
patterns are associated with the periphery of high-pressure
areas, particularly in the prefrontal and postfrontal areas.
Along the eastern slopes of the Rocky Mountains, weather
patterns producing Chinook winds are the most important.
In the intermountain West, critical fire weather is associated
with upper troughs and overhead jet streams, or surface dry
cold front passages. Along the Pacific Coast, from Washington to California, weather patterns producing offshore flow
or foehn wind are the most important.
Brotak and Reifsynder (1977b) detailed the relationship
of Central and Eastern U.S. wildland fires with surface
frontal systems and upper level troughs and ridges. They
found that just prior to and after passage of cold fronts (fig.
Figure 3-2—Idealized surface map showing all fire runs. CFA =
following cold frontal passage; CFB = preceding cold frontal
passage; WSL = warm sector of low; and WS = warm sector of
high. Source: Brotak and Reifsnyder 1977b.
Figure 3-3—Idealized 500 hPa geopotential height map showing
all fire runs. CFA = following cold frontal passage; CFB = preceding cold frontal passage; WSL = warm sector of low; and WS =
warm sector of high. Source: Brotak and Reifsnyder 1977b.
28
Synthesis of Knowledge of Extreme Fire Behavior: Volume I for Fire Managers
East of the Rocky Mountains, most
critical fire weather patterns are
associated with the periphery of
high-pressure areas, particularly in
the prefrontal and postfrontal areas.
Along the eastern slopes of the Rocky
Mountains, weather patterns producing Chinook winds are the most
important. In the intermountain West,
critical fire weather is associated
with upper troughs and overhead jet
streams, or surface dry cold front passages. Along the Pacific Coast, from
Washington to California, weather
patterns producing foehn wind are the
most important.
Figure 3-4—Life cycle stages of an upper level ridge.
3. Final breakdown, accompanied by a period of
severe burning conditions, strong winds, and
lightning followed by cooling and a reduction in
fire danger.
In summary, these studies indicate that most periods
of critical fire weather occur in transition zones between
high- and low-pressure systems, both at the surface and in
the upper air. The surface pressure patterns of most concern
are those associated with cold fronts and terrain-induced
foehn winds. Cold front passages are important to firefighters because of strong, shifting winds and unstable air that
can enhance the smoke column or produce thunderstorms.
Foehn winds occur on the lee side of mountain ranges and
are typically very strong, often occurring suddenly with
drastic warming and drying. The area between the upper
ridge and upper trough has the most critical upper air
pattern because of unstable air and strong winds aloft that
descend to ground level.
3-2) were favored times for large fire growth to occur. At
500 hPa, the favored area was between the upper ridge and
trough axis (fig. 3-3).
Nimchuk (1983) documented the relationship between
the breakdown of a blocking upper level ridge and severe
fire behavior conditions in western Canada. He concluded
that the trigger for extreme fire behavior was the breakdown
of the upper ridge, rather than the presence of a persistent
upper ridge. His statements concerning the fire behavior
associated with the three stages in the life cycle of an upper
ridge are of particular interest (fig. 3-4).
1. An establishment period characterized by warm,
dry stable conditions, low humidity, light wind,
rapidly decreasing fuel moisture, and low lightning risk.
Regional Critical Fire Weather Patterns
The following section will briefly describe critical fire
weather patterns by region and season. Critical fire weather
patterns can be separated into two primary categories:
2. Initial weakening of upper level disturbances,
leading to decreased atmospheric stability and
increased lightning activity, but little or no cooling
or reduction in fire danger.
•
•
29
Those that produce strong surface wind.
Those that produce atmospheric instability.
GENERAL TECHNICAL REPORT PNW-GTR-854
In both cases, an unusually dry airmass, for the region
and season, must also occur. Strong wind with high relative humidity is not a critical fire weather situation nor is
unstable air combined with high relative humidity.
When critical fire weather patterns occur during
periods of drought, the threat of extreme fire behavior significantly increases in brush and timber fuels. However, in
grass fuels, some of the worst fire behavior has occurred in
moist periods owing to increased fuel loadings. The key to
identifying a critical fire weather pattern is the recognition
that these patterns must also produce unusually low relative
humidity for the region, along with strong surface wind or
unstable air.
Northern Plains, Great Lakes, and the
Northeastern United States
Figure 3-5—1400 Eastern Daylight Time surface weather map.
Source: Brotak 1979.
The fire season in this region primarily occurs before greenup in the spring and after leaf drop in the fall. The spring
season can start as early as March in the Northern Plains
and the Ohio River Valley and as late as April in the Great
Lakes and Northeast States. The fall season can last through
November.
Critical fire weather patterns in this part of the country
are identified by the source of surface high-pressure areas
before or after the passage of cold fronts. That is because
the source of these high-pressure areas determines the moisture content of the airmass and whether passing cold fronts
will be wet or dry. There are three surface high-pressure
types that can produce critical fire weather and extreme fire
behavior in this region.
movement over warmer land. Critical fire weather occurs on
the periphery of the high, especially the north and northwest
sides. This type occurs during the spring and fall.
Hudson Bay High—
This is similar to the Northwest Canadian High. The most
critical fire weather is on the northwest side of the high.
However, dry cold fronts can produce extreme fire behavior,
both before and after frontal passage. Schroeder (1950)
indentified the Hudson Bay High as the principal weather
type associated with periods of very high fire danger for the
Great Lakes States.
Brotak (1979) analyzed the weather and fire behavior
conditions during the July 22, 1977, Bass River Fire in New
Jersey. The fire claimed the lives of four firefighters when
flames overran their position. Drought, strong wind, unusually low relative humidity, and extreme instability contributed
Pacific High—
This high pressure originates over the Pacific Ocean
and loses much of its moisture as it crosses the Rocky
Mountains. It moves into the Northern Plains and Great
Lakes States with a dry continental airmass. This is the
most common type and shows little preference for any
particular month.
to the extreme fire behavior experienced during the fire.
The extreme fire behavior occurred after the passage of a
cold front and in the southeast quadrant of a Hudson Bay
high-pressure area (fig. 3-5). The 500 hPa (fig. 3-6) shows
an upper level trough over New Jersey and a northwesterly
flow of subsiding air in the leading edge of high pressure
over the Great Lakes.
Northwest Canadian High—
This high pressure is normally warm and dry owing to
its source region, subsidence warming, and southward
30
Synthesis of Knowledge of Extreme Fire Behavior: Volume I for Fire Managers
Figure 3-6—0800 Eastern Daylight Time, 500 hPa geopotential
height map. Source: Brotak 1979.
Figure 3-7—Cold frontal positions during the Mack Lake Fire.
Source: Simard et al. 1983.
Simard et al. (1983) researched the weather, topography,
fuels, and fire behavior of the May 5, 1980, Mack Lake Fire
in Michigan. They concluded that the extreme fire behavior
observed on the Mack Lake Fire occurred as follows:
“Ahead of the weak cold front (fig. 3-7), relative
humidity was low at 24 percent, and the temperature was unseasonably high at 26.7 °C (80 °F). Wind
speed (at the Mio weather station) increased
significantly to 24 km/h (15 mi/h), gusting to 40
km/h (25 mi/h) plus as the front approached.” This
is a classic prefrontal critical fire weather pattern
during the spring months for the Great Lakes States.
Southeast is typically during the spring and fall. However,
wildland fires do occur at other times of the year. The
spring fire season occurs in the weeks before green-up. This
usually begins during March near the Carolina and Georgia
coast and the Gulf States. The fall fire season occurs in
October and November, normally after the first frost.
Oklahoma and Texas are typically dry in late winter, and
large grass fires are not uncommon in February. The Florida
season may extend through the winter and spring well into
June, especially during periods of drought. Critical fire
weather patterns in this region are those that produce low
relative humidity, and either strong surface wind or unstable
air.
McCarthy (1923), in a study of fire weather in the
southern Appalachian Mountains, observed, “Low vapor
pressure (related to low dew point and low relative humidity) usually accompanies high atmospheric pressure and
seems to be induced by prevailing wind from the west or
northwesterly directions, while south or easterly winds tend
to increase the humidity.”
McCarthy (1924) further stated, “Winds, coming from
the interior of the continent and warming as they move
southward, are usually low in humidity, a condition which
is increased by the downward convection of cold air in
The August 25, 1995, Sunrise Fire on Long Island,
New York, is another example of a fire that burned during
a postfrontal critical fire weather pattern, with north winds
and a relative humidity of less than 20 percent reported.
It burned approximately 2833 ha (7,000 ac) and damaged
numerous homes and small businesses.
Southeastern United States
The Southeastern United States encompasses an area from
eastern Oklahoma and eastern Texas, eastward across the
lower Mississippi Valley and the Gulf States, to the Atlantic
coast from North Carolina to Florida. Fire season in the
31
GENERAL TECHNICAL REPORT PNW-GTR-854
system settles over the region. Weak fronts from the north
may reinforce the dry airmass. Relative humidity may not
be quite as low as with Pacific fronts, and better humidity
recovery can be expected at night. Strong northwest to north
winds often occur as the surface high pressure pushes into
the Southeast.
the high pressure zone which warms as it approaches the
surface.”
Williams and Smith (1962) documented the weather
and fire behavior associated with the March 1953 Brasstown
Fire in South Carolina. They determined that the fire’s large
growth and extreme fire behavior occurred after the passage
of a cold front when northwesterly winds brought dry air
from Canada and the Great Lakes.
Early fire case studies concluded that high fire activity in the Southeast is more often associated with surface
high-pressure systems that originate in Canada or those that
move across the Rocky Mountains from the Pacific Ocean.
The important characteristic of these high-pressure systems
is the dry air that replaces the moist Gulf of Mexico or
Atlantic Ocean airmass, which normally covers this part of
the country.
The movement of surface high-pressure systems is
dependent upon the upper level windflow. For that reason,
it is difficult to discuss critical fire weather patterns without
linking the surface features to upper level pressure patterns.
Three upper level patterns are effective in keeping the
Southeast under the influence of high pressure at the surface. If the antecedent conditions of below normal rainfall
are in place, a critical fire weather pattern emerges.
Blocking ridge aloft—
This pattern occurs when high pressure aloft persists near
the Atlantic coast for an extended period of time, possibly
for a few weeks. Weather systems from the west or north
are blocked from moving through the region. Little or no
rainfall is produced during the period that the upper level
ridge is in place.
In addition to the upper level patterns, extreme fire
behavior can also occur in advance of a tropical storm
owing to subsidence-produced dry air and a strong wind
area that extends beyond the cloud and rain shield.
Critical fire weather patterns should be carefully examined for the presence of strong low-level jets (i.e., reverse
wind profile). Research conducted by Byram (1954) showed
a strong connection between low-level jets and extreme
fire behavior in the Southeast. (Note: For more information
concerning low-level jets and adverse wind profiles, see
chapter 5.)
The combination of extreme drought and critical fire
weather patterns were major factors in the severe 1998
Florida wildland fire season. Fires in the northern and
central portions of the state experienced major fire runs on
July 4, driven by strong westerly winds and unusually low
relative humidity of 30 percent or less (fig. 3-8). The source
of the dry air was the Great Plains, which was pushed into
Florida by a northwesterly upper level windflow (fig. 3-9).
Strong westerly flow—
During the spring and fall, strong westerly winds aloft
result in a rapid succession of Pacific fronts traversing the
Southeast. Little, if any, moisture from the Gulf of Mexico
is able to return to the region in advance of these cold fronts.
Rainfall with the front is sparse and light. Exceptionally low
relative humidity may occur the day after frontal passage,
and little recovery can be expected before the next front
arrives. Strong and gusty winds are a distinct possibility.
Southwestern United States
Northwesterly flow—
Dry air, associated with Canadian high-pressure systems,
can spread across the Southeast during the spring and fall.
The initial Canadian cold front moves through the Southeast
and remains stationary far south of the region until the upper
level pattern changes. A large and stagnant high-pressure
The Southwestern region includes the states of Arizona,
New Mexico, and west Texas. The normal fire season spans
the months of May to October but can extend throughout
the year in the grasslands of eastern New Mexico and
western Texas.
32
Synthesis of Knowledge of Extreme Fire Behavior: Volume I for Fire Managers
Crimmins (2005) examined the seasonal climatology
of extreme fire weather conditions across Arizona and New
Mexico during the period 1988–2003. He found that there
are three key upper level patterns associated with over 80
percent of the extreme fire-weather days identified in this
study. These upper level patterns represent broad southwesterly flow and large geopotential height gradients and are
very similar to the critical fire weather patterns identified by
Schroeder et al. (1964). All three of these upper level patterns are consistent with the “breakdown of the upper level
ridge” critical fire weather pattern defined earlier.
The major critical fire weather patterns of the Southwest are listed below.
Breakdown of Upper Ridge—
This is the most prevalent pattern in the Southwest, as a
mean 500 hPa ridge is frequently positioned over the area
during the fire season. From late spring through the early
summer, upper level troughs moving inland from the Pacific Ocean are strong enough to temporarily push the upper
ridge east and south of the area. These upper troughs are
Figure 3-8–Visible satellite picture 2132 Coordinated Universal
Time 01 July 1998 shows strong, dry westerly wind pushing
smoke columns from central Florida wildfires out over the Atlantic Ocean. Source: National Oceanic and Atmospheric Administration and University Corporation for Atmospheric Research.
Figure 3-9–500 hPa geopotential height
map indicating northwesterly flow aloft
over Florida. (National Oceanic and
Atmospheric Administration National
Centers for Environmental Prediction/
National Center for Atmospheric
Research reanalysis.)
33
GENERAL TECHNICAL REPORT PNW-GTR-854
manifest at the surface as dry, cold fronts, which produce
strong winds, very low relative humidity, and isolated dry
lightning. The airmass becomes unstable as the upper level
trough approaches, resulting in moderate to high Haines
Index values. Strong upper level winds will frequently mix
down to the surface, producing winds of 64 to 80 km/h (40
to 50 mi/h). The peak fire season ends when these upper
troughs stay well to the north and the southwest monsoon
becomes fully developed.
Early Stage Monsoon—
The onset of the southwest monsoon can present an opportunity for extreme fire behavior owing to the combination
of gusty wind, low relative humidity, and dry lightninginduced fire starts. As the mean 500 hPa ridge builds north
in June and early July, moisture begins to increase at mid
levels while surface conditions remain hot and dry. The
speed and strength at which the monsoon develops determines the severity of this pattern. If the monsoon starts
slowly, there may be enough dry lightning to overwhelm
local fire management resources. If it develops quickly, dry
storms will rapidly become rain producers and effectively
end the fire season. When surface dew points rise to 10 to
15 °C (50 to 59 °F), the majority of storms will be wet.
Lee surface trough/dryline—
This pattern occurs in eastern New Mexico and western
Texas in advance of an approaching upper level trough.
Well ahead of the upper trough, a north-south dryline
develops in the surface pressure pattern that sharply divides
moist air to the east and dry air to the west. The passage
of a dryline is similar to that of a dry cold front. Strong,
gusty southwest winds develop and surface dewpoint
temperatures drop from 10 to 20 °C (50 to 69 °F) to -5 to -10
°C (13 to 19 °F). This results in very low relative humidity
and rapidly drying fuels. Dry, windy conditions behind a
dryline can last for hours until the trailing cold front moves
through with much cooler temperatures, higher relative
humidity, and decreasing west to northwest winds.
The May 7, 2000, Cerro Grande Fire in New Mexico
exhibited extreme fire behavior owing to a critical fire
Figure 3-10—07 May 2000, 500 hPa geopotenital height map.
(National Oceanic and Atmospheric Administration National
Centers for Environmental Prediction/National Center for
Atmospheric Research reanalysis.).
weather pattern known as “the breakdown of the upper level
ridge.” A strong upper level trough (fig. 3-10) was moving
into Arizona and New Mexico, pushing a ridge that had
been over the area into Texas and Oklahoma. Strong southwest surface winds (fig. 3-11) were experienced on the fire
with gusts up to 120 km/h (75 mi/h). Drought conditions
and extremely low relative humidity also contributed to
the extreme fire behavior. The final size of the fire was
20 234 ha (50,000 acres) and 235 homes were burned.
Rocky Mountain and Intermountain Regions
These two regions cover much of the interior Western
United States. The Rocky Mountain region includes the
states of Montana, Wyoming, Colorado, and northern Idaho.
The Intermountain region comprises the states of Nevada,
Utah, and southern Idaho. The fire season ranges from May
through October in the southern and June through October
in the northern portions of these regions. However, in the
grasslands of eastern Colorado, eastern Wyoming, and
eastern Montana, it may start as early as February or March
prior to green-up.
34
Synthesis of Knowledge of Extreme Fire Behavior: Volume I for Fire Managers
Figure 3-11—07 May 2000 visible satellite picture showing well-defined smoke plume driven by strong southwest
winds. (National Oceanic and Atmospheric Administration, National Weather Service.)
A considerable amount of fire weather research has
been conducted in these regions, beginning with the historic
1910 Great Idaho Fire. Beals (1914) studied this fire that
burned over 809 372 ha (2 million acres) in Idaho and
Montana and caused 85 fatalities. He noted, “There were
many fires burning in northern Idaho, but they were kept
under fair control until August 20, when a hot, high wind
from the southwest began to blow. They burned so furiously
that nothing could be done to stop them.”
Syverson (1962, 1963, 1964) researched and identified
a number of critical fire weather patterns in the Northern
Rocky and Intermountain regions as part of a “Nationwide
Study of Synoptic Fire Weather Types” project spearheaded
by Schroeder, Glovinsky, Hendricks, and others. He studied
weather patterns on days when the fire danger was high on
days of large fire activity and concluded that:
•
The area of high fire danger is almost always on the
southwest or west side of the high-pressure cell at
the surface.
•
The greatest danger occurs just ahead of the upper
trough in the area of the low pressure at the surface.
•
The breakdown of this fire weather type (high
pressure) comes with a strong upper air impulse of
cooler air moving through from the Pacific.
Syverson’s conclusions agree very well with what
occurs during the “breakdown of the upper level ridge”
critical fire weather pattern.
Anderson (1968) examined the weather and fire environment conditions during the September 1, 1967, major
run of the Sundance Fire in northern Idaho. He found that
the extreme fire behavior on this fire occurred with strong
winds and low relative humidity in the prefrontal area ahead
of an advancing cold front.
35
GENERAL TECHNICAL REPORT PNW-GTR-854
The “monsoon pattern” accounted for 7 of the 17 events and
is characterized by high pressure centered over northern
Utah and southern Idaho. With this pattern, warm, moist air
originating in the Gulf of California is advected northward
into Nevada triggering thunderstorms. The second and
more significant pattern involves a negatively tilted shortwave trough moving northeastward from the eastern Pacific
Ocean into north-central California and through northern
Nevada and southern Oregon.
The following is a brief summary of critical fire
weather patterns in the Rocky Mountain and Intermountain
regions.
Upper ridge-Surface thermal trough—
This is the most significant pattern for these regions. It is
characterized by a strong north-south upper ridge along
105 to 110 degrees west longitude and a hot, dry surface
thermal trough extending from central California to eastern
Washington or Idaho. High fire danger results when a weak
mid- to upper level trough moves up the west side of the
ridge, producing dry lightning in the vicinity of the thermal
trough. If the upper trough is strong enough, the upper ridge
will break down and the thermal trough will shift eastward
across the area. A dry and windy surface cold front will
then follow the thermal trough, producing very high fire
danger and increasing the threat of extreme fire behavior on
ongoing wildland fires.
Figure 3-12—Typical 500 hPa and surface pressure pattern
associated with the “breakdown of the upper ridge” critical fire
weather pattern. Pattern is also favorable for moderate to high
Haines Index values. MSL= Mean sea level. Source: Werth and
Ochoa 1993.
Werth and Ochoa (1993) documented the weather and
fire behavior that occurred on the 1988 Willis Gulch and
1989 Lowman Fires in central Idaho. The “breakdown
of the upper level ridge” critical fire weather pattern was
identified as significantly contributing to extreme fire
behavior observed on both fires. They concluded that this
pattern consisted of both upper level and surface pressure
pattern components (fig. 3-12) that resulted in high Haines
Index values. These index values correlated well with the
rate of spread (ROS) for both fires, validating the usefulness
of the Haines Index. The transition zone, between an upper
level ridge and upper trough, and in an area defined by the
surface thermal low-pressure trough, is a favored location
for moderate and high Haines Index values.
Gibson (1996) found that the “breakdown of the upper
ridge” critical fire weather pattern was present with major
increases in area burned on wildland fires in the Northern
Rocky region. Gibson stated, “The pattern develops as the
normal upper level ridge is shoved east by an approaching
shortwave trough.”
In a study of lightning-induced wildfires in Nevada,
Miline (2006) found that two weather patterns account for
all 17 of the major outbreaks over a 9-year sample period.
Early stage monsoon—
This pattern occurs with an upper level ridge around 105
degrees west longitude and an upper trough off the Pacific
coast. It results in dry lightning and gusty winds over the
southern parts of these regions.
Foehn wind/Chinook wind—
These strong downslope winds, along the eastern slopes of
the Rocky Mountains, are unusually warm and dry for the
season. This pattern occurs when strong jet stream winds
blow perpendicular to the mountains and the airmass is
stable. They are most pronounced in the winter and spring,
but can occur during the fall. When the upper level windflow is from the southwest, the onset of Chinook winds is
36
Synthesis of Knowledge of Extreme Fire Behavior: Volume I for Fire Managers
South L
Figure 3-13—1800 Mountain Daylight Time, 06 July 1994, 500
hPa map. Source: USDA, USDI, and USDC 1994.
Figure 3-14—1800 Mountain Daylight Time, 06 July 1994,
surface map. Source: USDA, USDI, and USDC 1994.
often prior to the passage of a weak cold front. When the
flow is northwesterly, the strong wind begins after frontal
passage.
a “breakdown of the upper level ridge.” An upper level
trough and a strong west-to-northwest jet stream (fig. 3-15)
produced winds in excess of 80 km/h (50 mi/h), unusually
low relative humidity, and major crowning on both of these
wildland fires. The passage of two cold fronts (fig. 3-16)
added to the severity of the weather pattern. A Chinook
wind developed in Montana, pushing the Canyon Creek Fire
well east of the Continental Divide. Long-term drought was
also a major factor.
The 1994 South Canyon Fire in western Colorado is a
good example of a fire that burned during a “breakdown of
the upper ridge” critical fire weather pattern. On the afternoon of July 6, the fire rapidly transitioned from a surface to
a crown fire during the passage of a dry cold front. Tragically, 14 firefighters perished when the fire overran their
position. The upper level pattern that afternoon (fig. 3-13)
showed a low center in northwestern Wyoming and a trough
southward along the Colorado/Utah border. This upper level
system replaced an upper ridge that had been previously
over Colorado. A surface cold front moved across the fire
site earlier in the afternoon and at 1800 Mountain Daylight
Time (MDT) was located in eastern Colorado (fig. 3-14).
This weather pattern not only produced strong, gusty winds
and unusually low relative humidity (<10 percent), but also
very unstable air. Fuels were also especially dry owing to
long-term drought.
The September 6–7, 1988, extreme fire behavior exhibited on the Yellowstone National Park (northwest Wyoming)
and Canyon Creek (Montana) Fires also occurred during
Pacific Northwest Region
The Pacific Northwest region comprises the states of
Washington and Oregon. The typical fire season is short
compared to other regions and extends from June through
early October.
There are two critical fire weather patterns in this
region, foehn or east winds in western Washington and
western Oregon, and the “breakdown of the upper ridge”
from the crest of the Cascade Mountains eastward across
eastern Washington and eastern Oregon.
East winds were recognized as a fire problem west of
the Cascades from the beginning of fire weather research.
Beals (1914) and Joy (1923) noted that large fires west of
the Cascades were caused by strong east winds that were
37
GENERAL TECHNICAL REPORT PNW-GTR-854
Figure 3-15—1200 Coordinated Universal
Time 07, September 1988, 500 hPa geopotential height map showing a trough over Alberta,
Canada, and a strong northwesterly jet stream
over Idaho, Montana, and Wyoming. (National
Oceanic and Atmospheric Administration,
National Weather Service.)
unusually hot and dry for the area. They also noted that
these strong winds occurred when there was high pressure
east of the Cascades and low pressure west of the Cascades.
Dague (1934) documented weather during the August
1933 Great Tillamook Fire that burned 105 882 ha (261,640
ac) in western Oregon. He stated, “Low relative humidity,
fresh to strong easterly winds, and high temperatures were
responsible for this huge fire.” Dague also observed that
a surface low-pressure trough west of the Cascades
contributed to the strength of these winds, and the trough
pushed northward from the interior of California.
Saltenberger and Barker (1993) researched weather and
extreme fire behavior conditions during the August 4–5,
1990, Awbrey Hall Fire in central Oregon. They concluded
that the plume-dominated wildfire became severe owing to
a combination of fuels and weather, noting, “The Haines
Index performed well. When the index indicated moderate
to high growth potential the fire displayed extreme behavior
and rapid growth.”
In a study of lightning-induced wildland fires in the
Pacific Northwest, Rorig and Ferguson (1999) discovered
that there were distinctly different weather patterns between
dry and wet thunderstorm days. The pattern for dry days
showed an upper trough near the coast and a pronounced
thermal trough at the surface in eastern Washington and
eastern Oregon (near the Idaho border). Wet-pattern days
show a deeper upper trough (much lower geopotential
38
Synthesis of Knowledge of Extreme Fire Behavior: Volume I for Fire Managers
Figure 3-16—1200 Coordinated Universal
Time 07, September 1988, surface pressure
map showing cold fronts over northwestern
Wyoming along the Canadian/United States
border. (National Weather Service 1993.)
heights) and a weak surface thermal trough in southern
Idaho and eastern Nevada.
Critical fire weather patterns of the Pacific Northwest
are detailed below.
wind and unusually low relative humidity often results in
wind-driven fires and extreme fire behavior. The upper
level pattern (fig. 3-18) shows a strong high amplitude ridge
off the coast between 130 and 140 degrees west longitude.
The east wind pattern normally ends when the upper ridge
moves inland and the surface thermal trough either dissipates or pushes east of the Cascades. This pattern typically
occurs during September and early October and often
represents the peak of the fire season west of the Cascades.
Foehn wind/east wind—
Severe east wind patterns occur when surface high pressure pushes inland behind the passage of a cold front and
becomes centered over eastern Washington, Idaho, or western Montana. Meanwhile, the California surface thermal
trough pushes northward along the Oregon and Washington
coasts (fig. 3-17). This pressure pattern produces strong
pressure differences (gradients) across western Washington
and western Oregon, resulting in offshore flow and northeast-to-east winds of 80 to 97 km/h (50 to 60 mi/h) through
the Columbia Gorge and the ridges and passes of the
Cascade and coastal mountains. Subsidence also results in
warming and drying of the airmass, and relative humidity
can drop to 10 percent or lower. The combination of strong
Upper ridge breakdown—This is similar to the type previously described for the Rocky Mountain and Intermountain
regions. In this case, the pattern is shifted farther west so
the southwest flow is over Oregon and Washington. This
pattern occurs when an upper level trough approaches the
coast pushing the upper ridge to the east. Cooling aloft
results in unstable air and an increased risk of lightning. If
the airmass is dry, moderate to high Haines Index values
and dry lightning are possible. The upper level winds will
39
GENERAL TECHNICAL REPORT PNW-GTR-854
Figure 3-17–East wind surface pressure pattern with a thermal trough just
off the coast and a high centered over
Idaho and western Montana. Pattern
pro-duces strong pressure gradients
and strong winds from the crest of
the Cascades to the Coast. (National
Oceanic and Atmospheric Administration, National Weather Service.)
Figure 3-18—Typical east wind
500 hPa geopotential height pattern
with strong ridge off the Washington
and Oregon coasts. (National Oceanic
and Atnospheric Adminstration,
National Weather Service.)
40
Synthesis of Knowledge of Extreme Fire Behavior: Volume I for Fire Managers
frequently mix to the surface, resulting in strong gusty
winds. Meanwhile, the surface thermal trough will shift
eastward across the area increasing the threat of extreme
fire behavior on new and ongoing wildland fires.
Northwest, resulting in large pressure differences (gradients) across northern California. Dry air moves from
Oregon southward into the Sacramento Valley with additional warming and drying. Relative humidity of 10 percent
or less with temperatures of 43 °C (110 °F) can occur in the
valley under these conditions. Windspeed strength depends
on the pressure gradient, upper level windflow, and local
topography. When the upper windflow is from the north
or northeast, windspeed values in excess of 65 km/h (40
mi/h) often occur. Mono winds are strong easterly winds
that occur along the western slopes of the Sierra Nevada
Mountains. They are similar to the above-mentioned North
winds, but in this case, the center of the surface high pressure is located in Nevada and Utah. This is primarily a late
summer and fall pattern, but can occur at other times during
the year if the fuels are dry.
California Region
The fire season extends from mid-May through October in
northern California and from late March through December
in southern California. However, during drought years, the
season in southern California can extend throughout the
year.
Krumm (1954) examined the meteorological conditions
that affected the July 9, 1953, Rattlesnake Fire in northern
California. Fifteen firefighters were killed on this fire.
He determined that strong downslope winds occurred on
the fire after sunset, caused by a strong pressure gradient
between surface high pressure along the Pacific Coast and
a thermal trough over the Sacramento Valley. This wind
develops and descends to the surface similar to other foehn
winds with low relative humidity and warm temperatures.
Weather, fuels, and fire behavior of the 1956 Inaja Fire
were researched by Countryman et al. (1956) to determine
what caused 11 firefighter fatalities during the fire’s major
run. They determined that the fire burned during a Santa
Ana wind event in a very wind-prone canyon in the San
Diego area.
Ortel (1964) studied serious fire weather conditions
in northern and central California as part of a nationwide
study of synoptic fire weather types. He identified five
weather patterns of concern: an upper level high over the
Southwestern States, an upper high over the Pacific Ocean,
an upper trough offshore near 130 degrees west longitude,
surface cold fronts, and easterly winds from surface highpressure systems over the Great Basin.
The following is a summary of critical fire weather
patterns in California.
Foehn winds/Santa Ana and sundowner winds—
This is the primary critical fire weather pattern for
southern California. The pattern develops when surface
high pressure builds over Nevada, Utah, and northern
Arizona after the passage of an upper level trough. Meanwhile, an upper ridge of high pressure builds off the Pacific
Northwest coast. North to northeasterly flow around the
upper ridge results in cold air advection and strengthening
of the surface high over the Great Basin. High pressure over
Nevada and low pressure along the California coast result
in strong pressure gradients over southern California. As a
result, strong north to east winds develop from the crest of
the mountains into the coastal areas. Air descending from
higher to lower elevations causes compressional heating,
which results in dramatic heating and drying of the air.
When Santa Ana winds occur, extreme fire behavior conditions can suddenly develop as relative humidity drops to
10 percent or less and winds increase to 80 km/h (50 mi/h)
or more. Winds can be substantially stronger in mountain
passes and canyons. These winds are typically strongest
at night and during the morning hours, and diminish
somewhat during the afternoon owing to surface heating.
This pattern occurs most often during the fall and winter
months.
Foehn winds/north and mono winds—
This is the most common critical fire weather pattern in
northern and central California. These strong, dry winds
occur when surface high pressure builds into the Pacific
41
GENERAL TECHNICAL REPORT PNW-GTR-854
Figure 3-19—1200 Coordinated Universal Time, 22 October 2007, surface
pressure map. High centered over Utah
with strong pressure gradients over
southern California. (National Oceanic
and Atmospheric Administration,
National Weather Service.)
A sundowner wind is an offshore northerly foehn
wind that occurs in the lee of the Santa Ynez Mountains,
which rise directly behind Santa Barbara and the surrounding coastal area. They develop when high pressure at the
surface is centered over the Pacific Northwest and northern
California and pressure gradients are perpendicular to the
east-west axis of the Santa Ynez Mountains. These winds
often precede Santa Ana events by a day or two. The normal
progression is for the surface high pressure to migrate into
the Great Basin causing pressure gradients and winds to
shift more to the northeast and east ending the sundowner
winds. (Note: For more information on Santa Ana and
sundowner winds, see chapter 2.)
The October 2007 siege of wildland fires in southern
California is a good example of a Santa Ana critical fire
weather pattern. These massive wildfires burned hundreds
of thousands of hectares, displaced nearly a million people,
destroyed thousands of homes, and resulted in 10 fatalities.
The surface and upper level pressure patterns are
shown in (figs. 3-19 and 3-20). Strong surface high pressure
was centered over Utah and Nevada, and an upper ridge was
located off the California coast. A satellite picture (fig. 3-21)
shows numerous smoke plumes being driven off the coast
by northeast to east winds. Surface winds in excess of 80
km/h (50 mi/h) and relative humidity of less than 10 percent
was reported on the fires.
Subtropical high aloft—
This pattern occurs when the westerlies shift northward,
causing a closed subtropical high to become centered over
the Southwest. The upper ridge axis extends far enough off
the coast to block subtropical moisture from the area. This
pattern produces heat waves in California. When a weak
42
Synthesis of Knowledge of Extreme Fire Behavior: Volume I for Fire Managers
Figure 3-20—1200 Coordinated
Universal Time, 22 October 2007,
50 hPa geopotential height map.
A strong high was centered off
the northern California coast.
(National Oceanic and Atmospheric Administration, National
Weather Service.)
Models and Predictive Tools
upper trough pushes into the western portion of the upper
ridge, instability can result in a significant outbreak of dry
lightning (fig. 3-22).
The Predictive Services Program is national in scope. It
supports the wildland fire community and others with
information and decision-support products. The program
encompasses meteorologists and intelligence coordinators
at each geographic area coordination center (GACC) and
the National Interagency Coordination Center (NICC).
Fire behavior or long-term analysts are detailed to GACCs
during the fire season.
The following is a list of products produced by Predictive Services units that are useful in determining areas of
greatest concern in relation to large fire potential and the
possibility of extreme fire behavior.
Alaska
The fire season in Alaska extends from May through
August but is most active during June and July.
The primary critical fire weather pattern in Alaska is
the “breakdown of the upper level ridge.”
Breakdown of the upper ridge with southwest flow—
This pattern occurs when southeasterly winds push moist,
unstable air into the retreating upper level ridge (fig. 3-23).
This can bring gusty winds and dry lightning to the interior
of Alaska. The June 1998 Carla Lake Fire burned under
these conditions caused by wind gusts of 56 km/h (35 mi/h)
and relative humidity of less than 25 percent.
43
GENERAL TECHNICAL REPORT PNW-GTR-854
Figure 3-21—22 October 2007 satellite picture showing smoke from numerous southern California wildfires blowing out over the Pacific Ocean. (National Oceanic and Atmospheric Administration, National Weather Service).
Figure 3-22–Critical California lightning pattern with subtropical 500 hPa ridge over the Great Basin and short-wave trough
moving inland from the Pacific Ocean. (National Oceanic and
Atmospheric Administration National Centers for Environmental
Prediction/National Center for Atmospheric Research reanalysis.)
Figure 3-23—“Breakdown of the upper ridge” critical fire weather
pattern in Alaska. Source: National Weather Service 1993.
44
Synthesis of Knowledge of Extreme Fire Behavior: Volume I for Fire Managers
these outcomes could pose a threat to life and property. Fire
Weather Watches are issued when there is a high potential
for the development of a Red Flag Event. Red Flag Warnings are used to warn of an impending, or occurring Red
Flag Event. Its issuance denotes a high degree of confidence
that weather and fuel conditions consistent with local Red
Flag Event criteria will occur in 24 hours or less.
The National Wildland Significant Fire Potential
Outlook
This product is prepared by NICC on the first business day
of each month. The report consists of national maps and
associated text that depict areas of below normal, normal,
and above normal significant fire potential.
GACC 7-Day Significant Fire Potential
Spot Weather Forecasts/Digital Web Services
This GACC product is produced daily during the primary
fire season under the direction of a qualified fire weather
meteorologist. The report contains projected fire weather,
fuel dryness, fire danger, fire potential, and resource status
information for the next 7-day period. A short discussion
accompanies the report detailing weather of concern
through the period.
A spot forecast is a site-specific 24- to 36-hour forecast
issued to fit time, topography, and weather of a specific
location. The spot forecast can be requested for wildfires,
prescribed burns, spray projects, and other special projects.
Other products available include FARSITE data streams and
point forecast matrix forecasts from the National Digital
Forecast Database. The NWS issues thousands of spot
forecasts per year, and there is extensive use of digital Web
services in diagnosing fire risks resulting from critical fire
weather patterns.
The Storm Prediction Center’s (SPC) Fire Weather program issues a daily national fire weather guidance product
for use by the NWS, as well as other federal, state, and local
government agencies. The product is intended to delineate
areas of the contiguous United States where preexisting
fuel conditions, combined with forecast weather conditions
during the next 8 days, may result in a significant threat of
wildfires.
Fuel and Fire Behavior Advisories
These advisories are issued to inform fire managers and
firefighters of safety concerns owing to existing or predicted
fuel and fire behavior conditions.
Other GACC Products and Services
The GACC Predictive Services units provide a wide variety
of products and services in support of wildland fire operations. These include weather/intelligence briefings, situation
reports, and resource summaries.
Fire Weather Watches and Red Flag Warnings
There are three types of Fire Weather Outlook areas:
• Critical Fire Weather Area for wind and relative
The National Weather Service (NWS) provides fire weather
products and services in support of fire management decisions. Some of the best tools in assessing the potential for
critical fire weather situations are the Fire Weather Watch
and Red Flag Warning program, and Spot Weather Forecasts.
Fire Weather Watches and Red Flag Warnings are
issued when the combination of dry fuels and weather
conditions indicate the possibility of extreme fire danger
or fire behavior. These conditions alert land management
agencies to the potential for widespread new ignitions that
could overwhelm initial attack activities, or conditions that
could cause control problems on existing fires, etc. Any of
humidity.
•
Extremely Critical Fire Weather Area for extreme
conditions of wind and relative humidity.
•
Critical Fire Weather Area for dry thunderstorms.
The SPC Fire Weather Outlook comprises a day 1 and a day
2 forecast, in addition to a day 3 through 8 forecast.
Summary/Knowledge Gaps
Fire weather research has been ongoing for nearly a century, and many advances have been made during that time
45
GENERAL TECHNICAL REPORT PNW-GTR-854
concerning weather’s effect on wildland fire behavior.
Wind and relative humidity have been effectively incorporated into the fire behavior models. However, the effect of
atmospheric stability on fire behavior is not modeled and
remains subjective at best. More research is needed, beyond
the Haines Index, to quantify the effects of atmospheric
stability on fire behavior.
The concept of critical fire weather patterns has been
in existence for 50 years. It has been successfully applied to
fire case studies, but rarely has it been used in conjunction
with weather forecast models to predict periods when large
fires or extreme fire behavior are likely to occur.
Future research into the climatology and dynamics of
these weather patterns and their effects on fire behavior
would be beneficial, especially for the “breakdown of the
upper ridge” pattern. Research concerning the fire behavior
effects associated with the surface thermal trough also need
to be better defined.
Brotak, E.A.; Reifsnyder, W.E. 1977b. Predicting major
wildland fire occurrence. Fire Management Notes.
38: 5–8.
Brown, A.A. 1950. Warning signs for fire fighters. Fire
Control Notes. 11(3): 28–29.
Byram, G.M. 1954. Atmospheric conditions related
to blowup fires. Sta. Pap. 35. Asheville, NC: U.S.
Department of Agriculture, Forest Service, Southeastern
Forest Experiment Station. 34 p.
Byram, G.M.; Nelson R.M. 1951. The possible relation of
air turbulence to erratic fire behavior in the Southeast.
Fire Control Notes. 12(3): 1–8. (Republished in Fire
Management Today. 63(3): 46–51.)
Crimmins, M.A. 2005. Synoptic climatology of extreme
fire-weather conditions across the Southwest United
States. International Journal of Climatology.
26: 1001–1016.
References
Crosby, J.S. 1949. Vertical wind currents and fire behavior.
Fire Control Notes. 10(2): 12–15.
Anderson, H.E. 1968. Sundance Fire: an analysis
of fire phenomena. Res. Pap. INT-56. Ogden, UT:
U.S. Department of Agriculture, Forest Service,
Intermountain Forest and Range Experiment Station.
37 p.
Countryman, C.M.; Chandler, C.; Arnold, K. 1956.
Fire behavior: Inaja Fire disaster November 25, 1956.
Berkeley, CA: U.S. Forest Service, California Forest and
Range Experiment Station Report.
Beals, E.A. 1914. The value of weather forecasts in the
problem of protecting forests from fire. Monthly Weather
Review. 42(2): 111–119.
Dague, C.I. 1930. Disastrous fire weather of September,
1929. Monthly Weather Review. 58: 368–370.
Beals, E.A. 1916. Droughts and hot weather. Monthly
Weather Review. 44: 135–138.
Dague, C.I. 1934. The weather of the great Tillamook,
Oregon, fire of August 1933. Monthly Weather Review.
62(7): 227–231.
Brotak, E.A. 1979. The Bass River Fire: weather conditions
associated with a fatal fire. Fire Management Notes.
40(1): 10–13.
Davis, R.T. 1969. Atmospheric stability forecast and fire
control. Fire Control Notes. 30(3): 3–4, 15.
Gibson, C.V. 1996. Break-down of the Western U.S.
upper-level ridge: a critical fire weather pattern. 22nd
Brotak, E.A. 1992–1993. Low-level weather conditions
preceding major wildfires. Fire Management Notes.
53-54: 23–26.
conference on agricultural and forest meteorology.
Boston, MA: American Meterological Society: 261–262.
Brotak, E.A.; Reifsnyder, W.E. 1977a. An investigation
of the synoptic situations associated with major wildland
fires. Journal of Applied Meteorology. 16(9): 867–870.
Gisborne, H.T. 1927. Meteorological factors in the Quartz
Creek forest fire. Monthly Weather Review. 55(2): 56–60.
46
Synthesis of Knowledge of Extreme Fire Behavior: Volume I for Fire Managers
Goens, D.W.; Andrews, P.L. 1998. Weather and fire
behavior factors related to the 1990 Dude Fire near
Payson, Arizona. In: Proceedings: 2nd symposium on
fire and forest meteorology. Boston, MA: American
Meteorological Society: 153–158.
Krumm, W.R. 1954. An explanation of meteorological
conditions which probably caused unexpected behavior
of the Rattlesnake Fire, Mendocino National Forest, July
9, 1953. 4 p. Unpublished report. On file with: National
Weather Service, Pocatello, ID.
Haines, D.A. 1988. A lower atmospheric severity index for
wildland fires. National Weather Digest. 13: 23–27.
McCarthy, E.F. 1923. Forest fire weather in the southern
Appalachians. Monthly Weather Review. 51(4): 182–185.
Haines, D.A.; Sando R.W. 1969. Climatic conditions
preceding historically great fires in the North Central
Region. Res. Pap. NC-34. St. Paul, MN: U.S. Department
of Agriculture, Forest Service, North Central Forest and
Range Experiment Station. 23 p.
McCarthy, E.F. 1924. Forest fires and storm movement.
Monthly Weather Review. 52: 257–259.
Miline, R. 2006. Critical lightning induced wildfire
patterns for the Western Great Basin. Tech. Attachment.
LiteTA-lite 06-13. National Oceanic and Atmospheric
Administration, National Weather Service, Western
Region.
Hoenisch, R. 2009. January 31st 2009 off-season grassland
wildfire. Tech. Attachment. LiteTA-lite. 09-11. Salt
Lake City, UT: National Oceanic and Atmospheric
Administration, National Weather Service, Western
Region.
Munns, E.N. 1921. Evaporation and forest fires. Monthly
Weather Review. 49(3): 140–152.
National Weather Service. 1993. Critical fire weather
patterns of the United States. Fire Weather Training
Report. http://www.nwccweb.us/content/products/fwx/
publications/CRITICAL_FWX_PATTERNS_US.pdf.
(May 13, 2011).
Hofmann, J.V. 1923. Meteorological factors and forest
fires. Monthly Weather Review. 51(11): 569.
Hughs, M.; Hall, A. 2009. Local and synoptic mechanisms
causing southern California Santa Ana winds. Climate
Dynamics. SpringerLink. DOI: 10.1007/s00382-0090650–4.
Nimchuk, N. 1983. Wildfire behavior associated with upper
ridge breakdown. Report No. T/50. Edmonton, AB:
Alberta Energy and Natural Resources, Forest Service.
45 p.
Hull, M.K.; O’Dell, C.A.; Schroeder, M.J. 1966. Critical
fire weather patterns: their frequency and levels of fire
danger. Berkeley, CA: U.S. Department of Agriculture,
Forest Service, Pacific Southwest Forest and Range
Experiment Station. 40 p.
Ortel, A.G. 1964. Weather types associated with critical
fire weather conditions in Northern and Central
California. Unpublished report. On file with: U.S.
Department of Agriculture, Forest Service, Pacific
Wildland Fire Sciences Laboratory, Seattle, WA 98103.
Jemison, G.M. 1932. Meteorological conditions affecting
the Freeman Lake (Idaho) Fire. Monthly Weather
Review. 60(1): 1–2.
Rorig, M.L.; Ferguson, S.A. 1999. Characteristics of
lightning and wildland fire ignition in the Pacific
Northwest. Journal of Applied Meteorology. 38(11):
1565–1575.
Joy, G.C. 1923. Forest fire weather in western Washington.
Monthly Weather Review. 51(11): 564–566.
Kauffman, E. 1937. Death in Blackwater Canyon.
American Forests. 1937(November): 534–559.
Saltenberger, J.; Barker, T. 1993. Weather related unusual
fire behavior in the Awbrey Hall Fire. National Weather
Digest. 18(2): 20–29.
47
GENERAL TECHNICAL REPORT PNW-GTR-854
Schaefer, V.J. 1957. The relationship of jet streams to forest
wildfires. Journal of Forestry. 55: 419–425.
Syverson, C.E. 1963. Fire weather synoptic types of the
Northern Intermountain, Northern Rockies and the
Northwestern Plains regions. Unpublished report. On
file with: U.S. Department of Agriculture, Forest Service
Pacific Wildland Fire Sciences Laboratory, Seattle, WA
98103.
Schroeder, M.J. 1950. The Hudson Bay high and the
spring fire season in the Lake States. Fire Control
Notes. 11(1): 1–8. (Also in Bulletin of the American
Meteorological Society. 1974. 31(4): 111–118 as same
title, slightly different text.)
Syverson, C.E. 1964. The meridional ridge–Pacific high,
and fire weather of Northern Intermountain, Northern
Rockies, and the Northern Plains. Unpublished report.
On file with: U.S. Department of Agriculture, Forest
Service, Pacific Wildland Fire Sciences Laboratory,
Seattle, WA 98103.
Schroeder, M.J.; Buck, C.C. 1970. Fire weather. In: Fire
climate regions. Agric. Handb. 360. Washington, DC:
U.S. Department of Agriculture, Forest Service:
196–220. Chapter 12.
Schroeder, M.J.; Glovinsky, M.; Hendricks, V.F. [et al.].
1964. Synoptic weather types associated with critical fire
weather. Berkeley, CA: U.S. Department of Agriculture,
Forest Service, Pacific Southwest Forest and Range
Experiment Station. 492 p.
Weidman, R.H. 1923. Relation of weather forecasts to the
prediction of dangerous forest fire conditions. Monthly
Weather Review. 51(11): 563–564.
Werth, P.A.; Ochoa, R. 1990. The Haines Index and Idaho
fire growth. Fire Management Notes. 51(4): 9–13.
Show, S.B. 1931. Meteorology and the forest fire problem.
Monthly Weather Review. 59: 432–433.
Werth, P.A.; Ochoa, R. 1993. The evaluation of Idaho
wildfire growth using the Haines Index. Weather and
Forecasting. 8(2): 223–234.
Simard, A.J.; Haines, D.A.; Blink, R.W.; Frost, J.S.
1983. The Mack Lake Fire. Gen. Tech. Rep. NC-83.
St. Paul, MN: U.S. Department of Agriculture, Forest
Service, North Central Forest Experiment Station. 36 p.
Williams, E.B.; Smith, A.D. 1962. Case history of the
Brasstown Fire. Unpublished report. On file with:
National Fire Behavior School, San Dimas, CA.
Stickel, P.W. 1928. Forest-fire weather in central
Massachusetts. Monthly Weather Review.
56(4): 134–136.
U.S. Department of Agriculture; U.S. Department of
the Interior; U.S. Department of Commerce [USDA,
USDI, and USDC]. 1994. Report of the South Canyon
Fire Accident Investigation Team (SCAIT). U.S. GPO
1994-573-183 / 84023 Region No. 8. Washington, DC:
U.S. Government Printing Office. 243 p.
Syverson, C.E. 1962. Prediction of the crisis period and
the use of Red Flag Forecasts. Unpublished report. On
file with: U.S. Department of Agriculture, Forest Service
Pacific Wildland Fire Sciences Laboratory, Seattle, WA
98103.
48
Synthesis of Knowledge of Extreme Fire Behavior: Volume I for Fire Managers
Chapter 4: Fire Interactions and Mass Fires
Mark A. Finney and Sara S. McAllister1
Introduction
Some interactions of wildland fires are experienced routinely under field conditions. Firefighters and prescribed
fire personnel see flames tilting toward adjacent ignition
points or fire edges, particularly as the sources advance
closer together (Martin and Dell 1978, Rothermel 1984). In
the extreme case, interactions occurring when large areas
are ignited and burning simultaneously are described as
mass fires, area fires, or “fire storms” (Countryman 1964).
Hundreds or thousands of individual fires may interact
over an area and exhibit some “unified” behavior. Such
fires are generally described as having such strong indrafts
that outward propagation is minimal. They have extremely
tall convection columns or smoke plumes and burn for
long durations until all the fuel within the perimeter is
consumed. Good reviews of mass or large area fires can be
found in Williams (1982), Pitts (1991), and Heskestad (1998).
Mass fires were responsible for tremendous burning rates
and tornado-strength winds (Carrier et al. 1985) witnessed
after the fire bombings of cities in Germany and Japan
during World War II (Hewitt 1983, Schmalz 1992) and have
been studied mainly in relation to consequences of nuclear
attacks (Balwin and North 1967; Chandler 1963; Countryman 1964, 1965, 1969; Eggleston 1968; German 1968;
Hewitt 1983; Larson et al. 1982; Larson and Small 1982a,
1982b; Lee 1969a, 1969b; Lommasson et al. 1967, 1968;
Nielsen 1970; Nielsen et al. 1963; Parker 1967; Penner et al.
1986; Pryor and Yuill 1966; Quintiere 1993; Sanderlin et al.
1981; Wood et al. 1971). Many of these studies were through
“Project Flambeau,” a joint effort between the U.S. Office of
Civil Defense Defense Atomic Support Agency and the U.S.
Department of Agriculture Forest Service in the mid-1960s.
These fires were designed to mimic a suburb fire. Each
square fuel bed was constructed with a mixture of pinyon
pine and juniper (see “Common and Scientific Names”
Figure 4-1—Prescribed fire ignition patterns designed to restrict
or enhance fire front interactions (from Martin and Dell 1978).
Figure 4-2—Indrafting and flame response of sequential line fires
in prescribed burning (from Rothermel 1984).
section) and was approximately the same size and fuel load
as a typical suburban house (185.8 m 2 and about 18 000 kg
of fuel). The spacing between fuel beds was either 7.6 m
or 35.1 m and fire sizes were 2, 6, 12, and 20 ha. Airflow
velocities and temperatures were measured inside and
just outside the fire area along with thermal radiation just
1
Mark A. Finney and Sara S. McAllister, USDA Forest Service,
Missoula Fire Sciences Laboratory, Missoula, MT.
49
GENERAL TECHNICAL REPORT PNW-GTR-854
outside the fire area, oxygen and carbon dioxide concentrations inside the fire area, and the mass loss rate of the fuel
beds (Countryman 1964, 1965, 1969).
Wildland fire interactions are intentionally manipulated
for ignition or firing operations (see figs. 4-1 and 4-2) to
orient spread directions (Johansen 1987), to use indrafts
for backfire operations (Miralles et al. 2010), to increase
the development of convection columns on prescribed fires
through center-firing techniques (Martin and Dell 1978),
and to limit spread and intensity with spot fire ignitions
(Luke and McArthur 1978, Johansen 1984, Weatherspoon
et al. 1989). Rapid increases in fire growth and energy
release—termed “blowup”—are sometimes associated with
fire interactions (Arnold and Buck 1954). Yet, despite the
common usage and practical familiarity with interactions
that fire personnel often acquire, there is very little quantitative physical understanding of these behaviors and no
operational models that can predict them. By comparison to
other fire behavior characteristics, such as fire spread rates,
fire interactions at any scale have been subject to limited
study.
In this review, we endeavored to obtain literature from
many sources, including wildland fire and structural fire,
as well as combustion engineering and fluid dynamics, in
order to cover the range of research on fire-fire interactions
and the state of knowledge. Our search revealed that the
topic of fire interactions overlaps considerably with other
fire behaviors that are distinguished individually, such as
vortices and terrain effects. These behaviors will be mentioned when appropriate, but their full discussion is beyond
the scope of this review.
Figure 4-3—Theoretical fire spread rate acceleration curves from
point-source ignitions show asymptotic increase in spread rate
over time toward an equilibrium (from McAlpine and Wakimoto
1991). ROS = rate of spread.
useful background material for discussion of fire-fire
interactions, although studies of fire acceleration have not
directly addressed interactions of multiple fires. Many of
the time-dependent changes in fire behavior are associated
with fire growth or expansion in two dimensions. Changes
are observed in spread rates (acceleration), frontal geometry (width, curvature), and heat transfer indicated by the
orientation and size of flames. These fire characteristics are
interrelated with spread processes, and the literature does
not discern the causes of observable features as distinct
from their probable effects.
Fire Acceleration
Fire acceleration is defined as the time-dependent changes
in spread and intensity occurring under constant weather
and uniform fuel conditions. The notion of acceleration
is implicitly applied to fires that are already capable of
spreading as compared to combinations of threshold conditions where spread only occurs above some limit. Various
mathematical representations of acceleration (fig. 4-3) have
been proposed from a theoretical standpoint that express
spread rate from a point-source fire as a negative exponential function of time (Cheney 1981, Cheney and Bary 1969).
Parameters of these equations were fit to empirical data
Background: Time-Dependent Fire
Behaviors
For a constant set of environmental conditions, fire
behavior is known to change with time. These changes
are not expressly considered interactions, but spread and
intensity changes within individual fires are also affected
during interaction among fires and may contribute to later
development of interactions. Thus, such behaviors provide
50
Synthesis of Knowledge of Extreme Fire Behavior: Volume I for Fire Managers
from wind tunnel experiments by McAlpine and Wakimoto
(1991). These functions tend toward a final equilibrium rate
and are, thus, commonly communicated in terms of the
time to reach some fixed fraction of equilibrium (e.g., 90
percent). A similar result was developed by Weber (1989),
who represented acceleration of fires expanding as a circle
from a point ignition and depended on the curvature of the
fire front.
Studies of acceleration typically report time elapsed
from ignition to a near-steady spread rate. Values of 20 to
30 min for point-source ignitions in slash fuels for prescribed fire conditions (McRae 1999) and in pine litter and
feather moss (Kucuk et al. 2007) have been reported. Winddriven grass fires in Australia (Albini 1982) showed large
variation in acceleration times (about 6 min under slow
wind conditions to over 45 min with faster winds) and a
strong dependency on the width of the fire front. Wind tunnel burns of shallow (8 cm deep) pine needle and excelsior
beds suggested time to equilibrium of only a few minutes
(McAlpine and Wakimoto 1991) and largely independent of
windspeed. Data from point ignitions in pine needle litter
reported by Curry and Fons (1938) suggested windspeed
affected acceleration rate (increased time to equilibrium)
as well as a final spread rate. Windspeed may also affect
acceleration times for conflagrations involving structures
at urban densities. Chandler et al. (1963) referenced much
longer time estimates than for wildland fuels, including 1
hr to achieve near-steady spread rates with windspeed up
to 6.7 m/s (15 mi/h), 2 hrs for winds to 17.9 m/s (40 mi/h)
and possibly much longer times for stronger winds. A long
acceleration period, exceeding the 36-min observation
time, was described for line ignitions in heavy fuel loadings
associated with felled eucalyptus slash (McArthur 1969a)
(see “Common and Scientific Names” section). By contrast,
rapid acceleration to near-steady burning after line ignition
was reported for experimental crown fires in jack pine
forests (Stocks 1989). Implications of a theoretical analysis
by Albini (1982) suggests that line ignitions in surface fuels
could accelerate very rapidly, initially overshooting the
steady rate, but then slow and exhibit damped oscillations
toward the steady value as the increasing vertical buoyancy
of the combustion zone offsets horizontal wind force. From
the existing literature, it is not clear what influences the
various factors of fuel loading, fuel sizes, burning duration,
and final spread rates have on acceleration time, nor more
complicated interactions among multiple flame zones or
heat sources.
Acceleration of fires can also occur when air inflow
is asymmetrically restricted by surface topography, either
in canyons (Viegas and Pita 2004), or inclined channels
(Woodburn and Drysdale 1998) and slopes (Dold and
Zinoviev 2009, Wu et al. 2000). Detailed treatment of these
important fire-topographic interactions, however, is beyond
the scope of this review of fire-fire interactions.
Length of Fire Front
Fire acceleration and final spread rate appear to be dependent on fire size. Fires accelerate slowly from point-ignition
sources (Cheney and Gould 1995, McAlpine and Wakimoto
1991, McRae 1999) relative to line-source ignitions (Cheney
and Gould 1995, Johansen 1987). At the small scale of
laboratory stick arrays, fuel bed width and proportion of
edge on the curvature of the head fire had significant effects
on spread rate (Fendell and Wolff 2001). In wind-driven
grass fires, fire spread rates were found to be dependent on
the length of the ignition for lines shorter than 50 to 75 m
(Cheney and Gould 1995) and required longer acceleration
times for higher winds (fig. 4-4). Experiments and modeling
by Wotton et al. (1999) for fires in red pine litter, however,
showed no increase in radiation from flames for ignition
lines longer than about 2 m and no effect of line width on
spread rate beyond about 1 m. Dold et al. (2006) offered
an explanation for fire size effect on forward spread rate.
As fires expand in two dimensions, the distance between
the fire edges increases, meaning that buoyancy-induced
inflow along segments of flaming front comes from a wider
area. This allows ambient winds from behind the front to
penetrate to the heading portion of the flame zone. Such
effects on narrow combustion zones of expanding fires is
presumably different than for mass fires or large-area
51
GENERAL TECHNICAL REPORT PNW-GTR-854
Figure 4-4—Fire spread rates in
grass fuels were found to increase
with the width of head fires and
depend on the final spread rates
determined by windspeed (from
Tolhurst and Cheney 1999).
ignitions, which create indrafts from all directions (Baum
and McCaffrey 1989, Smith et al. 1975), and strong buoyancy-driven convection may deflect ambient airflow around
the column (Countryman 1964).
portion of the fire tilt toward the unburned fuel. The very
large differences in spread rate and intensity between
backing and heading fires (and flanking fires) can be estimated assuming elliptical fire shapes (Catchpole et al. 1982).
Numerous studies of flame tilt angle in a wildland fuel bed
on flat terrain in wind have consistently found a strong
relationship to the Froude number calculated from ratios of
windspeed to intensity or flame length (Albini 1981, 1982;
Nelson and Adkins 1986; Weise and Bigging 1996). Similar
experimental results were found using liquid pool fires
(Martin et al. 1991, Pipkin and Sliepcevich 1964, Welker
and Sliepcevich 1966, Welker et al. 1965) and explained as
the counteraction of upward buoyant forces by crossflow,
including flame trailing (lateral deflection of combustion
products and flames) with high windspeeds. Recent numerical modeling (Nmira et al. 2010) has also reported Froude
number relationships for both line-source and point-source
simulated fires. Although slope effects were deemed significant (Weise and Bigging 1996), they are not accounted
for in such formulations. When fires are in proximity, the
interaction between them can change the flame tilt angle
and rates of spread (Pitts 1991, Rios 1966, Welker et al.
1965). In these cases, the flame tilt angles can be correlated
Flame Tilt
Flame angle orientation relative to the unburned fuel is
related to acceleration and is affected by fire size and stage
of growth. Flames can tilt owing to wind, slope, or the
interaction with other fires. Flames tilted away from the
direction of spread are referred to as backing fires, and
flames tilting toward the direction of spread are referred
to as heading fires. Flames tilt toward the interior of the
burned area in small fires or point-source fires, producing backing spread (Fendell and Wolff 2001, Luke and
McArthur 1978, Tolhurst and Cheney 1999). Spread rate of
backing fires spreading downslope has been shown to be
only weakly diminished as slope increases (Van Wagner
1988) and little affected by wind (Beaufait 1965, McAlpine
and Wakimoto 1991). Backing fires have been reported to
increase fuel consumption and residence times. As fires
grow larger, backing fire remains only at the rear of the
perimeter (upwind or downslope) and flames for the heading
52
Synthesis of Knowledge of Extreme Fire Behavior: Volume I for Fire Managers
firebrands at relatively short distances from the fire front
(a few kilometers) can substantially increase spread rate
and create simultaneous area ignition (Cheney and Bary
1969). On wildfires, Cheney and Bary observed that the
highest concentration of fire brands fell within a fan-shaped
zone about 9 degrees in angle on either side of the primary
wind direction and theorized that mass fire behavior could
be achieved for certain unspecified combinations of fire
brand density and acceleration time for individual ignitions. Johansen (1984) made similar observations for spot
ignition patterns on prescribed burns where higher spot
densities increased the numbers and frequencies of junction
or merger zones. The increase in intensity at such junction
zones have been documented empirically (Johansen 1984,
McRae et al. 2005) and modeled (Morvan et al. 2009)
leading to recommendations for wide separation of igni-
with a modified Froude number that includes the separation
distance of the fires (Pitts 1991, Rios 1966, Welker et al.
1965). In the case of no wind, a modified Grashof number
is used (Gebhart et al. 1976, Pera and Gebhart 1975) to
describe the flame tilt purely owing to flame interaction.
Spread Thresholds
Thresholds describe a point of near-instantaneous acceleration that delineates when fire will and will not spread.
Threshold-crossing for fire spread has been documented for
many discontinuous fuel types including grasses (MarsdenSmedly et al. 2001), shrubs (Brown 1982, Burrows et al.
1991, Bradstock and Gill 1993, Weise et al. 2005), and trees
(Bruner and Klebenow 1979, Van Wagner 1977). Laboratoryscale fires reveal similar spread thresholds in arrays of
small sticks (Beer 1995, Vogel and Williams 1970, Weber
1990) and taller beds of excelsior (Finney et al. 2010). These
studies reveal threshold dependencies on multiple environmental, fuel, and fire variables, such as windspeed, fuel
moisture, slope, horizontal fuel gap dimensions, fuel bed
depth, fuel combustion rate, and flame size. Chandler (1963)
proposed combinations of ranges of windspeed, humidity,
and rainfall by fuel type to define spread thresholds for significant growth of large fires. Recent studies of fire spread
sustainability provide empirical evidence on the importance
of fuel moisture, wind, and fuel loading (Beverly and
Wotton 1997, Leonard 2009). As described in later sections
of this chapter, fire interactions exert strong influences over
many of these same environmental and fire variables and,
thus, may elicit threshold-crossing spread for fires burning
in discontinuous fuels.
tions (Marsden-Smedley 2009, Tolhurst and Cheney 1999)
unless area ignition is desired (Taylor et al. 1973). Mass
ember deposition and area ignition has been documented
by McArthur (1969b) for Tasmanian fires, which resulted in
near-simultaneous ignition of hillsides. A similar process
was proposed for the Air Force Bomb Range Fire (Wade
and Ward 1973), which periodically caused area ignition
ahead of the main front and vertical development of a
convection column. Modeling by Weihs and Small (1986)
showed that interactions between large mass fires can even
cause these typically nonspreading fires to propagate toward
one another.
How close together fires must be before flames visibly interact and subsequently merge is not clear. There
have been many empirically derived merging criteria in
the literature. Correlations exist for the critical parameters
for both flame interaction (Baldwin 1968, Liu et al. 2007,
Sugawa and Takahashi 1993) and merging (Delichatsios
2007, Fukuda et al. 2004, Putnam and Speich 1963, Wood et
al. 1971). These correlations take many forms—some define
a critical ratio between the fire spacing and fire diameter
(Sugawa and Takahashi 1993, Wood et al. 1971) or flame
height (Baldwin 1968, Delichatsios 2007, Liu et al. 2007),
some define a critical ratio between the flame height and
Conditions Where Fire Interactions Occur
Interactions are possible when many separate fires grow
together or multiple segments of a single continuous fire are
oriented in proximity. In natural wildland fires, multiple
fronts often occur because of spotting from a single main
fire. Spot fires are relatively common under dry and windy
conditions and even long-distance spotting contributes to
fire movement (Anderson 1968). But massive deposition of
53
GENERAL TECHNICAL REPORT PNW-GTR-854
fire diameter (Wood et al. 1971), and some define a critical
dimensionless heat release rate (Fukuda et al. 2004, Putnam
and Speich 1963). Upon close examination, however, it
becomes clear that fire spacing, fire diameter, flame height,
and dimensionless heat release rate have interdependencies,
and, thus, these different correlations are not necessarily
contradictory. The discussion here will focus on the relations between spacing, diameter, and flame height because
they are the most intuitive.
Using both gas diffusion burners and pool fires,
Sugawa and Takahashi (1993) reported that flames begin
to interact when the ratio of the spacing distance to the
fire diameter is less than four. In other words, flames can
interact, here defined as visually tilting, over distances four
times their diameter, Baldwin (1968) considered the onset
of flame interaction in terms of flame height. Flames were
considered to be interacting if the flame heights increased
more than 10 percent above the independent flame height.
Using square and round gas burners, wood cribs, and large
timber yard fires, Baldwin (1968) (and Baldwin 1966,
Baldwin et al. 1964, Thomas 1968) correlated experimental
data over a wide range of scales and configurations found in
the literature and determined that the flames would interact
if the spacing were less than 0.22 times the flame length.
For a characteristic dimension D and height L, this correlation holds for 1 < L/D < 300. Liu et al. (2007) also found
the same dependency but with a slightly different constant
of proportionality for merging of round pool fires. In their
experiments, flame merging was likely to occur when
closer than 0.29 to 0.34 times the merged flame length.
Delichatsios (2007) also found that flames began to merge
at spacing less than 0.33 times the actual flame length for
gaseous burners. The discrepancy in these constants may
be due to different definitions of flame interaction (tilting
versus change in flame height) and flame merging (using
completely merged flame height versus actual flame height),
different fuels, and possibly uncertainty of measuring flame
dimensions. In comparing the results of the Project Flambeau fires to those using a sand-filled pan burner, Wood et
al. (1971) reported that flames merged if the flame height
was at least half of the fire diameter. Heskestad (1998)
clarified that this occurs when the nondimensional group
N ~Q2/D5 is near 10 -5 (Q is the heat release rate and D is
the fire diameter). Clearly there is no definitive criterion for
when flames begin to interact and merge, and these relations
will remain qualitative guidelines until there is some sort of
unifying theory.
An opposing effect may occur with area fires over
large homogenous fuel beds (small flame height compared
to fire diameter). For a sufficiently large fuel bed, it may be
impossible for a continuous flame to exist over the entire
bed. Instead of one continuous flame, the fire may break
up into many distributed flamelets (Countryman 1969,
Heskestad 1991, Wood et al. 1971). Heskestad (1991) showed
that the breakup of continuous flames occurs when the
2 5
-6
nondimensional group N ~Q /D is near 10 . The convection column for these cases has been described as having
two modes: Bénard cell convection near the surface, which
then merges and transitions to a more organized convective
plume (Fosberg 1967).
Specific Effects of Fire Interaction
Studies of fire interactions involve specific types of behavior of the combustion and observable fire characteristics.
Much of the research on these behaviors comes from laboratory experiments with artificial fuel sources and attempts to
isolate the particular response of interest.
Burning Rate
When fire fronts are close enough to interact and merge,
such as in a mass fire, the mass of fuel burned as a function
of time, or burning rate, of the fire can change dramatically.
Much of the research on fire interactions has been done
using gas burners with a fixed burning rate, but there has
been some work on the interaction of flames over liquid
pool fires and wood crib fires. Although the geometry and
heat transfer mechanisms inside the fuel bed are different,
liquid pool fires are much like fires burning over solid
fuel in that the heat transfer from the fire back to the fuel
controls the burning rate. In contrast, the burning rate of a
54
Synthesis of Knowledge of Extreme Fire Behavior: Volume I for Fire Managers
Figure 4-5—Burning rate as a function of separation distance for 10.1-cm-diameter cyclohexane
burners (from Huffman et al. 1969).
gas burner is controlled by using a fixed fuel supply rate.
Results from pool and crib fire experiments can often be
extended to larger fuel beds using appropriate scaling laws
(Emori and Saito 1983).
The experiments by Huffman et al. (1969) clearly reveal
the effect of spacing on the burning rate of pool fires. In
this work, the burning rate of an array of liquid pools was
measured while keeping a constant fuel depth and varying
the number of pools, pool diameter, fuel, and pool separation distance. In general, the burning rate of each individual
pool burner increases as the burners are brought closer
together and the flames began to interact. In particular,
the pools in the middle of the array show a very dramatic
increase. For example, figure 4-5 shows that the burning
rate of 4-inch (10-cm)-diameter pools of cyclohexane
experienced over a 400 percent increase in burning rate
when the separation distance was halved. At the onset of
flame merging, the burning rate is at its maximum. As the
flames merge, the burning rate decreases as the separation
distance continues to decrease. In the limit of zero separation distance, however, the burning rate of the individual
fires is still larger than if they were burning independently
with no interaction effects. These trends were also seen by
Grumer and Strasser (1965) with solid fuel beds.
Kamikawa et al. (2005) studied the effect of flame
merging on heat release rates (heat released per time). Heat
release rate is calculated by multiplying the burning rate
(mass of fuel burned per time) by the heat of reaction (heat
released per mass of fuel burned). However, the heat of
reaction is dependent on the fuel and the mixture ratio of
fuel to air. In large fire arrays, the inner regions of the array
typically experience a shortage of air. Without sufficient air,
the fuel cannot completely react and release the full potential heat, i.e., the combustion efficiency is low and less heat
is released per mass of fuel. Not surprisingly, Kamikawa et
al. saw the same trend with heat release rates as Huffman
et al. (1969) with burning rates. When the flames are merged,
the heat release rate increases with separation distance.
55
GENERAL TECHNICAL REPORT PNW-GTR-854
As the burners are moved farther apart, more air can penetrate into the inner regions of the array. More air entrainment means greater combustion efficiency and greater heat
release. This, in turn, heats up and evaporates the unburned
fuel more quickly, increasing the burning rate.
Liu et al. (2009) explained the mechanisms behind
these trends in burning and heat release rate with separation
distance. The non-monotonic behavior seen in figure 4-5
is the result of two competing mechanisms: heat feedback
enhancement and air entrainment restriction. As the burners
are moved closer, the view factor between neighboring fires
increases. In other words, the fires can “see” each other
better, increasing the radiative heat transfer in addition to
the convective heat transfer (Grumer and Strasser 1965).
Because the burning rate is dictated by the heat feedback
from the flame, this increased radiative heat seen by the fuel
will evaporate the fuel more quickly and increase the burning rate. Conversely, as the fires get sufficiently close, there
is less room to entrain air inside the array and the flames
become “choked.” When the flames are merely interacting,
the heat feedback mechanism is more important than the air
restriction and the burning rate increases. When the flames
have merged, the air restriction is the dominant mechanism
and the burning rate decreases.
Because the experiments by Kamikawa et al. (2005)
used wood crib fires, they were also able to examine the
release rate as a function of time for merged flames. As
with most wildland fires, the heat release rate (and burning rate) of wood crib fires increases as the fire builds,
reaches a maximum, then begins to decrease as the fuel is
depleted. Kamikawa et al. (2005) made the observation that
as the number of fires increases, the peak heat release rate
increases above that expected by multiplying the independent fire heat release rate by the number of fires. This
discrepancy grows as the number of fires increases. So the
burning and heat release rates of interacting and merging
fires not only are dependent on the spacing of the fires, but
also on the total number of fires (see also Liu et al. 2009).
Fire interactions can increase burning rates by another
mode as well. If the fires interact such that vorticity is gen-
erated, fire whirls can form. Although not discussed further
here, it has been shown that fire whirls have dramatically
increased burning rates in comparison to an equivalent,
nonrotating fire (see e.g., Emmons 1965, Grishin et al. 2004).
Flame Dimensions
Flame height trends for a non-premixed flame, such as those
in a wildfire, are usually discussed in terms of two dimensionless parameters: the dimensionless flame height and the
dimensionless heat release rate. The dimensionless flame
height is usually defined as the flame height divided by
the characteristic burning area diameter (D). The characteristic burning area diameter is a dimensioned parameter
frequently introduced in fire arrays and is usually some
function of the number of fires, fire diameter, and the fire
arrangement (separation distance). The dimensionless heat
release rate (Q*) is usually defined as the total heat release
rate of the group divided by the characteristic burning
area diameter to the five-halves power (material property
constants are used to make the ratio dimensionless: Q* ~
Q tot /D5/2). The dimensionless heat release rate for natural
fires tends to fall between 0.05 and 5 (McCaffrey 1995).
Much of the research on flame height has been performed using gas burners. However, two regimes of flow
from a gas burner can be identified. When the flow velocity
is low or the burner diameter is large, the momentum of
the gaseous fuel is due primarily to its buoyancy. When the
flow velocity is high or the burner diameter is small, the
flow is like a jet. Putnam and Speich (1963) have a method
for determining whether the flow from a gas burner is a
high-momentum jet or buoyancy controlled. The discussion
here will be limited to turbulent, buoyancy-driven flames,
as this situation better describes what occurs during a
wildfire.
In general, the flame height increases as the fires are
moved closer. When the flames begin to merge, the flame
height will dramatically increase with further decreases
in separation distance. However, once the flames are fully
merged, further decreases in separation distance will have
little effect (Chigier and Apak 1975, Fukuda et al. 2004,
56
Synthesis of Knowledge of Extreme Fire Behavior: Volume I for Fire Managers
Lf /D~Q*2
Lf /D~Q*(2/3)
Lf /D~Q*(2/5)
Figure 4-6—Dimensionless flame height (Lf /D) correlations with dimensionless heat release
rate (Q*) (Quintiere and Grove 1998).
Putnam and Speich 1963). The dimensionless flame height
has successfully been correlated to the dimensionless heat
release rate raised to some power, a. Because the dimensionless heat release rate can range over at least seven orders
of magnitude, this power “a” can take on three different
values depending on the range of the dimensionless heat
release rate. As shown in figure 4-6 (Quintiere and Grove
1998), the dimensionless flame height increases with the
dimensionless heat release rate. These correlations were
originally developed for the flame height of a single independent burner where the characteristic dimension is the
burner diameter, and hold for buoyancy-driven gas burners,
liquid pool fires, and wood crib fires. However, there is an
indication that these correlations also apply to interacting
flames when the characteristic burning area dimension is
given as discussed above. For example, for the interaction of
relatively tall flames compared to the actual burner diameter
(Lf /D > 1, or high values of Q*), Putnam and Speich (1963)
and Sugawa and Takahashi (1993) showed that the dimen-
sionless flame height correlates well with the dimensionless
heat release rate to the two-fifths power (Lf /D ~ Q*2/5).
Delichatsios (2007) successfully correlated the dimension
2.5 two thirds power (Lf /D ~ Q*2/3) for Q* between 0.1 and
1. On the other hand, Weng et al. (2004) and Kamikawa et
al. (2005) showed that the data for merged flame height is
better correlated with the exponent “a” varying with the
number of burners.
With all else remaining constant, these correlations
suggest that an increase in either the number of fires or the
individual fire heat release rate will increase the interacting
or merged flame height. Increases in the separation distance
or the fire diameter will result in a decrease in the interacting or merged flame height. An interesting caveat to these
correlations is that the burning rate for individual pool or
crib fires is not constant, but is a function of the separation
distance as discussed above. This trend is not necessarily
captured in figure 4-6 or by Putnam and Speich (1963) (gas
burners), Kamikawa et al. (2005), Fukuda et al. (2004), or
57
GENERAL TECHNICAL REPORT PNW-GTR-854
a
Figure 4-7a—Effect of nearby burners on flame temperature (from Chigier and Apak 1975).
DT is throat diameter, DE is exit diameter, a is separation distance, Tm is merged flame
temperature, and Ts is single flame temperature.
Delichatsios (2007) (all fully merged flames). Also, vorticity
can greatly increase flame height as well (Emmons 1965).
This literature suggests that in a mass fire situation, as
the flames grow closer together, the heat release rate and
characteristic “burner” diameter should increase. The net
effect is most likely an increase in the flame height. If more
spot fires were ignited in the burning area, for example,
the flame height would increase further. This is consistent
with the observations of spot ignitions on prescribed burns
(Johansen 1984) and mass spotting in wildfires (Cheney
and Bary 1969). However, for a sufficiently large area or
mass fire, when the nondimensional group N ~Q2/D5 is near
10 -6, the fire is not expected to burn as a continuous flame
but will break up into many distributed flamelets (Countryman 1969, Heskestad 1991, Wood et al. 1971). In this case,
the flame height will be less than that predicted for a fully
merged, continuous flame but larger than that of isolated
flames (Thomas 1963).
Flame Temperatures and Pollutants
As discussed in relation to flame height, as fires are moved
closer together, air entrainment is blocked and the gaseous
fuel must travel higher to find sufficient air for combustion.
Experiments by Chigier and Apak (1975) indicated that a
fuel particle on its journey from the base to the tip of an
interacting turbulent flame would experience delayed combustion compared to an independent flame (see fig. 4-7a).
The delay means that the maximum temperature of the
interacting flames would occur further from the flame base.
With limited mixing of fresh air into the flame to provide
cooling, the temperatures inside an interacting flame decay
more slowly with height so the flame is hot over a greater
portion. In addition, limited mixing of air into the flames
causes the formation of more carbon monoxide inside the
flame zone. This prompted Countryman (1969) to speculate
that the lack of oxygen in conjunction with elevated carbon
monoxide could be fatal to ground personnel trapped inside
the burning area.
58
Synthesis of Knowledge of Extreme Fire Behavior: Volume I for Fire Managers
b
Figure 4-7b—Temperature compared to independent flame for varying axial distance along flame,
number of burners, burner arrangement, and burner spacing (from Chigier and Apak 1975).
Chigier and Apak (1975) also showed that the maximum temperature achieved by interacting turbulent flames
is also a function of the separation distance and the number
of burners (see fig. 4-7b). When the flames are close enough
to interact, they lose less heat from radiation (the surroundings are at the same temperature) and by mixing with cool,
fresh air. The maximum temperatures inside interacting
flames therefore increase as the number of fires increases
and as the burners get closer together. These increased temperatures could produce more of the smog-forming nitrogen
oxide emissions (Tarr and Allen 1998).
the standard correlations of plume theory are valid only
above the flame. Although several plume theories exist
in the literature (see review in Heskestad 2008), there is
general agreement that the total mass of air entrained can be
estimated as proportional to the convective heat release rate
(heat release rate minus radiative and other losses) raised to
the one-third power and to the height above the fire source
to the five-thirds power. Fires with greater heat release
rate entrain more air, and the total amount of air entrained
increases with height above the plume. Note, however, that
the velocity of the flow inside the plume decreases with
height, so at some point near the top of the plume no further
air is entrained (no velocity difference). Current research
on the indraft caused by entrainment as related to fire
interactions is focused mainly on providing better quantitative predictions with computational fluid dynamics (CFD)
modeling (Morvan et al. 2009, Roxburgh and Rein 2008).
However, plumes from wildfires can interact with local
meteorology (Weber and Dold 2006) such as wind and
atmospheric conditions. Additionally, classic plume theory
Indraft Velocity
In typical fire situations where the flame height is relatively
tall compared to the fire diameter, standard correlations
exist to predict the mass of air entrained by the fire and its
plume owing to the velocity difference between the plume
gases and the ambient air. This air entrainment causes an
inflow into the fire and is generally responsible for the
bending of two flames in relative proximity. However,
59
GENERAL TECHNICAL REPORT PNW-GTR-854
for entrainment rates may not hold for small ratios of the
flame height to fire diameter (Lf /D). Although the exact
threshold is not known, Heskestad (2008) contends that
the standard plume theory falls apart for Lf /D somewhere
between 0.14 to 0.9. The perimeter of the plume where
entrainment occurs becomes too small in relation to the
volume of air inside and the slow moving entrained air will
not have much effect on the momentum of the entire plume.
Mass fires by definition fall into the range of flame height
to fire diameter ratios where classic plume theory does not
hold. The results of the Project Flambeau burns confirm that
there is little entrainment into the plume core (Palmer 1981).
Many authors (e.g., Adams et al. 1973, Small et al. 1983,
Smith et al. 1975) also argue that the entrainment of plume
theory does not account for the reported high-velocity winds
associated with mass fires. As discussed earlier, mass fires
are characterized by such strong indrafts that the fire does
little outward propagation. In their review of the range of
possible indraft velocities, Trelles and Pagni (1997) showed
that indraft velocities of large fires can range from about
2 to 40 m/s. In the Project Flambeau burns, Countryman
(1964, 1965, 1969) also reported complicated airflow patterns and strong downdrafts that cannot be accounted for
with simple plume theory.
There seem to be two main theories in the literature
as to what causes the high-velocity inflows. One theory,
advanced by Baum and McCaffrey (1989) and Carrier et al.
(1985) is that large-scale vorticity in conjunction with heat
release is responsible. These models contend that the entire
fire plume slowly rotates. Note, however, that Church et
al. (1980) and McRae and Flannigan (1990) characterized
this type of motion as one type of fire whirl. In Baum and
McCaffrey’s model (also used by Trelles and Pagni 1997
and Ohlemiller and Corley 1994), this rotation is caused
by density gradients from the high heat release, and not
necessarily by any imposed swirling caused by the ambient
environment. The slow rotation of such a large mass of air
above the ground translates to high-velocity, purely horizontal, and nonrotating flow at the ground. One unique feature
of the Baum and McCaffrey model is that it treats the large
area fire as an ensemble of randomly distributed individual
fires of varying strengths. Because of the method chosen
to represent the fire, the model is only valid for heights
above the fuel bed where the plumes of the individual fires
have not merged. The model of Carrier et al. (1985) was
intended to determine how long it would take to spin up the
convective column and under what conditions this occurred.
Based on the fact that the fire in Hamburg, Germany, took 2
hours to develop, they concluded that the growth of swirl, at
least in this case, was most likely due to the intensification
of a preexisting vortex from earlier fires and bombings.
Although this contradicts the Baum and McCaffrey model,
the experiments and discussion by Church et al. (1980)
support this argument. The spatial orientation of individual
fires may cause a swirling flow owing to the interaction of
the indrafts to each fire (Soma and Saito 1991). Carrier et
al. (1985) found that large-diameter plumes spin up faster,
and proposed a set of four criteria that must be met for a
6
“firestorm” to develop: heat release of 10 MW over a localized area for 2 to 3 hours, a preexisting weak vortex, low
ambient winds, and a nearly dry-adiabatic lapse rate over
the first few kilometers of the atmosphere.
Because it seems unlikely that all the criteria for
spin-up of a convective column will be met, another theory,
advanced by Smith et al. (1975) and Small et al. (1983) is
proposed. These authors claimed that buoyancy-induced
pressure gradients are responsible for the large indrafts.
Smith et al. (1975) used a simple two-dimensional model of
a convective column over a hot area to effectively show that
near the fire, a dynamic pressure gradient can cause highvelocity inflow. This dynamic pressure gradient is caused
by a balance between hydrostatic pressure and buoyancy.
Buoyancy pushes the hot gases up while atmospheric
pressure pushes fresh air at the ground in toward the fire
horizontally to fill the gap left by the rising gases. Smith
et al. (1975) also suggested that the traditional “weakly
buoyant” plume theories described above may be valid for a
small range of plume heights sufficiently far away from the
fire and any inversion layer above. Small et al. (1983) used
a similar model to that of Smith et al. (1975) but included
60
Synthesis of Knowledge of Extreme Fire Behavior: Volume I for Fire Managers
Figure 4-8—Model results for flow-field streamlines for three fires in proximity (from Weihs and Small 1986).
a volume heat addition and large density and temperature
gradients. Small et al. (1983) also numerically matched
their model results of the area near the fire to the results of
traditional plume theory for the region far from the fire. In
both the Smith et al. (1975) and Small et al. (1983) models,
the fire is treated as a single large heat source (fig. 4-8).
Small et al. (1983) used their model to demonstrate how the
maximum indraft velocity varies with fire radius, burning
rate, and fire height (fig. 4-8). They showed that the maximum indraft velocity at first increases but eventually levels
point source. Interestingly, both the Baum and McCaffrey
(1989) and Small et al. (1983) models reasonably replicate
what little experimental data are available. However, the
theories differ slightly in their predictions of the distance
away from the fire that these indrafts extend (Pitts 1991).
The model of Baum and McCaffrey (1989) predicts that the
high-velocity indrafts will extend much farther from the fire
compared to the model of Small et al. (1983). Without more
detailed experimental data, it is impossible to say which
model more accurately portrays the physics.
off (to approximately 40 m/s) with increases in both the fire
radius and the burning rate. On the other hand, the maximum indraft velocity appears to be linear with fire height.
A third, not yet well-explored explanation was proposed by Carrier et al. (1984). In this work, they used classic
plume theory, but assumed that the fire does not burn as a
single fire, but a collection of individual fires. They hypothesized that the high indraft velocities are then due to the
increased fire perimeter from this “multicellular burning
zone.” This hypothesis was not further developed, and in
later works, these authors treated the fire as a subterranean
Pulsation
Although not an effect of flame interactions, flame pulsation
(or puffing) is an interesting phenomenon that can occur in
stationary fires, such as a mass fire. This pulsation typically
occurs in circular or axisymmetric fires in weak ambient
wind and is periodic in nature. Flame pulsation is important
to many researchers because it can have a large influence
on air entrainment rates and therefore heat release rates and
pollution formation (Ghoniem et al. 1996). Observations of
this phenomenon reveal the expansion of the flame near the
61
GENERAL TECHNICAL REPORT PNW-GTR-854
0.5
dimensionless “buoyancy” number, π2 = Qc /[(gD) pcpT],
where Qc is the rate of convective heat release per area, g is
the acceleration due to gravity, D is the fire diameter, and ρ,
cp, and T are the density, specific heat, and temperature of
the ambient air. Although no quantitative values were given,
they argued that a fire will not pulsate if π2 is either too
small (low heat release rate relative to large fire diameter)
or too large (large heat release rate relative to small fire
diameter).
Because this puffing occurs in nonreacting helium
plumes, it is actually not caused by a combustion instability, but instead is produced by a fluid dynamic instability
(Cetegen and Ahmed 1993). There is disagreement about the
actual cause of the instability (Tieszen 2001), but the vortex
is generally thought to be formed because of the interaction
between gravity and the density gradient between the flame
and ambient air temperatures (Ghoniem et al. 1996).
Most of what has been learned about the characteristics
of pulsation has been learned through experiments. Cetegen
and Ahmed (1993) showed that the toroidal vortex forms
within one fire diameter above the flame base and that the
frequency of the puffing is insensitive to the fuel or the heat
release rate. By plotting the available data in the literature,
Cetegen and Ahmed, and later Malalasekera et al. (1996),
showed that the pulsation frequency is proportional to the
-1/2
fire diameter raised to the negative one-half power ( f ~D )
so that large fires pulsate at a much lower frequency than
small fires. Though this correlation was developed using
data from fires ranging from 0.1 to 100 m in diameter (four
orders of magnitude) using gaseous, liquid, and solid fuels,
Baum and McCaffrey (1989) suggested that it may well hold
for much larger fires as well. For a large fire with a diameter
on the order of 20 km, Larson et al. (1982) estimated that
the pulsation will occur every 20 min. Although it is not
accounted for in the above correlation, Malalasekera et al.
(1996) showed that increasing fuel flow rates also result in a
small increase in puffing frequency, especially for small fire
sizes. Because of this, Malalasekera et al. (1996) correlated
the puffing frequency in a slightly different manner using
the dimensionless Strouhal number (ratio of oscillation
frequency to 1 over the characteristic time of convection)
Figure 4-9–Thermal images of flame pulsation (from Malalasekera
et al. 1996).
base of the fire as a toroidal vortex, about the size of the fire
diameter. As this vortex is shed and propagates upward, the
flame necks inward giving the appearance of a “mushroom”
shape. Figure 4-9 illustrates the process with time sequence
of photos. Not all circular flames pulsate, however. Using
dimensional analysis, Byram and Nelson (1970) attempted
to describe what type of fires will pulsate. They defined a
62
Synthesis of Knowledge of Extreme Fire Behavior: Volume I for Fire Managers
and Froude number (ratio of inertia force to gravitational
force), which retains the same dependency on fire diameter
but allows for a correction owing to changes in fuel flow
velocity.
Palmer (1981) described the interesting structure of
the convection columns that formed during the Project
Flambeau tests. In the first few minutes of these large-scale
burns, the majority of the gaseous combustion products
were contained in a “bubble” near the fire. Once the
“bubble” got sufficiently hot, the associated buoyancy was
enough to overcome the surface drag forces and the bubble
rose. As the bubble rose, a vortex ring would form in a
similar manner described above with respect to flame pulsations. Regardless of the atmospheric stability, this vortex
ring would rise until it encountered a region of vertical wind
shear. The vertical wind shear weakened the vortex enough
for the plume to then follow the prevailing horizontal winds.
Palmer (1981) also noted that the “exterior form of the
convection column at a particular altitude was determined
by the initial vortex bubble as it passed that altitude.” Most
of the plumes in these fires began to rotate as a single vertical vortex, as suggested by the Baum and McCaffrey (1989)
model. This rotation further inhibits entrainment, which
would also prevent the use of classic plume models for mass
fires (Banta et al. 1992).
Convection Column
Mass fires are also described as having very tall convection columns, or smoke plumes with large cloud structures
because of the moisture release from combustion (Small
and Heikes 1988). As discussed in the section on indraft
velocities, the entrainment of cold, ambient air slows the
rise of the hot gases by cooling them. Additionally, the
density of the ambient air itself decreases with elevation. As
the hot gases rise and cool, the density difference driving
their upward motion disappears. It follows then that the top
of the smoke plume corresponds to the height where the
combustion products stop rising. As the fire diameter grows,
however, the entrainment predicted by classic plume theory
becomes less effective. Entrainment occurs at the perimeter
of the plume, and with large fire sources there is such a
large core of hot gases that entrainment is less effective at
slowing the rise of the combustion products (Palmer 1981).
Thus, it takes longer to entrain enough cold air to slow
the combustion products, and therefore the smoke plume
becomes taller. For example, a lack of entrainment to the
convection column was noted and discussed by Taylor et
al. (1973) on a large prescribed burn. In fact, the plume
from a sufficiently large mass fire may be almost as wide
as it is tall, so Brode and Small (1986) and Palmer (1981)
contended that air entrainment is not likely to be a major
influence on plume height and that it is the structure of the
atmosphere itself that is the limiting factor. The plume of
large mass fires is therefore more sensitive to atmospheric
gradients, inversion heights, and upper atmosphere crosswinds (see also Penner et. al 1986). Brode and Small (1986)
showed that the tropopause/stratosphere transition may be
what actually caps the smoke plume. Note, these theories
contradict the suggestion of Smith et al. (1975) that the
traditional plume theory holds at some intermediate height
above the ground. Perhaps the scale of the fires modeled by
Smith et al. (1975) was not large enough to see this effect.
Summary of Interaction Effects
As the individual spot fires grow together, they will begin
to interact. This interaction will increase the burning
rates, heat release rates, and flame height until the distance
between them reaches a critical level. At the critical separation distance, the flames will begin to merge together and
burn with the maximum rate and flame height. As these
spot fires continue to grow together, the burning and heat
release rates will finally start to decrease but remain at a
much elevated level compared to the independent spot fire.
The flame height is not expected to change significantly.
The more spot fires, the bigger the increase in burning rate
and flame height.
Needs for Further Research and
Application
The characteristics of many fire interactions have been
examined and reported in the research literature, leaving
63
GENERAL TECHNICAL REPORT PNW-GTR-854
little doubt that local spread and behavior experienced by
wildland fire personnel can be greatly influenced by fire
configurations at larger scales. The ignition patterns and
“suppression fire” tactics used in firefighting (Castellnou
et al. 2010, Miralles et al. 2010) depend on understanding
these interactions. However, questions remain about how
to extend the findings of fundamental research to the field
scale for wildland fires and mass fires. In particular, there
is no clear method to determine the minimum separation
distance between two fires for interaction and merging to
occur. The influence of ambient winds or topography on
interactions is directly relevant to wildfire management
activities and tactics but has not been explored. Large-area
fires were discussed as an extreme case of fire interactions
and often behave quite differently than propagating line
fires. Just how much area must be ignited to display “mass
fire” characteristics is unknown. In the Project Flambeau
experiments, Countryman (1964) argued that even these
large fires were not large enough to be considered mass
fires. Both Byram (1966) and Thomas et al. (1968) developed scaling laws in an attempt to answer this question, but
many potentially limiting assumptions were made in the
development and the laws were not validated. Baldwin and
North (1967) attempted to quantify the minimum area for
urban applications based on city layout and historical fires,
but their estimations are admittedly crude. As discussed,
there is no consensus in the literature about the convection
column dynamics of mass fires and what mechanism is
responsible for the reported strong indrafts. These suggestions are merely a starting point, as the subjects of fire
interactions and mass fires clearly involve a great deal of
physics and require the union of many fields of study.
Albini, F.A. 1981. A model for the wind-blown flame from
a line fire. Combustion and Flame. 43: 155–174.
Literature Cited
Baum, H.; McCaffrey, B. 1989. Fire induced flow field–
theory and experiment. Fire Safety Science. 2: 129–148.
Adams, J.S.; Williams, D.W.; Tregellas-Williams,
J. 1973. Air velocity, temperature, and radiant-heat
measurements within and around a large free-burning
fire. Symposium (International) on Combustion.
14: 1045–1052.
Albini, F.A. 1982. Response of free-burning fires to
nonsteady wind. Combustion Science and Technology.
29: 225–241.
Anderson, H.E. 1968. The Sundance Fire. Res. Pap. INT56. Ogden, UT: U.S. Department of Agriculture, Forest
Service, Intermountain Forest and Range Experiment
Station. 39 p.
Arnold, R.K.; Buck, C.C. 1954. Blow-up fires—
silviculture or weather problems. Journal of Forestry.
1954(June): 408–411.
Baldwin, R. 1966. Some tentative calculations of flame
merging in mass fires. Fire Research Note 629. Boreham
Wood, Hertfordshire, England: Fire Research Station.
Baldwin, R. 1968. Flame merging in multiple fires.
Combustion and Flame. 12(4): 318–324.
Baldwin, R.; North, M.A. 1967. The firestorm—its size
and importance. Fire Research Note 645. Boreham
Wood, Hertfordshire, England: Fire Research Station.
Baldwin, R.; Thomas, P.H.; Wraight, H.G.G. 1964. The
merging of flames from separate fuel beds. Fire Research
Note 551. Boreham Wood, Hertfordshire: Fire Research
Station.
Banta, R.M.; Olivier, L.D.; Holloway, E.T.; Kropfli,
R.A.; Bartram, B.W.; Cupp, R.E.; Post, M.J. 1992.
Smoke-column observations from two forest fires using
Doppler LIDAR and Doppler radar. Journal of Applied
Meteorology. 31: 1328–1348.
Beaufait, W.R. 1965. Characteristics of backfires and
headfires in a pine needle fuel bed. Res. Note INT-39.
Ogden, UT: U.S. Department of Agriculture, Forest
Service, Intermountain Forest and Range Experiment
Station.
64
Synthesis of Knowledge of Extreme Fire Behavior: Volume I for Fire Managers
Beer, T. 1995. Fire propagation in vertical stick arrays: the
effects of wind. International Journal of Wildland Fire.
5(1): 43–49.
Carrier, G.F.; Fendell, F.E.; Feldman, P.S. 1985.
Firestorms. Journal of Heat Transfer. 107: 19–27.
Castellnou, M.; Kraus, D.; Miralles, M.; Delogu, G.
2010. Suppression fire use in learning organizations.
In: Silva, J.S.; Rego, F.; Fernandes, P.; Rigolot, E., eds.
Towards integrated fire management—outcomes of the
European Project Fire Paradox. Res. Rep. 23. Joensu,
Finland: European Forest Institute: 189–201. Chapter 5.2.
Beverly, J.L.; Wotton, B.M. 1997. Modelling the
probability of sustained flaming: predictive value of fire
weather index components compared with observations
of site weather and fuel moisture conditions.
International Journal of Wildland Fire. 16: 161–173.
Catchpole, E.A.; DeMestre, N.J.; Gill, A.M. 1982.
Intensity of fire at its perimeter. Australian Forest
Research. 12: 47–54.
Bradstock, R.A.; Gill, A.M. 1993. Fire in semi-arid
Mallee shrublands: size of flames from discrete fuel
arrays and their role in the spread of fire. International
Journal of Wildland Fire. 3(1): 3–12.
Cetegen, B.M.; Ahmed, T.A. 1993. Experiments on the
periodic instability of buoyant plumes and pool fires.
Combustion and Flame. 93: 157–184.
Brode, H.L.; Small, R.D. 1986. A review of the physics
of large urban fires. In: The medical implications of
war. Washington, DC: Institute of Medicine, National
Academies Press. 620 p.
Chandler, C.C. 1963. A study of mass fires and
conflagrations. Res. Note PSW-N22. Berkeley, CA:
U.S. Department of Agriculture, Forest Service, Pacific
Southwest Forest and Range Experiment Station. 9 p.
Brown, J.K. 1982. Fuel and fire behavior prediction
in big sagebrush. Res. Pap. INT-290. Ogden, UT:
U.S. Department of Agriculture, Forest Service,
Intermountain Forest and Range Experiment Station.
Chandler, C.C.; Storey, T.G.; Tangren, C.D. 1963.
Prediction of fire spread following nuclear explosions.
Res. Pap. PSW-5. Berkeley, CA: U.S. Department of
Agriculture, Forest Service, Pacific Southwest Forest and
Range Experiment Station. 110 p.
12 p.
Bruner, A.D.; Klebenow, D.A. 1979. Predicting success of
prescribed fires in pinyon-juniper woodland in Nevada.
Res. Pap. INT-219. Ogden, UT: U.S. Department of
Agriculture, Forest Service, Intermountain Forest and
Range Experiment Station. 12 p.
Cheney, N.P. 1981. Fire behavior. In: Gill, A.M.; Groves,
R.H.; Noble, I.R., eds. Fire and the Australian biota.
Canberra, ACT: Australian Academy of Science:
151–175. Chapter 7.
Burrows, N.; Ward, B.; Robinson, A. 1991. Fire behavior
in spinefex fuels on the Gibson Desert Nature Reserve,
Western Australia. Journal of Arid Environments.
20: 189–204.
Cheney, N.P.; Bary, G.A.V. 1969. The propagation of
mass conflagrations in a standing eucalypt forest by the
spotting process. In: Proceedings, Mass fire symposium.
Canberra, Australia: Defense Standards Laboratory:
1 (Sessions A and B): 1–11.
Byram, G.M. 1966. Scaling laws for modeling mass fires.
Pyrodynamics. 4: 271–284.
Byram, G.M.; Nelson, R.M. 1970. The modeling of
pulsating fires. Fire Technology. 6(2): 102–110.
Cheney N.P.; Gould J.S. 1995. Fire growth in grassland
fuels. International Journal of Wildland Fire. 5: 237–247.
Carrier, G.; Fendell, F.; Feldman, P. 1984. Big fires.
Combustion Science and Technology. 39: 135–162.
Chigier, N.A.; Apak, G. 1975. Interaction of multiple
turbulent diffusion flames. Combustion Science and
Technology. 10 (5-6): 219–231.
65
GENERAL TECHNICAL REPORT PNW-GTR-854
Church, C.R.; Snow, J.T.; Dessens, J. 1980. Intense
atmospheric vortices associated with a 1000 MW fire.
Bulletin of the American Meteorological Society.
61(7): 682–694.
Countryman, C.M. 1964. Mass fires and fire behavior.
Res. Pap. PSW-19. Berkeley, CA: U.S. Department of
Agriculture, Forest Service, Pacific Southwest Forest and
Range Experiment Station. 53 p.
Countryman, C.M. 1965. Mass fire characteristics in large
scale tests. Fire Technology. 2: 303–317.
Countryman, C.M. 1969. Project Flambeau… an
investigation of mass fire (1964–1967) final report.
Prepared for Office of Civil Defense under OCD
Work Order No. OCD-PS-65-26. Berkeley, CA: U.S.
Department of Agriculture, Forest Service, Pacific
Southwest Forest and Range Experiment Station.
Volume 1.
Curry, J.R.; Fons, W.L. 1938. Rate of spread of surface
fires in the ponderosa pine type of California. Journal of
Agriculture Research. 57(2): 39–267.
Delichatsios, M. 2007. A correlation for the flame height in
“group” fires. Fire Science and Technology. 26(1): 1–8.
Dold, J.W.; Zinoviev, A. 2009. Fire eruption through
intensity and spread rate interaction mediated by flow
attachment. Combustion Theory and Modeling.
13(5): 763–793.
Dold, J.W.; Zinoviev, A.; Weber, R.O. 2006. Nonlocal
flow effects in bushfire spread rates. Paper presented
at V International conference on forest fire research.
Manchester, United Kingdom: University of Manchester.
9 p.
Eggleston, L.A. 1968. Electronic simulation of mass fires.
Spring meeting of the Central States Section of the
Combustion Institute. Los Angeles, CA: University of
Southern California: 1–11.
Emmons, H.W. 1965. Fundamental problems of the free
burning fire. Symposium (International) on Combustion.
10: 951–964.
Emori, R.I.; Saito, K. 1983. A study of scaling laws in
pool and crib fires. Combustion Science and Technology.
31: 217–231.
Fendell, F.E.; Wolff, M.F. 2001. Wind-aided fire spread.
In: Johnson, E.A.; Miyanishi, K., eds. Forest fires:
behavior and ecological effects. Maryland Heights, MO:
Academic Press: 171–223.
Finney, M.A.; Cohen, J.D.; Yedinak, K.M.; Grenfell,
I.C. 2010. An examination of fire spread thresholds
in discontinuous fuelbeds. International Journal of
Wildland Fire. 19(2): 163–170.
Fosberg, M.A. 1967. Evaluation of the natural length
scale in mass fires. Proceedings: Tripartite technical
cooperation program panel N-3 (thermal radiation) mass
fire research symposium, DASA 1949. Special Report
59. Defense Atomic Support Agency Information and
Analysis Center.
Fukuda, Y.; Kamikawa, D.; Hasemi, Y.; Kagiya, K.
2004. Flame characteristics of group fires. Fire Science
and Technology. 23(2): 164–169.
Gebhart, B.; Shaukatullah, H.; Pera, L. 1976.
The interaction of unequal laminar plane plumes.
International Journal of Heat and Mass Transfer.
19: 751–756.
German, D. 1968. Mass fire infrared measurements.
Report D3-7655. Wichita, KS: Boeing Company.
Ghoniem, A.F.; Lakkis, I.; Soteriou, M. 1996. Numerical
simulation of the dynamics of large fire plumes and the
phenomenon of puffing. Symposium (International) on
Combustion. 26: 1531–1539.
Grishin, A.M.; Golovonov, A.N.; Sukov, Y.V. 2004.
Physical modeling of firestorms. Doklady Physics.
49(3): 191–193.
66
Synthesis of Knowledge of Extreme Fire Behavior: Volume I for Fire Managers
Grumer, J.; Strasser, A. 1965. Uncontrolled fires—
specific burning rates and induced air velocities. Fire
Technology. 1(4): 256–268.
Larson, D.A.; Small, R.D. 1982a. Analysis of the large
urban fire environment: Part I. Theory. PSR Report 1210.
Final report contract EMW-C-0747. Arlington, VA:
Pacific-Sierra Research Corp.
Heskestad, G. 1991. A reduced-scale mass fire experiment.
Combustion and Flame. 83: 293–301.
Larson, D.A.; Small, R.D. 1982b. Analysis of the large
urban fire environment: Part II. Parametric analysis and
model city simulations. PSR Report 1210. Final report
contract EMW-C-0747. Arlington, VA: Pacific-Sierra
Research Corp.
Heskestad, G. 1998. Dynamics of the fire plume.
Philosophical Transactions of the Royal Society of
London: A356: 2815–2833.
Heskestad, G. 2008. Fire plumes, flame height, and
air entrainment. SFPE handbook of fire protection
engineering. 4th ed. Quincy, MA: National Fire
Protection Association.
Lee, B.T. 1969a. Mass fire scaling with small electrically
heated models. Spring meeting of the Central States
Section of the Combustion Institute. Minneapolis, MN:
University of Minnesota: 1–2.
Hewitt, K. 1983. Place annihilation: area bombing and
the fate of urban places. Annals of the Association of
American Geographers. 73(2): 257–284.
Lee, B.T. 1969b. Mass fire scaling with small electrically
heated models. NRDL-TR-69. Final report, Office of
Civil Defense contract No. DAHC20-67-C-0149. San
Francisco, CA: Naval Radiological Defense Laboratory.
Huffman, K.G.; Welker, J.R.; Sliepcevich, C.M.
1969. Interaction effects of multiple pool fires. Fire
Technology. 5(3): 225–232.
Leonard, S. 2009. Predicting sustained fire spread
in Tasmanian native grasslands. Environmental
Management. 44: 430–440.
Johansen, R.W. 1984. Prescribed burning with spot fires
in the Georgia coastal plain. Forest Res. Pap. 49. Macon,
GA: Georgia Forestry Commission. 6 p.
Liu, N.; Liu Q.; Deng, Z.; Satoh, K.; Zhu, J. 2007.
Burn-out time data analysis on interaction effects
among multiple fires in fire arrays. Proceedings of the
Combustion Institute. 31: 2589–2597.
Johansen, R.W. 1987. Ignition patterns and prescribed fire
behavior in southern pine forests. Forest Res. Pap. 72.
Macon, GA: Georgia Forestry Commission.
Kamikawa, D.; Wend, W.G.; Kagiya, K.; Fukuda, Y.;
Mase, R.; Hasemi, Y. 2005. Experimental study of
merged flames from multifire sources in propane and
wood crib burners. Combustion and Flame. 142: 17–23.
Liu, N.; Liu, Q.; Lozano, J.S.; Shu, L.; Zhang, L.;
Zhu, J.; Deng, Z.; Satoh, K. 2009. Global burning
rate of square fire arrays: experimental correlation and
interpretation. Proceedings of the Combustion Institute.
32: 2519-2526.
Kucuk, O.; Bilgili, E.; Baysal, I. 2007. Fire development
from a point source in surface fuels of a mature
Anatolian black pine stand. Turkish Journal of
Agriculture and Forestry. 31: 263–273.
Lommasson, T.E.; Keller, J.A.; Kirkpatrick, R.G. 1967.
Firestorm analysis. DC–TN-2046-1. Division of Fire
Research U.S. Forest Service contract No. 13-248. Los
Angeles, CA: Dikewood Corporation.
Larson, D.A.; Brode, H.L.; Small, R.D. 1982. Timedependent model of flows generated by large area fires.
Note 483. Los Angeles, CA: Pacific-Sierra Research
Corp.
Lommasson, T.E.; Miller, R.K.; Kirkpatrick, R.G.;
Keller, J.A. 1968. A firestorm existence and buildup
hypothesis. DC-FR-1058.0. Defense Atomic Support
Agency contract No. DASA 01-67-C-0008. Los Angeles,
CA: Dikewood Corporation.
67
GENERAL TECHNICAL REPORT PNW-GTR-854
Luke, R.H.; McArthur, A.G. 1978. Bushfires in Australia.
Canberra, ACT, Australia: Australian Government
Publishing Service. 359 p.
Malalasekera, W.M.G.; Versteed, H.K.; Gilchrist, K.
1996. A review of research and an experimental study on
the pulsation of buoyant diffusion flames and pool fires.
Fire and Materials. 20: 261–271.
Marsden-Smedley, J.B. 2009. Planned burning in
Tasmania: operational guidelines and review of current
knowledge. Hobart, Tasmania: Fire Management
Section, Parks and Wildlife Service, Department of
Primary Industries, Parks, Water and the Environment.
Marsden-Smedley, J.B.; Catchpole, W.R.; Pryke,
A. 2001. Fire modeling in Tasmanian buttongrass
moorlands. IV. Sustaining versus non-sustaining fire.
International Journal of Wildland Fire. 10: 255–262.
Martin, R.E.; Dell, J.D. 1978. Planning for prescribed
burning in the inland Northwest. Gen. Tech. Rep. GTR76. Portland, OR: U.S. Department of Agriculture, Forest
Service, Pacific Northwest Forest and Range Experiment
Station. 74 p.
Martin, R.E.; Finney, M.A.; Molina, D.M.; Sapsis,
D.B.; Stephens, S.L.; Scott, J.H.; Weise, D.R. 1991.
Dimensional analysis of flame angles versus wind speed.
th
In: Andrews, P.L.; Potts, D., eds. 11 Conference on
fire and forest meteorology. Bethesda, MD: Society of
American Foresters: 212–218.
McAlpine, R.S.; Wakimoto, R.H. 1991. The acceleration
of fire from point source to equilibrium spread. Forestry
Science. 37(5): 1314–1337.
McArthur, A.G. 1969a. The behavior of mass fires in felled
eucalypt forest originating from a simultaneous grid or
line ignition system. Paper A1. In: Mass fire symposium.
Canberra, Australia: Defense Standards Laboratory:
1–34.
McArthur, A.G. 1969b. The Tasmanian bushfires
th
of 7 February, 1967, and associated fire behavior
characteristics. Paper A7. In: Mass fire symposium.
Canberra, Australia: Defense Standards Laboratory:
1–23.
McCaffrey, B. 1995. Flame heights. SFPE handbook of fire
protection engineering. 2nd ed. Quincy, MA: National
Fire Protection Association.
McRae, D.J. 1999. Point-source fire growth in jack pine
slash. International Journal of Wildland Fire. 9(1): 65–77.
McRae, D.J.; Flannigan, M.D. 1990. Development of
large vortices on prescribed fires. Canadian Journal of
Forest Research. 20: 1878–1887.
McRae, D.J.; Jin, J.-Z.; Conard, S.G.; Sukhinin,
A.I.; Ivanova, G.A.; Blake, T.W. 2005. Infrared
characterization of fine-scale variability in behavior of
boreal forest fires. Canadian Journal of Forest Research.
35: 2194–2206.
Miralles, M.; Kraus, D.; Molina, F.; Loureiro, C.;
Delogu, G.; Ribet, N.; Vilalta, O. 2010. Improving
suppression fire capacity. In: Silva, J.S.; Rego, F.;
Fernandes, P.; Rigolot, E., eds. Towards integrated fire
management—outcomes of the European Project Fire
Paradox. Res. Rep. 23. Joensu. Finland: European Forest
Institute: 203–215. Chapter 5.3.
Morvan, D.; Hoffman, C.; Rego, F.; Mell, W. 2009.
Numerical simulation of the interaction between two
fire fronts in the context of suppression fire operations.
th
In: 8 Symposium on fire and forest metrology. Boston,
MA: American Meteorological Society: 1–11.
Nelson, R.M.; Adkins, C.W. 1986. Flame characteristics
of wind-driven surface fires. Canadian Journal of Forest
Research. 16: 1293–1300.
Nielson, H.J. 1970. Mass fire data analysis. Final report
for Defense Atomic Support Agency Report No.
2018. Project J6099. Chicago, IL: Illinois Institute of
Technology Research Institute.
68
Synthesis of Knowledge of Extreme Fire Behavior: Volume I for Fire Managers
Nielson, H.J.; Tao, K.; Wolf, L. 1963. Analysis of
convection column above a fire storm. Final report,
Office of Civil Defense contract No. OCD-OS-62-82.
Chicago, IL: Illinois Institute of Technology Research
Institute.
Quintiere, J.G. 1993. Canadian mass fire experiment.
Journal of Fire Protection Engineering. 5(2): 67–78.
Quintiere, J.G.; Grove, B.S. 1998. A unified analysis for
fire plumes. Proceedings of the Combustion Institute.
27: 2757–2766.
Nmira, F.; Consalvi, J.L.; Boulet, P.; Porterie, B. 2010.
Numerical study of wind effects on the characteristics of
flames from non-propagating vegetation fires. Fire Safety
Journal. 45: 129–141.
Rios, J. 1966. Interaction effects of wind-blown proximate
flames from burning wood cribs. Norman, OK:
University of Oklahoma. Ph.D. thesis.
Rios, J.; Welker, J.R.; Sliepcevich, C.M. 1967. Interaction
of wind-blown flames from wood crib fires. Fire
Ohlemiller, T.; Corley, D. 1994. Heat release rate and
induced wind field in a large scale fire. Combustion
Science and Technology. 97: 315–330.
Technology. 3(2): 129–136.
Rothermel, R.C. 1984. Fire behavior considerations of
aerial ignition. In: Mutch, R.W., tech. coord. Prescribed
fire by aerial ignition: proceedings of a workshop.
Intermountain Fire Council: 143–158.
Palmer, T.Y. 1981. Large fire winds, gases and smoke.
Atmospheric Environment. 15(10/11): 2079–2090.
Parker, W.J. 1967. Urban mass fire scaling considerations.
USNRDL-TR-67-150. San Francisco, CA: U.S. Naval
Radiological Defense Laboratory, OCD Work Unit No.
2536F.
Roxburgh, R.; Rein, G. 2008. Study of wildfire indraft flows for counter fire operations. Proceedings,
forest fires: modelling, monitoring, and management
of forest fires. WIT Transactions on Ecology and the
Environment. 119: 13–22.
Penner, J.E.; Haselman, L.C.; Edwards, L.L. 1986.
Smoke-plume distributions above large-scale fires:
implications for simulations of “nuclear winter.” Journal
of Climate and Applied Meteorology. 25: 1434–1444.
Sanderlin, J.C.; Ball, J.A.; Johanson, G.A. 1981. Mass
fire model concept. DNA 5803F. Final report for period
8 September 1980–31 May 1981. Contract No. DNA
001-80-C-0351. Santa Barbara, CA: Mission Research
Corporation.
Pera, L.; Gebhart, B. 1975. Laminar plume interactions.
Journal of Fluid Mechanics. 68(2): 259–271.
Pipkin, O.A.; Sliepcevich, C.M. 1964. The effect of wind
on buoyant diffusion flames. Industrial and Engineering
Chemistry Fundamentals. 3(May): 147–154.
Schmalz, R.F. 1992. Conflagrations: disastrous urban fires.
In: Majumdar, S.K.; Forbes, G.S.; Miller, E.W.; Schmalz,
R.F., eds. Natural and technological disasters: causes,
effects and preventative measures. The Pennsylvania
Academy of Science: 62–74. Chapter 6.
Pitts, W.M. 1991. Wind effects on fires. Progress in Energy
and Combustion Science. 17: 83–134.
Pryor, A.J.; Yuill, C.H. 1966. Mass fire life hazard. Final
report, contract No. N228(62479)68665. San Antonio,
TX: Southwest Research Institute, Office of Civil
Defense Work Unit 2537A.
Small, R.D.; Heikes, K.E. 1988. Early cloud formation by
large area fires. Journal of Applied Meteorology.
27: 654–663.
Small, R.D.; Larson, D.A.; Brode, H.L. 1981. Analysis of
large urban fires. PSR Report 1122. Final report contract
EMW-C-0309. Arlington, VA: Pacific-Sierra Research
Corporation.
Putnam, A.A.; Speich, C.F. 1963. A model study of
the interaction of multiple turbulent diffusion flames.
Symposium (International) on Combustion. 9: 876–877.
69
GENERAL TECHNICAL REPORT PNW-GTR-854
Small, R.D.; Larson, D.A.; Brode, H.L. 1983. Fluid
dynamics of large area fires. Proceedings of the 21st
national heat transfer conference. New York: Society of
Mechanical Engineers.
Tolhurst, K.G.; Cheney, N.P. 1999. Synopsis of the
knowledge used in prescribed burning in Victoria.
Victoria, Australia: Department of Natural Resources
and Environment, Fire Management.
Smith, R.K.; Morton, B.R.; Leslie, L.M. 1975. The role
of dynamic pressure in generating fire wind. Journal of
Fluid Mechanics. 68(1): 1–19.
Trelles, J.; Pagni, P.J. 1997. Fire induced winds in the
20 October Oakland Hills Fire. Fire Safety Science.
5: 911–922.
Soma, S.; Saito, K. 1991. Reconstruction of fire whirls
using scale models. Combustion and Flame. 86: 269–284.
Van Wagner, C.E. 1977. Conditions for the start and spread
of crown fire. Canadian Journal of Forest Research.
7: 23–34.
Stocks, B.J. 1989. Fire behavior in mature jack pine.
Canadian Journal of Forest Research. 19: 783–790.
Van Wagner, C.E. 1988. Effect of slope on fires spreading
downhill. Canadian Journal of Forest Research.
18: 818–820.
Sugawa, O.; Takahashi, W. 1993. Flame height behavior
from multi-fire sources. Fire and Materials. 17: 111–117.
Viegas, D.X.; Pita, L.P. 2004. Fire spread in canyons.
International Journal of Wildland Fire. 13: 253–274.
Tarr, S.J.; Allen, G. 1998. Flame interactions. Final
technical report on performance prediction in advanced
coal fired boilers. Contract No. JOF3–CT95–0005.
Westminster, London, United Kingdom: International
Combustion Limited, Rolls Royce Industrial Power
Group.
Vogel, M.; Williams, F.A. 1970. Flame propagation along
matchstick arrays. Combustion Science and Technology.
1: 429–436.
Wade, D.D.; Ward, D.E. 1973. An analysis of the Airforce
Bomb Range Fire. Res. Pap. SE-105. Asheville, NC: U.S.
Department of Agriculture, Forest Service, Southeastern
Forest Experiment Station. 38 p.
Taylor, R.J.; Evans, S.T.; King, N.K.; Stephens, E.T.;
Packham, D.R.; Vines, R.G. 1973. Convective
activity above a large-scale bushfire. Journal of Applied
Meteorology. 12: 1144–1150.
Weatherspoon, C.P.; Almond, G.A.; Skinner, C.N. 1989.
Tree-centered spot firing—a technique for prescribed
burning beneath standing trees. Western Journal of
Applied Forestry. 4(1): 29–31.
Thomas, P.H. 1963. The size of flames from natural fires.
Symposium (International) on Combustion. 9: 844–859.
Thomas, P.H. 1968. On the development of urban fires
from multiple ignitions. Fire Research Note 699.
Boreham Wood, Hertfordshire, United Kingdom: Fire
Research Station.
Weber, R.O. 1989. Analytical models for fire spread due to
radiation. Combustion and Flame. 78: 398–408.
Weber, R.O. 1990. A model for fire propagation in arrays.
Mathematical and Computer Modeling. 3(12): 95–102.
Thomas, P.H.; Baldwin, R.; Theobald, C.R. 1968.
Some model scale experiments with multiple fires. Fire
Research Note 700. Boreham Wood, Hertfordshire,
United Kingdom: Fire Research Station.
Weber, R.O.; Dold, J.W. 2006. Linking landscape fires and
local meteorology—a short review. JSME International
Journal. Series B49(3): 590–593.
Tieszen, S.R. 2001. On the fluid mechanics of fires. Annual
Review of Fluid Mechanics. 33: 67–92.
Weihs, D.; Small, R.D. 1986. Interactions and spreading
of adjacent large area fires. DNA-TR-86-214. Arlington,
VA: Pacific-Sierra Research Corporation. 38 p.
70
Synthesis of Knowledge of Extreme Fire Behavior: Volume I for Fire Managers
Weise, D.R.; Bigging, G.S. 1996. Effects of wind velocity
and slope on flame properties. Canadian Journal of
Forest Research. 26: 1849–1858.
Williams, F.A. 1982. Urban and wildland fire
phenomenology. Progress in Energy and Combustion
Science. 18: 317–354.
Weise, D.R.; Zhou, X.; Sun, L.; Mahalingam, S. 2005.
Fire spread in chaparral: “go or no-go.” International
Journal of Wildland Fire. 14(1): 99–106.
Wood, B.D.; Blackshear, P.L.; Eckert, E.G.R. 1971. Mass
fire model: an experimental study of the heat transfer
to liquid fuel burning from a sand-filled pan burner.
Combustion Science and Technology. 4(1): 113–129.
Welker, J.R.; Pipkin, O.A.; Sliepcevich, C.M. 1965. The
effect of wind on flames. Fire Technology. 1: 122–129.
Woodburn, P.J.; Drysdale, D.D. 1998. Fires in inclined
trenches: the dependence of the critical angle on trench
and burner geometry. Fire Safety Journal. 31:143–164.
Welker, J.R.; Sliepcevich, C.M. 1966. Bending of windblown flames from liquid pools. Fire Technology. 2(2):
127–135.
Wotton, B.M.; McAlpine, R.S.; Hobbs, M.W. 1999.
The effect of fire front width on surface fire behavior.
International Journal of Wildland Fire. 9(4): 247–253.
Weng, W.G.; Kamikawa, D.; Fukuda, Y.; Hasemi, Y.;
Kagiya, K. 2004. Study on flame height of merged flame
from multiple fire sources. Combustion Science and
Technology. 176(12): 2105–2123.
71
GENERAL TECHNICAL REPORT PNW-GTR-841
This page was intentionally left blank.
ii
Synthesis of Knowledge of Extreme Fire Behavior: Volume I for Fire Managers
Chapter 5: Column/Plume Dynamics
Brian E. Potter1
Introduction
AC C
ER
erating
U PF
LOW
“Plume dynamics” refers to the airflow related to a fire’s
updraft and the way that updraft changes over time. In
terms of extreme fire behavior, plume dynamics matter
because they can bring the wind, moisture, and temperature
conditions above the ground down to the ground where the
fire is. These aboveground conditions may or may not be
the same as the conditions at the ground, and the differences can produce unexpected changes in fire behavior.
The updraft is part of a fire-driven circulation that includes
downward air motion in other areas. The circulation also
modifies the horizontal winds near the fire. The updraft
also lifts burning embers that can subsequently lead to spot
fires. Any of these can lead to a nonsteady state, or for the
purposes of this review, extreme fire behavior. This section
examines several concepts and tools related to plume
dynamics that are well known in the fire management community, noting their foundations, strengths, weaknesses,
and limitations. Spot fires are addressed in more detail in
chapter 6.
Before considering specific concepts, it is important to
understand how the plume, or updraft, relates to other air
currents associated with a fire. These currents are of greater
concern to the firefighter than the updraft, most of the time.
Observations of wildland fires (Banta et al. 1992; Clements
et al. 2006, 2007; Countryman 1969; Goens and Andrews
1998; Reid and Vines 1972; Schroeder and Buck 1970;
Taylor et al. 1968, 1971, 1973) reveal many of these air
currents. In addition, studies of the air currents in and
around thunderstorms, in the absence of fire (Browning et
al. 1976, Foote and Frank 1983, Houze et al. 1989, Klemp
et al. 1981) provide additional information about the threedimensional airflow associated with an updraft or plume.
This model is a simplification and does not include the
rapidly changing features of a real plume, but it is a
useful foundation for discussing how plume dynamics con-
DESCENDING REAR INFLOW
REA R SU
RFACE
INFLOW
LATER AL
SUFACE
INFLOW
Figure 5-1—Conceptual model of the airflow in and around a
fire’s plume.
tribute to extreme fire behavior. The rapidly changing features not included in this simple model include fire whirls
(vortices), waves in the vertical and horizontal airflow, and
turbulent eddies on a wide range of scales. Because they
are not steady-state features, these are all closely related
to what is commonly recognized as extreme fire behavior
(fig. 5-1). The most consistently observed, best recognized
characteristics of a fire plume are the updraft column, eddy
vortices (whirls) along the perimeter at the fire’s head, and
the winds blowing into the rear and sides of the fire at the
ground. The updraft is the most obvious part of the plume
as it is where the smoke is. It may consist of a sequence
of puffs or turrets (each an updraft, itself) that separate
from the fire front and move downwind. Near the ground,
the updraft accelerates as it rises. The rate of acceleration
depends on the stability and wind profiles of the atmosphere
around the plume. The rear inflow, less often observed but
often implicitly recognized, descends toward the back of the
fire’s head. The acceleration of the updraft and the detailed
path of the rear inflow are difficult to observe, so details
1
Brian E. Potter, U.S. Department of Agriculture, Forest Service,
Pacific Wildland Fire Sciences Laboratory, Seattle, WA.
73
GENERAL TECHNICAL REPORT PNW-GTR-854
Three fire case studies (Aronovitch 1989, Simard et al.
1983, Wade and Ward 1973) have included Byram’s powers or convection number. Rothermel (1991) incorporated
Byram’s equations into his model for predicting behavior
and size of crown fires in the Northern Rockies. In the case
studies, authors had to make numerous assumptions about
the weather: neutral stability, winds constant over time,
winds constant with height, and some calculation of fire
intensity, and none of the studies reaches any substantial or
verifiable conclusions about the fire’s behavior based on the
power of the fire, power of the wind, or convection number.
In describing the use of the crown fire nomograms, Rother-
of their character are very poorly known. The descending
rear inflow, a sustained feature of moderate speed, is not
the same as a downburst, which is a fast, short-lived and
localized current.
Plume-Dominated and Wind-Driven Fires
The most recognized connection between extreme fire
behavior and plume dynamics is the concept of a plumedominated or wind-driven fire. Generally, wind-driven
fires are more predictable because the fire spreads with the
wind. When someone labels a fire “plume dominated” it is
because the smoke plume is standing near vertically and
there is little visible influence of horizontal wind on it. In
common usage, the implication is that the fire’s behavior
may change rapidly and that the fire’s direction of spread
could change unexpectedly. The distinction between these
two broad categories comes from Byram (1959), who introduced the power of the fire and power of the wind (Pf and
Pw ) and identified them as the energy-criterion equations.
The equations and energies are intended to help identify
when a fire is dominated by what Byram called “its own
energy” as opposed to being dominated by the energy of the
wind field. Byram originally provided the equations without
any derivation and eventually Nelson (1993) presented derivations based on notes he had from Byram. Both authors
emphasized the ratio of the power of the fire to the power of
the wind, which they call the convection number, Nc, rather
than the power expressions. Nelson (1993) provided a brief
discussion explaining how turbulent mixing and a stable or
unstable temperature profile may affect the equations, and
Nelson (2003) expanded on these two points.
Byram (1959) provided one example of the power equations applied to an actual fire, using Rhode Island’s Wood
River Valley Fire of May 1951. He stated:
…studies have shown that extreme fire behavior and blowup characteristics occur when Pf > Pw for a
considerable height above the fire–usually at least
1000 feet and more, often greater than 3000 or 4000 feet. Possibly one of the most erratic conditions is in
the transition zone where Pf and Pw are nearly equal.
mel (1991) assumed that windspeed is constant at the 6-m
(20-ft) speed and does not adjust for the fire’s rate of spread,
even though he stated, “this can produce errors and should
not always be assumed.”
Byram’s equations, or Nelson’s more general equations,
represent the energy produced by combustion and that
contained in the wind field. Application of the equations
for case studies has a very low precision, and obtaining the
necessary data to apply the equations is nearly impossible
for an ongoing fire. Although the National Wildfire Coordinating Group (NWCG) S-490 course objectives discuss
estimation of power of the fire and power of the wind, there
is no quantitative exercise or explicit discussion of how to
estimate them, and it is not listed in the instructor handbook
among the topics to be tested.
Adverse Wind Profiles and Low-Level Jets
Closely related to the power of the wind is Byram’s other
well-known contribution to the science of fire behavior,
the idea of the “adverse wind profile” (Byram 1954). This
is often simply referred to as the “low-level jet.” Byram’s
adverse profile/low-level jet concept is taught in all of the
NWCG fire behavior classes. The paper discusses turbulence, instability, and the location of the jet stream in the
upper troposphere in addition to wind profiles, but it is the
windspeed profiles that remain widely known and remembered.
74
Synthesis of Knowledge of Extreme Fire Behavior: Volume I for Fire Managers
inflow, and there are studies of thunderstorm dynamics that
can lend insight, but there is no work at present that clearly
shows why or how Byram’s wind profiles would lead to
extreme fire behavior or blow-up fires.
The earlier discussion of Byram’s power of the fire and
power of the wind equations noted the case studies that used
them assumed constant winds with height. The low-level jet
seen in Byram’s most dangerous profiles directly contradicts this assumption. Using constant winds underestimates
the power of the wind and therefore also underestimates
the value of the power of the fire necessary to yield a
convection number, Nc, greater than 1. The only operational
application of the Byram wind profiles is subjective assessment of observed profiles.
Byram examined the wind profiles measured near 17
fires. He identified nine profile types from the 17 fires and
noted that six of the profiles were associated with extreme
fire behavior. Furthermore, he noted that there were differences in fire behavior within any profile type and associated
those differences with the height of the low-level jet above
the ground. Notably, his type 1-a profile, “one of the most
dangerous types that can exist from the standpoint of
personnel safety and erratic and unpredictable fire behavior” has no jet in it. In addition to discussing the windspeed
profile, Byram stated, “The direction profile is an extremely
important part of the complete wind profile,” but did not
provide an explanation of the directional profiles. The
figures show a variety of directional profiles, as well as
changes in those profiles during the fires.
Subsequent discussions of Byram’s profiles appear in
Steiner (1976) and Brotak (1976). Steiner’s discussion is in
general terms and does not reach any particular conclusions.
Brotak (1976) considered 62 “large and extremely serious”
wildfires in the Eastern United States and found that only
one-third of the fires considered displayed such a jet.
The variety of wind profiles, both in terms of speed
and direction, are so great that one could not definitively or
authoritatively associate any observed wind profile with just
one of Byram’s adverse wind profiles. Rather than trying,
one could note the general structure Byram described as
related to blow-up fires:
• Windspeed of 18 mi/h or more measured in the “free
air” at the elevation of, or slightly above, the fire’s
elevation.
• Wind decreasing with height for several thousand feet
above the fire with the possible exception of the first
few hundred feet.
Stability and Instability
Few fire managers or fire researchers doubt that there is
a connection between atmospheric stability and extreme
fire behavior. The idea first appeared in Foley (1947),
followed by Crosby (1949), and Byram and Nelson (1951).
Davis (1969) examined stability accompanying 70 fires in
Arkansas, Alabama, Louisiana, Mississippi, and Tennessee
using broad stability and fire size classes. Later, Brotak and
Reifsnyder (1977) found that unstable air above a fire was
present for a number of large fires. Haines (1988b) used
these observations as the basis of his Lower Atmosphere
Severity Index, now known widely as the Haines Index.
Potter (2002) discussed atmospheric stability influences
on the circulation created by a fire and showed that greater
instability leads to stronger updrafts and surface winds,
and that the influence is greater when the instability is
closer to the ground. In terms of basic physics, an unstable
atmosphere provides less resistance than a stable atmosphere to the ascent of hot air in the fire’s plume and is more
conducive to general mixing of air between the ground and
regions higher up.
Instability itself cannot directly influence the combustion process—it must be converted into wind. Nor can
instability directly start a fire—it may enable thunderstorms
that produce lightning, but that is an indirect connection
Although the general concept of the low-level jet or the
adverse wind profile has moved into the realm of common
usage, no one has explained or demonstrated why or how it
influences a fire’s behavior. Byram (1959) did not do so, he
solely described how he identified it in conjunction with the
fires he examined. It is possible to hypothesize on ways the
profile interacts with the plume updraft or descending rear
75
GENERAL TECHNICAL REPORT PNW-GTR-854
and is not related to extreme fire behavior. In addition to the
circulation that a fire in an unstable environment creates,
instability can influence a fire by allowing existing windy
or dry air from upper levels to more easily reach the ground
where it can interact with the fuels and combustion. Foley
(1947), Crosby (1949), and Byram and Nelson (1951) all
connected instability to fire behavior through the turbulence
and high winds it can produce and transport downward to
the fire. Brotak and Reifsnyder (1977), Haines (1988b) and
Potter (2002) all included some measure of moisture aloft
in their discussions of instability. It was Brotak and Reifsnyder’s (1977) correlation between low moisture aloft and
large fire occurrence at the ground that led to its inclusion in
the Haines Index.
Davis (1969), Brotak and Reifsnyder (1977) and Haines
(1988b) did not examine fire behavior qualities: intensity,
rate of spread, or flame length. Rather, Davis considered
stability at the time of fires over 120 ha (300 ac) provided to
him by state fire control staff. Brotak and Reifsnyder looked
at atmospheric properties present at the time of “large”
fires, defined as larger than 2000 ha (5,000 ac). Haines’ fire
data included 74 fires reported by wildland fire management
units as “their worst situations over 20 [years].” How to
translate these to the concept of extreme fire behavior, if it
is even possible to do so, is not clear. The Haines Index is
the only quantitative measure of stability used in wildland
fire management to indicate the regional potential for fires
to become large or display erratic behavior. This application is consistent with its origins and derivation. There are
other stability indices used for thunderstorms (such as the
K, Lifted, Showalter, SWEAT, and the Total Totals indices)
or smoke dispersion (such as the Lavdas Atmospheric
Dispersion Index), but none of these have been scientifically
evaluated for use in predicting extreme fire behavior, or fire
behavior of any kind.
Much remains unknown about instability’s influence on
fire behavior. Is it possible to separate instability’s influence
on plume strength (and subsequently ground-level inflow
winds) from the relationship between instability and turbulence? Heilman and Bian (2010) showed that multiplying
the Haines Index by the surface turbulent kinetic energy
(TKE) differentiates fires larger than 400 ha (1,000 ac)
from smaller fires better than the Haines Index does alone,
suggesting that it is the turbulence generated by the instability that matters for fire size, but does not rule out plume
strength as an additional contributing factor. In addition, the
questions noted above regarding moisture interactions with
instability and which measures of fire behavior are influenced by instability are subjects needing further research.
Although answers to these questions may prove useful,
there is sufficient evidence of instability’s ties to extreme
fire behavior to justify great caution by fire management
when unstable conditions exist.
Downbursts and Plume Collapse
In meteorology, a downburst is both a broad description of
a family of phenomena and a specific member of that family. The fire behavior community generally uses the broader
definition: “An area of strong, often damaging winds
produced by one or more convective downdrafts over an
area from less than 1 to 400 km in horizontal dimensions.”
(AMS 2000) The physical processes driving a downburst
rely critically on moisture in the plume and, to an extent, on
the vertical wind profile. Details of the downburst process
can be found in Houze (1993) and other books describing
the dynamics of severe storms.
The related term “plume collapse” (sometimes called
column collapse) evokes vivid images of towering smoke
plumes rising upward and then falling back toward the
ground. The origins of the term in the fire community are
unclear. There is no official definition in the fire community
for plume collapse, nor does there appear to be any generally agreed upon standard. The idea of plume collapse is
taught in S-290 and in more detail in S-390, but there is no
single stated definition in those curricula, nor is there a
definition in the NWCG Glossary of Wildland Fire Terminology. The S-390 precourse work still references the Fire
Weather handbook (Schroeder and Buck 1970) that includes
a discussion of the air mass thunderstorm concept—a highly
idealized simplification—suggesting that this is the
intended use of the term for wildland fire management.
76
Synthesis of Knowledge of Extreme Fire Behavior: Volume I for Fire Managers
For the present discussion, plume collapse is a special
case of a downburst. In plume collapse, the energy source
driving the updraft is cut off or ceases, and the updraft
decays or reverses its motion, producing a downburst. A
downburst, more generally, is a strong, short-lived downdraft that occurs near the continuing updraft, not necessarily including the loss of the driving energy source or the
cessation of the main updraft. This is compatible with the
equivalence of plume collapse and dissipating convection in
the current S-390 course.
At the ground, the symptoms of a downburst are a
rapid but brief period where the wind dies down, followed
by a sudden gust of winds radiating out from the center of
the sinking air. There may be precipitation at the ground
or signs of precipitation aloft, such as virga. The area
underneath the precipitation is the most likely candidate
for the center of the sinking air. Air temperatures may drop
suddenly at the ground, but this may be difficult to detect
near a fire and will occur at the same time as the arrival of
the wind gust.
Downbursts associated with fire behavior appear in the
fire literature going back to Cramer (1954), although that
paper calls them thundersqualls. There and in Schroeder
and Buck (1970) and Haines (1988a), discussion focused on
downbursts generated by nearby thunderstorms, not by the
fire column itself. Haines (1988a) noted that downbursts
with heavy precipitation are more common in the Eastern
United States, labeling them “wet downbursts.” Dry downbursts, in contrast, are more common in the arid regions
of the United States where the precipitation may evaporate
before reaching the ground.
Goens and Andrews (1998) hypothesized that the fatalities on the 1990 Dude Fire resulted from a fire-generated
downburst driving the fire on the heels of the fleeing fire
crew. They presented fire behavior observations and meteorological observations consistent with the development of
such a downburst. The observations included light precipitation at the ground, a strong convection column, and a calm
just before the downburst. The downburst, when it came,
brought winds of 18 to 27 m/s (40 to 60 mi/h) and lasted
only a few minutes. In this instance, topography added
to the danger of the downburst. The air in a downburst is
denser than the air around it, so it will flow downhill. If that
flow runs into the fire, it will carry the fire downhill with it
at speeds more typical of an uphill run.
The only reference to plume (column) collapse in
the scientific literature on wildland fires is Fromm and
Servranckx (2003). They referred to the Chisolm Fire in
2001, and the use of the term “convective collapse” is not
clarified; it appears to mean that the plume top, which had
been well above the tropopause, sank down to be closer to
the tropopause. Because the reported surface winds at this
time were between 30 and 50 km/h (20 and 30 mi/h), the top
of the convective plume would have been well downwind of
the fire when this occurred, and the event does not qualify
as plume collapse under the definition stated above. There
is no clear evidence that collapse near the tropopause led to
fire behavior changes at the ground.
It is clear that the processes involved in plume collapse are poorly understood, but that does not negate the
importance of the characteristics frequently attributed
to plume collapse. Firsthand observations of showers of
embers, increasing smoke, or sudden changes of wind
and fire spread are not in question, and many people have
observed these. What is questionable or unknown is what
caused these things to happen, whether it in any way relates
to the idea of plume collapse as defined here, or what factors
control the timing and location of these processes. Haines
(1988a) listed several fires where thunderstorm downbursts
were considered responsible for firefighter fatalities and
extreme fire behavior. The Dude Fire study by Goens and
Andrews (1998) appears to be the only case study specifically documenting a downburst created within the fire’s
plume. There is no doubt that downbursts can cause extreme
fire behavior.
The useful questions about downbursts center on
understanding when the temperature, wind, and moisture
profiles at a fire favor the occurrence of downbursts and
whether those conditions can be predicted with sufficient
lead time to allow any action. The wind profile interacts
77
GENERAL TECHNICAL REPORT PNW-GTR-854
with temperature and moisture in complex ways, influencing when downdrafts occur and where they occur relative
to the updraft. The question of precisely when or where a
downburst will occur relative to the fire is much more difficult to answer and of limited value for operational purposes.
If the possible location of the downburst and its influence
on the fire’s direction or rate of spread change more rapidly
than resources or fire crews can adapt, then simply knowing
it can occur is more useful information.
Although there is no scientific study of plume collapse
(as defined here) in wildland fires, management anecdotes
and physics both support it as a sound explanation for
some situations, notably the stage in slash burns when the
fire’s energy output ceases or drops off rapidly. The stated
significance of plume collapse in the NWCG fire behavior
courses indicates the potential value in scientific study of
just what conditions can yield plume collapse. The ambiguity and imagery inherent in the phrase “plume collapse”
remain problematic, however. Eliminating the term “plume
collapse” in the context of fire behavior and just discussing
“downbursts” could reduce confusion.
nonextreme fire behavior events. For example, it is entirely
possible that one or more of Byram’s adverse wind profiles
occurs on every fire, no matter how small. If an index or
process is just as common during nonextreme fire behavior
as it is during extreme fire behavior, then the potential false
alarm rate for that property is quite high and its value to the
management community proportionally diminished.
Literature Cited
American Meteorological Society. 2000. Glossary
of meteorology. 2nd ed. Boston, MA: American
Meteorological Society. 850 p.
Aronovitch, B.B. 1989. Forecasting wildfire “blow-up.”
th
In: Proceedings, 10 conference on fire and forest
meteorology. Boston, MA: American Meteorological
Society and Society of American Foresters: 391–399.
Banta, R.M.; Olivier, L.D.; Holloway, E.T.; Kropfli,
R.A.; Bartram, B.W.; Cupp, R.E.; Post, M.J. 1992.
Smoke-column observations from two forest fires using
Doppler LIDAR and Doppler radar. Journal of Applied
Meteorology. 31: 1328–1349.
Summary
Brotak E.A. 1976. A synoptic study of the meteorological
conditions associated with major wildland fires. New
Haven, CT: Yale University. Ph.D. dissertation.
Although scientific studies provide a consistent qualitative
picture of the fire’s plume, the quantitative tools associated
with plume structure are less robust. Operationally, there
are two significant limitations on applying even qualitative
relationships of plume dynamics to extreme fire behavior.
The first is the fact that all of the plume aspects discussed
here require information on the three-dimensional structure of the atmosphere before they can serve as a basis for
action. Practitioners must either have experience and intuition that allow them to accurately understand and predict
the changing nature of the atmosphere in three dimensions,
or else they must have access to numerical model data that
tell them the current and future structure of the atmosphere.
The second limitation is that although the plume dynamics and indices discussed here have to some degree been
documented accompanying extreme fire behavior, there
is no scientific study showing that they are absent during
Brotak E.A.; Reifsnyder, W.E. 1977. An investigation of
the synoptic situations associated with major wildland
fires. Journal of Applied Meteorology. 16(9): 867–870.
Browning, K.A.; Fankhauser, J.C.; Chalon, J.-P.; Eccles,
P.J.; Strauch, R.C.; Merrem, F.H.; Musil, D.J.;
May, E.L.; Sand, W.R. 1976. Structure of an evolving
hailstorm. Part V: Synthesis and implications for hail
growth and hail suppression. Monthly Weather Review.
104: 603–610.
Byram, G.M. 1954. Atmospheric conditions related to
blowup fires. Station Pap. 35. Asheville, NC: U.S.
Department of Agriculture, Forest Service, Southeastern
Forest Experiment Station. 34 p.
78
Synthesis of Knowledge of Extreme Fire Behavior: Volume I for Fire Managers
Byram, G.M, 1959. Forest fire behavior. In: Davis, K.P.,
ed. Forest fire control and use. New York: McGraw Hill:
90–123.
Fromm, M.D.; Servranckx, R. 2003. Transport of forest
fire smoke above the tropopause by supercell convection.
Geophysical Research Letters. 30(10): 41–1 through
49–4.
Byram, G.M.; Nelson, R.M. 1951. The possible relation of
air turbulence to erratic fire behavior in the Southeast.
Fire Control Notes. 12(3): 1–8. (Republished in Fire
Management Today. 63(3): 46–51.)
Goens, D.W.; Andrews, P.L. 1998. Weather and fire
behavior factors related to the 1990 Dude Fire near
Payson, Arizona. In: Proceedings, 2nd symposium on
fire and forest meteorology. Boston, MA: American
Meteorological Society: 153–158.
Clements, C.B.; Potter, B.E.; Zhong, S. 2006. In situ
measurements of water vapor, heat, CO2 fluxes within a
prescribed grass fire. International Journal of Wildland
Fire. 15: 299–306.
Haines, D.A. 1988a. Downbursts and wildland fires: a
dangerous combination. Fire Management Today.
49(3): 8–10.
Clements, C.B.; Zhong, S.; Goodrick, S.; Li, J.; Potter,
B.E.; Bian, X.; Heilman, W.E.; Charney, J.J.; Perna,
R.; Jang, M.; Lee, D.; Patel, M.; Street, S.; Aumann,
G. 2007. Observing the dynamics of wildland grass fires:
Fireflux—a field validation experiment. Bulletin of the
American Meteorological Society. 88(9): 1369–1382.
Haines, D.A. 1988b. A lower atmospheric severity index
for wildland fires. National Weather Digest. 13: 23–27.
Heilman, W.E.; Bian, X. 2010. Turbulent kinetic energy
during wildfires in the North Central and Northeastern
US. International Journal of Wildland Fire.
19(3): 346–363.
Countryman, C.M. 1969. Project Flambeau: an
investigation of mass fire (1964–1967): final report.
Berkeley, CA: U.S. Department of Agriculture, Forest
Service, Pacific Southwest Forest and Range Experiment
Station. 68 p.
Hobbs, P.V.; Rangno, A.L. 1985. Ice particle
concentrations in clouds. Journal of the Atmospheric
Sciences. 42: 2523–2549.
Houze, R.A., Jr. 1993. Cloud dynamics. San Diego, CA:
Academic Press. 573 p.
Cramer, O.P. 1954. Recognizing weather conditions that
affect forest fire behavior. Fire Control Notes. 15(2): 1–6.
Houze, R.A, Jr.; Rutledge, S.A.; Biggerstaff, M.I.;
Smull, B.F. 1989. Interpretation of Doppler-radar
displays in midlatitude mesoscale convective systems.
Bulletin of the American Meteorological Society. 70:
608–619.
Crosby, J.S. 1949. Vertical wind currents and fire behavior.
Fire Control Notes. 10(2): 12–15.
Davis, R.T. 1969. Atmospheric stability forecast and fire
control. Fire Control Notes. 30(3): 3–4.
Foley, J.C. 1947. A study of meteorological conditions
associated with bush and grass fires and fire protection
strategy in Australia. Bulletin No. 38. Melbourne, VIC:
Commonwealth of Australia Bureau of Meteorology.
234 p.
Klemp, J.B.; Wilhelmson, R.B.; Ray, P.S. 1981. Observed
and numerically simulated structure of a mature
supercell thunderstorm. Journal of the Atmospheric
Sciences. 38: 1558–1580.
Nelson R.M., Jr. 1993. Byram’s derivation of the energy
criterion for forest and wildland fires. International
Journal of Wildland Fire. 3: 131–138.
Foote, G.B.; Frank, J.W. 1983. Case study of a hailstorm
in Colorado. Part III: Airflow from triple-Doppler
measurements. Journal of the Atmospheric Sciences.
40: 686–707.
79
GENERAL TECHNICAL REPORT PNW-GTR-854
Nelson, R.M., Jr. 2003. Power of the fire—a
thermodynamic analysis. International Journal of
Wildland Fire. 12(1): 51–65.
Palmer, TY. 1981. Large fire winds, gases and smoke.
Atmospheric Environment. 15(10/11): 2079–2090.
Potter, B.E. 2002. A dynamics-based view of fireatmosphere interactions. International Journal of
Wildland Fire. 11: 247–255.
Reid D.G.; Vines, R.G. 1972. A radar study of the smoke
plume from a forest fire. Tech. Paper No. 2. Clayton
South, VIC, Australia: Commonwealth Scientific
Industrial Research Organization, Division of Applied
Chemistry.
Rothermel, R.C. 1991. Predicting behavior and size of
crown fires in the northern Rocky Mountains. Res. Pap.
INT-438. Ogden, UT: U.S. Department of Agriculture,
Forest Service, Intermountain Research Station. 46 p.
Schroeder M.J.; Buck, C.C. 1970. Fire weather.
Washington, DC: U.S. Department of Agriculture,
Forest Service. 229 p.
Steiner, J.T. 1976. Blowup fires—the Byram wind profile.
Australian Meteorological Magazine. 24(3): 139–142.
Taylor, R.J.; Bethwaite, F.D.; Packham, D.R.; Vines,
R.G. 1968. A meso-meteorological investigation of five
forest fires. Tech. Paper No. 18. Melbourne, Australia:
CSIRO Division of Meteorological Physics. 19 p.
Taylor R.J.; Corke, D.G.; King, N.K.; MacArthur,
D.A.; Packham, D.R.; Vines, R.G. 1971. Some
meteorological aspects of three intense forest fires. Tech.
Pap. No. 21. Melbourne, Australia: CSIRO Division of
Meteorological Physics.
Taylor, R.J.; Evans, S.J.; King, N.K.; Stephens, E.T.;
Packham, D.R.; Vines, R.G. 1973. Convective
activity above a large-scale bushfire. Journal of Applied
Meteorology. 12(7): 1144–1150.
Wade, D.D.; Ward, D.E. 1973. An analysis of the Air
Force Bomb Range Fire. Res. Pap. SE-105. U.S.
Department of Agriculture, Forest Service, Southeast
Forest Experiment Station. 38 p.
Simard, A.J.; Haines, D.A.; Blank, R.W.; Frost, J.S.
1983. The Mack Lake Fire. Gen. Tech. Rep. NC-83.
St. Paul, MN: U.S. Department of Agriculture, Forest
Service, North Central Forest and Range Experiment
Station. 36 p.
80
Synthesis of Knowledge of Extreme Fire Behavior: Volume I for Fire Managers
Chapter 6: Spot Fires
Brian E. Potter1
Introduction
As the ember shrinks, it is more easily pushed and
carried by the wind, and it settles toward the ground more
slowly. Eventually, however, the ember reaches the ground
or perhaps it comes to rest in a tree canopy or understory
vegetation. If it lands in flammable fuel, it may ignite that
fuel if the ember has enough energy to dry and heat the fuel
to the combustion point. That drying and heating may take
some time, resulting in an ignition delay. At this point, the
ember has started a spot fire.
Now consider not just the one ember, but all of the
embers generated by a fire. At any time there can be many
embers in the air around a fire. The size, shape, and number
of embers depend on the fuel type and the intensity of the
fire. Some fuels, such as eucalypts and chaparral, produce
embers in abundance. Eucalypts also produce some of the
most aerodynamic embers, strips of bark capable of sailing
long distances (McArthur 1967). Grasses, owing to their
fineness and short consumption time, produce fewer embers
that survive to return to the ground.
Some embers, especially large ones, land relatively
close to the main fire front. The closer they land to the
front and the longer they take to ignite the recipient fuels,
the more likely it is that the main fire front will overrun
them and the less likely that they will cause the fire front
to “hop” forward. The zone where overrunning occurs has
no definite size—it depends on the fire’s rate of spread, the
fuel moisture, and, again, the fuel type. One can estimate
the width of the overrunning zone by multiplying the spread
rate of the main fire front times an estimate of the time it
takes embers landing in the fuel to establish themselves as
new fires. Even in the overrunning zone, however, heavy
showers of embers can gradually dry and heat the fuels
so that the fire spreads more rapidly when the main front
arrives. Fire spread models based on measurements of
spread in actual forest fires will implicitly reflect any such
effects, if spotting occurred on the fires used to develop the
model. Spread models based on laboratory measurements,
Spotting is specifically cited in the National Wildfire
Coordinating Group (NWCG) definition of extreme fire
behavior. It also qualifies as extreme fire behavior under the
working definition used for this synthesis because its irregularity and unpredictable nature are inherently not steady
state. Spotting and spot fires are dangers to fire management
because of the ember showers they create near the main fire
front and their potential to cross substantial barriers.
The following discussion of spotting addresses what is
known of the process itself, the tools available to managers,
and the primary areas for further research and tool development. Specific papers are cited when appropriate, but there
are many more studies in the scientific literature that are
related to spotting but not cited here. Readers looking for a
more detailed discussion of the science should consult Koo
et al. (2010) and Ellis (2000), both of which are themselves
valuable resources, but also because they contain many
relevant references.
The Spotting Process
To understand the factors that influence spotting, consider
the life cycle of an ember or fire brand. The ember starts as
a leaf, twig, seed, nut, or pine cone, piece of bark, or small
fragment of a larger piece of fuel that was partially consumed. It may originate on the ground, in the understory, or
in the canopy. The air currents associated with the fire must
lift the ember up into the fire’s plume, until the air currents
or gravity throw it out of the updraft. (See chapter 5 for a
more detailed description of the air currents associated with
the fire’s updraft.) As the ember falls to earth, the winds
continue to push it horizontally—and perhaps vertically,
if it gets caught in an eddy. All through this journey, the
ember continues to burn, losing mass and getting smaller.
(If it stops burning, there is no longer a spotting hazard.)
1
Brian E. Potter, U.S. Department of Agriculture, Forest Service,
Pacific Wildland Fire Sciences Laboratory, Seattle, WA.
81
GENERAL TECHNICAL REPORT PNW-GTR-854
Figure 6-1—Conceptual diagram (not to scale) of the spotting process, illustrating the influence of ember size and shape, lofting height,
and ignition. Thin arrows are ember trajectories, those ending in dashed lines indicate the ember burned completely and never reached
the ground. Round embers represent woody embers, and the stick-shaped ember leaving the top of the plume represents aerodynamic
embers (typically bark) or large embers lofted extremely high by fire whirls or intense surges in the fire.
however, will not include any preconditioning effects from
spotting.
Just beyond this zone, there is a chance for embers to
ignite a new fire and for that fire to establish itself before the
main front arrives. This could be considered the establishment zone, and it extends as far as any embers can travel
and still ignite fuels when they alight (fig. 6-1). If there are
few embers landing here, they will create spot fires that
grow independently of one another and largely independently of the main fire front. Numerous spot fires, however,
may form close enough to one another that their heat and
air currents will influence one another (see chapter 4). A
collection of nearby spot fires that coalesce will grow more
rapidly than a fire lit by a single ember (the same principle
that lies behind aerial ignition of multiple spot fires.) Just
how many embers actually ignite spot fires, or how quickly
those fires can grow and merge, depends strongly on the
fuel where the embers land. The chance of an ember igniting and growing into a new fire increases as the fine fuel
load increases, as the windspeed increases, and as the fuel
moisture decreases. It also depends on the fuel species.
Multiple, nearby spot fires may coalesce into one or
more larger fires, and depending on where they are relative
to the main fire front, they may remain a separate fire for
many days or indefinitely. For example, fires that coalesce
across a fire break, across a ridge or valley, or on the flank
of the main fire can grow with little chance of merging with
the main fire. Spot fires that coalesce ahead of the main fire
front with no barrier between, can effectively increase the
fire’s forward rate of spread. This effect was described in
detail in the Wade and Ward (1973) study of the Air Force
Bomb Range Fire.
Embers that reach these distances require strong winds
and enough vertical lofting that they take a long time to
come back to the ground. They must be big enough at the
outset to still be burning when they land, yet small enough
for the winds to carry them the necessary distance. Embers
with low trajectories, primarily carried by horizontal winds,
will typically fly out directly ahead of the fire, driven by
those same winds. Embers lofted high may experience
winds aloft very different from those driving the fire front.
Wind direction can vary significantly in the lowest 600 to
900 m (2000 to 3000 ft) of the atmosphere. In the Northern
Hemisphere, the wind typically turns to the right as height
increases, whereas in the Southern Hemisphere, it tends to
turn to the left. There is a recognized tendency for spot
82
Synthesis of Knowledge of Extreme Fire Behavior: Volume I for Fire Managers
fires to develop on these respective flanks. Complex terrain
and strong weather fronts can also modify wind direction
at different levels, although less predictably.
There may be some embers that are big or aerodynamic
enough to keep burning as they travel great distances,
McArthur (1967) cited spot fires up to 29 km (18 mi) for the
March 1965 fires in Victoria, Australia. For these embers
to get up into the air in the first place, requires substantial
vertical wind. Early studies of ember lofting and transport
(e.g., Lee and Hellman 1969, Muraszew 1974, Muraszew et
al. 1975) concluded that the necessary updrafts had to be
of such magnitude and spatial extent that they were physically improbable. For example, Muraszew (1974) calculated
that an updraft of 30 m/s, 1 km wide at the ground, only
transported embers 7 km. The only way to lift these embers
would be in a fire whirl or very intense flareup. (This region
is labeled the “whirl/sailing zone” in fig. 6-1.) The embers
have to be highly aerodynamic, as well, so that they could
sail efficiently on the winds. They would be lofted to such
heights that they would almost certainly encounter winds of
variable speed and direction, making their ultimate resting
place even more difficult to predict.
calculations estimate the maximum likely spotting distance
for such embers, under very specific conditions. The model
does not apply to “running crown fires, fires in heavy slash
or chaparral under extreme winds, or fires in which fire
whirls loft” the embers. It assumes the ember comes from
near the top of the torching tree(s). It assumes a specific
vertical profile for the wind, one with constant direction
and speed increasing from canopy top to a constant value
several hundred feet above. Furthermore, it cannot predict
the effects of wind eddies caused by terrain, such as lee
waves or rotors, or flow in canyons. It assumes the ember is
a cylinder of wood, or similar shape. (Laboratory studies by
Tarifa et al. (1967) showed that shape is not a major factor
most of the time. Cylinders, spheres, and plates of a given
density travel roughly the same distance.) The model does
not predict the probability of ignition when an ember lands,
nor does it predict the number of embers reaching the estimated maximum distance. The model allows lofting up to
305 m (1,000 ft) above ground and predicts distances up to
3.2 km (2 mi) over flat terrain with uniform fuels. Multipliers for noflat terrain can increase spot distance to as much
as 5.6 km (3.5 mi), if the source is atop a 1200-m (4,000-ft)
ridge and the distance to the valley bottom exceeds 3.2 km
(2 mi).
Albini (1981) modified the torching tool so that it
could be used for isolated, more sustained sources such as
slash piles or fuel “jackpots.” Although the earlier model
assumes a short-lived heat source and a brief surge in the
fire’s plume, the newer model allows a more sustained heat
source and plume lofting the ember. This model also allows
estimation of maximum spotting distance when there is not
uniform-height forest along the ember’s flight path. The
estimate assumes a neutral or stable atmosphere and still
assumes constant wind direction. The strongest plumes
and most intense fires, however, tend to develop under
conditions with unstable air near the ground: how much this
would affect spot distance estimates is not clear.
The third tool/model is from Albini (1983) and extends
the earlier models for use with wind-driven surface fires
without timber cover. The model assumes the fire is linear,
Management Tools
There are five tools available that translate the complex
science of spotting into an operational context. Like any
model or tool based on so many interacting processes,
these require many assumptions and simplifications. Frank
Albini of the USDA Forest Service developed three of the
tools, and each addresses a specific type of ember source.
The assumptions, simplifications, and limitations of each
model are clearly stated and acknowledged in each case. All
three provide the same output, an estimate of the maximum
spotting distance. One of the other two tools deals with the
probability spotting will span a fire break on a grass fire,
and the last tool provides an estimate of the minimum spotting distance at which fires can become established before
they are overrun.
The first tool is for embers and spotting from single
torching trees or groups of up to 30 trees (Albini 1979.) The
83
GENERAL TECHNICAL REPORT PNW-GTR-854
Figure 6-3—Mimimum distance at which a spot fire will not be
overrun by the main fire. Distance depends on ignition delay and
is shown for delays of 0.2 minutes (solid line); 1.5 minutes (dotted
line), 5 minutes (dashed line), and 10 minutes (dash-dot line).
Following Alexander and Cruz 2006.
Figure 6-2—Probabilities of breaching firebreaks of specified
width as a function of fireline intensity. Based on equations in
Wilson 1988.
perpendicular to the wind, and much longer than the frontto-back depth of the flaming front. It also assumes that any
embers lofted by a surface fire rise in short surges in fire
intensity. This aspect of the model relies on a theoretical
model of the duration and strength of the surges, and Albini
said outright “this hypothesis, crucial in the model’s development, is unlikely to ever be tested directly.” The results
of this extension only predict the lofting height of embers,
which then go into the Albini (1979) model to provide the
estimated maximum spotting distance. Albini (1983) did not
state whether the surface-fire model still assumes, cylindrical wood embers; if so, it may not be appropriate for grassy
fuels without any woody component.
The next tool is a pair of graphs (fig. 6-2) from Wilson
(1988) that indicate the probability that a grass fire will spot
across a firebreak of given width. Note that this is based
on, and only strictly appropriate for, grass fires with very
few trees. The only input required is an estimate of the
fire’s intensity and whether or not there are trees in the fire
perimeter within 20 m of the fire break. The figures (and the
equation from which they are derived) indicate the probability the fire will spot across a break of given width.
The last tool is also a graph, and it is for use during
active crown fires. Specifically, it is calibrated for use on
crown fires in open canopy coniferous fuel types (Forestry
Canada Fire Danger Group 1992). Alexander and Cruz
84
Synthesis of Knowledge of Extreme Fire Behavior: Volume I for Fire Managers
(2006) provided an estimate of the minimum distance at
which a newly ignited spot fire will not be overrun by the
main fire front. This is essentially the depth of the overrun
zone mentioned previously. The graph (fig. 6-3) indicates
the distance/depth based on rate of spread and ignition delay
(ID). It assumes that once an ember ignites a fire, it will
accelerate and achieve 90 percent of its steady-state spread
rate in 20 min. Fires that require longer to reach a steadystate rate of spread, including those in a more closed canopy
environment, will result in increased separation distances or
overrun zone depths.
these properties for various fuel types and fire intensities.
Manzello et al. (2007) examined embers produced by single
Douglas-fir trees (see “Common and Scientific Names”
section), but it is the only study of this nature. Related to
this is the need for research on the effect of embers and
spotting on preconditioning fuels. Incorporation of this into
fire behavior tools would provide the ability to estimate
any acceleration of the fire spread in the overrun zone and
“hopping” potential in the establishment zone.
There are several studies that examine the probability
of an ember igniting fuels after it lands (e.g., Ganteaume et
al. 2009; Manzello et al. 2006a, 2006b), and a few consider
the time interval between the ember landing and fuels
igniting (Alexander and Cruz 2006, Ganteaume et al. 2009).
No tool, however, gathers this information and uses it to
indicate the delay or probability of ignition for recipient
fuels. Such a tool would admittedly require many assumptions about ember size, burning rate, and fuel characteristics, but those assumptions are not necessarily any more of
a limitation than the assumptions Albini had to make for
the spotting distance models. Overall, there are two basic
management implications of the state of knowledge on spot
fires. First, the existing tools have clearly stated limitations
with respect to when they apply, what they predict, and
how certain those predictions are. Users should know the
limitations when applying the tools. Taken as a whole, the
limitations mean the tools can provide general guidance
regarding how far from the main front spot fires can be
expected, but they do not claim to be, nor should they be
used as, substitutes for lookouts and constant vigilance.
Second, in the absence of scientific information on a
particular fuel’s tendency to produce embers or ignite when
embers land, local knowledge, familiarity, and observations
are essential. The number and size of embers or spot fires,
and the observed distance and direction of ember travel are
all important pieces of information. If spot fires are close
enough together to merge before the main front arrives, or
are observed on the flank of the fire, they could produce a
new front or a rapid jump in the main front or a flank that
could endanger crews.
Knowledge Gaps
There are several opportunities for improvement in both the
tools and the underlying science of spot fires. Foremost of
these is one basic element: validation or evaluation of how
the Albini tools currently perform. Albini stated repeatedly that the models were not tested in the field, and that
“assumptions, approximations, and inadequately supported
empirical relationships are sprinkled throughout.” There
is no published study scientifically evaluating any of the
Albini submodels or models in their whole. Two publications (Norum 1982 and Rothermel 1983) cite the use of the
models in the field and view them favorably, but neither of
these constitutes a rigorous model evaluation.
The science already exists to estimate trajectories in
a complex wind field. Smoke and air pollution models
regularly and quickly compute trajectories in wind fields
that vary in the vertical, horizontal, and time. These could
be combined with the lofting and burnout models of Albini
(the components most strongly supported by research). The
existing tools could also be modified to include more aerodynamic fuels like eucalyptus bark, or lofting by short-lived
fire whirls.
These adaptations would still only address maximum
distance and direction for single embers, however. The
number, size, and spotting density of embers at shorter distances are important for the accurate estimation of spread
rate of the main fire front. Before any tools can provide
this information, however, basic studies must measure
85
GENERAL TECHNICAL REPORT PNW-GTR-854
Literature Cited
Albini, F.A. 1979. Spot fire distance from burning trees
—a predictive model. Gen. Tech. Rep. INT-56. Ogden,
UT: U.S. Department of Agriculture, Forest Service,
Intermountain Forest and Range Experiment Station.
25 p.
Albini, F.A. 1981. Spot fire distance from isolated
sources—extensions of a predictive model. Res. Note
INT-309. Ogden, UT: U.S. Department of Agriculture,
Forest Service, Intermountain Forest and Range
Experiment Station. 9 p.
Albini, F.A. 1983. Potential spotting distance from
wind-driven surface fires. Res. Pap. INT-309. Ogden,
UT: U.S. Department of Agriculture, Forest Service,
Intermountain Forest and Range Experiment Station.
27 p.
Alexander, M.E.; Cruz, M.G. 2006. Evaluating a model
for predicting active crown fire rate of spread using
wildfire observations. Canadian Journal of Forest
Research. 36: 3015–3028.
American Meteorological Society [AMS]. 2000. Glossary
of meteorlogy. http//amsglossary.allenpress.com/
glossary. (June 16, 2011).
Ellis, P.F. 2000. The aerodynamic and combustion
characteristics of eucalypt bark—a firebrand study.
Canberra, ACT, Australia: Australian National
University. Ph.D. thesis.
Forestry Canada Fire Danger Group. 1992. Development
and structure of the Canadian Forest Fire Behavior
Prediction System. Information Report ST-X-3. Ottawa,
Ontario, Canada: Forestry Canada, Science and
Sustainable Development Directorate. 63 p.
Ganteaume, A.; Lampin-Maillet, C.; Guijarro, M.;
Hernando, C.; Jappiot, M.; Fonturbel, T.; PérezGorostiaga, P.; Vega, J.A. 2009. Spot fires: fuel bed
flammability and capability of firebrands to ignite fuel
beds. International Journal of Wildland Fire. 18: 951–969.
Koo, E.; Pagni, P.J.; Weise, D.F.; Woycheese, J.P. 2010.
Firebrands and spotting ignition in large-scale fires.
International Journal of Wildland Fire. 19: 818–843.
Lee, S.L.; Hellman, J.M. 1969. Study of firebrand
trajectories in a turbulent swirling natural convection
plume. Combustion and Flame. 15: 645–655.
Manzello, S.L.; Cleary, T.G.; Shields, J.R.; Yang, J.C.
2006a. Ignition of mulch and grasses by firebrands in
wildland-urban interface fires. International Journal of
Wildland Fire. 15: 427–431.
Manzello, S.L.; Cleary, T.G.; Shields, J.R.; Yang, J.C.
2006b. On the ignition of fuel beds by firebrands. Fire
and Materials. 30: 77–87.
Manzello, S.L.; Maranghides, A.; Mell, W.E. 2007.
Firebrand generation from burning vegetation.
International Journal of Wildland Fire. 16: 458–462.
McArthur, A.G. 1967. Fire behaviour in eucalypt forests.
Leaflet 100. Canberra, Australian Capital Territory,
Australia: Commonwealth of Australia, Forestry and
Timber Bureau, Forest Research Institute.
Muraszew, A. 1974. Firebrand phenomena. Aerospace
Report ATR-74(8165-01)-1. El Segundo, CA: The
Aerospace Corporation. 109 p.
Muraszew, A.; Fedele, J.B.; Kuby, W.C. 1975. Firebrand
investigation. Aerospace Report ATR-74(7470)-1. El
Segundo, CA: The Aerospace Corporation. 104 p.
Norum, R.A. 1982. Predicting wildfire behavior in black
spruce forests in Alaska. Res. Note PNW-401. Portland,
OR: U.S. Department of Agriculture, Forest Service,
Pacific Northwest Forest and Range Experiment Station.
10 p.
Rothermel, R.C. 1983. How to predict the spread and
intensity of forest and range fires. Gen. Tech. Rep. INT143. Ogden, UT: U.S. Department of Agriculture, Forest
Service, Intermountain Forest and Range Experiment
Station. 161 p.
86
Synthesis of Knowledge of Extreme Fire Behavior: Volume I for Fire Managers
Tarifa, C.S.; del Notario, P.P.; Moreno, F.G.; Villa, A.R.
1967. Transport and combustion of firebrands. Final
report of grants FG-SP-114 and FG-SP-146. Madrid,
Spain: Instituto Nacional de Tecnica Aeroespacial. 90 p.
Vol. II.
Wade, D.D.; Ward, D.E. 1973. An analysis of the Air
Force Bomb Range Fire. Res. Pap. SE-105. Asheville,
NC: U.S. Department of Agriculture, Forest Service,
Southeast Forest Experiment Station. 38 p.
Wilson, A.A.G. 1988. Width of a firebreak that is necessary
to stop grass fires: some field experiments. Canadian
Journal of Forest Research. 18: 682–687.
87
GENERAL TECHNICAL REPORT PNW-GTR-841
This page was intentionally left blank.
ii
Synthesis of Knowledge of Extreme Fire Behavior: Volume I for Fire Managers
Chapter 7: Vortices and Wildland Fire
Jason A. Forthofer and Scott L. Goodrick1
Introduction
brief introduction to vorticity, a measure of the atmosphere's
tendency to spin or rotate about some axis. With this basic
understanding of vorticity, we will examine the common
vortex forms described in the fire behavior literature, fire
whirls and horizontal roll vortices.
Large fire whirls are often one of the more spectacular
aspects of fire behavior. Flames flow across the ground
like water feeding into the base of the vortex, the lowest
thousand feet of which often takes on an orange glow from
combusting gases rising within the vortex core. Burning
debris lofted within the vortex can lead to a scattering of
spot fires some distance from the main fire. With their
sudden formation, erratic movement, and often sudden
dissipation, fire whirls are a good example of extreme fire
behavior. However, other forms of vortices are actually
quite common on wildland fires and receive less attention
despite their potential to dramatically alter fire behavior.
This chapter is designed to provide a better understanding of vortices associated with wildland fires, both
fire whirls and horizontal roll vortices. A key point will be
providing a basic understanding of what aspects of the fire
environment contribute to the development and growth of
these vortices. The next section of the chapter supplies a
Vorticity Basics
Simply stated, vorticity is the measure of spin about an axis.
That axis can be vertical, as in the case of a fire whirl, or
horizontal for a roll vortex, or somewhere in between. Figure 7-1 is an idealized illustration of a cross section through
a fire with no ambient horizontal wind. The vertical winds
near the ground can be characterized by a strong updraft
over the fire and descending air outside of the fire area.
The change in the vertical velocity across the fire imparts
rotation to the flow field about an axis perpendicular to the
page. Horizontal vortices form at both edges of the fire area
and rise along the edge of the plume. While rising, these
vortices can grow and will transfer energy to other vortices,
which is one way that atmosphere dissipates energy.
1
Jason A. Forthofer, USDA Forest Service, Missoula Fire Sciences
Laboratory, Missoula, MT.
Scott L. Goodrick, U.S. Department of Agriculture, Forest Service,
Southern Research Station, Athens, GA.
Figure 7-1—Cross section through idealized fire illustrating occurrence of vortices owing to horizontal
gradient of vertical motion produced by buoyancy from the fire.
89
GENERAL TECHNICAL REPORT PNW-GTR-854
The change of vorticity can be described by the following equation where the terms on the righthand side of
the equation can be grouped as either modifying terms or
producing terms.
another, the tilting of vorticity from one axis to another,
the stretching and intensifying of vortices by convergence,
or by the generation of vorticity through buoyancy or wind
shear.
Vorticity = (Transport + Tilting + Stretching)modifying +
(Baroclinic + Shear + Body)producing
(1)
The first group of terms in equation 1 can modify
vorticity that is already present in the atmosphere, but
cannot create new areas of rotation. Transport is the process
by which the mean wind can move vorticity from one area
to another. Tilting involves changing the orientation of
the axis of rotation (e.g., a horizontal vortex can be tilted
into a vertical orientation). As will be shown later, this is
an important process for wildland fires. The third term,
stretching, can modify a vortex by changing the magnitude
of the vorticity (how fast it rotates). The first two terms,
transport and tilting, are only capable of moving or reorienting a vortex, but not strengthening or weakening one. A
converging airflow, such as indraft feeding a fire, acts to
strengthen a vortex by concentrating its circulation about a
smaller radius, much like ice skaters spinning faster when
pulling their arms in.
The producing terms on the righthand side of equation
1 describe processes that create areas of rotation within the
atmosphere. The baroclinic term generates vorticity in cases
where the gradients in pressure and density are not parallel.
In the case of a fire, rapid heating develops a horizontal
temperature gradient that is not aligned with the vertical
static pressure gradient. This misalignment of the vertical
pressure gradient and horizontal thermal gradient leads to
rotational motions to mix warm and cold fluid in an attempt
to restore balance. The shear term describes the generation
of vorticity from viscous shear stress. Wind shear induced
by surface drag is a source of vorticity; therefore, if the
wind is blowing at the earth's surface, horizontal vorticity
is being generated. The final producing term in equation
1 represents changes in vorticity from body forces such as
gravity acting on the fluid.
In summary, the vorticity at any location changes
owing to the transport of vorticity from one place to
Fire Whirls
Fire whirls are vertically oriented, intensely rotating
columns of gas found in or near fires. They have been
observed in wildland, urban, and oil spill fires and volcanic
eruptions. Dynamically they are closely related to other
swirling atmospheric phenomena such as dust devils, waterspouts, and tornadoes (Emmons and Ying 1967). Fire whirls
have also been called fire devils, fire tornadoes, and even
fire-nados. They are usually visually observable because
of the presence of flame, smoke, ash, or other debris. The
definition of a fire whirl used here includes those whirls
caused by the buoyancy of a fire but with no inner core of
flame. Fire whirls range in size from less than 1 m in diameter and velocities less than 10 m/s up to possibly 3 km in
diameter and winds greater than 50 m/s (Goens 1978). The
smaller fire whirls are fairly common, whereas the larger
whirls are less common. All fire whirls, especially the larger
ones, represent a considerable safety hazard to firefighters
through increased fire intensity, spotting, erratic spread rate
and direction, and wind damage (Emori and Saito 1982,
Moore 2008, U.S. Bureau of Land Management 2006).
Several extremely large fire whirls have been reported
in urban fires that illustrate their potentially destructive
nature. In 1871, the Great Chicago Fire generated whirlwinds that lifted and transported burning planks 600 m
ahead of the main fire, which contributed greatly to the
spread and destruction of the fire (Musham 1941). On the
same day, a fire in Peshtigo, Wisconsin, generated a whirl
that was strong enough to lift a house off its foundations
(Gess and Lutz 2002). Hissong (1926) also reported a whirl
strong enough to move a house. This whirl was one of many
that formed during a large oil storage facility fire. The whirl
separated from the fire and moved 1000 m downwind, lifted
a small house, and moved it 45 m killing the two residents
inside. A much more devastating whirl formed in 1921 when
90
Synthesis of Knowledge of Extreme Fire Behavior: Volume I for Fire Managers
a magnitude 7.9 earthquake hit the Tokyo, Japan, area causing a mass urban fire. This fire spawned an extremely large
fire whirl that killed an estimated 38,000 people in less than
15 min (Soma and Saito 1988). The victims had gathered
in an area of sparse fuel 0.16 km2 in size, and the whirl
moved over the area. Last, the World War II city bombings
of Hamburg, Dresden, and Hiroshima were reported to have
caused very large and destructive fire whirls. The Hamburg
whirl was estimated at 2.4 to 3 km in diameter and 5 km tall
(Ebert 1963).
Large and intense fire whirls also occur on wildland
fires. Graham (1952, 1955, 1957) described several large
whirls that were able to lift large logs and other debris and
break off large standing trees. He indicated that many form
on lee slope locations. Pirsko et al. (1965) reported on a
very intense fire whirl that moved out of the fire area in the
downwind direction and destroyed two homes, a barn, three
automobiles, toppled almost 100 avocado trees, and injured
four people. They also believed that the terrain and lee slope
location contributed to the formation of the whirl. Additionally they cited moderate winds, an unstable atmosphere, and
a large heat source as contributors. King (1964) analyzed
video of a fire whirl and found that maximum vertical
velocities in the whirl core were up to 91 m/s. Large fire
whirls have also been documented on flat ground. Haines
and Updike (1971) described several medium to large fire
whirls that occurred during prescribed fires on flat ground.
They cited a super-adiabatic lapse rate in the lower atmosphere as an important factor. Umscheid et al. (2006) also
reported on a large fire whirl that occurred on flat ground
and gave convincing arguments that a major contributor to
the whirl was vorticity associated with passage of a cold
front. Billing and Rawson (1982) also reported on a large
whirl that may have been influenced by a cold front passage. McRae and Flannigan (1990) described many large
whirls that occurred on prescribed fires. One of the largest
and most intense whirls was 400 m in diameter and ripped
standing trees out of the ground and lifted them upward.
This whirl occurred on a cloudy day with a temperature
lapse rate of -6 °C/1000 m in the first 1000 m above the
ground. They concluded that the influence of the environmental lapse rate on fire whirl formation is unclear and that
whirls can form under lapse rates other than dry or super
adiabatic.
Fire whirls have severely injured firefighters in the past.
Emori and Saito (1982) described a wildland fire in Japan
that may have spawned a fire whirl that injured firefighters.
The 2001 Fish Fire in Nevada generated a fire whirl that
caused firefighters to deploy their fire shelters (U.S. Bureau
of Land Management 2001). Another whirl in 2006 in
Nevada injured six firefighters (U.S. Bureau of Land Management 2006). Finally, a very large whirl formed on the
2008 Indians Fire in California that injured four firefighters
(Moore 2008).
Fire Whirl Physics
Over the past few decades, a significant body of information
has accumulated on fire whirl structure and influencing
factors. The different techniques used to investigate fire
whirls include field and laboratory-scale experiments, as
well as analytical, physical, and numerical modeling. This
work has revealed some of the main features of fire whirls.
For example, it is commonly accepted that the formation
of fire whirls requires a source of ambient vorticity and a
concentrating mechanism (Emmons and Ying 1967, Goens
1978, Meroney 2003a, Zhou and Wu 2007). Ambient
vorticity in the atmosphere can be generated at the ground
through wind shear, horizontal density gradients, and from
the Earth’s rotation. The concentrating mechanisms in fires
are produced by the buoyant flow. It reorients horizontal
vorticity into the vertical direction and provides vortex
stretching.
Vorticity Sources
In the wildland fire context, there are many possible
sources of ambient vorticity that could contribute to fire
whirls. Morton (1966) discussed some of these sources. One
important source may be the shear layer that develops when
ambient wind flows over the ground surface, producing horizontally oriented vorticity. This type of vorticity generation
91
GENERAL TECHNICAL REPORT PNW-GTR-854
Figure 7-2—A schematic
showing how shear-generated
horizontal vorticity present
in the atmosphere near the
ground can be reoriented to
the vertical by a fire (from
Church et al. 1980).
corresponds to the shear term on the righthand side of
equation 1. As shown in figure 7-2, this horizontal vorticity
can then be reoriented, or tilted, by the fire’s buoyant flow
into the vertical (Church et al. 1980, Cunningham et al.
2005, Jenkins et al. 2001) and may be a major contributor
to many fire whirls. Similarly, it is likely that the indrafting
to a buoyant plume develops a shear layer near the ground
that also generates horizontally oriented vorticity that can
be tilted to the vertical. This source of vorticity could be
present even in zero ambient wind situations. Complex
terrain can also generate vorticity through channeling and
shear of ambient and fire-induced winds (Pirsko et al. 1965).
Turbulent wake regions behind terrain features such as hills
and mountains are thought to produce favorable vorticity for
fire whirls (Countryman 1964, 1971; Goens 1978; Graham
1957). Another source of ambient vorticity for some whirls
may be vorticity present along frontal boundaries (Billing
and Rawson 1982, Umscheid et al. 2006). This may be similar to the meteorological setting for many non-mesocyclone
tornadoes (Umscheid et al. 2006).
Another possible source of vorticity in fire whirls is
the baroclinic term in equation 1. At this time, it is unclear
how important this source of vorticity is to fire whirls.
McDonough and Loh (2003) provided an initial examination using numerical modeling. They mainly examined
grid resolution requirements and were not able to make any
strong conclusions about the significance of baroclinically
generated vorticity, other than that it warrants further study.
Vortex Stretching
The primary vorticity-concentrating mechanism in fire
whirls appears to be vortex stretching owing to vertically
accelerating flow in the whirl core (Snegirev et al. 2004).
The vertical acceleration is due to buoyant forces from hot
gases in the core of the fire whirl. This acceleration causes
a reduction in the diameter of a horizontal area enclosed
by a chain of fluid particles (horizontal convergence),
thereby increasing nonzero vorticity at any location on the
horizontal area (Jenkins et al. 2001). This is analogous to a
reduction in the moment of inertia of a rotating solid, causing increased rotation rate to conserve angular momentum.
92
Synthesis of Knowledge of Extreme Fire Behavior: Volume I for Fire Managers
Snegirev et al. (2004) indicated that the whirl core radius
is not dependent on the initial or imposed circulation, but
that it is probably dependent on vortex stretching owing to
vertical acceleration.
This same mechanism may also contribute to reduction in whirl vorticity (Snegirev et al. 2004) high up in the
vortex where the vertical velocity decreases with height.
This could occur when the core’s buoyancy is reduced
from ambient air entrainment or encountering a stable
atmospheric lapse rate aloft. The vertical deceleration
would reduce the vorticity.
likely to occur. This critical velocity was found to be
proportional to the vertical buoyant velocity, which depends
on the burning rate and length scale of the burning area.
Fire Whirls in the Real World: Common
Features
Many factors appear to influence the development of fire
whirls on wildland fires. These factors interact in complex
ways, and it is doubtful that firefighters will ever have
very accurate predictive tools to foresee whirl formation,
especially in a timely manner to make real-time decisions.
The hope at this point is to identify situations that are
more likely to form whirls. The following are some likely
scenarios where fire whirls have been known to form. It is
probable that some of these types of fire whirl scenarios
could combine to possibly make whirl formation more
likely or more intense.
Increased Combustion Rates
A number of researchers have noted significant increases in
burning rates of laboratory fire whirls (Byram and Martin
1962, Chuah et al. 2009, Emmons and Ying 1967, Martin et
al. 1976). In all of these studies, the burning rate is defined
as the mass loss rate of the fuel source (solid or liquid).
Byram and Martin (1962) found a threefold increase in
alcohol burning rate when a whirl formed. Emmons and
Ying (1967) found that the burning rate of their acetone pool
fires was a function of the externally imposed circulation,
with increases of up to seven times the nonwhirl conditions.
Martin et al. (1976) measured burning rates in fires fueled
by cross-piled wood sticks of varying sizes that were 1.4 to
4.2 times the nonwhirl fire rate.
Whirl Shedding on the Lee Side of a Plume
This type of whirl forms when a plume is subjected to
a crossflow wind. The whirl forms on the lee side of the
plume. It separates from the plume and advects in the
downwind direction. It is similar in appearance to Von
Karman vortex shedding behind an obstruction in a flow.
Often, as the whirl moves away from the fire, it contains
no flaming combustion. Wind in the whirl can be strong
enough to cause damage to trees, structures, vehicles, etc.,
and the whirl may stay intact for several minutes and travel
for distances of possibly 1.6 km (1 mi). Its ability to stay
intact even though most of its vortex stretching mechanism
(buoyancy) is lost is probably due to the strong reduction
in turbulent diffusion of the core. Examples of this type of
whirl have been reported by many authors (Church et al.
1980; Clements et al. 2008; Dessens 1962; Hissong 1926;
Pirsko et al. 1965; Soma and Saito 1988, 1991) and video
and images of others are on file at the U.S. Forest Service
Missoula Fire Sciences Laboratory.
It is probable that a critical crossflow wind velocity is
very important to this type of fire whirl, as discussed in the
section on scaling firewhirls. Its main source of vorticity
Scaling Fire Whirls
Much of what is known about fire whirls comes from
small-scale laboratory experiments. Full-scale experiments are usually not practical because of safety concerns,
economic aspects, and difficulties of controlling boundary
conditions (Emori and Saito 1982). Because of this, scaling
laws are very important to consider when attempting to
apply information gained from small-scale experiments to
full-scale fire whirls. Several authors have examined scaling
related to fire whirls.
Kuwana et al. (2007, 2008) examined several experimental and full-scale whirls and concluded that a critical
crossflow wind velocity exists where fire whirls are most
93
GENERAL TECHNICAL REPORT PNW-GTR-854
wind is above or below this speed, whirls are less likely to
form. This type of whirl is probably very much related to
the shedding whirl type, including the important vorticity
source from the ambient shear flow.
Vorticity Associated With Cold Fronts
Figure 7-3—Schematic of fire whirl formation for an L-shaped
heat source in a crossflow wind. View is from above.
may come from the tilting of horizontally oriented, sheargenerated vorticity in the ambient crossflow. The significance of other sources of vorticity is currently unknown.
Others (Fric and Roshko 1994, McMahon et al. 1971, Moussa
et al. 1977) have shown that the same shedding whirls are
present in an isothermal vertical jet in crossflow, giving
some credibility to the notion that the main source of vorticity comes from the shear-induced ambient vorticity
L-Shaped Heat Source in Crossflow
Soma and Saito (1988, 1991) first investigated this type of
fire whirl as an explanation for a historic and catastrophic
fire whirl that occurred in 1923 in Tokyo. Unlike the
shedding whirl, this type of whirl seems to be mostly
stationary. It occurs when a roughly L-shaped heat source
is subjected to a crossflow wind as shown in figure 7-3. The
whirl forms in the inside bend of the L-shaped heat source.
As in the shedding whirl, a critical crossflow windspeed is
thought to be important (Soma and Saito 1988, 1991). If the
This type of whirl forms when ambient vertical vorticity
from cold fronts interacts with a fire plume. Billing and
Rawson (1982) and Umscheid et al. (2006) discussed cases
where this type of whirl formed over flat terrain. The key
feature of these two examples is that they occurred almost
exactly when a cold front passed over the fire area. Umscheild et al. (2006) discussed the associated ambient vertical
vorticity present along a cold front boundary and identified
some similarities between this type of fire whirl and the
formation mechanisms of non-mesocyclone tornadoes. At
this time, it is not clear why fire whirls form under some
cold front passage conditions, but not others. Perhaps nonmesocyclone tornado genesis research can help identify
why these whirls form.
Multiple Interacting Plumes
This type of fire whirl occurs from the interaction of
multiple plumes with no ambient crossflow wind. Entrainment into each plume is affected by the nearby plumes,
and under the correct configuration and buoyant plume
strengths, a whirl can form. Figure 7-4 shows a schematic
of how five fires could be oriented to cause a fire whirl.
Lee and Otto (1975) observed whirl formation owing to
plume interaction in their experiment using two asymmetric burning wood piles. Zhou and Wu (2007) examined
the multiple interacting plume whirl in more detail using
experimental fires, numerical simulation, and some scaling
analysis. They discussed configurations under which whirls
would and would not form. They also showed that whirls
can form under randomly oriented plume locations (fig. 7-5).
This has implications for wildland fire under mass ignition
conditions. Occurrence of fire whirls under such conditions
might be very likely, so long as the multiple plumes are
drafting a significant amount of air and are properly spaced
and organized.
94
Synthesis of Knowledge of Extreme Fire Behavior: Volume I for Fire Managers
Lee Side of a Hill/Mountain
These fire whirls occur when a fire plume exists on the
lee side of a terrain obstruction such as a hill or mountain.
The plume uses vorticity existing in the wake region of the
obstruction to form the whirl. Countryman (1971) stated
that this is the most favorable situation for generation of
fire whirls. During investigations of full-scale mass fires,
Countryman (1964) intentionally burned a fire on a lee
slope under moderate wind to investigate this type of whirl.
Several whirls formed during the burn, with the largest
occurring near the end. Pirsko et al. (1965) described a
whirl that formed on the lee side of a terrain obstruction and
then shed from the plume in the downwind direction. The
whirl caused significant wind damage to several houses,
trees, and vehicles. Windspeed at the time was 9.4 m/s (21
mi/h) with gusts to 13 m/s (29 mi/h).
Horizontal Vortices
Horizontal vortices are quite common in the atmosphere
and have been extensively studied (see Brown [1980] and
Etling and Brown [1993] for reviews). In the absence of
wind, when the ground is heated, the warm air near the
ground will eventually begin to rise in circulation cells, a
process known as Rayleigh-Bernard convection (Fernando
and Smith 2001). In the presence of vertical wind shear,
these cells begin to transition from disorganized and transient to an organized state: hexagonal lattice of convective
cells. Fair-weather cumulus clouds often mark the tops of
updrafts of these cells. As the wind shear increases, the
convective cells further organize into horizontal convective rolls that are perpendicular to the mean wind; further
increases in the vertical wind shear change the balance
between buoyancy-driven vorticity and shear-driven vorticity and lead to the convective rolls being oriented parallel to
the mean wind (Küettner 1971). These longitudinal convective rolls are easily seen in satellite images as parallel
bands of cumulus clouds known as cloud streets. Figure
7-6 illustrates the structure of these cloud streets. Although
such horizontal convective rolls are a common feature of the
atmosphere in the planetary boundary layer, the presence of
Figure 7-4—Schematic showing one configuration that can cause
a multiple interacting plume type fire whirl (from Zhou and Wu
2007).
Figure 7-5—A computer simulation showing how randomly
oriented heat sources could cause a fire whirl through plume
interactions (from Zhou and Wu 2007).
95
GENERAL TECHNICAL REPORT PNW-GTR-854
The buoyancy-forced ring vortex is a common feature
of fluid flows associated with heat sources ranging in
scales from candles to pool fires up to large mass fires;
however, they are most clearly visible under conditions
of weak mean horizontal flow. For these ring vortices, the
vorticity is generated through the baroclinic term from
equation (1). Because the thickness of the density layer
controls the magnitude of the baroclinically forced vorticity, the strongest vortices have scales similar to that of the
flame surface (Cheung and Yeoh 2009). As buoyant forces
Figure 7-6—Illustration of the role of horizontal vortices in the
development of cloud streets (based on Etling and Brown 1993).
a fire adds a complicating factor in the form of a horizontal
temperature gradient that can locally alter the convective
organization of the boundary layer.
Horizontal vortices associated with wildland fires have
received less attention than their vertical counterparts, fire
whirls. Haines and Smith (1987) provided descriptions
of three distinct types of horizontal vortices observed on
wildland fires: the transverse vortex, which is perpendicular
to the flow direction; a single longitudinal (flow parallel)
vortex; and a counter-rotating longitudinal vortex pair.
Transverse Vortices
Transverse vortices are described by Haines and Smith
(1987) as a series of vortices “climbing” the upstream side
of the convective column under conditions of low ambient
windspeeds and intense burning. The mechanism Haines
and Smith (1987) proposed for the development of such
vortices involves the development of buoyancy-forced ring
vortices rising through the smoke column. Haines and
Smith (1987) further hypothesized that only the upwind
portion of the ring is clearly visible, as turbulent mixing
is thought to render the downwind section of the ring less
distinct. Transverse vortices on wildland fires have received
little attention, but extensive literature is available on ring
vortices associated with pool fires.
cause these vortices to rise, a process often referred to as
“amalgamation” takes place as the rising vortices merge and
grow and manifest themselves in the oscillatory necking
and bulging of the fire that results from the Rayleigh-Taylor
instability. The same basic process can be observed at the
scale of the smoke plume, leading to the development of the
transverse vortices described by Haines and Smith (1987).
The oscillatory nature of the development of these vortices
has been extensively studied for pool fires (Cetegen and
Ahmed 1993); however, little has been done at the scale of
wildland fire events.
Although descriptions of vortex rings are quite common in the literature, little is mentioned about transverse
vortices outside of Haines and Smith (1987). These vortices
manifest themselves on the upwind side of the plume and
add a boiling appearance to the plume. Although the vortices themselves are not a source of erratic fire behavior, their
presence is an indicator of a potential increase in the rate of
combustion and an associated change in fire behavior.
Longitudinal Vortices
Single longitudinal vortex—
Longitudinal vortices differ from their transverse counterparts in that their axis of rotation is oriented parallel to
the mean flow. The first class of longitudinal vortices from
Haines and Smith (1987) is the single longitudinal vortex,
of which only one case is presented, the Dudley Lake Fire
as described by Schaefer (1957). The vortex was oriented
in the direction of the mean flow, which was quite strong
that day as surface winds were between 16 and 22 m/s. The
96
Synthesis of Knowledge of Extreme Fire Behavior: Volume I for Fire Managers
diameter of the vortex was estimated at 1800 m. Smoke
entrained within the vortex delineated the corkscrewlike
nature of the vortex and allowed the vortex to be observable
500 km downwind. The scale of this vortex is similar to
those of the convective boundary layer rolls responsible for
cloud streets and shows strong similarities to roll vortices
associated with other crown fires (Haines 1982) with the
main exception being that this was only a single vortex.
A possible answer to the question of why only a single
vortex was observed may be answered through the numerical modeling work of Heilman and Fast (1992). In this study,
a computer model of the atmospheric boundary layer was
initialized with multiple heat sources some distance apart
to examine how circulations induced by each heat source
interacted and how the collection of these flows responded
to the introduction of a transverse wind component (wind
blowing perpendicular to the axis of the roll vortices). The
introduction of the transverse wind component tended to
destabilize the longitudinal vortices, and, in some cases,
eliminated the upwind vortex entirely. Haines and Smith
(1992) similarly found in their wind tunnel studies that a
slight transverse component to the flow destabilized the
vortex pair, causing the collapse of the downwind (relative to the transverse wind component) vortex, which on a
wildland fire would cause the vortex to fall outward across
the flank of the fire, providing an additional mechanism for
lateral fire spread and a threat to firefighter safety. On the
Dudley Lake Fire, Schaefer (1957) observed that at regular
intervals, the outward/downward moving segments of the
vortex would mark lateral surges in the fire growth, indicating the possible presence of some slight shifts in the wind
that may have inhibited the presence of the other vortex.
This vortex type differs from the other two types
described by Haines and Smith (1987) in that the fire is not
necessarily an integral forcing term in the development of
the vortex. Conditions in the atmosphere may already favor
the development of the convective rolls, and the fire may
simply act to enhance the vortex through additional thermal
instability. Although the transverse vortices are most pronounced at low windspeeds, the Dudley Lake vortex was
Figure 7-7—Bifurcated smoke plume from a computer simulation.
View is from upwind of the fire (from Cunningham et al. 2005).
accompanied by surface winds of 16 to 22 m/s (the mean
windspeed for the 12 crown fire cases in Haines 1982 was
5.5 m/s).
Counter-rotating, longitudinal vortex pair—
Of the three types of horizontal vortices described by Haines
and Smith (1987), the counter-rotating, longitudinal vortex
pair is the best documented, although early work (Scorer
1968, Turner 1960) focused on vortex pairs associated with
smokestack emissions rather than wildland fires. The key
feature of this vortex type is obviously the paired nature of
the vortices rotating in opposite directions. These vortices
often occur along the flanks of the fire and can also be
observed in the main plume at the head of the fire; this is
often referred to as a bifurcating smoke column. Figure 7-7
shows a numerical simulation of a bifurcated smoke plume
as viewed from behind the fire. Cunningham et al. (2005)
showed that the degree to which the smoke plume splits is
related to the depth of the surface shear layer.
97
GENERAL TECHNICAL REPORT PNW-GTR-854
The New Miner Fire in central Wisconsin in 1976 is
one example of a bifurcated smoke column provided by
Haines and Smith (1987). This fire burned under very low
relative humidity conditions for the region (minimum of
23 percent) with light winds averaging around 2 m/s. The
bifurcated column consisted of a pair of vortices approximately 30 m in diameter that rotated fairly slowly compared
to other atmospheric whirls like tornadoes. These columns
would intermittently collapse and spill over the fire's flanks,
bringing hot gases and embers into contact with unburned
fuels and providing for rapid lateral spread. Obviously,
such behavior is a threat to fire crews that often focus their
suppression efforts along the flanks of the fire. A key difference between these vortex pairs and the single vortex is the
scale; the bifurcated columns were approximately 30 m in
diameter, whereas the vortex on the Dudley Lake Fire was
over 1 km.
As part of a 1979 study conducted at the Centre de
Recherches Atmosphériques Henri Dessens in France,
Church et al. (1980) studied the vortices produced by the
Météotron, an array of 105 oil burners with a total heat
output of 1000 MW. Three types of vortices were observed:
(1) a columnar vortex that had the entire smoke column
rotating, (2) small dust-devil-like vortices just downwind
of the burner array, and (3) a large, counter-rotating vortex
pair within the plume that started as vertical vortices at the
burn site, but became horizontal and oriented parallel to the
wind as the plume rose and moved downwind. The first two
vortex types are vertical vortices as described in the section
on fire whirls.
The last type resembles the bifurcating column
described for the New Miner Fire. At a height of 40 to 50 m,
the smoke column of the Météotron experiment bifurcated
into a pair of counter-rotating vortices with initial diameters
of 30 to 60 m (Church et al. 1980). The dominant motion
associated with these vortices was rotation about their axis
with little noticeable motion along the axis, a stark contrast
to the strong axial flow observed in many fire whirls.
The forcing of the counter-rotating vortex pair is
complex and has parallels with the forcing of similar vortex
pairs by nonbuoyant jets in a crossflow (see Margason 1993
for a review). The split plume develops through the interaction of the ambient vorticity in the flow owing to vertical
wind shear with the jet shear layer (or plume shear layer in
the case of wildland fires). The presence of buoyancy adds
additional complexity to the forcing of the split plume compared to the nonbuoyant jet. Church et al. (1980) put forth a
pair of physical processes capable of describing the development of the bifurcating smoke column. The first process
focuses on the reorientation and stretching of the horizontal
vorticity in the ambient flow. Initially, the ambient vorticity can be thought of as a collection of horizontal tubes
oriented perpendicular to the wind with upward motion
along the upwind side of the tube and downward motion
along the downwind side. As these vortex tubes encounter
the rising air at the fire, the portion of the tube over the fire
is lifted, which acts to tilt the vortex tube at the edge of
the fire into a vertical orientation, producing a hairpin-like
shape. As the lifted portion of the vortex tube continues to
rise in the plume, it encounters stronger horizontal winds
that transport this portion of the tube downwind faster than
the surface parts, stretching the arms of the hairpin vortex.
Eventually the combined processes of the lifting and faster
downwind transport leads to the majority of the hairpin
vortex being oriented horizontal and parallel to the mean
flow. This is illustrated in figure 7-2.
The second process proposed by Church et al. (1980)
deals with the generation of vorticity through the combined
effects of buoyancy and surface drag forces. This process is
actually a variation on the buoyant rings discussed earlier.
The variation is the impact of the crossflow on the rising
ring vortex. On the upwind edge of the ring, the crossflow
enhances entrainment of ambient air on that side of the
plume, which decreases the vertical velocity of that part of
the plume. This causes the downwind section of the ring to
rise faster than the upwind side, tilting some of the vorticity into a vertical orientation. The downwind section also
encounters the stronger winds aloft before the upwind side,
which leads to a stretching/intensifying of the streamwise
sections of the ring. Experiments by Tsang (1970, 1971)
98
Synthesis of Knowledge of Extreme Fire Behavior: Volume I for Fire Managers
support the viability of this method in generating the
counter-rotating vortex pair.
Although both physical processes are plausible explanations for the development of the counter-rotating vortex
pair, both are not equally supported by the observations.
Many of the observed fire plumes exhibited significant nearsurface vertical vorticity, which is best supported by the
first process, which relies upon the reorientation of ambient
vorticity (Cunningham et al. 2005). Wind tunnel studies
of the longitudinal vortex pair offer further support for
the ambient vorticity process, as Smith et al. (1986) found
the vorticity in the streamwise vortex pair to agree quite
well with the vorticity of the ambient flow as it approached
the heat source. This is not to suggest that the buoyancy
generated from the fire has no impact, just that it is not the
dominant forcing for the development of the vortex pair.
Numerical modeling studies of the longitudinal vortex
pair have largely been two dimensional (Heilman and Fast
1992; Luti 1980, 1981; Porteire et al. 1999) or quasi-three
dimensional (streamwise flow component assumed constant)
where the governing equations are solved for a number
of planes perpendicular to the streamwise flow (McGratten et al. 1996, Trelles et al. 1999, Zhang and Ghoniem
1993). Cunningham et al. (2005) conducted the first fully
three-dimensional simulation of fire plumes to focus on
the development of vortical structures. Their simulations
revealed the relationship among the depth of the shear
layer, fire intensity, and the behavior of the vortex pair. The
basics of this relationship centered around how long it took
a buoyant air parcel to traverse the shear layer. Keeping the
mean crossflow constant, a deeper shear layer would lead
to a wider split of the smoke column. If the fire intensity
is increased, the air parcels travel through the shear layer
faster, which leads to a decrease in the width of the plume
split. One interesting observation is that for a given fire
intensity, the plume rise is not affected by the width of the
smoke column's bifurcation, although its horizontal spread
and deviation from a Gaussian distribution is strongly
affected.
Another aspect of the counter-rotating vortex pair
described by the numerical simulations of Cunningham et
al. (2005) is the potential for oscillations, with each branch
periodically exhibiting dominance. These oscillations
were linked with localized regions of vertical vorticity of
alternating signs being shed from either side of the plume in
a manner similar to wake vortices observed for fluid flowing
around a cylinder. These results were limited to a narrow
range of flow parameters, but the simulations indicate that
the counter-rotating vortex pair are not necessarily stable.
Wind tunnel studies using a heated wire to mimic the flank
of a crown fire have shown that perturbations in the flow
component perpendicular to the mean flow can cause the
vortex pair to collapse (Haines and Smith 1992). These flow
perturbations could be caused by upstream topographic
features, possibly groups of trees, or even natural shifts in
the ambient wind.
In the previous discussion, the wind profile reflected
typical conditions where windspeed increased with height.
Byram (1954) noted that a number of major fire runs
occurred when the windspeed decreased with height near
the surface, a condition known as an adverse wind profile.
Clark et al. (1996) examined the potential impact of an
adverse wind profile on fire spread through the use of a
three-dimensional coupled fire-atmosphere model. In their
simulations, a counter-rotating vortex formed through the
reorientation of the ambient boundary layer vorticity as
described above; however, this time, the rotation was in
the opposite direction (see figure 7-2 of Clark et al. 1996),
which leads to narrow regions of hot, high-speed air shooting out of the fire front. This dynamic fingering occurred at
scales of the order of tens of meters and has the potential to
augment fire spread.
Tree Crown Streets
Some fires exhibit complex patterns of alternating strips of
burned and unburned fuel, often referred to as tree crown
streets. One possible explanation for the development of
tree crown streets involves horizontal roll vortices (Haines
1982). It is hypothesized that on one side of the vortex,
99
GENERAL TECHNICAL REPORT PNW-GTR-854
descending air cools the fuels and causes surface winds to
diverge, thus inhibiting crown fire spread. On the other side
of the vortex, upward motion is enhancing the convective
column owing to the associated surface wind convergence,
which can in turn enhance a spreading crown fire. Tree
crown streets are cited as evidence for the presence of
horizontal roll vortices on the Mack Lake Fire (Simard et al.
1983). Wade and Ward (1973) observed complex patterns of
intermittent strips of unburned fuel in the Air Force Bomb
Range Fire and suggested some potential hypotheses for
these patterns including brief fluctuations of windspeed
or direction, or pulsations of long-range spotting linked to
an erratic convective column. Although often considered a
fingerprint for the presence of horizontal roll vortices, the
exact cause of tree crown streets is not known.
Summary
Vorticity describes the degree of rotation in the atmosphere
about some axis. Two factors that induce rotation in the
atmosphere are wind shear and sharp horizontal gradients
in temperature. Once one of these factors has generated
vorticity, that vorticity can be transported by the mean wind
to other locations, reoriented from one axis to another (a
horizontal vortex can be tilted to become a vertical vortex),
or enhanced by flow convergence that stretches the vortex.
It is rare for the atmosphere to be completely devoid of
vorticity. If the wind is blowing at all, there is vorticity
produced near the ground by surface drag. Terrain features
provide flow obstacles whose drag produces wind shear,
thus generating vorticity. Different ground surfaces heat at
different rates, which also generates vorticity. Vortices are
present across a broad spectrum of spatial scales, continuously transferring energy between scales, mostly from large
scales to smaller scales. A fire not only interacts with and
modifies this ambient vorticity, but also generates additional
vorticity.
For convenience in our discussion of wildland fire
vortices, we split our discussion into vertical and horizontal
vortices. Vertical vortices, often referred to as fire whirls,
are often the most dramatic and often-described type of
vortex. Fire whirls, especially the larger ones, represent a
considerable safety hazard to firefighters, as these vortices
can result in sudden increases in fire intensity, spotting,
erratic spread rate and direction, and damaging winds.
Most often, the source of vorticity for a fire whirl is not
the fire itself; rather, the vorticity is present in the ambient atmosphere. This ambient vorticity may be generated
by wind shear, vortex shedding in the wake of a plume or
topographic obstruction, or an approaching cold front. The
fire plays a much more important role in modifying the
ambient vorticity field by tilting horizontal vortices toward
the vertical, and increasing the vorticity magnitude through
the stretching term as surface flow converges at the fire to
feed the strong updraft.
Similarly, two of the three horizontal vortex types
described by Haines and Smith (1987) rely on ambient
vorticity. The counter-rotating vortex pair builds upon the
tilting and stretching vortex modifications that enable a
fire to transform horizontal vorticity generated by wind
shear into a vertically oriented fire whirl. The key addition is stronger winds above the surface that sweep the
upper part of the hairpin vortex described in figure 7-2
downwind, bending the vortices back toward a horizontal
orientation. For the single longitudinal vortex described for
the Dudley Lake Fire, the fire is interacting with vorticity
on a much larger scale, a boundary layer roll whose depth
can occupy the entire mixed layer. Again the fire's role is
one of modifying the vortex, which can in turn modify the
fire environment by changing windflow patterns near the
fire and creating a positive feedback loop leading to fire
intensification.
Vortices are common features of the atmosphere occurring across a broad range of spatial scales. Our understanding of how wildland fires interact with this broad spectrum
of atmospheric vortices is still very much in development.
Table 7-1 summarizes the various vortices described in the
text along with their causes and potential threats. Although
the occurrence of these vortices is currently impossible to
predict with precision, having a basic understanding of the
importance of ambient atmospheric vorticity for vortex
100
Synthesis of Knowledge of Extreme Fire Behavior: Volume I for Fire Managers
Table 7-1—Summary of vortices, their causes, and potential threats
Phenomenon
Causal factor(s)
Potential danger
Fire whirl formation on the lee side of a
plume Shear-generated vorticity near the ground
is concentrated and reoriented to the vertical on the lee side of the plume.
Increased energy release rate, spread rate,
and spotting. The whirl could travel downwind
from the fire and overtake firefighters.
Fire whirl formation
near an L-shaped
fire in a crossflow
wind
Shear-generated vorticity near the
ground is concentrated and reoriented
of the vertical on the lee side of the L, as
shown in figure 7-3.
Increased energy release rate, spread rate, and
spotting. The whirl could suddenly form in the
“interior” area of L.
Fire whirl formation
near a cold front
Vorticity along the frontal boundary is
concentrated in to a fire whirl.
Increased energy release rate, spread rate,
and spotting.
Fire whirl formation
owing to multiple
interacting fire
plumes
The indrafting and blocking effects of
of multiple interacting fire plumes
concentrates vorticity that was likely
shear generated near the ground.
Increased energy release rate, spread rate, and
spotting. Whirl could build into a fire storm.
Fire whirl formation Vorticity associated with the wake region
on the lee side of a
of a terrain obstruction such as a hill or
hill/mountain mountain is concentrated into a fire
whirl.
Increased energy release rate, spread rate,
and spotting. The fire could quickly switch from
a sheltered, backing fire with low fire behavior
to more extreme fire behavior. The whirl could
travel downwind from the fire and overtake
firefighters.
Transverse vortex Horizontal vorticity is produced
on upwind side of
through buoyancy.
smoke column
Not a source of erratic fire behavior, but rather
an indicator of a potential increase in the rate
of combustion and an associated change in
fire behavior.
Single longitudinal
vortex
Slight variations in wind direction can
destabilize the vortex, causing the vortex to fall
outward across the flank of the fire, providing a
mechanism for lateral bursts in fire spread.
Unstable atmosphere and strong winds
generate horizontal vortices with axis
parallel to the wind direction. Vortex
formation is not tied to the fire.
Counter-rotating
Transverse ambient vorticity from
longitudinal vortex surface wind shear is altered by the fire pair
as it is tilted into the vertical and reoriented to the longitudinal direction. Evident as a bifurcated smoke plume.
development provides some guidance on situations that
require awareness. Examining surrounding topography
relative to the expected wind direction, can reveal features
that may block or channel the flow. Wind profiles, when
available, can provide information on wind shear as can
watching direction and speed of cloud movements and their
organization (are the clouds forming in lines?). Things
101
Can produce concentrated wind bursts at the head
of the fire front. The vortices are not always
stable as variations in wind direction can cause
one of the vortices to collapse and bring hot
gases and fire brands into contact with the unburned fuel.
to observe include (1) the behavior of the fire and smoke
plume. Vortices are almost always present along the flaming
front at some scale. (2) Vortices that grow or persist. (3)
Signs of rotation or splitting in the smoke plume. This
information is not sufficient for predicting the occurrence
of intense vortices on wildland fires, but it can help identify
potentially hazardous conditions.
GENERAL TECHNICAL REPORT PNW-GTR-854
Knowledge Gaps
Vortices in the atmosphere occur across a broad range of
scales and may impact wildland fires in numerous ways.
Vortices on wildland fires can develop rapidly, and their
behavior is quite erratic and difficult to predict. As with
tornadoes, understanding the environmental conditions that
favor vortex formation is the first step to understanding the
phenomenon. However, in the case of fire-related vortices,
an important aspect not shared with tornadoes is the
coupling between the fire and the ambient vorticity field. As
highlighted in the fire whirl scaling section, a relationship
exists—between the vigor of the vertical motions induced
by the fire and the ambient crossflow—that describes a
range of windspeeds that would support whirl development. Further investigation of this relationship and similar
relationships that exist for horizontal vortices would provide
a sound basis to develop management tools for assessing the
potential for vortex development on a fire.
Literature Cited
Billing, P.; Rawson, R. 1982. A fire tornado in the sunset
country. Report 11. Victoria, BC: Forests Commission,
Fire Research Branch.
Brown, R.A. 1980. Longitudinal instabilities and
secondary flows in the planetary boundary layer: a
review. Reviews of Geophysics and Space Physics.
18: 683–697.
Byram, G.M. 1954. Atmospheric conditions related to
blowup fires. Station Paper 35. Asheville, NC: U.S.
Department of Agriculture, Forest Service, Southeastern
Forest Experiment Station. 31 p.
Byram, G.M.; Martin, R.E. 1962. Fire whirlwinds in the
laboratory. Fire Control Notes. 33(1): 13–17.
Cetegen, B.G.; Ahmed, T.A. 1993. Experiments on the
periodic instability of buoyant plumes and pool fires.
Combustion and Flame. 93: 157–184.
Cheung, S.C.P.; Yeoh, G.H. 2009. A fully-coupled
simulation of the vortical structures in a large-buoyant
pool fire. International Journal of Thermal Sciences.
48: 2187–2202.
Chuah, K.H.; Kuwana, K.; Saito, K. 2009. Modeling a
fire whirl generated over a 5-cm-diameter methanol pool
fire. Combustion and Flame. 156: 1828–1833.
Church, C.R.; Snow, J.T.; Dessens, J. 1980. Intense
atmospheric vortices associated with a 1000 MW fire.
Bulletin of the American Meteorological Society.
61(7): 682–694.
Clark, T.L.; Jenkins, M.A.; Coen, J.L.; Packham, D.R.
1996. A coupled atmosphere-fire model: role of the
convective Froude number and dynamic fingering at the
fireline. International Journal of Wildland Fire.
6(4): 177–190.
Clements, C.B.; Zhong, S.; Bian, X.; Heilman, W.E.;
Byun, D.W. 2008. First observations of turbulence
generated by grass fires. Journal of Geophysical
Research: 113. D22102. DOI: 10.1029/2008JD010014.
Countryman, C.M. 1964. Mass fires and fire behavior.
Res. Pap. PSW-19. Berkeley, CA: U.S. Department of
Agriculture, Forest Service, Pacific Southwest Forest and
Range Experiment Station. 53 p.
Countryman, C.M. 1971. Fire whirls: why, when,
and where. Res. Note PSW-216. Berkeley, CA: U.S.
Department of Agriculture, Forest Service, Pacific
Southwest Forest and Range Experiment Station. 6 p.
Cunningham, P.; Goodrick, S.L.; Hussaini; M.Y.; Lin,
R.R. 2005. Coherent vortical structures in numerical
simulations of buoyant plumes from wildland fires.
International Journal of Wildland Fire. 14: 61–75.
Dessens, J. 1962. Man-made tornadoes. Nature.
193(4810): 13–14.
Ebert, C.H.V. 1963. Hamburg's fire storm weather.
National Fire Protection Association Quarterly.
56(3): 253–260.
102
Synthesis of Knowledge of Extreme Fire Behavior: Volume I for Fire Managers
Emmons, H.W.; Ying, S.J. 1967. The fire whirl. In:
Proceedings of the 11th international symposium on
combustion. Pittsburgh, PA: Combustion Institute:
475–488.
Haines, D.A.; Smith, M.C. 1992. Simulation of the
collapse of bent-over vortex pairs observed in wildland
fires. Forest Science. 38: 68–79.
Emori, R.I.; Saito, K. 1982. Model experiment of
hazardous forest fire whirl. Fire Technology.
18(4): 319–327.
Haines, D.A.; Updike, G.H. 1971. Fire whirlwind
formation over flat terrain. Res. Pap. NC-71. St. Paul,
MN: U.S. Department of Agriculture, Forest Service,
North Central Forest Experiment Station.
Etling, D.; Brown, R.A. 1993. Roll vortices in the
planetary boundary layer: a review. Boundary-Layer
Meteorology. 65: 215–248.
Heilman, W.E.; Fast, J.D. 1992. Simulations of horizontal
roll vortex development above lines of extreme surface
heating. International Journal of Wildland Fire. 2: 55–68.
Fernando, H.J.S.; Smith, D.C.I. 2001. Vortex structures in
geophysical convection. European Journal of Mechanics
- B/Fluids. 20(4): 437–470.
Hissong, J. 1926. Whirlwinds at oil-tank fire, San Luis
Obispo, California. Monthly Weather Review.
54: 161–163.
Fric, T.; Roshko, A. 1994. Vortical structure in the wake of
a transverse jet. Journal of Fluid Mechanics. 279: 1–47.
Jenkins, M.A.; Clark, T.; Coen, J. 2001. Coupling
atmospheric and fire models. In: Johnson, E.A.;
Miyanishi, K., eds. Forest fires: behavior and ecological
effects. San Diego, CA: Academic Press. 598 p.
Gess, D.; Lutz, W. 2002. Firestorm at Peshtigo: a town, its
people and the deadliest fire in American history. New
York: Henry Holt Publishing.
King, A.R. 1964. Characteristics of a fire-induced tornado.
Australian Meteorological Magazine. 44: 1–9.
Goens, D.W. 1978. Fire whirls. Tech. Memo. NWS WR129. Missoula, MT: National Oceanic and Atmospheric
Administration.
Küettner, J.P. 1971. Cloud bands in the atmosphere. Tellus.
23: 404–425.
Graham, H.E. 1952. A firewhirl of tornadic violence. Fire
Control Notes. 13(2): 22–24.
Kuwana, K.; Sekimoto, K.; Saito, K. [et al.]. 2007.
Can we predict the occurrence of extreme fire whirls?
American Institute of Aeronautics and Astronautics
Journal. 45(1): 16–19.
Graham, H.E. 1955. Fire whirlwinds. Bulletin of the
American Meteorological Society. 36(3): 99–103.
Kuwana, K.; Sekimoto, K.; Saito, K.; Williams, F.A.
2008. Scaling fire whirls. Fire Safety Journal.
43: 252–257.
Graham, H.E. 1957. Fire-whirlwind formation as favored
by topography and upper winds. Fire Control Notes.
18(1): 20–24.
Haines, D.A. 1982. Horizontal roll vortices and crown fires.
Journal of Applied Meteorology. 2: 751–762.
Haines, D.A.; Smith, M.C. 1987. Three types of horizontal
vortices observed in wildland mass and crown fires.
Journal of Climate and Applied Meteorology.
26: 1624–1637.
103
Lee, S.L.; Otto, F.W. 1975. Gross vortex activities in a
simple simulated urban fire. Symposium (International)
on Combustion. 15(1): 157–162.
Luti, F.M. 1980. Transient flow development due to
a strong heat-source in the atmosphere. I. Uniform
temperature source. Combustion Science and
Technology. 23: 163–175.
GENERAL TECHNICAL REPORT PNW-GTR-854
Luti, F.M. 1981. Some characteristics of a two-dimensional
starting mass fire with cross flow. Combustion Science
and Technology. 26: 25–33.
Moore, T. 2008. Indians Fire accident prevention analysis.
Vallejo, CA: U.S. Department of Agriculture, Forest
Service, Pacific Southwest Region. 113 p.
Margason, R.J. 1993. Fifty years of jet in crossflow
research. In: Proceedings of the AGARD symposium
on computational and experimental assessment of
jets in crossflow. AGARD-CP-534. London, United
Kingdom: Advisory Group for Aerospace Research and
Development: 1.1 through 1.41.
Morton, B.R. 1966. Geophysical vortices. Progress in
Aerospace Sciences. 7: 145–194.
Martin, R.E.; Pendleton, D.W.; Burgess, W. 1976. Effect
of fire whirlwind formation on solid fuel burning rates.
Fire Technology. 12(1): 33–40.
McDonough, J.M.; Loh, A. 2003. Simulation of vorticitybuoyancy interactions in fire-whirl-like phenomena. In:
Proceedings, American Society of Mechanical Engineers
Heat Transfer Summer Conference. American Society of
Mechanical Engineers: 195–201.
Moussa, Z.M.; Trischka, J.W.; Eskinazi, S. 1977. The
near field in the mixing of a round jet with a cross-flow.
Journal of Fluid Mechanics. 80: 49–90.
Musham, H.A. 1941. The Great Chicago Fire. In: Papers
in Illinois History and Transactions for the Year 1940.
Springfield, IL: Illinois Historical Society: 69–189.
Pirsko, A.R.; Sergius, L.M.; Hickerson, C.W. 1965.
Causes and behavior of a tornadic fire-whirlwind.
Res. Note PSW-61. Berkeley, CA: U.S. Department of
Agriculture, Forest Service, Pacific Southwest Forest and
Range Experiment Station.
McGratten, K.B.; Baum, H.R.; Rehm, R.G. 1996.
Numerical simulation of smoke plumes from large oil
fires. Atmospheric Environment. 30: 4125–4136.
Porteire, B.; Loraud, J.C.; Morvan, D.; Larini, M.
1999. A numerical study of buoyant flow in cross-flow
conditions. International Journal of Wildland Fire.
9: 101–108.
McMahon, H.; Hester, D.; Palfery, J.G. 1971. Vortex
shedding from a turbulent jet in a cross-wind. Journal of
Fluid Mechanics. 48: 73–80.
Schaefer, V.J. 1957. The relationship of jet streams to forest
fires. Journal of Forestry. 55: 419–425.
McRae, D.J.; Flannigan, M.D. 1990. Development of
large vortices on prescribed fires. Canadian Journal of
Forest Research. 20: 1878–1887.
Meroney, R.N. 2003a. Fire whirls and building
aerodynamics. In: Proceedings of the 11th international
conference on wind engineering. http://www.engr.
colostate.edu/~meroney/projects/MERFWB.pdf. (May
16, 2011).
Meroney, R.N. 2003b. Fire whirls, fire tornados, and
fire storms: physical and numerical modeling. In:
Proceedings of PHYSMOD2003: International workshop
on physical modeling of flow and dispersion phenomena.
http://www.engr.colostate.edu/~meroney/PapersPDF/
CEP03-04-1.pdf. (May 16, 2011).
Scorer, R.S. 1968. Air pollution. Oxford, United Kingdom:
Pergamon Press. 151 p.
Simard, A.J.; Haines, D.A.; Blank, R.W.; Frost, J.S.
1983. The Mack Lake Fire. Gen. Tech. Rep. NC-83.
St. Paul, MN: U.S. Department of Agriculture, Forest
Service, North Central Forest Experiment Station. 36 p.
Smith, M.C.; Haines, D.A.; Main, W.A. 1986. Some
characteristics of longitudinal vortices produced by linesource heating in a low-speed wind tunnel. International
Journal of Heat Mass Transfer. 29: 59–68.
Snegirev, A.Y.; Marsden, J.A.; Francis, J.; Makhviladze,
G.M. 2004. Numerical studies and experimental
observations of whirling flames. International Journal of
Heat and Mass Transfer. 47: 2523–2539.
104
Synthesis of Knowledge of Extreme Fire Behavior: Volume I for Fire Managers
Soma, S.; Saito, K. 1988. A study of fire whirl on mass
fires using scaling models. In: Proceedings of the first
international symposium on scale modeling. Tokyo: The
Japan Society of Mechanical Engineers: 353.
Soma, S.; Saito, K. 1991. Reconstruction of fire whirls
using scale models. Combustion and Flame. 86: 269–284.
Tsang, G. 1970. Laboratory study of two-dimensional
starting plumes. Atmospheric Environment. 4: 519–544.
Tsang, G. 1971. Laboratory study of line thermals.
Atmospheric Environment. 5: 445–471.
U.S. Department of the Interior, Bureau of Land
Management [BLM]. 2001. Preliminary 72 hour
briefing on Fish Fire deployment investigation. http://
www.wildfirelessons.net/documents/2001_Fish_Crk_72_
hr.pdf. (March 23, 2010).
U.S. Department of the Interior, Bureau of Land
Management [BLM]. 2006. New York Peak Fire
burnover, factual report. http://www.wildfirelessons.net/
documents/new_york_peak_factual_report_2006.pdf.
(March 23, 2010).
Wade, D.D.; Ward, D.E. 1973. Analysis of the Air Force
Trelles, J.; McGrattan, K.B.; Baum, H.R. 1999. Smoke
transport by sheared winds. Combustion Theory and
Modeling. 3: 323–341.
Bomb Range Fire. Res. Pap. SE-105. Asheville, NC: U.S.
Department of Agriculture, Forest Service, Southeastern
Forest Experiment Station. 38 p.
Turner, J.S. 1960. A comparison between buoyant vortex
rings and vortex pairs. Journal of Fluid Mechanics.
7: 419–433.
Umscheid, M.; Monteverdi, J.; Davies, J. 2006.
Photographs and analysis of an unusually large and longlived firewhirl. Severe Storms Meteorology. 1: 1–13.
105
Zhang, X.; Ghoniem, A.F. 1993. A computational model
for the rise and dispersion of wind-blown, buoyancydriven plumes. I. Neutrally stratified atmosphere.
Atmospheric Environment. 15: 2295–2311.
Zhou, R.; Wu, Z.N. 2007. Fire whirls due to surrounding
flame sources and the influence of the rotation speed on
flame height. Journal of Fluid Mechanics. 583: 313–345.
GENERAL TECHNICAL REPORT PNW-GTR-841
This page was intentionally left blank.
ii
Synthesis of Knowledge of Extreme Fire Behavior: Volume I for Fire Managers
Chapter 8: Crown Fire Dynamics in Conifer Forests
Martin E. Alexander and Miguel G. Cruz1
As for big fires in the early history of the Forest Service,
a young ranger made himself famous by answering the
big question on an exam, “What would you do to control
a crown fire?” with the one-liner, “Get out of the way and
pray like hell for rain.”—Norman Maclean (1992)
wind (fig. 8-1 A) or downslope. A crown fire is dependent
on a surface fire for both its initial emergence and continued
existence. Thus, a crown fire advances through both the
surface and tree canopy fuel layers with the surface and
crown fire phases more or less linked together as a unit (fig.
8-1 B and C). The term “crowning,” therefore, refers to both
the ascension into the crowns of trees and the spread from
crown to crown.
From the perspective of containing or controlling
wildfires or unplanned ignitions, the development and
subsequent movement of a crown fire represents a highly
significant event as a result of the sudden escalation in
the rate of advance and the dramatic increase in flame
size and thermal radiation as well as convective activity,
including fire-induced vortices and, in turn, both short- to
long-range spotting potential. As a consequence, crown
Introduction
Three broad types of fire are commonly recognized in
conifer-dominated forests on the basis of the fuel layer(s)
through which they are spreading:
• Ground or subsurface fire
• Surface fire
• Crown fire
Ground or subsurface fires spread very slowly and with no
visible flame. Heading surface fires can spread with the
wind or upslope, and backing surface fires burn into the
fires are dangerous for firefighters to try to control directly
by conventional means. Suppression actions and options
1
Martin E. Alexander, Department of Renewable Resources and
Alberta School of Forest Science and Management, University of
Albert, Edmonton, Alberta, Canada. Miguel G. Cruz, Bush Fire
Dynamics and Applications, CSIRO Ecosystems Sciences–Climate
Adaptation Flagship, Canberra, ACT 2601, Australia.
Figure 8-1—Variations in fire behavior within the jack pine/black spruce fuel complex found at the International Crown
Fire Modeling Experiment study area near Fort Providence, Northwest Territories, Canada: (A) surface fire, (B) passive
crown fire, and (C) active crown fire. For additional photography carried out on experimental basis, see Alexander and De
Groot (1988), Alexander and Lanoville (1989), Stocks and Hartley (1995), and Hirsch et al. (2000).
107
GENERAL TECHNICAL REPORT PNW-GTR-854
Figure 8-2—Cross section of a stylized, wind-driven surface head
fire spreading behind a conifer forest canopy on level terrain.
Figure 8-3—Type of fire classification scheme based on Van
Wagner’s (1977a) theories regarding the start and spread of crown
fires in conifer forests.
at the head of the fire tend to be severely restricted until
there is a major change in the prevailing fuel, weather, or
topographic conditions (e.g., a drop in windspeed, a major
fuel discontinuity). As a result, crown fires are capable of
burning large tracts of forested landscape, thereby posing a
threat to public safety and properties, potentially adversely
impacting other values-at-risk, and increasing suppression
expenditures.
Prolific crowning is an element or characteristic of
extreme fire behavior in conifer-dominated forest cover
types. This chapter constitutes a state-of-knowledge summary prepared for operational fire management personnel
in the United States concerning our current understanding
of the characteristics and prediction of crown fire behavior in such fuel complexes. Information on crown fire
phenomenology is drawn upon from a number of sources,
including relevant observations and data from Canada and
Australia. The dynamics of crown fires in tall brush fields
(e.g., chaparral) and other forest types (e.g., eucalypt) will
not specifically be dealt with here. For present purposes, it
is assumed that there is a distinct separation between the
canopy fuel layer and the ground and surface fuels by an
open trunk space in which ladder or bridge fuels may be
present (fig. 8-2). Certain aspects of crown fire behavior are
not addressed here but can be found in other chapters of this
synthesis document (e.g., horizontal roll vortices, plume- or
convection-dominated crown fires, influences of atmospheric conditions aloft, fire-atmosphere interactions).
Types of Crown Fires
Van Wagner (1977a) proposed that crown fires in conifer
forests could be classified according to their degree of
dependence on the surface fire phase and the criteria could
be described by several semi-mathematical statements
(fig. 8-3). He recognized three types of crown fires (box 1).
According to Van Wagner (1977a), the type of crown fire to
be expected in a conifer forest on any given day depends on
three simple properties of the canopy fuel layer (box 2) and
two basic fire behavior characteristics:
• Initial surface fire intensity
• Foliar moisture content
• Canopy base height
• Canopy bulk density
• Rate of fire spread after the onset of crown
combustion
108
Synthesis of Knowledge of Extreme Fire Behavior: Volume I for Fire Managers
Box 1:
Box 1: continued
Crown Fire Classification
considered necessary for crowning
(e.g., tall or open-forest stand types),
so that even under severe burning
conditions (i.e., critically dry fuels and
strong surface winds), active crown
fire spread is not possible, although
vigorous, high-intensity fire behavior
can occur.
For the longest time, only two kinds of
crown fire were generally recognized,
namely “dependent” and “running”
(Brown and Davis 1973). Van Wagner
(1977a) recognized three classes or
types of crown fires:
Passive Crown Fire
Passive or dependent crown fires can
involve a portion or all of the canopy
fuel layer in combustion, but the overall rate of spread is largely determined
by the surface phase. Passive crown
fires cover a range in fire behavior
from moderately vigorous surface
fires with frequent crown ignition
occurring behind the surface flame
front up to high-intensity surface
fires spreading with an almost solid
flame front occupying the canopy and
subcanopy or trunk space that have
nearly achieved the critical minimum
spread rate for active crowning. Passive crown fires can occur under two
broad situations. First, the canopy
base height and canopy bulk density
are considered optimum, but fuel
moisture and wind conditions are not
quite severe enough to induce fullfledged crowning (fig. 8-1 B). Second,
the canopy base height and canopy
bulk density are, respectively, above
and below the thresholds generally
Active Crown Fire
Active or running crown fires are
characterized by the steady advancement of a tall and deep coherent flame
front extending from the ground
surface to above the top of the canopy
fuel layer (fig. 8-1 C). The surface
and crown phases are intimately
linked, but fire propagation is largely
determined by the crown phase. The
spread of active crown fires requires
(1) relatively dry and plentiful surface
fuels that allow for the development
of a substantial surface fire (2) low to
moderately high canopy base height,
and (3) a fairly continuous crown layer
of moderate to high canopy bulk den3
sity (>0.1 kg/m ) and low to normal
foliar moisture content.
Independent Crown Fire
An independent crown fire no longer
depends in any way on the surface
phase, spreading ahead of the surface
phase in the crown fuel layer entirely
109
GENERAL TECHNICAL REPORT PNW-GTR-854
Box 1: continued
Box 1: continued
on its own. Stand conditions favoring an independent crown fire are
a continuous crown layer of low to
moderate canopy bulk density and an
abnormally low foliar moisture content. For a truly independent crown fire
to develop on flat topography would
require very strong, sustained winds.
In mountainous terrain, slope steepness would no doubt compensate for a
lesser velocity.
The vast majority of crowning
forest fires spread either as passive
or active crown fires, each controlled
by a different set of processes. Van
Wagner (1993) acknowledged that the
concept of a truly independent crown
fire as a stable phenomenon on level
terrain is dubious but that it “may still
have value in rough or steep terrain
and as a short-term fluctuation under
the most extreme conditions.” Indeed,
there are reports of the flames in the
crown extending 50 to 150 m ahead
of the surface burning in momentary
bursts and of crown fires spreading up
steep, partially snow-covered slopes
in the spring (Mottus and Pengelly
2004). These incidents might possibly
give the appearance of being evidence
for independent crown fires. However,
there is no steady-state propagation
as seen with passive and active crown
fires.
It is worthwhile noting that the
concept of passive crowning implies
an element of forward movement or
propagation of the flame front. The
incidental ignition of an isolated tree
or clump of trees, with the flames
spreading vertically from the ground
surface through the crown(s) without
any form of forward spread following,
does not constitute passive crowning.
Flame defoliation of conifer trees by
what amounts to stationary torching
or “crowning out,” especially common
during the postfrontal combustion
stage following passage of the surface
fire, generally does not generate any
kind of horizontal spread.
Scott and Reinhardt (2001) claimed
that the possibility exists for a stand
to support an active crown fire that
would otherwise not initiate a crown
fire. They referred to this situation as
a “conditional surface fire.” Later on
Scott (2006) termed this a “conditional
crown fire.” To our knowledge, no
empirical proof has been produced to
date to substantiate the possible existence of such a situation, at least as a
steady-state phenomenon.
110
Synthesis of Knowledge of Extreme Fire Behavior: Volume I for Fire Managers
The first three quantities determine whether a surface
fire will ignite coniferous foliage. The last two determine
whether or not a continuous flame front can be sustained
in the canopy fuel layer. The initial surface fire intensity
and rate of fire spread after the onset of crown combustion
would, in turn, include the effects of windspeed, slope
steepness, fuel dryness, air temperature, relative humidity,
and fuel complex characteristics. Examples of how canopy
base height and canopy bulk density CBD vary with tree
and stand characteristics is presented here for ponderosa
pine in figures 8-4 and 8-5.
Albini and Stocks (1986) considered the factors
included in Wagner’s (1977a) proposed criteria for the start
and spread of a crown fire as “heuristically valid.” Subsequent experience and analysis has shown both the strengths
and limitations of his approach (Cruz et al. 2003c, 2004,
2006a).
Crown Fire Initiation
Figure 8-4—Canopy base height for ponderosa pine stands as a
function of average stand height and basal area according to Cruz
et al. (2003a). The regression equation used to produce this graph
is not valid for tree heights of less than 1.0 m.
For a crown fire to start, an intense surface fire is generally
required. The questions then become: How do we define fire
Figure 8-5—Canopy bulk density (A) and canopy fuel load (B) for ponderosa pine stands as a function of stand density and basal area
according to Cruz et al. (2003a).
111
GENERAL TECHNICAL REPORT PNW-GTR-854
Box 2:
Box 2: continued
Canopy Fuel Characteristics in
Van Wagner’s (1977a) Crown Fire
Initiation and Propagation Models
Canopy Base Height
Canopy base height (CBH) represents
the mean height from the ground surface to the lower live crown base of the
conifer trees in a forest stand (fig. 8-2).
Canopy base height is dependent on the
mean tree height and live stem density
(fig. 8-4). Ladder or bridge fuels (e.g.,
loose bark and dead bole branches on
tree boles, lichens, shrubs, and small
conifers) in the space between the
ground surface and the canopy “must
presumably be present in sufficient
quantity to intensify the surface fire
appreciably as well as to extend the
flame height” (Van Wagner 1977a).
Unfortunately, our ability to assess ladder or bridge fuel effects on crown fire
initiation remains qualitative (Menning
and Stephens 2007).
represents the quantity of crown fuel
typically consumed in a crown fire,
principally needle foliage. Both the
CBD and CFL are, in turn, functions
of stand structure characteristics (fig.
8-5).
Foliar Moisture Content
Foliar moisture content (FMC) represents a weighted average or composite
moisture content for the various needle
ages found within the canopy fuel layer.
Needles decrease in moisture content
with age following their initial flushing
(Keyes 2006).
Some researchers such as Scott and
Reinhardt (2001) have applied different
criteria to the CBH, CFL, and CBD
inputs in their use of Van Wagner’s
(1977a) models (Cruz and Alexander
2010, in press). However, strictly speaking, such ad hoc adjustments or modifications are not compatible with the
use of these models. Still others have
in some cases recommended or applied
potentially unrealistically low values
of FMC (Cruz and Alexander 2010).
Varner and Keyes (2009) have outlined
other faulty assumptions and common errors regarding modeling inputs
involved in simulating fire behavior
potential.
Canopy Bulk Density
Canopy bulk density (CBD) represents
the amount of available crown fuel
within a unit volume of the canopy.
Canopy bulk density is computed by
dividing the canopy fuel load (CFL)
by the canopy depth (fig. 8-2), which
represents the average tree height of
the stand minus the CBH. The CFL
112
Synthesis of Knowledge of Extreme Fire Behavior: Volume I for Fire Managers
Figure 8-7—Critical surface fire intensity for crown combustion in
a conifer forest stand as a function of canopy base height and foliar
moisture content according to Van Wagner (1977a).
Figure 8-6—Head fire rate of spread and fuel consumed in relation
to the type of fire and six distinct levels of Byram’s (1959a) fireline
intensity, assuming a net heat of combustion of 18 000 kJ/kg.
intensity? and How intense is intense enough with respect
to the convective and radiative energy transferred upward
to the canopy fuels necessary to initiate crowning? The
distance the canopy fuel layer (fig. 8-4) is from the heat
source at the ground surface will dictate how much energy
is dissipated before reaching the fuels at the base of the
canopy. Furthermore, if the moisture content of the canopy
fuels is high, greater amounts of energy are required to raise
the tree foliage to ignition temperature.
Byram (1959a) defined fireline intensity (I, kW/m) as
the rate of heat released from a linear segment of the fire
perimeter as calculated by the following equation:
I=H×w×r
(1)
where H is regarded as the net low heat of combustion (kJ/
kg), w is amount of fuel consumed in the active flaming
113
2
front (kg/m ), and r is the rate of fire spread (m/s) (Alexander 1982). If we assume H = 18 000 kJ/kg, then the equation
for calculating fireline intensity can also be expressed as
follows:
I = 300 × w × ROS
(2)
where ROS is the rate of fire spread given in m/min. A
graphical representation of this relation is presented in
figure 8-6. Wendel et al. (1962) concluded that the probability of blowup fires decreased rapidly when available fuel
loads were less than 1.35 kg/m 2.
Using physical reasoning and empirical observation,
Van Wagner (1977a) proposed that vertical fire spread
could occur in a conifer forest stand when the surface fire
intensity (SFI) attains or exceeds a certain critical surface
intensity for combustion (SFIcritical, kW/m) as dictated by
the foliar moisture content (FMC, %) and the canopy base
height (CBH, m) according to the following equation which
is graphically presented in figure 8-7:
SFIcritical = (0.01 × CBH × (460 + 25.9 × FMC))1.5
(3)
GENERAL TECHNICAL REPORT PNW-GTR-854
Table 8-1—Fire suppression interpretations of flame length and fireline intensity
Flame
Fireline
lengtha
intensity
Meters
kW/m
<1.2
<346
Fire suppression interpretations
Fire can generally be attacked at the head or flanks by persons using hand tools. Handline should hold the fire.
1.2 to 2.4 346 to 1730
Fires are too intense for direct attack on the head by persons using hand tools. Handline can not be relied on to hold fire. Equipment such as plows, dozers, pumpers, and retardant aircraft can be effective.
2.4 to 3.4 1730 to 3459
Fires may present serious control problems: torching out, crowning, and spotting. Control efforts at the fire head will probably be ineffective.
>3.4
>3459
Crowning, spotting, and major fire runs are probable. Control efforts at head of fire are
ineffective.
a
Based on Byram’s (1959a) flame length (L, m)-fireline intensity (I, kW/m) relation: L =
0.0775 × (I)0.46.
Adapted from Burgan 1979.
Thus, according to Van Wagner’s (1977a) theory of
crown fire initiation, if SFI > SFIcritical, some form of
crowning is presumed to be possible, but if SFI < SFIcritical,
a surface fire is expected to prevail (fig. 8-3). In applying
this criterion, it is assumed that a conifer forest stand possesses a minimum CBD that will allow flames to propagate
vertically through the canopy fuel layer.
One of the appealing aspects of eq. (3) is its simplicity,
but with this comes a major underlying assumption. According to Van Wagner (1977a), the 0.01 value given in eq. (3) is
an empirical constant of “complex dimensions.” He derived
this value from an outdoor experimental fire in a red pine
plantation stand (see “Common and Scientific Names”
section) with CBH of 6.0 m and a FMC of 100 percent and
the SFI was about 2500 kW/m just prior to crowning (Van
Wagner 1968). This widely used relation represented by eq.
(3) therefore incorporates a fixed set of burning conditions,
fuel characteristics, and surface fire behavior (e.g., in-stand
wind, ladder fuels, fuel consumed, flame depth, and
spread rate). Subsequent research has shown this empirical
constant to be a variable quantity dependent on these factors
(Alexander 1998, Cruz et al. 2006a).
From figure 8-7, it should be clear that the higher the
CBH and/or FMC, the more intense a surface fire must
Figure 8-8—Critical minimum spread rate for active crowning in a
conifer forest stand as a function of canopy bulk density according
to Van Wagner (1977a).
be to cause crowning. It is worth noting that the flames
of a surface fire don’t necessarily have to reach or extend
into the lower tree crowns to initiate crowning (Alexander
1988). The experimental fire used by Van Wagner (1977a) to
114
Synthesis of Knowledge of Extreme Fire Behavior: Volume I for Fire Managers
parameterize his crown fire initiation model represented by
eq. (3) would, for example, have had a flame length of 2.6 m
according to Byram’s (1959a) formula linking flame length
to fireline intensity (table 8-1).
Crown Fire Propagation
Assuming a surface fire is of sufficient intensity to initiate
and sustain crown combustion from below, the question
now becomes, Can a solid flame front develop and maintain
itself within the canopy fuel layer in order for horizontal
crown fire spread to occur? Van Wagner (1977a) theorized
that a minimum flow of fuel into the flaming zone of a
crown fire is required for combustion of the canopy fuel
layer to continue. In this conceptual formulation, the flame
front is viewed as stationary with the fuel moving into it.
Van Wagner (1977a) proposed that a critical minimum
spread rate needed to preserve continuous crowning (ROScritical, m/min) could be estimated on the basis of the stand’s
canopy bulk density (CBD, kg/m3) using the following
simplistic equation:
ROScritical = 3.0 ÷ CBD
(4)
According to eq. (4), ROScritical increases as the CBD
decreases (fig. 8-8). High CBD levels are associated with
dense stands and low values with open stands (fig. 8-5).
Active crowning is presumably not possible if a fire does
not spread rapidly enough following initial crown combustion. Albini (1993) viewed this criterion for active crowning as a “lean flammability limit.” Thus, if a fire’s actual
ROS after the initial onset of crowning, which is in turn a
function largely of the prevailing windspeed or slope, is less
than ROScritical, a passive crown fire is expected to occur
(fig. 8-3).
The 3.0 empirical constant given in eq. (4) was derived
largely on the basis of a single experimental crown fire in
a red pine plantation stand exhibiting a CBD of 0.23 kg/
m3 (Van Wagner 1964). However, the robustness of this
value has since been confirmed on the basis of an analysis
of a relatively large data set of experimental crown fires
in several different conifer forest fuel complexes (Cruz
et al. 2005) and a detailed wildfire behavior case study
115
(Alexander 1998). These analyses also support Agee’s
(1996) assertion that a CBD of about 0.1 kg/m3 constitutes
a significant threshold for active crown fires. Furthermore,
it appears from the function represented by eq. (4) and the
available empirical evidence (fig. 8-8), that active crown
fires are unlikely to occur at CBD levels below about 0.05
kg/m3, although this is not to suggest that a very vigorous,
high-intensity passive crowning is not possible.
Crown Fire Rate of Spread
Surface fires spreading beneath conifer forest canopies
seldom exceed 5 to 10 m/min without the onset of crowning
in some form or another (fig. 8-6). The exceptions would
involve open stands with a low CBD (say less than 0.05
3
kg/m ) or closed-canopied stands exhibiting a very high
canopy base height (perhaps 12 to 15 m or greater), in which
case, spread rates might reach as high as 25 m/min with
associated fireline intensities of 10 000 kW/m.
General observations of wildfires and documentation of
experimental crown fires indicate that a rather abrupt transition between surface and crown fire spread regimes is far
more commonplace than a gradual transition (Van Wagner
1964). With the onset of crowning, at a minimum, a fire
typically doubles or even triples its spread rate in comparison to its previous state on the ground surface (McArthur
1965). This sudden jump in the fire’s rate of spread occurs
as a result of (i) the enhanced radiant heating owing to the
taller and deeper flame fronts, (ii) the fact that the windspeeds just above the tree canopy are two and one-half to
six times that of the winds experienced near ground level
inside the stand, (iii) increased efficiency of heat transfer
into a tall and porous fuel layer, and (iv) an increase in spotting density and distance just beyond the fire’s leading edge.
Once crowning has commenced, a fire’s forward rate
of spread on level terrain is influenced largely by wind
velocity and to a lesser extent by physical fuel properties
and dryness. Continuous crowning generally takes place
at spread rates between about 15 and 45 m/min. Crowning
wildfires have been known to make major runs of 30 to
65 km over flat and rolling to gently undulating ground
GENERAL TECHNICAL REPORT PNW-GTR-854
during a single burning period or over multiple days, as so
vividly demonstrated, for example, on the Rodeo-Chediski
Fire in northern Arizona in June 2002 (Paxton 2007). A
wildfire crowning through sand pine forests in north-central
Florida on March 12, 1935, travelled nearly 32 km in about
6 hours with intervening spread rates of 135 to 150 m/min
(Folweiler 1937). During the major run of the Mack Lake
Fire in Michigan that occurred on May 5, 1980, the crown
fire rate of spread in jack pine forests peaked at nearly 190
m/min during a 15-min interval (Simard et al. 1983). Grass
fires have been reported to spread at twice these rates on
level ground and are thus capable of spreading the same
distance as crowning forest fires in half the time (Cheney
and Sullivan 2008).
In some conifer forest fuel types exhibiting discontinuous or very low quantities of surface fuels, surface fire
spread is nearly nonexistent, even under moderately strong
winds. However, once a certain windspeed threshold is
reached with respect to a given level of fuel dryness, a
dramatic change to crown fire spread suddenly occurs.
This type of fire behavior has been observed in pinyonjuniper woodlands of the Western United States (Bruner
and Klebenow 1979) and in the sand pine forests of Florida
(Hough 1973), for example. The same phenomenon has been
observed in certain grassland and shrubland fuel complexes
(Cheney and Sullivan 2008, Lindenmuth and Davis 1973).
Slope dramatically increases the rate of spread and
intensity of wildland fires by exposing the fuel ahead of
the advancing flame front to additional convective and
radiant heat. Fires advancing upslope are thus capable of
making exceedingly fast runs compared to level topography.
For example, one would expect a crown fire burning on a
35-percent slope to spread about 2.5 times as fast as one
on level terrain for the same fuel and weather fuel conditions (Van Wagner 1977b). As slope steepness increases,
the flames tend to lean more and more toward the slope
surface, gradually becoming attached, the result being a
sheet of flame moving roughly parallel to the slope. Rothermel (1985) has stated that although there is no definitive
research on the subject of flame attachment, “it appears
from lab work and discussions with users that the flames
become attached near 50 percent slope with no prevailing
wind.” The critical value will actually differ depending on
the prevailing wind strength (Cheney and Sullivan 2008)
as well as on the fuel type characteristics. The time-lapse
photography taken of the rapid upslope runs on the 1979
Ship Island Fire in central Idaho as shown in the video Look
Up, Look Down, Look Around (National Wildfire Coordinating Group 1993) constitutes a good example of such fire
behavior.
With the exception of very long slopes such as found,
for example, in the Salmon River country of central Idaho,
the rate of advance of wind-driven crown fires in mountainous terrain tends, over the duration of their run, to be well
below what would be expected on flat ground, even under
critical fire weather conditions. This is a result of the degree
of terrain exposure to the prevailing winds, which limits
the full effectiveness of windspeed on fire spread, as well as
differences in fuel moisture owing to aspect (Schroeder and
Buck 1970). However, when the advancing crown fire front
encounters a situation where wind and topography result
in a favourable alignment, spread rates of ~100 m/min are
quite easily possible for a brief period over short distances
with only moderately strong winds (e.g., Rothermel and
Mutch 1986). Fire spread rates in grassland and shrubland
fuel types at even twice this level can easily occur (Butler et
al. 1998, Rothermel 1993).
It is worth highlighting the fact that crown fire runs in
mountainous terrain are not limited to just upslope situations. Cases of crown fires burning downslope or crossslope under the influence of strong winds have occurred in
the past (Byram 1954, McAlpine et al. 1991). The major run
of the Dude Fire in northern Arizona on June 26, 1990, that
led to the deaths of six firefighters involved downslope and
cross-slope spread as a result of the strong downdraft winds
caused by the fire’s collapsing convection column (Goens
and Andrews 1998).
Crown Fire Intensity and Flame Zone
Characteristics
When a conifer forest stand crowns, additional fuel is
consumed primarily in the form of needle foliage but also
116
Synthesis of Knowledge of Extreme Fire Behavior: Volume I for Fire Managers
mosses and lichens, bark flakes, and small woody twigs.
The additional fuel consumed by a crown fire owing to the
canopy fuel involvement generally amounts to 0.5 to 2.0
kg/m2 depending on stand characteristics (i.e., an increase
in fuel consumption with respect to fireline intensity of
one-quarter to a doubling in the amount). Combined with
the increase in rate of fire spread after crowning, fireline
intensities can easily quadruple in value within a few
seconds (e.g., from 3000 kW/m to 12 000 kW/m). In such
cases, is there any wonder why some fires seem to literally
“blow up”?
A fire’s flame zone characteristics (i.e., depth, angle,
height, and length) are a reflection of its heat or energy
release rate. As the fireline intensity or rate of energy
released per unit area of the flame front increases because
of a faster rate of spread and a larger quantity of fuel being
volatilized in the flaming front, flame size or volume
increases. Fireline intensities of wind-driven crown fires
can exceed 100 000 kW/m for significant periods (Anderson
1968, Kiil and Grigel 1969).
The flame depth (D, m) of a spreading wildland fire (fig.
8-2) is a product of its ROS and the flame front residence
time (t r, min) which represents the duration that a moving
band or zone of continuous flaming combustion persists at
or resides over a given location:
D = ROS × tr
(5)
Residence times are dictated largely by the particle
size(s) distribution, load, and compactness of the fuelbed.
Residence times for conifer forest fuel types at the ground
surface are commonly 30 sec to 1 min compared to 5 to
10 sec in fully cured grass fuels. Assuming t r = 0.75 min
(i.e., 45 sec), a surface fire in a conifer forest spreading at
4.0 m/min would thus have flame depth of around 3.0 m
according to eq. (5). Crown fires are capable of producing
very deep flame fronts. The depth of the burning zone in the
surface fuels of a crown fire spreading at 60 m/min would,
for example, be around 45 m. The flame depth of a grass
fire advancing at this rate would in contrast be only about a
tenth of this value. Residence times within the canopy fuel
layer of a crown fire are approximately one-half to one-third
117
those experienced at ground level (Anderson 1968, Taylor
et al. 2004). This is reflected in the gradual convergence of
the flaming zone depth with height ending in the flame tip
above the tree crowns.
The flame front of a crown fire on level ground appears
to be roughly vertical or nearly so. This appearance has
led to the popular phase “wall of flame” when it comes
to describing crown fire behavior. Typically though, tilt
angles are 5 to 20 degrees from the vertical. The fact that
the flames of a crown fire stand so erect is a direct result of
the powerful buoyancy associated with the large amount
of energy released in the flame front (fig. 8-1 C). Radiation
from the crown fire wall of flame can produce painful burns
on exposed skin at more than 100 m from the fire edge
(Albini 1984).
Given the difficulty of gauging the horizontal depth of
the burning zone in a crown fire, flame height constitutes
a more easily visualized dimension than flame length.
However, efforts to objectively estimate flame heights of
crown fires is complicated by the fact that sudden ignition
of unburned gases in the convection column can result in
flame flashes that momentarily extend some 100 m or more
into the convection column aloft; one such flame flash was
photographically documented that extended almost 200
m above the ground (Sutton 1984). Such flashes can easily
result in overestimates of average flame heights, which usually range from about 15 to 45 m on high-intensity crown
fires (Byram 1959b). Average flame heights of crown fires
are thus generally regarded as being about two (fig. 8-1 C)
to three times the stand height.
Crown Fire Area and Perimeter Growth
For forest fires of today to become large, they typically have
to involve some degree of crowning. A common axiom is
that 95 percent of area burned is generally caused by less
than 5 percent of the fires. When a forest fire at the very
minimum doubles its spread rate after the onset of crowning, the area burned for a given period will be at least four
times what would have been covered by a surface fire. In
other words, the area burned is proportional to the rate of
GENERAL TECHNICAL REPORT PNW-GTR-854
Figure 8-9—Schematic diagram of a simple elliptical fire growth
model (after Van Wagner 1969). The point of ignition is at the
junction of the four area growth zones.
spread increase (following the transition to crowning) to
a power of 2.0 (McArthur 1965). Thus, if a fire triples its
rate of advance after crowning, the area burned will be
nine times the size it would have been had it remained as a
surface fire (i.e., 3.02 = 9).
Other than dry and plentiful fuels, the principal
ingredients for major crown fire runs are strong, sustained
winds coupled with extended horizontal fuel continuity.
The Hayman Fire that occurred along the Colorado Front
Range, for example, burned close to 25 000 ha during its
major run on June 9, 2002, and eventually grew to nearly
56 000 ha towards the end of the month (Graham 2003).
Under favourable conditions, crown fires on level to gently
undulating terrain have been documented to cover in excess
of 70 000 ha in a single, 10-hour burning period (Kiil and
Grigel 1969) and up to a third that much in mountainous
areas (Anderson 1968).
Assuming continuous fuels, including no major barriers
to fire spread, and no change in wind and fuel moisture
conditions, the forward spread distance of a crown fire can
Figure 8-10—Length-to-breadth ratio of elliptical-shaped fires on
level terrain as a function of windspeed, as used in the Canadian
Forest Fire Behavior Prediction System (Forestry Canada Fire
Danger Group 1992) and in Rothermel’s (1991) guide to crown
fire behavior in relation to experimental fire and wildfire observations given in Alexander (1985) and Forestry Canada Fire Danger
Group (1992). The Beaufort scale for estimating 6.1-m open
windspeeds is presented in table 8-4.
be determined by multiplying its predicted rate of spread
by a projected elapsed time. Provided the wind direction
remains relatively constant and the fire environment is
otherwise uniform, wind-driven surface and crown fires
typically assume a roughly elliptical shape (Alexander 1985,
Anderson 1983, Van Wagner 1969) defined by its length-tobreadth ratio (L:B) (fig. 8-9), which in turn is a function of
windspeed (fig. 8-10). The L:B associated with crown fires
generally ranges from a little less than 2.0 to a maximum
of approximately 8.0 in exceptional cases (Folweiler 1937).
Simple estimates of potential crown fire size in terms of
area burned and perimeter length can be made on the basis
of the forward spread distance and L:B (fig. 8-11).
This simplistic picture of fire growth as described
here is applicable to cases involving a point source ignition
(e.g., an escaped campfire or lightning fire start) or perhaps
118
Synthesis of Knowledge of Extreme Fire Behavior: Volume I for Fire Managers
Figure 8-11—Area burned (A) and perimeter length (B) of an elliptical-shaped crown fire as a function of forward spread distance and
windspeed on level terrain. The Beaufort scale for estimating 6.1-m open windspeeds is presented in table 8-4.
a breach in an established control line, involving unidirectional winds and is generally limited to a 1- to 8-hour
projection period. This approach is thus not appropriate to
estimating crown fire growth when the perimeter becomes
highly irregular in shape with the passage of time as a
result of changes in wind direction, fuel types, and terrain
characteristics (e.g., Rothermel et al. 1994).
One particularly dangerous synoptic fire weather situation worth highlighting with respect to crown fire behavior
is the case of the dry cold frontal passage (Schroeder and
Buck 1970). In the Northern Hemisphere, winds ahead
of an approaching dry cold front generally shift from the
southeast to south, and finally to the southwest. As the cold
front passes over an area, winds shift rapidly to the west,
then northwest. Windspeeds increase in strength as a front
approaches, and usually become quite strong and gusty
when the front passes over an area. This can result in a long
crown fire run in a north-northeast direction followed by a
119
fire’s entire right flank crowning in an east-southeast direction at an even greater rate of spread and intensity (DeCoste
et al. 1968, Simard et al. 1983, Wade and Ward 1973).
Crown Fire Spotting Activity
Spotting or mass ember transport can be an important
mechanism determining a crown fire’s overall rate of spread
under certain conditions. Its general effect on crown fire
rate of spread is determined by the density of ignitions and
distances these ignitions occur ahead of the main fire. These
two characteristics are intimately linked, with density
typically decreasing with distance from the main advancing
flame front.
The effect of spotting on the overall spread and growth
of a wildland fire is dependent on topography and fuel
distribution. In certain fuel types, the propagation of active
crown fires is linked to high-density, short-range spot fires
occurring up to 50 m or so ahead of the main advancing
flame front followed by their subsequent coalescence.
GENERAL TECHNICAL REPORT PNW-GTR-854
Figure 8-12—Minimum separation distance required for a newly
ignited spot fire to avoid being overrun by the main flame front
of an advancing crown fire as a function of rate of spread and
ignition delay (adapted from Alexander and Cruz 2006). Ignition
delay represents the elapsed time between a firebrand alighting,
subsequent ignition, and the onset of fire spread.
Under such conditions, the overall fire spread is dictated by
spotting as well as radiative and convective heat transfer
mechanisms associated with the crowning phase (Taylor et
al. 2004). In situations involving heterogeneous fuel type
distributions and complex topography, spotting will allow
the main advancing fire front to quickly bypass areas with
low spread potential (e.g., downslope runs, pure hardwood
stands in summer, discontinuous fuels) thereby effectively
advancing the horizontal extent of the fire’s “head.” Spotting from crown fires is also effective in breaching major
barriers to fire spread, including large water bodies and
other nonfuel areas (e.g., rock slides, barren ground).
When fire environment conditions are uniform and
winds aloft are favorable, spotting can contribute to the
overall spread and growth of crown fires provided the spot
fires are able to burn independently of the main advancing fire front. In most high-intensity wildfires that involve
crowning, spot fires originating out ahead of the advancing
flame front are typically overrun and thus incorporated into
the larger fire perimeter before they are able to develop and
spread independently, or otherwise be influenced by the
main fire (e.g., in-draft winds). For a crown fire spreading
at a rate of 50 m/min or 3 km/h and burning under homogeneous fuel, weather, and topographic conditions, spotting
distances would, depending on the ignition delay, have to
exceed approximately 500 to 700 m (fig. 8-12) to have the
potential to increase a fire’s overall rate of spread through a
“leapfrog” type of effect. If there are sufficient spot fires at
or just beyond this distance that can rapidly coalesce, this
“mass ignition” effect will temporarily lead to the formation
of pseudo flame fronts with greatly increased flame heights
(Wade and Ward 1973).
Spotting distances of up to about 2 km are commonly
observed on wind-driven crown fires in conifer forests, but
spotting distances close to 5 km have been documented
as well. Spot fire distances of 6 to 10 km were reported to
have occurred in the Northern Rocky Mountains during
the 1910 and 1934 fire seasons. The occurrence of spotting
distances greater than 5 km require a specific combination
of convection column strength and vertical wind profile. For
a viable firebrand to travel such distances, a large amount of
energy needs to be released (associated with the postfrontal
combustion of large fuels) to transport the firebrands at
significant heights. Spotting distances of this magnitude are
likely to be associated with isolated peaks of fire intensity,
such as those occurring in an upslope run, that will inject
large quantities of firebrands in the plume. An atmospheric
profile with very strong winds aloft is also necessary to
considerably tilt the convection column and allow for
significant drift of the firebrand after it leaves the plume.
Under exceptional circumstances, spotting distances greater
than 10 km have been described. Especially noteworthy is
the 16- to 19-km spot fire distances associated with the 1967
Sundance Fire in northern Idaho (Anderson 1968), which
were quite possibly caused by massive fire-induced vortices.
120
Synthesis of Knowledge of Extreme Fire Behavior: Volume I for Fire Managers
Table 8-2–Predicted fine dead fuel moisture content (FDFM)
as a function of ambient air temperature and relative humidity
assuming >50-percent shading between 1200–1600 hours
during May–July
Relative humidity
0 – 9
Percent
0–4
5–9
10–14
15–19
20–24
25–29
30–34
35–39
40–44
45–49
50–54
55–59
60–64
65–69
70–74
75–79
Air temperature
10 – 20 21 – 31 32 – 42
4
5
5
6
7
8
8
9
10
10
10
11
12
12
13
14
Degrees Celsius
4
4
5
4
5
5
6
5
7
6
8
7
8
8
9
8
9
9
10
10
10
10
11
11
11
11
12
11
12
12
13
13
4
4
5
5
6
7
7
8
9
10
10
11
11
11
12
13
>43
4
4
5
5
6
7
7
8
9
10
10
11
11
11
12
13
The FDFM values are used in the Rothermel (1991) crown fire rate of spread model and
in the Cruz et al. (2004, 2005) models for predicting crown fire occurrence and crown
fire rate of spread. Adapted from Rothermel 1983.
Models, Systems, and Other Decision Aids
for Predicting Crown Fire Behavior
Rothermel Guide to Predicting Size and Behavior
of Crown Fires
Rothermel (1972) developed a model for predicting surface
fire rate of spread and intensity that still forms the basis for
the vast majority of guides and computerized decision supports for predicting fire behavior in use today in the United
States. He acknowledged that his model was not applicable
to predicting the behavior of crown fires because the nature
and mechanisms of heat transfer between the two spread
regimes were quite different. In the mid to late 1970s, the
general guidance to gauging whether crowning was possible
or not was to use the predicted surface fireline intensity or
flame length (table 8-1). There was no method at that time
for predicting the spread rate of crown fires, but by the early
1980s, the suggestion was being made to assume that crown
121
fire rate of spread would be two to four times that of the
predicted surface fire rate of spread of Anderson’s (1982)
Fire Behavior Fuel Model 10 (Rothermel 1983).
The 1988 fires in the Great Yellowstone Area are
generally regarded as the impetus for developing a more
robust method of predicting crown fire behavior in conifer
forests (Alexander 2009), although such a general need
had been recognized for many years (e.g., USDA FS 1980).
Rothermel (1991) produced such a guide for the northern
Rocky Mountains or mountainous areas with similar fuels
and climate using currently available information, including
the method of estimating fine dead fuel moisture content
(table 8-2) given in Rothermel (1983). The core component
of his method or approach was a simple correlation derived
from eight wildfire observations of crown fire rate of spread
and the corresponding predictions from his surface fire rate
of spread model (i.e., a 3.34 multiplier as opposed to 2.0 to
GENERAL TECHNICAL REPORT PNW-GTR-854
4.0 as suggested earlier). Rothermel (1991) also included an
adjustment factor (1.7) for estimating the near-maximum
crown fire rate of spread associated with upslope runs or
sudden surges in crown fire activity.
Rothermel (1991) emphasized that his statistical model
for predicting the spread rate of wind-driven crown fires
was a first approximation and that more research was
needed to strengthen the analysis. At the time, he did not
explicitly include any specific criteria for determining the
onset of crowning other than in the most general terms (e.g.,
examine the fire weather forecast).
Rothermel (1991) considered his predictive methods
were not applicable to plume-dominated crown fire. However, he did end up incorporating Byram’s (1959b) ratio
of the power of the fire versus power of the wind concepts
(Nelson 1993) into his guide so as to distinguish the conditions favorable for plume-dominated crown fires as opposed
to wind-driven crown fires. Neither Byram’s (1959b) criteria
nor Rothermel’s (1991) adaptation of Byram’s criteria have
been evaluated for their robustness.
Rothermel’s (1991) guide included a suggested method
of predicting the flame lengths of crown fires. However,
neither his suggestion nor the approach of others seems to
work consistently well based on comparisons against data
from experimental crown fires. Furthermore, his model for
predicting the L:B of crown fires based on windspeed does
not appear to produce realistic results in light of observational evidence (fig. 8-10).
U.S. Fire Modeling Systems
Since the late 1990s, a number of existing and newly
developed decision-support systems have either separately
implemented or linked Rothermel’s (1972, 1991) surface and
crown rate of fire spread models with Van Wagner’s (1977a,
1993) crown fire transition and propagation criteria. These
include:
•
BehavePlus (Andrews et al. 2008)
•
FARSITE (Finney 2004)
•
NEXUS (Scott and Reinhardt 2001)
Figure 8-13—An example of the differences in the critical midflame windspeeds required for the onset of crowning resulting
from the implementation of Van Wagner’s (1977a) crown fire
initiation model in various U.S. fire modeling systems for fuel
models 2 and 10 as described by Anderson (1982) (adapted from
Cruz and Alexander 2010). The following environmental conditions were held constant: slope steepness, 0 percent; fine dead fuel
moisture, 4 percent; 10-h and 100-h time lag dead fuel moisture
contents, 5 and 6 percent, respectively; live woody fuel moisture
content, 75 percent; and live herbaceous fuel moisture content,
75 percent. The associated 6.1-m open winds would be a function
of forest structure and can be approximated by multiplying the
midflame windspeed by a factor ranging between 2.5 (open stand)
and 6.0 (dense stand with high crown ratio) (Albini and Baughman
1979).
•
Fire and Fuels Extension to the Forest Vegetation
Simulator (FFE-FVS) (Reinhardt and Crookston 2003)
•
Fuel Management Analyst (FMA) Plus (Carlton 2005)
FlamMap (Finney 2006)
•
To this list, we can also add two additional geographic
information system-based decision-support systems, namely
ArcFuels (Ager et al. 2011) and the Wildland Fire Decision
Support System (WFDSS) (Pence and Zimmerman 2011).
122
Synthesis of Knowledge of Extreme Fire Behavior: Volume I for Fire Managers
Figure 8-14—Observed head fire rates of spread >1.0 m/min associated with prescribed burning experiments in ponderosa pine forests
of Yosemite National Park, California, versus predictions based
on the Rothermel (1972) surface fire rate of spread model for fuel
model 9-hardwood litter as described by Anderson (1982)
(adapted from van Wagtendonk and Botti 1984). The dashed lines
around the line of perfect agreement indicate the ± 25-percent
error interval. Similar prediction trends were observed in mixedconifer pine, mixed-conifer fir, and true fir forest fuel types.
Figure 8-15–Observed rates of spread of experimental active crown fires and wildfires that exhibited extensive active crowning
versus predictions based on Rothermel’s (1991) crown fire rate of spread model (adapted from Cruz and Alexander 2010). The
dashed lines around the line of perfect agreement indicate the ± 25-percent error interval.
123
GENERAL TECHNICAL REPORT PNW-GTR-854
Figure 8-16–Comparison of the effect of crown fraction burned
(CFB) functions on rate of fire spread developed by Scott and
Reinhardt (2001) and Finney (2004) as used in various U.S. fire
modeling systems (e.g., NEXUS, FFE-FVS, FARSITE, FlamMap)
in relation to the Rothermel (1972, 1991) surface and crown fire
rate of spread models and Van Wagner’s (1977a) criteria for the
critical minimum spread rates for crown fire initiation (ROSinitiation) and active crowning (ROScritical) for the Anderson (1982) Fire
Behavior Fuel Model 2–Timber (grass and understory) with a wind
reduction factor of 0.2 (Albini and Baughman 1979), a canopy bulk
density of 0.1 kg/m3, and canopy base height of 1.5 m (adapted
from Cruz and Alexander 2010). A CFB function is not employed
in BehavePlus. The following environmental conditions were held
constant: slope steepness, 0 percent; fine dead fuel moisture, 6
percent; 10-h and 100-h time lag dead fuel moisture contents, 7 and
8 percent, respectively; live woody fuel moisture content, 75 percent; live herbaceous fuel moisture content, 75 percent; and foliar
moisture content, 140 percent. The dashed portion of the Rothermel
(1991) curve represents output below the original data set bounds
for rate of spread. The Beaufort scale for estimating 6.1-m open
windspeeds is presented in table 8-4.
These modeling systems are extensively used for fire
operations, planning, and research. A recent review of the
use of many of these fire modeling systems in several
simulation studies examining fuel treatment effectiveness,
revealed that many users are unaware of a significant
underprediction bias that exists within these systems
when it comes to assessing potential crown fire behavior
in conifer forests of western North America (Cruz and
Alexander 2010). The principal sources of this underprediction bias have been shown to include (i) incompatible model
linkages (fig. 8-13), (ii) use of surface and crown fire rate
of spread models that have inherent underprediction biases
themselves (figs. 8-14 and 8-15), and (iii) a reduction in
crown fire rate of spread based on the use of unsubstantiated crown fraction burned functions (fig. 8-16). The use
of uncalibrated custom fuel models to represent surface
fuelbeds was also identified as a fourth potential source
of bias (Cruz and Fernandes 2008). The underprediction
tendency was found to occur as well with the crown fire
rate of spread model in the Fuel Characteristic Classification System (Schaaf et al. 2007). The Cruz and Alexander
(2010) review also highlighted some issues with the manner
in which users have been handling certain inputs in their
crown fire modeling (i.e., foliar moisture content, canopy
base height, and canopy bulk density) and in some perceived
shortcomings of the two windspeed-based crown fire hazard
indices developed by Scott and Reinhardt (2001).
Canadian Forest Fire Behavior Prediction System
Do alternative methods exist for predicting crown fire
behavior? The Canadian Forest Fire Behavior Prediction
(FBP) System (Forestry Canada Fire Danger Group 1992,
Taylor et al. 1997, Wotton et al. 2009) constitutes one such
possibility, at least for certain regions of the United States
possessing fuel complexes structurally similar to those
found in adjacent areas of Canada. The FBP System is a
module of the larger Canadian Forest Fire Danger Rating
System (CFFDRS), which also includes the Canadian Forest
Fire Weather Index (FWI) System (Van Wagner 1987).
Some states have adopted all or part of the CFFDRS (e.g.,
Alaska, Minnesota, Michigan).
124
Synthesis of Knowledge of Extreme Fire Behavior: Volume I for Fire Managers
Table 8-3—Type of fire as a function of the Initial Spread Index (ISI) component of the
Canadian Forest Fire Weather Index (FWI) System for the coniferous (C) forest fuel types
found in the Canadian Forest Fire Behavior Prediction System
Fuel type
C-1
C-2
C-3
C-4
C-5
C-6
C-7
Surface
fire
<8
<1
<9
<2
<25
<8
<15
Descriptive name
Spruce-lichen woodland
Boreal spruce
Mature jack or lodgepole pine
Immature jack or lodgepole pine
Red and white pine
Conifer plantation
Ponderosa pine/Douglas-fir
Passive
crown fire
9 to 15
2 to 7
10 to 15
3 to 8
26 to 40
9 to 17
16 to 30
Active
crown fire
>16
>8
>16
>9
>41
>18
>31
The ISI is a relative numerical rating that combines the effects of fine fuel moisture (based on past and current weather
conditions) and windspeed on the expected rate of fire spread. In the above tabulation, level terrain, a foliar moisture
content of 97 percent, and a buildup index (BUI) of 81 to 120 is assumed. The BUI component of the FWI System is a
relative numerical rating of the fuel available for combustion based on fuel dryness as determined by past and current
weather conditions (Van Wagner 1987). In addition, a canopy base height of 7.0 m has been assigned to fuel type C-6.
Adapted from Taylor et al. 1997.
The FBP System provides estimates of head fire
spread rate, fuel consumption, fireline intensity, type of fire
description (table 8-3), and with the aid of an elliptical fire
growth model, it gives estimates of fire area, perimeter, and
perimeter growth rate as well as flank and backfire behavior
characteristics for 16 major fuel types, 11 of which are
subject to crowning (i.e., 7 coniferous and 4 mixed-wood
types). The FBP System includes functions for the acceleration in rate of fire spread for a point source ignition to a
quasi-steady-state equilibrium (McAlpine and Wakimoto
1991), including a prediction of the elapsed time to crown
fire initiation. Emphasis is placed on the influences of fire
weather (i.e., fuel moisture and wind) on potential fire
behavior for a given fuel type and the mechanical effects
of slope steepness. The FBP System forms the basis for
a major component of PROMETHEUS—the Canadian
wildland fire growth simulation model (Tymstra et al. 2010),
which is similar to FARSITE.
The FBP System is similar in many respects to predictive systems currently used in the United States. The
principal difference is in the technical basis. The Rothermel
(1972) surface fire model is based largely on laboratory fires
and physical theory. The FBP System, on the other hand,
is largely empirically based, representing the culmination
of nearly 30 years of outdoor experimental burning work
125
in major Canadian fuel types coupled with monitoring and
documentation of numerous high-intensity wildfires.
Other Empirically Based Approaches
Another possibility in lieu of the Canadian FBP System
is the suite of empirically based models for predicting fire
behavior incorporated into the Crown Fire Initiation and
Spread (CFIS) software system (Alexander et al. 2006).
These models are based largely on a reanalysis of the
experimental fires carried out as part of developing the
Canadian FBP System. The main outputs of CFIS are:
•
Likelihood of crown fire initiation or occurrence based
on two distinct approaches, one of which relies on
the CBH or certain components of the Canadian FWI
System (Cruz et al. 2003b), whereas the other is determined by the fine dead fuel moisture (table 8-2), CBH,
windspeed, and an estimate of surface fuel consumption (Cruz et al. 2004) (fig. 8-17).
•
Type of crown fire (passive crown fire or active crown
•
fire) and its associated rate of spread based on fine dead
fuel moisture, CBD and windspeed (Cruz et al. 2005)
(figs. 8-18 and 8-19).
Minimum spotting distance required to increase a
crown fire’s overall forward rate of spread assuming
a point ignition and subsequent fire acceleration to
GENERAL TECHNICAL REPORT PNW-GTR-854
Table 8-4—Beaufort scale for estimating 6.1-m open windspeeds
Wind
class
Windspeed
range
Description
km/h
1
<5
Very light
2
6 to 11
Light
3
12 to 19
Gentle breeze
4
20 to 29
Moderate breeze
5
30 to 39
Fresh
6
40 to 50
Strong
7
51 to 61
Moderate gale
8
>62
Fresh gale
Observed wind effects
Smoke rises nearly vertically. Leaves of quaking aspen in constant motion;
small branches of bushes sway; slender branchlets and twigs of trees move
gently; tall grasses and weeds sway and bend with wind; wind vane barely
moves.
Trees of pole size in the open sway gently; wind felt distinctly on face; loose
scraps of paper move; wind flutters small flag.
Trees of pole size in the open sway very noticeably; large branches of polesize trees in the open toss; tops of trees in dense stands sway; wind extends small flag; a few crested waves from on lakes.
Trees of pole size in the open sway violently; whole trees in dense stands
sway noticeably; dust is raised in the road.
Branchlets are broken from trees; inconvenience is felt walking against
wind.
Tree damage increases with occasional breaking of exposed tops and
branches; progress impeded when walking against wind; light structural
damage to buildings.
Severe damage to tree tops; very difficult to walk into wind; significant
structural damage occurs.
Surfaced strong Santa Ana; intense stress on all exposed objects, vegetation,
buildings; canopy offers virtually no protection; windflow is systematic in
disturbing everything in its path.
Adapted from Rothermel 1983.
an equilibrium rate of spread based on the presumed
crown fire rate of spread and ignition delay (Alexander
and Cruz 2006) (fig. 8-12).
The primary models incorporated into CFIS have been
evaluated against both outdoor experimental fires and wildfire observations and shown to be reasonably reliable (e.g.,
Alexander and Cruz 2006, Cronan and Jandt 2008, Stocks et
al. 2004). The CFIS does allow one to evaluate the impacts
of proposed fuel treatments on potential crown fire behavior
based on the ability to manipulate three characteristics of a
forest fuel complex (i.e., available surface fuel load, CBH
and CBD) using silvicultural techniques.
The CFIS system is considered most applicable to
free-burning fires that have reached a pseudo steady state,
burning in live, boreal, or near-boreal type conifer forests
found in western and northern North America (i.e., they are
not applicable to insect-killed or otherwise “dead” stands).
Furthermore, the models underlying CFIS are not applicable
to prescribed fire or wildfire situations that involve strong
convection activity as a result of the ignition pattern. Level
terrain is assumed, as the CFIS does not presently consider
the mechanical effects of slope steepness on crown fire
behavior, although this is being planned for in a future
version of the system.
Physically Based Models
Physically based models are formulated on the basis of the
chemistry and physics of combustion and heat transfer processes involved in a wildland fire. They range in complexity
from models for calculating rate of fire spread based solely
on the radiation from the flaming front (e.g., Albini 1996)
to three-dimensional models coupling fire and atmospheric
processes. Examples of the latter include FIRETEC (Linn
et al. 2002), FIRESTAR (Dupuy and Morvan 2005), and
Wildland Fire Dynamics Simulator (WFDS) (Mell et al.
126
Synthesis of Knowledge of Extreme Fire Behavior: Volume I for Fire Managers
Figure 8-17—The likelihood of crown fire occurrence as a function of canopy base height and windspeed for two fine dead fuel
moisture levels, assuming a surface fuel consumption of 1.0 to 2.0 kg/m 2, based on the Cruz et al. (2004) probability model. The
horizontal dashed line in each graph represents the approximate threshold value for the onset of crowning. The Beaufort scale for
estimating 6.1-m open windspeeds is presented in table 8-4.
2007). Physically based models hold great promise in being
able to advance our theoretical understanding of wildland
fire dynamics and could possibly be used for operational
prediction of wildand fire behavior in the future (Sullivan
2009b). By their completeness, these models should be able
to predict the development, the demise or cessation, spread
rate, fuel consumption, intensity, and flame dimensions of
crown fires in relation to any combination of fuel, weather,
and topographic variables. In recent years, these models
have been extensively used as research tools to evaluate
the effect of canopy fuel structure on crown fire dynamics.
Such modelling efforts could possibly allow one to investigate the effect of fuel treatments on crown fire potential.
Nonetheless, the capacity of these models to describe crown
fire behavior is still open to question given that no evaluation against any empirical crown fire data set has been
undertaken to date to our knowledge.
127
What is quite likely to happen is the continuing
mergence of empirical and physically based approaches
(Sullivan 2009b, Van Wagner 1985). An example of such
an approach is the semiphysically based crown fuel ignition
model (CFIM) developed by Cruz et al. (2006b) to predict
the onset of crowning based on fundamental heat transfer
principles. A series of submodels that take into account
surface fire characteristics along with canopy fuel properties are used to predict the ignition temperature of canopy
fuels above a spreading surface fire. An evaluation of CFIM
has been undertaken involving a sensitivity analysis of input
parameters, comparison against other similar models under
different burning conditions, and testing against outdoor
experimental fires (Cruz et al. 2006a). Results have been
favorable and provided new insights into the factors controlling the initiation of crown fires.
GENERAL TECHNICAL REPORT PNW-GTR-854
Figure 8-18–Threshold conditions for passive versus active crown fire spread in terms of windspeed and fine dead fuel moisture for
two canopy bulk density levels based on the Cruz et al. (2005) crown fire rate of spread models and Van Wagner’s (1977a) criteria for
active crowning. The Beaufort scale for estimating 6.1-m open windspeeds is presented in table 8-4.
Figure 8-19—Passive and active crown fire spread rates as a
function of windspeed and fine dead fuel moisture for a canopy
bulk density of 0.1 kg/m3 based on the Cruz et al. (2005) crown fire
rate of spread models. The vertical “kinks” in the fine dead fuel
moisture curves are considered to represent the windspeed thresholds between passive and active crowning. The Beaufort scale for
estimating 6.1-m open windspeeds is presented in table 8-4.
128
Synthesis of Knowledge of Extreme Fire Behavior: Volume I for Fire Managers
Another example of the merging of empirical and
physical modelling approaches was the International Crown
Fire Modeling Experiment (ICFME). One of the objectives
of this experimental burning program carried out in the
Northwest Territories of Canada from 1995 to 2001 (Alexander 2005) was to test a newly developed, deterministic
physical model for predicting crown fire rate of spread
(Albini 1996, Butler et al. 2004). Measurements of flame
radiometric properties and temperatures allowed for the
parameterizing of the heat transfer components in Albini’s
(1996) crown fire rate of spread model. Model evaluation
indicated that the model predicted the relative response of
fire spread rate to fuel and environmental variables, but it
consistently overpredicted the magnitude of the spread rates
observed on the ICFME crown fires.
Not all physically based models for predicting wildland
fire spread specifically take into account the effects of
spotting in increasing a fire’s rate of spread. The effects of
spotting on a fire’s overall rate of advance are implicitly
accounted for in both the FBP System and the Rothermel
(1991) crown fire rate of spread model as a result of the
empirical nature of their development (i.e., the use of
wildfire observations as a data source). This assumes,
however, that the fuels are continuous. Neither approach
indicates how barriers to fire spread are to be handled.
Short-range spotting from a crown fire is presumably able
to easily breach fuel discontinuities of up to 100 m in width
(Stocks et al. 2004, Taylor et al. 2004). Nominal spotting
from crown fires is undoubtedly capable of breaching even
much wider barriers, perhaps up to 1000 m (Alexander et
al. 2004). What is unknown, however, is how much of a
reduction there will be in the head fire rate of spread as a
result of the time delay involved (which might possibly be
30 to 60 min or longer) for the fire to resume its forward,
equilibrium rate of advance.
Albini (1979) developed a physically based model for
predicting the maximum spotting distance from single or
group tree torching that covers the case of intermediaterange spotting of up to perhaps 3.0 km. This model is
included within the BehavePlus modeling system, and a
manual procedure is given in Rothermel (1983). Rothermel
(1991) pointed out at the time he prepared his guide that
no model existed for predicting the spotting distances
for running or active crown fires. Venkatesh et al. (2000)
subsequently extended Albini’s (1979) model to the case of
wind-driven crown fires. The result was a 20- to 25-percent
increase in spotting distance. However, no testing of this
model has been undertaken to date to our knowledge. The
Venkatesh et al. (2000) model like the one developed by
Albini (1979) provides a prediction of the firebrand transport distance. Determining whether a given ember or firebrand will actually cause a spot fire must still be assessed
based on its ignition probability (e.g., Rothermel 1983).
More recently, an alternative predictive system has
been put forth for estimating the maximum spotting distance from active crown fires as a function of the firebrand
particle diameter at alighting based on three inputs, namely,
canopy top height, free flame height (i.e., flame distance
above the canopy top height), and the windspeed at the
2
height of the canopy. Although the system has not been
specifically validated, the estimates produced by the system
appear realistic in light of existing documented observations.
Example of a Practical Application of Linking
Empirical and Physically Based Models
Pine Plantation Pyrometrics (PPPY) is a new modeling
system developed to predict fire behavior in industrial pine
plantations over the full range of burning conditions in
relation to proposed changes in fuel complex structure from
fuel treatments (Cruz et al. 2008). The system comprises a
series of submodels, including CFIM and elements of CFIS,
that describe surface fire characteristics and crown fire
potential in relation to the surface and crown fuel structures, fuel moisture contents, and windspeed (fig. 8-20). A
case study application of the PPPY modeling system has
highlighted the complex interactions associated with fuel
2
Albini, F.A.; Alexander, M.E.; Cruz, M.G. Preciding the maximum
potential spotting distance from an active crown fire. Under review.
129
GENERAL TECHNICAL REPORT PNW-GTR-854
Figure 8-20—Flow diagram of the Pine Plantation Pyrometrics modeling system for predicting fire
behavior in exotic pine plantations (adapted from Cruz et al. 2008). CAC is the criteria for active
crowning (Van Wagner (1977a), CFROS is the crown fire rate of spread, and SFROS is the surface
fire rate of spread.
treatments such as pruning and thinning have on surface
and crown fire behavior potential (fig. 8-21). It is also
noteworthy that no definite reduction or increase in rate of
spread was identified. Although a direct evaluation of the
system’s overall performance has yet to be undertaken, its
main components have been evaluated against independent
data sets.
Implications for Fire and Fuel Management
In the broadest sense, the general conditions favorable
for the development of crowning in conifer forests have
130
Synthesis of Knowledge of Extreme Fire Behavior: Volume I for Fire Managers
•
Figure 8-21—Head fire rate of spread as a function of windspeed
for 12-year-old thinned (50 percent basal area reduction treatment) and unthinned pine plantation stands based on the Pine
Plantation Pyrometrics (PPPY) modeling system (adapted from
Cruz et al. 2008). The fuel complex characteristics for the thinned
and unthinned stands were, respectively, surface fuel available
for combustion, 1.1 and 0.5 kg/m 2; canopy base height, 1.7 and
0.9 m; and canopy bulk density, 0.05 and 0.1 kg/m3. Given an air
temperature of 40 °C and a relative humidity of 20 percent, the
fine dead fuel moistures for the surface litter were, in turn, judged
to be 5 and 7 percent, respectively. Foliar moisture content was set
at 100 percent in both cases, and level terrain was assumed. The
Beaufort scale for estimating 6.1-m open windspeeds is presented
in table 8-4.
been known for some time and also apply to nonforested
fuel types as well that exhibit high rates of fire spread and
fireline intensities or very long flame lengths (e.g., Butler
and Reynolds 1997). These include:
•
Continuous fine fuels in sufficient quantity and
arrangement, both vertically and horizontally.
•
A dry spell of sufficient length to reduce the moisture
content of dead fuels to a uniformly low level coupled
with high ambient air temperatures and low relative
humidity.
131
Strong prevailing winds or steep slopes.
In the past 25 years or so, these conditions have, in
turn, been crudely codified in various forms suitable for
use by field personnel. Other aspects of the fire environment may lead to an increase in crown fire potential but by
themselves are not a major predisposing factor (e.g., low
foliar moisture content, high foliar heat content, presence of
flammable oils and resins in the needle foliage).
Assuming a threshold level in dryness has been reached
in the forest floor layer, the potential for crown fire development and spread would generally follow the daily diurnal
cycle in fire weather conditions, typically peaking in late
afternoon (Beck et al. 2002). However, crown fire activity
can extend late into the day if fire weather conditions are
favorable for maintaining the moisture content of fine, dead
surface fuels at low levels (Hartford and Rothermel 1991).
Rothermel (1991) quite rightly pointed out that “Fires
are seldom uniform and well behaved.” Given the chaotic
nature of most extreme fire phenomena, can we expect the
behavior of crown fires to ever really be truly predictable?
That depends on how accurate you expect the prediction to
be. Certainly the minute-by-minute movement of a crown
fire will probably never be predictable. However, in looking
at crown fire propagation across longer timeframes, for
example (e.g., 30 min to several hours), the available data
have shown that some models are very capable of predicting
fire spread within a margin of error that is useful to fire
managers. Nevertheless, given the coarseness and uncertainty associated with the inputs in the crown fire initiation
and propagation models, managers should be wary of their
use for near-real-time predictions of fire behavior. Underestimating the potential for the onset of crowning under
conditions that would sustain active crown fire propagation
can, in turn, lead to substantial underpredictions in crown
fire rate of spread and fireline intensity.
Models or guides that have a good fundamental
framework and a solid empirical basis presumably predict
fire behavior well when used for conditions that are within
the data range used in their development (Sullivan 2009a).
Overestimates of fire behavior can easily be readjusted
GENERAL TECHNICAL REPORT PNW-GTR-854
Box 3:
Box 4:
Useful Links to Further
Information
U.S. Fire Modeling Systems
• http://www.firemodels.org/
Crown Fire Dynamics in Conifer
Forests—A Summary of the
Salient Points
Types of Crown Fires
Three kinds or classes of crown fire
are recognized according to their
degree of dependence on the surface
phase of fire spread (i.e., passive,
active, and independent, although the
latter is generally regarded as a rare
and short-lived occurrence).
Canadian Forest Fire Danger Rating
Systems
• http://frames.nbii.gov/cffdrs
• http://cwfis.cfs.nrcan.gc.ca/en_CA/
background/summary/fdr
Crown Fire Initiation and Spread
System
• http://frames.nbii.gov/cfis
Crown Fire Initiation
The amount of heat energy required
in the form of convection and radiation to induce the onset of crowning is
dictated by the canopy base height and
foliar moisture content as manifested
in the surface fire’s intensity. A rather
abrupt increase in fire activity should
be expected as a fire transitions from
the surface to crown fire phase.
International Crown Fire Modeling
Experiment
• http://frames.nbii.gov/icfme
• http://www.youtube.com/
watch?v=FYup7cYKE3w
• http://www.youtube.com/
watch?v=zvPa_yEEd4E
Joint Fire Science Program Crown
Fire Synthesis
Project
• http://www.fs.fed.us/wwetac/
projects/alexander.html
• http://www.myfirecommunity.net/
Neighborhood.aspx?ID=816
Crown Fire Propagation
Whether a passive or active crown
fire develops following the onset of
crowning depends on the spread rate
after initial crown combustion and is,
in turn, related to canopy bulk density.
3
A minimum value of about 0.1 kg/m
appears to represent a critical threshold for active crowning.
132
Synthesis of Knowledge of Extreme Fire Behavior: Volume I for Fire Managers
Box 4: continued
Box 4: continued
Crown Fire Rate of Spread
At a minimum, a doubling or tripling
in a fire’s rate of advance follows the
onset of crowning. Wind-driven crown
fires have been documented to spread
at up to 100 m/min for several hours
and in excess of 200 m/min for up
to an hour. Although the mechanical
effect of slope steepness on increasing
a fire’s rate of spread is well known,
fires in mountainous terrain generally
do not spread nearly as far for a given
period of time compared to those on
flat topography.
Assuming unlimited horizontal fuel
continuity, crown fires are capable of
burning an area of up to 70 000 ha
with a perimeter length of 160 km in a
single burning period and have done so
in the past.
Crown Fire Spotting Activity
Crown fires commonly display highdensity, short-range spotting (<50 m).
Spotting distances of up to about 2.0
km, although less common, are frequently seen on crown fires, resulting
in normal barriers to fire spread being
breached. Many spot fires are simply
overrun by the main advancing flame
front of a crown fire before they effectively contribute to an increase in the
fire’s overall rate of advance. Cases of
long-distance spotting in excess of 10
km have been reported.
Crown Fire Intensity and Flame
Zone Characteristics
As a result of the increase in spread
rate and fuel available for combustion,
a fire can easily quadruple its intensity
in a matter of seconds when crowning
takes place (e.g., from 3000 kW/m
to 12 000 kW/m). The resulting wall
of flame, standing nearly erect, is on
average up to two to three times the
tree height and emits fierce radiation.
Flame fronts commonly exceed 30 to
45 m in depth.
Models, Systems, and Other
Decision Aids for Predicting Crown
Fire Behavior
The current set of guides and decisionsupport system for assessing potential
crown fire behavior used in the United
States are considered deficient in the
absence of considerable adjustment on
the part of trained and informed users
(e.g., fire behavior analysts, long-term
fire analysts). Alternative models and
systems that have undergone far more
Crown Fire Area and Perimeter
Growth
The area burned by a crown fire is at
least four to nine times that of a surface fire for the same period.
133
GENERAL TECHNICAL REPORT PNW-GTR-854
Box 4: continued
extensive testing and requiring a
minimum of inputs are available.
Implications for Fire and Fuel
Management
Operational fire management personnel can readily help themselves when
it comes to being able to assess crown
fire behavior by engaging in a more
rigorous program of wildfire monitoring and case study documentation
than has been undertaken to date.
without serious consequences. However, underestimates can
be potentially disastrous (Cheney 1981). In this regard, the
underprediction trend in predictions of crown fire behavior
evident in the existing fire modeling systems used in the
United States is of concern on a number of fronts. For
example, if a system predicts or simulates that a fire will
behave as a moderate-intensity surface fire under extreme
fire weather conditions, why would it be necessary to undertake any form of fuel treatment or even be concerned about
the general flammability of an area? As for human safety, if
people are led to believe that some stand structures will not
support crowning under a given set of weather conditions—
but in actual fact they will—are they not putting themselves
and others in grave danger?
It has been suggested that most wildland fire operations personnel base their expectations of how a fire will
behave largely on experience and, to a lesser extent, on
guides to forecasting fire behavior (Burrows 1984). Experienced judgement is certainly needed in any assessment
of wildland fire potential, but it does have some limitations
(Gisborne 1948). The same can be said for mathematical
models and computerized decision-support systems. Given
the present realities, practical knowledge and sound professional judgment coupled with experience is still needed and
perhaps should take on an even more prominent role when
it comes to adjusting, interpreting, and applying crown fire
behavior predictions. Predicting wildland fire behavior is,
after all, both an “art and a science.”
Wildland fire research has done much to contribute to
our current understanding of crown fire behavior through
laboratory experiments, outdoor experimental burning,
numerical modeling, and wildfire case histories (box 3).
Although operational fire behavior specialists have also
made substantial contributions (e.g., Beighley and Bishop
1990, Murphy et al. 2007), valuable information and
insights are not being captured in a systematic way. The
continuance of basic research into fire fundamentals is
essential to gaining a complete understanding of crown fire
behavior, but scientific knowledge alone will not be enough
to develop a complete picture of crown fire dynamics. There
is still an overriding need to bolster the efforts in observing crown fire behavior and completing the necessary case
study documentation in order to evaluate new and existing
predictive models of crown fire behavior. Such a program
should be regarded as a shared responsibility between wildland fire research and fire management and be considered
part of adaptive management (Alexander and Taylor 2010).
Future Outlook
In discussing his dichotomous key for appraising crowning
potential, Fahnestock (1970) indicated that “No technique
is available for calculating the mathematical probability
that a fire will crown under given conditions.” In turn,
Kerr et al. (1971) considered that “In the foreseeable future
there is little prospect of predicting the behavior of a fast
spreading crown fire in timber over any extended period
of time.” More recently, Agee (1993) stated, “The chances
of firebrand spotting and crown fires can be estimated, but
the behavior of crown fire is still relatively unpredictable.”
In light of these comments, obviously much has been
accomplished and experienced in the past 20 to 40 years
134
Synthesis of Knowledge of Extreme Fire Behavior: Volume I for Fire Managers
when viewed from the point of our current understanding
and predictive capability with respect to crown fires (box 4).
Presumably, the future holds the same promise as the
recent past provided we are willing to readily admit what
we know and, more importantly, what we presumably still
do not know about crown fires with respect to their environment, characteristics, and prediction. Several knowledge
gaps have been alluded to throughout this summary.
Furthermore, a good many basic wildland fire behavior
research needs identified over 25 years ago, some of which
are relevant to crown fires, have yet to be addressed (Albini
1984). Research must be directed at both the operational
products desired by fire and fuel managers, and the fundamental understanding that forms the basis for such end-user
tools (Cohen 1990).
Further discoveries and advancements in understanding of crown fire dynamics in conifer forests will require
a dedication in time, money, and staff (Blatchford 1972).
In actual fact, new research into the complexities of crown
fire phenomenology has already been initiated (e.g., Cruz
and Alexander 2009). However, in the long run, scientific
investigations into crown fire behavior might be best
accomplished in the form of a collaborative, international
research, development, and application effort (Christensen
et al. 2007, Weber 1995). Networked, multidisciplinary
teams that can build on extant understanding while creating
new knowledge regarding the mechanisms associated with
crown fire initiation and spread may provide the necessary
platform.
Literature Cited
Agee, J.K. 1993. Fire ecology of Pacific Northwest forests.
Washington, DC: Island Press. 493 p.
Ager, A.A.; Vaillant, N.M.; Anderson, J.; Miller, L.
2011. ArcFuels user guide: for use with ArcGIS 9.X.
Prineville, OR: U.S. Department of Agriculture, Forest
Service, Pacific Northwest Research Station, Western
Wildland Environmental Threat Assessment Center.
256 p. http://www.fs.fed.us/wwetac/arcfuels/downloads/
ArcFuels_UserGuide.pdf. (3 February 2011).
Albini, F.A. 1979. Spot fire distance from burning trees—
a predictive model. Gen. Tech. Rep. INT-56. Ogden,
UT: U.S. Department of Agriculture, Forest Service,
Intermountain Forest and Range Experiment Station.
73 p.
Albini, F.A. 1984. Wildland fires. American Scientist.
72: 590–597.
Albini, F.A. 1993. Dynamics and modelling of vegetation
fires: observations. In: Crutzen, P.J.; Goldammer, J.G.,
eds. Fire in the environment: the ecological, atmospheric,
and climatic importance of vegetation fires. Environ. Sci.
Res. Rep. 13. Chichester, England: John Wiley & Sons:
39–52.
Albini, F.A. 1996. Iterative solution of the radiation
transport equations governing spread of fire in wildland
fuel. Combustion, Explosion, and Shock Waves.
32: 534–543.
Albini, F.A.; Baughman, R.G. 1979. Estimating
windspeeds for predicting wildland fire behavior.
Res. Pap. INT-221. Ogden, UT: U.S. Department of
Agriculture, Forest Service, Intermountain Forest and
Range Experiment Station. 12 p.
Albini, F.A.; Stocks, B.J. 1986. Predicted and observed
rates of spread of crown fire in immature jack pine.
Combustion Science and Technology. 48: 65–76.
Agee, J.K. 1996. The influence of forest structure on
fire behavior. In: Sherlock, J., ed. Proceedings of the
17th annual forest vegetation management conference.
Redding, CA: Forest Vegetation Management
Conference: 52–57.
Alexander, M.E. 1982. Calculating and interpreting forest
fire intensities. Canadian Journal of Botany. 60: 349–357.
135
GENERAL TECHNICAL REPORT PNW-GTR-854
Alexander, M.E. 1985. Estimating the length-to-breadth
ratio of elliptical forest fire patterns. In: Donoghue, L.R.;
Martin, R.E., eds. Proceedings of eighth conference on
fire and forest meteorology. SAF Publ. 85-04. Bethesda,
MD: Society of American Foresters: 287–304.
Alexander, M.E. 1988. Help with making crown fire
hazard assessments. In: Fischer, W.C.; Arno, S.F., comps.
Proceedings of symposium and workshop on protecting
people and homes from wildfire in the interior West.
Gen. Tech. Rep. INT-251. Ogden, UT: U.S. Department
of Agriculture, Forest Service, Intermountain Research
Station: 147–156.
Alexander, M.E. 1998. Crown fire thresholds in exotic pine
plantations of Australasia. Canberra, ACT: Australian
National University. 228 p. Ph.D. thesis.
Alexander, M.E. 2005. Long-term experiment takes some
of the mystery out of crown fires. Fire Management
Today. 65(3): 36–37.
Alexander, M.E. 2009. The 1988 fires of Yellowstone
and beyond as a wildland fire behavior case study.
Tucson, AZ: U.S. Department of Agriculture, Forest
Service, Wildland Fire Lessons Learned Center.
30 p. www.wildfirelessons.net/documents/Alexander_
Yellowstone88_FB.pdf. (3 February 2010).
Alexander, M.E.; Cruz, M.G. 2006. Evaluating a model
for predicting active crown fire rate of spread using
wildfire observations. Canadian Journal of Forest
Research. 36: 3015–3028.
Alexander, M.E.; Cruz, M.G.; Lopes, A.M.G. 2006.
CFIS: a software tool for simulating crown fire initiation
th
and spread. In: Viegas, D.X., ed. Proceedings of 5
international conference on forest fire research. [CDROM]. Amsterdam, The Netherlands: Elsevier BV. 13 p.
Alexander, M.E.; De Groot, W.J. 1988. Fire behavior
in jack pine stands as related to the Canadian Forest
Fire Weather Index (FWI) System. [Poster with text.]
Edmonton, AB: Government of Canada, Canadian
Forestry Service, Northern Forestry Centre.
Alexander, M.E.; Lanoville, R.A. 1989. Predicting fire
behavior in the black spruce-lichen woodland fuel type
of western and northern Canada. [Poster with text.]
Edmonton, AB and Fort Smith, NT: Forestry Canada,
Northern Forestry Centre and Government of Northwest
Territories, Department of Renewable Resources,
Territorial Forest Fire Centre.
Alexander, M.E.; Taylor, S.W. 2010. Wildland fire
behavior case studies and the 1938 Honey Fire
controversy. Fire Management Today. 70(1): 15–25.
Alexander, M.E.; Tymstra, C.; Frederick, K.W. 2004.
Incorporating breaching and spotting considerations into
PROMETHEUS—the Canadian wildland fire growth
model. Chisholm/Dogrib Fire Res. Initiative Quicknote
6. Hinton, AB: Foothills Model Forest. 2 p.
Anderson, H.E. 1968. Sundance Fire: an analysis
of fire phenomena. Res. Pap. INT-56. Ogden, UT:
U.S. Department of Agriculture, Forest Service,
Intermountain Forest and Range Experiment Station.
39 p.
Anderson, H.E. 1982. Aids to determining fuel models
for estimating fire behavior. Gen. Tech. Rep. INT-122.
Ogden, UT: U.S. Department of Agriculture, Forest
Service, Intermountain Forest and Range Experiment
Station. 22 p.
Anderson, H.E. 1983. Predicting wind-driven wild
land fire size and shape. Res. Pap. INT-305. Ogden,
UT: U.S. Department of Agriculture, Forest Service,
Intermountain Forest and Range Experiment Station.
26 p.
Andrews, P.L.; Bevins, C.D.; Seli, R.C. 2008. BehavePlus
fire modeling system, version 4.0: user’s guide. Gen.
Tech. Rep. RMRS-GTR-106WWW. Fort Collins, CO:
U.S. Department of Agriculture, Forest Service, Rocky
Mountain Research Station. 116 p.
136
Synthesis of Knowledge of Extreme Fire Behavior: Volume I for Fire Managers
Beck, J.A.; Alexander, M.E.; Harvey, S.D.; Beaver, A.K.
2002. Forecasting diurnal variation in fire intensity to
enhance wildland firefighter safety. International Journal
of Wildland Fire. 11: 173–182.
Butler, B.W.; Finney, M.A.; Andrews, P.; Albini, F.A.
2004. A radiation-driven model of crown fire spread.
Canadian Journal of Forest Research. 34: 1588–1599.
Beighley, M.; Bishop, J. 1990. Fire behavior in highelevation timber. Fire Management Notes: 51(2): 23–28.
[Republished in 2003 as: Fire Management Today.
63(4): 56–62.]
Butler, B.W.; Reynolds, T.D. 1997. Wildfire case study:
Butte City Fire, southeastern Idaho, July 1, 1994. Gen.
Tech. Rep. INT-GTR-351. Ogden, UT: U.S. Department
of Agriculture, Forest Service, Intermountain Research
Station. 15 p.
Blatchford, A.N. 1972. Dissemination and application of
research information in the field. Res. Develop. Pap. 88.
London, England: Forestry Commission. 5 p.
Byram, G.M. 1954. Atmospheric conditions related to
blowup fires. Stn. Pap. No. 35. Asheville, NC: U.S.
Department of Agriculture, Forest Service, Southeastern
Forest Experiment Station. 34 p.
Brown, A.A.; Davis, K.P. 1973. Forest fire: control and
use. 2nd ed. New York, NY: McGraw-Hill. 686 p.
Bruner, A.D.; Klebenow, D.A. 1979. Predicting success of
prescribed fire in pinyon-juniper woodland in Nevada.
Res. Pap. INT-219. Ogden, UT: U.S. Department of
Agriculture, Forest Service, Intermountain Forest and
Range Experiment Station. 12 p.
Burgan, R.E. 1979. Fire danger/fire behavior computations
with the Texas Instruments TI-59 calculator: user’s
manual. Gen. Tech. Rep. INT-61. Ogden, UT:
U.S. Department of Agriculture, Forest Service,
Intermountain Forest and Range Experiment Station.
25 p.
Burrows, N.D. 1984. Predicting blow-up fires in the jarrah
forest. Tech. Pap. No. 12. Perth, Western Australia:
Forests Department of Western Australia. 27 p.
Byram, G.M. 1959a. Combustion of forest fuels. In:
Davis, K.P., ed. Forest fire: control and use. New York:
McGraw-Hill: 61–89.
Byram, G.M. 1959b. Forest fire behavior. In: Davis, K.P.,
ed. Forest fire: control and use. New York: McGraw-Hill:
90–123.
Carlton, D. 2005. Fuels Management Analyst Plus
software, version 3. Estacada, OR: Fire Program
Solutions LLC. http://www.fireps.com/fmanalyst3/index.
htm. (8 November 2009).
Cheney, N.P. 1981. Fire behaviour. In: Gill, A.M.; Groves,
R.H.; Noble, I.R., eds. Fire and the Australian biota.
Canberra, ACT: Australian Academy of Science:
151–175.
Cheney, P.; Sullivan, A. 2008. Grassfires: fuel, weather
and fire behaviour. Collingwood, South Australia:
Butler, B.W.; Bartlette, R.A.; Bradshaw, L.S.; Cohen,
J.D.; Andrews, P.L.; Putnam, T.; Mangan, R.J.
1998. Fire behavior associated with the 1994 South
Canyon Fire on Storm King Mountain, Colorado. Res.
Pap. RMRS-RP-9. Ogden, UT: U.S. Department of
Agriculture, Forest Service, Rocky Mountain Research
Station. 82 p.
CSIRO Publishing. 150 p.
Christensen, N.L. (chair); Alexander, M.E.; Benson,
N.C.; Brown, T.J.; Cortner, H.J.; Omi, P.N.; Schmidt,
R.G.; Shlisky, A.; Swallow, S.K. 2007. U.S. Forest
Service R&D wildland fire external peer review. Report
submitted to USDA Forest Service Research and
Development, Washington, DC. 25 p.
137
GENERAL TECHNICAL REPORT PNW-GTR-854
Cohen, J.D. 1990. Research has part of the answer. In: Are
forests the answer? Proceedings of the 1990 Society of
American Foresters National Convention. SAF Publ.
90-02. Bethesda, MD: Society of American Foresters:
117–120.
Cronan, J.; Jandt, R. 2008. How succession affects fire
behavior in boreal black spruce forest of interior Alaska.
BLM-Alaska Tech. Rep. 59. Anchorage, AK: U.S.
Department of the Interior, Bureau of Land Management,
Alaska State Office. 15 p.
Cruz, M.G.; Alexander, M.E. 2009. Assessing
discontinuous fire behaviour and uncertainty associated
with the onset of crowning [extended abstract]. In:
Masters, R.E.; Galley, K.E.M.; Despain, D.G., eds. The
’88 Fires: Yellowstone and beyond. Tall Timbers Misc.
Publ. No. 16. Tallahassee, FL: Tall Timbers Research
Station: 20.
Cruz, M.G.; Alexander, M.E. 2010. Assessing crown fire
potential in coniferous forests of western North America:
a critique of current approaches and recent simulation
studies. International Journal of Wildland Fire.
19: 377–398.
Cruz, M.G.; Alexander, M.E. [In press]. Evaluating
regression model estimates of canopy fuel stratum
characteristics in four crown fire prone fuel types
in western North America. International Journal of
Wildland Fire.
Cruz, M.G.; Alexander, M.E.; Fernandes, P.A.M. 2008.
Development of a model system to predict wildfire
behaviour in pine plantations. Australian Forestry.
70: 113–121.
Cruz, M.G.; Alexander, M.E.; Wakimoto, R.H. 2003a.
Assessing canopy fuel stratum characteristics in
crown fire prone fuel types of western North America.
International Journal of Wildland Fire. 12: 39–50.
Cruz, M.G.; Alexander, M.E.; Wakimoto, R.H. 2003b.
Assessing the probability of crown fire initiation based
on fire danger indices. Forestry Chronicle. 79: 976–983.
Cruz, M.G.; Alexander, M.E.; Wakimoto, R.H. 2003c.
Definition of a fire behavior model evaluation protocol:
a case study application to crown fire behavior models.
In: Omi, P.N.; Joyce, L.A., tech. eds. Fire, fuel treatments
and ecological restoration: conference proceedings.
Proc. RMRS-P-29. Fort Collins, CO: U.S. Department of
Agriculture, Forest Service, Rocky Mountain Research
Station: 49–67.
Cruz, M.G.; Alexander, M.E.; Wakimoto, R.H. 2004.
Modeling the likelihood of crown fire occurrence in
conifer forest stands. Forest Science. 50: 640–658.
Cruz, M.G.; Alexander, M.E.; Wakimoto, R.H. 2005.
Development and testing of models for predicting crown
fire rate of spread in conifer forest stands. Canadian
Journal of Forest Research. 35: 1626–1639.
Cruz, M.G.; Butler, B.W.; Alexander, M.E. 2006a.
Predicting the ignition of crown fuels above a spreading
surface fire. Part II: Model behavior and evaluation.
International Journal of Wildland Fire. 15: 61–72.
Cruz, M.G.; Butler, B.W.; Alexander, M.E.; Forthofer,
J.M.; Wakimoto, R.H. 2006b. Predicting the ignition of
crown fuels above a spreading surface fire. Part I: Model
idealization. International Journal of Wildland Fire.
15: 47–60.
Cruz, M.G.; Fernandes, P.M. 2008. Development of
fuel models for fire behaviour in maritime pine (Pinus
pinaster Ait.) stands. International Journal of Wildland
Fire. 17: 194–204.
DeCoste, J.H.; Wade, D.D.; Deeming, J.E. 1968. The
Gaston Fire. Res. Pap. SE-43. Asheville, NC: U.S.
Department of Agriculture, Forest Service, Southeastern
Forest Experiment Station. 36 p.
138
Synthesis of Knowledge of Extreme Fire Behavior: Volume I for Fire Managers
Dupuy, J.L.; Morvan, D. 2005. Numerical study of
a crown fire spreading toward a fuel break using a
multiphase physical model. International Journal of
Wildland Fire. 14: 141–151.
Graham, R.T., tech. ed. 2003. Hayman Fire case study.
Gen. Tech. Rep. RMRS-GTR-114. Ogden, UT: U.S.
Department of Agriculture, Forest Service, Rocky
Mountain Research Station. 396 p.
Fahnestock, G.R. 1970. Two keys for appraising forest fire
fuels. Res. Pap. PNW-99. Portland, OR: U.S. Department
of Agriculture, Forest Service, Pacific Northwest Forest
and Range Experiment Station. 26 p.
Hartford, R.A.; Rothermel, R.C. 1991. Fuel moisture
as measured and predicted during the 1988 fires in
Yellowstone National Park. Res. Note INT-396. Ogden,
UT: U.S. Department of Agriculture, Forest Service,
Intermountain Research Station. 7 p.
Finney, M.A. 2004. FARSITE: Fire area simulator—
model development and evaluation. Res. Pap. RMRSRP-4 Revised. Fort Collins, CO: U.S. Department of
Agriculture, Forest Service, Rocky Mountain Research
Station. 47 p.
Hirsch, K.G.; Martell, D.L.; Corey, P.N. 2000.
Probability of containment by medium initial attack
Finney, M.A. 2006. An overview of FlamMap fire
modelling capabilities. In: Andrews, P.L.; Butler, B.W.,
comps. Fuels management—how to measure success:
conference proceedings. Proc. RMRS-P-41. Fort Collins,
CO: U.S. Department of Agriculture, Forest Service,
Rocky Mountain Research Station: 213–220.
Folweiler, A.D. 1937. Theory and practice of forest fire
protection in the United States. St. Louis, MO: John S.
Swift Co., Inc. 163 p.
Forestry Canada Fire Danger Group. 1992. Development
and structure of the Canadian Forest Fire Behavior
Prediction System. Inf. Rep. ST-X-3. Ottawa, ON:
Forestry Canada, Science and Sustainable Development
Directorate. 63 p.
Gisborne, H.T. 1948. Fundamentals of fire behavior. Fire
Control Notes. 9(1): 13–24. [Republished in 2004 as: Fire
Management Today. 64(1): 15–23.]
Goens, D.W.; Andrews, P.L. 1998. Weather and fire
behavior factors related to the Dude Fire, AZ. In:
Preprint volume of second symposium on fire and forest
meteorology. Boston, MA: American Meteorological
Society: 153–158.
crews in the boreal spruce fuel type. [Poster with text.]
Edmonton, AB: Natural Resources Canada, Canadian
Forest Service, Northern Forestry Centre.
Hough, W.A. 1973. Fuel and weather influence wildfires in
sand pine forests. Res. Pap. SE-174. Asheville, NC: U.S.
Department of Agriculture, Forest Service, Southeastern
Forest Experiment Station. 11 p.
Kerr, W.L.; Buck, C.C.; Cline, W.E.; Martin, S.;
Nelson, W.D. 1971. Nuclear weapons effects in a forest
environment—thermal and fire. Rep. N2: TR 2-70. Santa
Barbarba, CA: General Electric Company-TEMPO and
Department of Defense Nuclear Information Analysis
Center.
Keyes, C.R. 2006. Role of foliar moisture content in the
silvicultural management of forest fuels. Western Journal
of Applied Forestry. 21: 228–231.
Kiil, A.D.; Grigel, J.E. 1969. The May 1968 forest
conflagrations in central Alberta—a review of fire
weather, fuels and fire behavior. Inf. Rep. A-X-24.
Edmonton, AB: Canada Department of Fisheries and
Forestry, Forestry Branch, Forest Research Laboratory.
36 p.
Lindenmuth, A.W., Jr.; Davis, J.R. 1973. Predicting fire
spread in Arizona’s oak chaparral. Res. Pap. RM-101.
Fort Collins, CO: U.S. Department of Agriculture, Forest
Service, Rocky Mountain Forest and Range Experiment
Station. 11 p.
139
GENERAL TECHNICAL REPORT PNW-GTR-854
Linn, R.; Reisner, J.; Colman, J.J.; Winterkamp, J.
2002. Studying wildfire behavior using FIRETEC.
International Journal of Wildland Fire. 11: 233–246.
Maclean, N. 1992. Young men and fire. Chicago, IL:
University of Chicago Press. 301 p.
McAlpine, R.S.; Lawson, B.D.; Taylor, E. 1991. Fire
spread across a slope. In: Andrews, P.L.; Potts, D.F., eds.
Proceedings of the 11th conference on fire and forest
meteorology. SAF Publ. 91-04. Bethesda, MD: Society of
American Foresters: 218–225.
McAlpine, R.S.; Wakimoto, R.H. 1991. The acceleration
of fire spread from point source to equilibrium spread.
Forest Science. 37: 1314–1337.
McArthur, A.G. 1965. Fire behaviour characteristics of
the Longford Fire. Leafl. No. 91. Canberra, Australian
Capital Territory: Commonwealth of Australia, Forest
and Timber Bureau, Forest Research Institute. 19 p.
Mell, W.; Jenkins, M.A.; Gould, J.; Cheney, P. 2007. A
physics-based approach to modelling grassland fires.
International Journal of Wildland Fire. 16: 1–22.
Menning, K.M.; Stephens, S.L. 2007. Fire climbing in
the forest: a semiqualitative, semiquantitative approach
to assessing ladder fuel hazards. Western Journal of
Applied Forestry. 22: 88–93.
Mottus, B.; Pengelly, I. 2004. An analysis of the
meteorological conditions associated with the 1999
Panther River Fire in Banff National Park [abstract].
In: Engstrom, R.T.; Galley, K.E.M.; de Groot, W.J.;
eds. Proceedings of the 22nd Tall timbers fire ecology
conference: fire in temperate, boreal, and montane
ecosystems. Tallahassee, FL: Tall Timbers Research
Station: 239.
Murphy, K.; Rich, T.; Sexton, T. 2007. An assessment
of fuel treatment effects on fire behavior, suppression
effectiveness, and structure ignition on the Angora Fire.
Tech. Publ. R5-TP-025. Vallejo, CA: U.S. Department of
Agriculture, Forest Service, Pacific Southwest Region.
32 p.
National Wildfire Coordinating Group. 1993. Look up,
look down, look around [VHS videotape; 50 minutes].
Publication NFES 2244. Boise, ID: National Fire
Equipment System, Boise Interagency Fire Center.
Nelson, R.M., Jr. 1993. Byram’s energy criterion for
wildland fires: units and equations. Res. Note INT-415.
Ogden, UT: U.S. Department of Agriculture, Forest
Service, Intermountain Research Station. 5 p.
Paxton, J. 2007. The monster reared his ugly head—the
story of Rodeo-Chediski Fire and fire as a tool of nature.
Snowflake, AZ: Cedar Hill Publishing. 217 p.
Pence, M.; Zimmerman, T. 2011. The Wildland Fire
Decision Support System: integrating science,
technology, and fire management. Fire Management
Today. 71(1): 18–22.
Reinhardt, E.D.; Crookston, N.L., tech eds. 2003.
The Fire and Fuels Extension to the Forest Vegetation
Simulator. Gen. Tech. Rep. RMRS-GTR-116. Ogden, UT:
U.S. Department of Agriculture, Forest Service, Rocky
Mountain Research Station. 209 p.
Rothermel, R.C. 1972. A mathematical model for
predicting fire spread in wildland fuels. Res. Pap. INT115. Ogden, UT: U.S. Department of Agriculture, Forest
Service, Intermountain Forest and Range Experiment
Station. 40 p.
Rothermel, R.C. 1983. How to predict the spread and
intensity of forest and range fires. Gen. Tech. Rep. INT143. Ogden, UT: U.S. Department of Agriculture, Forest
Service, Intermountain Forest and Range Experiment
Station. 161 p.
140
Synthesis of Knowledge of Extreme Fire Behavior: Volume I for Fire Managers
Scott, J.H.; Reinhardt, E.D. 2001. Assessing crown fire
potential by linking models of surface and crown fire
behavior. Res. Pap. RMRS-RP-29. Fort Collins, CO:
U.S. Department of Agriculture, Forest Service, Rocky
Mountain Research Station. 59 p.
Rothermel, R.C. 1985. Fire behavior considerations of
aerial ignition In: Mutch, R.W., tech. coord. Prescribed
fire by aerial ignition, proceedings of a workshop.
Missoula, MT: Intermountain Fire Council: 143–158.
Rothermel, R.C. 1991. Predicting behavior and size of
crown fires in the northern Rocky Mountains. Res. Pap.
INT-438. Ogden, UT: U.S. Department of Agriculture,
Forest Service, Intermountain Research Station. 46 p.
Simard, A.J.; Haines, D.A.; Blank, R.W.; Frost, J.S.
1983. The Mack Lake Fire. Gen. Tech. Rep. NC-83.
St. Paul, MN: U.S. Department of Agriculture, Forest
Service, North Central Forest Experiment Station. 36 p.
Rothermel, R.C. 1993. Mann Gulch Fire: a race that
couldn’t be won. Gen. Tech. Rep. INT-299. Ogden,
UT: U.S. Department of Agriculture, Forest Service,
Intermountain Research Station. 10 p.
Stocks, B.J.; Alexander, M.E.; Wotton, B.M.; Stefner,
C.N.; Flannigan, M.D.; Taylor, S.W.; Lavoie,
N.; Mason, J.A.; Hartley, G.R.; Maffey, M.E.;
Dalrymple, G.N.; Blake, T.W.; Cruz, M.G.; Lanoville,
R.A. 2004. Crown fire behaviour in a northern jack pineblack spruce forest. Canadian Journal of Forest Research.
34: 1548–1560.
Rothermel, R.C.; Hartford, R.A.; Chase, C.H. 1994.
Fire growth maps for the 1988 Greater Yellowstone
Area fires. Gen. Tech. Rep. INT-304. Ogden, UT:
U.S. Department of Agriculture, Forest Service,
Intermountain Research Station. 64 p.
Stocks, B.J.; Hartley, G.R. 1995. Fire behavior in three
jack pine fuel complexes. [Poster with text.] Sault Ste.
Marie, ON: Natural Resources Canada, Canadian Forest
Service, Great Lakes Forestry Centre.
Rothermel, R.C.; Mutch, R.W. 1986. Behavior of the
life-threatening Butte Fire: August 27–29, 1985. Fire
Management Notes. 47(2): 14–24. [Republished in 2003
Sullivan, A.L. 2009a. Improving operational models of
fire behaviour. In: Anderssen, R.S.; Braddock, R.D.;
Newham, L.T.H., eds. Proceedings of the 18th World
as: Fire Management Today. 63(4): 31–39.]
Schaaf, M.D.; Sandberg, D.V.; Schreuder, M.D.;
Riccardi, C.L. 2007. A conceptual framework for
ranking crown fire potential in wildland fuelbeds.
Canadian Journal of Forest Research. 37: 2464–2478.
Schroeder, M.J.; Buck, C.C. 1970. Fire weather … a guide
for application of meteorological information to forest
fire control operations. Agric. Handb. 360. Washington,
DC: U.S. Department of Agriculture. 229 p.
Scott, J.H. 2006. Comparison of crown fire modeling
systems used in three fire management applications. Res.
Pap. RMRS-RP-58. Fort Collins, CO: U.S. Department
of Agriculture, Forest Service, Rocky Mountain
Research Station. 25 p.
141
IMACS Congress and MODSIM09 International
Congress on modelling and simulation. Modelling
and Simulation Society of Australia and New Zealand
and International Association for Mathematics and
Computers in Simulation: 2377–2383. http://www.
mssanz.org.au/modsim09/A4/sullivan.pdf. (14 February
2010).
Sullivan, A.L. 2009b. Wildland surface fire spread
modelling, 1990–2007. 1: Physical and quasi-physical
models. International Journal of Wildland Fire. 18: 349368.
Sutton, M.W. 1984. Extraordinary flame heights observed
in pine fires on 16 February 1983. Australian Forestry.
47: 199–200.
GENERAL TECHNICAL REPORT PNW-GTR-854
Taylor, S.W.; Pike, R.G.; Alexander, M.E. 1997. Field
guide to the Canadian Forest Fire Behavior Prediction
(FBP) System. Spec. Publ. 11. Edmonton, AB: Natural
Resources Canada, Canadian Forest Service, Northern
Forestry Centre. 60 p.
Van Wagner, C.E. 1985. Fire behavior modelling—how to
blend art and science. In: Donoghue, L.R.; Martin, R.E.,
eds. Proceedings of eighth conference on fire and forest
meteorology. SAF Publ. 85–04. Bethesda, MD: Society
of American Foresters: 3–5.
Taylor, S.W.; Wotton, B.M.; Alexander, M.E.;
Dalrymple, G.N. 2004. Variation in wind and crown fire
behaviour in a northern jack pine-black spruce forest.
Canadian Journal of Forest Research. 34: 1561–1576.
Van Wagner, C.E. 1987. Development and structure of the
Canadian Forest Fire Weather Index System. For. Tech.
Rep. 35. Ottawa, ON: Government of Canada, Canadian
Forestry Service. 37 p.
Tymstra, C.; Bryce, R.W.; Wotton, B.M.; Taylor, S.W.;
Armitage, O.B. 2010. Development and structure
of Prometheus: the Canadian wildland fire growth
simulation model. Inf. Rep. NOR-X-417. Edmonton, AB:
Natural Resources Canada, Canadian Forest Service,
Northern Forestry Centre. 102 p.
Van Wagner, C.E. 1993. Prediction of crown fire behavior
in two stands of jack pine. Canadian Journal of Forest
Research. 23: 442–449.
U.S. Department of Agriculture, Forest Service [USDA
FS]. 1980. Report on the National Fire Behavior
Research conference. Washington, DC: Forest Fire and
Atmospheric Sciences Research. 75 p. plus appendices.
U.S. Department of Agriculture, Natural Resources
Conservation Service [USDA NRCS]. 2010. The
PLANTS database. http://plants.usda.gov. (3 February
2011).
Van Wagner, C.E. 1964. History of a small crown fire.
Forestry Chronicle. 40: 202–205, 208–209.
Van Wagner, C.E. 1968. Fire behaviour mechanisms in a
red pine plantation: field and laboratory evidence. Dep.
Publ. No. 1229. Ottawa, ON: Canada Department of
Forestry and Rural Development, Forestry Branch. 30 p.
Van Wagner, C.E. 1969. A simple fire-growth model.
Forestry Chronicle. 45: 103–104.
Van Wagner, C.E. 1977a. Conditions for the start and
spread of crown fire. Canadian Journal of Forest
Research. 7: 23–34.
Van Wagner, C.E. 1977b. Effect of slope on fire spread
rate. Canadian Forestry Service Bi-monthly Research
Notes. 33: 7–8.
van Wagtendonk, J.W.; Botti, S.J. 1984. Modeling
behavior of prescribed fires in Yosemite National Park.
Journal of Forestry. 82: 479–484.
Varner, J.M.; Keyes, C.R. 2009. Fuels treatments and fire
models: errors and corrections. Fire Management Today.
69(3): 47–50.
Venkatesh, S.; Saito, K.; Rothermel, R.C. 2000.
Maximum spotting distance in wind-driven crown fires.
Nensho no Kagaku to Gijutsu. 7: 221–233. [In English.]
Wade, D.D.; Ward, D.E. 1973. An analysis of the Air
Force Bomb Range Fire. Res. Pap. SE-105. Asheville,
NC: U.S. Department of Agriculture, Forest Service,
Southeastern Forest Experiment Station. 38 p.
Weber, M.G. 1995. Fire research and the global village.
Forestry Chronicle. 71: 584–588.
Wendel, G.W.; Storey, T.G.; Byram, G.M. 1962. Forest
fuels on organic and associated soils in the Coastal Plain
of North Carolina. Stn. Pap. 144. Asheville, NC: U.S.
Department of Agriculture, Forest Service, Southeastern
Forest Experiment Station.
Wotton, B.M.; Alexander, M.E.; Taylor, S.W. 2009.
Updates and revisions to the 1992 Canadian Forest Fire
Behavior Prediction System. Inf. Rep. GLC-X-10. Sault
Ste. Marie, ON: Natural Resources Canada, Canadian
Forest Service, Great Lakes Forestry Centre. 45 p.
142
Synthesis of Knowledge of Extreme Fire Behavior: Volume I for Fire Managers
Weather Service), John Saltenberger (Fire Weather
Services Program Manager, Northwest Geographic
Area Coordination Center) and Julia Rutherford
(National Weather Service).
Acknowledgments
The Extreme Fire Behavior synthesis was funded by the
Joint Fire Science Program (JFSP) Project Number 09-201-11 and a contribution from Project Number 09-S-03-1.
The following individuals reviewed the entire manuscript
and provided insightful comments: Don Haines (U.S. Forest
Service, retired), Robert Ziel (Program Coordinator, Lake
States Fire Science Consortium) and John Snook (Fire
Weather/Predictive Services Program Manager, Northern
California Geographic Area Coordination Center).
Each chapter was also peer reviewed, and we wish
to acknowledge those individuals for their comments that
significantly improved the document. Listed below are the
chapter reviewers:
•
•
Effects of Complex Terrain—Tom Rolinski (Fire
Weather Program Manager, Southern California
Geographic Area Coordination Center) and Kenn
McCarty (California Department of Forestry and
Fire Protection).
Critical Fire Weather Patterns—Rick Ochoa
(National Interagency Fire Center Predictive
Services, retired), Heath Hockenberry (National
•
Fire Interactions and Mass Fires—Two anonymous
reviewers.
•
Column/Plume Dynamics and Spot Fires—Joseph
J. Charney (U.S. Forest Service, Northern Research
Station) and Don Haines (U.S. Forest Service, retired)
for plume section; Nicholas Gellie (Australian Fire
Behavior Analyst) and Marty Alexander (Alberta
School of Forest Science and Management, University
of Alberta, Edmonton, Canada) for spotting section.
•
Vortices and Wildland Fire—Don Haines and two
anonymous reviewers.
•
Crown Fire—Dave Thomas (U.S. Forest Service,
retired), Philip Omi (Professor Emeritus, Colorado
State University), C. Hoffman (University of Idaho)
and J. Kern (Florida Division of Forestry).
The authors also thank Victoria Werth for her help in
writing the final document summary and to Victoria Werth
and Lynn Sullivan for editing and formatting the manuscript in preparation for publication.
Unit Conversion Factorsa
SI unit
Multiplication factor
English unit
Inverse factor
Degrees Celsius (°C)
Hectares (ha)
Kilograms (kg)
Kilograms per cubic
5/9 (°F - 32)
2.47
2.205
0.624
= Degrees Fahrenheit (°F)
= Acres (ac)
= Pounds (lb)
= Pounds per cubic foot (lb/ft3)
(9/5 °C) + 32
0.405
0.454
16.0
meter (kg/m3)
Kilograms per square
0.205
meter (kg/m2)
Kilograms per second
737.463
per square meter
(kg sec-1 m-2)
Kilograms per square 4.46
2
meter (kg/m )
Hectopascals (hPa)
0.0145
= Pounds per square foot (lb/ft2)
4.88
= Pounds per hour per square
foot (lb hr-1.ft2)
0.001356
Tons per acre (t/ac)
0.224
= Pounds per square inch (lb/in 2)
143
68.94
GENERAL TECHNICAL REPORT PNW-GTR-854
SI unit
Multiplication factor
Kilojoules per kilogram
0.430
(kJ/kg)
Kilometers (km)
0.621
Kilometers per hour
0.621
(km/h)
Kilowatts per meter
0.289
(kW/m)
Megawatts (MW)
56,869
Centimeters (cm)
0.394
Meters (m)
3.28
Square meters (m 2)
10.764
Meters per minute
(m/min)
Meters per minute
(m/min)
Meters per second (m/s)
Number per hectare
(No./ha)
Square meters per
hectare (m2/ha)
English unit
British thermal units per
pound (BTU/lb)
= Miles (mi)
= Miles per hour (mi/h)
Inverse factor
2.32
1.61
1.61
= BTUs per second per foot
(BTU/s-ft)
= BTUs per minute (BTU/min)
Inches
Feet (ft)
3.46
3.28
= Square feet
Feet per minute (ft/min)
0.0929
0.305
2.98
= Chains per hour (ch/h)
0.335
3.28
0.405
= Feet per second (ft/s)
= Number per acre (No./ac)
0.305
2.47
4.36
= Square feet per acre (ft2/ac)
0.230
a
0.0000176
2.54
0.305
Factors are given to three significant digits. To convert an English unit to a Standard Inernationad Unites (SI) unit, multiply by the
inverse factor given in the right-hand column.
Common and Scientific Namesa
Common name
Douglas-fir
Eucalyptus
Jack pine
Lodgepole pine
Ponderosa pine
Red pine
Sand pine
Singleleaf pinyon
Utah juniper
White pine
Spruce
a
Scientific name
Pseudotsuga menziesii (Mirb.) Franco
Eucalyptus spp.
Pinus banksiana Lamb.
Pinus contorta Douglas ex. Louden
Pinus ponderosa C. Lawson
Pinus resinosa Aiton
Pinus clausa (Chapm. ex Engelm.)
Vasey ex Sarg.
Pinus monophylla Torr. & Frém.
Juniperus osteosperma (Torr.) Little
Pinus strobus L.
Picea spp.
Source: USDA NRCS 2008.
144
Synthesis of Knowledge of Extreme Fire Behavior: Volume I for Fire Managers
Pacific Northwest Research Station
Web site
Telephone
Publication requests
FAX E-mail
Mailing address
http://www.fs.fed.us/pnw
(503) 808-2592
(503) 808-2138
(503) 808-2130
[email protected]
Publications Distribution
Pacific Northwest Research Station
P.O. Box 3890
Portland, OR 97208-3890
145
GENERAL TECHNICAL REPORT PNW-GTR-854
U.S. Department of Agriculture
Pacific Northwest Research Station
333 SW First Avenue
P.O. Box 3890
Portland, OR 97208-3890
Official Business
Penalty for Private Use, $300
146


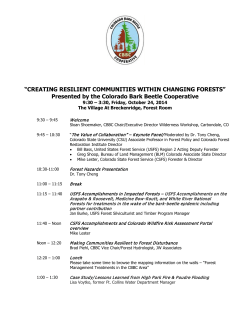
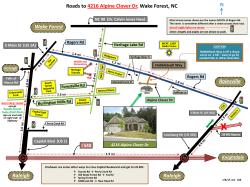
© Copyright 2026