
I Know What Your Packet Did Last Hop: Using Packet
I Know What Your Packet Did Last Hop: Using
Packet Histories to Troubleshoot Networks
Nikhil Handigol, Brandon Heller, Vimalkumar Jeyakumar, David Mazières,
and Nick McKeown, Stanford University
https://www.usenix.org/conference/nsdi14/technical-sessions/presentation/handigol
This paper is included in the Proceedings of the
11th USENIX Symposium on Networked Systems
Design and Implementation (NSDI ’14).
April 2–4, 2014 • Seattle, WA, USA
ISBN 978-1-931971-09-6
Open access to the Proceedings of the
11th USENIX Symposium on
Networked Systems Design and
Implementation (NSDI ’14)
is sponsored by USENIX
I Know What Your Packet Did Last Hop:
Using Packet Histories to Troubleshoot Networks
Nikhil Handigol† , Brandon Heller† , Vimalkumar Jeyakumar† , David Mazi`eres, Nick McKeown
{nikhilh,brandonh}@cs.stanford.edu, {jvimal,nickm}@stanford.edu, http: // www. scs. stanford. edu/ ~ dm/ addr/
Stanford University, Stanford, CA USA
† These authors contributed equally to this work
Abstract
1. “Host A cannot talk to Host B. Show me where
packets from A intended for B are going, along
with any header modifications.”
The complexity of networks has outpaced our
tools to debug them; today, administrators use manual tools to diagnose problems. In this paper, we
show how packet histories—the full stories of every
packet’s journey through the network—can simplify
network diagnosis. To demonstrate the usefulness
of packet histories and the practical feasibility of
constructing them, we built NetSight, an extensible
platform that captures packet histories and enables
applications to concisely and flexibly retrieve packet
histories of interest. Atop NetSight, we built four
applications that illustrate its flexibility: an interactive network debugger, a live invariant monitor,
a path-aware history logger, and a hierarchical network profiler. On a single modern multi-core server,
NetSight can process packet histories for the traffic of multiple 10 Gb/s links. For larger networks,
NetSight scales linearly with additional servers and
scales even further with straightforward additions to
hardware- and hypervisor-based switches.
1
2. “I don’t want forwarding loops in my network,
even transient ones. Show me every packet that
passes the same switch twice.”
3. “Some hosts are failing to grab IP addresses.
Show me where DHCP traffic is going in the
network.”
4. “One port is experiencing congestion. Show me
the traffic sources causing the congestion.”
Today, we cannot “just ask” these questions. Our
network diagnosis tools either provide no way to
pose such a question, or lack access to the information needed to provide a useful answer. But, these
questions could be answered with an omniscient view
of every packet’s journey through the network. We
call this notion a packet history. More specifically,
Definition A packet history is the route a packet
takes through a network plus the switch state and
header modifications it encounters at each hop.
Introduction
A single packet history can be the “smoking gun”
that reveals why, how, and where a network failed,
evidence that would otherwise remain hidden in gigabytes of message logs, flow records [8, 34], and
packet dumps [15, 18, 32].
Using this construct, it becomes possible to build
network analysis programs to diagnose problems.
We built four such applications: (1) ndb, an interactive network debugger, (2) netwatch, a live network invariant monitor, (3) netshark, a networkwide packet history logger, and (4) nprof, a hierarchical network profiler. The problems described
above are a small sample from the set of problems
these applications can help solve.
These four applications run on top of a prototype
platform we built, called NetSight. With a view of
Operating networks is hard. When networks go
down, administrators have only a rudimentary set of
tools at their disposal (traceroute, ping, SNMP, NetFlow, sFlow) to track down the root cause of the outage. This debugging toolkit has remained essentially
unchanged, despite an increase in distributed protocols that modify network state. Network administrators have become “masters of complexity” [40]
who use their skill and experience to divine the root
cause of each bug. Humans are involved almost every time something goes wrong, and we are still far
from an era of automated troubleshooting.
We could easily diagnose many network problems
if we could ask the network about suspect traffic and
receive an immediate answer. For example:
1
USENIX Association 11th USENIX Symposium on Networked Systems Design and Implementation 71
packet [dl_src: 0x123, ...]:
switch 1: { inport: p0, outports: [p1]
mods: [dl_dst -> 0x345]
matched flow: 23 [...]
matched table version: 3 }
switch 2: { inport: p0, outports: [p2]
mods: []
matched flow: 11 [...]
matched table version: 7 }
...
switch N: { inport: p0
table miss
matched table version: 8 }
every packet history in the network, NetSight supports both real-time and postmortem analysis. Applications use Packet History Filter, a regex-like language that we developed, to concisely specify paths,
switch state, and packet header fields for packet histories of interest. The fact that each application is
less than 200 lines of code demonstrates the power
of Packet History Filter in NetSight.
NetSight assembles packet histories using
postcards—event records created whenever a packet
traverses a switch. Each postcard contains a copy of
the packet header, the switch ID, the output ports,
and a version number for the switch forwarding
state. To generate postcards, our prototype transparently interposes on the control channel between
switches and controllers, and we have tested it with
both hardware and software OpenFlow switches.1
The challenge for any system offering packet histories is to efficiently and scalably process a stream
of postcards into archived, queryable packet histories. Surprisingly, a single NetSight server suffices
to assemble and store packet histories from packet
headers collected at each hop, for every packet that
crosses 14 routers in the Stanford backbone network. To support larger networks, NetSight scales
out on general-purpose servers—increasing its assembly, query, and storage capabilities linearly with
the number of processing cores, servers, and disks.
To scale further to bandwidth-heavy enterprise and
data center networks, we present two additional NetSight variants. NetSight-SwitchAssist proposes new
switch hardware changes to reduce postcard bandwidth, while NetSight-HostAssist spreads postcard
and history processing among virtualized servers. In
contrast to the na¨ıve method of collecting packet
headers that requires 31% bandwidth overhead in
the average case (§8), the SwitchAssist and HostAssist designs drastically reduce the bandwidth overhead to 7% and 3%, respectively (§8).
To summarize, our contributions include:
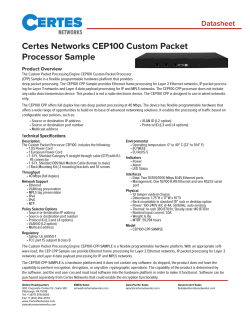
Figure 1: A packet history shows the path taken by a packet
along with the modifications and switch state encountered
by it at each hop.
pothetical packets, NetSight shows the actual forwarding behavior of real packets. NetSight makes no
assumptions about the correctness of network control software. However, it assumes that the hardware correctly forwards postcards to the NetSight
server(s). If it doesn’t, NetSight can flag it as a hardware error, but the information might not be helpful
in accurately homing in on the root cause. Thus,
NetSight helps network operators, control program
developers, and switch implementers to discover and
fix errors in firmware or control protocols that cause
network elements to behave in unexpected ways.
The source code of our NetSight prototype is publicly available with a permissive license [1]. We encourage the readers to download, use, extend, and
contribute to the codebase.
2
Motivating Packet Histories
In this section, we define packet histories, show an
example, note their challenges, and describe where
Software-Defined Networking (SDN) can help.
Packet History Definition. A packet history
tells the full story of a packet’s journey through the
network. More precisely, a packet history describes:
• what the packet looked like as it entered the
network (headers)
• Language: Packet History Filter concisely represents packet histories of interest. (§3)
• where the packet was forwarded (switches +
ports)
• Applications: a suite of network diagnosis
apps built atop the NetSight API. (§4)
• how it was changed (header modifications)
• why it was forwarded that way (matched
flow/actions + flow table).
Figure 1 shows an example packet history.
Why Packet Histories? Put simply, packet histories provide direct evidence to diagnose network
problems. For example, consider a WiFi handover
problem we recently encountered [26]. To diagnose
the problem, our network admins started with pings.
Then they collected and manually inspected forwarding rules. Then they visually parsed control
• Platform:
the design (§5), implementation (§6), and evaluation (§7) of NetSight.
• A discussion of the two other designs, NetSightSwitchAssist and NetSight-HostAssist (§8).
This method of network analysis complements
techniques that model network behavior [23, 24].
Rather than predict the forwarding behavior of hy1 Our
prototype uses OpenFlow but the design does not require it.
2
72 11th USENIX Symposium on Networked Systems Design and Implementation USENIX Association
3
plane logs, looking for the problem. After hours of
debugging, they diagnosed the (surprisingly simple)
cause: upon handover to a new AP, forwarding rules
in the upstream wired switch were improperly updated, sending incoming packets to the original AP.
The NetSight API
NetSight exposes an API for applications to specify, receive, and act upon packet histories of interest. NetSight provides a regular-expression-like
language—Packet History Filter (PHF)—to express
interest in packet histories with specific trajectories,
encountered switch state, and header fields. The
main function of the NetSight API is:2
add_filter(packet_history_filter, callback)
For every packet history matching the PHF
packet_history_filter , the callback function is
called along with the complete packet history.
Postcard Filters. The atomic element in a
PHF is the postcard filter (PF). A PF is a filter
to match a packet at a hop. Syntactically, a PF
is a conjunction of filters on various qualifiers:
packet headers, switch ID (known as datapath ID,
or dpid), input port, output port, and the switch
state encountered by the packet (referenced by a
“version” as described in §5). A PF is written as
follows:
--bpf [not] <BPF> --dpid [not] <switch ID>
--inport [not] <input port> --outport [not]
<output port> --version [not] <version>
where, <BPF> is a Berkeley Packet Filter [30] expression. The nots are optional and negate matches. A
PF must have at least one of the above qualifiers.
For example, a PF for a packet with source IP A,
entering switch S at any input port other than port
P is written as:
--bpf "ip src A" --dpid S --inport not P.
Packet History Filter Examples. A PHF is a
regular expression built with PFs, where each PF is
enclosed within double braces. The following sample
PHFs use X and Y as PFs to match packets that:
Instead, our admins might simply ask NetSight:
“Show me all packet histories for packets to the
client when the handover occurred.” Each history
would have shown a packet going to the wrong AP
along with the upstream flow table state that caused
the error, enabling an immediate diagnosis.
This example shows how just one packet history
can single-handedly confirm or disprove a hypothesis
about a network problem, by showing events that
actually transpired in the network, along with all
relevant state. Access to the stream of all packet
histories enables diagnostics that would otherwise
be impractical, time-consuming, or impossible for a
network administrator using conventional tools.
Challenges. Generating, archiving, and querying packet histories in operational networks requires:
(1) Path Visibility: we must somehow view and
record the paths taken by every packet.
(2) State Visibility: we must reconstruct the exact switch state encountered at each packet hop.
(3) Modification Visibility: we must know
where and how each packet has changed.
(4) Collection Scale: all of the above must run
at the maximum observed traffic rate.
(5) Storage Scale: querying histories requires
storing everything, for some time.
(6) Processing Scale: query processing should
keep up with collection and storage.
Observing switch states from an external vantage point, by either logging the control messages
or querying the switches for their state, will not
guarantee precise state-packet correlation. The only
place where packets can be correlated with the exact
switch state is the data plane itself [20].
• start at X: ^{{X}}
Opportunities with SDN. SDN offers a path
to the correlated visibility we need: logically centralized control provides a natural location to modify forwarding rules, while a common representation of switch state enables us to reason about any
changes. Later, in §6, we show how to precisely correlate packets with the state used to forward them.
We solve the remaining scale concerns with careful
system architecture, aggressive packet header compression, and an optimized implementation. Next,
we describe our API for specifying packet histories.
• experience a loop: (.).*(\1)
• end at X: {{X}}$
• go through X: {{X}}
• go through X, and later Y: {{X}}.*{{Y}}
• start at X, never reach Y: ^{{X}}[^{{Y}}]*$
4
Applications
The ability to specify and receive packet histories
of interest enables new network-diagnosis applications. This section demonstrates the utility of the
NetSight API by presenting the four applications we
built upon it.
2 The
other important function is delete_filter.
3
USENIX Association 11th USENIX Symposium on Networked Systems Design and Implementation 73
4.1
4.2
ndb: Interactive Network Debugger
netwatch: Live Invariant Monitor
The second application is netwatch, a live network
invariant monitor. netwatch allows the operator to
specify desired network behavior in the form of invariants, and triggers alarms whenever a packet violates any invariant (e.g., freedom from traffic loops).
netwatch is a library of invariants written using
PHFs to match packets that violate those invariants. Once PHFs are pushed to NetSight, the callback returns the packet history that violated the invariant(s). The callback not only notifies the operator of an invariant violation, but the PHF provides
useful context around why it happened. netwatch
currently supports the following network invariants:
Isolation: Hosts in group A should not be able
to communicate with hosts in group B. Raise an
alarm whenever this condition is violated. The function isolation(a_host_set, b_host_set, topo)
pushes down two PHFs:
^{{ GroupA }}.*{{ GroupB }}$
^{{ GroupB }}.*{{ GroupA }}$
GroupA and GroupB can be described by a set of
host IP addresses or by network locations (switch,
port) of hosts. This PHF matches packets that are
routed from GroupA to GroupB.
Loop Freedom: The network should have no
traffic loops. The function loop_freedom() pushes
down one PHF: (.).*(\1)
Waypoint routing: Certain types of traffic
should go through specific waypoints. For example, all HTTP traffic should go through the
proxy, or guest traffic should go through the IDS
and Firewall. The function waypoint_routing(
traffic_class, waypoint_id) installs a PHF of
the form: {{--bpf "traffic_class" --dpid not
"waypoint_id"}}{{--dpid not "waypoint_id
"}}*$
This PHF catches packet histories of packets that
belong to traffic_class and never go through the
specified waypoint.
Max-path-length: No path should ever exceed
a specified maximum length, such as the diameter
of the network. The function max_path_length(n)
installs a PHF of the form: .{n+1}
This PHF catches all paths whose lengths exceed n.
The original motivating application for NetSight is
ndb, an interactive network debugger. The goal of
ndb is to provide interactive debugging features for
networks, analogous to those provided by gdb for
software programs. Using ndb, network application
developers can set PHFs on errant network behavior.
Whenever these occur, the returned packet histories
will contain the sequence of switch forwarding events
that led to the errant behavior, helping to diagnose
common bugs like the following:
Reachability Error: Suppose host A is unable
to reach host B. Using ndb, the developer would
use a PHF to specify packets from A destined for B
that never reach the intended final hop:
^{{--bpf "ip src A and dst B" --dpid X -inport p1}}[^{{--dpid Y --outport p2}}]*$
where, (X, p1) and (Y, p2) are the (switch, port)
tuples at which hosts A and B are attached. Recall
that the regular expression ‘^X’ matches any string
that starts with character X, but ‘[^X]’ matches any
character except ‘X’. Thus, the above PHF matches
all packet histories with (source,destination)-IP
addresses (A,B) that start at (X,p1) but never
traverse (Y,p2).
Race condition: A controller may insert new
flow entries on multiple switches in response to network events such as link failures or new flow arrivals. If a controller’s flow entry insertions are delayed, packets can get dropped, or the controller
can get spurious ‘packet-in’ notifications. To query
such events, NetSight inserts a forwarding rule at
the lowest priority in all switches at switch initialization time. This rule generates postcards and performs the default action (by sending to either outport NULL that would drop the packet, or to outport CONTROLLER that would send the packet to
the controller). Since this rule is hit only when there
is no other matching flow entry, the following PHF
captures such events, by matching on packet histories that do not match any flow entry at switch X:
{{--dpid X --outport NULL}}$
Incorrect packet modification: Networks with
many nodes and rules can make it difficult to see
where and why errant packet modifications occurred.
Packets reaching the destination with unexpected
headers can be captured by the following PHF:
^{{--bpf "BPF1"}}.*{{--bpf "BPF2"}}$
Where BPF1 matches the packet when it enters the
network and BPF2 matches the modified packet when
it reached the destination.
4.3
netshark: Network-wide Path-Aware
Packet Logger
The third application is netshark, a wireshark-like
application that enables users to set filters on the
entire history of packets, including their paths and
header values at each hop. For example, a user could
look for all HTTP packets with src IP A and dst IP
4
74 11th USENIX Symposium on Networked Systems Design and Implementation USENIX Association
B arriving at (switch X, port p) that have also traversed through switch Y. netshark accepts PHFs
from the user, returns the collected packet histories
matching the query, and includes a wireshark dissector to analyze the results. The user can then view
properties of a packet at a hop (packet header values, switch ID, input port, output port, and matched
flow table version) as well as properties of the packet
history to which it belongs (path, path length, etc.).
4.4
Network Apps
network
admin
Control Plane
Postcard
Control
Postcard
Generation
Element
Generation
nprof: Hierarchical Network Profiler
The fourth application is nprof, a hierarchical network profiler. The goal of nprof is to ‘profile’ any
collection of network links to understand the traffic
characteristics and routing decisions that contribute
to link utilization. For example, to profile a particular link, nprof first pushes a PHF specifying the
link of interest:
{{--dpid X --outport p}}
nprof combines the resulting packet histories with
the topology information to provide a live hierarchical profile, showing which switches are sourcing
traffic to the link, and how much. The profile tree
can be further expanded to show which particular
flow entries in those switches are responsible.
nprof can be used to not only identify end hosts
(or applications) that are congesting links of interest, but also identify how a subset of traffic is being routed across the network. This information can
suggest better ways to distribute traffic in the network, or show packet headers that cause uneven load
distributions on routing mechanisms such as equalcost or weighted-cost multi-path.
5
packets
Postcard
Postcard
Forwarding
Generation
Generation
Element
forwarding
state
changes
postcards
Data Plane
ndb
netwatch
netshark
nprof
NetSight
API
NetSight
Coordinator
Postcard
NetSight
Postcard
Generation
Servers
Generation
History Plane
Figure 2: NetSight architecture.
ing and storage steps for a moderately-sized network
like the Stanford University backbone network on a
single server. For networks with higher aggregate
bandwidths, processing capabilities increase linearly
with the number of servers.
5.1
NetSight Philosophy
NetSight assembles packet histories using postcards,
event records sent out whenever a packet traverses
a switch. This approach decouples the fate of the
postcard from the original packet, helping to troubleshoot packets lost down the road, unlike approaches that append to the original packet. Each
postcard contains the packet header, switch ID, output port, and current version of the switch state.
Combining topology information with the postcards
generated by a packet, we can reconstruct the complete packet history: the exact path taken by the
packet along with the state and header modifications
encountered by it at each hop along the path.
We first explain how NetSight works in the common case, where: (1) the network does not drop
postcards, (2) the network does not modify packets,
and (3) packets are all unicast. Then, in §5.4, we
show how NetSight handles these edge cases.
How NetSight Works
In this section, we present NetSight, a platform to
realize the collection, storage, and filtering of all
packet histories, upon which one can build a range
of applications to troubleshoot networks.
The astute reader is likely to doubt the scalability
of any system that attempts to store every header
traversing a network, along with its corresponding
path, state, and modifications, as well as apply complex filters. This is a lot of data to forward, let alone
process and archive.
Hence, NetSight is designed from the beginning to
scale out and see linear improvements with increasing numbers of servers. The design implements all
software processing, such as table lookups, compression operations, and querying, in ways that are simple enough to enable hardware implementations. As
an existence proof that such a system is indeed feasible, the implementation described in §6 and evaluated in §7 can perform all packet history process-
5.2
System Architecture
Figure 2 sketches the architectural components of
NetSight. NetSight employs a central coordinator to
manage multiple workers (called NetSight servers).
NetSight applications issue PHF-based triggers and
queries to the coordinator, which then returns a
stream or batch of matching packet histories. The
coordinator sets up the transmission of postcards
from switches to NetSight servers and the transmission of state change records from the network control plane to the coordinator. Finally, the coordi5
USENIX Association 11th USENIX Symposium on Networked Systems Design and Implementation 75
data
headers
packets
switch,
ports
{pcard}
{pcard}
{pcard}
{pcard}
headers
version
switch
outport
headers
state
headers
state
switch,
ports
headers
state
compressed
packet
histories
compressed
postcard
lists
postcards
switch,
ports
shuffle
stage
Postcard
Processing
all postcards from
a switch
hash based
on flow key
(5-tuple)
d disks
...
...
Postcard
Generation
n servers
n servers
...
...
s switches
History
Processing
all postcards
for a flow
Figure 3: Processing flow used in NetSight to turn packets into packet histories across multiple servers.
nator performs periodic liveness checks, broadcasts
queries and triggers, and communicates topology information for the workers to use when assembling
packet histories.
5.3
packet histories, NetSight needs to collect all postcards corresponding to a single packet at a single
server. To scale processing, NetSight needs to ensure that these groups of postcards are load balanced
across servers. NetSight achieves this by shuffling
postcards between NetSight servers, using a hash on
the flow ID (5-tuple) to ensure postcard locality.
Postcard shuffling is batched into time-based
“rounds.” At the end of a round, servers send postcards collected during the round to their final destination, where the corresponding packet histories can
be assembled and archived. This stage provides an
opportunity to compress postcard data before shuffling, by exploiting the redundancy of header values,
both within a flow, and between flows. Section 6
details NetSight’s fast network-specific compression
technique to reduce network bandwidth usage.
History Assembly. Goal: to assemble packet
histories from out-of-order postcards. Packet histories must be ordered, but postcards can arrive
out-of-order due to varying propagation and queuing
delays from switches to NetSight servers. NetSight
uses topology information, rather than fine-grained
timestamps, to place postcards in order.
When a NetSight server has received the complete
round of postcards from every other server, it decompresses and merges each one into the Path Table, a
data structure that helps combine all postcards for
a single packet into a group. To identify all postcards corresponding to a packet, NetSight combines
immutable header fields such as IP ID, fragment offset, and TCP sequence number fields into a “packet
ID,” which uniquely identifies a packet within a flow.
To evaluate the strategy of using immutable header
fields to identify packets, we analyzed a 400k-packet
Life Of a Postcard
NetSight turns postcards into packet histories. To
explain this process, we now follow the steps performed inside a NetSight server, shown in Figure 3.
Postcard Generation. Goal: record all information relevant to a forwarding event and send for
analysis. As a packet enters a switch, the switch
creates a postcard by duplicating the packet, truncating it to the minimum packet size, marking it
with relevant state, and forwarding it to a NetSight
server. The marked state includes the switch ID,
the output port to which this packet is about to be
forwarded, and a version ID representing the exact
state of this switch when the packet was forwarded.
The original packet remains untouched and continues on its way. Switches today already perform
similar packet duplication actions to divert packets
for monitoring (e.g. RSPAN [7] and sFlow). Postcard generation should be much faster than normal
packet forwarding, because it does not require any
expensive IP lookups. It requires encapsulating the
packet to a known port and duplicating the packet
output; both of these are cheap operations relative
to typical IP lookups. Newer switches [17] also support hardware-accelerated encapsulation for tunneling traffic at line-rate (e.g., MPLS, GRE, VXLAN,
etc.).
Postcard Collection. Goal: to send all postcards for a packet to one server, so that its packet
history can be assembled. In order to reconstruct
6
76 11th USENIX Symposium on Networked Systems Design and Implementation USENIX Association
trace of enterprise packet headers [28]. Nearly 11.3%
of packets were indistinguishable from at least one
other packet within a one-second time window. On
closer inspection, we found that these were mostly
UDP packets with IPID 0 generated by an NFS
server. Ignoring these UDP packets removed all
IP packet ambiguity, leaving only seven ambiguous
ARPs. This initial analysis suggests that most of the
packets have enough entropy in their header fields to
be uniquely identified. The Path Table is simply a
hash table indexed by packet ID, where values are
lists of corresponding postcards.
The NetSight server extracts these postcard
groups, one-at-a-time, to assemble them into packet
histories. For each group, NetSight then performs a
topological sort, using switch IDs and output ports,
along with topology data.3 The resulting sorted list
of postcards is the packet history.
Filter triggers. Goal: to immediately notify applications of fresh packet histories matching a preinstalled PHF. Once the packet history is assembled, NetSight matches it against any “live” PHFs
pre-installed by applications such as netwatch, and
immediately triggers notifications back to the application on a successful match.
History archival. Goal: to efficiently store the
full set of packet histories. Next, the stream of
packet histories generated in each round is written to
a file. NetSight compresses these records using the
same compression algorithm that is used before the
shuffle phase to exploit redundancy between postcards of a packet and between packets of a flow.
Historical queries. Goal: to enable applications
to issue PHF queries against archived packet histories. When an application issues a historical PHF
query to a specified time region, that query runs in
parallel on all NetSight servers. Compression helps
to improve effective disk throughput here, and hence
reduces query completion times.4
5.4
tories to the user, who can often resolve the omission by using the topology information and filling
the missing postcards.5 Out-of-band control links
and highest-priority queues for postcards can help
to minimize postcard drops.
Non-unicast Packets. For broadcast and multicast traffic, NetSight returns packet histories as directed graphs, rather than lists. For loops, NetSight
returns the packet history with an arbitrary starting
point and marks it as a loop.
Modified Packets. When Network Address
Translation (NAT) boxes modify the header fields in
the flow key, the postcards for one packet may arrive
at different NetSight servers, preventing complete
packet history assembly. Using immutable headers
or hashes of packet contents in the shuffle phase
would ensure that all postcards for one packet arrive at the same server.6 However, with such keys,
packet histories of packets belonging to a single flow
will be evenly spread among servers, reducing opportunities for storage compression: each of n servers
will see packet histories of 1/n-th of the packets of
each flow.
Adding a second shuffle stage can ensure both correctness and storage efficiency. In the first stage,
packet histories are shuffled for assembly using their
packet ID, while in the second stage, they are shuffled for storage using a hash of the 5-tuple flow key
of their first packet. The reduced storage comes at
a cost of additional network traffic and processing.
6
NetSight Implementation
Our NetSight implementation has two processes:
one interposes between an OpenFlow controller and
its switches to record configuration changes, while
another does all postcard and history processing. To
verify that it operates correctly on physical switches,
we ran it on a chain topology of 6 NEC IP8800
switches [31]. To verify that it ran with unmodified
controllers, we tested it on the Mininet emulation environment [27] with multiple controllers (OpenFlow
reference, NOX [19], POX [35], RipL-POX [36]) on
multiple topologies (chains, trees, and fat trees).
This section describes the individual pieces of our
prototype, which implements all postcard and history processing in C++ and implements the control
channel proxy in Python.
Relaxing the Assumptions
We now describe how NetSight handles corner cases.
Dropped Postcards. When postcard drops occur (e.g., due to congestion), packet histories become incomplete, causing NetSight to return errantly matched histories as well as to miss histories
that should have matched the installed PHFs. NetSight delegates the responsibility for handling these
events to apps. For example, ndb returns partial his-
6.1
Postcard Generation
The NetSight prototype is for SDN, leveraging the
fact that network state changes are coordinated by
3 In
the current implementation the topology data needs to be externally fed into NetSight. Alternatively, with the SDN implementation
described in §6, the proxy can dynamically learn the topology.
4 Ideally the filesystem is log-structured, to restore individual rounds
at the full disk throughput, with minimal seeking [37].
5 These can indicate an unexpected switch configuration too, as we
saw the first time using NetSight on a network (§6.4).
6 That is, if middleboxes don’t mess with packet contents.
7
USENIX Association 11th USENIX Symposium on Networked Systems Design and Implementation 77
a controller. This provides an ideal place to monitor and intercept switch configuration changes. It
uses a transparent proxy called the flow table state
recorder (recorder for short) that sits on the control
path between the controller and OpenFlow switches.
When a controller modifies flow tables on a switch,
the recorder intercepts the message and stores it in a
database. For each OpenFlow rule sent by the controller to the switch, the recorder appends new actions to generate a postcard for each packet matching the rule in addition to the controller-specified
forwarding.
Specifically, the actions create a copy of the packet
and tag it with the switch ID,7 the output port, and
a version number for the matching flow entry. The
version number is simply a counter that is incremented for every flow modification message. The
tag values overwrite the original destination MAC
address (the original packet header is otherwise unchanged). Once assembled, postcards are sent to
a NetSight server over a separate VLAN. Postcard
forwarding can be handled out-of-band via a separate network, or in-band over the regular network;
both methods are supported. In the in-band mode,
switches recognize postcards using a special VLAN
tag to avoid generating postcards for postcards.
6.2
eralization of Van Jacobson’s compression of TCP
packets over slow links [21].
6.3
PHF Matching
The PHF matching engine in NetSight is based on
the RE1 regex engine [9] and uses the Linux x86 BPF
compiler [5] to match packet headers against BPF
filters. RE1 compiles a subset (concatenation, alternation and the Kleene star) of regular expressions
into byte codes. This byte code implements a Nondeterministic Finite Automaton which RE1 executes
on an input string. In RE1, character matches trigger state machine transitions; we modify RE1 and
“overload” the character equality check to match
postcards against postcard filters.
6.4
Test Deployment Anecdote
NetSight helped to uncover a subtle bug during our
initial test deployment. While connectivity between
hosts seemed normal, the packet histories returned
by ndb for packets that should have passed through a
particular switch were consistently returned as two
partial paths on either side of the switch. These
packet histories provided all the context our administrator needed to immediately diagnose the problem: due to a misconfiguration, the switch was behaving like an unmanaged layer-2 switch, rather
than an OpenFlow switch as we intended.
With no apparent connectivity issues, this bug
would have gone unnoticed, and might have manifested later in a much less benign form, as forwarding
loops or security policy violations. This unexpected
debugging experience further highlights the power of
packet histories.
Compression
NetSight compresses postcards in two places: (1) before shuffling them to servers, and (2) before archiving assembled packet histories to disk. While we
can use off-the-shelf compression algorithms (such as
LZMA) to compress the stream of packets, we can do
better by leveraging the structure in packet headers
and the fact that all the packets in a flow—identified
by the 5-tuple flow id (srcip, dstip, srcport,
dstport, protocol)—look similar.
NetSight compresses packets by computing diffs
between successive packets in the same stream.
A diff is a (Header,Value) pair, where Header
uniquely identifies the field that changed and Value
is its new value. Certain fields (e.g. IPID and TCP
Sequence numbers) compress better if we just store
the successive deltas. Compression works as follows: the first packet of each flow is stored verbatim. Subsequent packets are only encoded as the
(Header,Value) tuples that change, with a backreference to the previous packet in the same stream.
Finally, NetSight pipes the stream of encoded diffs
through a standard fast compression algorithm (e.g.
gzip at level 1). Our compression algorithm is a gen-
7
Evaluation
This section quantifies the performance of the serverside mechanisms that comprise NetSight, to investigate the feasibility of collecting and storing every
packet history. From measurements of each step, including compression, assembly, and filtering, we can
determine the data rate that a single core can handle. For switch-side mechanisms and scaling them,
skip to §8.
7.1
Compression
NetSight compresses postcards before the shuffle
phase to reduce network bandwidth, then compresses packet histories again during the archival
phase to reduce storage costs. We investigate three
questions:
Compression: how tightly can NetSight compress
packet headers, and how does this compare to offthe-shelf options?
7 To
fit into the limited tag space, NetSight uses a locally created
“pseudo switch ID” (PSID) and maintains an internal mapping from
the 8 B datapath ID to the PSID.
8
78 11th USENIX Symposium on Networked Systems Design and Implementation USENIX Association
Compression Type
Wire
PCAP
gzip
NetSight (NS)
NetSight +
(NS+GZ)
gzip
Description
Raw packets on the wire
All IP packets, truncated up to
Layer-4 headers
PCAP compressed by gzip level 6
Van Jacobson-style compression
for all IP 5-tuples
Compress packet differences with
gzip level 1
Table 1: Compression techniques.
Speed: how expensive are the compression and decompression routines, and what are their time vs.
size tradeoffs?
Duration: how does the round length (time between data snapshots) affect compression properties, and is there a sweet spot?
Figure 4: NetSight reduces storage relative to PCAP files, at
a low CPU cost. Combining NS with gzip (NS+GZ) reduces
the size better than gzip, at a fraction of gzip’s CPU costs.
The WAN traces compress less as we observe fewer packets
in a flow compared to other traces.
Traces. While we do not have a hardware implementation of the compression techniques, we answer
the performance questions using thirteen packet capture (pcap) data sets: one from a university enterprise network (UNIV), two from university data centers (DCs), and nine from a WAN. We preprocessed
all traces and removed all non-IPv4, non-TCP and
non-UDP packets, then stripped packet headers beyond the layer 4 TCP header, which accounted for
less than 1% of all traffic. UNIV is the largest trace,
containing 31 GB of packet headers collected over an
hour on a weekday afternoon. The average flow size
over the duration of this trace is 76 packets. The
data center traces DC1 and DC2 have average flow
sizes of about 29 and 333 packets per flow respectively. However, in the WAN traces, we observed
that flows, on average, have less than 3 packets over
the duration of the trace. We do not know why;
however, this extreme point stresses the efficiency of
the compression algorithm.
The UNIV trace contains packets seen at one core
router connecting Clemson University to the Internet. The data center traces—DC1 and DC2—are
from [4] whose IP addresses were anonymized using
SHA1 hash. And finally, each WAN trace (from [43])
accounts for a minute of packet data collected by
a hardware packet capture device. IP addresses in
this trace are anonymized using a CryptoPan prefixpreserving anonymization.
Storage vs CPU costs. Figure 4 answers many
of our performance questions, showing the tradeoff
between compression storage costs and CPU costs,
for different traces and compression methods. This
graph compares four candidate methods, listed in
Table 1: (a) PCAP: the uncompressed list packet
headers, (b) gzip compression directly on the pcap
file, (c) NS: the adaptation of Van Jacobson’s compression algorithm, (d) NS+GZ: output of (c) followed by gzip compression (level 1, fastest). Each
one is lossless with respect to headers; they recover
all header fields and timestamps and maintain the
packet ordering.
We find that all candidates reduce storage relative to PCAP files, by up to 4x, and as expected,
their CPU costs vary. GZ, an off-the-shelf option,
compresses well, but has a higher CPU cost than
both NS and NS+GZ, which leverage knowledge of
packet formats in their compression. NetSight uses
NS+GZ, because for every trace, it compresses better
than pure GZ, at a reasonably low CPU cost.
We also find that the compressed sizes depend
heavily on the average flow size of the trace. Most
of the benefits come from storing differences between
successive packets of a flow, and a smaller average
flow size reduces opportunities to compress. We see
this in the WAN traces, which have shorter flows
and compress less. Most of the flow entropy is in
a few fields such as IP identification, IP checksums
and TCP checksums, and the cost of storing diffs for
these fields is much lower than the cost of storing a
whole packet header.
To put these speeds in perspective, consider our
most challenging scenario, NS+GZ in the WAN,
shown by the blue stars. The average process time
per packet is 3.5µs, meaning that one of the many
cores in a modern CPU can process 285K postcards/sec. Assuming an average packet size of 600 bytes,
this translates to about 1.37 Gb/s of network traffic,
and this number scales linearly with the number of
cores. Moreover, the storage cost (for postcards) is
about 6.84 MB/s; a 1 TB disk array can store all
9
USENIX Association 11th USENIX Symposium on Networked Systems Design and Implementation 79
.*X
X.*X
X.*X.*X
Latency (us)
.*X.*
no-match
match
Figure 5: Packet compression quality for NS+GZ as a function of packets seen in the trace. In our traces from three
operating environments, we find that NetSight quickly benefits from compression after processing a few 100s of thousands of packets.
Scenario
CPU cost
per packet
Enterprise
0.725µs
WAN
0.434µs
Packet History Length
Figure 6: PHF matching latency microbenchmark for various sample PHFs and packet histories of increasing length.
Data Center
0.585µs
latencies, because the implementation loads the entire set of first packets and timestamps into memory
before iterating through the list of diff records. As
with compression, a small round timer would improve cache locality and use less memory.
Table 2: Decompression Speeds.
postcards for an entire day. The actual duration for
which postcards need to be stored depends on the
scenario and the organizational needs. For example, to troubleshoot routine network crashes whose
symptoms are usually instantly visible, storing a day
or two worth of postcards might suffice. On the
other hand, to troubleshoot security breaches, whose
effects might show up much later, postcards might
have to be stored for a longer period, say a week.
Most of this storage cost goes into storing the first
packet of a flow; as the number of packets per flow increases (e.g. in datacenter traces), the storage costs
reduce further.
Duration. A key parameter for NetSight is the
round length. Longer rounds present more opportunities for postcard compression, but increase the delay until the applications see matching packet histories. Smaller rounds reduce the size of the hash table
used to store flow keys in NS compression, speeding
up software implementations and making hardware
implementations easier. Figure 5 shows packet compression performance as a function of the number of
packets in a round. This graph suggests that short
rounds of 1000 packets see many of the compression
benefits, while long rounds of 1M postcards maximize them. On most lightly loaded 10Gb/s links, a
1M postcard round translates to about a second.
Decompression Speed. Table 2 shows NS+GZ
decompression costs for one trace from each of the
environments. In every case, NS+GZ decompression is significantly faster than compression. These
numbers underrepresent the achievable per-postcard
7.2
Packet History Assembly
At the end of the shuffle phase, each NetSight server
assembles packet histories by topologically sorting
received postcards, which may have arrived out-oforder. We measure the speed of our history assembly
module written in C++. Topological sorting is fast
– it runs in O(p), where p is the number of postcards
in the packet history, and typically, p will be small.
For typical packet history lengths (2 to 8 hops long in
each of the networks we observed) history assembly
takes less than 100 nanoseconds. In other words, a
single NetSight server can assemble more than 10
million packet histories per second per core.
7.3
Triggering and Query Processing
NetSight needs to match assembled packet histories
against PHFs, either on a live stream of packet histories or on an archive. In this section, we measure
the speed of packet history matching using both microbenchmarks and a macrobenchmark suite, looking for where matching might be slowest. The PHF
match latency depends on (1) the length of the
packet history, (2) the size and type of the PHF,
and (3) whether the packet history matches against
the PHF.
Microbenchmarks. Figure 6 shows the performance of our PHF implementation for sample PHFs
of varying size on packet histories of varying length.
The sample PHFs are of the type .*X, .*X.*, X.*X,
and X.*X.*X, where each X is a postcard filter and
10
80 11th USENIX Symposium on Networked Systems Design and Implementation USENIX Association
1.0
matching is embarrassingly parallel: each packet history can be matched against a PHF independent of
all other packet histories, enabling linear multi-core
scalability. A future optimized implementation can
also perform the matching directly on compressed
archives of packet histories, rather than on each individual packet history.
Latency (us)
0.8
0.6
0.4
h
Provisioning Scenario
At the beginning of this paper, we suggested a set
of questions, each of which maps to a filter in NetSight. With performance numbers for each piece of
NetSight, we can estimate the traffic rate it can handle to answer those questions.
Adding up the end-to-end processing costs in
NetSight – compressing, decompressing, assembling,
and filtering packets – yields a per-core throughput of 240K postcards/second. With five hops on
the typical path and 1000-byte packets, a single 16core server, available for under $2000, can handle
6.1 Gb/s of network traffic. This is approximately
the average rate of the transit traffic in our campus backbone. To handle the peak, a few additional
servers would suffice, and as the network grows, the
administrator can add servers knowing that NetSight will scale to handle the added demand.
The key takeaway is that NetSight is able to handle the load from an entire campus backbone with
20,000 users, with a small number of servers.
dc
_h
dr
-c
am
pu
s_
bo
t
7.4
pu
s_
hd
r
pu
s_
lo
c
am
hc
pu
s
ca
m
dc
ire
le
ss
w
ca
m
dc
_l
oc
-
dc
_b
ot
ho
st
ho
st
0.0
an
ip
y
-1
72
.1
ip
9.
-1
3.
30
83
.1
27
.1
20
.2
21
0.2
Figure 7: Representative results from the macrobenchmark
suite of queries run on the Clemson trace. The most expensive queries were those with complex BPF expressions.
contains filters on packet headers (BPF), switch ID,
and input ports. We match a large number of packet
histories against each PHF and calculate the average latency per match. In order to avoid any datacaching effects, we read the packet histories from a
6GB file, and we ignore the I/O latency incurred
while reading packet histories from the disk.
The dashed lines show the latency when the
packet history matches the PHF (“match”), while
the solid lines show the latency when the packet history does match the PHF (“no-match”). We see that
the “match” latencies are typically smaller than the
corresponding “non-match” latencies, since the code
can return as soon as a match is detected. We also
see that the match latency increases with the number of PFs in the PHF as well as the length of the
packet history. Importantly, the region of interest is
the bottom left corner – packet histories of length 2
to 8. Here, the match latency is low: a few hundred
nanoseconds.
Macrobenchmarks. The UNIV trace was captured at the core router connecting two large datacenters and 150 buildings to the Internet. We reconstruct packet histories for packets in this trace
using topology and subnet information. Then we
run a suite of 28 benchmark PHF queries which include filters on specific hosts, locations (datacenter,
campus and Internet), paths between locations, and
headers. Figure 7 shows the average PHF match
time (on a single CPU core) for a representative set
of queries on hosts, subnets (campus), and paths
(dc hdr–campus hdr). Most matches execute fast
(<300ns/match); the most expensive ones (900ns/match) are complex BPF queries that contain a predictate on 24 subnets.
The above results show that even an unoptimized
single-threaded implementation of PHF matching
can achieve high throughput. In addition, PHF
8
Scaling NetSight
If we do not compress postcards before sending them
over the network, we need to send them each as a
min-sized packet. We can calculate the bandwidth
cost as a fraction of the data traffic as:
cost =
postcard packet size
avg packet size
× avg number of hops.
The bandwidth cost is inversely proportional to
the average packet size in the network.
For example, consider our university campus
backbone with 14 internal routers connected by
10Gb/s links, two Internet-facing routers, a network diameter of 5 hops, and an average packet
size of 1031 bytes. If we assume postcards are
minimum-sized Ethernet packets, they increase traf64B
× 5(hops) = 31%.8
fic by 1031B
The average aggregate utilization in our university
backbone is about 5.9Gb/s, for which postcard traffic adds 1.8Gb/s. Adding together the peak traffic
seen at each campus router, we get 25Gb/s of packet
data, which will generate 7.8Gb/s of postcard traffic,
8 If
we overcome the min-size requirement by aggregating the 40
byte postcards into larger packets before sending them, the bandwidth
overhead reduces to 19%.
11
USENIX Association 11th USENIX Symposium on Networked Systems Design and Implementation 81
Hypervisors
NetSight
Dedicated Servers
Switches
packets
in a software switch such as Open vSwitch [33]) to
tag packets to help switches succinctly describe postcards. The shim tags each outgoing packet with a
sequentially-incrementing globally-unique packet ID
and locally stores the mapping between the ID and
the packet header. When a switch receives a packet,
it extracts the tag and generates a mini-postcard
that contains only the packet ID, the flow table state
and the input/output ports. This state is appended
to a hash table entry keyed by the source address
of this packet. Since a packet ID is valid only to a
particular host, the shim can use fewer bytes (e.g. 4
bytes) to uniquely identify a packet. When enough
bytes accumulate, the switch dispatches the hash entry (a list of packet IDs and state) to the source. At
the end of a round, the hosts locally assemble and
archive the packet history.
If on average, it takes 15 bytes per packet to store
compressed headers at the VM hosts (§7), and 6
bytes per mini-postcard, the bandwidth overhead to
collect postcards in the network reduces to 3%. This
number contrasts with 31% overhead when postcards are collected naively. Since each end host
stores packet histories for its own traffic, the mechanism scales with the number of hosts. If 3% is
still unacceptable, then NetSight may be deployed
for a subset of packets or a subset of switches. However, both of these options are qualitatively different;
either NetSight cannot guarantee that a requested
packet history will be available when ignoring some
packets, or NetSight cannot guarantee that each generated packet history will represent a packet’s complete path when not enabled network-wide.
To put things in perspective, while NetSight requires firmware modifications to expose existing
hardware functionality, NetSight-SwitchAssist and
NetSight-HostAssist require hardware modifications
in the switches. If our campus network (§7.4) were
to get upgraded to NetSight-SwitchAssist, one of
the expensive compression steps would go away and
yield a traffic processing rate of 7.3 Gb/s per server.
Adding NetSight-HostAssist would yield a rate of
55 Gb/s per server, because mini-postcards require
no compression or decompression. The processing
costs are heavily dominated by compression, and reducing these costs seems like a worthwhile future
direction to improve NetSight.
single postcards in
min-size packets
Postcard Generation
Postcard Processing
postcard lists
History Processing
NetSight-SwitchAssist
packets
Postcard Generation
Postcard Processing
(1) hash packet header
(2) append to postcard list
(3) compress lists
(4) send lists
History Processing
compressed
postcard lists
in max-size
packets
NetSight-HostAssist
packets
identity-marked packets
Mark Packet Identity
Identity Postcard Gen
History Processing
Postcard Generation
compressed
header
postcard lists
Postcard Processing
uncompressed (1) extract identity field
mini-postcard (2) append to postcard list
lists
(3) send lists
Figure 8: NetSight uses only dedicated servers, but
adding switch processing (-SwitchAssist) and VM servers
(-HostAssist) can reduce bandwidth costs and increase scalability. Postcard generation is common to all approaches.
yet can be handled by two NetSight servers (§7.4).
If the postcards are sent in-band, this extra traffic
may affect the network performance.
For a low-utilization network, especially test networks or production networks in the bring-up phase,
these bandwidth costs may be acceptable for the debugging functionality NetSight provides. But for a
live network with more hops, smaller packets, or
higher utilization, our NetSight may consume too
much network bandwidth. To scale NetSight to a
large data center or an enterprise, we present two
design modifications that reduce network bandwidth
by moving some of the processing into the switches
and end hosts, respectively.
NetSight-SwitchAssist, shown in the middle
of Figure 8, uses additional logic in the switches
to locally implement the Postcard Stage with compression, thus avoiding the extra network capacity
needed to transport uncompressed postcards to the
NetSight servers in minimum-size packets. Since
switches send compressed aggregates of postcards
to NetSight servers (rather than individual uncompressed postcards), the bandwidth requirement diminishes. For example, with a size of 15 bytes per
compressed postcard (as shown in §7), the bandwidth requirement reduces from 31% to 7%.
NetSight-HostAssist, shown at the bottom of
Figure 8, is suited for environments where end hosts
can be modified. This design reduces postcard traffic by using a thin shim layer at each end host (e.g.
9
Related Work
Commercial tools for troubleshooting networks provide visibility through packet sampling [8, 34], configurable packet duplication [15, 18, 32], or log analysis [42]. Most lack the network-wide visibility and
the packet-level state consistency provided by Net12
82 11th USENIX Symposium on Networked Systems Design and Implementation USENIX Association
fast processing of packet histories. X-Trace [16] is
a tracing framework that helps in debugging general
distributed systems by tracing tasks across different administrative domains. While similar in spirit,
NetSight takes a different approach to address statecorrelation and scalability challenges specific to tracing, storing, and querying packet histories.
Sight. cPacket Networks has a commercial product
that offers a central view with a grep-based interface,
but it is unclear whether they support mechanisms
to obtain network state that pertains to a specific
packet’s forwarding [10].
In the SDN space, OFRewind [45] records and
plays back SDN control plane traffic; like NetSight,
it also records flow table state via a proxy and logs
packet traces. ndb [20] proposes the postcard-based
approach to reconstruct the path taken by a packet.
In this paper, we build upon those ideas with the
packet history abstraction, the PHF API, four troubleshooting applications, and also describe and evaluate methods to scale the system. Other academic
work, IP traceback, builds paths to locate denialof-service attacks on the Internet [12, 38, 41]. Flow
sampling monitors traffic and its distribution [14] or
improves sampling efficiency and fairness [2, 13, 39];
NetSight has a different goal (network diagnosis) and
uses different methods. Packet Obituaries [3] proposes an accountability framework to provide information about the fate of packets. Its notion of a
“report” is similar to a packet history but provides
only the inter-AS path information. Each lacks a
systematic framework to pose questions of these reports in a scalable way.
Another class of related systems look for invariant violations atop a model of network behavior.
These include data-plane configuration checkers like
Anteater [29], Header Space Analysis [23, 22], and
VeriFlow [25], as well as tools like NICE [6], which
combines model checking and symbolic execution to
verify network programs. These systems all model
network behavior, but firmware and hardware bugs
can creep in and break this idealized model. NetSight on the other hand, takes a more direct approach – it finds bugs that manifest themselves as
errantly forwarded packets and provides direct evidence to help identify their root cause. Automatic Test Packet Generation [46] shares our overall
approach, but uses a completely different method:
sending test packets, as opposed to monitoring existing traffic. NetSight appears better suited for networks with rapidly changing state, because it avoids
the expensive test packet set minimization step.
Virtual Network Diagnosis [44] shares surface similarities with NetSight, such as a distributed implementation and a query API; however, its focus is performance diagnosis for tenants, rather than connectivity debugging for the infrastructure owner. Gigascope [11] is a stream query processing system used to
process large streams of packet data using an SQLlike query language. NetSight’s query engine uses
PHF, a regular-expression-like query language for
10
Summary
Networks are inherently distributed, with highly
concurrent data-plane and control-plane events, and
they move data at aggregate rates greater than any
single server can process. These factors make it
challenging to pause or “single-step” a network, and
none of our network diagnosis tools try to connect
packet events to control events. As a result, administrators find it hard to construct a packet’s perspective of its forwarding journey, despite the value for
diagnosing problems.
NetSight addresses these challenges to improve
network visibility in operational networks, by leveraging SDN to first gain visibility into forwarding
events, and then tackling performance concerns with
a scale-out system architecture, aggressive packet
header compression, and carefully optimized C++
code. The surprising result is the feasibility and
practicality of collecting and storing complete packet
histories for all traffic on moderate-size networks.
Furthermore, NetSight demonstrates that given
access to a network’s complete packet histories, one
can implement a number of compelling new applications. Atop the NetSight Packet History Filter
(PHF) API, we implemented four applications—a
network debugger, invariant monitor, packet logger,
and hierarchical network profiler—none of which required more than 200 lines of code. These tools
manifested their utility immediately, when a single, incompletely assembled packet history revealed
a switch configuration error within minutes of our
first test deployment.
Acknowledgments
We would like to thank our shepherd Ethan KatzBassett and the anonymous NSDI reviewers for their
valuable feedback that helped significantly improve
the quality of this paper. This work was funded
by NSF FIA award CNS-1040190, NSF FIA award
CNS-1040593-001, Stanford Open Networking Research Center (ONRC), a Hewlett Packard Fellowship, and a gift from Google.
References
[1] NetSight Source Code.
netsight.
http://yuba.stanford.edu/
13
USENIX Association 11th USENIX Symposium on Networked Systems Design and Implementation 83
[2] A. Arefin, A. Khurshid, M. Caesar, and K. Nahrstedt.
Scaling Data-Plane Logging in Large Scale Networks.
MILCOM, 2011.
[22] P. Kazemian, M. Chang, H. Zeng, G. Varghese, N. McKeown, and S. Whyte. Real Time Network Policy Checking Using Header Space Analysis. NSDI, 2013.
[3] K. Argyraki, P. Maniatis, D. Cheriton, and S. Shenker.
Providing Packet Obituaries. HotNets, 2004.
[23] P. Kazemian, G. Varghese, and N. McKeown. Header
Space Analysis: Static Checking For Networks. NSDI,
2012.
[4] T. Benson, A. Akella, and D. Maltz. Network Traffic
Characteristics of Data Centers in the Wild. IMC, 2010.
[5] A JIT for packet filters.
437981/.
[24] A. Khurshid, W. Zhou, M. Caesar, and P. B. Godfrey.
VeriFlow: Verifying Network-Wide Invariants in Real
Time. HotSDN, 2012.
http://lwn.net/Articles/
[25] A. Khurshid, X. Zou, W. Zhou, M. Caesar, and
P. Brighton Godfrey. VeriFlow: Verifying Network-Wide
Invariants in Real Time. NSDI, 2013.
[6] M. Canini, D. Venzano, P. Peresini, D. Kostic, and
J. Rexford. A NICE Way to Test OpenFlow Applications. NSDI, 2012.
[7] Cisco: Configuring Local SPAN, RSPAN, and ERSPAN.
http://www.cisco.com/en/US/docs/switches/lan/
catalyst6500/ios/12.2SX/configuration/guide/
span.html.
[26] M. Kobayashi, S. Seetharaman, G. Parulkar, G. Appenzeller, J. Little, J. van Reijendam, P. Weissmann, and
N. McKeown. Maturing of OpenFlow and SoftwareDefined Networking through Deployments. Computer
Networks (Elsevier), 2013.
[8] B. Claise. RFC 5101: Specification of the IP Flow Information Export (IPFIX) Protocol for the Exchange of
IP Traffic Flow Information. http://tools.ietf.org/
html/rfc5101.
[27] B. Lantz, B. Heller, and N. McKeown. A network in
a laptop: Rapid prototyping for software-defined networks. HotNets, 2010.
[28] LBNL/ICSI Enterprise Tracing Project. http://www.
icir.org/enterprise-tracing/download.html.
[9] R. Cox. Regular Expression Matching: the Virtual
Machine Approach. http://swtch.com/~rsc/regexp/
regexp2.html.
[10] cPacket Networks. Product overview. http://cpacket.
com/products/.
[29] H. Mai, A. Khurshid, R. Agarwal, M. Caesar, P. B. Godfrey, and S. T. King. Debugging the Data Plane with
Anteater. SIGCOMM, 2011.
[11] C. Cranor, T. Johnson, O. Spataschek, and
V. Shkapenyuk.
Gigascope: A Stream Database
for Network Applications. SIGMOD, 2003.
[30] S. McCanne and V. Jacobson. The BSD Packet Filter: A New Architecture for User-level Packet Capture.
USENIX Winter Conference, 1993.
[12] D. Dean, M. Franklin, and A. Stubblefield. An Algebraic Approach to IP Traceback. ACM Transactions on
Information and System Security (TISSEC), 2002.
[31] NEC IP8800 OpenFlow-enabled Switch.
support.necam.com/pflow/legacy/ip8800/.
http://
[32] Net optics: Architecting visibility into your network.
http://www.netoptics.com/.
[13] N. Duffield. Fair Sampling Across Network Flow Measurements. SIGMETRICS, 2012.
[33] Open vSwitch: An Open Virtual Switch.
openvswitch.org/.
[14] N. G. Duffield and M. Grossglauser. Trajectory Sampling
for Direct Traffic Observation. IEEE/ACM Transactions
on Networking, 2001.
http://
[34] P. Phaal. sFlow Version 5. http://sflow.org/sflow_
version_5.txt.
[15] Endace Inc. http://www.endace.com/.
[35] The POX Controller. http://github.com/noxrepo/pox.
[16] R. Fonseca, G. Porter, R. H. Katz, S. Shenker, and I. Stoica. X-Trace: A Pervasive Network Tracing Framework.
NSDI, 2007.
[36] RipL-POX (Ripcord-Lite for POX): A simple network
controller for OpenFlow-based data centers. https://
github.com/brandonheller/riplpox.
[17] Intel Ethernet Switch FM5000/FM6000 Series. http://
www.intel.com/content/www/us/en/switch-silicon/
ethernet-switch-fm5000-fm6000-series.html.
[18] Gigamon. http://www.gigamon.com/.
[37] M. Rosenblum and J. Ousterhout. The Design and Implementation of a Log-Structured File System. ACM
Transactions on Computer Systems, 1992.
[19] N. Gude, T. Koponen, J. Pettit, B. Pfaff, M. Casado,
and N. McKeown. NOX: Towards an Operating System
for Networks. SIGCOMM CCR, July 2008.
[38] S. Savage, D. Wetherall, A. Karlin, and T. Anderson.
Practical Network Support for IP Traceback. SIGCOMM, 2000.
[20] N. Handigol, B. Heller, V. Jeyakumar, D. Mazi`
eres, and
N. McKeown. Where is the Debugger for my SoftwareDefined Network? HotSDN, 2012.
[39] V. Sekar, M. Reiter, W. Willinger, H. Zhang, R. Kompella, and D. Andersen. CSAMP: A System for NetworkWide Flow Monitoring. NSDI, 2008.
[21] V. Jacobson. RFC 1144: Compressing TCP. http://
tools.ietf.org/html/rfc1144.
[40] S. Shenker. The Future of Networking, and the Past of
Protocols. Open Networking Summit, 2011.
14
84 11th USENIX Symposium on Networked Systems Design and Implementation USENIX Association
[41] A. C. Snoeren, C. Partridge, L. A. Sanchez, C. E. Jones,
F. Tchakountio, S. T. Kent, and W. T. Strayer. Hashbased IP traceback. SIGCOMM, 2001.
[42] Splunk: Operational Intelligence, Log Management, Application Management, Enterprise Security and Compliance. http://splunk.com.
[43] The CAIDA UCSD Anonymized Internet Traces 2012
– Nov 15 2012. http://www.caida.org/data/passive/
passive_2012_dataset.xml.
[44] W. Wu, G. Wang, A. Akella, and A. Shaikh. Virtual
Network Diagnosis as a Service. SoCC, 2013.
[45] A. Wundsam, D. Levin, S. Seetharaman, and A. Feldmann. OFRewind: Enabling Record and Replay Troubleshooting for Networks. USENIX ATC, 2011.
[46] H. Zeng, P. Kazemian, G. Varghese, and N. McKeown.
Automatic Test Packet Generation. CoNEXT, 2012.
15
USENIX Association 11th USENIX Symposium on Networked Systems Design and Implementation 85


© Copyright 2026