
Time Well Spent? Relating Television Use to
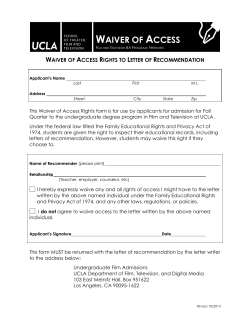
ARTICLE
Time Well Spent? Relating Television Use to
Children’s Free-Time Activities
Elizabeth A. Vandewater, PhDa,b,c,d, David S. Bickham, PhDb,c,d, June H. Lee, PhDb,c
a
Human Development and Family Sciences, The University of Texas at Austin, Austin, Texas; bCenter for Research on Interactive Technology, Television and Children, The
University of Texas at Austin, Austin, Texas; cChildren’s Digital Media Center, The University of Texas at Austin, Austin, Texas; dCenter on Media and Child Health, Harvard
Medical School/Children’s Hospital Boston, Boston, Massachusetts
The authors have indicated they have no financial relationships relevant to this article to disclose.
ABSTRACT
OBJECTIVES. This study assessed the claim that children’s television use interferes with
time spent in more developmentally appropriate activities.
METHODS. Data came from the first wave of the Child Development Supplement, a
nationally representative sample of children aged 0 to 12 in 1997 (N ⫽ 1712).
Twenty-four-hour time-use diaries from 1 randomly chosen weekday and 1
randomly chosen weekend day were used to assess children’s time spent watching
television, time spent with parents, time spent with siblings, time spent reading (or
being read to), time spent doing homework, time spent in creative play, and time
spent in active play. Ordinary least squares multiple regression was used to assess
the relationship between children’s television use and time spent pursuing other
activities.
RESULTS. Results indicated that time spent watching television both with and with-
out parents or siblings was negatively related to time spent with parents or siblings,
respectively, in other activities. Television viewing also was negatively related to
time spent doing homework for 7- to 12-year-olds and negatively related to
creative play, especially among very young children (younger than 5 years). There
was no relationship between time spent watching television and time spent
reading (or being read to) or to time spent in active play.
www.pediatrics.org/cgi/doi/10.1542/
peds.2005-0812
doi:10.1542/peds.2005-0812
Key Words
child development, children, media,
television
Abbreviations
AAP—American Academy of Pediatrics
CDS-I—first wave of the Child
Development Supplement
PSID—Panel Study of Income Dynamics
OLS— ordinary least squares
Accepted for publication Aug 3, 2005
Address correspondence to Elizabeth A.
Vandewater, PhD, Human Development and
Family Sciences, University of Texas at Austin,
1 University Station, A2700, Austin, TX 787121097. E-mail: [email protected]
PEDIATRICS (ISSN Numbers: Print, 0031-4005;
Online, 1098-4275). Copyright © 2006 by the
American Academy of Pediatrics
CONCLUSIONS. The results of this study are among the first to provide empirical
support for the assumptions made by the American Academy of Pediatrics in their
screen time recommendations. Time spent viewing television both with and
without parents and siblings present was strongly negatively related to time spent
interacting with parents or siblings. Television viewing was associated with decreased homework time and decreased time in creative play. Conversely, there
was no support for the widespread belief that television interferes with time spent
reading or in active play.
PEDIATRICS Volume 117, Number 2, February 2006
e181
T
ELEVISION VIEWING HAS been blamed for a variety of
social ills, including the creation of passive learners
who have difficulty paying attention and concentrating
on learning tasks (and, by extension, declining test
scores), inactivity (and, by extension, obesity), immorality, aggression, and even murder. In part, these charges
stem from the basic belief that television viewing interferes with the time that children spend in activities that
are deemed more developmentally appropriate. This belief is both long standing and widely held.1
The widespread conviction of the veracity of this belief has shaped at least 2 prominent public health policies. The American Academy of Pediatrics (AAP) recommends that pediatricians advise parents to avoid
television viewing entirely for children who are younger
than 2 years and limit the viewing time of older children
to ⬍2 hours a day.2 The AAP recommendation states
that pediatricians should “discourage television viewing
for children younger than 2 years and encourage more
interactive activities that will promote proper brain development, such as talking, playing, singing, and reading
together.”2 Although concern for young children’s neurologic development prompted this recommendation,
the implicit assumption is that the time that children
spend viewing screen media will interfere with time
spent in social interaction, particularly with parents.
Along the same lines, the Centers for Disease Control
and Prevention in its Healthy People 2010 has identified,
for the first time, the reduction of television viewing as
a fitness objective. Like the AAP recommendation, this
goal assumes that time spent viewing television interferes with time spent in more physically active pursuits.
It is true that American children spend anywhere
between 2 and 5 hours a day watching television,3–6
more time than in any other single discretionary activity
except for sleep.7 If time spent in activities is zero-sum,
then the assumption that time spent watching television
impinges on the total time available for social interaction
or for other activities makes intuitive sense. This is essentially the notion of the “displacement effect.”1
However, it is important to note that empirical examination of displacement or time “trade-offs” requires a
full accounting of all activities in which children engage
during a 24-hour period. Otherwise, it is impossible to
assess accurately the extent of the relationships among
activities in which children engage. This realization is far
from recent. In 1972, Robinson8 remarked, “A major
weakness of the available literature has been its failure
to employ an adequate sampling framework of daily life
with which to assess television’s full impact.” Surprising,
however, few existing studies used an appropriate timesampling method. Given that concern about the displacement of healthier activities by television has
loomed large in both popular and academic consciousness for decades, the relative dearth of empirical research on this topic is surprising.
e182
VANDEWATER, et al
In this article, we examine the relationship between
the amount of time that children spend watching television and the amount of time that they spend in activities that are viewed as more developmentally appropriate. We use data from the first wave of the Child
Development Supplement (CDS-I). One of the strongest
elements of the CDS-I is its reliance on 24-hour time-use
diaries to document time spent using media and in other
activities. The CDS data have distinct strengths for examining the relationship between time spent viewing
television and time spent in other activities: (1) the data
are drawn from a nationally representative sample of
children, which allows inference about time trade-offs at
the population level; (2) children’s activities and media
use were measured using 24-hour time-use diaries,
which allow direct comparison of time trade-offs; and
(3) data were collected from children who were aged 0
to 12, which allows an examination of time trade-offs
among even very young children.
To address health policy, scholarly, and popular concerns, we focus on the relationship between television
viewing and 5 activities that are deemed developmentally appropriate: (1) time spent interacting with family
(parents and siblings), (2) time spent reading (including
being read to), (3) time spent doing homework, (4) time
spent in creative play, and (5) time spent in active play.
We address the following questions: (1) Do children
“trade-off” time spent in more developmentally appropriate activities for time watching television? (2) Do
these trade-offs differ by type of activity and by age?
METHODS
SAMPLE
Data from this study come from the first wave of the
Panel Study of Income Dynamics (PSID) CDS-I. The
PSID began as a longitudinal study that focused on the
transfer of capital within families. In 1997, it was expanded to include a host of measures that are pertinent
to children aged 12 and younger. These measures ranged
from parenting, children’s academic achievement, behavior, and time use. Of the families in the PSID with
children younger than 12 years, 2380 participated, yielding a sample of 2902 children who returned at least 1
time-use diary. Appropriately weighted, these data provide nationally representative estimates (see Hofferth
and Sandberg9 for a detailed discussion of PSID and
CDS-I sampling procedures).
The current study used a subsample of the CDS (n ⫽
1712) in which children had at least 1 time-use diary
and complete data on all variables and covariates of
interest. Sampling weights were recalibrated such that
the subsample remained representative of the US population. The median income of families in CDS-I was
$39 409, with 18.1% of families falling below the 1997
federal poverty level. Twenty percent of heads of house-
hold had not graduated high school, 31% had a high
school diploma, 23% had some college, and 26% had
attained a bachelors degree or higher. Sixty-six percent
of the sample were white, 15.4% were black, 11.5%
were Hispanic, and 7% were of other ethnicities. The
study was approved by the Institutional Review Boards
of the University of Michigan, where the data were
collected, and the University of Texas at Austin, where
analyses for this study were conducted.
Time-Use Diaries
Children’s time-use information was collected during
the school year (September through May) using 24-hour
time-use diaries on 1 randomly chosen weekday and 1
randomly chosen weekend day. On the diary, every
minute of the two 24-hour periods was accounted for
with a primary activity and, if applicable, a secondary
activity. Also reported were who was doing the activity
with the child and who was there but not participating
directly in the activity with the child (eg, if the parent
was in the house but not watching television with the
child). The diaries were completed, by and large, by the
children’s primary caregivers, with some assistance from
older children in the sample (10- to 12-year-olds). Caregivers were reminded to keep track of their child’s activities with a telephone call the day before their randomly chosen diary day. Because the structure of
children’s time, particularly their discretionary time, differs on weekdays and weekends, day types were analyzed separately.
A substantial amount of attention has been paid to
measurement issues involving the use of time diaries to
assess time use,10,11 and a fairly extensive body of research now exists demonstrating the validity and the
reliability of such diaries as representations of the way
both children and adults spend their time.8,11,12 When
direct observation techniques are compared with time
dairies, the mean values for time allocated to different
activities were very close, and the correlations were
high, on the order of .70 to .80.10,11
Of particular relevance to this study, Anderson et al13
specifically examined the accuracy of parent report of
young children’s (age 5 on average) media use. Using
video cameras, they recorded all children’s viewing in
⬃100 families for a 10-day period while the children’s
parents also completed a viewing diary. The correlation
between the 2 methods was high (.84), indicating that
time diaries that are filled out by parents provided fairly
accurate representations of children’s weekly viewing.
Thus, time diaries have been shown to be a highly reliable and valid method for large-scale surveys to chart the
way individuals spend their time when observing individuals over 24-hour periods is neither logistically nor
financially feasible.
Children’s Time Use
The goal of this article is to examine the commonly held
notion that television viewing takes time away from
other activities that are healthier or developmentally
important for children. Analyses focus on 5 such activities: (1) interacting with parents and siblings, (2) reading or being read to, (3) doing homework, (4) engaging
in creative play, and (5) engaging in active play.
All time-use variables were constructed by summing
the total number of minutes spent in each activity on the
weekday and the weekend independently. Duration totals include reports of activities as either primary or
secondary but do not include concurrent use of media
and any of the other activities (ie, when one was reported as a primary activity and the other as a secondary
activity). Thus, for example, time spent doing homework in front of the television was counted in neither
the television time nor homework time variables. This
prevented overlap between independent and dependent
variables in the analyses. Means and SDs for time spent
in all activities examined here are presented in Table 1.
Time Spent With Television
Time spent watching television was the sum of the minutes of television viewing as either a primary or a secondary activity on the weekday or weekend day, with
no concurrent displacement activities reported.
Time With Family Members
The focus of many critiques of television is that it interferes with the time that children spend interacting with
their families. Using the time-use diaries, we were able
to examine the relationship between television viewing
and the time that children spend with their parents and
siblings in other activities (not viewing television). Because television viewing may also act as a venue for
social interactions, we explored the relationships between children’s co-viewing with their parents and siblings and the amount of time that they spent with their
parents and siblings in other, nonmedia use activities.
Time With Parents
When the child’s mother, father, step-mother, and/or
step-father was reported as participating directly with
the child in an activity, the event was considered as
having occurred with the child’s parents. The amount of
time that children spent with 1 or both parents in all
activities except watching television was the primary
dependent variable in these analyses. When the primary
or secondary activity was television and a parent was
participating, the activity was considered co-viewing
with parents.
Time With Siblings
Among children who had a sibling (n ⫽ 1094), when an
activity occurred with a child’s brother, sister, stepPEDIATRICS Volume 117, Number 2, February 2006
e183
TABLE 1 Means and SDs for Minutes Spent in Activities and With Family Members
Weekday Minutes
Ages 0–2
Mean
SD
Ages 3–5
Mean
SD
Weekend Minutes
Ages 6–8
Mean
SD
Ages 9–12
Mean
SD
Ages 0–2
Mean
SD
Ages 3–5
Mean
SD
Ages 6–8
Mean
SD
Criteria
309.21 156.40 223.17 148.75 129.15 103.95 101.79 99.75 390.74 181.38 336.67 185.47 246.77 176.27
Time with parentsa
Time with siblingsa
201.88 172.88 235.21 183.55 168.71 130.05 142.00 123.60 299.20 194.51 350.23 187.59 330.40 192.78
Readingb
15.09 27.65 16.06 23.76 11.03 19.64 10.73 23.48 14.84 28.57 14.66 23.75 16.48 32.73
Homeworkb
–
–
5.69 22.58 21.08 31.45 39.49 47.94
–
–
1.05
6.39
4.11 16.01
Creative playb
259.90 158.64 185.72 142.87 93.85 92.68 53.21 70.37 263.85 139.20 229.03 148.24 168.37 136.14
Active playb
49.78 68.21 50.77 81.38 40.37 65.73 26.05 49.24 65.87 87.08 77.34 90.24 87.85 118.10
Predictors
Viewing without parentsc 33.61 57.17 65.29 73.98 64.76 75.62 69.88 76.63 25.81 49.66 67.19 80.77 94.27 98.39
Viewing with parent(s)d
44.42 61.32 78.53 78.92 68.88 72.66 75.80 77.88 16.99 35.73 53.42 62.27 67.11 82.43
Viewing without siblings
18.12 42.62 20.18 41.79 20.31 58.88 14.85 38.25
5.71 24.48 25.94 61.36 19.17 42.98
Viewing with sibling(s)
38.29 59.63 81.39 85.23 73.41 66.46 79.41 78.66 48.57 63.46 93.07 80.74 130.73 123.30
Television viewinge
55.03 72.40 96.05 86.28 89.96 85.57 99.41 85.83 54.62 69.61 111.54 91.78 151.24 120.48
Ages 9–12
Mean
SD
221.77 195.57
278.52 201.57
18.42 45.02
13.05 46.58
128.44 128.76
69.48 95.69
113.12 120.39
76.73 99.71
31.67 63.84
122.88 108.96
163.51 135.92
Dashes indicate ⬍10% of the sample reported the activity.
a In all other activities except television viewing.
b With no concurrent television viewing.
c Without either parent present.
d With either parent present.
e With no concurrent activities.
brother, or step-sister participating, it was considered
time spent with siblings. The amount of time that children spent with siblings in all activities except watching
television was the primary dependent variable in these
analyses. When the primary or secondary activity was
television and a sibling was participating, the activity
was considered co-viewing with siblings.
Time Spent Reading
Because the age range of the sample includes very young
children, this variable included minutes of either reading
or being read to for the following types of print media:
books, magazines, newspapers, and letters.
Time Spent Doing Homework
This included non– computer-related homework, studying, reading, and conducting research related to class
work.
Time Spent in Creative Play
This included the usual childhood creative pastimes,
such as drawing, coloring, playing a musical instrument,
playing pretend or dress-up, playing card games or board
games, and playing with toys. It also included all types of
arts and crafts.
Time Spent in Active Play
Because our intention in this study was to capture the
relationship between children’s television viewing and
the way they choose to spend their discretionary time,
we included all unorganized sports activities (eg, soccer,
kickball, basketball, swimming, karate) but not time
spent in organized meets/competitions and practices for
e184
VANDEWATER, et al
such sports. Also included were other active outdoor
activities such as playing catch, walking for pleasure,
hiking, fishing, camping, and general playground activities.
Covariates
Children use media in rich social contexts, including the
family and neighborhood. Many factors affect the structure of children’s time, including the time they spend
watching television, as well as the time they spend with
their parents. Depending on the analyses being conducted, the following variables were entered as covariates in the regression analyses.
Socioeconomic and Demographic Characteristics
All models controlled for basic socioeconomic and
demographic characteristics. These included family
income-to-needs ratio (computed by dividing family income by the 1997 poverty threshold provided by the
Census Bureau appropriate for family size; mean: 3.04;
SD: 3.50); number of years of education completed by
the head of the household (mean: 12.90; SD: 2.62); and
child gender (881 boys and 831 girls) and child ethnicity
(924 white and 788 nonwhite), with boys and nonwhite
children as the reference group. In models that predicted
time spent with family only, we also controlled for
whether the child was the first-born child in the family
(n ⫽ 887) or not (n ⫽ 825).
Mother’s Average Weekly Work Hours
Because the amount of time that mothers spend working
can influence the amount of time that they are available
to spend with their child, including using print media
and watching television, we controlled for mother’s average weekly work hours (mean: 20.78; SD: 19.66) in all
models.
efficient estimates. Because of the existence of sibling
pairs in the data, standard errors were corrected for
nonindependence.
Neighborhood Safety
Because the safety of a child’s neighborhood may affect
the amount of time he or she spends indoors, neighborhood safety was included as a covariate in all models.
This measure was constructed by averaging primary
caregiver responses to a total of 8 items, with higher
scores indicating perceptions of less neighborhood safety
(mean: 1.6; SD: 0.63; ␣ ⫽ .94). Item examples include
the following: How safe is it to walk around alone in
your neighborhood after dark? (1 ⫽ completely safe, 4 ⫽
extremely dangerous). How likely is it that a neighbor
would do something if (1) Someone was breaking into
your home in plain sight? (2) Someone was trying to sell
drugs to your children in plain sight? (3) There was a
fight in front of your house and someone was being
beaten? (1 ⫽ Very likely, 4 ⫽ Very unlikely, for each).
RESULTS
Time Spent in Child Care or at School
Because the amount of time that children spend in child
care settings or at school affects the amount of time that
they have to spend in discretionary activities, time spent
in child care or at school was controlled for (weekday
minutes, mean: 298.56; SD: 225.43; weekend minutes,
mean: 2.88; SD: 27.19).
Time Spent With Siblings
There was also a negative relationship between television viewing and the time that children spend with their
siblings. The more time that children spent watching
television without a sibling, the less time they spent with
their siblings in other activities (Table 2). Overall, the
pattern of results was similar for the relationship between watching television with a sibling present and
time spent with siblings in other activities. This relationship was generally negative, with 1 notable exception.
Specifically, for very young children (aged 0 –2), time
spent watching television with a sibling was positively
related to time spent interacting with siblings.
Analysis Plan
Analyses were conducted using Stata 8.0. Hierarchic
ordinary least squares (OLS) multiple regressions were
performed separately by weekdays and weekend days
and for children in 4 age categories: 0 to 2 (n ⫽ 350), 3
to 5 (n ⫽ 372), 6 to 8 (n ⫽ 380), and 9 to 12 (n ⫽ 610).
Six sets of analyses were performed using the following
as criterion variables: (1) time spent with parents, (2)
time spent with siblings (for those with a sibling), (3)
time spent reading, (4) time spent doing homework, (5)
time spent in creative play, and (6) time spent in active
play. When “time spent with parents” was used as the
dependent variable, the predictor variables of interest
were “time spent watching television without parents
present” and “time spent co-viewing with parents.” Similarly, when “time spent with siblings” was the dependent variable, the key predictor variables were “time
spent watching television without siblings present” and
“time spent co-viewing with siblings.” These analyses
included only children with a sibling participant in the
sample (n ⫽ 1094). For all other activities, the predictor
variable of interest was “time spent watching television
with no concurrent activities” (ie, reading, homework,
creative play, or active play).
Covariates were entered before the predictor variable
of interest. All analyses were weighted using recalibrated
sampling weights to yield nationally representative co-
Television Viewing and Time Spent With Parents and Siblings
Results of the OLS regression analyses for the relationship between time spent watching television and time
spent interacting with parents and siblings are presented
in Table 2.
Time Spent With Parents
Regardless of children’s age, time spent watching television without a parent present was negatively related to
time spent with parents in other activities (Table 2).
With 1 exception (6- to 8-year-olds on the weekday),
the time that children spent watching television with
their parents was also negatively related to spending
time with parents in other activities.
Effect Sizes
The unstandardized coefficients from the regressions can
be interpreted in terms of the amount of time that children spend with their family according to how much
television they view. Specifically, for every hour of television that children view on a weekday (without their
parents present), they spend less time with their parents:
0- to 2-year-olds, 52 minutes; 3- to 5-year-olds, 45 minutes; 6- to 8-year-olds, 15 minutes; 9- to 12-year-olds,
23 minutes. For every hour of television that children
view on a weekend day (without their parents present),
they spend less time with their parents: 0- to 2-yearolds, 49 minutes; 3- to 5-year-olds, 29 minutes; 6- to
8-year-olds, 25 minutes; 9- to 12-year-olds, 37 minutes.
In terms of siblings, for every hour of television that
children view on a weekday (without their siblings
present), they spend less time with their siblings: 0- to
2-year-olds, 1 hour and 5 minutes; 3- to 5-year-olds, 1
hour and 34 minutes; 6- to 8-year-olds, 53 minutes; 9to 12-year-olds, 41 minutes. For every hour of television
that children view on a weekend day (without their
PEDIATRICS Volume 117, Number 2, February 2006
e185
TABLE 2 Regression Analyses Predicting Time Spent With Parents and Siblings in Nonmedia Activities
Age
Groups
Time spent with parents: predictors
TV viewing without parents present
TV viewing with parents
Time spent with siblings: predictors
TV viewing without siblings present
TV viewing with siblings
Weekday
Weekend
2
B
SE
R
B
SE
R2
0–2
3–5
6–8
9–12
0–2
3–5
6–8
9–12
⫺.86a
⫺.75a
⫺.25a
⫺.38a
⫺.51a
⫺.28d
⫺.03
⫺.20b
.13
.13
.10
.06
.15
.12
.09
.06
.28a
.23a
.12b
.18a
.23a
.13a
.09
.12a
⫺.81a
⫺.49a
⫺.41b
⫺.61a
⫺.79c
⫺.36d
⫺.35b
⫺.43a
.30
.14
.08
.08
.47
.18
.11
.10
.18a
.12a
.25a
.20a
.16a
.10b
.21a
.11a
0–2
3–5
6–8
9–12
0–2
3–5
6–8
9–12
⫺1.05a
⫺1.56a
⫺.89a
⫺.68b
.74b
⫺.36c
⫺.51b
⫺.30d
.32
.29
.25
.20
.26
.19
.17
.12
.19d
.21a
.26b
.14d
.19b
.13d
.26d
.13d
⫺.52
⫺.99a
⫺1.15a
⫺1.12a
⫺.14
⫺.44d
⫺.34d
.04
.35
.30
.30
.17
.31
.20
.14
.15
.14d
.16a
.11a
.19a
.14b
.12a
.08b
.05
Controlling for family income-to-needs ratio, education of household head, maternal average weekly work hours, child gender (0 ⫽ boy, 1 ⫽ girl), child ethnicity (0 ⫽ white, 1 ⫽ nonwhite), firstborn
(0 ⫽ not firstborn, 1 ⫽ firstborn).
a P ⬍ .001.
b P ⬍ .01.
c P ⬍ .10.
d P ⬍ .05.
siblings present), they spend less time with their siblings:
0- to 2-year-olds, 31 minutes; 3- to 5-year-olds, 59 minutes; 6- to 8-year-olds, 1 hour and 9 minutes; 9- to
12-year-olds, 1 hour and 7 minutes.
The magnitude of these relationships can be compared easily across age groups by transforming the effects into percentages. Figure 1 presents the percentage
decrease in each social activity that corresponds to 1
hour of television viewing. For example, an average 9to 12-year-old spends ⬃102 minutes on a weekday with
his or her parents (Table 1). Watching 1 hour of television corresponds to a reduction in this time of 23 minutes, or ⬃22%. It can be seen in Figure 1 that the
negative relationship between time spent watching television and time spent with parents or siblings is fairly
large. In general, for both parents and siblings, the effects
are larger during the week than on the weekend. However, an interesting weekend pattern is apparent
whereby the effect sizes become increasingly larger by
age. Thus, among the 9- to 12-year-olds, time spent
watching television without parents or siblings present is
displacing almost as much or as much of their time on
the weekends as it does during the week. This finding
might be exceptionally important considering that 9- to
12-year-olds spend the least amount of time with their
parents.
Television Viewing and Time Spent in Other, Developmentally
Appropriate Activities
Results of the OLS regression analyses for the relationship between time spent watching television and time
e186
VANDEWATER, et al
spent reading, doing homework, in creative play, and in
active play, respectively, are presented in Table 3.
Time Spent Reading or Being Read to
There were no significant relationships between time
spent watching television and time spent reading or
being read to.
Time Spent Doing Homework
Time spent watching television was related to slight
decreases in time spent doing homework: for every hour
of television that children watch on a weekday, 6- to
8-year-olds spend 3 minutes less doing homework and
9- to 12-year-olds spend 7 minutes less. Because 6- to
8-year-olds spent an average of 21 minutes and 9- to
12-year-olds spent an average of 39 minutes doing
homework during weekdays, this indicates a decrease of
14% for 6- to 8-year-olds and 18% for 9- to 12-yearolds.
Time Spent in Creative Play
Overall, the regression analyses show a negative relationship between television viewing and time spent engaged in creative play. An hour of television viewing
among 0- to 2-year olds was linked to a 9% reduction in
play during the week and an 11% reduction during the
weekend. For 3- to 5-year olds, the corresponding effects
were a 9% reduction on the weekday and 11% on the
weekend day. These decreases were about the same in
magnitude for 6 – 8 year-olds (8%) and 9 –12 year-olds
(9%) on the weekend, although these two older groups
FIGURE 1
Effect sizes: percentage decrease in the number of minutes spent in other activities for every hour of television
viewing without parents or siblings, respectively.
TABLE 3 Regression Analyses Predicting Time Spent Reading, Doing Homework, Engaging in Creative
Play, and Engaging in Active Play: Television Viewing as Predictor With No Concurrent
Criterion Activities
Age Groups
Time spent reading
0–2
3–5
6–8
9–12
Time spent doing homework
0–2
3–5
6–8
9–12
Time spent in creative play
0–2
3–5
6–8
9–12
Time spent in active play
0–2
3–5
6–8
9–12
Weekday
Weekend
2
B
SE
R
B
SE
R2
⫺.01
⫺.05
⫺.02
⫺.03
.03
.02
.01
.01
.09
.07
.07
.08b
.01
⫺.02
⫺.04
⫺.02
.02
.01
.01
.01
.05
.05
.06a
.04c
–
.01
⫺.05a
⫺.12a
–
.01
.02
.02
–
.05
.09c
.09b
–
.01
.01
⫺.02
–
.01
.01
.01
–
.03
.02
.03
⫺.39b
⫺.21c
⫺.09
⫺.09a
.11
.08
.06
.04
.12b
.20b
.18b
.07c
⫺.48b
⫺.32b
⫺.22b
⫺.21b
.12
.09
.06
.04
.10b
.06c
.09c
.08c
⫺.08
⫺.04
⫺.13
⫺.05
.05
.05
.06
.02
.04a
.12b
.17a
.05a
⫺.05
⫺.01
⫺.03
⫺.07c
.06
.05
.05
.03
.05a
.01
.06a
.04a
Controlling for family income-to-needs ratio, education of household head, maternal average weekly work hours, child gender (0 ⫽ boy, 1 ⫽
girl), and child ethnicity (0 ⫽ white, 1 ⫽ nonwhite).
a P ⬍ .05.
b P ⬍ .001.
c P ⬍ .01.
PEDIATRICS Volume 117, Number 2, February 2006
e187
of children spent much less time in creative play than did
younger children.
Time Spent in Active Play
There were no significant relationships between time
spent watching television and time spent in active play,
with 1 exception. The more time that 9- to 12-year-olds
spent watching television on the weekend, the less time
they spent in active play. The size of the coefficient
indicates a 4-minute (or 5%) decrease in active play for
every hour spent viewing. Although significant, the substantive meaning of this coefficient seems suspect, in
part because it is the sole significant coefficient in this
analysis and in part because the large sample size renders
our ability to find differences (ie, statistical power) very
great, even when such differences are small in terms of
magnitude.
DISCUSSION
Children’s Television Viewing and Family Interaction
In 1999, the AAP recommended eliminating or limiting
screen time of very young children, largely on the basis
of the assumption that time spent using screen media
would interfere with time spent interacting with parents, which is crucial for young children’s development.2
At the time when this recommendation was made, little
empirical evidence existed to support this assumption,
mainly because it had yet to be examined. The results of
this study are among the first to provide strong empirical
support for the assumptions made by the AAP in their
screen time recommendations. We found that the more
time that children spent viewing television without parents and siblings present, the less time they spent interacting with parents or siblings, respectively.
It is interesting that though the AAP targeted very
young children (0- to 2-year-olds), our results indicated
that television viewing is equally consequential for the
time that older children spend with their parents. It may
well be that the developmental consequences of decreased social interaction is dire for very young children,
yet because older children (between the ages of 6 and
12) spent relatively less time with their parents and
siblings than did the younger children, it is possible that
the consequences of viewing may have important developmental ramifications for them as well. The AAP recommendation specifically notes that parental interaction
is necessary for proper neurologic development among
very young children. Although neurologic development
is probably less of a concern for older children, different
aspects of well-being are known to be related to parental
interaction. For example, evidence suggests that positive
interactions with parents is negatively related to engaging in problem behavior among early-adolescent children.14,15
e188
VANDEWATER, et al
Children’s Television Viewing and Reading
We found no evidence that electronic media use was
related to time spent reading or being read to for children between the ages of 0 and 12. Of course, for a time
trade-off to occur, there needs to be time spent to trade.
The descriptive analyses indicated that children spent
very little time reading or being read to. On a weekday,
the 2 youngest groups spent ⬃15 minutes reading,
whereas the 2 older groups averaged only 10 to 11
minutes reading. These averages were roughly the same
on the weekend day for the 2 youngest groups, although
they increased slightly (to ⬃17 minutes) for the 2 oldest
groups.
Our findings are in line with other empirical evidence
in this area. Despite the popular belief that television
viewing has contributed to the general lack of reading
among the American public, there exists surprisingly
little empirical evidence to support this notion. Examinations of time spent reading before and after the advent
of television suggests that the time that children spend
reading has remained relatively stable through the
years.16 A major study that compared 10 communities
with or without television revealed that television viewing had the greatest impact on other media use, such as
comic reading, listening to the radio, and going to the
movies.17 Television viewing had little influence on the
time that children spent reading books or doing homework, even during its early introductory stages. Unfortunately, it seems that children spent little time reading
before the advent of television, and they spend little time
reading now.16
Leisure reading is embedded in a complex context
that includes the home environment, parent and teacher
nurturance, the child’s own intelligence and motivation,
and reciprocal interactions among these factors.16 It may
well be that American children are not reading enough,
but to believe that increases in reading can be achieved
by unplugging the television seems to be an unsubstantiated oversimplification.18
Children’s Television Viewing and Homework
There was some evidence that television use is negatively related to time spent doing homework. Among 6to 8- and 9- to 12-year-olds, television viewing on weekdays was negatively related to time spent doing homework. Because children did not spend much time doing
homework, these relationships were fairly large. Among
6- to 8-year-olds, the found decrease of 3 minutes of
homework time for every hour of television viewed
amounted to a decrease of 14% in the average amount
of time that they spent on homework, whereas among
9- to 12 year-olds, the found decrease of 7 minutes of
homework time for every hour of television amounted
to an 18% decrease in the average amount of time that
they spent doing homework during the week. These
results suggest that families would do well to bar (or at
least severely limit) television viewing among schoolaged children on school nights.
Children’s Television Viewing and Creative Play
Besides social interaction, television viewing showed the
largest negative relationship with the time that children
spent in creative play. This was especially true for the 2
younger age groups in our sample but was also true for
children of all ages on the weekend. Recall that these
activities are mainly activities that one does inside, including board games, pretend play, arts and crafts, etc.
One interpretation of this finding is that the ease of
television viewing as an activity may in some sense
“trump” these other inside activities, which require
some preparation time. By this, we mean that to play a
board game, for example, one first has to decide on the
board game, find it, and set it up. In addition, at the end
of the activity (or at least at some point in the future),
one has to clean it up or put it away. This is not true for
television viewing, which requires simply that one turn
it on to begin and turn it off to end (no set up or clean up
required).
Television has long been charged with deleterious
effects on children’s creativity. Although these data cannot address whether time spent in creative play enhances children’s creativity, they do indicate that children trade off time spent in creative play for television
viewing. In this vein, our findings are in line with experimental research examining the impact of television
on children’s creativity in rural Canada. Specifically,
Williams19 and her colleagues found that children who
lived in a community with no television initially had
higher scores on a measure of creativity than children
with access to either a single television channel or multiple channels. Once television was introduced, however, the creativity scores of these children dropped to
levels similar to those of children with television.
Children’s Television Viewing and Active Play
We found no evidence that television viewing and time
spent in active play were related, either negatively or
positively. Moreover, unlike time spent reading, children spent enough time in active play for some relationship to exist. Although it may be tempting to dismiss
these findings as an aberration, a number of studies have
failed to find a relationship between children’s physical
activity and their television use. Using large epidemiologic samples, Robinson and Killen20 reported no relationship between physical activity and television viewing. Similarly, Robinson et al21 and DuRant et al22 both
reported a negative but weak association between television viewing and physical activity. Even Robinson’s23
randomized, controlled experiment showing reductions
in children’s adiposity with reductions in television
viewing did not find commensurate changes in physical
activity. Thus, although these findings are, to date, the
strongest evidence available supporting the notion that
reducing television time can reduce adiposity in children, the mechanism linking television viewing with
childhood obesity remains open to interpretation.
These findings have important implications for the
notion that television viewing has contributed to the
obesity epidemic among American children via its impact on physical activity. Although it is true that children
of all ages spent far less time in active play than in other
types of activities (except reading and homework) and
that the older children spent less time in active play than
the younger children (similar to the findings of others),
our findings do not support the notion that active play
time is negatively related to television viewing.
Given the dire problem of childhood overweight in
this country, it seems reasonable to assume that American children are not active enough. The question at
hand is whether television is playing a role in this or not.
These findings can be added to others suggesting that,
perhaps, reduction of physical activity is not 1 of the
mechanisms by which television is contributing to childhood obesity.
Television viewing may be contributing to childhood
overweight in other important ways. Two possibilities
include increased caloric consumption through eating
while watching television or the influence of televised
advertising. More than 60% of televised advertising to
children is food related.24 There is a plethora of evidence
that such advertising works, and it works well: food
advertising is related to increased requests by children to
parents for such products, as well as increased parental
purchase of such products.25–27 It may be that television is
implicated in the childhood obesity epidemic in the
United States. If this is true, then it behooves public
health scholars to understand the ways in which it is
implicated, as well as the ways in which it is not.
Limitations
The notion of time trade-off or displacement as it applies
to television viewing rests on 2 fundamental assumptions: (1) that the relationship between time spent in 2
different activities is essentially zero-sum (thus time
spent viewing television means less time available for
another activity) and (2) that children would be engaged
in more appropriate (eg, social interaction, educational,
physically active) activities if they were not watching
television. However, the cross-sectional nature of most
studies on displacement make establishing causal influences impossible.16 This limitation exists in these data as
well. The findings reported here are relevant to the
magnitude and the direction of the relationship between
television viewing and time spent in other activities, but
they cannot untangle direction of effects. Thus, for example, we cannot assume that if children were not
watching television they would be spending more time
interacting with their parents or siblings or that they
PEDIATRICS Volume 117, Number 2, February 2006
e189
would be spending more time doing homework or more
time in creative play. Although these assumptions seem
likely, they remain to be verified. However, it is also
possible that the relationship between television viewing
and social interaction may simply be a “marker” of an
overall family style or of the nature of certain parent–
child relationships, such that even if the television were
off, family members would find other activities to perform separately. Again, this possibility warrants additional examination.
In addition, we note that one must be careful not to
assume that all time spent with parents will be “good
time.” There is a large body of evidence indicating that
when parents are under stress, their interactions with
their children are not always optimal.15,28 In fact, in other
analyses, we have found evidence that when parents are
under stress, they might be better off putting their children in front of the television to watch high-quality
educational programming than interacting with them.29
Although perhaps unfortunate, this is simply a reality of
family life in America today.
CONCLUSIONS
Lamenting about the amount of time that American
children “waste” watching television is so common that
it almost rates as a national pastime. Pundits, policy
makers, politicians, teachers, and parents all have bemoaned that the time that children spend watching television comes at the cost of what is widely viewed as time
better spent. Among other things, television viewing has
been charged with interfering with the time that children spend interacting with parents and siblings, reading, doing homework, engaging in creative play, and
engaging in physically active play. There is an annual
“national turn-off-the television week,” and parenting
books with “TV Free” in their titles abound.30–32
On the one hand, it seems that at least some of the
vilification of television is deserved. For example, a large
body of research has converged on findings that viewing
television violence affects both short-term and longterm aggressive behavior.33–35 Along these lines, our results suggest that the AAP was right to be concerned that
time spent viewing would be negatively related to the
time that children spend interacting with their parents.
We found a consistent pattern of fairly large negative
relationships among television viewing and time spent
interacting with both parents and siblings. Clearly, then,
some of the concerns regarding the impact of television
viewing on children are justified. On the other hand,
some of the concerns and assumptions regarding television have received little empirical support. We found
little evidence that time spent watching television is
negatively related to time spent reading or time spent in
active play.
Our own view is that, much like automobile use,
television use has become part of the fabric of daily life
e190
VANDEWATER, et al
in America. Moreover, it seems doubtful that this will
change anytime in the near future. Thus, it behooves
public health scholars to examine and document carefully the ways in which television may have deleterious
effects on daily life and health, as well as the ways in
which it has little or no effect.
ACKNOWLEDGMENTS
Funding for this research was provided by grant R01HD40851-01 from the National Institute of Child Health
and Human Development. The Children’s Digital Media
Center at the University of Texas at Austin is funded by
grant BCS-0126127 from the National Science Foundation. The Panel Study of Income Dynamics Child Development Supplement (CDS) is funded by grants R01HD33474 and R01-HD044027 from the National
Institute of Child Health and Human Development.
REFERENCES
1. Mutz DC, Roberts DF, van Vuuren DP. Reconsidering the displacement hypothesis: television’s influence on children’s time
use. Commun Res. 1993;20:51–75
2. American Academy of Pediatrics Committee on Public Education. Media education. Pediatrics. 1999;104:341–343
3. Kaiser Family Foundation. Kids and Media@The New Millennium. Menlo Park, CA: Kaiser Family Foundation; 1999
4. Wright JC, Huston AC, Vandewater EA, et al. American children’s use of electronic media in 1997: A national survey.
J Appl Dev Psychol. 2001;22:31– 47
5. Kaiser Family Foundation. Zero to Six: Electronic Media in the
Lives of Infants, Toddlers and Preschoolers. Menlo Park, CA: Kaiser
Family Foundation; 2004
6. Kaiser Family Foundation. Generation M: Media Use in The lives of
8 –18 Year-Olds. Menlo Park, CA: Kaiser Family Foundation;
2005
7. Huston AC, Wright JC, Marquis J, Green SB. How young
children spend their time: television and other activities. Dev
Psychol. 1999;35:912–925
8. Robinson JP. How Americans Use Time: A Social-Psychological
Analysis of Everyday Behavior. New York, NY: Praeger; 1977
9. Hofferth SL, Sandberg JF. How American children spend their
time. J Marriage Fam. 2001;63:295–308
10. Juster FT, Stafford FP, eds. Time, Goods, and Well-Being. Ann
Arbor, MI: Institute for Social Research, University of
Michigan; 1985
11. Juster FT, Stafford FP. The allocation of time: empirical findings, behavioral models, and problems of measurement. J Econ
Lit. 1991;29:471–522
12. Juster FT. Response errors in the measurement of time use.
J Am Stat Assoc. 1986;81:390 – 402
13. Anderson DR, Field DE, Collins PA, Lorch EP, Natham JG.
Estimates of young children’s time with television: a methodological comparison of parent reports with time-lapse video
home observation. Child Dev. 1985;56:1345–1357
14. Patterson GR, De Baryshe BD, Ramsey E. A developmental
perspective on anti-social behavior. Am Psychol. 1997;44:
329 –335
15. Conger RD, Ge X, Elder GH, Lorenz FO, Simons RL. Economic
stress, coercive family process, and developmental problems of
adolescents. J Marriage Fam. 1994;52:643– 656
16. Neuman SB. Literacy in the Television Age. Norwood, NJ: Ablex;
1991
17. Schramm W, Lyle J, Parker E. Television in the Lives of Our
Children. Stanford, CA: Stanford University Press; 1961
18. Koolstra CM, Van Der Voort THA. Longitudinal effects of television on children’s leisure-time reading: a test of three explanatory models. Hum Commun Res. 1996;23:4 –35
19. Williams TM. The Impact of Television: A Natural Experiment in
Three Communities. Orlando, FL: Academic Press; 1986
20. Robinson TN, Killen JD. Ethnic and gender differences in the
relationships between television viewing and obesity, physical
activity, and dietary fat intake. J Health Educ. 1995;26:S91–S98
21. Robinson TN, Hammer LD, Killen JD, et al. Does television
viewing increase obesity and reduce physical activity? Crosssectional and longitudinal analyses among adolescent girls.
Pediatrics. 3;91:273–280
22. Durant RH, Baranowski T, Johnson M, Thompson WO. The
relationship among television watching, physical activity, and
body composition of young children. Pediatrics. 1994;94:
449 – 455
23. Robinson TN. Reducing children’s television viewing to prevent obesity: a randomized controlled trial. JAMA. 1999;282:
1561–1567
24. Story M, Faulkner P. The prime time diet: a content analysis of
eating behavior and food messages in television program content and commercials. Am J Public Health. 1990;80:736 –740
25. Gorn GJ, Goldberg ME. Behavioral evidence for the effects of
televised food messages to children. J Consum Res. 1982;9:
200 –205
26. Ross RP, Campbell T, Huston-Stein A, Wright JC. Nutritional
27.
28.
29.
30.
31.
32.
33.
34.
35.
misinformation of children: a developmental and experimental
analysis of the effects of televised food commercials. J Appl Dev
Psychol. 1981;1:329 –347
Taras HL, Sallis JF, Patterson TL, Nader PR, Nelson JA. Television’s influence on children’s diet and physical inactivity. J Dev
Behav Pediatr. 1989;10:176 –180
Vandewater EA, Lansford JE. A family process model of problem behaviors in adolescents. J Marriage Fam. 2005;67:
100 –109
Vandewater EA, Bickham DS. The impact of educational television on young children’s reading in the context of family
stress. Appl Dev Psychol. 2004;25:717–728
Bennett SJ, Bennett R. 365 TV-Free Activities You Can Do With
Your Child. Avon, MA: Adams Media Corporation; 1996
Ellison S, Gray J. 365 Afterschool Activities: TV-Free Fun for Kids
Ages 7–12. Avon, MA: Sourcebooks Incorporated; 1996
Lee KC. Fixing Our Eyes: A guidebook for a TV-Free Week.
Wheaton, IL: Tyndale House; 2001
Friedrich-Cofer L, Huston AC. Television violence and
aggression: the debate continues. Psychol Bull. 1986. 100,
364 –371
Paik H, Comstock G. The effects of television violence on
antisocial behavior: a meta-analysis. Commun Res. 1994;21:
516 –546
Bushman BJ, Anderson CA. Media violence and the American
public: scientific facts versus media misinformation. Am Psychol.
2001;56:477– 489
PEDIATRICS Volume 117, Number 2, February 2006
e191


© Copyright 2026