
HILLTOP FAMILY APARTMENTS ELLICOTT CITY, MARYLAND MARKET FEASIBILITY ANALYSIS
HILLTOP FAMILY APARTMENTS ELLICOTT CITY, MARYLAND MARKET FEASIBILITY ANALYSIS Prepared For: Stavrou Associates, Inc. 441 Defense Highway Suite C Annapolis, Maryland 21401 Submitted by: Lipman Frizzell & Mitchell LLC 8815 Centre Park Drive Suite 200 Columbia, Maryland 21045 October 12, 2010 LIPMAN FRIZZELL & MITCHELL LLC Brooks • Thomas • Cronyn REAL ESTATE CONSULTANTS 6240 Old Dobbin Lane Suite 140 Columbia, Maryland 21045 (410) 423-2300 Joseph M. Cronyn, Principal Direct: (410) 423-2372 Fax: (410) 423-2373 E-mail: [email protected] October 12, 2010 Mr. Stephen J. Moore Stavrou Associates, Inc. 441 Defense Highway Suite C Annapolis, MD 21401 SUBJECT: HILLTOP FAMILY APARTMENTS—ELLICOTT CITY, MD Market Feasibility Analysis Dear Mr. Moore: Enclosed please find Lipman Frizzell & Mitchell's analysis of the market feasibility of Stavrou Associates’ proposed redevelopment of the Hilltop site located in Ellicott City, Howard County, Maryland. The 206 mixed income family apartment units will retain the subject’s current residents, but also serve affordable renters (incomes at or below 60% AMI) and market rate renters in an increasingly expensive Howard County rental market. LF&M finds the subject is market-supported in 2010 and beyond. The enclosed report summarizes our reasoning process. Please call me at (410) 423-2372 should you have any questions or comments. Sincerely, LIPMAN FRIZZELL & MITCHELL LLC Joseph M. Cronyn Joseph M. Cronyn Member HILLTOP FAMILY APARTMENTS ELLICOTT CITY, MARYLAND MARKET FEASIBILITY ANALYSIS EXECUTIVE SUMMARY Lipman Frizzell & Mitchell LLC (LF&M) has been engaged by Stavrou Associates (Developer) to conduct a market feasibility analysis of the proposed acquisition and redevelopment of the Hilltop Family Apartments located in Ellicott City, Howard County, Maryland. Hilltop Family Apartments consists of 206 mixed income apartments to be delivered in a master-planned redevelopment of existing public housing sites. There are 92 affordable LIHTC apartments targeted to family households earning 30%-60% of area median income (AMI). There are also 114 market rate apartments with no income restrictions. This analysis provides information on the community, the demand for affordable family apartments within the defined Ellicott City Primary Market Area and the market environment in which the units will compete for residents. Based on our analysis, LF&M finds that the Hilltop family apartments has strong market support. The subject is well-positioned to attract family households in a wide range of incomes in need of quality housing. The factors which support this conclusion include: Location - The subject is centrally located in Ellicott City. Quality schools, retail opportunities, quality healthcare, public transportation are all easily available to the subject’s residents. Redevelopment - The subject will begin the redevelopment of an obsolete and underutilized public housing site—replacing existing improvements with a high quality, mixed income multifamily development. Affordable Rents - The subject offers 206 mixed income apartment units. The 92 affordable units will target households at 30%-60% AMI. Market rate apartments will total 114. Affordable rental housing is an increasingly scarce commodity in the expensive Howard County market. Employment - Residents will have access to ample employment opportunities in Howard County, one of the strongest and fastest-growing employment markets in the Washington-Baltimore region. BRAC-related development pressure will only accelerate job creation, though it will also likely increase price pressure on housing. Page 1 Growth Trends – Howard County has been the fastest growing metropolitan county within the Baltimore area during the past decade. The Ellicott City PMA has fully participated in that growth. o Population & Household Trends - Howard County has been the fastest growing metropolitan county within the Baltimore area during the past decade. The Ellicott City PMA has fully participated in that growth. In 2010 there are an estimated 22,036 PMA households—a figure which is expected to increase to 23,175 by 2015. o Housing Trends - The PMA has a higher homeownership rate (74.9% in 2000) and higher owner-occupied housing values ($429,508 estimated median value in 2010) than Howard County. Over one-third (33.9%) of Howard County renter households, however, were housing cost burdened in 2000—paying more than 30% of their incomes towards total housing expenses. o Economic Trends - The PMA is located within one of the most diverse and dynamic County economies in the Baltimore-Washington area, offering the subject’s residents access to many employment, educational and other opportunities. The PMA’s estimated median household income of $105,550 in 2010 is 3.5% higher than Howard County’s $101,954 median. Competitive Niche - The that the subject is well-positioned to attract households looking for quality affordable and market rate housing. The Ellicott City PMA’s rental market is characterized by high occupancies for all properties and waiting lists for the affordable/subsidized properties. The factors which support this position include: o Market Rate Supply - The market rate apartment communities in the PMA maintain high occupancies, currently estimated at 97.4%. The quality of the midrange multifamily stock is good but typically older. Properties have generally been well managed. Market rents average $1,006 for a standard 1BR apartment, $1,303 for a standard 2BR apartment and $1,795 for a 3BR apartment. A luxury niche has been opened in recent years at the successful Oella Mill with rents at a considerable premium to the mid-range properties— demonstrating the PMA’s capacity for growth at the upper end of the income range. The subject’s LIHTC rents are a significant savings in comparison to the market, while the unrestricted rents are within the market range—especially considering the positive reception given the Oella Mill Apartments at the luxury end of the market. o Affordable/Subsidized Supply - The supply of subsidized and affordable family apartments in the PMA is small, currently estimated at 211 units. There are two senior affordable properties in the area, offering 243 age-restricted units. All have full occupancy with waiting lists. Page 2 o Amenities - The subject’s units and amenities are very competitive with the newest PMA market rate properties and superior to the area’s older (though typically updated) properties. In particular, the new 40,000 sq.ft. community center will be a great benefit. Prospect Pool - The income-qualified demand for the subject’s LIHTC apartments is very conservatively estimated at1,940 renter households within the Ellicott City PMA. The number of PMA renter households with incomes sufficient to afford the subject’s market rate units is estimated at 2,154 households. Capture/Penetration Rate - The subject’s current residents will be retained, some after temporary relocation—substantially reducing any lease-up risk. In addition, the subject’s capture rates are very low: 5.5% for LIHTC units and 7.4% for market rate units. LF&M conservatively assumes that all 92 LIHTC units will be filled by incomeeligible family renter households from within the PMA. Comparing that number to the total 2010 eligible target household pool, LF&M calculates the subject's capture rate as follows: o Project Capture - In 2010, the pool of income-qualified prospects consists of 1,940 renter households now living within the PMA. The subject would need to capture 4.7% of these households (92 units /1,940 = 4.7%). o Project Capture by Income - LF&M has further estimated the subject’s capture rate by Tax Credit income band in accordance with the number of units available to each income band. The table below stratifies the subject’s capture rate by income level: Capture Rate by Income Band Income Band 30% 60% Total No. of Units 18 74 92 Renter Hhlds 862 1,078 1,940 Capture Rate 2.1% 6.9% 4.7% o Market Rate Units - The subject’s 114 market rate apartments need capture only 5.3% of the income-qualified renter pool available in 2010. (114 units / 2,154 = 5.3%) The subject is planned to offer mixed income rental housing, providing affordable and market rate apartments in a well-managed community setting—within a County which experiences continuing housing price pressure due to high demand. That demand will only increase further with the influence of BRAC. LF&M finds, therefore, that the subject is market-supported in 2010 and for the foreseeable future. Page 3 Hilltop Family Apartments Key Findings Property 206 Apartments (92 LIHTC and 114 Market Rate) - 35 1BR/1BA - 117 2BR/2BA - 54 3BR/2BA Population Family Income Targeting 18 Units 74 Units 114 Units Competitive Analysis Property will serve a mixed income population with LIHTC units at rents substantially below market and with market rate units well within the market range. The high quality apartments in multiple design formats, excellent location and abundant employment opportunities in the growing Howard County economy make the subject very appealing. Impact on CDA Portfolio None. There is a very limited supply of subsidized and affordable apartments in the Ellicott City market, all with high occupancy and waiting lists. Capture Rate LIHTC Capture Rate: 5.5% Market Rate Capture : 7.4% Penetration Rate LIHTC Penetration Rate: 6.1% Stabilized Occupancy 93% very conservatively. 30% AMI 60% AMI No Income Restriction Absorption/Lease-Up Risk Will be leased up as new construction units are available due to the fact that most current residents will be retained, but also strong demand in Howard County. Stabilized occupancy will occur at completion of rehabilitation. Page 4 I. MARKET ANALYST QUALIFICATIONS Lipman Frizzell & Mitchell, LLC (LF&M) is a multifaceted real estate consulting and appraisal firm serving the Mid-Atlantic since 1977. LF&M is the largest real estate advisory firm headquartered in the Region, with 25 professionals in our Columbia, MD offices. A. COMPANY OVERVIEW LF&M provides clients with objective advice and practical assistance at every stage of decision-making on the development, use or reuse of all types of real estate. Our clients include corporations, institutions, real estate owners, builders, developers, and government entities. Our professional staff has an exceptional capability to use a vast array of information and resources to assist clients in making sound, timely decisions through the real estate planning, financing and development process. Seven senior members of the firm hold the MAI designation and other advanced degrees. Professional licenses are held by various members of the firm in Maryland, District of Columbia, Pennsylvania, Delaware and Virginia. Academic degrees and professional designations are combined with hands-on real estate investment, development and ownership expertise--offering our clients many decades of accumulated counseling and valuation experience. B. MARKET FEASIBILITY CONSULTING LF&M senior staff has advised state and county economic development and planning agencies, state housing finance agencies, and non-profit groups regarding affordable housing and other community development issues from a variety of perspectives including the following: - Urban, Rural, Inner Suburban Ring, Suburban Geographic Focus Partnership with Other Intermediary Groups - State Housing Finance Agencies, NonProfit Community Development Corporations, Public Housing Authorities, Entitlement/Non-Entitlement Jurisdictions, Other State/Federal Agencies Strategic Planning - Statewide Housing Needs Assessments; Determine Available Resources: Financial, Talent, Public/Private; Gauge Legislative and Regulatory Environment; Determine Agency Mission and Role Page 5 Advisory Assignments - Project Feasibility, Economic and Demographic Analysis, Program Feasibility and Review, Development Planning and Execution, Fiscal and Economic Impact Analysis, Annexation and Zoning Analysis, Policy Formulation and Implementation C. RESEARCHER FOR THIS MARKET ANALYSIS The LF&M principal-in-charge of this assignment has been Joseph Cronyn. He has over 35 years of real estate development, finance and consulting experience. Most relevant to this assignment, he has successfully completed feasibility assessments for rental and homeownership opportunities throughout the Mid-Atlantic in Maryland, Pennsylvania, Delaware and Virginia. To date, Mr. Cronyn has been responsible for dozens of LIHTC market studies submitted to CDA. Cronyn's resume and references are found in Appendix A. D. ORGANIZATION OF REPORT Lipman Frizzell & Mitchell has followed the CDA market study requirements and has organized this report in six principal sections: Section I outlines the market analyst qualifications and relevant areas of expertise. Section II provides an overview and description of the proposed project. Section III defines the market area for the project and describes relevant demographic and economic trends in the area. Section IV reviews the multifamily housing rental supply already available in the market area and against which the subject project will compete. Section V estimates the market demand for the apartments which are proposed. Section VI analyzes the relationship between supply and demand and factors affecting the subject project’s market capture ratios. E. UNDERLYING ASSUMPTIONS AND LIMITING CONDITIONS The conclusions reached in a market feasibility analysis are inherently subjective and should not be relied upon as a determinative predictor of results that will actually occur in the marketplace. Thus a market study is not a substitute for management's ultimate decision-making responsibilities. There can be no assurance that the estimates made or assumptions employed in preparing this report will in fact be realized or that other methods or assumptions might not be appropriate. The conclusions expressed in this report are as of the date of this report, and an analysis conducted as of another date may require different conclusions. The actual results achieved will depend on a variety of factors including the performance of management, the impact of changes in general and local economic conditions and the absence of material changes in the regulatory or competitive environment. Page 6 II. PROJECT DESCRIPTION In this section, LF&M describes the subject property, its proposed redevelopment and operating characteristics, site location and neighborhood environment. A. LOCATION The Hilltop community is located about three-quarters of a mile south of US Route 40 (Baltimore National Pike) and east of US Route 29 (Columbia Pike). More specifically the site is located at 3570 Court House Drive in Ellicott City, Maryland. The immediate neighborhood is predominately residential with a mix of single family homeownership and multifamily developments. The neighborhood also includes some nearby commercial properties including the Courthouse Square Office Park. In addition, Howard County Government offices are located at the intersection of Rogers Avenue and Courthouse Drive, just a quarter of a mile north. This is the main center for County administrative services and activities. It is also the headquarters for the Howard County Police. Historic Main Street in Ellicott City is located just to the south. The site has excellent access to commercial and public service amenities. B. HILLTOP APARTMENTS DESCRIPTION The Hilltop community is located on a site of approximately 17.8 acres currently occupied by the Hilltop and Ellicott Terrace low-income housing projects. Their total 154 rental units will be demolished and replaced with new construction in phases. Ownership Howard County Housing Commission, the jurisdiction’s public housing authority, will own the redeveloped property. Stavrou Associates is the Developer. Existing Properties Built in 1969 to replace a row of wooden rental cottages without indoor plumbing that had served as Ellicott City's African-American enclave, Hilltop has 94 brick town houses and apartments on a hilly 12-acre site, plus a 2006 apartment house for low-income seniors. Ellicott Terrace is a 60-unit garden-style brick complex on just under 4 acres within sight of Hilltop. Page 7 DeLorme Street Atlas USA® 2009 Regional Map Data use subject to license. Scale 1 : 200,000 TN 0 © DeLorme. DeLorme Street Atlas USA® 2009. www.delorme.com MN (11.0°W) 0 1 1 2 2 3 1" = 3.16 mi 3 4 4 5 5 mi km Data Zoom 10-0 The Carter Center, which was built as a segregated elementary school for Ellicott City's African-American children, later served as the county's police station before its expansion and conversion for recreational and educational use. It is also the site of the county's only publicly owned and operated swimming pool. Redevelopment The subject is proposed as Phase I of the redevelopment effort. The subject property will be a 206-unit mixed income community with 92 units having affordable restrictions. The multifamily structures will be a mix of manor style houses, 2-over-2 townhomes and small apartment buildings. There will be 1BR, 2BR and 3BR unit types. Eleven units will target households with disabilities. Each unit will have wall-to-wall carpeting, cable access, high speed Internet access and split HVAC systems. Apartments will have fully applianced kitchens with dishwasher, disposal and microwave. Washer/dryer hook-ups will be in each unit, though community laundry facilities will also be provided. Utilities will be all-electric, with residents responsible for paying the cost. Management will be responsible for trash and cold water. Included in the overall redevelopment, but financed separately, is a new 40,000 sq.ft. state-of-the-art community recreation facility that is being built by Howard County. Displacement Occupancy in the existing properties is currently approximately 84%. All qualified current residents will retain units in the redeveloped property. The goal is to have no permanent displacement. The Developer will most likely lease offsite apartments (60 or so) into which residents will be temporarily relocated. Existing buildings will be demolished in phases, new structures will be built, then residents will be moved into their new units. The relocation plan will tie into the construction phasing plan. Income Targeting All current residents wishing to maintain residency will be retained. LIHTC units will be targeted to households earning 30% and 60% of area median income (AMI). Market rate units will not have income restrictions. There will be no project-based rental subsidies. Tables outlining the community’s proposed unit types and sizes, estimated utilities, proposed contract rents and income targeting follow. Page 8 HILLTOP FAMILY APARTMENTS SUBJECT SITE PHOTOGRAPHS Hilltop Apartments LIHTC Unit Mix Units 6 10 6 46 6 18 92 Size 1BR/1BA 1BR/1BA 2BR/2BA 2BR/2BA 3BR/2BA 3BR/2BA Sq.Ft. 700 700 925 925 1,200 1,200 Utilities $100 $100 $125 $125 $150 $150 Contract Rent $345 $784 $409 $936 $466 $1,075 Target Income 30% AMI 60% AMI 30% AMI 60% AMI 30% AMI 60% AMI Hilltop Apartments Market Rate Unit Mix Units 19 65 30 114 Size 1BR/1BA 2BR/2BA 3BR/2BA Sq.Ft. 700 925 1,200 Contract Rent $1,250 $1,675 $1,975 LIHTC Rent Analysis LF&M has analyzed the subject’s rents in comparison to HUD guidelines. The maximum rents cited below are based upon a household size of 1.5 persons per bedroom. Gross rents include utilities. The Developer estimates utility allowances as: $65 for 1BR units, $88 for 2BR units and $124 for 3BR units. Residents are responsible for their own electric for heat and hot water heating as well as electric cooking and personal electric charges. The owner will pay for water and sewer as well as trash collection. The maximum allowable gross and contract rents (calculated using the maximum utility expenses for each unit size) under LIHTC guidelines in 2010 are: Maximum Allowable LIHTC Rents Unit Type 1BR/1BA (30%) 1BR/1BA (60%) 2BR/2BA (30%) 2BR/2BA (60%) 3BR/2BA (30%) 3BR/2BA (60%) Max. Gross Rent $462 $925 $555 $1,110 $641 $1,282 Page 9 Utilities $100 $100 $125 $125 $150 $150 Max. Contract Rent $362 $825 $430 $985 $491 $1,132 LF&M, then, calculates the maximum allowable 2010 contract rents for the subject as ranging from $362-$1,132 per month. LIHTC Incomes and Rents Using CDA’s 2010 guidelines, maximum household incomes are capped at the following levels in 2010 dollars: Maximum Household Incomes Target Population 1 Person 2 Persons 3 Persons 4 Persons 5 Persons 30% AMI $17,280 $19,740 $22,200 $24,660 $26,640 60% AMI $34,560 $39,480 $44,400 $49,320 $53,280 Residents will also need to earn minimum incomes sufficient to afford their rents. LF&M's analysis will be performed at CDA's minimum income qualification standard in which gross rent (contract rent plus utilities) must be no more than 30% of household income. Based on LF&M's knowledge of the practices of other family housing providers, the typical management policy is that contract rent is up to 30%-35% of gross household income. The CDA standard is, therefore, conservative. Operating Expenses The Developer has prepared an operating budget which is based upon a stabilized occupancy of 93%. LF&M believes that such an occupancy rate is easily attainable since the subject’s LIHTC rents will be significantly below market and the market units will be very competitive within the marketplace—all in an excellent location. LF&M has consulted the Institute of Real Estate Management's Income/Expense Analysis: Conventional Apartments (2009 Edition) regarding operating expenses for apartment properties comparable to the subject. Please note that the IREM statistics are intended to serve as benchmarks, since no two properties are ever going to encounter identical maintenance problems or run up the same utility bills during the year--despite any of their locational, structural or other similarities. The median expenses stated below might, therefore, be considered "typical" expenses: Page 10 Baltimore Metropolitan Area – 2008 Median Operating Costs/Unit Elevator Administrative $1,822 Operating $1,663 Maintenance $1,215 Taxes/Insurance $890 Recreation/Amenities $51 Other Payroll $654 Total All Expenses $5,236 Source: Institute of Real Estate Management, 2009. Garden $1,026 $895 $828 $1,167 $65 $675 $4,637 The Developer estimates the subject property's annual operating expenses at $5,153 per unit excluding a $300 contribution to replacement reserves. Overall the subject’s expenses are in line with the market, despite the fact that it will be providing additional services to its residents. LF&M finds, therefore, that the subject’s operating expenses are reasonable in light of operating costs in the Baltimore Metropolitan Area. C. NEIGHBORHOOD AND COMMUNITY SERVICES The subject has excellent access to commercial and public service amenities, most within an easy drive. At the corner of Baltimore National Pike and Rogers Avenue are located PNC Bank and Rite Aid. Other shopping opportunities may be found predominately along US Route 40 (Baltimore National Pike). Commercial Services Neighborhood shopping opportunities are in abundance, most being located along Baltimore National Pike: Super Fresh Supermarket located at 3301 North Ridge Road Walmart located at 3200 North Ridge Road St. John’s Crossing – This center is located at 9150 Baltimore National Pike. The center is 87,760 sq.ft. and is anchored by Mar’s Super market. Other retailers include Rite Aid, Advance Auto Parts, Bank of America, St. Johns Liquors, St. Johns Cleaners, Wells Fargo Financial, Bare Bones Restaurant and Hair Affair Chatham Station Shopping Center – Located at 9180 Baltimore National Pike, this 480,731 sq.ft. retail center is anchored by Giant Food, Home Depot and Sears. Page 11 Other retailers include Einstein Bros Bagels, Goodyear, Hallmark, RadioShack Burger King, Wachovia Bank and U.S. Cleaners. Long Gate Center – This 405,000 sq.ft. community shopping center is anchored by several national retailers, including Safeway, Target, Kohl’s and Barnes & Noble Booksellers and includes other, smaller specialty shops, such as Old Navy, Michael’s and Linens & Things. There are several national chain restaurants located here, including McDonald’s, Outback Steakhouse, Carraba’s and Uno Pizzeria. The center is located at Long Gate Parkway and Montgomery Road. Main Street – Ellicott City’s historic Main Street is located a short distance from the subject. This area offers a large selection of antique and specialty shops, restaurants and cafés. In addition, the Mall in Columbia is located approximately 4.8 miles south of the subject. This regional center is a 1.5 million sq.ft. super-regional shopping mall with five anchor department stores (Nordstrom, Lord & Taylor, Sears, Macy's, and JC Penney) and over 200 stores and restaurants. The mall also contains a 14-screen AMC movie theater, an LL Bean retail store, a Cheesecake Factory restaurant and a Bank of America branch. The Mall is the ultimate focal point and social center for all of Columbia and Howard County. Public Services Public services serving the community include: U.S. Post Office at 8267 Main Street, Ellicott City Volunteer Fireman’s Association at 4150 Montgomery Road Police Department at 3410 Courthouse Drive, Library (Miller Branch) at 9421 Frederick Court Road. Public Transit Overall, Howard County is well served by public transportation. The Howard Transit Yellow bus route currently has a designated transit stop at the subject site on Mt. Ida Drive. This bus provides hourly service Monday through Friday (and limited service Saturday) between the hours of 6:00 a.m. – 8:00 p.m. Scheduled bus service operates daily along nine fixed routes throughout Ellicott City and Columbia as well as the MARC stations in Savage, Elkridge and BWI Airport. The cost of a ride is $1.50 although a monthly pass with unlimited service is available for $47 per month. The Maryland Transit Authority (MTA) operates bus routes in various locations along U.S. Route 40 and in Columbia for commuters traveling to either Baltimore or Washington, D.C. These bus routes offer express service during the morning and evening rush hours. The MARC commuter train has stops in Dorsey, Jessup and Savage with connecting service to Columbia via Howard Transit. Page 12 Baltimore-Washington International Thurgood Marshall Airport and the nearby Amtrak Station are located less than 20 minutes from the subject site via major highways. Medical Services The site has good access to medical and other support services which are crucial to the health and well-being of its residents. Howard County General Hospital is located in west Columbia at the intersection of Cedar Lane and Little Patuxent Parkway. It is owned and operated by Johns Hopkins Hospital and is the County’s only full-service medical facility. In addition to inpatient services, there are specialty clinics for treatment of both heart disease and cancer. Medical facilities serving the Ellicott City area include the Howard County Medical Center on Chevrolet Drive, off St. John’s Lane. These two medical buildings are wellknown throughout the County for their well-established primary and specialty care physicians. Ellicott City Health Center is located at 8492 Baltimore National Pike in the Normandy Shopping Center. This clinic, run by the Health Department, includes facilities for dental and other specialized care. The main health clinic in the County is located at 7180 Columbia Gateway Drive. This facility provides a host of services, including immunizations, maternity care, HIV testing, etc. There are numerous private physicians and other medical practitioners located throughout Howard County. Schools Public schools serving the subject site are Veterans Elementary School, Dunloggin Middle School and Centennial High School. Performance measures for each public school and comparisons to other schools in the County are listed below. The following MSA data is based on information from Maryland State Department of Education, MDK12 and the 2009 Maryland Report Card. Veterans Elementary School (Grades Pre-K through 5) is located at 4443 Montgomery Road. In 2009 the school had an enrollment of approximately 904 students. The 5th graders at Veterans Elementary lagged somewhat behind Howard County 5th graders generally, with 63.4% reading at the proficient level compared to 71.1% for the County. In the 2008-2009 school years, 5th graders scored 91.6% in reading at the proficient or advanced levels and 86.7% in math. Dunloggin Middle School, located at 9129 Northfield Road had an enrollment of approximately 515 students in 2009. Among Dunloggin Middle’s 8th graders, 91.9% scored at the proficient or advanced levels in reading in the 2008-2009 school years. Math scores were even higher, with 95.4% scoring at those levels. Page 13 Centennial High School, located at 4300 Centennial Lane, originally opened in 1977. Enrollment in 2009 was approximately 1,486 students. All 12th graders at Centennial High School met the High School Assessments (HSAs) requirements for graduation in 2009. According to the 2010 Maryland Report Card, the attendance rate was 95.7%. The school’s graduation rate was 96.2% with 80.4% of those graduates planning to attend a four-year college and 7.7% planning to attend a two-year college. Higher Education Howard Community College, located near Howard County General Hospital in Columbia, opened its 120-acre campus in 1970. The college has grown tremendously and now has an overall enrollment of approximately 23,000 full- and part-time students in a variety of associate degree and transfer programs, such as nursing, computer science, music, etc. Both Johns Hopkins University and Loyola University Maryland are located in Columbia Town Center and operate graduate satellite programs in such fields as engineering, physics, computer science and business administration, among others. Other higher education opportunities in Columbia include The Lincoln Technical Institute located at 9325 Snowden River Parkway and the University of Phoenix located at 8830 Stanford Boulevard. The University of Maryland Baltimore County (UMBC) is located in nearby Catonsville at the interchange of I-95 and I-195. This campus of the University of Maryland specializes in physical and biological sciences, engineering, information technology and the humanities. The school offers 37 undergraduate majors, 27 master’s degrees and 21 doctoral degree programs. Recreation/Parks Recreational facilities are numerous throughout Howard County. Howard County Recreation and Parks have extensive programming for children, youth and adults, including organized sports, at affordable rates. The Roger Carter Pool and Recreation Center is located in historic Ellicott City, less than a five minute car ride from the subject site. The Center offers the County’s only public swimming pool. In addition, the Roger Carter/Hilltop After-School Program provides low- and moderate-income children with a safe, structured environment in which they receive academic assistance with homework assignments, technology training, a cultural exposure component and help with nutritional food preparation. The Howard County YMCA is located along Montgomery Road east of the subject site. This facility offers and indoor swimming pool, exercise room and classes for both children and adults at reasonable membership fees. Page 14 There are over 7,000 acres of protected open space in Howard County in several state and municipal parks. Many of these park areas are located in relatively close geographic proximity to the subject including Patapsco Valley State Park, Patuxent River State Park and Centennial Park. Community Services Summary The subject is, therefore, centrally located and proximate to a broad range of commercial and public services. The following table notes critical services and the distance to each service measured on a straight-line basis from the subject. Community Services (Distance from Subject) Shopping Healthcare Pharmacy Education Public Transit Library Police Fire Parks Recreation Center Name Distance Super Fresh Supermarket Howard County General Hospital Rite Aid Veterans Elementary Howard Community College Yellow-Howard County Transit 9421 Frederick Road 3410 Courthouse Drive 4150 Montgomery Road Patapsco Valley State Park 3676 Fels Lane 0.85 miles 5.6 miles 0.75 mile 1.8 miles 5.38 miles At front door 1.78 miles 0.25 miles 1.30 miles 2.20 miles Three blocks D. SUMMARY In summary, the Hilltop Apartments are assessed as having many positive attributes including: Location - The subject is centrally located in Ellicott City. Quality schools, retail opportunities, quality healthcare, public transportation are all easily available to the subject’s residents. Redevelopment - The subject is Phase I of the redevelopment of an obsolete and underutilized public housing site—replacing existing improvements with a high quality, mixed income multifamily development. Affordable Rents - The subject offers 206 mixed income apartment units. The 92 affordable units will target households at 30%-60% AMI. Market rate apartments will total 114. Affordable rental housing is an increasingly scarce commodity in the expensive Howard County market. Page 15 Employment - Residents will have access to ample employment opportunities in Howard County, one of the strongest and fastest-growing employment markets in the Washington-Baltimore region. BRAC-related development pressure will only accelerate job creation, though it will also likely increase price pressure on housing. Page 16 III. MARKET AREA TRENDS In this section, LF&M defines the Primary Market Area from which the subject will draw the majority of its residents. We then describe the demographic, housing and economic trends within the area which will affect the property and its residents. A. MARKET AREA DEFINITION LF&M has defined the subject property’s geographic Primary Market Area (PMA) to be the Ellicott City area of Howard County. We judge that the majority of the subject's residents will be drawn from the defined PMA, which is generally bound as follows: Patapsco River and rail lines to the north, Route 108 to the south, Patapsco State Park and rail lines to the east and Turf Valley/Manor Road to the west. This geographic area is known as Regional Planning District (RPD) 603-Ellicott City, as defined by the Baltimore Metropolitan Council. The Ellicott City PMA consists of the following eleven census tracts: 6021.00 6022.00 6023.02 6023.03 6023.04 6023.05 6023.06 6026.00 6027.00 6028.00 6029.00 The subject site is located in CT 6028.00. A map of the PMA is presented on the following page. LF&M has focused on the PMA characteristics which we believe are most relevant to the demand for affordable multifamily housing in our defined geographic area within Howard County. We have relied upon Environmental Systems Research Institute, Inc. (ESRI) for 2010 and 2015 population and household estimates and forecasts and upon the 2000 U.S. Census for our analysis of other trends. Though significant growth has occurred in the PMA over the past decade, we judge that most of the trends and relationships within the data sets revealed in the last census are likely valid in 2010. In addition, LF&M compares trends within the Ellicott City PMA to those in Howard County generally in order to add context to our analysis. Howard County has been experiencing significant and steady growth and is the fastest growing county in the Baltimore Metropolitan Region. The county is bounded to the north by Carroll County; to the east by Baltimore and Anne Arundel counties; by Prince George’s and Montgomery counties to the south; and Montgomery and Frederick counties to the west. Page 17 Primary Market Area Printed from BusinessMAP by ESRI. B. DEMOGRAPHIC CHARACTERISTICS Population and Households Population As summarized in Table III-1, the total population in the PMA was 52,978 in the 2000 U.S. Census. This was an increase of 12,502 persons since the 1990 U.S. Census—a 30.9% increase in population during the decade. By 2010, the PMA population is estimated to have increased an additional 7,907 persons to 60,885. Over the next five years, it is anticipated that the population will increase at a somewhat slower pace—by 2,866 persons or 4.7%. The total population in Howard County stood at 247,842 in 2000, an increase of 60,514 persons (32.3%) since 1990. The County’s population is estimated to have increased by another 14.6% through 2010 and is expected to continue its growth by 4.6% during the 2010-2015 period to total 296,964 persons by 2015. In all periods, the PMA is growing at approximately the same rate as Howard County overall. Households During the decade of the 1990’s, the number of PMA households increased by 4,260 (29.1%) to 18,922 in 2000. By 2010 there are an estimated 22,036 PMA households— a figure which is expected to increase to 23,175 by 2015. Howard County grew by 21,706 households (31.8%) during the 1990’s to a total of 90,043 households in 2000. The household count is estimated to be 102,847 in 2010. The number of County households is expected to increase to 109,538 by 2015. The PMA’s average household size is currently estimated at 2.74 persons per household, slightly larger than the County’s average household size of 2.72 persons. This indicates the presence of a solid proportion of families with children in both geographies, as further described below. Types of Households The types of households residing in the PMA and in Howard County in 2000 are summarized in Table III-2. The following characteristics are critical factors in the type of housing which is required in those areas: Family Households - While the overwhelming majority of households in the PMA (76.6%) and the County (73.6%) are family households, the PMA has a higher proportion of married couple families than Howard County as a whole (66.9% vs. Page 18 Table III-1 HILLTOP APARTMENTS Population and Households PMA and Howard County 1990, 2000, 2010, 2015 Population: 1990 PMA Howard County 2000 2010 Change (00-10) Persons Percent 2015 Change (10-15) Persons Percent 40,476 52,978 12,502 30.9% 60,885 7,907 14.9% 63,751 2,866 4.7% 187,328 247,842 60,514 32.3% 283,917 36,075 14.6% 296,964 13,047 4.6% 1990 2000 Households: PMA Change (90-00) Persons Percent Change (90-00) Households Percent 2010 Change (00-10) Households Percent 2015 Change (10-15) Households Percent Average Household Size 14,662 2.75 18,922 2.77 4,260 0.02 29.1% 0.7% 22,036 2.74 3,114 -0.03 16.5% -1.1% 23,175 2.73 1,139 -0.01 5.2% -0.4% Howard County Average Household Size 68,337 2.71 90,043 2.71 21,706 0.00 31.8% 0.0% 102,847 2.72 12,804 0.01 14.2% 0.4% 109,538 2.72 6,691 0.00 6.5% 0.0% Source: 1990 & 2000 U.S. Census of Population and Housing; 2010 & 2015 ESRI estimates and forecasts; Table III-2 HILLTOP APARTMENTS Households by Household Type Primary Market Area and Howard County 2000 PMA Households % of Total Howard County Households % of Total Total Households 18,945 100.0% 90,102 100.0% Family Households 14,518 76.6% 66,355 73.6% 12,679 6,899 5,780 66.9% 36.4% 30.5% 55,067 29,281 25,086 61.1% 32.5% 27.8% 446 236 210 2.4% 1.2% 1.1% 2,948 1,565 1,383 3.3% 1.7% 1.5% 1,393 889 504 7.4% 4.7% 2.7% 8,340 5,415 2,925 9.3% 6.0% 3.2% 831 490 341 4.4% 2.6% 1.8% 5,061 2,651 2,410 5.6% 2.9% 2.7% 3,596 1,547 2,049 19.0% 8.2% 10.8% 18,686 8,126 10,560 20.7% 9.0% 11.7% Married Couple Family with own children under 18 no own children under 18 Male Householder, no wife present with own children under 18 no own children under 18 Female Householder, no husband present with own children under 18 no own children under 18 Nonfamily Households Male Householder Female Householder 1 Person Household Male Householder Female Householder Source: U.S. Census of Population and Housing, SF-3, P10, 2000; compiled by Lipman Frizzell & Mitchell LLC. 61.1%). Over half of those married couples have minor children in both geographies. Female Householder - Households headed by a female represent 7.4% of all PMA households, a proportion lower than the County’s 9.3%. Almost two-thirds (63.8%) of PMA female householders are raising minor children. These households typically have fewer financial resources than married couple households with children. Single Person Households – Nearly one-fifth (19.0%) of PMA households are single persons, a share lower than the County’s 20.7%. The majority (57.0%) of the PMA’s single person households are females. Householder Age by Tenure As summarized in Table III-3, 25.1% of all households in the PMA were renters in 2000—a somewhat lower proportion than the County’s 26.2%. In the PMA, renters are in the majority only for the prime renter demographic of households age 15-34 years. The PMA had a homeownership rate slightly higher than the County overall in 2000: 74.9% as compared to the County’s 73.8%. C. HOUSING CHARACTERISTICS As recorded in the Census (Table III-4), there were 18,922 occupied housing units in the PMA in 2000. Characteristics of the housing supply relevant to our analysis include: Structure Type The predominant type of housing in both the PMA and County markets is single family structures (detached and attached). In the PMA there is an exceedingly low proportion of townhomes compared to the County as a whole (12.3% vs. 20.9%) and a much higher proportion (65.4% vs. 54.6%) of detached homes. Homeowners in both the PMA and County reside almost exclusively in single family homes: 98.5% and 92.9% respectively. Almost four-fifths (79.7%) of renters in the PMA live in larger multifamily structures of more than five units, as compared to 68.5% in the County overall. Less than one-tenth (9.4%) of PMA renters live in townhome units—a significantly lower proportion than the County’s 16.9% overall. Owner-Occupied Housing Housing in Howard County covers a broad spectrum, including working farms, single family subdivisions, townhomes and multifamily rental and for-sale communities. Most Page 19 Table III-3 HILLTOP APARTMENTS Age of Householder by Tenure Primary Market Area and Howard County 2000 Owner Households Renter Households Total Households Households % by Age Percent of Households Owner Renter Primary Market Area Total 14,176 4,746 18,922 100.0% 74.9% 25.1% 15-24 years 25-34 years 35-44 years 45-54 years 55-64 years 65+ years 12 1,162 3,901 4,477 2,160 2,464 477 1,369 989 859 258 794 489 2,531 4,890 5,336 2,418 3,258 2.6% 13.4% 25.8% 28.2% 12.8% 17.2% 2.5% 45.9% 79.8% 83.9% 89.3% 75.6% 97.5% 54.1% 20.2% 16.1% 10.7% 24.4% Total 66,414 23,629 90,043 100.0% 73.8% 26.2% 15-24 years 25-34 years 35-44 years 45-54 years 55-64 years 65+ years 420 9,057 19,463 18,924 10,562 7,988 2,064 7,863 6,012 3,424 1,541 2,725 2,484 16,920 25,475 22,348 12,103 10,713 2.8% 18.8% 28.3% 24.8% 13.4% 11.9% 16.9% 53.5% 76.4% 84.7% 87.3% 74.6% 83.1% 46.5% 23.6% 15.3% 12.7% 25.4% Howard County Source: U.S. Census of Population and Housing, SF-3, Table H-14, 2000. Table III-4 HILLTOP APARTMENTS Occupied Housing by Structure Type Primary Market Area and Howard County 2000 Homeowner Units % of Total Units Renter % of Total Units Total % of Total Primary Market Area 1, detached 1, attached 2 3-4 5-9 10-19 20-49 50 or more Mobile home Other TOTAL 12,075 1,879 16 40 52 72 34 0 0 8 14,176 85.2% 13.3% 0.1% 0.3% 0.4% 0.5% 0.2% 0.0% 0.0% 0.1% 100.0% 301 444 91 130 1,626 1,193 456 497 0 8 4,746 6.3% 9.4% 1.9% 2.7% 34.3% 25.1% 9.6% 10.5% 0.0% 0.2% 100.0% 12,376 2,323 107 170 1,678 1,265 490 497 0 16 18,922 65.4% 12.3% 0.6% 0.9% 8.9% 6.7% 2.6% 2.6% 0.0% 0.1% 100.0% Howard County 1, detached 1, attached 2 3-4 5-9 10-19 20-49 50 or more Mobile home Other TOTAL 46,861 14,843 90 242 1,027 1,387 271 168 1,513 12 66,414 70.6% 22.3% 0.1% 0.4% 1.5% 2.1% 0.4% 0.3% 2.3% 0.0% 100.0% 2,330 3,999 312 804 4,522 7,600 1,366 2,451 219 26 23,629 9.9% 16.9% 1.3% 3.4% 19.1% 32.2% 5.8% 10.4% 0.9% 0.1% 100.0% 49,191 18,842 402 1,046 5,549 8,987 1,637 2,619 1,732 38 90,043 54.6% 20.9% 0.4% 1.2% 6.2% 10.0% 1.8% 2.9% 1.9% 0.0% 100.0% Source: U.S. Census of Population and Housing, SF-3, H-32, 2000. of the housing in the County is oriented towards middle and upper income homebuyers. In fact, the County's prices are second only to Montgomery County among Maryland jurisdictions, making homeownership affordability a very real issue for moderate income households. Residential real estate values for all owner-occupied housing in the PMA are illustrated in Table III-5. ESRI estimates the 2010 PMA median home value at $429,508, which is 16.6% higher than the County's median of $368,238. Rental Housing Rents charged in the PMA (Table III-6) were lower than those charged throughout Howard County. The 2000 PMA median contract rent (not including utilities) was $658—17.5% lower than the County’s overall median contract rent of $798 per month. In the PMA and the County, nearly one-tenth of rents were lower than $500—pointing to a similar concentration of subsidized rental housing in both geographies. Rents in the PMA tended to be concentrated in the mid-range (62.0% between $500 and $749), whereas County rents tended to be focused in a higher price range (49.6% between $750 and $1,249) in the County overall—likely due to the influence of the Columbia market. It should be noted that, according to the 2000 Census, over one-third (33.9%) of Howard County renter households paid more than 30% of their incomes towards total housing expenses (i.e., rent plus utilities or “gross rent”) at that time. LF&M judges that that proportion has only increased in recent years. Households paying more than 30% of income towards housing expenses are considered “housing cost burdened” by HUD. D. ECONOMIC CHARACTERISTICS Income Trends In Table III-7, LF&M has summarized income trends for the PMA and Howard County based on the 2000 U.S Census and ESRI estimates for 2010 and 2015. Attention should be given to the following issues: Household Incomes - ESRI estimates the median household income for the PMA in 2010 at $105,500, which is 3.5% higher than the County median of $101,954. Households in the PMA earning less than $25,000 comprised 7.7% of all households as compared to 6.6% of County households overall in that category. PMA incomes are slightly more diverse, with 27.2% of households earning more than $150,000 in 2010 as compared to 25.0% for the County. Very Low Income Households - The proportion of very low income households (those with incomes less than $15,000 annually) in the PMA is small, only 4.0% of Page 20 Table III-5 HILLTOP APARTMENTS Estimated Value of Owner-Occupied Housing Units PMA and Howard County 2010 PMA Units Less than $10,000 $10,000 - $14,999 $15,000 - $19,999 $20,000 - $24,999 $25,000 - $29,999 $30,000 - $34,999 $35,000 - $39,999 $40,000 - $49,999 $50,000 - $59,999 $60,000 - $69,999 $70,000 - $79,999 $80,000 - $89,999 $90,000 - $99,999 $100,000 - $124,999 $125,000 - $149,999 $150,000 - $174,999 $175,000 - $199,999 $200,000 - $249,999 $250,000 - $299,999 $300,000 - $399,999 $400,000 - $499,999 $500,000 - $749,999 $750,000 - $999,999 $1,000,000 or more Total Median Value % of Total Howard County Units % of Total 0 0 0 0 3 5 12 39 16 12 17 27 11 22 69 125 330 1,053 1,220 3,841 3,799 4,405 740 100 0.0% 0.0% 0.0% 0.0% 0.0% 0.0% 0.1% 0.2% 0.1% 0.1% 0.1% 0.2% 0.1% 0.1% 0.4% 0.8% 2.1% 6.6% 7.7% 24.2% 24.0% 27.8% 4.7% 0.6% 131 83 85 104 181 170 120 295 150 153 187 248 371 818 1,384 2,169 3,301 8,342 7,929 16,611 11,663 14,270 5,196 1,151 0.2% 0.1% 0.1% 0.1% 0.2% 0.2% 0.2% 0.4% 0.2% 0.2% 0.2% 0.3% 0.5% 1.1% 1.8% 2.9% 4.4% 11.1% 10.6% 22.1% 15.5% 19.0% 6.9% 1.5% 15,846 $429,508 100.0% 75,112 $368,238 100.0% Source: ESRI estimate, 2010; compiled by Lipman Frizzell & Mitchell LLC. Table III-6 HILLTOP APARTMENTS Contract Rent of Specified Renter Occupied Units PMA and Howard County 2000 PMA Units < $100 $100 - $149 $150 - $199 $200 - $249 $250 - $299 $300 - $349 $350 - $399 $400 - $449 $450 - $499 $500 - $549 $550 - $599 $600 - $649 $650 - $699 $700 - $749 $750 - $799 $800 - $899 $900 - $999 $1,000 - $1,249 $1,250 - $1,499 $1,500 - $1,999 $2,000 + No Cash Rent % of Total Howard County Units % of Total 72 43 18 34 8 52 32 49 114 430 637 717 647 473 234 335 147 165 94 215 105 61 1.5% 0.9% 0.4% 0.7% 0.2% 1.1% 0.7% 1.0% 2.4% 9.2% 13.6% 15.3% 13.8% 10.1% 5.0% 7.2% 3.1% 3.5% 2.0% 4.6% 2.2% 1.3% 430 290 223 233 148 217 184 319 414 854 1,005 1,417 1,567 2,214 2,029 4,428 2,800 2,354 820 694 275 492 1.8% 1.2% 1.0% 1.0% 0.6% 0.9% 0.8% 1.4% 1.8% 3.6% 4.3% 6.1% 6.7% 9.5% 8.7% 18.9% 12.0% 10.1% 3.5% 3.0% 1.2% 2.1% Renter Occ. Units 4,682 100.0% 23,407 100.0% Median Contract Rent $658 $798 Source: 2000 U.S. Census of Population and Housing; compiled by Lipman Frizzell & Mitchell LLC Table III-7 HILLTOP APARTMENTS Household Incomes PMA and Howard County 2000, 2010, 2015 2000 Under $15,000 $15,000 - $24,999 $25,000 - $34,999 $35,000 - $49,999 $50,000 - $74,999 $75,000 - $99,000 $100,000 - $149,999 $150,000 - $199,999 $200,000 or more Total Households Median Income 2010 Under $15,000 $15,000 - $24,999 $25,000 - $34,999 $35,000 - $49,999 $50,000 - $74,999 $75,000 - $99,000 $100,000 - $149,999 $150,000 - $199,999 $200,000 or more Total Households Median Income 2015 Under $15,000 $15,000 - $24,999 $25,000 - $34,999 $35,000 - $49,999 $50,000 - $74,999 $75,000 - $99,000 $100,000 - $149,999 $150,000 - $199,999 $200,000 or more Total Households Median Income Households: PMA County Percent by Income: PMA County 925 1,091 1,434 2,136 3,345 3,149 4,127 1,677 1,061 4,400 4,594 6,404 10,756 19,397 15,821 17,661 6,524 4,545 4.9% 5.8% 7.6% 11.3% 17.7% 16.6% 21.8% 8.9% 5.6% 27.1% 5.1% 7.1% 11.9% 21.5% 17.6% 19.6% 7.2% 5.0% 18,945 $78,245 90,102 $74,181 100.0% 122.2% Households: PMA County Percent by Income: PMA County 888 822 1,092 1,854 3,043 2,460 5,881 3,342 2,654 3,794 3,018 3,982 8,799 16,521 13,789 27,269 14,259 11,416 4.0% 3.7% 5.0% 8.4% 13.8% 11.2% 26.7% 15.2% 12.0% 3.7% 2.9% 3.9% 8.6% 16.1% 13.4% 26.5% 13.9% 11.1% 22,036 $105,500 102,847 $101,954 100.0% 100.0% Households: PMA County Percent by Income: PMA County 684 622 734 1,328 2,828 1,656 7,185 4500 3638 3,959 3,171 4,115 9,648 19,609 10,657 30,269 15,355 12,755 3.0% 2.7% 3.2% 5.7% 12.2% 7.1% 31.0% 19.4% 15.7% 3.6% 2.9% 3.8% 8.8% 17.9% 9.7% 27.6% 14.0% 11.6% 23,175 $125,550 109,538 $107,127 100.0% 100.0% Source: 2000 US Census; ESRI estimates and forecasts, 2010; compiled by Lipman Frizzell & Mitchell LLC. PMA households in 2010. This is a proportion only slightly greater than the County’s 3.7%. Poverty Status As outlined in Table III-8, only a small proportion of households in the PMA are severely economically distressed. In 2000, the proportion of households below the poverty line was 3.5% in the PMA as contrasted with 3.6% in the County as a whole. We also note the following: Married Couple Households - Married couple households tend to fare better economically than other households due to the likelihood of having two earners or a strong primary earner, with over 98% of all married couples in both the PMA and County earning above the poverty line. Female Householder with Children - The largest single group of households living in poverty in both the PMA and County is households headed by females with minor children. The poverty rate for this group was 11.1% in the PMA and 13.4% in the County. Senior Households - The proportion of senior households living in poverty in the PMA was 5.7%, a proportion somewhat lower than the County’s 7.0%. We judge that a high proportion of these seniors were female householders living alone. Income by Tenure Table III-9 addresses the issue of dramatic income disparity between homeowners and renters. In 2000, the median income of PMA owners ($93,781) was almost double that of PMA renters ($48,509). For Howard County as a whole, the income disparity was similar, with homeowners having a $86,933 median income as compared to a median of $44,315 for renters. Whereas more than one quarter (27.5%) of PMA renters earned less than $25,000 per year, only 5.2% of owners were in that income range. Approximately one quarter (23.6%) of the lowest income (<$25,000) renters in Howard County lived in the PMA. In 2000, among the 2,041 PMA households earning less than $25,000 per year, over three fifths (63.8%) were renters. These households were renters by necessity, not by choice. Employment In the past three decades, Howard County has shifted from a primarily farming community to a combination urban and rural community due to the County’s active promotion of economic development and its central location between Washington, DC and Baltimore. Page 21 Table III-8 HILLTOP APARTMENTS Poverty Status of Households by Family Type PMA and Howard County 2000 PMA Poverty Level Below At or Above Hhlds Total % by Type % of Households Below At or Above Total 662 18,283 18,945 100.0% 3.5% 96.5% Family Households Male Householder, no wife present w/ Related Children under 18 313 29 21 14,205 417 248 14,518 446 269 76.6% 2.4% 1.4% 2.2% 6.5% 7.8% 97.8% 93.5% 92.2% Female Householder, no husband present w/ Related Children under 18 106 106 1,287 845 1,393 951 7.4% 5.0% 7.6% 11.1% 92.4% 88.9% Married-Couple Family w/ Related Children under 18 178 139 12,501 6,896 12,679 7,035 66.9% 37.1% 1.4% 2.0% 98.6% 98.0% Nonfamily Households Male Householder Female Householder 349 117 232 4,078 1,920 2,158 4,427 2,037 2,390 23.4% 10.8% 12.6% 7.9% 5.7% 9.7% 92.1% 94.3% 90.3% Householder Over 65 172 2,829 3,001 15.8% 5.7% 94.3% Howard County Poverty Level Below At or Above Hholds Total % by Type % of Households Below At or Above Total 3,288 86,814 90,102 100.0% 3.6% 96.4% Family Households Male Householder, no wife present w/ Related Children under 18 1,688 150 104 64,667 2,798 1,630 66,355 12,891 1,734 73.6% 5.0% 1.9% 2.5% 1.2% 6.0% 97.5% 80.3% 94.0% Female Householder, no husband present w/ Related Children under 18 843 791 7,497 5,131 8,340 5,922 9.3% 6.6% 10.1% 13.4% 89.9% 86.6% Married-Couple Family w/ Related Children under 18 695 436 54,372 30,247 55,067 30,683 61.1% 34.1% 1.3% 1.4% 98.7% 98.6% 1,600 568 1,032 22,147 10,209 11,938 23,747 10,777 12,970 26.4% 12.0% 14.4% 6.7% 5.3% 8.0% 93.3% 94.7% 92.0% 718 9,576 10,294 11.4% 7.0% 93.0% Nonfamily Households Male Householder Female Householder Householder Over 65 Source: U.S. Census of Population and Housing 2000, SF-3, Tables P90, P92 Table III-9 HILLTOP APARTMENTS Household Income by Tenure PMA and Howard County 2000 PMA <$5,000 $5,000-$9,999 $10,000-$14,999 $15,000-$19,999 $20,000-$24,999 $25,000-$34,999 $35,000-$49,999 $50,000-$74,999 $75,000-$99,999 $100,000-$149,999 $150,000 + Total Median Howard County Homeowners Households Percent Renters Households Percent Total 78 91 132 198 239 647 1,130 2,417 2,727 3,913 2,604 26.9% 29.7% 39.4% 39.2% 39.5% 45.0% 53.5% 71.8% 86.4% 93.9% 98.6% 212 215 203 307 366 791 981 949 429 255 38 73.1% 70.3% 60.6% 60.8% 60.5% 55.0% 46.5% 28.2% 13.6% 6.1% 1.4% 290 306 335 505 605 1,438 2,111 3,366 3,156 4,168 2,642 14,176 $93,781 74.9% 4,746 $48,509 25.1% 18,922 Homeowners Households Percent Renters Households Percent Total <$5,000 $5,000-$9,999 $10,000-$14,999 $15,000-$19,999 $20,000-$24,999 $25,000-$34,999 $35,00-$49,999 $50,000-$74,999 $75,000-$99,999 $100,000-$149,999 $150,000 + 396 406 640 853 1,234 3,290 6,167 13,717 13,116 16,246 10,349 31.0% 26.9% 39.9% 42.7% 46.6% 51.6% 57.6% 70.3% 83.4% 91.5% 94.7% 883 1,106 964 1,144 1,413 3,082 4,547 5,796 2,603 1,517 574 69.0% 73.1% 60.1% 57.3% 53.4% 48.4% 42.4% 29.7% 16.6% 8.5% 5.3% 1,279 1,512 1,604 1,997 2,647 6,372 10,714 19,513 15,719 17,763 10,923 Total Median 66,414 $86,933 73.8% 23,629 $44,315 26.2% 90,043 Source: U.S. Census of Population and Housing, 2000: SF-3, QT-H11; compiled by Lipman Frizzell & Mitchell LLC. LF&M has reviewed the structure of the Howard County economy using the Maryland Department of Labor’s employment and wage statistics for the fourth quarter of 2009, presented in Table III-10. The sectoral analysis of at-place-of-work employment, comparing Howard County to the State of Maryland follows: Government Sector – Howard County has proportionately fewer government jobs (12.6%) than the State as a whole (19.9%). Federal and state government workers represent a much lower proportion of the County’s employment, while the proportion of local government employees is similar to the state-wide average. Goods Producing Sector - The City’s goods producing sector (11.3%) is similar to the State's (11.0%) as a whole, although the proportion of construction jobs in the County (6.8%) is somewhat larger than the State’s (6.0%)—appropriate for a growing jurisdiction. Service Providing Sector - The service providing sector represents a much larger share of the County’s economy, with the County having proportionately more jobs in Trade, Transportation, Utilities than does the State (22.3% vs. 17.9%) and in Professional & Business Services (24.1% vs. 15.6%). The TTU sector is heavily influenced by retail employment and Howard County has a high concentration of those opportunities as an affluent suburban jurisdiction, anchored by Columbia Mall. The County is a major business location due to its strategic location on I-95 between Baltimore and Washington. Wages - Howard County wages overall are at a level slightly higher than those prevailing throughout the State, exhibiting a 7.3% premium in 4Q09. Reviewing the most current statistics available (July 2010) from the State, unemployment in Howard County has remained stable at 5.7% as compared to 12 months earlier. Only Montgomery County is reported to have an unemployment rate that low. During the same period, the Baltimore-Towson MSA and the State of Maryland each saw their unemployment rates increase to 8.2% and 7.6% respectively. The statistics are not seasonally adjusted. Labor Force, Unemployment & Unemployment Unemp. Rate Labor Force Employment Unemp. 7/10 7/09 Howard County 158,557 149,449 9,108 5.7% 5.7% MSA 1,400,598 1,286,138 114,460 8.2% 7.9% 3,006,345 2,778,607 227,738 Maryland Source: MD Dept. of Labor, Licensing and Regulation 7.6% 7.4% Howard County is a major center of employment and industry in the BaltimoreWashington metro area. There are approximately 70 business and industrial parks in Page 22 Table III-10 HILLTOP APARTMENTS Average Employment by NAICS Sector Howard County, State of Maryland Fourth Quarter Average 2009 Average Employment Howard Maryland Total Employment Government Sector - Total Federal Government State Government Local Government Private Sector Total - All Industries Goods Producing Natural Resources & Mining Construction Manufacturing Service Providing Trade, Transportation, Utilities Information Financial Activities Professional & Business Services Education & Health Services Leisure & Hospitality Other Services Unclassified Percent of Total Howard Maryland Howard Avg. Weekly Wages MD Diff. 143,039 2,464,445 100.0% 100.0% $1,131 $1,054 7.3% 18,046 619 3,290 14,137 489,774 134,298 101,167 254,309 12.6% 0.4% 2.3% 9.9% 19.9% 5.4% 4.1% 10.3% $995 $1,321 $822 $1,021 $1,192 $1,723 $904 $1,026 -16.5% -23.3% -9.1% -0.5% 124,993 1,974,671 87.4% 80.1% $1,150 $1,019 12.9% 16,109 406 9,763 5,940 270,436 6,226 147,480 116,730 11.3% 0.3% 6.8% 4.2% 11.0% 0.3% 6.0% 4.7% $1,214 $832 $1,208 $1,249 $1,210 $769 $1,153 $1,306 0.3% 8.2% 4.8% -4.4% 108,884 31,867 3,501 8,176 34,480 14,955 11,616 4,289 1,704,043 441,071 47,169 139,821 383,900 382,692 222,290 87,100 76.1% 22.3% 2.4% 5.7% 24.1% 10.5% 8.1% 3.0% 69.1% 17.9% 1.9% 5.7% 15.6% 15.5% 9.0% 3.5% $1,141 $972 $1,580 $1,393 $1,629 $876 $356 $682 $989 $798 $1,424 $1,436 $1,558 $972 $390 $681 15.4% 21.8% 11.0% -3.0% 4.6% -9.9% -8.7% 0.1% 0 192 0.0% 0.0% $0 $1,534 -100.0% Source: Office of Labor Market Analysis & Information, MD Dept. of Labor, Licensing & Regulation, 2010. the County as well as 45 retail centers. Altogether, it is estimated that there are more than 8,000 businesses in Howard County. Howard County’s strong economic development performance makes this jurisdiction a very dynamic employment environment. In addition, according to Howard County Economic Development Authority, the County will benefit over the next five to seven years from the influx of new jobs as a result of the 2005 Base Realignment and Closure Act (BRAC). The creation of roughly 22,000 new jobs over the next five years at both Fort Meade and the National Security Agency (NSA) in Anne Arundel County will clearly have a direct and positive impact on the neighboring Howard County economy. While many residents both live and work in Howard County, there are strong highway networks which connect the County to both Washington, DC and Baltimore metropolitan areas with their large concentrations of professional, technical and government jobs. As of the 2000 U.S. Census, 51.8% of all County workers age 16 and older worked outside Howard County and an additional 10.2% worked outside the State of Maryland, presumably primarily in the District of Columbia. E. SAFETY STATISTICS The Howard County Police Department actively tracks crime throughout the County. The subject’s immediate neighborhood is served by the Northern District Headquarters (Area 213). Police statistics for the area in 2009 report: 41 thefts, 33 incidents of vandalism; 11 burglaries; 11 vehicle thefts; 9 aggravated assaults; 76 drug violations, 14 incidents of disorderly conduct, and one rape. According to the 2009 Howard County Department of Police Annual Report, there was a 13.2% reduction in Part I serious crime in the County between 2008 and 2009. Serious crime levels remained reasonably consistent with 2005-2007 levels. Part II offenses saw a smaller 0.7% decline. Burglaries were reduced in part due to early recognition of emerging trends, identification of repeat offenders, surveillance operations, increased patrols and community outreach. In comparison to 2008, homicides also decreased from four to two. Aggravated assaults increased from 404 to 437 cases and rape increased from 36 to 43. Overall, the Howard County Department of Police met their expectations for 2009. Many of their accomplishments included increased patrol staffing, new Repeat Offenders Proactive Enforcement Unit, youth programs, two new satellite offices, new Spanish interpreter position created to address the communication gap between HCPD and residents. Over the past several years, 54 new sworn positions were filled allowing the department to implement new units focused on domestic violence, gang detection and apprehension, gun violence and computer crimes. The department also created units to work specifically with the growing senior population. Page 23 F. AREA INVESTMENT The subject’s Primary Market Area is benefiting from significant private and public investment. According to the Baltimore Metropolitan Council which tracks new residential and non-residential projects authorized by building permits and valued at $1 million+ within the region, the subject’s Regional Planning District 603 benefited from over $100 million in private commercial investment in recent years including: 8215 Stone Crop Drive 4253 Montgomery Road Howard County BD of Ed. Glen Mar UM Church Howard County Howard County Howard Co Bd. of Ed. Howard Co Bd. of Ed. Executive Park Dr. Assoc. Project Description Value Units 16 unit res. condo building 27 unit res. condo building Alterations to Worthington ES Addition for education wing New building Convert into Maintenance Fac. New modular blgs Mt Hebron HS Addition to St. Johns La ES New bank building $4,000,000 $3,000,000 $10,960,900 $3,200,000 $3,120,000 $2,500,000 $1,870,532 $1,111,056 $1,100,000 16 27 In addition several residential projects were added to the PMA: Alta at Regency Crest- Currently under construction, this project is located just off Route 40 (Baltimore National Pike) on Rogers Avenue. Upon completion the project will contain 150 luxury apartment units for active adults ages 62 and better. The project is being developed by Wood Partners and expected to be completed by Spring 2011. Montjoy – This is a planned residential community located on 76 acres which opened in 2007. The community consists of 118 townhouses and 62 single family detached homes. Original selling prices were between $750,000 - $1,000,000. In addition, the community has 286 multifamily rental apartments known as Elms at Montjoy. The rental community offers 1BR, 2BR and 3BR floor plans. Monthly rents range $1,310 to $2,020 with 830-1,650 sq.ft. of living areas. The property also offers community amenities such as a swimming pool, clubhouse and fitness center. The Gathering at Jefferson Place - This new community is located along Montgomery Road in Ellicott City. The active adult community opened in 2009 and was developed by Beazer Homes. The community offers four different 2BR floorplans. Select units include detached garage and study. Original pricing ranged $246,900-$368,000. Page 24 G. SUMMARY In summary, Howard County has been the fastest growing metropolitan county within the Baltimore area during the past decade. The Ellicott City PMA has fully participated in that growth. Population & Household Trends - Howard County has been the fastest growing metropolitan county within the Baltimore area during the past decade. The Ellicott City PMA has fully participated in that growth. In 2010 there are an estimated 22,036 PMA households—a figure which is expected to increase to 23,175 by 2015. Housing Trends - The PMA has a higher homeownership rate (74.9% in 2000) and higher owner-occupied housing values ($429,508 estimated median value in 2010) than Howard County. Over one-third (33.9%) of Howard County renter households, however, were housing cost burdened in 2000—paying more than 30% of their incomes towards total housing expenses. Economic Trends - The PMA is located within one of the most diverse and dynamic County economies in the Baltimore-Washington area, offering the subject’s residents access to many employment, educational and other opportunities. The PMA’s estimated median household income of $105,550 in 2010 is 3.5% higher than Howard County’s $101,954 median. The subject is planned to offer mixed income rental housing, providing affordable and market rate apartments in a well-managed community setting—within a County which experiences continuing housing price pressure due to high demand. That demand will only increase further with the influence of BRAC. Page 25 IV. COMPETITIVE SUPPLY In this section, LF&M reviews conditions in the existing multifamily rental communities in the subject’s Ellicott City Primary Market Area. A map illustrating the locations of those communities follows. Photographs of all properties are included at the end of this section. A. HOWARD COUNTY APARTMENT SUPPLY LF&M has reviewed the Howard County Department of Housing & Community Development's "2009 Howard County Rental Survey," the most recent and comprehensive statistics on the County's rental housing stock. In 2009, the County’s rental inventory was comprised of over 20,000 multifamily units (16,237 market rate in 63 communities; 2,679 of them affordable or subsidized in 28 communities) and 1,202 scatter-site rentals. The report found: Within the market rate multifamily stock, 601 units were reported vacant—which translated into an overall vacancy rate of 3.8%. Compared with survey data from August 2008, average rents in the county had fallen at an average annual rate of 1.2% across 1BR, 2BR and 3BR units. The 2BR rents fell by 3.3% and 3BR rents fell by 1.2%, while 1BR rents remained stable. The rental inventory increased by 15.2% during the 1996-2009 period. Two new market rate communities were added to the Howard County rental inventory in 2005: the Elms at Montjoy and Evergreen. Since the 2008 survey, no new market rate multifamily communities had been added in the Howard County rental market. The typical market-rate multifamily rental unit in Howard County was built approximately 21 years earlier. Over 41% of Columbia’s multifamily rental inventory was built in the 1980’s compared to 29% of the inventory outside of Columbia. Recent construction and rehabilitation has reduced the average age of the rental inventory outside of Columbia. Approximately 28% of multifamily rental units outside Columbia have been built or rehabilitated since 2000. In comparison, only 23.0% of the market-rate multifamily units in Columbia were built or rehabilitated since 2000. Ten affordable communities (all LIHTC) contained 1,199 apartments; only three communities accepted families, the remaining properties were age-restricted. Eighteen subsidized communities contained 1,480 apartments; only three communities containing 210 units were age-restricted. Approximately 13.1% of the total rental inventory was in the affordable or subsidized categories—about one-third of those units being reserved for seniors. The newest family LIHTC property was Port Capital Village in the Elkridge area, which opened in 2007 and includes 84 units. Page 26 B. MARKET RATE APARTMENTS LF&M has surveyed six professionally managed market rate multifamily rental housing communities in the PMA. Overall, these properties have been well maintained and have convenient, accessible locations. They represent typical mid-market offerings. Most of the communities include desirable community amenities, including swimming pool and playground, units with patios or balconies and in-unit washer/dryer, etc. Each of these properties is described briefly below and further described in Table IV-1. Charleston Manor - Formerly Normandy Woods Apartments, this community is a 858-unit apartment complex located at 3182 Normandy Woods Drive. Units were renovated in 2008 and include kitchens with new cabinets, flooring countertops, appliances, wall to wall carpet. Select units include washer/dryer. The units also include a balcony or patio. Community amenities include two playgrounds, fitness center, business center, Olympic size swimming pool, tennis courts, car care area, community lounge and party room. Contract rents range $998-$1,485 for 691-1,079 sq.ft. of living area. The property also offers upgraded units with rents ranging $1,035-$1,575. The heating type is gas and residents are responsible for all utilities excluding water and sewer. The property is currently managed by the Donaldson Group and is reported to be 96.5% occupied. Concessions being offered include one half month free on select units with a signed 13 month lease. Chatham Gardens – This large, 414-unit property consists of garden-style apartments built in two sections in 1976 (198 units) and 1981 (216 units). The property, which is managed by Century Corporation was renovated in 2006 with new kitchens and baths. Overall, units in both sections are identical with the exception of the fact that the apartments in the newer section include an in-unit washer and dryer. There is a laundry room in each building in the older section. Contract rents range $1,030-$1,430 with living areas ranging 878-1,258 sq.ft. Management includes water, sewer and trash in the contract rents. Tenants are responsible for their electric utilities. Community amenities include swimming pool and playground. The property is conveniently located adjacent to the Chatham Station retail center, anchored by Giant Food, Home Depot and K-Mart. Management reports occupancy to be 98%. The property is also offering a reduced security deposit of $98. Howard Crossing - Formerly known as Town & Country Apartments, this 1,350-unit garden style community was originally built in the late 1960’s and is located at 8732 Town & Country Boulevard. The property offers 1BR and 2BR floorplans. Apartment amenities include fully equipped kitchens with dishwasher, garbage disposal, icemaker, microwave, ceiling fan and wall to wall carpeting. Select units include washer/dryers; laundry facilities are located in buildings where washer/dryers are not Page 27 Table IV-1 HILLTOP APARTMENTS PMA Market Rate Apartments September 2010 Utilities Units Unit Type Occupancy Monthly Average Rent per Sq.Ft. Sq. Ft. Rate Rent Charleston Manor 3182 Normandy Woods Drive Ellicott City, MD 21043 (410) 465-8600 The Donaldson Group 392 52 278 72 46 18 858 1BR/1BA 1BR/den 2BR/1BA 2BR/2BA 2BR/1BA/den 2BR/2BA/den 96.5% Chatham Gardens 3372 North Chatham Road Ellicott City, MD 21043 (410) 465-7598 Century Corporation 126 12 253 23 414 1BR/1BA 1BR/1.5BA/den 2BR/2BA 2BR/2BA/den Howard Crossing Apartments 8732 Town & Country Blvd Ellicott City, MD 21043 410-465-3400 Hirschfield Kaiser Park 8120 Randolph Way Ellicott City, Maryland 21043 410465-2454 HAI Management Tenant Pays Features & Amenities $998 $1,125 $1,203 $1,300 $1,330 $1,485 691 794 915 937 1,045 1,079 $1.44 $1.42 $1.31 $1.39 $1.27 $1.38 98.0% $1,030 $1,130 $1,300 $1,430 878 958 1,125 1,258 $1.17 Electric All $1.18 excluding $1.16 water & sewer $1.14 Garden apartments with swimming pool, playground & laundry room in buildings in initial section. Units have patio or balcony, renovated kitchens, second section of buildings include a washer/dryer in units. Opened 1976 & 1981. Concessions: Reduced Security Deposit - $98 1BR/1BA 1BR/1BA/Den 2BR/1BA 2BR/2BA 97.3% $930 $1,155 $1,290 $1,480 727 927 1,003 1,084 $1.28 $1.25 $1.29 $1.37 All Large garden apartment community formerly known as Town & Country. Community amenities include a fitness center, basketball court, playground, lighted tennis courts. Units include carpet, ceiling fans, kitchens with gas ranges, dishwasher, disposals, balconies. Units have been renovated to include microwaves & washer/dryers. Laundry facilities are located in buildings where washer/dryers are not included. 133 78 211 2BR/2BA 3BR/2BATH 98.6% $1,438 $1,795 1,065 1,920 $1.35 Electric $0.93 All Garden apartment and townhome community built between 2004-2008. Units include fully applianced kitchens with dishwasher, disposal, microwave, carpet, washer/dryer. Community amenities include private storage area, fitness center, tanning booth, swimming pool and clubhouse. 12 1BR/1BA 1BR/1BA/Den 2BR/1BA 2BR/2BATH F 2BR/2BATH B 98.3% $1,075 $1,195 $1,245 $1,395 $1,495 795 1,058 1,400 1205 1,325 $1.35 $1.13 $0.89 $1.16 $1.13 All Garden apartments and townhomes with swimming pool, fitness center, carport facility & car wash area. Units include eat-in kitchens with dishwasher, disposal, ice-maker, carpet and washer/dryer. Property also offers upgraded units with new kitchens and baths. 1BR/1BA 1BR/den 2BR/1BA 2BR/1.5 BA/den 98.0% $996 $1,058 $1,166 $1,380 713 877 968 1,013 $1.40 Electric All $1.21 excluding $1.20 water & sewer $1.36 1,350 Orchard Park 3113 Pine Orchard Ellicott City, MD 21043 (410) 465-0300 HAI Management 202 18 232 Plumtree Apartments 3463 Plumtree Drive Ellicott City, MD 21043 (410) 465-8611 A & G Management 66 6 88 8 168 Totals Heat Type 3,233 97.4% 1BR 1BR/Den 2BR 2BR/Den 3BR Source: Lipman, Frizzell & Mitchell LLC. survey: September 2010 Average Rents $1,006 761 $1,133 923 $1,303 1,062 $1,406 1,099 $1,795 1,920 $1.32 $1.23 $1.23 $1.28 $0.93 Gas Gas Gas All excluding water & sewer Large garden apartment complex with swimming pool, tennis court, fitness center. Units have carpet, gas HVAC, select units have washer/dryer. The property opened 1976 & 1986 (formerly known as Normandy Woods). Upgraded units in 2008 with new kitchens and baths. Concessions: 1/2 month free on select units w/13 month lease. Garden apartments with laundry room in every bldg, swimming pool, playground and picnic area. Units include eat-in kitchens with dishwasher, gas range, disposal, carpet and patio or balcony. Rental Concessions: 1 month free rent on select 1BR units with 13 month lease. DeLorme Street Atlas USA® 2009 Market Rate Multifamily Properties Data use subject to license. Scale 1 : 50,000 TN 0 © DeLorme. DeLorme Street Atlas USA® 2009. www.delorme.com MN (10.9°W) 0 ¼ ½ ½ 1" = 4,166.7 ft ¾ 1 1 1½ 2 mi km Data Zoom 12-0 included. Community amenities include two swimming pools, tennis courts, Clubhouse, 24-hour fitness center, playground and basketball court. Monthly rents at this community range $930-$1,480 for 727-1,084 sq.ft. of living area. Tenants are responsible for all utilities including water and sewer. The property is currently managed by Hirschfield and reported to be 97.3% occupied with no rental concessions. Kaiser Park at Ellicott City - Located at 8120 Randolph Way, this 211-unit property consists of 133 two-bedroom apartment homes and 78 three bedroom townhome units. Units feature fully applianced kitchens with dishwasher, garbage disposal, microwave, refrigerator with ice-maker, wall-to-wall carpeting and full size washer/dryer. Apartment units include balcony or patio. Community amenities include a private storage area, fitness center, tanning booth, swimming pool and club house. Contract rents for the 2BR/2BA apartment units average $1,438 with 1,065 sq.ft. of living area and $1,795 with 1,920 sq.ft. for the 3BR/2BA townhomes. Tenants are responsible for all utilities including water and sewer. Kaiser Park is currently managed by HAI Management and is reported to be 98.6% occupied with no rental concessions. Orchard Park Apartments I & II - This garden-style apartment and townhome community is located at 3113 Pine Orchard Lane. It consists of 232 units and was initially constructed in 1990. Apartment units range in size from 750–1,400 sq.ft. The contract rents range $1,075-$1,245. Townhome units at this community range 1,205-1,325 sq.ft. in size with rents ranging $1,395-$1,495. In addition this community offers upgraded units in the Orchard Park I section at rental rates ranging $1,255-$1,455. The complex includes gas heating and water heating and tenants are responsible for all utilities, including water and sewer charges. Units include an eat-in kitchen with dishwasher, garbage disposal, ice maker, carpet, washer/dryer. Upgraded units include new kitchens, bathroom vanities, State of the Art Black GE Appliances, Brushed Nickel Finishes and color coordinated carpet. All units include basement storage space and security alarm. Some units have fireplaces and bay windows. Community amenities include swimming pool, fitness center, availability of carports ($35 per month) and a car wash facility. Orchard Park is reported to be 98.3% occupied with no rental concessions. This property is managed by HAI Management Inc.. Plumtree Apartments - This 168 unit garden-style complex was constructed in 1973 and is located south of US Route 40 at 3463 Plumtree Drive. The 3-story buildings have controlled access entries. The apartments feature eat-in kitchens with dishwasher, gas range, garbage disposal, carpet, balcony or patio and central air Page 28 conditioning. Community amenities include swimming pool, playground and picnic area. There are laundry rooms in each building. Contract rents range $996-$1,380 with living areas ranging 713-1,013 sq.ft. Tenants pay all utilities, including electric heat, cooking, water heating and personal electric. The property is currently managed by A&G Management and reported to be 98.0% occupied. Rental concessions being offered include one month free rent on select 1BR units, with signing of a 13 month lease. Evaluation LF&M finds that the PMA typical market rate inventory is characterized by a solid overall occupancy rate of 97.4%. Average contract rents are as follows: Rent Sq.Ft. Rent PSF 1BR 1BR/Den $1,006 $1,133 761 923 $1.32 $1.23 2BR 2BR/Den $1,303 $1,406 1,062 1,099 $1.23 $1.28 3BR $1,795 1,920 $0.93 The market rate competition is comprised of typically older but well-managed and updated properties which offer rents in the moderate range for Ellicott City and Howard County. Oella Mill Apartments LF&M notes that Southern Management has opened a higher niche in the Ellicott City area with its Oella Mill Apartments, the adaptive reuse of an historic mill building just east of the Main Street historic district. The property is located at 840 Oella Avenue and opened in 2008. It is located just outside the PMA and in Baltimore County. The original structure was built in 1919 and the mill operation shut down in the 1970’s. Units have luxury-level features and finishes. Community amenities include a lounge with fully equipped kitchen, WIFI, pool table, fitness center, two-level library with comfortable seating, concierge, structured parking, observation deck overlooking the Patapsco River. The property has a total of 147 total units including 141 in the main mill building and six townhomes. Rents for standard 1BR apartments range $1,476-$2,480 for an average 915 sq.ft. and standard 2BR rents are $1,991-$2,773 for an average 1,093 sq.ft. Management reports occupancy at 98.6%. Page 29 C. AFFORDABLE FAMILY APARTMENTS LF&M has requested and received "Proximity Report" data concerning competitive supply within the Primary Market Area from CDA. In addition, we have also reviewed U.S. Department of Housing & Urban Development and local source materials. LF&M has exercised due caution in selecting all affordable and subsidized rental communities which may be considered pertinent to this analysis. LF&M has identified only one multifamily rental apartment community within the PMA that includes LIHTC apartments. Orchard Crossing Apartments Orchard Crossing is a 187-unit rental apartment complex located of MD Route 100. This community opened in 1995 and was partially financed with 9% Tax Credits. Onehalf of the apartments are reserved for households at or below 60% of the median income. The apartments in this complex include carpet, fully applianced kitchen with dishwasher, garbage disposal and gas stove, full size washer/dryer, mini-blinds, balcony or patio and additional storage in hallway of each apartment building. The community amenities include outdoor swimming pool, clubhouse with exercise room, tennis court, car wash area and tot lot. The 1BR apartments range in size between 840 – 915 sq.ft. while the 2BR units range in size from 1,053 – 1,245 sq.ft. Market rents for the 1BR units are $1,155 - $1,200; 2BR contract rents range from $1,255 - $1,435. Tenants are responsible for all utilities, including gas heat and water heating and personal electric. Tax credit apartment rents are $795 for the 1BR units and $948 for the 2BR apartments. According to Armiger Management, all apartments are fully occupied with a waiting list of three to six months for the market rate and affordable units. This community also accepts section 8 vouchers. D. AFFORDABLE SENIOR APARTMENTS LF&M has determined there are two affordable senior rental communities in the subject’s PMA which do not offer direct tenant rent subsidies. The properties are Selbourne House of Dorsey Hall (72 units) and Park View at Ellicott City I & II (171 units). The apartments are mentioned for informational purposes only since none are considered directly competitive with a family rental community like the subject. Page 30 DeLorme Street Atlas USA® 2009 Affordable/Subsidized Multifamily Properties Data use subject to license. Scale 1 : 100,000 TN 0 © DeLorme. DeLorme Street Atlas USA® 2009. www.delorme.com MN (10.9°W) 0 ½ 1 1 1" = 1.58 mi 1½ 2 2 3 4 mi km Data Zoom 11-0 E. SUBSIDIZED APARTMENTS Howard County According to the “2009 Howard County Rental Survey”, there are 18 communities with 1,480 housing units offering units with project-based Section 8 rental subsidies. Of the 1,480 subsidized units, three communities with a combined total of 210 units are designated for seniors. The remaining units are for general occupancy. It is important to note that 82% of the subsidized units in Howard County are located in Columbia. Only five communities with 266 units are subsidized in County neighborhoods outside of Columbia. Ellicott City PMA Excluding the properties being redeveloped in the Hilltop Master Plan, the only subsidized housing in the PMA is Colts Crossing (formerly Alfa Pines Condominium Complex). This townhome development is comprised of 24 units and is located on Corporate Court in Ellicott City. The property was recently rehabbed and includes new plumbing, windows, heat pumps and water heaters. The complex was acquired by Howard County Housing in 1990. The apartments are fully occupied and the waiting list is closed until further notice. Scattered-Site Public Housing In addition, the Howard County Housing Commission owns and operates fifty units of scattered-site public housing. The Housing Commission does not identify these public housing units by address to protect the privacy of the residents. Twenty-four units are townhouses in a single community. Two of these units have been partially modified to meet accessibility requirements for disabled tenants. The remaining 26 homes consist of two single housing units; one duplex and the others are townhomes. All 50 units are rented at or below 30% of household income and include utility allowances. F. AMENITY ANALYSIS The subject’s units compare well to the existing typically older multifamily inventory in the Ellicott City PMA, as summarized in Table IV-1. Though much of the PMA rental stock is older, it has generally been well managed and updated. The newer properties (including Orchard Crossing) are state of the art. The subject’s new construction units will be superior to the other family properties in terms of its design, condition and amenities: Unit Amenities - The subject’s living areas are within the competitive range of the market rate supply. Units include washer/dryer hook-ups in units, whereas about half of the competition reports offering washer/dryer. All features and finishes will be at least at a par with the newest market rate competition. Some Page 31 of the buildings will have sheltered parking in the building—a very attractive feature. Community Amenities - The subject will offer typical CDA community spaces and Tenant Service programming, which will be enhanced in the state-of-the-art community center next door. Two buildings will be elevator-served. The subject’s unit and community amenities are typical of those recommended by Maryland CDA for Tax Credit properties and fully consistent with the PMA’s newest market rate competition. The subject’s amenities are superior to the older market rate garden apartments in the PMA inventory. E. SUMMARY In summary, from a market and existing competitive property perspective, LF&M finds that the subject is well-positioned to attract households looking for quality affordable and market rate housing. The factors which support this position include: The market rate apartment communities in the PMA maintain high occupancies, currently estimated at 97.4%. The quality of the multifamily stock is good but typically older. Properties have generally been well managed. Market rents average $1,006 for a standard 1BR apartment, $1,303 for a standard 2BR apartment and $1,795 for a 3BR apartment. The subject’s LIHTC rents are a significant savings in comparison to the market, while the unrestricted rents are within the market range—especially considering the positive reception given the Oella Mill Apartments at the luxury end of the market. The supply of subsidized and affordable family apartments in the PMA is small, currently estimated at 211 units. There are two senior affordable properties in the area, offering 243 age-restricted units. All have full occupancy with waiting lists. The subject’s units and amenities are very competitive with the newest PMA market rate properties and superior to the area’s older (though typically updated) properties. In particular, the new 40,000 sq.ft. community center will be a great benefit. LF&M concludes, therefore, that the Ellicott City PMA’s rental market is characterized by high occupancies for all properties and waiting lists for the affordable/subsidized properties. Redevelopment of the subject site as a mixed income community is important in serving the needs of a growing Howard County population. Page 32 HILLTOP FAMILY APARTMENTS MARKET RATE MULTIFAMILY PROPERTIES CHARLESTON MANOR CHATHAM GARDENS HILLTOP FAMILY APARTMENTS MARKET RATE MULTIFAMILY PROPERTIES HOWARD CROSSING KAISER PARK HILLTOP FAMILY APARTMENTS MARKET RATE MULTIFAMILY PROPERTIES ORCHARD PARK PLUMTREE HILLTOP FAMILY APARTMENTS MARKET RATE MULTIFAMILY PROPERTIES OELLA MILL HILLTOP FAMILY APARTMENTS AFFORDABLE/SUBSIDIZED MULTIFAMILY PROPERTIES ORCHARD CROSSING COLTS CROSSING HILLTOP FAMILY APARTMENTS AFFORDABLE/SUBSIDIZED MULTIFAMILY PROPERTIES ELLICOTT TERRACE V. DEMAND ANALYSIS LF&M’s task is to estimate the number of income-qualified households who are likely to demand and afford a rental apartment at the subject property. A. HILLTOP HOUSEHOLDS LF&M has reviewed a recent rent roll for Hilltop. We find that household incomes are indeed very low, with a median income for the property of approximately $16,270. Incomes were reported for 79 resident households and they are in the following ranges: Hilltop Household Incomes Households 24 12 13 8 6 6 4 6 Less than $10,000 $10,000 - $14,999 $15,000 - $19,999 $20,000 - $24,999 $25,000 - $29,999 $30,000 - $34,999 $35.000 - $39,999 $40,000 or More Household income data was not available to us for Ellicott Terrace, but we assume those households have been income-qualified by Howard County Housing and are in reasonably the same income ranges. It appears that the household incomes of the vast majority of current residents fall well under the maximum incomes allowed under LIHTC guidelines. B. PMA HOUSEHOLD INCOMES LF&M summarizes the detailed ESRI estimates of household incomes by age of householder for the Ellicott City PMA and Howard County in Tables V-1 and V-2 following. The median household income in 2010 for all households residing in the PMA is estimated at $105,500. Only 1,710 households (7.7%) are estimated to have incomes less than $25,000; another 2,946 households (13.4%) have incomes of $25,000$50,000; 17,380 households (78.9%) have incomes exceeding $50,000. Overall, PMA household incomes are very high. Page 33 Table V-1 HILLTOP APARTMENTS Householder Age by Income PMA 2000, 2010, 2015 2000: Under $10,000 $10,000 - $14,999 $15,000 - $24,999 $25,000 - $34,999 $35,000 - $49,999 $50,000 - $74,999 $75,000 - $99,999 $100,000 - $149,999 $150,000 - $199,999 $200,000 or more Total Median HH Income 2010 Under $15,000 $15,000 - $24,999 $25,000 - $34,999 $35,000 - $49,999 $50,000 - $74,999 $75,000 - $99,999 $100,000-$149,999 $150,000-$199,999 $200,000-$249,999 $250,000-$499,999 $500,000 or more Total Median HH Income 2015 Under $15,000 $15,000 - $24,999 $25,000 - $34,999 $35,000 - $49,999 $50,000 - $74,999 $75,000 - $99,999 $100,000 - $149,999 $150,000 - $199,999 $200,000 - $249,999 $250,000 - $499,999 $500,000 or more Total Median HH Income <25 25-34 78 10 62 118 89 76 5 22 0 0 68 61 188 259 522 568 426 442 86 75 460 $31,930 <25 104 70 112 132 118 17 50 24 24 6 2 659 $38,730 <25 88 64 85 117 135 11 75 41 29 11 2 Age of Householder: 35-44 45-54 55-64 39 66 131 270 330 745 917 1,458 737 400 49 20 75 156 236 365 464 583 272 247 2,695 $57,868 5,229 5,093 $87,423 $101,128 2,467 $91,184 25-34 Age of Householder: 35-44 45-54 55-64 126 140 134 500 536 320 663 183 120 99 38 128 14 250 248 460 954 970 1,392 526 287 98 124 132 254 504 434 1,307 730 221 168 41 93 109 226 257 614 655 1,824 1,350 435 337 74 68 70 151 260 442 491 1,475 838 459 296 75 2,859 4,013 5,974 4,625 $74,568 $111,742 $122,039 $121,699 25-34 106 121 104 414 622 273 1,089 349 175 157 41 Age of Householder: 35-44 45-54 55-64 60 83 73 152 348 221 1,456 984 270 267 42 59 77 153 150 447 364 1,792 1,511 437 418 60 34 44 76 138 337 259 1,772 1,183 587 477 85 658 3,451 3,956 5,468 4,992 $45,854 $102,155 $129,749 $137,417 $142,863 65-74 74 58 198 205 306 456 242 164 33 15 75+ 156 104 187 178 193 181 125 66 23 37 Total 592 333 1,091 1,434 2,136 3,345 3,149 4,127 1,677 1,061 Percent 3.1% 1.8% 5.8% 7.6% 11.3% 17.7% 16.6% 21.8% 8.9% 5.6% 1,751 1,250 $51,392 $35,000 18,945 100.0% $78,245 65-74 Total 113 135 166 248 542 323 335 103 58 34 17 75+ 286 174 171 203 287 220 227 114 82 49 19 2,074 1,832 $64,746 $55,398 65-74 102 107 126 204 652 336 664 246 173 123 43 75+ 235 126 117 153 287 192 337 186 133 88 20 2,776 1,874 $88,036 $76,957 Source: ESRI estimates and forecasts, 2010; compiled by Lipman Frizzell & Mitchell LLC. 888 822 1,092 1,854 3,043 2,460 5,881 3,342 1,399 989 266 Percent 4.0% 3.7% 5.0% 8.4% 13.8% 11.2% 26.7% 15.2% 6.3% 4.5% 1.2% 22,036 100.0% $105,500 Total 684 622 734 1,328 2,828 1,656 7,185 4,500 1,804 1,541 293 Percent 3.0% 2.7% 3.2% 5.7% 12.2% 7.1% 31.0% 19.4% 7.8% 6.6% 1.3% 23,175 100.0% $125,550 Table V-2 HILLTOP APARTMENTS Householder Age by Income Howard County 2000, 2010, 2015 2000: Under $10,000 $10,000 - $14,999 $15,000 - $24,999 $25,000 - $34,999 $35,000 - $49,999 $50,000 - $74,999 $75,000 - $99,999 $100,000 - $149,999 $150,000 - $199,999 $200,000 or more Total Median HH Income 2010 Under $15,000 $15,000 - $24,999 $25,000 - $34,999 $35,000 - $49,999 $50,000 - $74,999 $75,000 - $99,999 $100,000-$149,999 $150,000-$199,999 $200,000-$249,999 $250,000-$499,999 $500,000 or more Total Median HH Income 2015 Under $15,000 $15,000 - $24,999 $25,000 - $34,999 $35,000 - $49,999 $50,000 - $74,999 $75,000 - $99,999 $100,000 - $149,999 $150,000 - $199,999 $200,000 - $249,999 $250,000 - $499,999 $500,000 or more Total Median HH Income <25 271 60 289 426 522 560 230 101 7 2 25-34 Age of Householder: 35-44 45-54 55-64 373 287 907 1,433 2,834 4,885 3,313 2,339 540 331 606 158 872 1,628 2,817 5,888 4,956 5,827 2056 1361 253 250 495 1,138 1,793 3,839 4,131 5,699 2439 1717 307 138 618 655 1,149 2,253 2,094 2,860 1202 899 2,468 17,242 $39,657 $62,726 26,169 $79,227 21,754 $92,212 12,175 $84,605 <25 390 197 391 626 682 403 263 148 120 22 6 25-34 481 479 744 2,006 3,342 2,497 3,330 868 427 317 86 Age of Householder: 35-44 45-54 55-64 583 455 823 1,797 3,714 3,400 7,482 3,036 1,194 1,001 179 395 357 783 1,398 3,331 3,941 8,570 4,503 1,788 1,764 382 429 450 474 1,102 2,387 2,394 6,006 3,124 1,367 1,160 242 3,248 14,577 23,664 27,212 19,135 $50,465 $76,728 $104,088 $113,775 $113,410 <25 327 148 280 505 739 336 392 225 148 37 6 25-34 377 378 541 1,599 3,708 2,040 5,375 1,573 617 566 104 Age of Householder: 35-44 45-54 55-64 338 287 445 1,016 2,707 1,795 8,117 3,812 1,341 1,348 178 242 231 487 849 2,837 2,373 9,728 5,547 1,978 2,338 367 244 280 264 624 2,010 1,516 7,493 4,319 1,765 1,867 280 65-74 388 263 713 620 1,051 1,333 771 577 227 138 75+ 604 442 700 504 590 639 326 258 53 97 Total 2,802 1,598 4,594 6,404 10,756 19,397 15,821 17,661 6,524 4,545 Percent 3.1% 1.8% 5.1% 7.1% 11.9% 21.5% 17.6% 19.6% 7.2% 5.0% 6,081 4,213 $50,075 $32,368 90,102 100.0% $74,181 65-74 Total 643 588 557 1,211 1,806 1,288 1,504 836 485 307 82 75+ 1,014 617 474 648 957 597 753 308 299 126 55 9,307 5,848 $72,075 $53,214 65-74 542 501 439 1,050 2,216 1,301 2,674 1,663 920 710 149 75+ 874 484 358 525 1,113 552 1,260 595 474 237 71 3,143 16,878 21,384 26,977 20,662 12,165 6,543 $57,926 $96,869 $118,011 $126,833 $130,098 $100,388 $72,450 Source: ESRI estimates and forecasts, 2010; compiled by Lipman Frizzell & Mitchell LLC. 3,935 3,143 4,246 8,788 16,219 14,520 27,908 12,823 5,680 4,697 1,032 Percent 3.8% 3.1% 4.1% 8.5% 15.7% 14.1% 27.1% 12.5% 5.5% 4.6% 1.0% 102,991 100.0% $100,769 Total 2,944 2,309 2,814 6,168 15,330 9,913 35,039 17,734 7,243 7,103 1,155 Percent 2.7% 2.1% 2.6% 5.7% 14.2% 9.2% 32.5% 16.5% 6.7% 6.6% 1.1% 107,752 100.0% $118,087 C. INCOME WINDOW LIHTC Income Window Households must be found within an annual income window determined by the maximum incomes allowable for qualification purposes by Maryland’s Community Development Administration (CDA) and the minimum income required to afford the rents at the CDA guideline's 30% gross rent-to-income ratio. The U.S. Department of Housing and Urban Development (HUD) calculates the median family income for a household of four persons in the Baltimore Metropolitan Area (including Howard County) to be $82,200 in 2010. Maximum Household Incomes Using HUD guidelines, LF&M calculates Tax Credit maximum income limits for the subject at 30% and 60% AMI by household size as follows: Maximum Household Incomes 2010 Limits Household Size 1 Person 2 Persons 3 Persons 4 Persons 5 Persons 30% AMI $17,280 $19,740 $22,200 $24,660 $26,640 60% AMI $34,500 $39,420 $44,340 $49,260 $53,220 IRS Section 42(g)(2)(C)(ii) guidelines state the maximum income limitation is to be based on occupancy, which is established at 1.5 persons per bedroom. The subject’s maximum incomes are, therefore, set for households ranging in size to 4.5 persons. (LF&M notes that this is a very conservative measure, since management typically allows occupancy of two persons per bedroom.) The subject's maximum allowable incomes range from $17,280 for a one person household at 30% AMI up to $51,240 for a 4.5 person household at 60% AMI. For these calculations, therefore, the maximum income allowed at the subject is stated at $51,240 for a 4.5 person household at 60% AMI Minimum Income LF&M calculates the minimum household income level needed to afford the subject’s LIHTC apartments based on a qualification ratio of 30% of gross rent. Using the subject’s 30% AMI gross rents of $443 (1BR), $532 (2BR) and $615 (3BR) as our standard, we have calculated that the minimum annual income required to afford those rent payments as $17,720, $21,280 and $24,600 respectively. The subject units will not have project-based Section 8 subsidies. Page 34 Eligible Income Window At CDA's qualification ratio for gross rents of up to 30% of household income for housing, we estimate the range of incomes required to meet the subject’s proposed gross rents to be: 30% Gross Qualification: $17,720 - $51,240 Market Rate Qualification Management companies typically qualify prospects for market rate apartments at a 30% ratio of contract rent (not including utilities) to gross income. The subject’s apartments with no income restrictions range from $1,250 (1BR) to $1,975 (3BR), requiring a minimum household income of $50,000 up to $79,000. So as not to overlap with the subject’s affordable income window, LF&M estimates the number of PMA households with incomes above $51,240 in 2010. D. TARGET HOUSEHOLDS LIHTC Households Using the Table V-1 estimates, LF&M has estimated the number of income-qualified households in the Ellicott City PMA in 2010. We estimate that there are currently 3,695 PMA households who have incomes ranging from $17,720 to $51,240 annually. This represents about one sixth (16.8%) of all households in the PMA. Using Census data in Table III-9, LF&M estimates the proportion of renters among the target group at 52.5% in the PMA. We note that this percentage is high compared to what is found in the PMA overall (with a renter share of 25.1%) due to the high cost of homeownership in Ellicott City—disqualifying many households from buying a home. The reality is that low- to moderate-income households (and even many middle income households) in the PMA and Howard County lack the financial ability to afford homeownership and are renters by necessity rather than by choice. LF&M, therefore, estimates the total number of income-qualified renter households within the PMA in 2010 as follows: Income Qualified Households Times: Renter Share Target Market Page 35 3,695 52.5% 1,940 Analysis by Income Band Understanding that our calculations are conservative since so many of PMA renter households spend more than 30% of their incomes on rent, the table below illustrates the distribution of these income-qualified households by income band: Households by Income Band Income Band 30% 60% Total Qualifying Income $17,720-$34,559 $34,560-$51,240 Households 1,642 2,017 3,659 Renter Households 862 1,078 1,940 There is a certain amount of overlap among the income bands depending on household size, but LF&M finds the income ranges to be useful in offering general guidance on the distribution of senior incomes in the PMA. Market Rate Households Again referring to Table V-1, we find that there are 17,229 households in that range. The homeownership rate in this group, however, is very high (87.5%). We calculate the number of income-qualified renter households in the $51,240+ income range in 2010 as follows: Income Qualified Households Times: Renter Share Target Market 17,229 12.5% 2,154 The implications of these statistics, the subject project’s capture and market penetration rates, are presented in Section VI, Supply and Demand Analysis. E. FURTHER QUANTIFICATION OF DEMAND As an alternate perspective, we can further quantify the subject project’s potential demand using the U.S. Census Bureau's American Housing Survey (AHS) research product. AHS data is used to estimate the proportion of households who are most likely to move in the course of a year from their current dwelling to rental quarters. Based on these statistics, produced by the U.S. Bureau of the Census, LF&M estimates that approximately 36.2% of all rental units turn over annually. Using that statistic, we would estimate that up to 1,170 renter households could be expected to move annually within the PMA—most of them income-qualified to live at the subject property. This gauge of natural turnover within the PMA suggests that demand for family apartments will remain strong. Page 36 F. SUMMARY In summary, LF&M finds that there is a substantial potential demand pool of low- and moderate-income households within the defined Ellicott City PMA who are incomequalified to rent the subject’s affordable LIHTC apartments. In 2010, the pool of income-qualified renter households from the PMA is estimated at 1,940 according to CDA’s guidelines. In addition, we find that the pool of renters who are income-qualified to rent the subject’s market rate apartments is a substantial 2,154 households in 2010. Neither number takes into consideration the tremendous growth which is taking place in Ellicott City and Howard County. Page 37 VI. SUPPLY AND DEMAND ANALYSIS LF&M has estimated the project’s potential capture and penetration rates, building upon the assumptions presented in the previous sections. A. CAPTURE ANALYSIS LF&M defines "capture rate" as the share of the eligible prospect pool which a property must attain in order to fully lease up. The following calculations ignore the reality that the subject will certainly be able to retain most if not all of its current tenants. The following calculations represent, therefore, the most conservative and “worst case” scenario for the subject’s lease-up. LIHTC Apartments LF&M conservatively assumes that all 92 LIHTC units will be filled by income-eligible family renter households from within the PMA. Comparing that number to the total 2010 eligible target household pool, LF&M calculates the subject's capture rate as follows: Project Capture - In 2010, the pool of income-qualified prospects consists of 1,940 renter households now living within the PMA. The subject would need to capture 4.7% of these households (92 units /1,940 = 4.7%). Project Capture by Income - LF&M has further estimated the subject’s capture rate by Tax Credit income band in accordance with the number of units available to each income band. The table below stratifies the subject’s capture rate by income level: Capture Rate by Income Band Income Band 30% 60% Total No. of Units 18 74 92 Renter Hhlds 862 1,078 1,940 Capture Rate 2.1% 6.9% 4.7% Market Rate Apartments The subject’s 114 market rate apartments need capture only 5.3% of the incomequalified renter pool available in 2010. (114 units / 2,154 = 5.3%) Evaluation LF&M’s analysis indicates that the Hilltop capture rates in 2010 for both affordable and market rate units are very low and eminently achievable, even when population and Page 38 household growth in the dynamic Ellicott City and Howard County markets are not considered. B. PENETRATION RATE LF&M defines "penetration rate" as the share of the remaining eligible prospect pool-who are not already living in competitive rental quarters--which a property must attain in order to fully lease up. The first step in calculating the market penetration for the Tax Credit units involves estimating the number of income-eligible PMA renter households now residing in competitive family rental projects. Based on our analysis of the competitive PMA housing supply in Section IV above, LF&M estimates that there may be 211 households in our target group residing in other PMA affordable and subsidized apartment properties. To be conservative, we have not deducted any vacancy factor. LF&M, therefore, calculates the market penetration rate of the subject’s subsidized units at 6.1% as follows: = 5.3% 92 LIHTC units to be filled (1,940 income-qualified renters – 211 living in competition) The subject’s penetration rate is low and indicative of the fact that the supply of affordable rental housing in the Ellicott City PMA and Howard County is very limited. C. LEASE-UP RISK From a market perspective, LF&M finds that the new construction family apartments will be leased up as units are delivered. The PMA demonstrates a history of stable, high occupancies. Current Hilltop and Ellicott Terrace residents will be moved into the new apartments as construction work progresses and displacement will be zero. We assume that they will be bridged into the new units with Housing Choice Vouchers. The Developer assumes an ongoing vacancy allowance of 7.0%. LF&M judges that this is reasonable and conservative given the Ellicott City PMA’s historical performance. The subject should be able to sustain a stabilized occupancy rate of at least 93% due to the fact that the supply of affordable and market rate housing in the PMA is inadequate in the face of continuing growth of Howard County. We judge that the subject property will be perceived as an excellent value by renters within the Ellicott City PMA and Howard County. Page 39 APPENDIX A JOSEPH M. CRONYN Resume Cronyn has more than three decades of professional experience in real estate research, sales and marketing, development, public policy, financing and appraisal. His experience includes market and financial feasibility analyses of major real estate projects; land acquisition and marketing for commercial and residential development; planning for mixed use development, including historic preservation concerns; tax-motivated and conventional financing for single family and multifamily residential projects; and advising public, nonprofit and private clients concerning economic and community development strategies. PROFESSIONAL EXPERIENCE Lipman Frizzell & Mitchell, LLC, Columbia, MD (2003 - present), Principal (1997 - 2003), Senior Associate Legg Mason Realty Group, Inc., Baltimore, MD (1989-1997), Vice President Financial Associates of Maryland, Baltimore, MD (1987-1989), Vice President Baltimore Federal Financial, F.S.A., Baltimore, MD (1982-1987), Sr. Vice President Neighborhood Reinvestment Corporation, Washington, DC (1978-1982), Asst. Director Baltimore Federal Savings & Loan, Baltimore, MD (1976-1978), Mortgage Underwriter EDUCATION Master of Business Administration, Loyola College Maryland, Executive Program, 1986 Bachelor's Degree, English & Philosophy, Boston College, 1969 AFFILIATIONS Neighborhood Housing Services of Baltimore, Chairman of the Board emeritus Citizens Planning and Housing Association, Member National Trust for Historic Preservation, Member Maryland Economic Development Association (MEDA), Member Lambda Alpha International Land Economics Society, Baltimore Chapter, Board of Directors PROFESSIONAL LICENSES State of Maryland Real Estate Agent's License QUALIFIED AS EXPERT WITNESS Before Maryland public administrative bodies, zoning hearing examiners and/or boards of appeals: Anne Arundel County, Baltimore County, Carroll County, Charles County, Frederick County, Harford County, Howard County, Montgomery County, Prince George's County Page 40

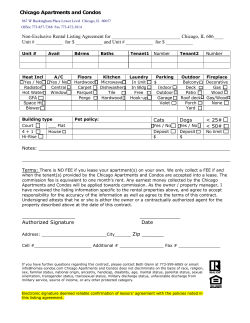


© Copyright 2026