
Log & Event Manager User Guide
Contents
Copyright © 1995-2015 SolarWinds Worldwide, LLC. All rights reserved worldwide. No part of this
document may be reproduced by any means nor modified, decompiled, disassembled, published or
distributed, in whole or in part, or translated to any electronic medium or other means without the
written consent of SolarWinds. All right, title, and interest in and to the software and documentation
are and shall remain the exclusive property of SolarWinds and its respective licensors.
SOLARWINDS DISCLAIMS ALL WARRANTIES, CONDITIONS OR OTHER TERMS, EXPRESS
OR IMPLIED, STATUTORY OR OTHERWISE, ON SOFTWARE AND DOCUMENTATION
FURNISHED HEREUNDER INCLUDING WITHOUT LIMITATION THE WARRANTIES OF
DESIGN, MERCHANTABILITY OR FITNESS FOR A PARTICULAR PURPOSE, AND
NONINFRINGEMENT. IN NO EVENT SHALL SOLARWINDS, ITS SUPPLIERS, NOR ITS
LICENSORS BE LIABLE FOR ANY DAMAGES, WHETHER ARISING IN TORT, CONTRACT OR
ANY OTHER LEGAL THEORY EVEN IF SOLARWINDS HAS BEEN ADVISED OF THE
POSSIBILITY OF SUCH DAMAGES.
The SolarWinds, the SolarWinds & Design, ipMonitor, LANsurveyor, Orion, and other SolarWinds
marks, identified on the SolarWinds website, as updated from SolarWinds from time to time and
incorporated herein, are registered with the U.S. Patent and Trademark Office and may be registered
or pending registration in other countries. All other SolarWinds trademarks may be common law
marks or registered or pending registration in the United States or in other countries. All other
trademarks or registered trademarks contained and/or mentioned herein are used for identification
purposes only and may be trademarks or registered trademarks of their respective companies.
Microsoft®, Windows®, and SQL Server® are registered trademarks of Microsoft Corporation in the
United States and/or other countries.
LEM 6.1
2/3/15
2
LEM User Guide
Chapter 1: Introduction
1
How LEM Works
1
LEM Architecture
2
LEM Manager
3
Protocols and Communication Direction
4
New Items in 6.1
4
Chapter 2: Upgrading
6
LEM 6.1
6
New Licensing Requirements Started With Version 5.3
6
Upgrading from Version 5.6 or Later
7
Determining the LEM Components Version
7
Best Practices for Appliance Upgrades
8
Resizing the LEM Virtual Appliance
8
Increasing the LEM Virtual Appliance
8
Cloning the LEM Virtual Appliance
9
To clone a disk in Hyper-V:
10
Determining Automatic Update Settings
12
Upgrading LEM Appliance
12
Troubleshooting Errors During the Appliance Upgrade
Upgrading LEM Connectors
13
14
Applying a LEM connector Update Package
15
Additional Information
17
Updating Agents
17
Upgrading LEM Consoles
18
Upgrading LEM Reports
18
Upgrading LEM Agents
19
Upgrade Paths for Versions Prior to 5.7
20
i
LEM User Guide
Chapter 3: Introduction to the Console
Opening Views in the Console
22
22
Working with Grids
23
Rearranging Grid Columns
23
Sorting a Grid by its Columns
24
Logging In and Out of Managers
25
Logging Into a Manager
25
Logging Out of a Manager
26
Logging Out of the LEM Console
26
Chapter 4: Getting Started
27
Configuring Email Alerting
28
Configuring an Active Directory Connection
29
Adding a Node
29
Rules
30
Adding Rules with the Rules Wizard
31
Chapter 5: Useful Tasks
33
Tour Log & Event Manager
33
Ops Center
33
Monitor
34
Explore
35
Build
36
Rules – Additional Details
36
Manage
36
Additional Information
37
Adding Devices
38
Agent Installation
39
ii
Table of Contents
Configuring Non-Agent Devices
39
Configuring Connectors for Agent and Non-Agent Devices
40
Troubleshooting
41
Additional Information
42
Verifying Data
43
Which Do I Pick?
44
nDepth: A Fully Integrated IT Search Solution
44
LEM Reports: For Compliance and Historical Reporting Needs
45
Troubleshooting
46
Additional Information – nDepth
47
External Resources
47
Additional Information – LEM Reports
48
Adding Filters
48
Which Do I Pick?
49
Use the Default Filters as Examples
49
Other Filter Scenarios
50
Example: Change Management
50
Troubleshooting
51
Additional Information
52
Adding Rules
53
Use Pre-configured Rules to Get Started
53
Example: Change Management
54
Other Rule Scenarios
55
Troubleshooting
56
Additional Information
57
Analyzing Data
57
Which Do I Pick?
58
nDepth: A Fully Integrated IT Search Solution
58
LEM Reports: For Compliance and Historical Reporting Needs
59
iii
LEM User Guide
Troubleshooting
60
Additional Information – nDepth
61
Additional Information – LEM Reports
62
Chapter 6: Leveraging
63
Monitoring Windows Domain Controllers for Brute Force Hacking Attempts
63
Configuring the SolarWinds LEM Agent
64
Creating a LEM Rule to Track Failed Login Attempts to Administrative Accounts
68
Monitoring Firewalls for Port Scans and Malformed Packets
70
Setting a Firewall to Log to a LEM Appliance
70
Configuring a Firewall Connector on a LEM Manager
71
Viewing Network Traffic from Specific Computers
72
Creating a LEM Rule to Notify of Potential Port Scanning Traffic
73
Monitoring Antivirus Software for Viruses that are Not Cleaned
74
Setting Antivirus Software to Log to a LEM Appliance
74
Configuring the Antivirus Connector on a LEM Manager
75
Creating a LEM Rule to Track When Viruses Are Not Cleaned
76
Monitoring Proxy Servers for Suspicious URL Access
76
Setting Proxy Server to Log to a SolarWinds LEM Appliance
77
Configuring a Proxy Server Connector on a SolarWinds LEM Manager
77
Monitoring Microsoft SQL Databases for Changes to Tables and Schema
79
Leveraging the Incidents Report in Security Audits
82
Chapter 7: Ops Center
84
Widgets
84
User Details Page
86
User: Details Widget
87
User: All Events Widget
87
Node Details Page
87
iv
Table of Contents
Node: Details Widget
88
Node:Connectors Applied Widget
88
Node: All Events Widget
88
Ops Center Widget Manager
89
Using the Widget Builder
90
Viewing Specific Widget Data
95
Refreshing a Widget’s Data
96
Opening a Filter From a Widget
96
Editing a Widget’s Chart Presentation
98
Resizing a Widget
99
Viewing a Widget’s Legend
99
Widget Storage
100
Chapter 8: Monitor
101
Monitor View Features
101
Filters and Filter Groups
103
Standard LEM Filters
104
Filter Creation
107
Features of Filter Creation
108
Events
110
Applying a Filter to the Events Grid
110
Sorting the Events Grid
110
Highlighting Events
111
Copying Event Data to the Clipboard
112
Marking Events as Read and Unread
113
Removing Events
114
Using the Event Details/Event Description Pane
115
Event Severity Levels
117
v
LEM User Guide
Chapter 9: Explore
118
nDepth
118
nDepth's Visual Tools
119
nDepth's Primary Uses
119
Exploring Events vs. Log Messages
120
Opening nDepth
120
Opening nDepth From Another Data Source
121
Scheduled Saved Searches
124
nDepth's Search Bar
125
nDepth Explorer Toolbar
127
nDepth's History Pane
128
Using the nDepth Histogram
129
Histogram Features
130
Searching the Activity Associated with a Particular Histogram Bar
131
Moving the Search Period
131
Changing the Period's Start and End Time
132
Using Result Details
133
Interpreting Search Results in Events Mode
134
Interpreting Search Results in Log Messages Mode
134
Adding Search Strings from Result Details
136
Using Explorers with Result Details
137
Responding to Result Details
138
Exporting Result Details Data to a Spreadsheet
139
Common nDepth Data Fields
139
Common Data Fields Categories in Events Mode
139
Common Data Field Categories in Log Messages Mode
140
Using the Word Cloud
141
Opening the Word Cloud
142
vi
Table of Contents
Viewing Statistics in the Word Cloud
142
Filtering the Contents of the Word Cloud
142
Exploring Items in the Word Cloud
143
Using the Tree Map
144
Opening the Tree Map
145
Resizing Tree Map Categories
145
Exploring items in the Tree Map
145
Using nDepth widgets
146
Default nDepth Chart Widgets
146
nDepth Explorer and Widget Icons
146
Viewing a widget's details
148
Creating a search string from a widget item
148
Adding new nDepth Widgets
149
Editing nDepth Widgets
149
Adding a Chart Widget to the nDepth Dashboard
150
Adding a main nDepth view to the nDepth Dashboard
151
Using Search Builder
151
Opening Search Builder
152
Switching from the Search Bar to Search Builder
152
Search Builder features
154
Configuring a Search with Search Builder
157
Utilities
159
Explorer Types
160
NSLookup Explorer
161
Traceroute Explorer
162
Whois Explorer
163
Manually Exploring an Item
165
vii
LEM User Guide
Chapter 10: Build
166
Groups
166
Group types
166
Groups View Features
168
Refining the Groups Grid
169
Rules
170
Rules View Features
170
Rules Grid Columns
170
Refine Results Form
171
Rule Categories and Tags
173
Rule Tagging
173
Users
174
Users View Features
174
Users Grid Columns
175
Refining the Users Grid
176
Viewing a User’s System Privileges
176
Chapter 11: Manage
178
Appliances View Features
178
Appliances Grid Columns
179
Details Pane
181
Configuring a Manager's Properties
182
The Login Tab
183
The License Tab
185
License Recycling
185
The Settings Tab
186
Configuring Event Distribution Policy
188
Practical Uses for Event Distribution Policy
188
viii
Table of Contents
Opening the Event Distribution Policy Window
189
189
About the Event Distribution Policy Window
190
Configuring Event Distribution Policy
191
Pushing event policy to lower-level event types
192
Exporting a Manager’s Event Policy
193
Nodes
194
Nodes View Features
194
Nodes Grid Columns
196
Adding a Syslog Node
198
Scan for New Nodes
199
Adding Nodes Manually
200
200
Refining the Agents Grid
200
Chapter 12: Access Controls
202
Adding New Users
202
Editing User Settings
207
Deleting Users
208
Restricting LEM Reports
208
Chapter 13: Utilizing the Console
Filters
210
210
Features of the Conditions Box
215
Creating a New Filter
219
Editing an Existing Filter
220
Cloning an Existing Filter
220
Pausing Filters
221
Resuming Paused Filters
222
ix
LEM User Guide
Turning Filters On and Off
223
Copying a Filter
223
Importing a Filter
224
Exporting a Filter
225
Deleting a Filter
225
Managing Filter Groups
226
Adding a New Filter Group
226
Renaming a Filter Group
226
Rearranging Filter Groups
227
Moving a Filter From One Group to Another
227
Deleting a Filter Group
228
Responding to Events
229
Using the Respond Form’s Drag and Drop Functionality
Event Explorer
229
231
Opening the Event Explorer
231
Event Explorer Features
232
Exploring Events
233
Using the Event Map
234
Reading an Event Map
234
Event Map Legend
235
Using the Event Grid
236
Viewing information in the event grid
236
Exploring From the Event Grid
237
Using the Event Details Pane
237
Opening and Closing the Event Details Pane
238
Viewing an Event’s Event Details
238
Exploring From the Event Details Pane
238
Performing nDepth Searches
239
Creating Search Conditions
241
x
Table of Contents
Deleting Items From Search Strings
243
Creating Custom time frames
244
Saving a Search
245
Using a Saved Search
246
Making Changes to a Saved Search
246
Exporting nDepth Search Results to PDF
247
Exploring Search Results from Graphical Views
248
Taking Action on Event Details
249
Deleting a Saved Search
249
Creating Search Conditions
250
Deleting Items From Search Strings
252
Creating Custom time frames
253
Managing Connectors
254
Adding New Connector Instances
255
Starting a Connector Instance
257
Stopping a Connector Instance
258
Editing a Connector Instance
259
Deleting a Connector Instance
259
Creating Connector Profiles to Manage and Monitor LEM Agents
260
File Integrity Monitoring Connectors
262
Features of FIM
262
What can FIM detect?
263
Adding a FIM Connector
263
Monitors
264
Adding Custom Monitors
264
Editing Monitors
264
Promoting a Monitor to a Template
264
Deleting a Monitor
265
Adding Conditions
265
xi
LEM User Guide
Editing Conditions
266
Deleting Conditions
266
FIM Connector Advanced Settings
266
Managing Widgets
268
Opening and Closing the Widget Manager
269
Creating New Master Widgets
269
Editing Master Widgets
270
Adding Widgets to the Dashboard
271
Deleting Master Widgets
271
Editing a Dashboard Widget
272
Deleting Dashboard Widgets
272
Chapter 14: Advanced Configurations
274
Setting up an Appliance
274
Adding Appliances to the Console
274
Copying Appliance Data
276
Removing an Appliance
276
Managing Connectors
277
Configuring Manager Connectors (general procedure)
277
Configuring Agent Connectors (general procedure)
278
Using Connector Profiles to Configure Multiple Agents
278
Managing Groups
279
Adding a New Group
279
Editing a Group
279
Cloning a Group
280
Importing a Group
281
Exporting a Group
282
Deleting a Group
282
Configuring Event Groups
283
xii
Table of Contents
Configuring an Event Group
283
Event List Features
284
Configuring Directory Services Groups
286
How to Use Directory Services Groups
286
Synchronizing Directory Service Groups with LEM
286
Viewing a Directory Services Group Members
288
Directory Services Group Grid Columns
288
Deleting DS Groups
289
Configuring Email Templates
289
Step 1: Creating the Email Template
289
Step 2: Adding Message Parameters
291
Step 3: Creating the message
292
Managing email template folders
292
Configuring State Variables
293
Adding new State Variable fields
293
Editing State Variable fields
295
Deleting State Variable fields
295
Managing State Variable Folders
296
Configuring Time of Day Sets
296
Configuring a Time of Day Set
296
Selecting periods in the time grid
298
Configuring User-Defined Groups
298
Examples of User-Defined Groups
299
Configuring a User-Defined Group
299
Adding data elements to a User-Defined Group
300
Editing a data element in a User-Defined Group
302
Deleting a data element from a User-Defined Group
302
Configuring Connector Profiles
304
Connector Profile Rules
305
xiii
LEM User Guide
Creating a Connector Profile (general procedure)
305
Step 1: Selecting a template for the profile
305
Step 2: Selecting the Agents that are members of the profile
307
Editing a Connector Profile’s Connector Settings
308
Opening a Connector Profile’s Settings
309
Adding a New Connector Instance
309
Editing a Connector Profile’s Connector Settings
310
Managing Rules
311
Rule Creation
311
Rule Creation Features
312
Advanced Thresholds
313
Opening the Set Advanced Threshold form
313
Setting an advanced threshold
314
Adding a Threshold Field
314
Editing threshold fields
315
Deleting a threshold field
316
Using the Actions box
316
Using constants and fields to make actions flexible
316
Configuring a Rule’s Actions
317
Adding a New Rule
318
Rule Window Features
319
Correlations Box Features
324
Editing Rules
326
Subscribing to a rule
328
Enabling a rule
329
Placing rules in test mode
331
Activating rules
333
Disabling a rule
334
Cloning rules
335
xiv
Table of Contents
Importing a rule
336
Exporting rules
337
Deleting Rules
338
Connector Configuration Features
339
Connectors Grid Columns
341
Connectors Grid Icons
341
Refining the Connectors Grid
342
Chapter 15: Scalability
344
Setting up an Addition nDepth Appliance
344
Using a separate nDepth appliance
344
Installing a Separate nDepth Appliance
345
Configuring Network Connectors for Use with nDepth
345
Alternate Storage Methods
345
Where to Find the Numbers
346
Disk Usage Summary
346
Log Storage Maintenance Report
347
Alternate Storage Methods
348
Chapter 16: Enabling Transport Layer Security
349
Enabling Standalone LEM Appliance
349
Setting up a Dedicated LEM User for Reports Accessing
350
Configuring Reports Application
350
Enabling TLS on a LEM Manager with a Dedicated Database Appliance
351
Enabling TLS on LEM Database
352
Importing Certificates into the Manager and Database
353
Chapter 17: Troubleshooting
354
Disconnected or Missing LEM Agents
354
xv
LEM User Guide
Connected LEM Agents
355
Troubleshooting Network Devices Logging to LEM
356
Devices Logging to a Log File on the Appliance
358
Contacting Support
358
Appendix A: Standard Widget Tables
359
Appendix B: Events
362
Types of Events
362
Asset Events
364
Audit Events
367
Incident Events
386
Internal Events
387
Security Events
393
Appendix C: Appendix Event Data Fields
441
Appendix D: Connector Categories
444
Appendix E: CMC Commands
469
Logging on to CMC
469
Using the CMC 'appliance' Menu
471
Using the CMC 'manager' Menu
472
Using the CMC 'ndepth' menu
474
Using the CMC 'service' Menu
475
Appendix F: Report Tables
478
Table of Audit reports
478
Table of Security reports
498
xvi
Table of Contents
Table of Support Reports
514
Report schedule definitions
516
Appendix G: Connector Configuration Tables
Connector Categories
517
517
Configuring Sensors
523
Configuring Actors
527
Setting up a Notification System
529
Appendix H: Filter Configuration Tables
Filter Condition Table
532
532
Comparing Values with Operators
534
Selecting a new operator
535
Operator tips
536
Table of operators
536
Examples of AND and OR conditions
538
Configuring event filter notifications
538
Selecting the notification method
539
Notifications table
539
Appendix I: Rule Configuration Tables
xvii
543
Chapter 1: Introduction
SolarWinds Log & Event Manager (LEM) is a state-of-the-art virtual appliance that adds value to
existing security products and increases efficiencies in administering, managing and monitoring
security policies and safeguards on your network.
SolarWinds LEM is based on brand new concepts in security. You can think of it as an immunity
system for computers. It is a system that is distributed throughout your network to several “points of
presence” that work together to protect and defend your network. SolarWinds LEM responds
effectively with focus and speed to a wide variety of threats, attacks, and other vulnerabilities.
SolarWinds LEM collects, stores and normalizes log data from a variety of sources and displays that
data in an easy to use desktop or web console for monitoring, searching, and active response. Data is
also available for scheduled and ad hoc reporting from both the LEM Console and standalone LEM
Reports console.
Some common use cases for SolarWinds LEM include the following:
l
Correlating network traffic from a variety of sources using filters and rules.
l
Visualizing log data in dynamic graphs, charts and other widgets.
l
Monitoring USB mass storage device activity on network Agents.
l
Responding to countless threats, attacks and other vulnerabilities with easy to use
point-and-click and automated active responses.
l
Searching normalized log data for events of interest.
l
Change Management and other security-related reporting for management and
auditors.
How LEM Works
The SolarWinds LEM system is based on software modules called Agents, which collect and
normalize log data in real time before it’s processed by the virtual appliance, and other non-Agent
devices, which send their log data directly to the Manager for both normalization and processing.
Agents are installed on workstations, servers, and other network devices where possible. Agents
communicate the log data from each device’s security products to the LEM virtual appliance. These
1
Chapter 1: Introduction
security products include anti-virus software, network-based intrusion detection systems, and logs
from operating systems.
When an Agent cannot be installed on a device, that device can be set to send its log data to the LEM
Manager for normalization and processing. Examples of devices that cannot host Agent software
include firewalls, routers, and other networking devices.
LEM accepts normalized data and raw data from a variety of devices. LEM agent connectors
normalize the data before sending the data to the LEM manager. Non-agent devices send their log
data in raw form to the LEM manager. The following diagram shows this flow of data and the ports
involved. Once normalized, log data is processed by the LEM Manager, which provides a secure
management clearinghouse for normalized data. The Manager’s policy engine correlates data based
on user defined rules and local alert filters, and initiates the associated actions when applicable.
These actions can include notifying users both locally in the Console and by email, blocking an IP
address, shutting down or rebooting a workstation, and passing the alerts on to the LEM database for
future analysis and reporting within the Reports application.
LEM Architecture
The LEM architecture is uniquely designed for gathering and correlating logs and events in real-time at
network speed and further defend the network using LEM’s Active Response Technology. The figure
below illustrates the typical log sources and LEM software components. It also illustrates the
direction in which communication is initiated and the network protocols used
2
LEM Manager
LEM Manager
The LEM Manager is a result of the Virtual Appliance that is deployed, it consists of the following key
components:
l
Hardened Linux® OS
l
Syslog Server and SNMP Trap Receiver
l
High compression, search optimized database
l
Web server
l
Correlation engine
For Network Device log sources such as routers, firewalls, and switches, LEM relies on these
devices sending Syslog messages to the Syslog server running on the LEM appliance.
3
Chapter 1: Introduction
For Servers and Applications LEM largely relies on a LEM Agent installed on these servers. The LEM
Agent has a negligible footprint on the server itself, and provides a number of benefits to ensure logs
are not tampered with during collection or transmission while being extremely bandwidth friendly.
For Workstations, the LEM Agent used on Windows® workstations is the same as the one used for
Windows servers.
Other SolarWinds solutions like Network Performance Monitor (NPM), Server & Application Monitor
(SAM) and Virtualization Manager (VMan) can send performance alerts as SNMP Traps to LEM. LEM
can correlate these performance alerts with LEM events.
You can install the LEM Reports Console on any number of servers to schedule the execution of over
300 audit-proven reports. From a security standpoint, the command service > restrictreports can be
used to limit the IPs that can run these reports
Protocols and Communication Direction
Below is a summary of the protocols and communication direction.
l
Network devices can send Syslogs to LEM Manager over TCP or UDP. The direction
of this communication is from the network device to the LEM Manager.
l
LEM Agents installed on servers and workstations initiate TCP connections to the LEM
Manager, so the Agents push data to the LEM Manager.
New Items in 6.1
l
An updated Getting Started wizard that guides you through an overview of the
functionality and basic configuration tasks for LEM , such as:
l
Configuring email server
l
Configuring directory services group access
l
Configuring connectors for non-agent data (utilizing existing add node
wizard framework in new format)
l
Enabling key rules quickly
4
New Items in 6.1
l
Guidance for agent installation and configuration
l
Customizing content to match your needs
5
Chapter 2: Upgrading
This chapter provides instructions for upgrading to the latest version of SolarWinds Log & Event
Manager. The LEM upgrade process consists of upgrading the LEM appliance and related
components: console, agents, and reports.
The LEM 6.1 appliance upgrade package upgrades all components of LEM appliances running LEM
version 5.6 or later. If you are running an earlier version of LEM or TriGeo SIM, see Upgrade Paths for
Versions Prior to 5.7
LEM 6.1
This upgrade is recommended for all LEM components. The latest LEM agents are available both as
standalone installers and as part of the LEM appliance upgrade package.
For more information about the details of this release, see Log & Event Manager Version 6.1 Release
Notes.
New Licensing Requirements Started With Version 5.3
If you are upgrading a LEM virtual appliance from a version earlier than 5.3, this upgrade requires
applying a new license file within 30 days. If you do not apply your license within that time frame, your
LEM appliance will stop collecting data.
Obtain a license key from the SolarWinds Customer Portal. Enter this key in the LEM console to
apply the nodes license to your LEM manager.
To apply a LEM license key:
1. Open the LEM console and log into your LEM manager as an administrator.
2. Navigate to Manage > Appliances.
3. Click License on the Properties pane.
4. Select Automatic or Manual in the Type field.
6
Chapter 2: Upgrading
Note: We recommend selecting Automatic here, but the Manual option is available
when the computer being used to complete this procedure is not able to connect to the
Internet.
5. Enter the license key in the Key field.
6. Enter Name, Email, and Phone.
7. Click Activate.
8. Click OK when the license has been successfully activated.
Upgrading from Version 5.6 or Later
The procedures in this section apply to LEM versions 5.6 and later. If you are running an earlier
version, see Upgrade Paths for Versions Prior to 5.7
Determining the LEM Components Version
While it is only necessary to follow a specific upgrade path when upgrading LEM appliances, we
recommend maintaining a consistent version across all LEM components. Complete the following
procedures to determine the current version of each of those components.
To determine the version of your LEM appliance:
1. Open the LEM console and authenticate to the manager.
2. Select the appliance to view its details in the Details pane on the bottom left.
Note: If you cannot connect to your LEM appliance using your LEM console, SolarWinds Support can
assist you in finding this information.
To determine the LEM console version:
1. Open the LEM console.
2. Click the SolarWinds logo in the top left corner.
To determine the LEM Reports version:
1. Open LEM Reports.
2. Click the Settings tab.
7
Best Practices for Appliance Upgrades
3. Click Help and then select About Reports.
To determine the LEM agents version:
1. Open the LEM console and authenticate to the manager.
2. Click Manage > Nodes and note the Version column.
Note: The current version of the LEM agent is 6.1.
Best Practices for Appliance Upgrades
If you have multiple LEM appliances, including hardware and virtual appliances, we recommend you
upgrade them in the following order.
1. Database appliances
2. nDepth appliances
3. Manager appliances
Note:
l
You can upgrade logging servers and network sensors at any time.
l
If you have a High Availability (HA) system, upgrade the primary appliance(s)
first, followed by the secondary appliance(s).
Resizing the LEM Virtual Appliance
Increase and decrease the capacity of your LEM virtual appliance using the following procedures.
Increasing the LEM Virtual Appliance
You can increase the capacity of your LEM virtual appliance by increasing the hard disk in your
vSphere or Hyper-V client. To increase the size of your virtual appliance, consider the following
notes:
l
The virtualization platform disk size limits are 2040 GB for Microsoft Hyper-V and 2TB
for VMware vSphere ESXi.
8
Chapter 2: Upgrading
l
After you increase the size of your virtual disk, you cannot decrease it using the same
methods. Cloning allows you to decrease the size, but not below the original size of the
disk.
l
You cannot increase the size of your virtual appliance if you have snapshots for the
VM.
In VMware, you can edit the VM settings and change the size of the disk if there are no snapshots. On startup, the virtual appliance recognizes the change in disk size and repartitions and adjust the
filesystems appropriately.
If there are snapshots, the disk size field is disabled. To increase the size of your virtual appliance,
you must delete all snapshots of the VM.
You may also increase the existing VM by cloning it into a larger disk.
Cloning the LEM Virtual Appliance
To increase or decrease the capacity of the virtual appliance, create a secondary hard disk for the
virtual appliance in your vSphere or Hyper-V client, and then start the virtual appliance to
automatically clone the existing disk to the secondary hard disk.
Note: The new disk must be large enough to accommodate all of the data on the existing disk, but it
does not have to have the same maximum capacity.
To clone a disk in vSphere:
1. Open vSphere.
2. In the left pane, select the LEM appliance.
3. In the Inventory menu, click Virtual Machine > Power > Shut Down Guest.
4. Add the new disk:
a. In the Inventory menu, click Virtual Machine > Edit Settings.
b. Click Add.
c. In the center pane, select Hard Disk, and then click Next.
d. Select Create a new virtual disk, and then click Next.
9
To clone a disk in Hyper-V:
e. Enter the settings for a new hard disk that is large enough to accommodate all of
the data on the existing disk.
f. Click Browse to select a new datastore.
g. Click Next.
h. In the Virtual Device Node menu, select SCSI (0:2), and then click Next. The
Virtual Device Node value should be higher than the value for Hard Disk 1.
i. Click Finish.
j. Click OK.
5. On the vSphere Client window, click Inventory > Virtual Machine > Power > Power
On. The appliance starts up, clones the primary disk to the new disk, and then shuts
down. This takes between 15 minutes and several hours, depending on the size of the
disk.
6. Replace the old disk with the new one:
a. In the Inventory menu, click Virtual Machine > Edit Settings.
b. In the left pane, select the old hard disk.
c. Click Remove.
d. Select Remove from virtual machine and delete files from disk.
e. Select the new hard disk.
f. In the right pane, select SCSI (0:0) in the Virtual Device Node menu.
g. Click OK.
7. Power on the LEM appliance.
Note: We recommend taking a new appliance snapshot at this time.
To clone a disk in Hyper-V:
1. Open Hyper-V Manager.
2. In the left pane, select the LEM appliance.
10
Chapter 2: Upgrading
3. In the Actions pane (right), click Shut Down.
4. Add the new disk:
a. In the Actions pane, click Settings.
b. In the left pane under Hardware, click IDE Controller 0.
a. In the right pane, select Hard Drive, and then click Add.
b. Under Virtual hard disk (.vhd) file in the Media section, click New.
c. On the New Virtual Hard Disk Wizard window, select Fixed size and then click
Next.
d. Specify a name and location for the new disk, and then click Next.
e. Specify a size for the new blank disk that is large enough to accommodate all of
the data on the existing disk, and then click Next.
f. Click Finish.
g. In the left pane under IDE Controller 0, select the new hard disk.
h. In the right pane, select 1 in the Location menu.
i. Click OK.
5. Back on the Hyper-V Manager window, click Start in the Actions pane. The appliance
starts up, clones the primary disk to the new disk, and then shuts down. This takes
between 15 minutes and several hours, depending on the size of the disk.
6. Replace the old disk with the new one:
a. In the Actions pane, click Settings.
b. In the left pane under IDE Controller 0, select the old hard disk.
c. In the right pane, click Remove.
d. In the left pane under IDE Controller 0, select the new hard disk.
e. In the right pane, select 0 in the Location menu.
f. Click OK.
11
Determining Automatic Update Settings
7. Power on the LEM manager.
Determining Automatic Update Settings
Before upgrading the LEM manager appliance, verify that the Global Automatic Update settings for
your LEM agents have been configured according to your preferences.
To view or modify Global Automatic Update settings:
1. Open the LEM console and authenticate to the manager.
2. Go to Manage > Appliances, and then click the Settings tab in the Properties pane.
3. Select or clear Enable Global Automatic Updates according to your preferences.
4. Click Save.
Upgrading LEM Appliance
Complete the following procedure to upgrade all LEM appliances. During this process, the upgrade
script disconnects the LEM appliance from all LEM agents and consoles. If upgrading from a version
earlier than 5.3, it also reboots the LEM appliance when the upgrade is complete.
Note: If upgrading a hardware (SIM) appliance, the upgrade repartitions the available disk space on
the appliance upon reboot. This adds up to 15 minutes to the upgrade process. Do not turn off or
reboot the appliance until after it starts up completely.
To upgrade LEM appliance:
1. Prepare the upgrade media:
a. Download the Appliance upgrade for all appliance types zip file from the
SolarWinds Customer Portal.
b. Unzip the file.
c. Open the SolarWinds Log & Event Manager v6.1 Upgrade folder.
d. Copy the TriGeo and Upgrade folders to the root of a network share. For
example: C:\share\TriGeo\ and C:\share\Upgrade\.
12
Chapter 2: Upgrading
2. Connect to the LEM appliance using either the virtual console (vSphere or Hyper-V
Manager) or an SSH client such as PuTTY.
Note: Use port 32022 when using a SSH client.
3. Access the CMC prompt:
l
In vSphere: Arrow down to Advanced Configuration, and then press Enter.
l
In PuTTY: Log in using your CMC credentials.
4. At the cmc> prompt, enter upgrade.
5. Follow the onscreen instructions to complete the LEM appliance upgrade.
Troubleshooting Errors During the Appliance Upgrade
If you encounter errors during the appliance upgrade, consider the scenarios below before you
proceed or contact Support.
For additional information about contacting Support for assistance with any of these scenarios, see
the KB article, How to send LEM debugging information to Support.
To troubleshoot a generic "An error occurred during the upgrade" message:
1. Rerun the upgrade script.
2. If the script returns the error again, pull a debug and open a Support ticket.
If you receive a "You must upgrade to 5.6 before upgrading to 6.1" error, see Upgrade Paths for
Versions Prior to 5.7 for the appropriate upgrade procedure.
To troubleshoot a "The current hostname is invalid" message:
This error occurs when the hostname for your LEM appliance contains an underscore (_) character.
To resolve this issue, complete the following procedure.
1. Enter exit to return to the cmc> prompt.
2. At the cmc> prompt, enter appliance.
3. At the cmc::acm prompt, enter hostname.
13
Upgrading LEM Connectors
4. Follow the on screen instructions to change the hostname for your LEM appliance to
something that does not contain the underscore character.
5. Rerun the upgrade script.
6. If the script returns the error again, pull a debug and open a Support ticket.To
troubleshoot a "The database is not running" message, pull a debug and open a Support
ticket.
Upgrading LEM Connectors
All LEM upgrades include a connector update, but we often update the stand-alone Connector Update
package between releases as well. To ensure you have the latest version of all of the LEM
connectors, download the current Connector Update package here:
http://downloads.solarwinds.com/solarwinds/Release/LEM/SolarWinds-LEM-Connectors.zip.
To apply a LEM connector update package:
1. Prepare the update package:
a. Download the Connector Update package using the link above, or from the
Additional Components page for LEM on the SolarWinds Customer Portal. The
download is approximately 3 MB.
b. Unzip the file.
c. Open the SolarWinds-LEM-Connectors folder.
d. Copy the LEM folder to the root of a network share. For example:
C:\share\LEM\.
2. Connect to the LEM appliance using a virtual console or SSH client.
3. Access the CMC prompt:
l
Virtual Console: Arrow down to Advanced Configuration, and then press Enter.
l
SSH Client: Log in using CMC credentials.
4. At the cmc> prompt, enter manager.
5. At the cmc::cmm# prompt, enter sensortoolupgrade.
14
Chapter 2: Upgrading
6. Press Enter to validate the entry.
7. Enter n to indicate that the update is on the network.
8. Press Enter to validate your entry.
9. Enter the server and share the name for the location where the update package was
saved in \\server\share format.
10. Enter y to confirm the entry.
11. Enter the domain and user name for a user that can access the share in domain\user
format.
12. Enter y to confirm the entry.
13. Enter the password for the user.
14. Re-enter the password to confirm the entry.
15. Enter 1 to start the update. The update takes several minutes.
Note: Verify that the configured connectors restart after they are updated by watching
for InternalToolOnline alerts in the default SolarWinds Alerts filter in the LEM console.
16. After the update is finished, enter exit twice to exit the CMC interface.
For additional information, see Applying a LEM connector Update Package
Applying a LEM connector Update Package
Apply the LEM data connector update package any time SolarWinds updates a connector you use,
usually when Support informs you to do so. SolarWinds automatically updates all of your data
connectors any time you perform an appliance upgrade, but you can use stand-alone connector
updates from Support as needed to address "Unmatched Data" alerts in your environment.
To apply a LEM connector update package:
1. Prepare the update package by downloading the Connector Update package from the
Additional Components page on the SolarWinds Customer Portal.
15
Applying a LEM connector Update Package
a. Open the SolarWinds-LEM-Connectors folder.
b. Copy the LEM folder to the root of a network share. For example:
C:\share\LEM\.
2. Connect to your LEM virtual appliance using a virtual console or SSH client.
3. Access the CMC prompt using the appropriate method below:
a. Virtual Console: Arrow down to Advanced Configuration, and then press
Enter.
b. ◦SSH Client: Log in using your CMC credentials.
4. At the cmc> prompt, enter manager.
5. At the cmc::cmm# prompt, enter sensortoolupgrade.
6. Press Enter to validate your entry.
7. Enter n to indicate that your update is on the network.
8. Press Enter to validate your entry.
9. Enter the server and share name for the location into which you saved the update
package in \\server\share format.
10. Enter y to confirm your entry.
11. Enter the domain and user name for a user that can access the share in domain\user
format.
12. Enter y to confirm your entry.
13. Enter the password for the user.
14. Re-enter the password to confirm your entry.
15. Enter 1 to start the update. The update takes several minutes.
Note: Verify your configured connectors restart after they are updated by watching for
InternalToolOnline alerts in the default SolarWinds Alerts filter in the LEM Console.
16. After the update is finished, enter exit twice to exit the CMC interface.
16
Chapter 2: Upgrading
Additional Information
During the update process, the update script restarts all LEM connectors that you have configured. In
most cases, restarted connectors only trigger one "offline" and one "online" alert in your LEM
Console. However, you might also see an InternalWarning alert similar to the one shown below.
Alert Name: InternalWarning
EventInfo: -1:Start location was -1. Init set to 'newest' record, record info: 1 - 193 (101 - 293) @ -1.
InsertionIP: lab-vm-exc10.lab.exc Manager: lem DetectionIP: 10.0.0.1 InsertionTime: 11:51:04
Mon Jan 16 2012 DetectionTime: 11:51:04 Mon Jan 16 2012 Severity: 2 ToolAlias: NT DNS
InferenceRule: ProviderSID: FASTCenter normal error ExtraneousInfo: Component:
FASTCenter:NT DNS Description: -1:Start location was -1. Init set to 'newest' record, record info: 1
- 193 (101 - 293) @ -1. Detail: StackTrace:
This alert indicates that a connector has started at the beginning of the corresponding log file, and
could be related to any on of the following possible scenarios, listed in the order of their likelihood.
l
You have an unnecessary connector configured. For example, you might have the NT
DNS connector configured on a server that is not running the DNS service.
l
You have a misconfigured connector. For example, you might have a connector
pointing to the wrong location for the requisite log file.
l
The device associated with the connector rotated its logs while the connector was
offline.
Updating Agents
If this tool update is used at the Agent level (such as an Event Log tool), the Agents need to be
updated.
1. Start the LEM Console
2. Open the Manage > Nodes.
3. Highlight the Node to be updated in the list and click Remote Updates >Update to
update the tool on those Agents.
17
Upgrading LEM Consoles
Note: You can select more than one agent at a time by using the Shift or Ctrl keys in
conjunction with your mouse-clicks. Alternatively, you can enable “Global Automatic
Updates” from Manage > Appliances >Settings to have the Manager automatically
update the Agents as they connect.
It could take a couple of minutes for the update to complete as it is being broadcast out to your
agents. When the update is complete, the Agents have an Update Status of "Updated" a green
checkmark in the Update Status column.
Upgrading LEM Consoles
After the LEM manager is upgraded, the LEM web console is automatically updated. You may be
automatically reconnected during upgrade but to ensure you are running the latest version you should
refresh the console in your browser, or close and reopen your browser, and reconnect.
To upgrade your LEM desktop console:
After you upgrade your LEM manager, upgrade the LEM desktop console to take advantage of the
new features in this release. If the LEM desktop console is not upgraded, you will experience missing
features and unexpected behavior.
1. Uninstall the existing air console.
2. Download the Log & Event Manager Console v6.1.zip file from the SolarWinds
Customer Portal and extract its contents.
3. Run SolarWindsLEMConsole.air and complete the installation wizard.
Note: Both the LEM desktop console and web consoles preserve all filters and other
local settings from previous versions of the LEM console.
Upgrading LEM Reports
After upgrading the LEM manager, upgrade the LEM Reports to be compatible with the web console.
Note: Previously scheduled reports will not run until you upgrade to the latest version. 18
Chapter 2: Upgrading
To upgrade LEM Reports:
1. Download the Log & Event Manager Reports v6.1.zip file from the SolarWinds
Customer Portal and extract its contents.
2. Run setup.exe and complete the installation wizard.
Upgrading LEM Agents
Upgrade all of your LEM agents to take advantage of several enhancements, including an updated
Java Runtime Environment (JRE), and several infrastructure updates.
If you selected Enable Global Automatic Updates when you completed Determining Automatic
Update Settings, your LEM agents have been automatically upgraded and there is nothing further for
you to do.
If you did not select Enable Global Automatic Updates when you completed Determining Automatic
Update Settings, use the following procedures to upgrade your LEM agents. You can upgrade your
LEM agents either from your LEM console or using the appropriate installer.
To manually upgrade your LEM agents from your LEM console:
1. Open the LEM console and authenticate to the manager.
2. Click Manage, and then select Nodes.
3. Select the LEM agent(s) you want to upgrade. Use Ctrl+click to select multiple agents.
4. Click Remote Updates and then select Update. The LEM manager attempts to
automatically restart the SolarWinds Log and Event Manager Agent service when the
update is complete.
5. If a LEM agent does not reconnect within a reasonable time, restart the service on the
affected computer manually.
To manually upgrade LEM agents using an installer:
Note: Install the new version of your LEM agents in the same folder as your existing LEM agents.
Installing over the existing agent allows the installer to update the LEM agent software while
maintaining all other configuration settings.
19
Upgrade Paths for Versions Prior to 5.7
1. Download the appropriate agent Installer from the Additional Components page of the
SolarWinds Customer Portal and extract the ZIP file's contents.
2. Run setup.* and complete the installation wizard.
Note: For information about running the remote installer for Windows agents, see the Using the LEM
Remote Agent Installer KB article.
Upgrade Paths for Versions Prior to 5.7
The LEM appliance upgrade package upgrades only LEM version 5.7 and later. If you are running an
earlier version of LEM or TriGeo SIM, upgrade your appliance to a compatible version first, using the
following upgrade paths.
Note: If you need upgrade media for prior versions of LEM or TriGeo SIM, open a Support ticket.
The full upgrade paths from earlier versions of LEM (formerly TriGeo) are as follows:
LEM
Version
Upgrade Path
3.5.x
3.5.6 > 4.0 > 4.5.3 > 5.0.2 > 5.2.1 > 5.4 > 5.6 > 6.0.1 >6.1
3.5.6
4.0 > 4.5.3 > 5.0.2 > 5.2.1 > 5.4 > 5.6 >6.0.1 > 6.1
4.0
4.5.3 > 5.0.2 > 5.2.1 > 5.4 > 5.6 > 6.0.1 > 6.1
4.5.3
5.0.2 > 5.2.1 > 5.4 > 5.6 > 6.0.1 > 6.1
4.6
5.0.2 > 5.2.1 > 5.4 > 5.6 > 6.0.1 > 6.1
5.0.x
5.0.2 > 5.2.1 > 5.4 > 5.6 > 6.0.1 > 6.1
5.0.2
5.2.1 > 5.4 > 5.6 > 6.0.1 > 6.1
5.1.x
5.2.1 > 5.4 > 5.6 > 6.0.1 > 6.1
5.2.1
5.4 > 5.6 > 6.0.1 > 6.1
5.3
5.4 > 5.6 > 6.0.1 > 6.1
20
Chapter 2: Upgrading
LEM
Version
Upgrade Path
5.4
5.4 > 5.6 > 6.0.1 > 6.1
5.5
5.6 > 6.0.1 > 6.1
5.6
6.0.1 > 6.1
6.0
> 6.0.1
6.0.1
>6.1
21
Chapter 3: Introduction to the Console
The LEM Console is organized into different functional areas, called views. These views organize
and present different information about the components that make up the LEM system.
l
In Ops Center, you'll find a dashboard view that presents visual representations of
your data.
l
In Monitor, you'll filter and view event details.
l
In Explore, you'll find utilities for investigating events and their details.
l
In Build, you'll create critical components of LEM that function on a Manager for
processing process data.
l
In Manage, you'll manage properties associated with Agents and Managers, and
configure data sources to integrate your network security data with LEM.
l
Reports is a separate application. Its reporting tools let you run or schedule reports
about the data that is stored in your LEM database.
The following topics briefly explain the role of each view of the Console, the view’s primary uses, and
where to get information on performing key tasks within that view. Topics are arranged here in an
order that will help you understand the most fundamental items first, such as events, event filters,
and widgets. They then progress to more advanced features, such as exploring events, and creating
Groups and rules.
Opening Views in the Console
The Console is made up of multiple views, where each view has a special function.
To open a view:
l
To open the Ops Center view (to work with widgets), click Ops Center .
l
To open the Monitor view (to view, manage, and create filters), click Monitor.
l
To open the Explore view (to work with explorers), click Explore .
22
Chapter 3: Introduction to the Console
l
To open the Explore view (to search or view event data or log messages), click
Explore and then select nDepth.
l
To open the Explore view (to view additional utilities), click Explore and then select
Utilities.
l
To open the Groups view (to build and manage Groups), click Build and then select
Groups.
l
To open the Rules view (to build and manage policy rules), click Build and then select
Rules.
l
To open the Users view (to add and manage Console users), click Build and then
select Users.
l
To open the Appliances view (to add and manage appliances), click Manage and then
select Appliances.
l
To open the Nodes view (to add and manage Agents), click Manage and then select
Nodes.
Working with Grids
Grids are used throughout the Console. The following topics explain how to perform common tasks
with grids, such as selecting rows and grid cells, resizing grid columns, rearranging grid columns, and
sorting a grid by its columns.
Rearranging Grid Columns
When needed, you can rearrange the order in which grid columns appears. The columns will stay in
their rearranged order until you exit the Console. Upon reopening the Console, the columns revert to
their default order.
To rearrange grid columns:
Click the header of the column you want to move; then drag it to the right or left and drop it into the
desired position.
23
Sorting a Grid by its Columns
Sorting a Grid by its Columns
You can sort the data in a grid by clicking its column headers. You can sort each column in ascending
(alphabetical) order, or in descending (reverse alphabetical) order. In many cases, you can sort a grid
by more than one column by using the Ctrl+click method.
Note: Before sorting the Monitor view’s event grid, you must first click the grid’s Pause button to
stop the incoming event traffic. When you are done, click Resume to continue receiving event traffic.
To sort a grid:
l
Click one of the grid’s column headers to sort the grid by that column. If the column
header shows an upward ▲ arrow, it means the column data is sorted in ascending
order (alphabetically, or from lowest to highest: A to Z, 1 to 0).
If the column header shows a downward ▼ arrow, it means the column data is sorted in
descending order (reverse alphabetical, or from highest to lowest: Z to A, 0 to 1).
l
Click the column header again to sort the grid by the same column, but in reverse order.
To sort a grid by multiple columns:
l
Press and hold the Ctrl key; then click another column header. You can tell how the
table is sorted by the small ▲ and ▼ arrows in the column headers, and by the little
numbers (1 and 2) that appear next to them. An “up” ▲ arrow means the column is
sorted in ascending order. A “down” ▼ arrow means it is sorted in descending order.
Then numbers state the column sort order. 1 is the first sort, 2 is the second sort, and
24
Chapter 3: Introduction to the Console
so on.
l
If a secondary column’s sort order is in the wrong direction, press the Ctrl key and click
the column header again. This will reverse the column’s sort order.
By pressing Ctrl and then clicking the Name column, you can also sort the tool names
in ascending or descending order. In the example shown here, the Name column was
sorted in ascending order, so the specific tools would appear in alphabetical order
within each tool category.
Logging In and Out of Managers
When first connecting to the web console, you are prompted to authenticate to the host manager. If
you have additional managers associated with that console, log in to configure them or view their
events. Logging out will disconnect you from additional managers in the web console. To disconnect
from the host manager, close the browser window.
Note: Only existing Administrator, Auditor, and Monitor Users can log on to the system.
Contacts cannot log on to LEM.
Logging Into a Manager
1. At the top of the LEM Console, click Manage and then click Appliances.
2. In the Appliances grid, click to select the appliance you want to work with.
3. Click the gear
button and then select Login. Depending on the Manager’s Login
tab settings (in the Properties pane), the LEM Console may automatically log you on to
the appliance. Otherwise, the Login form appears.
4. In the Username box, type user name for this Manager.
5. In the Password box, type password for this Manager.
6. Click OK or press Enter to log on. A
25
icon appears in the Manager’s Status
Logging Out of a Manager
column, indicating that you are logged on to that Manager.
Logging Out of a Manager
1. At the top of the Console, click Manage and then click Appliances.
2. In the Appliances grid, click the gear
button for the Manager you want to log out
of, and then select Logout. After a moment, a
icon appears in the Manager’s
Status column, indicating that you are no longer logged on to that Manager.
Logging Out of the LEM Console
Clicking the Logout button closes the Console window and disconnects the Console from any
connected Managers. Logging out of the Console causes it to disappear to the Managers, but the
Managers continue to gather information from their Agents. However, when you reopen the Console,
it will not display the Manager and Agent event traffic that occurred when it was closed. Instead, the
event grid will be blank.
It is recommended that you keep the Console running either on your workstation or a secondary
workstation to best monitor events on a daily basis.
26
Chapter 4: Getting Started
1. To start the LEM web console, launch a web browser and enter the Web Console URL
provided during the configuration of VMware vSphere or Microsoft Hyper-V.
2. Click Connect.
3. Accept the license agreement and then click OK. Click Cancel if you do not wish to
accept the license agreement.
4. Enter your email. This is required for all evaluation users.
5. Select the check box to assist the SolarWinds Improvement program in collecting
anonymous data about your product usage.
6. Click Save.
When you start the Console for the first time, the Manage >Appliances view appears, so you can
configure and log in to a Manager. Otherwise, the Console restores the view that was open the last
time you closed the Console.
The Getting Started Wizard is a quick and easy guide to getting your initial system setup and
configured so you can start working with LEM. We recommend working through the wizard to set up
some of the basics settings.
27
Chapter 4: Getting Started
The Getting Started Wizard widget is located on the Ops Center tab.
Configuring Email Alerting
This wizard walks you through a short process to set up to receive email alerts when there is a
problem with a device that is being monitored.
1. From the Getting Started widget, click Configure Basic LEM Settings.
2. Click Next on the Welcome to LEM window.
3. Enter the Mail Host.
4. Enter the Port number.
5. Select the Transport Protocol.
6. Enter the Return Address.
7. Enter the Return Address Display Name.
8. Enter the Authentication Server Username.
28
Configuring an Active Directory Connection
9. Enter the Authentication Server Password.
10. If desired, click Test Email.
11. Click Next.
Configuring an Active Directory Connection
Configure the Directory Service connector on your LEM Manager to enable the LEM Manager to
establish an LDAP connection to your Active Directory server to import your organizational groups.
1. Enter a Domain Name.
2. Enter the Directory Service Server.
3. Enter a User Name.
4. Enter a Password.
5. Select the Encryption method.
6. Enter a Custom Port.
7. Click the Test Domain Connection.
Adding a Node
The Add Nodes to Monitor wizard walks you through adding a Node to monitor a network device.
The wizard locates the new node and then recommends an appropriate connector. For information on
adding other types of Nodes, see Adding Nodes Manually
Adding a Syslog Node:
1. From the Getting Started widget, click Add Nodes to Monitor.
2. Select Syslog node.
3. Enter the IP Address of the node.
4. Select the Node Vendor from the list.
5. Configure the node so LEM can receive syslog messages. If you need help, click the
links provided for enabling specific vendor devices.
29
Chapter 4: Getting Started
6. Select the I have configured this node so that LEM can receive its Syslog
messages check box.
7. Click Next and LEM then scans for new devices.
Rules
The Rules wizard combines all steps necessary for enabling bulk basic rules in one area:
l
Setup email action configuration
l
Setup email alert recipients
l
Select categories of rules enabled. General best practice steers users towards
important rules to enable
There are three methods to access the Rules wizard.
l
Click Define Rules and Configure Alerts from the Getting Started widget.
l
Click the Try it Now link in the What's New in LEM widget.
l
Select Build > Rules and click Add Rules in the Rules area.
30
Adding Rules with the Rules Wizard
Adding Rules with the Rules Wizard
1. Click Define Rules and Configure Alerts.
2. Select the rules categories you wish to use from the Rules Category screen.
3. Click Next.
4. Select the rules within the chosen categories and click Next.
31
Chapter 4: Getting Started
5. Configure your Email Server Settings if you have not already done so previously. For
more information, see Configuring Email Alerting
6. Select the email recipients.
7. Click Next.
8. Review the rules summary page for all rule categories, and then click Finish.
For more information on adding rules, see Rule Categories and Tags
Click the Advanced LEM Tools link to learn more about Advanced LEM Tools, such as filters, reports,
nDepth searches, and custom rules.
32
Chapter 5: Useful Tasks
Tour Log & Event Manager
Click the
video icon to view the corresponding tutorial.
Access your log and event data using the LEM web console or local desktop console. Both interfaces
allow you to monitor your data in real time with filters, respond automatically to specific events with
rules, and analyze events on your network with the nDepth search utility. Access all of these features
and more on the navigation bar at the top of the LEM Console window.
Ops Center
Use the Ops Center tab as a real-time graphical overview of the events on your network. The Ops
Center includes the following useful components:
l
A customizable dashboard with several default charts and graphs, called widgets
l
The Widget Manager to browse, edit, add, and pin widgets
l
Informational widgets with links to videos, documents, and other resources
To add a widget to the Ops Center dashboard:
1. In the LEM Console, click the Ops Center tab.
2. Click Widget Manager in the upper-right corner.
3. Find and select a filter from the Categories list.
4. In the Widgets pane, scroll through the available widgets to put the widget you want in
the main preview position.
5. Click Add to Dashboard in the upper-right corner.
6. To re-position the widgets on the dashboard, drag and drop them into a new position.
33
Chapter 5: Useful Tasks
To create a new widget using Widget Manager:
1. In the LEM Console, select the Ops Center tab.
2. Click Widget Manager in the upper-left corner.
3. Click the plus
button at the top of the Categories list.
4. Complete the Widget Builder form.
5. To pin the new widget to the dashboard, select Save to Dashboard.
6. Click Save.
Monitor
Use the Monitor tab to view all of the monitored events on your network in real time. Monitor includes
the following useful components:
l
A real-time event stream to which you can apply event filters
l
The Event Details pane, which displays the details for any event you highlight in the
event stream
l
A Widgets pane, which displays a graphical representation of the current filter, if
available
l
Several default filters to refine the data you see in the event stream
l
A GUI filter editor, called Filter Creation, to create and edit event filters
To apply a filter to the Monitor event stream, select a default or custom filter from the Filters list.
To view the Event Details for a specific event in the event stream, select the event in the event
stream.
To change the widget the Widgets pane displays for a filter:
1. In the LEM Console, select the Monitor tab.
2. Select the filter you want to modify in the Filters pane.
3. Click the menu at the top of the Widgets pane, and then select the widget you want that
filter to display.
34
Explore
Explore
Use the Explore tab menu to access several analysis utilities to get additional information about the
events you see in the LEM Console. Use the nDepth option in the Explore menu to search and
analyze the events on your network. nDepth includes the following useful components:
l
A variety of clickable charts and utilities to view and refine search results
l
A comprehensive toolbar to switch between multiple utilities and views
l
A Result Details utility to view all of your search results in text format
l
A PDF export utility to configure and export custom reports
Use the Utilities option in the Explore menu to access several IT analysis utilities, including:
l
WhoIs
l
NSLookup
l
Traceroute
l
Flow (sFlow and NetFlow)
To execute a WhoIs, NSLookup, or Traceroute task from an event or search result in the
LEM Console:
1. Find the event or search result you want to explore further, and then select it.
2. Click the Explore menu on the Event Grid or nDepth title bar (next to Respond), and
then select the utility you want to use.
To execute a blank WhoIs, NSLookup, or Traceroute task in the LEM Console:
1. Click the Explore tab on the navigation bar, and then select Utilities.
2. Click the Explore button on the Utilities title bar , and select the utility you want to use.
3. Complete the form for the utility, and then click Search.
For information about using the Flow task in the Explore > Utilities view, see the KB article, "Use
your LEM appliance as a Flow collector."
35
Chapter 5: Useful Tasks
Build
Use the Build tab menu options to customize LEM behavior. The Build menu consists of the following
options:
l
Groups: Create and manage lists of users, computers, and information.
l
Rules: Create and manage rules that correlate events from different systems and
instruct the LEM appliance to respond accordingly.
l
Users: Create and manage LEM Console users.
For additional information about the Users and Groups options in the Build menu, see the following
KB articles:
l
"Getting Started with User-Defined Groups"
l
"Creating Users in the LEM Console"
Rules – Additional Details
View custom and pre-configured rules in the Rules view under the Build menu. The Rules view
consists of the following useful components:
l
A GUI editor, just like Filter Creation
l
A community rule set, organized by event-centric categories
l
35 active responses to assign to custom or pre-configured rules
Manage
Use the Manage tab menu to access details about your LEM architecture. The Manage menu
consists of the following options:
l
Appliances: Add LEM appliances to monitor in the LEM Console, view your LEM
license details, and configure global settings.
l
Nodes: View and manage LEM nodes, including remote logging devices and LEM
Agents.
36
Additional Information
To set your LEM Console authentication preferences:
1. In the LEM Console, click the Manage tab, and then select Appliances.
2. Click the Login tab on the Properties pane.
3. If you want your LEM Console to authenticate to your LEM appliance upon launch,
enter your LEM Username and Password.
4. If you want your LEM Console to ask you for your LEM Password upon launch, enter
just your LEM Username.
5. Select Login Automatically Next Time.
6. Select Save Credentials.
7. Click Save.
To set the global password policy for LEM users:
1. In the LEM Console, click the Manage tab, and then select Appliances.
2. Click the Settings tab on the Properties pane.
3. Adjust the Minimum Password Length according to your preference.
4. If you want to require complex passwords for LEM users, select Must Meet
Complexity Requirements.
Note: Complex passwords must include any three of the following four character types:
l
Capital letters
l
Lower-case letters
l
Numerals (0-9)
l
Symbols (!, @, #, etc.)
5. Click Save.
Additional Information
For additional information about how to use the LEM Console, consult the following resources:
37
Chapter 5: Useful Tasks
l
Introduction to the Console
l
Ops Center
l
Monitor
l
Explore
l
Build
l
Manage
Adding Devices
Click the
video icon to view the corresponding tutorial.
Configure your IT devices to work with LEM using one of two options:
l
Install the LEM Agent and connectors directly on the device
l
Set the device to log to LEM and then configure the appropriate connectors directly on
the LEM appliance.
Install the LEM Agent on computers that allow third party software. SolarWinds provides LEM Agents
for these operating systems:
l
Microsoft Windows (local and remote installers)
l
Linux
l
Mac OS X
l
Solaris on Intel
l
Solaris on Sparc
l
HPUX on PA
l
HPUX on Itanium
l
AIX
Configure other devices, such as firewalls, routers, or switches to send logs directly to the LEM
appliance using syslog or SNMP traps.
38
Agent Installation
Agent Installation
The LEM Agent is a necessary component to monitor local events on the computers on your network.
Install the LEM Agent on servers, domain controllers, and workstations. The LEM Agent then
captures log information from sources such as Windows Event Logs, a variety of database logs, and
local antivirus logs. The LEM Agent also allows LEM to take specific actions that you use rules to
define. You can also trigger actions manually from the LEM Console using the Respond menu.
Installing a LEM Agent:
1. Click the DOWNLOAD: Agents link in the LEM Console Getting Started widget, or
visit the SolarWinds Customer Portal for a complete list of available downloads.
2. Download the appropriate installer, and then run it on the computer(s) you want to
monitor
Note: If you are deploying LEM Agents to Windows computers, you can use the Remote Agent
Installer for a faster deployment.
View and manage installed LEM Agents in the Nodes view of the LEM Console. The LEM Agent for
Windows includes several pre-configured connectors so you immediately start to see data from these
computers after you have installed the LEM Agent. By default, the LEM Agent for Windows includes
the following pre-configured connectors:
l
Windows Security Log (for the host OS version)
l
Windows Active Response
l
Windows Application Log
l
Windows System Log
For other operating systems, or for broader coverage on your Windows computers, configure specific
connectors to get exactly what you are looking for.
Configuring Non-Agent Devices
Non-Agent devices include any supported network or security device on which you cannot install a
LEM Agent. Some common examples are firewalls, routers, and switches. To monitor these devices
with LEM, configure each device to log to the LEM appliance using syslog or SNMP traps. Then,
configure the appropriate connector on the LEM appliance using the LEM Console.
39
Chapter 5: Useful Tasks
Configuring Connectors for Agent and Non-Agent Devices
The procedure for configuring connectors for Agent and non-Agent devices is generally the same. The
major difference is where you find the configuration forms in the LEM Console. Complete the
following procedure to configure connectors for all the devices you want to monitor with LEM.
To configure connectors in the LEM Console:
1. In the LEM Console, click the Manage tab, and the select Nodes (for Agent
connectors) or Appliances (for non-Agent connectors).
2. Click the gear
button next to the LEM Node or Manager you want to configure,
and then select Connectors.
3. If you want to view or modify the configured connectors, select Configured in the
Refine Results pane.
4. To find the connectors you need, use the search box and filter menus on the Refine
Results pane.
5. After you've identified the connector to be configured, click the gear
button next
to it, and then select New.
6. Complete the Connector Configuration form according to the device you're configuring.
The following fields/descriptions are common for most connectors:
l
Alias: a "user friendly" label for your connectors
l
Log File: the location of the log file the connector will normalize; this is a location
on either the local computer (Agents) or LEM appliance (non-Agent devices)
l
Output, nDepth Host, and nDepth Port: values used specifically for LEM
environments that are configured to store original log messages; for additional
ixxnformation, consult the resources at the end of this section
7. After completing the form, click Save.
8. In the Connectors list, click the gear
button next to the new connector (denoted
by an icon in the Status column), and then select Start.
40
Troubleshooting
9. After starting the connector, verify that it is working by checking for events on the
Monitor tab.
To configure FIM connectors in the LEM Console:
1. In the LEM Console, click the Manage tab, and the select Nodes.
2. Click the gear
icon next to the LEM Node you want to configure, and then select
Connectors.
3. To find the connectors you need, enter FIM in the Refine Results search box.
4. Click the gear
icon next to the connector to be configured, and then select New.
5. In the Monitor Templates area, click the gear
icon next to the desired Monitor
Template and select Add to selected monitors. The Monitor template moves to the
Selected Monitors area.
6. After completing the form, click Save.
7. In the Connectors list, click the gear
icon next to the new connector (denoted by
an icon in the Status column), and then select Start.
8. After starting the connector, verify that it is working by checking for events on the
Monitor tab.
For more information on FIM connectors, see .
Troubleshooting
If you have configured a device to log to the LEM appliance, but you cannot determine the exact
logging location, check the logging facilities on the LEM appliance to determine where your data is
going.
To check the logging facilities on the LEM appliance:
1. Connect to your LEM appliance using the VMware console view, or an SSH client such
as PuTTY.
41
Chapter 5: Useful Tasks
2. If you are connecting to your appliance through SSH, log in as the CMC user, and
provide the appropriate password.
3. If you are connecting to your appliance using VMware, select Advanced
Configuration on the main console screen, and then press Enter to get to the
command prompt.
4. At the cmc> prompt, enter appliance.
5. At the cmc::acm# prompt, enter checklogs.
6. Enter an item number to select a local facility to view.
7. Look for indications of specific devices logging to this facility, such as the product
name, device name, or IP address.
8. After you have determined the facility your device is logging to, configure the connector
with the corresponding Log File value.
For additional troubleshooting tips related to LEM Agents or remote logging devices, see the following
KB articles:
l
"Troubleshooting LEM Agent Connections"
l
"Troubleshooting 'Unmatched Data' or 'Internal New Tool Data' events in your LEM
Console"
Additional Information
For additional information about configuring devices to monitor with LEM, see Leveraging
For additional information about installing LEM Agents on a variety of operating systems, see the
following KB articles:
l
"Using the SolarWinds LEM Agent Installer for Windows"
l
"Using the SolarWinds LEM Remote Agent Installer"
l
"Using the SolarWinds LEM Agent Installer non-interactively"
l
"Using the SolarWinds LEM Agent Installer for Linux"
l
"Using the SolarWinds LEM Agent Installer for Mac OS X"
42
Verifying Data
For additional information about how to tune Windows logging for your LEM deployment, see the
following KB articles:
l
"Audit Policy and Best Practice"
l
"LEM Manager crashes after receiving a high number of events from Windows 7 or
Windows Server 2008"
l
"How to enable file auditing in Windows"
l
"Monitoring Account Lockout Events"
For additional information about how to monitor and configure groups of LEM Agents using Connector
Profiles, see the KB article, "How to create Connector Profiles to manage and monitor LEM Agents."
For a list of supported Agent and non-Agent devices, see "Comprehensive Data Source Support for
All Your Logs & Events."
For additional information about configuring connectors for specific devices, search the "Connectors"
category of the LEM Knowledge Base.
For additional information about configuring LEM and your connectors to store original log messages,
see the following KB articles:
l
"Configuring Your LEM Appliance for Log Message Storage and nDepth Search"
l
"Do not modify the Output, nDepth Host, or nDepth Port fields when configuring LEM
connectors unless your appliance is set up to store original log data"
For additional information about creating filters for specific devices, see the KB article, "How can I
see all traffic from a specific device in my LEM Console?".
Verifying Data
Click the
video icon to view the corresponding tutorial.
Now that LEM is collecting your log data, use nDepth and LEM Reports to search, analyze, and
report on that data. In most cases, use the nDepth Explorer in the LEM Console to search and
analyze your data. Use the stand-alone LEM Reports application to report on your data.
43
Chapter 5: Useful Tasks
Which Do I Pick?
Use nDepth if you want to perform immediate search or analysis tasks, or create specific custom
PDF reports. Use nDepth to:
l
Search your log data interactively
l
Search for specific variables, such as user names, IP addresses, or specific events
l
Perform root-cause analysis
l
Troubleshoot specific issues
l
Explore data and produce custom PDF reports
Use LEM Reports if you want to view or schedule fixed reports for regulatory and compliance
purposes or to:
l
Automate reporting
l
Produce compliance reports
l
View reports based on specific regulatory compliance initiatives
l
Provide proof that you are auditing log and event data to auditors
l
Schedule formatted reports for LEM Reports to run and export automatically
nDepth: A Fully Integrated IT Search Solution
Open nDepth in the LEM Console in any of these three ways:
1. Select an event on the Monitor tab, click the Explore menu, and then select nDepth.
2. Select a filter in the Filters pane on the Monitor tab, click the gear
icon at the top
of the Filters pane, and then select Send to nDepth.
3. Click the Explore tab from anywhere in the LEM Console, and then select nDepth.
Consult nDepth for several analytical connectors that it summarizes on both its dashboard and
toolbar. Use this view to:
44
LEM Reports: For Compliance and Historical Reporting Needs
l
Search original log messages (AKA "raw logs") or normalized events
l
View search results in several charts and graphs, and add values from these visuals
directly to your search just by clicking them
l
Refine the time frame of your searches using pre-defined or custom ranges
l
View the text output of your search results using the Result Details connector on the
nDepth toolbar
l
Export your search results in CSV or fully-customizable PDF format
l
Save searches for future use
LEM Reports: For Compliance and Historical Reporting Needs
LEM Reports is a stand-alone application that you install separately from the LEM Console. Access
LEM Reports using a shortcut, if available, or by navigating to the SolarWinds Log and Event
Manager application group in your Windows Start menu.
Use LEM Reports to:
l
Run hundreds of pre-configured compliance and security reports
l
Schedule reports for LEM Reports to run automatically
l
Filter the reports list by industry or requirement
l
Run Master, Detail, or Top level reports according to how much information you need
l
Use Select Expert to filter your report data by specific values, such as computer name,
IP address, or user name
l
Export reports into several formats, including PDF, CSV, and RPT
To get started with LEM Reports, filter the reports listing by the industries or requirements relevant to
your network. Then, the next time you open LEM Reports, access your custom list of reports by
clicking Industry Reports on the main view.
To filter the reports list by industry or requirement:
1. Open LEM Reports.
2. On the Settings tab, click Manage, and then select Manage Categories.
45
Chapter 5: Useful Tasks
3. Select your industries and requirements in the left pane. Mix and match as necessary.
For example, if you are a school that accepts credit card payments, select Education,
FERPA, and PCI.
4. Click OK.
5. To view the filtered list of reports, click the Category menu back on the Settings tab,
and then select Industry Reports.
Select which reports to run based on their values in the Level column on the Settings tab:
l
Master: Reports at this level contain all of the data for their category. For example, the
master-level Authentication report contains all authentication-related data.
l
Detail: Reports at this level contain information related to a specific type of event. For
example, the Authentication – Failed Authentications detail-level report only contains
data related to "Failed Authentication" events.
l
Top: Reports at this level display the top number of occurrences for a specific type of
event. Use the default top number, or Top N, of 10, or customize this when you run the
report.
Troubleshooting
If you have installed LEM Reports, but are unable to open the application or run reports, complete the
following procedures to troubleshoot the issue.
To troubleshoot application launch errors on computers running Windows Vista,
Windows 7, and Windows Server 2008:
1. Uninstall LEM Reports and Crystal Reports v11 Runtime.
2. Reinstall both components as Administrator.
3. Adjust the LEM Reports properties to run the program in Windows XP compatibility
mode and as an administrator:
a. Right-click the LEM Reports shortcut on your desktop or in the SolarWinds
Log and Event Manager program group in your Windows Start menu, and then
select Properties.
46
Additional Information – nDepth
b. Click the Compatibility tab.
c. Select Run this program in compatibility mode for, and then select
Windows XP (Service Pack 3).
d. Select Run this program as an administrator.
e. Click OK.
4. Launch LEM Reports.
To address "Logon failed. Database Vendor Code 210" errors:
Add the computer running LEM Reports to the list of authorized reporting computers. By default, the
LEM appliance restricts all access to LEM Reports. To allow specific computers to run LEM Reports
or remove all reporting restrictions, complete the procedures in the KB article, "Configuring Report
Restrictions."
Additional Information – nDepth
For additional information about how to use nDepth to search and analyze your data in the LEM
Console, consult the following resources.
l
Explore
l
Utilizing the Console
External Resources
For examples of how to execute nDepth searches, see the following KB articles:
l
l
"How to create an nDepth query for all activity by a single user"
"Sending Filters to nDepth for Historical Search"
For additional information about how to save nDepth searches for future use, see the KB article,
"Save nDepth searches to quickly execute frequent queries."
For additional information about how to export nDepth search results in CSV or PDF format, see the
KB article, "Export nDepth results in custom or text formats for retention and ad hoc reporting."
47
Chapter 5: Useful Tasks
For additional information about configuring your LEM appliance to store and search original log data,
see the following KB articles:
l
"Configuring Your LEM Appliance for Log Message Storage and nDepth Search"
l
"Using your LEM Console to view and search original log messages"
l
"Do not modify the Output, nDepth Host, or nDepth Port fields when configuring LEM
connectors unless your appliance is set up to store original log data"
Additional Information – LEM Reports
For additional information about how to run, schedule, and configure formatted compliance and
security reports using LEM Reports, consult the following resources.
l
Reports
l
Report Tables
For information about installing LEM Reports on computers without the LEM Console, see the KB
article, "Configuring LEM Reports on Computers Without the LEM Console."
For information about how to schedule several best practice compliance and security reports, see the
following KB articles:
l
l
l
"Configuring Default Batch Reports on XP/2003 Computers"
"Configuring Default Batch Reports on Vista/7/2008 Computers"
"Report Formats and their corresponding numbers listed in a LEM scheduled report ini
file"
For additional information about working with individual reports in LEM Reports, see the following KB
article
l
"Filtering and Exporting LEM Reports"
l
"Creating a Custom Filtered Report"
Adding Filters
Click the
video icon to view the corresponding tutorial.
48
Which Do I Pick?
Filters group and display events that your LEM Agents and remote logging devices send to LEM.
They are based on events, which are the normalized version of these network events. For LEM, the
terms "events" and "alerts" are interchangeable. View these events in real time on the Monitor tab in
the LEM Console.
Which Do I Pick?
Create filters when you want to group a particular type of event. The following are just a few examples
of what you might create a filter to catch:
l
All events from your firewalls
l
All events from your domain controllers
l
All events for a specific type of user
l
All events except for recurring, expected events
Create rules when you want LEM to take some kind of action in response to one or more events. In
many cases, you base rules on several events that LEM correlates to trigger an action, but you can
also configure a rule to look for a single event. Rule actions include, but are not limited to:
l
Sending an email
l
Logging a user off
l
Shutting down a computer
l
Deleting an Active Directory group
l
Blocking an IP address
Use the Default Filters as Examples
The LEM Console includes several pre-configured filters on the Monitor tab. Examine the conditions
of these filters to get a sense of how broad or specific filters can be. The following are two examples
of these extremes:
l
All Events: This filter does not have any specific conditions, so it captures all events,
regardless of the source or event type.
49
Chapter 5: Useful Tasks
l
User Logons: This filter has a single condition that means, "UserLogon Exists." It
captures all events with the event type "UserLogon" and nothing else – not user log
offs, not user logon failures.
To view the conditions of a default filter:
1. In the LEM Console, click the Monitor tab.
2. Select the filter you want to examine in the Filters pane.
3. Click the gear
button at the top of the Filters pane, and then select Edit.
4. If you make any changes to the filter, click Save. Otherwise, click Cancel.
Other Filter Scenarios
Some scenarios may warrant a filter so you can monitor them more closely:
l
Change management events: Monitor configuration changes made to your network.
l
High volume events: Watch for spikes of traffic, or unexpected off-peak traffic.
l
Events of general interest: Keep track of logon failures and failed authentications.
Note: A failed authentication is an event triggered by three logon failures by the same account within
an extremely short period of time.
l
Rule scenarios: Determine whether you have the right events to create a rule for a
specific scenario.
l
Daily problems: Get a head start on operational problems like account lockouts by
seeing the events in real time.
Example: Change Management
Create a change management filter to monitor configuration changes users make to your network.
Keep this filter general, as illustrated here, or refine it to show you only certain changes or changes
made by certain users.
50
Troubleshooting
To create a filter for all change management events:
1. In the LEM Console, click the Monitor tab.
2. Click the plus
button at the top of the Filters pane, and then select New Filter.
3. Enter an appropriate name for the filter, such as Change Management Events.
4. Fill the filter's Conditions box with an appropriate event or event group. For this
example, use an Event Group Exists condition to capture all events from a certain
group:
a. Click Event Groups on the left pane.
b. Find the Change Management Events event group, and drag it into the
Conditions box.
5. Click Save.The LEM Console takes you to the new filter on the Monitor tab. Examine the events
here, and click an event to see more information in the Event Details pane.
Troubleshooting
If you have created a filter, but it is not capturing the expected events, check the All Events filter to
ensure the events are making it to the LEM Console.
To use the All Events filter to troubleshoot custom filters:
1. In the LEM Console, click the Monitor tab.
2. Click All Events in the Filters pane.
3. Locate an event you expected to see in your custom filter. If necessary, pause the filter
and sort it by any of the column headers.
4. If you locate a related event, verify the field-value combinations in the event match the
ones you used in your filter. For example, if your filter is looking for *firewall* in the
ConnectorAlias field, ensure the Connector Alias field in your event contains the word
firewall.
51
Chapter 5: Useful Tasks
5. If you cannot locate a related event, verify one of your monitored devices is logging the
event, and that the device is sending its events to LEM. For example, create another
filter to show all events from the specific device using the ConnectorAlias or
DetectionIP event field, as illustrated in the KB article, "How can I see all traffic from a
specific device in my LEM Console?".
Additional Information
For additional information about how to create filters in the LEM Console to monitor events of interest,
consult the following resources.
l
Monitor
l
Filter Configuration Tables
l
Appendix Event Data Fields
For a general procedure and video addressing how to create filters in the LEM Console, see the KB
article, "Creating Filters for Real-time Monitoring in Your LEM Console."
For additional information about how to create filters for specific events, devices, or time frames, see
the following KB articles:
l
l
"Quickly Creating a Filter for a Specific Event Type"
"Use Time of Day Sets to pinpoint specific time frames in filters and rules"
For additional information about advanced options related to filters and the Monitor view, see the
following KB articles:
l
"Disabling Windows Noise Events Using Event Distribution Policy "
l
"Disabling Windows Filtering Platform Events Using Event Distribution Policy"
l
"Modifying Filters for 'Monitor' Users"
l
"Modifying AND and OR Relationships in Filters and Rules Using Nested Groups"
l
"Filters with an AND relationship between conditions with different event types do not
return any results"
52
Adding Rules
Adding Rules
Click the
video icon to view the corresponding tutorial.
Rules correlate events that your LEM Agents and remote logging devices send to LEM, and assign
automatic actions or responses to those events. These actions differentiate filters from rules: filters
only display events, while rules instruct LEM to take action. Rule actions include, but are not limited
to:
l
Sending an email
l
Logging a user off
l
Shutting down a computer
l
Deleting an Active Directory group
l
Blocking an IP address
Use Pre-configured Rules to Get Started
The LEM appliance includes hundreds of pre-configured rules. Use these rules to instruct LEM to
respond to specific events on your network.
To clone and enable a rule for use on your network:
1. In the LEM Console, click the Build tab, and then select Rules.
2. Use the Folders list or the Refine Results pane to browse, search, or filter for specific
rules or scenarios.
3. After you find a rule you want to clone, click the gear
button next to it, and then
select Clone.
4. On the Clone Rule dialog, select a Custom Rules folder and rename the rule if you
wish, and then click OK.
5. In the Rule Creation view, customize the rule further if necessary, select Enable at the
top of the form, and then click Save.
6. Back in the main Rules view, click Activate Rules to sync your local changes with the
LEM appliance.
53
Chapter 5: Useful Tasks
Example: Change Management
Create a change management rule to notify you anytime a user makes any kind of change to your
network configurations. Examples of such network changes include:
l
Adding, changing, or deleting users in Active Directory
l
Installing software on monitored computers
l
Changing firewall policy
Create a general change management rule, similar to the filter illustrated in the previous section, to
instruct LEM to notify you anytime any user makes a configuration change, or create a more specific
rule to only fire for specific users, groups, or types of changes.
Note: An important rule of thumb is, "If you can see it in your LEM Console, you can build a rule for
it." Remember to use your filters as a starting-place as you consider creating custom rules.
To create a rule that sends you an email anytime someone adds a user to an administrative
group:
1. In the LEM Console, click the Build tab, and then select Rules.
2. Click the plus
button in the upper-right corner.
3. Enter an appropriate name for the rule, such as New Admin User.
4. Populate the rule's Correlations box with an appropriate event or event group. For this
example, use a NewGroupMember.EventInfo Equals *admin* condition to fire
anytime LEM gets a NewGroupMember event with the text, "admin" anywhere in the
EventInfo field:
a. Click Eventson the left pane.
b. At the top of the Events list, enter NewGroupMemberto search for that event,
and then select it in the list.
c. In the Fields: NewGroupMemeber list, find EventInfo, and then drag it into
the Correlations box.
54
Other Rule Scenarios
d. In the text field (denoted by a pencil icon in the Correlations box), enter *admin*
to account for all variations on the word "administrator."
5. Leave the Correlation Time box as-is so your rule fires anytime LEM captures this type
of event.
6. Add the Send Email Message action to the Actions box:
a. Click Actions on the left pane.
b. Find Send Email Message, and then drag it into the Actions box.
c. Select a template from the Email Template menu.
d. Select a LEM user from the Recipients menu.
e. Drag and drop event fields or constants from the left pane into the Send Email
Message form to complete the action.
Note: Always use event fields for the event(s) present in the Correlations box. For example,
use NewGroupMember.DetectionTime to populate the DetectionTime field in this example.
7. Select Enable at the top of the Rule Creation form, and then click Save.
8. To sync your local changes with the LEM appliance, click Activate Rules back in the
main Rules view.
After you enable and activate this rule, the LEM appliance sends an email anytime someone adds a
user to any group in Active Directory that contains the text, "admin" in its name.
For more detailed information about how to create LEM rules to take action on your network, see the
KB article, "Creating Rules from Your LEM Console to Take Automated Action."
Other Rule Scenarios
Countless scenarios may warrant a rule. Consider these combinations of rules and actions:
l
Respond to other change management events with the Send Email Message action.
l
Respond to port scanning events with the Block IP action.
55
Chapter 5: Useful Tasks
l
Respond to isolated spikes in network traffic with the Send Email Message or Disable
Networking action.
l
Respond to users playing games on monitored computers with the Send Popup
Message or Kill Process action.
l
Respond to users attaching unauthorized USB devices to monitored computers using
the Detach USB Device action.
Basically, any activity or event that can pose a threat to your network might warrant a LEM rule.
Troubleshooting
If you have created a rule, but you are not getting the expected results, verify the following to track
down the root cause:
1. Check for the requisite events on the Monitor tab. For example, if your rule is based on
the NewGroupMember event, see if you can find one in the All Events or default
Change Management filter.
2. If you do not see the requisite events, troubleshoot your devices and connectors to get
the events into LEM. Otherwise, continue troubleshooting here.
3. Check for an InternalRuleFired event in the SolarWinds Events filter.
4. If you do not see an InternalRuleFired event for your rule, check the following to
continue troubleshooting. Otherwise, skip to Step 5 to continue.
l
Is your rule enabled?
l
Did you modify the Correlation Time or Response Window in your rule?
l
Did you click Activate Rules after saving your rule?
l
Is the time on your device more than 5 minutes off from the time on your LEM
appliance?
5. If you see an InternalRuleFired event for your rule, but the rule LEM does not respond
as expected, check the following, according to the action you configured:
l
Send Email Message: Verify you have configured and started the Email Active
56
Additional Information
Response connector on the LEM appliance.
l
Send Email Message: Verify you have associated an email address for the
LEM user you selected as your email recipient.
l
Agent-based Actions: Verify you have installed the LEM Agent on the
computer you want LEM to respond to.
l
Block IP: Verify you have configured the active response connector for the
firewall you want to use to take this action. The active response connector is
separate from the data gathering connector.
For more detailed information about how to troubleshoot LEM rules and active responses, see the KB
article, "Troubleshooting LEM Rules and Email Responses."
Additional Information
For a general procedure and video addressing how to create and clone rules in the LEM Console, see
the following KB articles:
l
"Creating Rules from Your LEM Console to Take Automated Action"
For additional information about the active responses available for LEM rules, see the following KB
articles:
l
"How does the Block IP active response work?"
l
"How does the Detach USB Device active response work?"
l
"How does the Append Text To File active response work?"
l
"How do the computer-based active responses work?"
l
"How do the user-based active responses work?"
l
"How do the Kill Process active responses work?"
l
"How does the Disable Networking active response work?"
Analyzing Data
Click the
video icon to view the corresponding tutorial.
57
Chapter 5: Useful Tasks
Now that LEM is collecting your log data, use nDepth and LEM Reports to search, analyze, and
report on that data. In most cases, use the nDepth Explorer in the LEM Console to search and
analyze your data. Use the stand-alone LEM Reports application to report on your data.
Which Do I Pick?
Use nDepth if you want to perform immediate search or analysis tasks, or create specific custom
PDF reports. Use nDepth to:
l
Search your log data interactively
l
Search for specific variables, such as user names, IP addresses, or specific events
l
Perform root-cause analysis
l
Troubleshoot specific issues
l
Explore data and produce custom PDF reports
Use LEM Reports if you want to view or schedule fixed reports for regulatory and compliance
purposes. Use LEM Reports to:
l
Automate reporting
l
Produce compliance reports
l
View reports based on specific regulatory compliance initiatives
l
Provide proof that you are auditing log and event data to auditors
l
Schedule formatted reports for LEM Reports to run and export automatically
nDepth: A Fully Integrated IT Search Solution
Open nDepth in the LEM Console in any of these three ways:
1. Select an event on the Monitor tab, click the Explore menu, and then select nDepth.
2. Select a filter in the Filters pane on the Monitor tab, click the gear
button at the top
of the Filters pane, and then select Send to nDepth.
3. Click the Explore tab from anywhere in the LEM Console, and then select nDepth.
Consult nDepth for several analytical connectors that it summarizes on both its dashboard and
toolbar. Use this view to:
58
LEM Reports: For Compliance and Historical Reporting Needs
l
Search original log messages (AKA "raw logs") or normalized events
l
View search results in several charts and graphs, and add values from these visuals
directly to your search just by clicking them
l
Refine the time frame of your searches using pre-defined or custom ranges
l
View the text output of your search results using the Result Details connector on the
nDepth toolbar
l
Export your search results in CSV or fully-customizable PDF format
l
Save searches for future use
LEM Reports: For Compliance and Historical Reporting Needs
LEM Reports is a stand-alone application that you install separately from the LEM Console. Access
LEM Reports using a shortcut, if available, or by navigating to the SolarWinds Log and Event
Manager program group in your Windows Start menu.
Use LEM Reports to:
l
Run hundreds of pre-configured compliance and security reports
l
Schedule reports for LEM Reports to run automatically
l
Filter the reports list by industry or requirement
l
Run Master, Detail, or Top level reports according to how much information you need
l
Use Select Expert to filter your report data by specific values, such as computer name,
IP address, or user name
l
Export reports into several formats, including PDF, CSV, and RPT
To get started with LEM Reports, filter the reports listing by the industries or requirements relevant to
your network. Then, the next time you open LEM Reports, access your custom list of reports by
clicking Industry Reports on the main view.
To filter the reports list by industry or requirement:
1. Open LEM Reports.
2. On the Settings tab, click Manage, and then select Manage Categories.
59
Chapter 5: Useful Tasks
3. Select your industries and requirements in the left pane. Mix and match as necessary.
For example, if you are a school that accepts credit card payments, select Education,
FERPA, and PCI.
4. Click OK.
5. To view the filtered list of reports, click the Category menu back on the Settings tab,
and then select Industry Reports.
Select which reports to run based on their values in the Level column on the Settings tab:
l
Master: Reports at this level contain all of the data for their category. For example, the
master-level Authentication report contains all authentication-related data.
l
Detail: Reports at this level contain information related to a specific type of event. For
example, the Authentication – Failed Authentications detail-level report only contains
data related to "Failed Authentication" events.
l
Top: Reports at this level display the top number of occurrences for a specific type of
event. Use the default top number, or Top N, of 10, or customize this when you run the
report.
Troubleshooting
If you have installed LEM Reports, but are unable to open the application or run reports, complete the
following procedures to troubleshoot.
To troubleshoot application launch errors on computers running Windows Vista,
Windows 7, and Windows Server 2008:
1. Uninstall LEM Reports and Crystal Reports v11 Runtime.
2. Reinstall both components as Administrator.
3. Adjust the LEM Reports properties to run the program in Windows XP compatibility
mode and as an administrator:
1. Right-click the LEM Reports shortcut on your desktop or in the SolarWinds Log and
Event Manager program group in your Windows Start menu, and then select
Properties.
2. Click the Compatibility tab.
60
Additional Information – nDepth
3. Select Run this program in compatibility mode for, and then select Windows XP
(Service Pack 3).
4. Select Run this program as an administrator.
5. Click OK.
4. Launch LEM Reports.
To address "Logon failed. Database Vendor Code 210" errors:
Add the computer running LEM Reports to the list of authorized reporting computers. By default, the
LEM appliance restricts all access to LEM Reports. To allow specific computers to run LEM Reports
or remove all reporting restrictions, complete the procedures in the KB article, "Configuring Report
Restrictions."
Additional Information – nDepth
For additional information about how to use nDepth to search and analyze your data in the LEM
Console, consult the following resources.
l
Explore
For examples of how to execute nDepth searches, see the following KB articles:
l
"How to create an nDepth query for all activity by a single user"
l
"Sending Filters to nDepth for Historical Search"
For additional information about how to save nDepth searches for future use, see the KB article,
"Save nDepth searches to quickly execute frequent queries."
For additional information about how to export nDepth search results in CSV or PDF format, see the
KB article, "Export nDepth results in custom or text formats for retention and ad hoc reporting."
For additional information about configuring your LEM appliance to store and search original log data,
see the following KB articles:
l
"Configuring Your LEM Appliance for Log Message Storage and nDepth Search"
l
"Using your LEM Console to view and search original log messages"
61
Chapter 5: Useful Tasks
l
"Do not modify the Output, nDepth Host, or nDepth Port fields when configuring LEM
connectors unless your appliance is set up to store original log data"
Additional Information – LEM Reports
For additional information about how to run, schedule, and configure formatted compliance and
security reports using LEM Reports, consult the following resources.
l
"Reports" on page 1.
l
See page 478 for details.
For information about installing LEM Reports on computers without the LEM Console, see the KB
article, "Configuring LEM Reports on Computers Without the LEM Console."
For information about scheduling several best practice compliance and security reports, see the
following KB articles:
l
"Configuring Default Batch Reports on XP/2003 Computers"
l
"Configuring Default Batch Reports on Vista/7/2008 Computers"
l
"Report Formats and their corresponding numbers listed in a LEM scheduled report ini
file"
For additional information about working with individual reports in LEM Reports, see the following KB
articles:
l
"Filtering and Exporting LEM Reports"
l
"Creating a Custom Filtered Report"
62
Chapter 6: Leveraging
This chapter provides a series of use cases to get you started with SolarWinds LEM. Use these
scenarios to ensure you have the most basic coverage in your environment, though the third party
products you use or other variables in your network might be different than the ones provided in these
examples.
This chapter addresses the following use cases.
l
"Leveraging" on page 63
l
"Monitoring Firewalls for Port Scans and Malformed Packets" on page 70
l
Monitoring Antivirus Software for Viruses that are Not Cleaned
l
Monitoring Proxy Servers for Suspicious URL Access
l
"Monitoring Microsoft SQL Databases for Changes to Tables and Schema" on page 79
l
Leveraging the Incidents Report in Security Audits
Monitoring Windows Domain Controllers for Brute Force
Hacking Attempts
Monitor the Windows domain controllers to track failed logon attempts to administrative accounts,
which can be indicative of "brute force" or other hacking attempts. Also, gain visibility into account
lockout, user and group modification, and other change management events across your network.
Install a LEM Agent on all domain controllers to ensure the LEM Manager captures all of your domain
events, even if they are not replicated across all of your domain controllers. View the events in the
default Change Management filter in your LEM Console, and create custom filters to show all activity
on these critical servers.
This section contains the following procedures:
l
"Configuring the SolarWinds LEM Agent" on page 64
l
"Using Connector Profiles to Maintain and Monitor Multiple Domain Controller Agents"
on page 66
63
Chapter 6: Leveraging
l
"Creating a LEM Rule to Track Failed Login Attempts to Administrative Accounts" on
page 68
l
"Tuning Windows Logging for LEM Implementation" on page 68
Configuring the SolarWinds LEM Agent
Install a LEM Agent and configure the appropriate connectors to monitor domain events on your
network along with local events on the servers themselves. Use the procedures below to configure a
SolarWinds LEM Agent on a single Windows domain controller. For information about installing
several SolarWinds LEM Agents remotely, see the "Remote Installation" knowledge base (KB)
article.
The following table provides the installation requirements for the LEM Agent:
Software/Hardware
Operating System
Requirements
AIX, Linux, Solaris, Windows XP, Windows Vista, Windows 7, Windows 8, Windows Server 2000, Windows Server 2003, Windows
Server 2008
CPU Speed
450 MHz Pentium III or equivalent
Memory
512 MB RAM
Hard Drive Space
1 GB
Environment Variables
The ability to install all software with administrator rights
Installing a LEM Agent on a single Windows domain controller:
1. Download the SolarWinds LEM Agent installer for Windows.
a. If you are a licensed LEM customer, download the installer from the SolarWinds
customer portal.
b. If you are an evaluation LEM customer, see the "Additional Evaluation
Downloads" KB article.
2. Extract the contents of the installer ZIP file to a local or network location.
3. Run Setup.exe.
64
Configuring the SolarWinds LEM Agent
4. Click Next to start the installation wizard.
5. Accept the End User License Agreement and click Next.
6. Enter the hostname of your LEM Manager in the Manager Name field and click Next.
Do not change the default port values.
7. Confirm the Manager Communication settings and click Next.
8. Specify whether to install USB-Defender with the LEM Agent and click Next. The
installer includes USB-Defender by default. To omit this from the installation, clear the
Install USB-Defender checkbox.
Note: Install USB-Defender on every system. USB-Defender never detaches a USB
device unless you have explicitly enabled a rule to do so. By default, USB-Defender
simply generates events related to USB mass storage devices attached to your LEM
Agents
9. Confirm the settings on the Pre-Installation Summary and click Install.
10. Once the installer finishes, click Next to start the LEM Agent service.
11. Inspect the Agent Log for any errors and click Next.
12. Click Done to exit the installer.
The SolarWinds LEM Agent continues running on your computer until you uninstall or manually stop
it. It begins sending events to your SolarWinds LEM Manager immediately.
Configuring additional connectors on your SolarWinds LEM Agent:
1. Open your SolarWinds LEM Console and log into your SolarWinds LEM Manager as an
administrator.
2. Click the Manage tab, and then click Nodes.
3. Locate the LEM Agent in the list. Use the Refine Results pane on the left if necessary.
4. Click the gear
button next to the LEM Agent (left), and then click Connectors.
5. Locate the connector you want to configure in the list. Use the Refine Results pane on
the left if necessary.
6. Click the gear
button next to the connector (left), and then click New.
65
Chapter 6: Leveraging
7. Modify the connector if necessary and then click Save.
8. Click the gear
button next to the new instance of the connector , indicated by an
icon in the Status column, and then click Start.
9. Click Close to close the Connector Configuration window.
10. Configure the following additional connectors on your Windows domain controllers, as
applicable.
l
Windows Directory Service Log
l
Windows DNS Server Log
l
Windows DHCP Server version
Using Connector Profiles to Maintain and Monitor Multiple Domain
Controller Agents
Use Connector Profiles to maintain and monitor multiple domain controllers in the LEM Console.
Connector Profiles allows you to configure and modify connector settings at the profile level, and they
also provide a group by which you can filter your event traffic coming into your SolarWinds LEM
Console from your SolarWinds LEM Agents. Use the procedures below to create a Connector Profile
based on a single SolarWinds LEM Agent and a corresponding filter to monitor activity on the
computers in that profile.
Note: Microsoft changed the way Windows computers log security events with their latest operating
system releases. For that reason, SolarWinds LEM Agents on computers running Windows Server
2008, Windows Vista, or Windows 7 require different connectors than those Agents on computers
running older operating systems. If you are running both old and new versions of these Windows
operating systems in your environment, create a Connector Profile for each operating system.
Creating a Connector Profile based on a single SolarWinds LEM Agent:
1. Install the SolarWinds LEM Agent software on all of the computers you want to end up
in your new Connector Profile.
2. Configure a single SolarWinds LEM Agent to serve as the template for your Connector
Profile. For more information, see Configuring the SolarWinds LEM Agent
3. In the LEM Console, select the Build tab, and then click Groups.
66
Configuring the SolarWinds LEM Agent
4. Click the
button in the upper right, and then click Connector Profile.
5. Enter a Name and Description for the Connector Profile.
6. Select the recently configured SolarWinds LEM Agent from the Template list.
7. Click Save.
8. Locate your new Connector Profile in the Groups list. Use the Refine Results pane on
the left if necessary.
9. Click the gear
button next to your Connector Profile (left), and then click Edit.
10. Locate the SolarWinds LEM Agents you want to add to your Connector Profile in the
Available Agents pane, and click the arrow next to them to add them to the Contained
Agents pane.
11. If you are finished adding SolarWinds LEM Agents to your Connector Profile, click
Save.
Creating a filter for all activity from the computers in a Connector Profile:
1. Open the SolarWinds LEM Console and log into the SolarWinds LEM Manager as an
administrator or auditor.
2. Click Monitor.
3. Click the
button on the Filters pane (left), and then click New Filter.
4. Enter a Name and Description for the filter.
5. Click Event Groups on the components list (left).
6. Click Any Event.
7. In the Fields: Any Event list below, click and drag DetectionIP into the Conditions box
(right).
8. Click Connector Profiles on the components list (left).
9. Click and drag your Connector Profile into the Conditions box (right), replacing the Text
Constant field, which is denoted by a pencil icon.
10. Click Save.
67
Chapter 6: Leveraging
Creating a LEM Rule to Track Failed Login Attempts to
Administrative Accounts
Clone and enable the Critical Account Logon Failures rule to track failed login attempts to the default
Administrator account in Windows. The default action for this rule is to generate a HostIncident
event, which you can use in conjunction with the Incidents report to prove to auditors that you are
auditing the critical events on your network. For more information about scheduling and leveraging the
Incidents report, see Leveraging the Incidents Report in Security Audits
Cloning and enabling the Critical Account Logon Failures rule:
1. Open the SolarWinds LEM Console and log into the SolarWinds LEM Manager as an
administrator.
2. Click the Build tab, and then click Rules.
3. Enter Critical Account Logon Failures in the search box at the top of the Refine
Results pane.
4. Click the gear
button next to the rule (left), and then click Clone.
5. Select the folder where you want to save the cloned rule, and then click OK.
6. Select Enable at the top of the Rule Creation window, next to the Description field.
7. Click Save.
8. Back on the main Rules screen, click Activate Rules.
Tuning Windows Logging for LEM Implementation
After you have installed and configured you SolarWinds LEM Agents, optimize your SolarWinds LEM
deployment by tuning Windows to log the specific events you want to see in your SolarWinds LEM
Console and store on your SolarWinds LEM database. Use the recommendations below to get
started with this tuning process.
Note: Set group and local policies according to the needs of your environment. We provide
recommendations to illustrate common, but not universal, use cases. For additional information about
tuning Windows logging, see the Windows Logging section of the SolarWinds Knowledge Base, or
technet.microsoft.com.
68
Creating a LEM Rule to Track Failed Login Attempts to Administrative Accounts
Default Domain Policy
Configure logging for default domain policy in Windows as recommended in the following table.
Policy
Success Failure Not Defined
Audit account logon events
Yes
Yes
Audit account management
Yes
Yes
Audit directory service
Not defined
access
Audit logon events
Yes
Yes
Audit object access
Audit policy change
Not defined
Yes
Yes
Audit privilege use
Not defined
Audit process tracking
Yes
No
Audit system events
Yes
Yes
Default Domain Controller Policy
Configure logging for your default domain controller policy in Windows as recommended in the
following table.
Policy
Success Failure
Audit account logon events
Yes
Yes
Audit account management
Yes
Yes
Audit directory service
Yes
Yes
Yes
Yes
access
Audit logon events
Audit object access1
Yes
69
Chapter 6: Leveraging
Policy
Success Failure
Audit policy change
Yes
Audit privilege use
Yes
Yes
Audit process tracking
Yes
Yes
Audit system events
Yes
Yes
1Audit object access
is required for file auditing. For more information, see the How to enable file
auditing in Windows KB article
For more information about the policies discussed above and how to configure their auditing, see the
Audit Policy and Best Practice KB article
Monitoring Firewalls for Port Scans and Malformed
Packets
Monitor firewalls to detect port scans and other network attacks based on unusual traffic patterns and
malformed packets. Also, gain visibility into web traffic and other network traffic events across your
network. Configure your firewalls to log to your SolarWinds LEM appliance and set up the appropriate
connector on your SolarWinds LEM Manager. View the events in the default Firewall filter in your
SolarWinds LEM Console, and create custom filters to show traffic to or from specific computers.
This section contains the following procedures.
l
"Setting a Firewall to Log to a LEM Appliance" on page 70
l
"Configuring a Firewall Connector on a LEM Manager" on page 71
l
"Viewing Network Traffic from Specific Computers" on page 72
l
"Creating a LEM Rule to Notify of Potential Port Scanning Traffic" on page 73
Setting a Firewall to Log to a LEM Appliance
Set your firewall to log to your SolarWinds LEM appliance to centralize its log data with the rest of
your SolarWinds LEM events. The process for doing this is different for each vendor, and it even
differs across firewall versions. For that reason, we document each firewall separately, which is
beyond the scope of this guide.
70
Configuring a Firewall Connector on a LEM Manager
Firewalls from popular vendors such as Cisco, Check Point, and Juniper can be integrated with
SolarWinds LEM appliances. For more information, see the following KB articles.
l
"Configuring a Cisco PIX or ASA Firewall to Log to Your LEM Appliance"
l
"Integrating Check Point with SolarWinds LEM "
l
"Integrating Juniper Firewalls with SolarWinds LEM "
If your firewall vendor is not listed here, search for your vendor in the SolarWinds LEM Knowledge
Base. If documentation is not available, please contact Support.
Configuring a Firewall Connector on a LEM Manager
After you have set your firewall to log to your SolarWinds LEM appliance, configure the corresponding
connector on your SolarWinds LEM Manager. Many of the firewall connectors are similar, though
some will have a few unique settings. The procedure below illustrates how to set up a connector for a
Cisco PIX firewall, and you can find instructions for additional firewall connectors in the SolarWinds
LEM Knowledge Base.
To configure the Cisco PIX and IOS connector on your SolarWinds LEM Manager:
1. Open the SolarWinds LEM Console and log into the SolarWinds LEM Manager as an
administrator.
2. Click the Manage tab, and then click Appliances.
3. Click the gear
button next to the SolarWinds LEM Manager (left), and then click
Connectors.
4. In the Connector Configuration window, enter Cisco PIX in the search box at the top of
the Refine Results pane.
5. Click the gear
button next to the Cisco PIX and IOS connector, and then click
New.
6. Replace the Alias value with a more descriptive connector alias. For example, PIX
Firewall.
71
Chapter 6: Leveraging
7. Use firewall somewhere in the Alias field to ensure the default Firewall filter captures
your firewall data.
8. Verify the Log File value matches the local facility defined in your firewall settings.
9. Click Save.
10. Click the gear
button next to the new instance of the connector, indicated by an
icon in the Status column, and then click Start.
11. Click Close to close the Connector Configuration window.
Viewing Network Traffic from Specific Computers
Create custom filters to make specific firewall events more visible than others. For example, if you
want to monitor all traffic coming from a specific computer more closely than other firewall traffic,
create a filter for all network traffic coming from that source machine. Use Connector Profiles and
other groups to broaden or refine the scope of custom filters like this.
Creating a filter for all traffic from a specific computer:
1. Open the SolarWinds LEM Console and log into the SolarWinds LEM Manager as an
administrator or auditor.
2. Click Monitor.
3. Click the
button on the Filters pane (left), and then click New Filter.
4. Enter a Name and Description for the filter.
5. Click Event Groups on the components list (left).
6. Click Network Audit Events.
7. In the Fields: Network Audit Events list below, click and drag SourceMachine into the
Conditions box (right).
8. Enter the computer's name into the Text Constant field, which is denoted by a pencil
icon. Use a wildcard character (*) after the computer name to avoid having to enter the
computer's fully qualified domain name.
72
Creating a LEM Rule to Notify of Potential Port Scanning Traffic
Note: Use a Connector instead of a Text Constant to filter for all network traffic coming
from a group of similar computers.
9. Click Save.
Creating a LEM Rule to Notify of Potential Port Scanning Traffic
Clone and enable the PortScans rule to recognize suspicious firewall traffic that can be indicative of
port scanning. The default action for this rule is to generate a TCPPortScan event, which the
SolarWinds LEM Console displays in the default Security Events filter. Use these events to monitor
suspicious network traffic and potentially take action against an external source.
Cloning and enabling the PortScans rule:
1. Open the SolarWinds LEM Console and log into the SolarWinds LEM Manager as an
administrator.
2. Click the Build tab, and then click Rules.
3. Enter PortScans (one word) in the search box at the top of the Refine Results pane.
4. Click the gear
button next to the rule (left), and then click Clone.
5. Select the folder where you want to save the cloned rule, and then click OK.
6. Select Enable at the top of the Rule Creation window, next to the Description field.
7. Optionally, to tune the rule to be more appropriate for your environment, consider the
following:
l
Subscribe to the rule to track its activity in the Subscriptions report.
l
Increase the number of events in the Correlation Time box to modify how frequently the
rule fires.
l
Omit vulnerability scanners from the Correlations by changing the TCPTrafficAudit
"exists" condition to TCPTrafficAudit .SourceMachine = Your Scanners, where Your
Scanners is a User-Defined Group, Connector Profile, or Directory Service Group that
represents that group of computers.
73
Chapter 6: Leveraging
l
Modify the default action or add additional actions to do things such as send an email
message, or block an IP address.
Note: For more information about working with SolarWinds LEM rules, see the Rules section of the
SolarWinds Knowledge Base.
9. If you are finished configuring your rule, click Save.
10. Back on the main Rules screen, click Activate Rules.
Monitoring Antivirus Software for Viruses that are Not
Cleaned
Monitor your antivirus software to track whether or not your antivirus solution is able to fully clean the
viruses it detects. Configure your antivirus software to log to your SolarWinds LEM appliance and set
up the appropriate connector on your SolarWinds LEM Manager. View the events in the default Virus
Attack filter in your SolarWinds LEM Console.
This section contains the following procedures.
l
"Setting Antivirus Software to Log to a LEM Appliance" on page 74
l
"Configuring the Antivirus Connector on a LEM Manager" on page 75
l
"Creating a LEM Rule to Track When Viruses Are Not Cleaned" on page 76
Setting Antivirus Software to Log to a LEM Appliance
Set your antivirus software to log to your SolarWinds LEM appliance to centralize its log data with the
rest of your SolarWinds LEM events. The process for doing this is different for each vendor, and it
even differs across antivirus versions. For that reason, we document each antivirus solution
separately, which is beyond the scope of this guide.
You can integrate antivirus software from popular vendors such as Symantec, and McAfee with your
SolarWinds LEM appliance. For more information, see the following KB articles.
l
Configuring Symantec Endpoint Protection 11
l
Configuring McAfee EPO
If your antivirus vendor is not listed here, search for your vendor in the SolarWinds LEM Knowledge
Base. If documentation is not available, please contact Support.
74
Configuring the Antivirus Connector on a LEM Manager
Configuring the Antivirus Connector on a LEM Manager
After you have set your antivirus to log to your SolarWinds LEM appliance, configure the
corresponding connector on your SolarWinds LEM Manager. Many of the antivirus connectors are
similar, though some will have a few unique settings. The procedure below illustrates how to set up a
connector for Symantec Endpoint Protection, and you can find instructions for additional firewall
connectors in the SolarWinds LEM Knowledge Base.
Configuring the Symantec Endpoint Protection 11 connector on your SolarWinds LEM
Manager:
1. Replace the Alias value with a custom alias or accept the default.
2. Verify the Log File value matches the Log Facility defined in your antivirus settings.
3. Open the SolarWinds LEM Console and log into the SolarWinds LEM Manager as an
administrator.
4. Select the Manage tab, and then click Appliances.
5. Click the gear
button next to your SolarWinds LEM Manager (left), and then click
Connectors.
6. In the Connector Configuration window, enter Symantec Endpoint Protection in the
search box at the top of the Refine Results pane.
7. Click the gear
button next to the Symantec Endpoint Protection 11 connector,
and then click New.
Note: For Symantec Endpoint Protection (SEP), the Log Facility is equal to the local facility on your
SolarWinds LEM appliance plus 16. So, the default Log File value of /var/log/local6.log on your
SolarWinds LEM appliance actually corresponds to Log Facility 22 in your SEP11 settings.
8. Click Save.
9. Click the gear
button next to the new instance of the connector , indicated by an
icon in the Status column, and then click Start.
10. Click Close to close the Connector Configuration window.
75
Chapter 6: Leveraging
Creating a LEM Rule to Track When Viruses Are Not Cleaned
Clone and enable the Virus Attack – Bad State rule to track the state of virus attacks reported by your
antivirus software. The Bad Virus State User-Defined Group defines a bad state as any virus that has
not been fully cleaned by your antivirus software. That is, any virus that has been left alone,
quarantined, or renamed.
The default action for this rule is to generate a HostIncident event, which you can use in conjunction
with the Incidents report to prove to auditors that you are auditing the critical events on your network.
For more information about scheduling and leveraging the Incidents report, see Leveraging the
Incidents Report in Security Audits
Cloning and enabling the Virus Attack – Bad State rule:
1. Open the SolarWinds LEM Console and log into the SolarWinds LEM Manager as an
administrator.
2. Select the Build tab, and then click Rules.
3. Enter Virus Attack – Bad State in the search box at the top of the Refine Results
pane.
4. Click the gear
button next to the rule (left), and then click Clone.
5. Select the folder where you want to save the cloned rule, and then click OK.
6. Select Enable at the top of the Rule Creation window, next to the Description field.
7. Click Save.
8. Back on the main Rules screen, click Activate Rules.
Monitoring Proxy Servers for Suspicious URL Access
Monitor proxy servers to track when users attempt to access suspicious websites by partial or
complete URL addresses. Configure your proxy server to log to your SolarWinds LEM appliance and
set up the appropriate connector on your SolarWinds LEM Manager.
This section contains the following procedures:
76
Setting Proxy Server to Log to a SolarWinds LEM Appliance
l
""Setting Proxy Server to Log to a SolarWinds LEM Appliance" on page 77
l
"Configuring a Proxy Server Connector on a SolarWinds LEM Manager" on page 77
l
"Creating a SolarWinds LEM Rule to Notify of Suspicious URL Attempts" on page 78
Setting Proxy Server to Log to a SolarWinds LEM Appliance
Set your proxy server to log to your SolarWinds LEM appliance to centralize its log data with the rest
of your SolarWinds LEM events. The process for doing this is different for each vendor, so we
document each proxy server separately, which is beyond the scope of this guide.
You can integrate proxy servers from popular vendors such as Websense, and Barracuda with your
SolarWinds LEM appliance. For more information, see the following KB articles.
l
"Integrating Websense with SolarWinds LEM"
l
"Integrating Barracuda with SolarWinds LEM "
If your firewall vendor is not listed here, search for your vendor in the SolarWinds LEM Knowledge
Base. If documentation is not available, please contact Support.
Configuring a Proxy Server Connector on a SolarWinds LEM
Manager
After you have set your proxy server to log to your SolarWinds LEM appliance, configure the
corresponding connector on your SolarWinds LEM Manager. Many of the proxy server connectors are
similar, though some have a few unique settings. The procedure below illustrates how to set up a
connector for a Websense proxy server, and you can find instructions for additional firewall
connectors in the SolarWinds LEM Knowledge Base.
Configuring the Websense Web Filter and Websense Web Security connector:
1. Open the SolarWinds LEM Console and log into the SolarWinds LEM Manager as an
administrator.
2. Select the Manage tab, and then click Appliances.
3. Click the gear
button next to your SolarWinds LEM Manager (left), and then click
Connectors.
77
Chapter 6: Leveraging
4. In the Connector Configuration window, enter Websense Web Filter in the search box
at the top of the Refine Results pane.
5. Click the gear
button next to the Websense Web Filter and Websense Web
Security connector , and then click New.
6. Replace the Alias value with a custom alias or accept the default.
7. Click Save.
8. Click the gear
button next to the new instance of the connector, indicated by an
icon in the Status column, and then click Start.
9. Click Close to close the Connector Configuration window.
Creating a SolarWinds LEM Rule to Notify of Suspicious URL
Attempts
Clone and enable the Known Spyware Site Traffic rule to track when users attempt to access
suspicious websites by partial or complete URL addresses. The default action for this rule is to
generate a HostIncident event, which you can use in conjunction with the Incidents report to prove to
auditors that you are auditing the critical events on your network. For more information about
scheduling and leveraging the Incidents report, seeLeveraging the Incidents Report in Security Audits
Note: Before enabling this rule, ensure your proxy server transmits complete URL addresses to your
SolarWinds LEM Manager by checking the URL field of any WebTrafficAudit event generated by your
proxy server. If your proxy server does not log web traffic events with this level of detail, check the
events coming from your firewalls, as they can sometimes be used for this rule as well.
Cloning and enabling the Known Spyware Site Traffic rule:
1. Open theSolarWinds LEM Console and log into the SolarWinds LEM Manager as an
administrator.
2. Select the Build tab, and then click Rules.
3. Click Default Rules on the Refine Results pane (left).
4. Enter Known Spyware Site Traffic in the search box at the top of the Refine Results
pane.
78
Monitoring Microsoft SQL Databases for Changes to Tables and Schema
5. Click the gear
button next to the rule (left), and then click Clone.
6. Select the folder where you want to save the cloned rule, and then click OK.
7. Select Enable at the top of the Rule Creation window, next to the Description field.
8. Click Save.
9. Back on the main Rules screen, click Activate Rules.
Monitoring Microsoft SQL Databases for Changes to
Tables and Schema
Monitor databases to track successful or failed attempts to make changes to their tables or schema.
Install MSSQL Auditor on a LEM Agent running Microsoft SQL Profiler to monitor local or remote
Microsoft SQL databases. MSSQL Auditor runs as a service in addition to the LEM Agent service.
l
"Configuring Database Servers" on page 79
l
"Configuring the MSSQL Auditor Connector on a SolarWinds LEM Agent" on page 81
l
"Creating a SolarWinds LEM Rule to Send Notifications of Microsoft SQL Database
Change Attempts" on page 81
Configuring Database Servers
Install and configure MSSQL Auditor on your database server to allow SolarWinds LEM Agent
access to details about database configuration changes on that computer.
Install the following components on your database server prior to installing MSSQL Auditor.
l
Microsoft SQL 2005 or 2008 Profiler
l
Microsoft .NET 2.0 Framework
l
SolarWinds LEM Agent for Windows
Installing MSSQL Auditor on a SolarWinds LEM Agent
1. Download SolarWinds-LEM-v6.1-MSSQLAuditor.zip from the SolarWinds customer
79
Chapter 6: Leveraging
portal under Additional Components.
2. Run mssqlaudsetup.exe.
3. Click Next to start the wizard.
4. Accept the End User License Agreement, and then click Next.
5. Click Change to specify an installation folder, or accept the default, and then click
Next.
6. Click Install.
7. When the installation is finished, select Launch SolarWinds MSSQL Auditor, and
then click Finish.
To configure MSSQL Auditor for use with your servers:
Note: If you did not select Launch SolarWinds MSSQL Auditor after installing the application, you
can launch it from the SolarWinds Log and Event Manager program group in your Start menu.
1. Enter the name of the SQL server to be monitored in the SQL Server\Instance field,
and click Add Server.
Note: To specify an instance other than the default, enter your server name in the following
format: Server\Instance.
2. Repeat this step for all of the servers to be monitored.
3. To use an account other than the Local System Account to run MSSQL Auditor on your
database server, select This Account in the Run Service As section, and provide
the appropriate credentials.
Note: We recommend you use an account in the "sysadmin" role on your database, though the
account only needs to have Execute permissions for any stored procedures with the xp_trace prefix.
4. Click Start Auditor Service, which is denoted by a green "Play" icon, in the Manage
Auditor Service section.
5. Click OK.
80
Monitoring Microsoft SQL Databases for Changes to Tables and Schema
Configuring the MSSQL Auditor Connector on a SolarWinds LEM
Agent
To configure the MSSQL Auditor connector on your SolarWinds LEM Agent:
1. Open the SolarWinds LEM Console and log into theSolarWinds LEM Manager as an
administrator.
2. Select the Manage tab, and then click Nodes.
3. Locate the SolarWinds LEM Agent for your database server and verify it is connected
to your LEM Manager.
4. Click the gear
button next to the SolarWinds LEM Agent, and then
click Connectors.
5. Enter MSSQL in the search box at the top of the Refine Results pane.
6. Click the gear
button next to the SolarWinds Log and Event Manager MSSQL
Auditor connector , and then click New.
7. Give the new connector a custom Alias, or accept the default.
8. Verify that the value in the Log File field matches the folder in which the logs are stored
on your database server, and then click Save.
9. Click the gear
button next to the new instance of the connector , indicated by an
icon in the Status column, and then click Start.
10. Repeat these steps for the MSSQL 2000 Application Log connector .
11. Click Close to close the Connector Configuration window.
Creating a SolarWinds LEM Rule to Send Notifications of Microsoft
SQL Database Change Attempts
Clone and enable the MSSQL Database Change Attempt rule to track when users attempt to change
properties on a monitored Microsoft SQL database. The default action for this rule is to generate a
HostIncident event, which you can use in conjunction with the Incidents report to prove to auditors
that you are auditing the critical events on your network. For more information about scheduling and
leveraging the Incidents report, see "Leveraging the Incidents Report in Security Audits
81
Chapter 6: Leveraging
Clone and enable the MSSQL Database Change Attempt rule to track when users attempt to change
properties on a monitored Microsoft SQL database. The default action for this rule is to generate a
HostIncident event, which you can use in conjunction with the Incidents report to prove to auditors
that you are auditing the critical events on your network. For more information about scheduling and
leveraging the Incidents report, see "Leveraging the Incidents Report in Security Audits
Cloning and enabling the MSSQL Database Change Attempt rule:
1. Open the SolarWinds LEM Console and log into the SolarWinds LEM Manager as an
administrator.
2. Select the Build tab, and then click Rules.
3. Enter MSSQL Database Change Attempt in the search box at the top of the Refine
Results pane.
4. Click the gear
button next to the rule (left), and then click Clone.
5. Select the folder where you want to save the cloned rule, and then click OK.
6. Select Enable at the top of the Rule Creation window, next to the Description field.
7. Click Save.
8. Back on the main Rules screen, click Activate Rules.
Leveraging the Incidents Report in Security Audits
Auditors typically require that IT administrators review the critical events on their networks on a daily
basis. Create a method for reviewing these events by utilizing Incident events as discussed in the
previous sections in this chapter. After you have defined your critical network events as Incidents,
schedule the Incidents report to run daily and follow the procedure suggested below to maintain a
paper trail to use during your security audits.
We recommend scheduling 4 reports to run on a daily basis, one of which is the Incidents report. For
more information on scheduling these daily reports, see the following KB articles.
l
"Configuring Default Batch Reports on XP/2003 Computers"
l
"Configuring Default Batch Reports on Vista/7/2008 Computers"
82
Leveraging the Incidents Report in Security Audits
Maintaining a paper trail for your security audits using the daily Incidents report:
1. Open the Incidents report every day for the previous day.
2. Print the report and review its contents.
3. Document any action you took as a result of the report on the printed report and sign it.
4. File the printed and signed report in a safe location for your next security audit.
83
Chapter 7: Ops Center
The Ops Center is a dashboard used for viewing and managing informational widgets. Each widget
represents a high-level graphical view of specific network activity. Widgets are designed to present
important high-level information in easy-to-read graphical formats, such as charts and graphs.
Widgets are filter-driven — that is, a filter is the data source for the graphical representation found in
the widget. In fact, widgets appear in Monitor, as well, so you can see graphical views of your filters
along with their grid-based views.
You can select from a library of commonly used widgets, or you can create your own widgets. You
can add or remove widgets, edit existing widgets, or resize, refresh, and rearrange widgets to meet
your personal preferences.
Click to select the widget you want to work with. You can point to the widget to display ToolTips and
details about its graph. You can also use the control options on its toolbar to change the widget’s
settings display format.
You can resize widgets, but they are limited to certain sizes and aspect ratios to keep the Ops
Center tidy and organized.
The following table describes the key features of the Ops Center view.
Widgets
Each widget represents a high-level graphical view of specific network activity. Widgets are designed
to present important high-level information at a glance. Most widgets are filter-driven—that is, a filter
is the data source for what you are graphing in the widget.
84
Chapter 7: Ops Center
Name
Widget Manager
Description
Click this button to alternately open and close the Widget
Manager. The Widget Manager includes two panes—the
Categories pane and the Widgets pane.
Getting Started
Tips and shortcuts to get you started configuring and exploring
LEM
Node Health
A view of the status of each device being monitored by LEM.
thwack Community & Support
Access to useful information from the thwack community.
Top 10 Events
Displays the top 10 events in the selected time range.
Help
Links to different resources to help you learn more about LEM
What's New in LEM
A list of items that have been added or improved in this version.
Events per Minute
Displays the total count of events per minute for the past 15
minutes.
85
User Details Page
Name
Description
Custom Widget
Example of what can be created on a custom widget.
Top 10 Nodes by # of Events
Displays the top 10 most active nodes(by # of events).
Top 10 Users by # of Events
Displays the top 10 users with the most events in the selected
time range.
Network Events by Source
Displays the top 10 machines generating network events.
Machine
User Logons by Source
Displays the top 5 user logons by source machine.
Machine
Data Simulator
Plays back different kinds of simulated network data.
Top 10 Rules by Number of
Displays the top 10 most commonly triggered rules and how
Rules Fired
many times each has been triggered over a selected time
period.
User Details Page
From the Top 10 Users widget, click on a user to open the User Details page. Every user has a User
Details page that displays all related information, including all events, for that user.
The User Details page contains the User:Details and User:All Events widgets.
86
Chapter 7: Ops Center
User: Details Widget
Displays detailed user information such as User Name, Manager, User Type, etc.
User: All Events Widget
Lists all events generated by the selected user and displays statistics of the events in a graph. Click
an event to see the Event Details page for the selected event.
The User:All Events menus provide several presentation options:
l
Filter events by event group
l
Switch between Grid and Details views
l
Select by time
Color-coding allows you to easily pick out events that might need attention. A green line on a graph
represents informational events, a yellow line represents warning events, and a red line represents
critical events.
Node Details Page
From the Top 10 Nodes, click a node to open the Nodes Details page. The Nodes Details page
displays overview information on every device that is monitored by LEM.
87
Node: Details Widget
The Nodes Details page contains the Node:Details, Node:Connectors Applied, and Nodes:All
Events widgets.
Node: Details Widget
Represents the detailed information about the specified node such as Node IP, Node Name, Last
Event etc.
Node:Connectors Applied Widget
l
Provides a list of connectors which are configured for the specified node
l
Shows whether the connector is enabled or not
l
Allows you to turn on or turn off connectors
l
Allows you to configure new connectors
Node: All Events Widget
Lists all events generated by the selected node and displays statistics of the events in a graph. Click
an event to see the Event Details page for the selected event.
The Node:All Events menus provide several presentation options:
88
Chapter 7: Ops Center
l
Filter events by event group
l
Switch between Grid and Details views
l
Select by time
Color-coding allows you to easily pick out events that might need attention. A green line on a graph
represents informational events, a yellow line represents warning events, and a red line represents
critical events.
Ops Center Widget Manager
In the Ops Center, master widgets reside in the Widget Manager’s Categories list. Dashboard
widgets reside on the dashboard. Dashboard widgets cannot be saved in the Widget Manager.
Name
Description
Filters
Widgets are organized by filter. You can use the Filters pane to view, add, and edit
pane
the master widgets that are associated with each filter, and to create dashboard
widgets from each master widget.
The Name column lists each filter that has one or more master widgets. The Count
column states how many master widgets are associated with each filter. You can
also sort the columns of the Filters pane.
Opens the Widget Builder, so you can add a new master widget to the selected
category.
Opens the Widget Builder for the widget that is currently selected in the Widgets
pane. The Widget Builder lets you edit the widget’s settings.
89
Using the Widget Builder
Name
Description
Widgets
The Widgets pane is used to view the master widgets that are associated with each
pane
filter. You can also use this pane to create dashboard widgets and to delete master
widgets from the selected filter.
Add to
This button adds a copy of the master widget that is currently shown in the Widgets
Dashboard pane to the dashboard.
Delete
This button deletes the master widget that is currently shown in the Widgets pane.
Widget
Deleting a master widget does not delete any of the dashboard widgets that came
from that widget.
Using the Widget Builder
This topic explains how to use the Widget Builder, which is used to add a new widget or edit the
configuration of an existing widget.
The following table explains each field on the Widget Builder.
Field
Description
Name
Type a name for the widget. This name will appear in the widget’s title bar.
Filter
Select the filter that is to be the widget's data source. If a filter name appears in
italics, it means the filter is currently turned off.
When creating a widget from the Monitor view, this field defaults to the filter that is
currently active. If you select a different filter, the widget will be associated with
that filter, not the active filter.
When creating a widget from the Ops Center, this field defaults to the first option in
the list.
Note: If you create a widget from a filter that is turned off, the widget will not display
any chart information until the filter is turned back on.
Description
Type a brief description of the information this widget is reporting. You may use up
to 80 characters.
90
Chapter 7: Ops Center
Field
Description
Visual Configuration
Visualization Select the type of chart or graph you want—Pie, Bar, Line, Table, etc. Select
Type
Table for those times when a table of values is a useful way to view the data. You
can display a widget with any of these display types at any time. However, some
display types may not make sense for some widgets, depending on the widget’s
content.
Color/
Select a color palette for the chart or graph.
Color Palette
X-Axis Label If desired, type a label for the chart or graph’s horizontal axis.
Y-Axis Label If desired, type a label for the chart or graph’s vertical axis.
Preview
The Preview section shows what the widget will look like, based on the options you
have selected in the Visual Configuration section.
Data Configuration
Field
Select a data field you want reported from those that are available in the selected
data source.
Show
Select how you want the frequency reported:
n
Count: (default) This option counts each occurrence of the selected Field value.
For example, if the Field you select is EventID, you are counting the number of
events. As a practical matter, no matter which field you select, you are counting
events. But it is best to think of the widget as counting occurrences of the field.
n
Distinct Count: This option does not count repeating Field values. Instead, it
counts each time a distinctly different event occurs. For example, if you select a
Field value like Event Name or Detection IP, the widget will count each
specific value only once.
When used in a single-dimension chart, the Distinct Count option reports all
values as 1, so this option is best used with multi-dimensional charts.
91
Using the Widget Builder
Field
Sort
Description
Select how you want the data Show data sorted:
n
Descending (default) order is from highest to lowest (Z to A, or 0 to 1, etc.).
n
Ascending order is from lowest to highest (A to Z, or 1 to 0, etc.).
Sorting only applies when your Versus value is something other than Time.
Versus
If you want a second dimension in the chart, select another data field from those
that are available in the selected data source.
This field’s sort order is ascending.
Split By
If you want a third dimension in the chart, select another data field from those that
are available in the selected data source.
This field’s sort order is ascending.
Limit
Most filters contain a data span that exceeds what is practical to chart. The Limit
value limits the number of items that will be seen.
Select a limit for the number of items that are to be charted. The default value is 5.
For example, this can represent your Top 5 or Bottom 5, depending on how you sort
the data.
Scope
Select a value for the scope. This is the time frame reported by the chart or graph.
The scope is always measured backward from the moment the chart is refreshed.
For example, a scope of 30 minutes means “the last 30 minutes.”
The scope can be measured in Seconds, Minutes (default), Hours, or Days. For
events that happen frequently, choose a narrow scope. For events that happen
rarely, choose a large scope.
Resolution
Select the time value that defines the “tick marks” that are to be used on the chart’s
horizontal X-axis. This field is required when Versus is a Time Field.
For example, if you are looking at 30 minutes of data, a Resolution of 5 Minutes
means the bars or line chart data points are drawn in 5 minute increments. In charts
with wider scope, the resolution could be hours or even days.
This option is disabled for widgets that are not reporting time-based data.
92
Chapter 7: Ops Center
Field
Refresh
Description
Select the rate at which you want the widget to refresh its visual display. This is
necessary because the Console is monitoring real-time data. Therefore, you need
to periodically refresh the chart.
Save and cancel
Save to
Select this option to save the new or updated widget to the bottom of the Ops
Dashboard
Center dashboard.
Save
Click Save to save the new or revised master widget.
Upon saving, the new widget configuration immediately appears in the Op
CenterWidget Manager and in the Monitor view's Widget pane.
Cancel
Click Cancel to cancel your changes close the Widget Builder.
Widgets act as shortcuts to the event filters that are their data sources. This means you can open the
source filter directly from a widget. You do this by clicking the specific line, bar, or pie wedge of chart
that interests you. The corresponding filter then opens in the Monitor view. The filter lists only the
events that correspond with the chart item selected.
To open a filter from a dashboard widget:
1. Open the Ops Center view.
2. In the dashboard, locate the widget you want to work with.
3. On the widget, click the specific line, bar, or pie wedge that interests you.
93
Using the Widget Builder
4. The Monitor view appears, with the event grid showing the filter that is the widget’s
data source. Note that the event grid lists only those events that correspond to the line,
bar, or pie wedge that you clicked. Also note that the filter is paused. Click Resume on
the event grid toolbar to begin running the filter again.
Note: It is possible for you to select an item in the widget that is no longer shown in the Monitor's
event grid. That is, the filter may actually show fewer events than appear in the widget. This can
happen if the widget's scope is broader than the filter's scope. In this case, the filter may no longer
have some of the data shown by the widget, because the filter has had to make room for new data.
Remember, the widget's scope can be different than the filter's scope. The widget tracks statistics
about events that occurred over time (and perhaps a very large time frame). The filter tracks only a
certain quantity of events for a time frame that may be much smaller than the widget's scope.
To think about it another way: the Console filters are aware of 10,000 events at a time. With every
refresh interval, a widget looks at those 10,000 events to draw a line, bar, or wedge that matches the
right count for that time. Those 10,000 events are also displayed in the corresponding filter. But when
the Console gets to 10,000 events, the widget doesn't "erase" any data points it has already drawn,
but the filter has to remove the oldest events from the grid to make room for new data.
The following table describes the function of each button on a widget toolbar. All of these buttons are
on the widget toolbar, except for the “legend” button, which appears in the lower-left corner of the
widget.
94
Chapter 7: Ops Center
Button
Function
Opens the widget in the Widget Builder, so you can edit its settings.
“Flips” the widget, so you can configure its presentation format.
Refreshes the widget’s data.
Expands (maximizes) the widget to fill the desktop.
Restores the widget from its maximized size to its default size.
This button has two functions:
n
In normal dashboard mode, this button deletes the widget from the dashboard.
n
When you are editing a “flipped” widget, this button closes the widget’s edit mode, and
returns it to its normal desktop view.
Opens the widget’s legend.
Viewing Specific Widget Data
Widget graphs and charts display basic high-level information. However, each widget includes
ToolTips that show specific data about each bar, line, or wedge in the chart. Typically, this
information is the reported event, Event Group, or event field, and its number of occurrences.
To view specific chart data:
Point to the specific bar, line, or wedge you want to know about and a ToolTip appears, showing
specific data about the item you are pointing to.
95
Refreshing a Widget’s Data
Refreshing a Widget’s Data
On the widget toolbar, click the refresh
button to show the latest data from your network.Widgets
automatically refresh themselves according to the Refresh rate that was set when the widget was
created. If a widget has a slow refresh rate, you can refresh it whenever you want. Refreshing a
widget immediately updates it to show the most current real-time data from your network traffic.
Opening a Filter From a Widget
Widgets act as shortcuts to the event filters that are their data sources. This means you can open the
source filter directly from a widget. You do this by clicking the specific line, bar, or pie wedge of chart
that interests you. The corresponding filter then opens in the Monitor view. The filter lists only the
events that correspond with the chart item you selected.
To open a filter from a dashboard widget:
1. Open the Ops Center view.
2. In the dashboard, locate the widget you want to work with.
3. On the widget, click the specific line, bar, or pie wedge that interests you.
4. The Monitor view appears, with the event grid showing the filter that is the widget’s
data source. Note that the event grid lists only those events that correspond to the line,
bar, or pie wedge that you clicked. Also note that the filter is paused. Click Resume on
96
Chapter 7: Ops Center
the event grid toolbar to begin running the filter again.
Note: It is possible for you to select an item in the widget that is no longer shown in the Monitor's
event grid. That is, the filter may actually show fewer events than appear in the widget. This can
happen if the widget's scope is broader than the filter's scope. In this case, the filter may no longer
have some of the data shown by the widget, because the filter has had to make room for new data.
Remember, the widget's scope can be different than the filter's scope. The widget tracks statistics
about events that occurred over time (and perhaps a very large time frame). The filter tracks only a
certain quantity of events for a time frame that may be much smaller than the widget's scope.
To think about it another way: the Console filters are aware of 10,000 events at a time. With every
refresh interval, a widget looks at those 10,000 events to draw a line, bar, or wedge that matches the
right count for that time. Those 10,000 events are also displayed in the corresponding filter. But when
the Console gets to 10,000 events, the widget doesn't "erase" any data points it has already drawn,
but the filter has to remove the oldest events from the grid to make room for new data.
97
Editing a Widget’s Chart Presentation
Editing a Widget’s Chart Presentation
On the back of each widget there is a form that lets you change how the data is presented on the
widget. However, your options are limited to the type of widget you are working with and the type of
data it is reporting. For example, widgets that only report data in one dimension may be limited to a pie
chart, while information in two dimensions can be reported in a bar chart or a line chart.
To edit a widget’s presentation from the dashboard:
1. In the Ops Center dashboard, locate the widget you want to work with.
2. Click the configure
button on the widget toolbar.
3. The widget flips over to display its configuration options, as shown here.
4. Configure the widget, according to its configuration options. These options are a subset of the fields on the Widget Builder.
To arrange widgets on the dashboard:
1. Open the Ops Center view.
2. If needed, click Widget Manager to close the Categories and Widgets panes. This
provides the most space for arranging your widgets.
3. In the dashboard, drag a widget’s title bar to move that widget into a new position on the
dashboard. As you move the widget around the dashboard, the other widgets rearrange
98
Chapter 7: Ops Center
themselves and make room for your widget. Upon releasing the mouse button, the
widget snaps into place.
Resizing a Widget
You can view widgets in “full-screen” mode or in their normal size. You can also change the size of a
widget to make it taller or wider. However, the widget’s different sizes must conform to the
dashboard’s standard geometry.
To resize a widget:
In the Ops Center dashboard, drag the lower-right corner of the widget in any direction. As you resize
the widget, the surrounding widgets rearrange themselves to make room for the larger one. Upon
releasing the mouse button, the widget snaps to the closest size allowed by the desktop’s geometry.
To show a widget in full-screen mode:
In the Ops Center dashboard, click the Maximize
button on the widget’s toolbar. The widget
takes up the entire dashboard.
To restore a widget to its normal size:
In the Ops Center dashboard, click the Minimize
button on the widget’s toolbar. The widget
returns to its normal size.
Viewing a Widget’s Legend
Each widget bar chart, graph, and pie chart has a legend that explains what each bar, line, or wedge in
the chart represents.
To view a widget’s legend:
Click the widget’s legend
button. The chart legend appears, as shown here.
99
Widget Storage
Widget Storage
Widgets appear in two areas—the Ops Center and in the Monitor view’s Widgets pane:
l
In the Ops Center, master widgets always reside in the Widget Manager’s
Categories list. Dashboard widgets always reside on the dashboard. Dashboard
widgets cannot be saved in the Widget Manager.
l
In the Monitor view, each master widget appears in the Widgets pane for the filter that
acts as its data source. Dashboard widgets do not appear in the Monitor view’s
Widgets pane.
100
Chapter 8: Monitor
The Monitor view is the heart of the LEM Console. As the name implies, it is used for monitoring your
network activity. In Monitor, you create filters and widgets that group and display different events
that come from your Agents, Managers, and network devices.
Events are messages created from Agent, Manager, and network device log entries. These log
entries are processed (or normalized) to extract information and display the data in a common
column/field-based format, rather than the often convoluted format you see in the source data. These
normalized events are sent from the Agent to the Manager for processing. At the Manager, the events
are processed against your Rules, sent to your Database for archiving, and sent to the LEM Console
for monitoring.
Monitor View Features
The following table describes the key features of the Monitor view.
Name
Description
Filters button
Click the Filters button to alternately show and hide the Filters pane.
Filters pane
Stores all of the filters that you can apply to the Console’s event messages.
n
Click a filter name to apply that filter to the events grid. The events grid
refreshes to show only the incoming events allowed by the filter’s conditions.
n
Use the plus
button to create your own custom filters and filter groups.
n
Use the pane’s gear
button to edit, pause, resume, turn on, turn off,
import, export, or delete filters.
101
Chapter 8: Monitor
Name
Events grid
Description
Agents monitor each configured data source on your network. The Agents then
send events to your Managers. The Console's events grid displays every event
that is logged to each Manager the Console is connected to.
The grid’s title bar displays the name of that filter that is currently applied. By
default, incoming events always appear at the top of the grid. This allows the
Console to always show the most recent event activity first.
Respond menu Use this menu to actively respond to a particular event message. For example,
you can choose to block an IP address, or restart or shut down machine that is
the source of the event activity.
Explore menu
Use this menu to explore a particular event message or one of its specific data
elements with an explorer. The menu is context-sensitive. The contents of the
selected cell (called a string) determines which explorers you may choose from.
Pause/Resume This button toggles to pause or resume the event traffic that is currently being
reported by the filter.
This button lets you “highlight” rows in the events grid with a particular color.
Highlighting can serve as a helpful visual reference point for marking and locating
specific events in the grid.
The gear button in each row opens a menu of commands that you can perform on
the item that is currently selected in the grid. You can use these commands to
mark messages as read or unread, to remove messages, or to copy event
information.
Sort (▼ ▲)
When a filter is paused, you can click the column headers to sort the grid in
ascending (▲) or descending (▼) order by each of its columns
Filter
The Filter Notifications pane summarizes the event activity from each of your
Notifications
active notification filters—these are filters that use blink, popup, or sound
pane
notifications. Click a filter name in this tab to view the events associated with
that filter. This pane behaves exactly like the status bar's Notifications tab.
102
Filters and Filter Groups
Name
Widgets pane
Description
This pane displays the widgets associated with the filter that is currently applied
to the events grid. Widgets automatically refresh themselves to reflect changes
in events grid filtering.
You can use this pane view the different widgets associated with the filter,
change a widget’s visualization type (bar chart, pie chart, line graph, etc.), create
a new widget, edit an existing widget, or save a widget to the Ops Center
dashboard.
Event Details
Event Details and Event Description are two views of the same pane. This
and
pane displays detailed information about the last event to be selected in the grid.
Description
n
The Event Details view displays specific technical details about the event.
You can also use this view to create a filter based on the selected event, or to
scroll through the contents of the events grid.
n
The Event Description view displays a written description of the event that is
currently selected.
Notifications
The Notifications tab summarizes the event activity from each of your active
notification filters—these are filters that use blink, popup, or sound notifications.
Click a filter name in this tab to view the events associated with that filter.
Filters and Filter Groups
On a busy network, there can be millions of events each day. Therefore, the LEM Console uses event
filters to manage events. A filter is a subset of your events that focuses on a particular type or group
of events and hides all others. When configuring a filter, you can examine and use individual event
properties to determine precisely which events are to appear in that filter.
Filters apply at the LEM Console level. This means they apply to all data sent from every Manager
monitored by the LEM Console. Filters also display events in real time.
You can turn filters on and off, pause filters to sort or investigate their events, perform actions to
respond to events, and configure filters to notify you when they capture a particular event. Filters can
also display widgets, which are charts and graphs that visually represent the event data. Widgets are
described in more detail below.
103
Chapter 8: Monitor
LEM ships with many commonly used filters that support best practices in the security industry.
However, you can create your own custom filters, or modify existing filters to meet your needs. There
is no limit to the number of filters a LEM Console can contain.
Filters are managed in the Filters pane. The Filters pane stores all of
the filters that can be applied to the Console’s events grid.
Filter Attributes
The number next to each filter shows the total number of events that are
currently associated with that filter. Positioning your pointer over a filter
displays a Tooltip that briefly describes the purpose of each filter, when
such a description is available. Any filters that appear in italics are
currently turned off.
You can use the Filters pane to do any of the following tasks:
l
Create your own custom filters and reconfigure existing
filters to meet your needs.
l
Create filter groups for storing and organizing your filters.
l
Turn filters on and off, and pause them to stop the flow of event traffic.
l
Move filters from one filter group to another.
l
Copy filters.
l
Rename filters and filter groups.
l
Import and export filters.
l
Delete obsolete filters and filter groups.
Standard LEM Filters
LEM ships with some commonly used filters that support best practices in the security industry. Each
of these filters is described in the following table. They are listed alphabetically for easy reference.
The Default status column indicates if the filter is On (visible) or Off (hidden) by default.
104
Standard LEM Filters
To add your own custom filters, see "Utilizing the Console" on page 210.
Note: If you are installing an upgrade, LEM automatically converts your existing filters into the new
graphical format described in see "Utilizing the Console" on page 210.
Default
Filter
Description
status
Admin Account
Displays events for authentication to administrative-level
Off
Authentication
accounts.
All Events
Displays all events from all sources.
On
Change Management
Displays events for changes made to users, groups, and
On
devices.
Denied ACL Traffic
Displays events for network traffic that has been
Off
administratively denied.
Domain Controllers (all)
Displays all events from domain controller devices.
Off
Failed Logons
Displays failed logon attempts.
On
File Audit Failures
Displays FileAuditFailure events, which show failed
Off
attempts to access audited files.
Firewall
Displays all events from firewall devices.
On
FTP Traffic
Displays TCP Traffic to and from ports 20 and 21, indicating
On
file transfer activity on the network.
IDS
Displays all events from network intrusion detection devices.
On
Incidents
Displays all Incident Events.
On
Network Events
Displays all events in the NetworkAudit category of the
On
event tree.
105
Chapter 8: Monitor
Default
Filter
Proxy Bypassers
Description
Displays WebTrafficAudit events that are not from a proxy
status
Off
server. This can indicates an internal machine attempting to
access the Web directly, rather than by using the proxy
server.
Rule Activity
Displays InternalRuleFired and InternalTestRule events,
On
which indicate that Rules have been triggered.
Security Events
Displays all events in the SecurityEvent category of the
On
event tree.
Security Processes
Displays ProcessStart and ProcessStop events related to
On
critical security processes running on machines. These
processes include anti-virus, anti-spyware, and firewall
processes.
SMTP Traffic
Displays TCP traffic to and from port 25. It can also identify
On
potentially infected hosts.
SNMP Traffic
Displays network traffic to and from port 161. This filter can be On
used to discover network scan attempts and normal network
monitoring tools.
Subscriptions
Displays events from user rule subscriptions.
On
Events
Displays all events in the InternalEvent category of the event On
tree.
Unusual Network Traffic Displays events in the NetworkSuspicious branch of the
On
event tree, which indicate that potentially suspicious or
unusual network activity may be occurring.
USB File Auditing
Displays file-related events from Agents with USB-Defender
On
installed.
USB-Defender
Displays events from USB-Defender technology that are
related to insertion and removal of USB devices.
106
On
Filter Creation
Default
Filter
Description
status
User Logon
Displays UserLogon events where the logon type indicates a On
(interactive)
user physically logging on at a machine, or interactively
logging on to a remote desktop.
User Logons
Displays all UserLogon events from all sources, indicating
On
varying types of user authentication and access.
Virus Attacks
Displays all VirusAttack events. VirusAttack events are
Off
created when virus scanners detect potentially malicious
virus activity.
Web Traffic for
Displays WebTrafficAudit events that match a specific
Source Machine
source machine. This filter can be used to track a single
Off
machine’s web activity to discover potentially abusive
activity.
Web Traffic – Spyware
Displays WebTrafficAudit activity to and from URLs that are Off
indicated by the Spyware Sites User-Defined Group to be
potentially malicious websites.
Filter Creation
The Monitor view has a Filter Creation tool where you create and edit your own custom event
filters, as well as edit any existing filters. Use this form to name, describe, configure, and verify your
filters.
Event filters are based on specific Events or Event Groups. You configure them by dragging and
dropping the filter’s Event attributes into configuration boxes. When an Agent or Manager reports an
event that conforms to the event filter’s conditions, the event message appears in the events grid,
whenever that filter is active.
Each filter created is added to the Filters pane. Selecting the filter causes it to become the active
filter in the events grid. As with other filters, the events grid show only those event messages that
meet your filter’s requirements.
107
Chapter 8: Monitor
The possibilities for event filters are endless, so this section describes how to create filters in general
terms. This section is not intended to be a tutorial, but rather a reference for you to fall back on if you
are unclear about how any of the custom filter form’s elements, commands, or functions perform.
The tools in Filter Creation are very similar to those found in Rule Creation. Filters report event
occurrences, so there is no harm if you create a filter that is unusual or has logic problems. But this is
not the case when building rules—creating an incorrect rule can have unpleasant consequences.
Therefore, creating filters with Filter Creation is an excellent way to familiarize yourself with the
logic and tools needed to create well crafted rules.
Features of Filter Creation
Each element of the form is described in the following table.
Name
List pane
Description
This “accordion” pane is called the list pane. It contains categorized lists of the
events, event groups, event variables, groups, profiles, and constants that you can
use when creating conditions for your filters
If more than one Manager is linked to the Console, each item in the list pane lists
the Manager it is associated with. Therefore, some list items may appear to be
listed multiple times. But in reality, they are listed once for each Manager. Events
are universal to all Managers,so they do not show a Manager association.
Filter
Use the top part of the form to name and describe the filter, so you can quickly
identification identify it.
section
Filter Status
The Filter Status bar lists warnings and error messages about your filter’s current
bar
configuration logic.
n
Click >to view a list of warning and error messages.
n
Click a message flag to provide detailed information about the nature of that
problem.
n
Click a message to highlight the specific area or field that is the source of that
problem.
108
Features of Filter Creation
Name
Description
Conditions
Use this box to define the conditions for the data that is to be reported by the filter.
box
You configure conditions by dragging items from the list pane into the Conditions
box.
Notifications Use this box to define how the Console is to event users of event events, such as
box
sound, pop-up message, etc.
Undo/Redo
Click the Undo button to undo your last desktop action. You can click the Undo
button repeatedly to undo up to 20 steps.
Click the Redo button to redo a step that you have undone. You can click the Redo
button repeatedly to redo up to 20 steps.
You can only use Undo or Redo for any steps you made since the last time you
clicked Save.
Save/Cancel Click Save to save your changes to a filter, close Filter Creation, and return to the
events grid.
Click the Cancel button to cancel any changes you have made to a filter since the
last time you clicked Save, exit Filter Creation, and return to the events grid. If you
have any unsaved changes, the system prompts you to confirm that you want to
cancel.
109
Chapter 8: Monitor
Events
The topics in this section explain how to use the events grid to apply filters to incoming event traffic. It
also explains how to use the events grid to pause, sort, highlight, copy, read, remove, explore, and
respond to events to take preventive or corrective action.
Applying a Filter to the Events Grid
In the Monitor view, each item listed in the Filters pane represents a different event filter. You can
filter the events coming into the Console by selecting any of these items.
To apply a filter:
1. Open the Monitor view.
2. In the Filters pane, click the title bar of the filter group you want to work with. The filter
group opens to list the filters that are available for that group.
3. Select the filter you want to apply to the events grid.
The events grid title bar displays the name of the filter you have selected, and the grid
refreshes to display only those events that meet the special conditions of that filter.
Sorting the Events Grid
You can sort the events grid by any of its columns by clicking its column headers. Doing so also
changes how the graph is sorted. However, you must pause the events grid before you can sort it.
Pausing the grid temporarily stops the incoming flow of event traffic.
For example, if you click the Event Name column header, the grid becomes sorted by event names
in ascending order. If you click the column header again, it sorts the grid by that column in descending
order.
110
Highlighting Events
To sort the events grid:
1. On the events grid toolbar, click Pause.
2. Sort the grid as you normally would. You can also sort the grid by more than one
column.
3. When you are finished working with the sorted grid, click Resume to continue receiving
the filter’s unsorted event traffic.
Highlighting Events
In the Monitor view’s events grid, you can highlight events to call attention to them or mark them for
future reference. This allows the events to really stand out as you scroll through the contents of the
grid. You can highlight multiple events at the same time. You can also choose the color you want for
each set of events you are highlighting.
To highlight events:
1. Open the Monitor view.
2. In the Filters pane, click to select the filter you want to work with. The events grid
displays the filter you have selected.
3. On the events grid toolbar, click Pause to temporarily stop any incoming events.
Note: It is not required to pause a filter to highlight its events; however, it is convenient.
Pausing temporarily stops the flow of event traffic (freezing any event movement in the
grid) so you can easily select each item.
4. In the events grid, click to select the events you want highlighted.
5. On the events grid toolbar, click the ▼ arrow next to the “highlight”
button.
6. Use the color picker to select the highlight color you want. You can also type the
hexadecimal value of any color in the Web-safe color palette. In the grid, the selected
events become highlighted in the color you chose.
111
Chapter 8: Monitor
7. Click Resume to continue the flow of incoming event traffic.
To highlight more events with the same color:
1. In the events grid, click to select the events you want highlighted.
2. Click the "marker" part of the events grid’s “highlight”
button. The selected events
become highlighted with the marker color.
To turn an event’s highlighting off:
1. (Optional) On the events grid toolbar, click Pause to temporarily stop any incoming
events.
2. In the events grid, select the events for which you want to remove highlighting.
3. On the events grid toolbar, click the ▼ arrow next to the “highlight”
click the No Color
button. Then
button. The highlighting is removed from the events.
4. Click Resume to continue the flow of incoming event traffic.
Copying Event Data to the Clipboard
When needed, you can copy event data from the Monitor view's events grid or Event Details pane to
your clipboard. This allows you to paste the data into another application, such as Microsoft Excel, for
comparison or analysis, to share the data with someone who does not have a Console, or to send to
SolarWinds for technical support. You can copy the data for a single event or for multiple events.
112
Marking Events as Read and Unread
To copy event data from the events grid:
1. Open the Monitor view.
2. In the Filters pane, click to select the filter you want to work with. The events grid
displays the filter you have selected.
3. In the events grid, click to select the events you want to copy.
4. Click the events grid’s gear
button and then click Copy.The event data is now
copied to your clipboard (as text), where it can be pasted into another application.
To copy event data from the Event Details grid:
1. Open the Monitor view.
2. In the Filters pane, click to select the filter you want to work with. The events grid
displays the filter you have selected.
3. In the events grid, click to select the event you want to work with.
4. In the Event Details pane, click to select the rows you want to copy.
5. Click the events grid’s gear
button and then click Copy. The selected event
details are now copied to your clipboard (as text), where it can be pasted into another
application.
Marking Events as Read and Unread
You may want to mark the events in event filter as being unread and read. A read event is one that
you have already looked at. An unread event is one you have not looked at yet. By marking events
this way, you can easily track which events you have already examined.
To mark events as read and unread:
1. Open the Monitor view.
2. In the Filters pane, click to select the filter you want to work with.The events grid
displays the filter you have selected.
113
Chapter 8: Monitor
3. In the events grid, select the events you want to mark as read or unread. Skip this step
if you are going to mark all of the events as read or unread.
4. Click the events grid’s gear
button, and then select one of the options listed in the
following table.
Command
Description
Mark
Select this command to mark the selected events as unread. This
Unread
means you have not looked at them yet. Unread events appear in bold
text. When a filter has the “read/unread” feature turned on, any of its
events that are captured by other filters will appear as unread in those
filters, too.
Mark
Select this command to mark the selected events as having been read.
Read
Events marked as “read” appear in normal text, rather than bold text.
Mark All
Select this command to mark all of the events in the active filter as
Unread
unread. This means you have not looked at them yet. Unread events
appear in bold text.
Mark All
Select this command to mark all of the events in the active filter as
Read
having been read. Events marked as “read” appear in normal text, rather
than bold text.
The grid refreshes to show each row’s read/unread status.
Removing Events
When needed, you can remove individual events from a filter, or all of the events from a filter. You
may want to do this to clean a filter of historical information that is no longer important to you.
To remove individual events:
1. Open the Monitor view.
2. In the Filters pane, click to select the filter you want to work with. The events grid
114
Using the Event Details/Event Description Pane
displays the filter you have selected.
3. In the events grid, select the events you want to remove.
4. Click the events grid’s gear
button, and then click Remove. The selected events
are removed from the grid.
To remove all events:
1. Open the Monitor view.
2. In the Filters pane, click to select the filter you want to work with. The events grid
displays the filter you have selected.
3. Click the events grid’s gear
button, and then click Remove All. All of the filter’s
existing events are removed from the grid. The filter will now show only new incoming
events.
Using the Event Details/Event Description Pane
In the Monitor view, the right half of the lower pane has two different views to show the properties of
the event that is currently selected in the events grid: l
The Event Details view displays detailed information about the event that is currently
selected in the grid. If more than one event is selected, it shows the properties of the
last event to be selected.
l
The Event Description view displays a written description of the last event to be
selected in the grid.
You can also use this pane to create a filter based on the selected event, or to scroll through the
contents of the events grid.
115
Chapter 8: Monitor
The Event Details view
Button
The Event Description view
Description
Click this button to create a new filter that captures the currently selected event type.
Upon doing so, the Monitor view opens, with the new filter open in the events grid. The
new filter appears in the Filters pane, under the last selected filter. If needed, you can edit
the filter so it captures events of an even more specific nature.
Click these buttons to move up and down among the events in the event event grid. The
pane shows detailed technical information about each event that is selected. This lets you
view the technical details and written descriptions of each event in the grid.
Remember, you can also use your keyboard's up (↑) and down (↓) arrow keys: n
To cycle through the events in the events grid, click anywhere in the event event grid.
Then use your up and down arrow keys.
n
To cycle through the fields in the Event Details pane, click anywhere in the Event
Details grid. Then use your up and down arrow keys.
116
Event Severity Levels
Button
Description
Click this button to open the pane’s Event Details view. This view shows detailed
information about each of the selected event's data fields. The actual fields that appear
here vary, according to the event type that is currently selected. For example, networkoriented events show fields for IP addresses and ports. Account-oriented events show
account names and domains.
Click this button to open the pane’s Event Description view, which provides a detailed
written description of the event type that is currently selected.
Click the Print button to print this information from either view.
Event Severity Levels
Each event is assigned a number that indicates its severity. The following table explains each
severity level.
Level
0
Name
Debug
Description
Designates detailed event information used for debugging by SolarWinds
engineers.
1
System
Indicates that part of the system is unusable.
Error
2
Informational Indicates SolarWinds informational messages only.
3
Normal Audit Indicates normal behavior, but could be part of a signature attack.
4
Normal
Indicates normal behavior that should be monitored.
Notice
5
Suspicious
Indicates normal behavior under some circumstances, but should be
investigated.
6
Threatening
Indicates that investigation is needed and possibly an action.
7
Critical
Indicates that immediate action is needed.
117
Chapter 9: Explore
The Console's Explore area has two views: l
The nDepth view contains a powerful search engine that lets you search all of the
event data or the original log messages that pass through a particular Manager. The log
data is stored in real time, as it originally occurs from each host (network device) and
source (application or tool) that is monitored by the Manager.
nDepth summarizes and displays search results with several different visual tools that
can also be combined into a customizable dashboard. The tools are intuitive and
interactive—you can point and click to view information or refine your searches. Each
graphical tool provides an alternative view of the same data, so you can examine your
data from several perspectives. You can also view and explore a text-based view of the
actual data.
nDepth employs drag-and-drop tools that let you configure simple or even complex
search criteria. You can use these tools to dig deeper into your findings by adding
search conditions, or by appending text to existing search strings. nDepth also includes
a tool called Search Builder that lets you configure complex search criteria using the
same sort of drag-and-drop interface found in Filter Creation.
Many of the explorers are utilities used for finding out more about event specific details,
such as looking up IP addresses, domain names, and host names. The Event explorer
lets you view all of the events related to an event message. It is designed to help you
visualize how the event occurred and the system's response to that event. You can
follow the chain of events that caused the event, and help determine its root cause.
l
The Utilities view contains several utilities, called explorers. You can think of this view
as a center for investigating events and their details.
nDepth
nDepth is a powerful search engine that lets you search all of the event data or the original log
messages that pass through a particular Manager. The log data is stored in real time, as it originally
occurs from each host (network device) and source (application or tool) that is monitored by the
118
Chapter 9: Explore
Manager. You can use nDepth to conduct custom searches, investigate your search results with a
graphical tools, investigate event data in other explorers, and take action on your findings.
nDepth's Visual Tools
nDepth summarizes and displays search results with several different visual tools that can also be
combined into a customizable dashboard. The tools are intuitive and interactive—you can point and
click to refine your searches. Each graphical tool provides an alternative view of the same data, so
you can examine your data from several perspectives. You can also view and explore a text-based
view of the actual data.
nDepth employs drag-and-drop tools that let you configure simple or even complex search criteria.
You can use these tools to dig deeper into your findings by adding search conditions, or by appending
text to existing search strings. nDepth also includes a tool called Search Builder that lets you
configure complex search criteria using the same sort of drag-and-drop interface found in Filter
Creation.
nDepth's Primary Uses
You can use nDepth to do any of the following:
l
Search either normalized event data or the original log messages. You can also use
nDepth to explore log messages that are stored on a separate nDepth appliance.
l
Intuitively view, explore, and search significant event activity. nDepth summarizes
event activity with simple visual tools that you can use to easily select and investigate
areas of interest.
l
Use existing filter criteria from the Monitor view to quickly create similar searches.
l
Create your own custom widgets for the nDepth Dashboard.
l
Conduct custom searches. You can also create complex searches with the Search
Builder, which is a tool that behaves just like the Filter Builder. You can also save any
search, and then reuse it at any time by clicking it.
l
Save and reuse custom searches.
119
Exploring Events vs. Log Messages
l
Schedule saved searches
l
Export your findings to a printable report in PDF format, or your search results to a
spreadsheet file in CSV format.
l
Use the Explore menu to investigate nDepth search results with other explorers.
l
Use the Respond menu to take action on any of your findings.
l
Export your findings to a report in PDF format.
Exploring Events vs. Log Messages
LEM has two data storage areas — one to store the messages from the original event logs, and one to
store the normalized event data that the Console reports in the Monitor view. You can use nDepth to
explore either one of these sources:
l
In Events mode, nDepth summarizes and explores your event data. This is the
normalized data that appears in the Monitor view and is stored in the LEM database.
l
In Log Messages mode, nDepth summarizes and explores the raw log messages that
are going into nDepth Log Storage from the original event logs. This mode is intended
for customers who have specific data analysis needs, and who fully understand how to
interpret the raw log messages that are generated by their network devices and tools.
Note: The virtual appliance must be configured to store log message data. For more information, see
the following KB article, "Configuring Your LEM Appliance for Log Message Storage."
Be aware that data storage is limited. If you have not configured a CMC option for archiving data,
LEM will delete the oldest data to make room for new data.
The topics in this chapter explain how to perform a basic searches with nDepth, how to use nDepth's
graphical tools, how to use nDepth with other explorers, and how to respond to your findings.
Opening nDepth
You can open nDepth several ways. You can open the Explore >nDepth view directly to conduct
custom searches. Or you can open nDepth from an existing data source, such as an event field or
another explorer (NSLookup, Whois, and Traceroute, and Flow), to search for similar events or data.
120
Chapter 9: Explore
By default, the nDepth search time is for the last 10 minutes (the end time is now, and the start time is
10 minutes ago).
Opening nDepth From Another Data Source
1. Do one of the following:
l
In the Monitor view’s event grid, select the event row or field you want to
explore.
l
In the Event explorer’s Event Details pane, event map, or event grid,
click the item or field you want to explore.
l
In an explorer, select the data source you want to explore.
2. In the Explore menu on the Event grid, click nDepth.
The Explore >nDepth view appears, and the nDepth search box contains the event or
event field you are exploring.
When you initiate an nDepth search from the Monitor view, nDepth automatically
searches all hosts and sources for every instance of the selected event field that has
occurred within a ten-minute period around the event you are exploring. This way, you
can identify similar events that occurred before and after the event you are exploring.
The following table describes the key features of the Explore >nDepth view.
Name
Description
History button
Alternately hides and opens the History and Saved Searches panes.
History pane
Shows recent Explore activity. This pane is shared between the Utilities view
and the nDepth view.For more information, see "Using the History pane" on
page 1.
121
Opening nDepth From Another Data Source
Name
Description
Saved Searches Lists any searches that you have saved. To begin using one of these searches,
pane
click it to run that search. You can edit, schedule, and save changes to your
saved searches. You can also save variations on these searches as new
searches.
nDepth explorer Use this window to create and run your searches, and to view, explore, and
respond to your search results.
Undo/Redo
Click the Undo button to undo your last action. You can undo up to 20 actions.
Click the Redo button to redo a step that you have undone. You can redo up to
20 actions.
Respond
Use this menu to initiate a response to a particular event, event, or data field.
Explore
Use this menu to explore a particular data field with another explorer.
Click the gear
button to do any of the following:
n
Click Save to save any changes to the current search.
n
Click Save As to save the search for later use.
n
Click Schedule to create a scheduled search.
n
Click Delete Schedule to delete a scheduled search.
n
Click Export to export nDepth's current search results to a PDF document.
122
Chapter 9: Explore
Name
Search bar
Description
Use the search bar to:
n
Select the type of data you want to explore—event data (default) or the
original log messages.
n
Select the mode for configuring searches—drag and drop, or text entry.
n
Configure and select the search's time frame.
n
Run the search.
n
Stop a search that is in progress.
or detailed information on the search bar, see nDepth's Search Bar
List pane
The list pane is the “accordion” list on nDepth's left side. It contains categorized
lists of items that you can use when configuring search conditions. To use a list
item as a search condition, double-click it, or drag it from the list into the search
bar. You can also drag these items into the Search Builder to quickly configure
complex searches.
Two of these lists appear only in nDepth:
n
The Refine Fields list categorizes and lists the primary data details that are
found in your nDepth search results. You can use these details to create,
refine, or append nDepth searches.
n
The Managers list includes each Manager and appliance that can be used
with nDepth for searching data.
Histogram
Shows the number of events or log messages that were reported within a particular period. You can expand or reduce this period, as needed. You can also
zoom in to a period to take a closer look, or zoom out to see high-level activity.
123
Scheduled Saved Searches
Name
Explorer
Description
Shows different graphical and text-based views of your search results, as well
as a Dashboard view and the Search Builder. You can click items in each
graphical view to search for those specific items. The title bar states which view
is open, and the icon on the title bar indicates which type of data you are
exploring:
means you are exploring event data.
means you are exploring log messages.
Toolbar
Use to select the nDepth explorer view you want to work with.
Scheduled Saved Searches
Saved searches can be scheduled to run automatically whenever you want. Scheduled Searches can
also be shared between users.
To schedule a Saved Search:
1. Select a Saved Search from the Saved Searches pane .
2. Click the gear
button and select Schedule.
3. Select the Run Search option you desire.
4. Select the Start Date of the search.
5. Select the Create an event checkbox.
6. If you wish to send email, select the Send email checkbox, and then select the
recipients from the drop-down list.
7. Click OK.
124
Chapter 9: Explore
Note: If the virtual appliance is offline for some time (such as more than a day or two),
the schedules that are run when the virtual appliance first comes back online may not
run at the expected time. The schedules run at the next expected time after the
appliance has been back online for a time.
nDepth's Search Bar
You can use the nDepth search bar to search all of the event data or the original log messages that
pass through a particular Manager. You can use the search bar to perform simple searches and to
append searches with basic search strings
Tip: You can use the search bar to configure highly specific or complex searches; however, this is
more easily done with Search Builder. To open Search Builder, click the search bar. The searches
you configure in Search Builder automatically appear in the search bar.
The following table describes the key features of nDepth's search bar.
Name
Description
Mode
Use this toggle switch to select how you intend to enter the search string for your
selector
queries:
n
Select Drag & Drop Mode (upper position) to drag items from the list pane or the
Result Details view directly into the search box. This is the recommended position,
as it is it the easiest to use.
n
Select Text Input Mode (lower position) to type a search string directly in the search
box. In this mode, the search box also shows the text version (or search string) of any
search that is being run or configured in Search Builder or the Saved Searches pane.
Search
This box contains your search conditions. You can enter search conditions a number of
box
different ways.
Click a delete button next to a condition or a group to remove that condition or group from
the current search configuration.
125
nDepth's Search Bar
Name
Description
AND The search bar includes AND and OR operators. These operators let you include AND
and OR relationships between conditions and groups of conditions, when you have
OR
multiple conditions in your search string. Click the operator icon to toggle between
AND and OR relationships.
Group
When you have a group of conditions, the search bar displays the conditions as a sum-
summary mary. To see the actual conditions, point to them. A ToolTip appears that shows each
condition in the group.
Click this Delete All button to delete the entire contents of the search box, so you can
begin a new search.
Click this button to begin a search, or to stop a search that is in progress.
n
Click
to begin searching.
n
If the search button turns red
n
Click
, it means the current search configuration is invalid.
to stop a search that is in progress.
Time
In the time selector, select a time frame for the search. If needed, you can create your
selector
own custom time frame
Data
Use this toggle switch to choose the data you want to nDepth to explore:
selector
n
Select Events (left position) to search LEM's normalized event data. This is the event
data that appears in the Monitor view.
n
Select Log Messages (right position) to search the actual log entries that are
recorded on your network products' log files. If Log Messages is disabled, it means
your equipment is either disabled, or it does not have the capacity to store and search
the original log messages. However, you can still search the data in the Events
position.
126
Chapter 9: Explore
nDepth Explorer Toolbar
nDepth explorer toolbar
The following table describes the function of each option on the nDepth explorer toolbar. Each option
provides a different view of the data from nDepth's most recent search.
Tool
View
Description
Dashboard Opens the nDepth Dashboard. This is nDepth's default view. It shows each
nDepth view of the current search data as a small widget. You can minimize
and maximize each widget, as needed. You can also edit the chart widgets to
change their appearance.*
Word
Opens the Word Cloud, which shows keyword phrases that appear in your
Cloud
event data. Phrases appear in a size and color that relates to their frequency.
You can filter this view to zero in on a range of activity. You can also click a
phrase to create or append a search based on that phrase.
Tree Map
Opens the Tree Map, which shows the items that appear most often in the data
as a series of categorized boxes. The box categories correspond with the
those data categories found in the Refine Fields list.
The size of a box within each category is associated with its relative
frequency. The more often an item occurs, the larger its box appears. If a box
is small, you can point to it to open a ToolTip that shows its contents. You can
also click a box to create or append a search based on that item.
Bar Charts Opens the Bar Charts* view, which is a group of widgets that shows your most
frequent data items as a series of bar charts. The size of each bar corresponds
with the item's relative frequency. The more often an item occurs, the larger its
bar appears. You can point to a bar to show information about it. You can also
click a bar to create or append a search based on that item.
127
nDepth's History Pane
Tool
View
Description
Line
Opens the Line Charts* view, which is a group of widgets that shows your
Charts
most frequent data items as a series of line graphs. The height of point on the
graph corresponds with the item's relative frequency. The more often an item
occurs, the higher the point appears on the graph. You can point to a item on
the graph to show information about it. You can also click a point on the graph
to create or append a search based on that item.
Pie Charts Opens the Pie Charts* view, which is a group of widgets that shows your most
frequent data items as a series pie charts. The size of each pie wedge corresponds with the item's relative frequency. The more often an item occurs, the
larger its wedge appears. You can point to a wedge to show information about
it. You can also click a wedge to create or append a search based on that item.
Bubble
Opens the Bubble Charts* view, which is a group of widgets that shows your
Charts
most frequent data items as a series of circles or "bubbles." The size of each
bubble corresponds with the item's relative frequency. The more often an item
occurs, the larger its bubble appears. You can point to a bubble to show
information about it. You can also click a bubble to create or append a search
based on that item.
Result
Opens the Result Details view, which is a text-based view of all of the data
Details
you are investigating. This view also supports nDepth's search capabilities by
letting you create or refine searches by dragging and dropping search strings
from the data into the search box.
Search
Opens nDepth's Search Builder, which is a graphical interface used to create
Builder
and refine complex searches. You can drag items from the nDepth's list pane
directly into Search Builder's Conditions box to quickly configure complex
searches. With a few minor differences, Search Builder behaves just like the
Filter Creation tool.
*In any explorer view, if a particular chart configuration does not logically apply to the data you are
exploring, that chart will be disabled.
nDepth's History Pane
Each nDepth explorer search adds an item to the Explore view’s History pane.
128
Chapter 9: Explore
represents a search of event data.
represents a search of original log messages.
The history item shown below is for an nDepth search of event data. Pointing to the item's history
icon also displays the number of search results and the text of your search string.
A new search always adds a history item. If you click an earlier history item, the system takes you
back to that search; it does not make a new item. As soon as you change something in nDepth and
perform a new search, that search becomes a new history item.
Using the nDepth Histogram
nDepth's histogram shows the number of events or log messages that were reported within the
search's time frame. nDepth returns search results chronologically, so you can use the histogram to
investigate a particular interval, to move the search period, to zoom in to a period to take a closer
look, or zoom out to see high-level activity.
nDepth's histogram summarizes event activity within a particular period. This histogram is for a search of the last 10 minutes of
event activity. The bright zone shows the period that is currently being reported. The gray zones show activity outside of the
reported period.
129
Histogram Features
This example shows the histogram for a search that covers a recent 10-minute period of activity. For
this search, the bottom time bar is divided into one-minute intervals. The bar above that is divided into
half-minute (30-second) intervals. The histogram displays a separate bar for each 30-second interval.
Histogram Features
The histogram has the following features:
l
The title bar shows the total number of events that were reported by the search, as well
as the search's time frame.
l
The gray zones preview results that are outside the search's time frame.
l
Each vertical bar in the histogram shows the total number of events that happened
within the corresponding period.
l
Time is provided in 24-hour (military) time.
l
Pointing to a bar shows the total number of events in that interval, as shown above.
l
Clicking a bar opens a pop-up window that shows a histogram for that bar's interval.
Depending on range of the search's time frame, these intervals can be as little as 5seconds. Pointing to a bar shows the total number of events that occurred in that
interval.
Clicking a bar opens a pop-up window to show a histogram for that bar's interval
130
Chapter 9: Explore
l
When you are in the Result Details view, the histogram shows two dashed vertical
lines. These lines are markers that indicate where you are in the histogram for each
page of the search results. The lines show the times of the first and last event on the
current Result Details page.
By default, the ▲ pointer shows the time of the first result on the page. If you select an
event in the Result Details box, the pointer shows the time of that event.
Example: If you are looking at the search results of events number 1-200, the left line
shows the time of event number 1, and the right line shows the time of event number
200. If you click event number 150, the ▲ pointer shows the time that event occurred.
Searching the Activity Associated with a Particular Histogram Bar
You can use the histogram to search the event activity associated with a particular vertical bar in the
histogram.
To search activity for a bar:
l
In the histogram, double-click a vertical bar.nDepth automatically refines the search
and refreshes the data to show only the events from the time frame associated with
that bar.
Moving the Search Period
You can use the nDepth histogram to move the search period to an earlier or later start time. For
example, say you run a search for a 30 minute time frame. This procedure lets you search the data for
the same period (still 30 minutes), but from a different starting point (maybe with a starting point of 2
hours ago).
131
Changing the Period's Start and End Time
To move the search period:
1. Point to the histogram's time bar. A slider appears. You can use this slider to move the
same search period to an earlier or later starting point. For example, if the search period
is 10 minutes, this slider moves that 10-minute period to an earlier or later starting point.
This lets you search your data for the same period, but at some other starting point.
2. Drag the slider to move the search's period:
l
Drag the slider to the left to move the period to an earlier starting point.
l
Drag the slider to the right to move the period to a later starting point.
As you move the slider, a ToolTip displays the period's midpoint time.
3. Click
to run the search for the new time frame.nDepth automatically refines the
search and refreshes the data to show only the events from the new time frame.
Moving the period automatically changes the search bar's time selector to Custom.
4. If desired, click
to restore the previous time frame.
Changing the Period's Start and End Time
You can use the nDepth histogram to change the search period by changing its start time and end
time. For example, say you run a search for a 30 minute period. This procedure lets you expand the
time frame (say to 40 minutes) or reduce the time frame (say to 23 minutes).
132
Chapter 9: Explore
To change a period's start or end time:
1. Point to anywhere on the histogram's vertical bars. Two sliders appear between the
active time and the gray zones. You can use these sliders to expand or reduce the
search time frame by changing its start time or end time.
2. Drag the sliders to change the search's time frame:
l
Drag the left slider to change the time frame's start time. When you
release the slider, a ToolTip shows the new start time.
l
Drag the right slider to change the time frame's end time. When you
release the slider, a ToolTip shows the new end time.
3. Click
to run the search for the new time frame.nDepth automatically refines the
search and refreshes the data to show only the events from the new time frame.
Changing the time frame automatically changes the search bar's time selector to
Custom.
4. If desired, click
to restore the previous time frame.
Using Result Details
Whenever you use nDepth, you can view the actual data the graphical views are based on by opening
the Result Details view. Result Details is a text-based view of all of the data you are investigating.
However, Result Details also supports nDepth's search capabilities, by letting you create or refine
searches by dragging and dropping search strings from the search data into nDepth's search box.
You can use Result Details in Events mode to view and search the normalized event data found in
133
Interpreting Search Results in Events Mode
the Monitor view, or in Log Messages mode to view and search the original log message data that is
collected and stored on the LEM (or some other dedicated nDepth appliance, as applicable).
You can use nDepth's search results to refine your nDepth searches, to explore event details with
other explorers, or to initiate an active response to event details.
The following topics describe the key features of the Result Details view, as well as how to perform
the primary tasks associated with this view.
Interpreting Search Results in Events Mode
In Events mode, you can use nDepth to search all of the normalized event data that is reported in the
Monitor view. This data always comes from LEM.
The following table explains how to interpret search results of data in Events mode.
Name
Event number
Description
The number to the far left is a counter for each event that is reported in the nDepth
search results. Each event gets its own number.
Each row represents a different event. To make viewing easier, each event
appears with an alternating gray or white background. The number of events that
appear depend entirely on your search conditions.
Data and time
The time and date the event occurred.
stamp
Event name
The name of the event that occurred.
Event details
The rest of the information in the box is made up of event details. You can select
these details to refine your nDepth search, to explore them with other explorers,
or to respond to them with an active response.
Interpreting Search Results in Log Messages Mode
In Log Messages mode, you can use nDepth to search all of the original log messages that pass
through a particular network appliance (or host).
134
Chapter 9: Explore
nDepth Result Details view, showing original log message data
The following table explains how to interpret search results of data in Log Messages mode.
Item
Name
Event number
Description
The number to the far left is a counter for each log message (or event)
that is reported in the nDepth search results. Each event gets its own
number.
Each row represents a different event.To make viewing easier, each
event appears with an alternating gray or white background. The number
of events that appear depend entirely on your search conditions.
Data and time
The time and date the event occurred.
stamp
Log message
The first line of event displays the actual log message that matched your
search criteria.
Host
The network device the message came from (that is, the Manager or
appliance that is storing the message).
ToolId
The actual product or tool that generated the message.
ToolType
SolarWinds's tool category for the tool that generated the message.
Note: Tool IDs and Tool Types match SolarWinds’s tool configuration
categories.
135
Adding Search Strings from Result Details
Adding Search Strings from Result Details
When using the Result Details view, use the following procedures to highlight and select character
strings, and to create new search conditions from the data.
To
Do this
Selecting data
Highlight a continuous
Point to the character string.
character string
Select a continuous character
string
Point to the character string to highlight it; then click to select it.
Upon selecting a character string, an orange box surrounds the
string. In addition, every matching character string in the search
results becomes selected, too.
Select a phrase (two or more
Click the first character in the string, then drag across the string
character strings separated by
to select the rest of it.
spaces)
Upon selecting a character string, an orange box surrounds the
string. In addition, every matching character string in the search
results becomes selected, too.
Select a data row
Click the row's event number (the far left column of the row).
When the row is selected, an orange highlight bar appears to the
left of the row.
Creating search conditions from Result Details data
Clear the search box to add a
new search condition
1. On the search bar, click
to clear the search box.
2. Add a new search condition by using any of the
techniques in this table.
136
Chapter 9: Explore
To
Do this
Add a search condition from
Select a character string in the data. Then double-click the
Result Details data
selected string to add it to the search box.
Select a character string in the data; then drag it into the search
box.
Copy and paste a character
string from Result Details data
1. Change the search bar to Text Input Mode.
2. Select a character string in the data.
into the search box
3. Press Ctrl+C to copy the search string.
4. Click the search box, and then press Ctrl+V to
paste the character string in the text box.
Type a search string in the
search box
1. Change the search bar to Text Input Mode.
2. Type the search string directly in the search box.
Add conditions to an existing
1. In the data, select the character string you want to
search
append to the existing search conditions.
2. Do either of the following: n
Double-click the selected string.
n
Drag the string into the search box.
In either case, your selection is appended to the
existing conditions.
Using Explorers with Result Details
You can use nDepth's Result Details view to access other explorers. This allows you to use other
explorers to investigate specific details that you find in your nDepth search results.
l
You can select specific values, and pass them into the value-based explorers, such as
Whois, NSLookup, and Traceroute. For example, you could investigate a suspicious
IP address with these explorers to learn more about that IP address.
137
Responding to Result Details
l
When you are viewing data in Events mode, each row in the search results represents
the data for an individual event. You can select the row for an event you want to
explore, and then pass the row into the Event Explorer to explore that event.
To explore details in search results:
1. In the Result Details view, select the item you want to explore: l
Select the character string you want to investigate. When selected
properly, the character string is surrounded by an orange box.
l
If you are viewing data in Events mode, you can select the row that you
want to explore in the Event Explorer. When you select a row, an orange
highlight bar appears to the left of the row.
2. In the Explore menu, select the explorer you want to use.
The Explore >Utilities view appears, and the system “passes” the selected data to the
explorer you selected.
3. Click Search or Analyze, as applicable, to explorer the string.
Responding to Result Details
As with other explorers, you can respond to any item that is reported in nDepth's search results. If
you see something unusual, you may want to take some kind of corrective action. For example, you
could send a user account a popup message, or block a hostile IP address. Use the following
procedure to initiate a response or corrective action to a particular event or event detail.
To respond to a search result:
1. In the Result Details view, select the character string you want to respond to. When
selected properly, the character string is surrounded by an orange box.
2. In the Respond menu, select which response you want to take.
If nDepth is in Events mode, the event or the selected text appears in the Respond
138
Chapter 9: Explore
form.
3. Complete the Respond form, as applicable for the response.
Exporting Result Details Data to a Spreadsheet
Use the following procedure to export your nDepth search results to a spreadsheet. This lets you
open, view, manipulate, and analyze your data in a spreadsheet application, such as Microsoft Excel.
Spreadsheets are saved in comma-separated values (.csv) format.
To export nDepth search results to a spreadsheet:
1. In nDepth, run the search you want to export.
2. Open the Result Details view.
3. Click the gear
icon and then click Export to CSV. The Save Data As form
appears.
4. Select the folder in which you want to save the file.
5. In the File name box, type a name for the file, if you want one different from the default
name given.
6. Click Save. The Console exports the data to a .csv file, in the folder you selected. To
stop this operation, you can click Cancel at any time before the data export is
complete. Once exported, you may open the file in a spreadsheet application.
Common nDepth Data Fields
These categories frequently appear in the Refine Fields list, the Tree Map view, and the Result
Details view.
Common Data Fields Categories in Events Mode
This table describes the data fields that are most commonly seen when working with event data. The
139
Common Data Field Categories in Log Messages Mode
fields are listed here alphabetically.
Field
Description
Event Name
The name of the event.
Detection IP
The network node that is the originating source of the event data. This is
usually a Manager or an Agent and is the same as the Insertion IP field, but
can also be a network device such as firewall or an intrusion detection
system that may be sending log files over a remote logging protocol.
Inference Rule
The name of the correlation that caused the event. The Inference Rule field
will generally be blank, but in cases where the event was related to a rule, it
displays the rule name.
Insertion IP
The Manager or Agent that first created the event. This is the source that
first read the log data from a file or other source.
IP Address
The IP address associated with the event. This is a composite field, drawn
from several different event fields. It shows all the IP addresses that appear
in event data.
Manager
The name of the Manager that received the event. For data generated from
an Agent, this is the Manager the Agent is connected to.
Provider SID
A unique identifier for the original data. Generally, the Provider SID field
includes information that can be used in researching information on the
event in the originating network device vendor's documentation.
Severity
The severity (0–7) of the event
Tool Alias
The Alias Name entered when configuring the tool on the Manager or Agent.
User Name
The user name associated with the event. This is a composite field, drawn
from several different event fields. It shows all the places that user names
appear in event data.
Common Data Field Categories in Log Messages Mode
This table describes the data fields that are most commonly seen when working with log messages.
The fields are listed here alphabetically.
140
Chapter 9: Explore
Field
Host
Description
The node the log message came from (that is, the LEM or Agent that collected the
message for forwarding to nDepth).
HostFromData The originating network device (if different than the node) that the message came
from. Normally, Host and HostFromData are the same, but in the case of a
remote logging device (such as a firewall) this field reports the original remote
device's address.
ToolId
The actual tool that generated the log message.
ToolType
Tool category for the tool that generated the log message.
Using the Word Cloud
nDepth's Word Cloud. You can use the sliders on the lower bar to filter the items shown in the World Cloud.
nDepth's Word Cloud summarizes your event activity by showing the top 100 keyword phrases that
appear in your event messages. Phrases appear in a size and color that relates to their frequency:
l
Phrases that appear in warmer colors (red, orange, and yellow) and in larger print
represent the phases that occur most frequently. You can think of these as your "hot"
items.
l
Phrases that appear in cooler colors (green and blue) and in smaller print are those that
occur with the least frequency. You can think of them as "cool" items. Cool items may
still be important; they just occur far less frequently than "hot" items.
141
Opening the Word Cloud
Opening the Word Cloud
l
On the nDepth toolbar, click the
icon.
Viewing Statistics in the Word Cloud
Word Cloud includes statistics about each item that is listed in the cloud.
To see statistics:
l
Point to a phrase in the Word Cloud. A ToolTip appears showing the keyword phrase,
its count (the number of times it occurs in the reported period), and its percentage. The
percentage is based on the phrase's relative frequency, compared to the other reported
phrases.
Filtering the Contents of the Word Cloud
There are two horizontal bars at the bottom of the Word Cloud:
l
The top bar is a color gradient that goes from red (hot) to blue (cool). These colors
correspond with the colors of the phrases shown in the Word Cloud.
l
The lower bar controls which parts of the gradient the Word Cloud is allowed to show.
You can use this bar to filter the World Cloud so that it only shows that section of the
gradient you want to see. By default, the Word Cloud shows everything associated
with the entire gradient—all items that are hot, cool, and in between.
By default, the Word Cloud displays the top 100 phrases, and the sliders are automatically adjusted
to this width. If you manually adjust the sliders, nDepth remembers the left position and automatically
adjusts the right position so the Word Cloud displays up to 100 phrases between the left and right
positions. If all 100 phrases can be shown within the positions you've selected, the sliders will stay in
place.
142
Chapter 9: Explore
Slider settings are remembered with each Word Cloud. This means you can create Word Clouds for
the Dashboard that are adjusted differently from the primary Word Cloud view.
To filter the contents of the World Cloud: l
To hide hot items, drag the lower bar's left-hand slider to the right.
l
To hide cool items, drag the lower bar's right-hand slider to the left.
l
To restore the Word Cloud, drag the sliders back to their far-left and far-right positions.
Exploring Items in the Word Cloud
You can use the Word Cloud to explore a particular phase, by using as the basis for a new search, or
to append an existing search.
To explore an item in the Word Cloud: 1. In the Word Cloud, click the phrase you want to explore. The phrase appears in the
search bar.
2. On the search bar, click the search
button.After a moment, nDepth refreshes to
show the results associated with your search.
143
Using the Tree Map
Using the Tree Map
nDepth's Tree Map
The items that appear in nDepth's Tree Map view are the same data field categories and values that
are listed in the Refine Fields list (at the top of the list pane).
l
When you are working with events, the Tree Map organizes itself into categories based
on common event data fields. Most categories correspond with actual event fields, as
they appear in the Monitor view.
l
When you are working with log messages, the Tree Map organizes itself into categories
based on common log message data fields.
Note: Some data categories may not always be present. If there is no event activity associated with
a particular data category or field, it will not appear in the Tree Map.
The size of each box corresponds with the relative frequency of its occurrence. So the more often a
detail occurs, the larger its box appears.
Click to select an item from the Tree Map as a search condition. If a box is too small to show its
contents, point to it to open a ToolTip that shows its contents.
144
Chapter 9: Explore
Opening the Tree Map
l
On the nDepth toolbar, click the
icon.
Resizing Tree Map Categories
Use the following procedures to resize each category box in the Tree Map is associated with the
relative frequency of its occurrence.
To maximize a category:
l
Click the
icon on the box's toolbar.
Note: Even when maximized, a Tree Map category can show very small items within
it. Don't forget, if a box is too small to show its contents, you can point to it to open a
ToolTip that shows its contents.
To restore a category to its proportional size:
l
Click the
icon on the box's toolbar.
Exploring items in the Tree Map
You can use the Tree Map to explore a particular item, by using that item as the basis for a new
search, or to append an existing search.
To explore an item in the Tree Map: 1. In the Tree Map, click the item you want to explore. A search string for that item
appears in the search bar.
2. On the search bar, click the search
button. After a moment, nDepth refreshes to
show the results associated with your search.
145
Using nDepth widgets
Using nDepth widgets
nDepth comes with a series of commonly used widgets. These widgets behave very much like the
widgets in the Ops Center. Each widget represents a high-level graphical view of the specific
network activity associated with your nDepth search results. It shows the primary items that are
generating that activity, as well as the count (or number of incidents) for each item.
A typical nDepth widget
You can use nDepth's explorer views to create new widgets, change the look of existing widgets, add
widgets to the nDepth Dashboard, and remove widgets you no longer user.
Default nDepth Chart Widgets
On the widget toolbar, click the refresh
button. The widget refreshes to show the latest data from
your network.
nDepth Explorer and Widget Icons
The following table briefly describes the function of each icon you will find on nDepth explorer views
and widgets.
146
Chapter 9: Explore
Icon
Description
From a main nDepth view (such as Word Cloud, Tree View, or Result Details), this button
add the view to the nDepth Dashboard as a widget.
From the nDepth explorer toolbar, you can point to a chart view and then click this button to
add a specific chart widget to the nDepth Dashboard.
Adds a new widget to the current chart view.
This button adds the widget to the nDepth Dashboard. This button only appears on widgets
in their various chart views.
Refreshes the widget so it displays the latest data.
This button is only enabled when the chart properties have changed. If you edit a chart's
configuration, the Console does not have the data to draw the chart until you refresh its data.
Opens the nDepth Widget Builder so you can edit or reconfigure the widget.
Minimizes the widget to it appears as a title bar at the bottom of the view.
To restore the widget, scroll down to the bottom of the view, and then click the widget's title
bar.
Toggles the widget between being its normal size and being maximized to fill the current
view.
Deletes the widget from the view. Once deleted, the widget cannot be restored; you must recreate it.
147
Viewing a widget's details
Viewing a widget's details
To view a widget's details, just click or point to an item on the widget
nDepth widgets behave a lot like widgets in the Ops Center. To view a widget's details, point to that
widget, or click an item on that widget to view details and statistics about that item, like in the pie
chart widget show here.
Creating a search string from a widget item
You can use items in widgets, or any of nDepth's graphical tools, to create new search strings, or to
append existing search strings.
To create a new search string from a widget:
1. On the search bar, click
to delete the existing search string.
2. Click an item on a widget. A new search string associated with the widget item appears
in search box.
To append an existing search string with an item from a widget:
l
Click an item on a widget.
148
Chapter 9: Explore
In the search box, a new search string associated with the widget item is appended to
the existing search string.
Adding new nDepth Widgets
Use this procedure to add a new widgets to the nDepth explorer's Bar Charts, Line Charts, Pie
Charts, or Bubble Charts views.
To add new nDepth widgets:
1. Open the Explore >nDepth view.
2. Use the nDepth explorer toolbar to open the chart view you want to work with—Bar
Charts, Line Charts, Pie Charts, or Bubble Charts.
The corresponding view appears.
3. On the view's title bar, click the New Widget
icon.
The nDepth Widget Builder appears.
4. Complete the nDepth Widget Builder to configure the new widget. For completing
instruction on completing this form, see "Using the nDepth Widget Builder" on page 1.
The new widget appears at the bottom of the chart view. When configuring the widget,
if you chose the Save to Dashboard option, the new widget also appears at the bottom
of the nDepth Dashboard.
Editing nDepth Widgets
When needed, you can edit the configuration of any of the chart widgets. You can edit widgets from
the Dashboard or from any of the chart views.
149
Adding a Chart Widget to the nDepth Dashboard To edit a chart widget:
1. Open the Explore >nDepth view.
2. Use the nDepth explorer toolbar to open the Dashboard or the chart view you want to
work with.
The corresponding view appears.
3. On the widget you want to edit, click the Edit
icon.
The nDepth Widget Builder appears.
4. Use the nDepth Widget Builder to reconfigure the widget.
The updated widget appears at the bottom of the view. When configuring the widget, if
you chose the Save to Dashboard option, the new widget also appears at the bottom
of the nDepth Dashboard.
5. Click
to get the data for the widget's new configuration, so the Console can draw the
chart.
Adding a Chart Widget to the nDepth Dashboard
At any time, you can add a chart widget to the nDepth Dashboard. You can do this from any of the
chart views, or directly from the nDepth explorer toolbar.
To add a widget to the nDepth Dashboard from a chart view:
1. Open the Explore >nDepth view.
2. Use the nDepth explorer toolbar to open the chart view you want to work with.
3. In the view, locate the chart widget you want to add to the Dashboard.
4. On the widget, click the Add to Dashboard
button.
The widget is copied to the bottom of the nDepth Dashboard.
150
Chapter 9: Explore
Adding a main nDepth view to the nDepth Dashboard
Use this procedure to add a main nDepth view (such as Word Cloud, Tree View, or Result Details) to
the nDepth Dashboard. These views are there by default; but if you ever remove them from the
Dashboard, you can use this procedure to restore them.
To add a main nDepth view to the Dashboard:
1. Open the Explore >nDepth view.
2. On the nDepth explorer toolbar, click the view you want to add to the Dashboard.
3. On the view's title bar, click the gear
icon, and then click Add to Dashboard.
4. The view now appears as a widget at the bottom of the nDepth Dashboard.
Using Search Builder
Use Search Builder whenever you need to need to create complex search queries.
Search Builder is a visual tool that is used in conjunction with the options in nDepth's list pane. The
list pane lets you choose which elements you want to incorporate in your search, such as events,
event fields, specific event values, Tool Profiles, User-Defined Groups, constants, etc. You then
create the search by selecting the conditions you want to search for, and then dragging and dropping
those items into Search Builder's Conditions box.
For example, if you want to search for activity among your Admin Accounts, you don't have to type a
search with a long list of account names. Instead, you can just drag the appropriate User-Defined
Group or Directory Service Group into the Conditions box.
Search Builder lets you group search items, show AND/OR relationships between search items,
select specific values for search items, and select the appropriate operators for specific values.
151
Opening Search Builder
Opening Search Builder
1. Open the Explore >nDepth view.
2. On the nDepth explorer toolbar, click the Search Builder
icon.
Switching from the Search Bar to Search Builder
You can open Search Builder directly from the nDepth search bar by double-clicking it. This is handy
152
Chapter 9: Explore
if you have a complex search and the search box shows only a summary of the search, because it
lets you open Search Builder to see the search's complete configuration. Search Builder always
shows the configuration of the search that is currently in the search bar.
The search bar and the Search Builder show different views of the same search configuration
To switch from the search bar to Search Builder:
l
Double-click the search bar.
Search Builder appears, showing the configuration of the search that is in the search
bar.
153
Search Builder features
Search Builder features
This topic shows the main features of Search Builder.
Search Builder
154
Chapter 9: Explore
The following table describes each main features of Search Builder.
Item
Name
Description
Undo/Redo Click the Undo button to undo your last action. You can undo up to 50 steps.
Click the Redo button to redo a step that you have undone. You can redo up
to 50 steps.
Search bar
The search box shows the current state of the search you are building. If you
have a complex search, the search box shows its configuration as a
"summary." If you want to view the complete text of the search, switch the
search bar to Text Input Mode, which shows the current search configuration as a search string.
List pane
This “accordion” pane is called the list pane. It contains categorized lists of
the events, event groups, event variables, groups, profiles, and constants
that you can use when creating conditions for your filters.
Two of the lists apply only to nDepth:
n
The Refine Fields list summarizes all of the primary event details from
your search results. Rather than typing this information as a search string,
it is much easier (and less prone to error) to drag this information from the
Refine Fields list into the search box.
n
The Managers list includes each Manager and appliance that can be used
with nDepth for searching data.
Histogram
Use the histogram to investigate a particular interval, to move the period, to
pane
zoom in to a period to take a closer look, or zoom out to see high-level activity.
After configuring the search, click
155
to begin the search.
Search Builder features
Item
Name
Description
Conditions Use this box to define the conditions for the data that is to be reported by the
box
filter. You configure conditions by dragging items from the list pane into the
Conditions box. For more information, see "Configuring filter conditions" on
page 1.
This is the Add Group button. It appear at the top of every group box. Click it
to create a new group within the group box. A group within a group is called a
nested group.
Each group is subject to AND and OR relationships with the groups around it
and within it. By default, new groups appear with AND comparisons.
This is the Delete button. It appears at the top of every Group box. When you
point to a condition, it also appears next to that condition. Click this button to
delete a condition or a group. Deleting a group also deletes any groups that
are nested within that group.
Group
Individual groups (and the entire Conditions box) can be expanded or
collapsed to show or hide their settings:
n
Click to >expand a collapsed group.
n
Click to ▼ collapse an expanded group. The number that appears in
parentheses indicates how many conditions are contained in the group.
Once a group is properly configured, you may want to collapse it to avoid
accidentally changing it.
AND
The Conditions box includes AND and OR operators, so you can include
AND and OR relationships between your search conditions.
OR
n
Click the operator icon to toggle between AND and OR conditions.
156
Chapter 9: Explore
Configuring a Search with Search Builder
Use this basic procedure whenever you need to configure a search with Search Builder. The number
of possibilities are endless. They they all follow this basic procedure.
Feel free to experiment with these tools. Searches report information, so there is no harm done if you
create searches that are unusual or have logic problems. With a little practice, you will be able to
configure complex searches that report exactly the data you want.
To configure a search with Search Builder:
1. Open Search Builder.
2. In the list pane, locate the item you want to search for.
3. Do one of the following:
l
Drag the item from the list pane into the Conditions box.
l
Double-click the item to add it to the Conditions box.
Note: By default, the Conditions box includes a "this item exists" condition. To use it,
type or paste the search string you want to search for into the text box. Or you can
replace this condition by dragging an item from the list pane on top of it.
4. If the list item contains a variable field (such as a field for an IP address, a constant
value, or an empty text box), type the specific value you want to search for.
Note: Search Builder will show you if a particular configuration is invalid. If a condition
field is yellow (left), it means the search's current configuration is invalid. If a condition
field is red (right), it means the condition does not apply to the type of data you are
currently searching. For example, perhaps you are trying to search log messages with
conditions that are meant for event data.
157
Configuring a Search with Search Builder
A yellow condition field means the search
A red condition means the search configuration does
configuration is invalid.
not apply to the type of data you are searching.
5. Click
to create new groups, as needed.
6. Repeat Steps 2 and 3, dragging new items into the appropriate group boxes, as needed.
7. Select the appropriate AND and OR operators for each group to configure the search to
your needs.
8. When you are satisfied with the search conditions, click
You can click
to run the search.
at any time to stop a search that is in progress.
After a few moments, nDepth returns the search results. To see the search results, do
one of the following: l
Select an option from the nDepth explorer toolbar to view a graphical
version of the search results.
l
Open the Refine Fields list to see a categorized summary of the search
data.
l
Open the Result Details view to examine and explore the actual data.
158
Chapter 9: Explore
Utilities
The following table describes the key features of the Explore >Utilities view.
Name
History pane
Description
The History pane displays a record of your explorer viewing history. Selecting
an item in the history list displays the corresponding explorer event in the
Explorer pane.
Click the History button to alternately show and hide the History pane. When
needed, you can delete individual history items from the history list. The Reset
button lets you remove all items from the history list.
Utilities pane
The Utilities pane shows the explorers that are currently open. You can have
multiple explorers open at the same time.
Cascade button
This button arranges the open explorer windows so they appear in an
organized “cascade.” Their title bars are all visible, but the windows are all
stacked, one on top of another. The active explorer is at the front of the stack.
Respond menu
This menu lets you take action to respond to the event or event field that is the
subject of the active explorer. You can also use the Respond menu to take
action even when no explorer windows are open or active.
This menu behaves exactly as it does in the Monitor view’s event grid.
Explore menu
This menu contains options to open the other explorers. You can use it to
further explore the event message or event field that is the subject of the
active explorer. Or you can open a blank explorer to manually enter the item
you want to explore.
Explorer windows
The explorers you are working with appear as individual windows within the
Utilities pane. You can minimize, resize, and close each explorer window, as
needed.
Minimized
Any explorers that you have minimized appear at the bottom of the Utilities
explorers
pane as a title bar. Click a title bar to reopen that explorer.
159
Explorer Types
Name
◄>buttons
Description
Beginning from the active explorer window, you can use these buttons to cycle
through the other open explorer windows. Click ◄ to go to the previous
window. Click >to go to the next window.
Explorer Types
The Console contains the following explorers.
Explorer
Event
Description
The Event explorer, which can only be opened from the Monitor view, allows you to
view all of the events that are related to the event that is currently selected in the
Console. The Event explorer displays both sequential and concurrent events. That is,
you can view the events that occurred before, during, and after the event occurred. You
can also monitor events in real time, to see where they came from and where they are
going. Use this explorer when you need to know what caused the rule to fire.
Whois
The Whois explorer identifies the source of an IP address or domain name based on
how it is registered with domain and network authorities. It can tell you where
something is located physically in the world, and who actually owns the device you're
searching for. For example, use this explorer if you need to know who owns a domain
that corresponds to the IP that caused that rule to fire.
NSLookup The NSLookup explorer resolves IP addresses to host names, and host names to IP
addresses. Use this explorer to determine more information about a source or
destination IP address. For example, use this explorer when you need to know a name
that corresponds to that IP address that caused the rule to fire (it resolves a name like
“SolarWinds.com” to an IP address).
Traceroute The Traceroute explorer traces the network links from your host computer to the
destination you specify. That is, it shows you the “hops” between your computer and
the IP address of the destination. For example, use this explorer to determine the
network connections between yourself and an IP that caused the rule to fire.
160
Chapter 9: Explore
Explorer
Description
Flow
The Flow explorer lets you perform flow analysis to determine which IP addresses or
explorer
ports are generating or receiving the most network traffic. You can also analyze the
volume of data (in bytes or packets) that is transferring to or from a given IP address or
port number on your network. The explorer reports this information in easy-to-read
graphs and tables.
For example, if you see a strange IP address at the top of the Flow explorer’s activity
list, you can select the desired bar on the graph or a row in the table, and then choose
the Whois explorer from the Explore menu to find out what that the IP address is and
why it is transmitting so much data.
nDepth
nDepth is a powerful search engine that lets you search all of the event data or the original log messages that pass through a particular Manager. The log data is stored in
real time, as it originally occurs from each host (network device) and source (application or tool) that is monitored by the Manager.
Both Explore views have a Respond menu and an Explore menu that you can use with any of the
explorers:
l
The Respond menu lets you take corrective action on an event or other information
presented in an explorer, such as shutting down a workstation when you see a problem
reported in the Console.
l
The Explore menu lets you explore use any of the other explorers to investigate a
particular event, event detail, nDepth search result, or other explorer finding.
NSLookup Explorer
The NSLookup explorer is a network utility that is designed to resolve IP addresses to host names,
and host names to IP addresses. Use this explorer whenever you need to know a name that
corresponds to the IP address that caused the rule to fire. For example, it resolves a name like
“SolarWinds.com” to an IP address.
161
Traceroute Explorer
In the example shown here, we opened the NSLookup explorer for an event field that has an IP
address of 192.168.168.10 (which appears in the Search field). The explorer retrieved the
corresponding host name, which is grendel.corp.SolarWinds.com.
Opening the NSLookup explorer adds an item to the Explore view’s History pane. The new item has
a NSLookup explorer
icon.
Traceroute Explorer
The Traceroute explorer is a network utility that is designed to trace the network links from your host
computer to the destination you specify. Use this explorer whenever you need to determine the
network connections between yourself and the IP address that caused the rule to fire.
162
Chapter 9: Explore
In the example shown here, we used the Traceroute explorer on the IP address of 192.168.167.1. It
shows you the “hops” between your computer and that IP address. In this example, connecting to that
IP address required two “hops.”
Opening the Traceroute Explorer adds an item to the Explore view’s History pane. The new item has
a Traceroute explorer
icon.
Whois Explorer
The Whois explorer is a network utility that is designed to identify the source of an IP address or
domain name based on how it is registered with domain and network authorities. This explorer
contacts the central databases for IP addresses and domain names and returns the results of any of
your searches. It can tell you where something is located physically in the world, and who actually
owns the device you’re searching for. For example, use this explorer if you need to know who owns a
domain that corresponds to the IP address that caused a rule to fire.
163
Whois Explorer
The example on the left shows the results for an IP address. The example on the right shows the
results for the SolarWinds domain name, SolarWinds.com. From these, you can find out who owns
the IP address and where the server is hosted.
Opening the Whois Explorer adds an item to the Explore view’s History pane. The new item has a
Whois explorer
icon.
164
Chapter 9: Explore
Manually Exploring an Item
At any time, you can manually explore an IP address, host name, or domain name. To do this, open a
new, empty explorer, or by typing directly into the Search box of an explorer that is already open.
165
Chapter 10: Build
The Build menu contains three views: Groups, Rules, and Users. Use these views to configure the
related components on the LEM appliance. Since these components reside on the appliance, they are
universal and available to all console users from any computer. The sections in this chapter address
the features of each Build view in detail.
Groups
The Build >Groups view is used to create, name, configure, and organize groups of parameters. You
may then choose from these Groups when configuring filters (in Filter Creation) and rules (in Rule
Creation) to include or exclude the specific elements defined within each Group.
Each Group you create only applies to the Manager that is selected when you create the Group. If you
need a similar Group for another Manager, you must create it separately with that other Manager; or
you must export the Group, and then import it from the other Manager’s Groups grid.
Group types
You can use the Build >Groups view to create any of the Groups listed in the following table.
Group type
Description
EventGroups Event Groups are custom families of events that you can save as a Group. You can
then associate the Event Group with your rules and filters. For example, you might
create an Event Group made up of similar events that all need to trigger the same
response from the Console. When you apply the Event Group to a rule, the Console
implements the same rule when any one of the events in the Group occurs.
166
Chapter 10: Build
Group type
Description
Directory
If you use a directory service, such as Active Directory, you can connect LEM to
Service
the server that stores your existing directory service (DS) Groups. Once
Groups
connected, you can synchronize your DS Groups with LEM and apply them to your
rules and filters. DS Groups allow you to match, include, or exclude events to
specific users or computers, based on their DS Group membership.
In most cases, DS Groups are used in rules and filters as a type of white list or
blacklist for choosing which users or computers to include or to ignore. When used
by a filter, a DS Group lets you limit the scope of the events included in the filter to
those users or computers that have membership in a particular Group.
Email
Email Templates allow you to create pre-formatted email messages that your rules
Template
can use to notify you of an event.
State
State Variables are used in rules. They represent temporary or transitional states.
Variables
For example, you can create a State Variable to track the “state” of a particular
system, setting it to a different value depending on whether the system comes
online or goes offline.
Time of Day
Time of Day Sets are specific groups of hours that you can associate with rules and
Sets
filters. Time of Day Sets allow them to take different actions at different times of
day.
For example, if you define two different Time of Day Sets for “Working Hours” and
“Outside Working Hours,” you can assign different rules to each of these Time of
Day Sets. For instance, you may want a rule that automatically shuts down the
offending computer and events your system administrator via email.
Connector
Connector Profiles are groups of Agents that have common connector
Profiles
configurations. Most Agents in a network have only a few different network security
connector configurations. Connector Profiles allow you to group Agents by their
common connector configurations. You can then have your rules and filters include
or exclude the Agents associated with a particular profile.
167
Groups View Features
Group type
Description
User-Defined User-Defined Groups are groups of preferences that are used in rules and filters.
Groups
They allow you to match, include, or exclude events, information, or data fields
based on their membership in a particular Group. In most cases, User-Defined
Groups are used in rules and filters as a type of white list or blacklist for choosing
which events to include or to ignore.
Groups View Features
The topics in this section describe the key features of the Groups view, including its major sections,
the meaning of its grid columns, and how to refine its grid.
The following table describes the meaning of each column in the Groups grid.
Column
Description
The gear button in each row opens a menu of commands that you can perform on
the item that is currently selected in the grid. It has commands for editing,
cloning, exporting, and deleting the selected Group.
Type
Displays the type of the Group—Connector Profile, User-Defined Group, Time of
Day Set, etc.
Name
Displays the name of the Group.
Description
Displays a description of the Group. Pointing to this field displays the complete
description as a ToolTip.
Created By
Displays the name of the Console user who created the Group.
Created Date
Displays the date the Group was created.
Modified By
Displays the name of the Console user who last modified the Group.
Modified Date
Displays the date on which the Groups was last modified.
Manager
Displays the name of the Manager the Group is associated with.
168
Chapter 10: Build
Refining the Groups Grid
By default, the Groups grid shows every Group associated with each Manager the Console is
connected to. If the same Group is configured for more than one Manager, it appears in the grid
multiple times—once for each Manager it is associated with. To help you work more efficiently with a
long list of Groups, the Refine Results pane lets you apply filters to the Groups grid to reduce the
number of Groups it shows.
When you select options in the Refine Results pane, the grid refreshes to show only those items that
match the refinement options you have selected. The other items in the grid are still there; however,
they are hidden. To restore them, click the Reset button or select All in the refinement lists you are
using.
The following table explains how to use the Refine Results form.
Field
Reset
Search
Description
Click Reset to return the form and the Groups grid to their default settings.
Use this field to perform keyword searches for specific Groups. To search,
type the text you want to search for in the text box. The grid displays only
those Groups that match or include the text you entered.
Type
Select the type of the Group you want to work with (Connector Profile, UserDefined Group, Time of Day Set, etc.) to have the grid display only Groups of
that type.
Manager
Select a Manager to have the grid display only the Groups that are associated
with that Manager.
Created By
Select the name of the Console user who created the Group to have the grid
display only Groups from that user.
Created Date
Type or select a date range to have the grid display only Groups that were
Range
created on or within that date range.
Modified By
Select the name of the Console user who last modified the Group to have the
grid display only Groups modified by that user.
Modified Date
Type or select a date range to have the grid display only Groups that were
Range
modified on or within that date range.
169
Rules
Rules
The Console’s Build > Rules view is used to create, configure, and manage your rules. Rules are
used to monitor and respond to event traffic. They allow you to automatically notify or respond to
security events in real time, whether you are monitoring the Console or not. When an event (or a
series of events) meets a rule's conditions, the rule automatically prompts the Manager to take
action, such as notifying the appropriate users, or performing a particular active response (such as
blocking the IP address or stopping a particular process).
The Console ships with a set of pre-configured rules that you can begin using immediately. However,
you can use the view's Rule Creation connector to create your own custom rules and your own
variations on any existing rules.
Rules View Features
This topic describes the key features of the Rules view and the Rules grid, and explains how to
refine the Rules grid.
Rules Grid Columns
The Rules grid contains all policy rules that are configured for all Managers that are connected to the
Console. The Manager column indicates which Manager each rule applies to.
By default, the view shows the rules from the Custom Rules folder in the Folders pane. If you do not
have any custom rules, then click the Rules folder to list the rules that the Console ships with.
The following table describes the meaning of each column in the Rules grid. Columns are listed in
their default order, from left to right.
Column
Description
The gear button in each row opens a menu of commands that you can perform on
the item that is currently selected in the grid. These commands let you edit,
enable, disable, test, clone, and delete the selected rule.
170
Chapter 10: Build
Column
Enabled
Description
Indicates whether or not the rule is enabled and ready for use with your policies.
means the rule is enabled and is in active use.
means the rule is disabled, and is not in use.
Test
Indicates whether or not the rule is in test mode. When a rule is in test mode, it
causes events to appear in the Console, but it cannot perform any active
responses. This lets you see how the rule would behave when it is fully enabled,
but without risking any negative unintended consequences.
means the rule is in test mode.
means the rule is not in test mode.
Note: A rule must be Enabled before you can test it.
Name
The name of the rule.
Description
A description of the rule. Pointing to this field displays the complete description
as a ToolTip.
Folder
The name of the folder (in the Folders pane) in which the rule is stored.
Created By
The name of the Console user who created the rule.
Created Date
The date the rule was created.
Modified By
The name of the Console user who last modified the rule.
Modified Date
The date and time on which the rule was last modified.
Manager
The Manager the rule is associated with.
Refine Results Form
You can use the Refine Results form to refine the Rules grid. The form behaves like a search
engine, letting you apply filters to the Rules grid to reduce the number of rules it shows.
When you select options in the Refine Results pane, the grid refreshes to show only those items that
match the refinement options you have selected. The other items in the grid are still there; however,
171
Refine Results Form
they are hidden. To restore them, click the Reset button or select All in the refinement lists you are
using.
The following table explains how to use the Refine Results form.
Field
Reset
Description
Click Reset to clear the form. This returns the form and the Rules grid to their
default settings.
Search
Use this Search field to perform keyword searches for specific rules. To search,
type the text you want to search for in the text box. The grid displays only those
rules whose Name fields match or include the text you entered.
Enabled
Click this check box to show only those rules that are Enabled. Clear this check
box to show both Enabled and Disabled rules.
Test
Click this check box to show only those rules that are in test mode. Clear this
check box to show rules that are both in and out of test mode.
Manager
Select a Manager to have the grid display only the rules that are associated with
that Manager.
Created By
Select the name of the Console user who created the rule to have the grid display
only rules created by that user.
Created Date Type or select a date range to have the grid display only rules that were created
Range
within that date range.
Modified By
Select the name of the Console user who last modified the rule to have the grid
display only rules modified by that user.
Modified
Type or select the begin and end date range to have the grid display only rules that
Date Range
were modified on or within that date range.
The connectors in Rule Creation are very similar to those found in Filter Creation. However, filters
report event occurrences; rules act on them. There is no harm if you create a filter that is unusual or
has logic problems. But this is not the always case with rules. Rules can have unexpected and
sometimes unpleasant consequences if they are not configured exactly as you intend them to be.
Inexperienced users should use caution when creating rules. Creating filters is an excellent way to
familiarize yourself with the logic and connectors needed to create well crafted rules. You should only
172
Chapter 10: Build
begin configuring rules after you are at ease with configuring filters. Even then, always test your rules
before implementing them.
Rule Categories and Tags
The Rule Categories & Tags is the list of default rules categories and tags. To make it easier to find
and categorize, rules that apply to multiple purposes appear in more than one category and/or tags.
l
There are a default set of Rule Categories & Tags, and you can also create your own
customizable ones. New rule categories and tags that are created can be added or
removed from your list of categories/tags at any time.
l
Activity Types, Authentication, Change Management, Compliance, Devices, Endpoint
Monitoring, IT Operations and Security categories are available pre-defined categories
l
Rule templates have been separated into their own view and categorized into all of the
appropriate categories and tags, making them much easier to find and use
Rule Tagging
The Rule Tagging feature allows you to add, change, or remove tags from existing or newly created
rules. Rules may have several different categories and tags.
If you have a rule that you want to appear in several different category locations, you can use the tag
feature to have it display in those locations.
To tag a rule:
1. Select an existing Rule Template or create a new Rule.
2. Click the Add Tags... link
3. Select the categories and tags.There are many default tags or you can create a custom
tag to suit your needs.
4. Click OK
173
Users
Users
The Users view is used to manage the system users who are associated with each Manager. By
adding email addresses for each user, the Console can notify users of event conditions by email.
This topics in this section describe the key features of the Users view, the meaning of each column in
the Users grid, and how to refine the Users grid.
Users View Features
The following table describes the key features of the Users view.
Name
Description
Refine
This form behaves like a search engine. It lets you apply filters to the Users grid to
Results
reduce the number of users it shows.
Users grid
The Users grid displays all of the system users who are associated with each
Manager throughout your network.
174
Chapter 10: Build
Name
Description
Click this button to add a new user.
User
This pane displays detailed information about the user who is currently selected in
Information the grid, including the user’s role, password information, and contact information.
When editing a user, the User Information pane turns into an editable form.
Users Grid Columns
By default, the Users grid shows all users who are configured for all Managers that are monitored by
the Console. However, you can use the Refine Results form to refine the grid’s contents.
Column
Status
Description
n
Use the Edit command to edit the user’s settings and contact information.
n
Use the Delete command to delete the user.
Indicates if the user is currently logged on to the Console:
means the user is logged on.
means the user is not logged on.
User Name
Displays the name the user uses to log on to the Manager.
First Name
Displays the user’s first name.
Last Name
Displays the user’s last name.
Role
Displays the user role that has been assigned to the user.
Description
Displays a brief description of the user’s job function or responsibility.
Manager
States which Manager the user is associated with.
Last Login
States the date and time the user last logged on to the system.
175
Refining the Users Grid
Refining the Users Grid
By default, the Users grid shows all users for all Managers. The Refine Results form behaves like a
search engine, letting you apply filters to the grid to reduce the number of users it shows.
Field
Description
Reset
Click Reset to return the form and the Users grid to their default settings.
Manager
Select the Manager you want to work with. By default, the grid displays All
Managers.
Role
Select the user role you want to work with. By default, the grid displays All
roles.
Last Login
Type or select the begin and end date range to display the users who have
Date Range
logged in within that date range.
Viewing a User’s System Privileges
After selecting a user role, you can use the View Role button to view the system privileges that are
associated with the user’s assigned role.
To view a user’s system privileges:
1. Open the Build >Users view.
2. In the Users grid, double-click to user you want to work with. Below the grid, the User
Information pane displays the user’s current settings.
176
Chapter 10: Build
3. Click the View Role button. The Privileges form appears, showing the user’s system
privileges for his or her assigned role. This information is provided here for reference
purposes and cannot be changed.
4. When you are finished viewing the role’s privileges, click Close to return to the
Console.
177
Chapter 11: Manage
The Manage >Appliances view (also called the Appliances view) is used to add, configure, and
maintain each virtual appliance that is associated with and monitored by the LEM system.
Throughout this chapter, we will use appliances as a generic term to include:
l
Managers
l
Database servers
l
Logging servers
l
Network sensors
l
nDepth servers
This is primarily concerned with Managers, even though other appliances may appear in your
appliance list. Once a Manager is in place, you can use the Appliances view to do the following:
l
Use the Console to connect to and disconnect from a particular Manager.
l
Add a Manager’s Agents.
l
Configure rules, policies, and network security connectors that apply to each Manager.
Note: Commands in the Appliances view can take a while to execute, because they
must remotely access the Manager or network appliance.
Appliances View Features
This topic describes the key features of the Appliances view, the Details pane, the Appliances grid,
and its Status icons.
The following table describes the key features of the Manage >Appliances view.
178
Chapter 11: Manage
Name
Description
Appliances This grid lists all of the Managers and other network appliances that are monitored by
grid
LEM. You can use this grid to add, configure, or remove appliances, to configure
Manager connectors and Manager policy, and to connect to and disconnect from
Managers.
Click this button to add a new Manager or network appliance to the Console.
The gear button at the top of the grid opens commands that you can perform on multiple selections in the grid, and commands that do not require a grid selection. Click
this button to copy the grid's information about your Managers to the clipboard, so you
can paste it elsewhere, such as Microsoft Excel for analysis or the Remote Agent
Installer for updates.
Details
The Details pane displays an image of the appliance, as well as basic properties
about that appliance, such as its name, connection status, etc.
LEM provides the images for the last few (and next) generation of appliances. When
you add or configure a Manager, one of the options is to identify the model. Your
choice determines which picture, if any, is shown.
Properties
The Properties form is used to configure each Manager. It records the Manager’s
configuration settings, such as its login options, Agent licenses, its password
settings, and its ability to automatically send software updates to Agents.
Note: This form is only used for Managers. It is disabled for other types of
appliances.
Appliances Grid Columns
The following table briefly describes the meaning of each column in the Manage >Appliances view’s
Appliances grid.
179
Appliances Grid Columns
Column
Description
The gear button in each row opens a menu of commands that you can perform on
the appliance that is currently selected in the grid, such as Login, Logout,
Configure, Connectors (for connecting products to the appliance), Policy (for
assigning event distribution policy), and Delete.
The Login, Logout, Connectors, and Policy options apply only when you have a
Manager selected. If you have a Manager selected but are not connected, only the
Login, Configure, and Delete commands are available.
Status
The appliance’s current connection status:
means Connected/Logged In.
means Disconnected/Logged Off.
Icon
Used to differentiate between multiple Managers in the nDepth view.
Name
The name of the Manager or the appliance.
Type
The type of appliance—Manager, Database, Logging Server, or Network Sensor.
Version
States the version of the LEM Manager software.
Level
The model number for the appliance. It is directly related to the capacity and
performance of the appliance, ranging from Level to Level 4.
IP Address
States the Manager’s or the appliance’s IP address.
Port
The port number the Console is using to communicate with the Manager, the
network appliance, or the database.
Service Tag
The Dell serial number or registration number for this appliance. It uniquely identifies
this piece of equipment and its specific configuration properties.
Model
For Managers, states the model number.
User
For Managers, this column displays the user name that is currently logged on to that
Manager.
180
Chapter 11: Manage
Details Pane
The Details pane displays essential information about an appliance, such as its name, connection
status, IP address, etc. The image area can also display an image for each appliance, if you choose
to provide them.
To view an appliance’s details:
1. Open the Manage >Appliances view.
2. If needed, log into the Manager you want to work with.
3. In the Appliances grid, click to select the Manager or appliance you want to work with.
4. If the Details/Properties pane is not already open, click the “open pane” ▲ button at
the bottom of the window.
181
Configuring a Manager's Properties
The Details pane displays information about the Manager or appliance you have selected.
Field
Image area
Description
Displays an image of the Manager that is currently selected in the Appliances
grid, if the model number is known and an image is available.
Status
Displays the Manager’s or the appliance’s current connection status.
Name
Displays the Manager’s or the appliance’s name.
Type
Indicates the appliance type—Manager, Database Server, nDepth, Logging
Server, or Network Sensor.
Version
Displays the version of the Manager software.
Level
Displays the specific Manager appliance configuration level you have purchased.
IP Address
Displays the Manager’s or the appliance’s IP address.
Port
Displays the port number that the Console uses to communicate with the Manager
or the appliance.
Service Tag
Displays Dell’s assigned serial number for the Manager appliance. You can find
this number on the Manager information sheet that is provided with the appliance.
Model
When applicable, this field displays the Manager’s model number. If the model is
unknown, the model may be Other. If the appliance is not a Manager, this field is
empty.
Configuring a Manager's Properties
In the Properties pane, the Properties form is used to configure Managers. It records the Manager’s
configuration settings, such as its login options, Agent licenses, its password settings, its ability to
automatically send software updates to Agents.
Note: The Properties form is only used for Managers. It is disabled for other types of appliances.
1. At the top of the Console, click Manage >Appliances.
2. In the Appliances grid, click to select the Manager you want to work with.
182
Chapter 11: Manage
3. If the Details/Properties pane is not already open, click the “open pane” ▲ button at
the bottom of the window.
4. Complete Properties form. The following sections describe how to complete each tab.
Note: The Properties form automatically refreshes to display any changes that may
have occurred with the Manager since you opened the form. This ensures that you are
looking at the most current information.
The Login Tab
The Login tab has two main uses:
l
If the Login on console startup option is checked, the system uses this data to
automatically connect to the Manager whenever the Console is opened.
l
If you manually log in to a Manager from the Appliances grid, the system uses this
data to connect the Manager so you don’t have to complete the log in dialog box.
Use the following table to complete the Properties pane’s Login tab.
Option
Description
Username
Type your user name for logging into LEM.
Password
Type your password for logging into the Manager.
Login on
Select this check box to have LEM automatically log you into the Manager
console startup
upon opening the LEM Console. If you prefer to manually log on, then clear
this check box.
183
The Login Tab
Option
Description
Save Credentials
Select this check box to have the Console save the Manager’s user name
and password locally. The Console can then automatically provide them
whenever you log on to a Manager.
n
If you also select the Login on console startup check box, the Console
will automatically log on to the Manager whenever the Console is started.
n
If the Login on console startup check box is not selected, then the
Console automatically supplies the user name and password whenever
you manually log on to the Manager.
Reconnect on
Select this check box to have the Console automatically attempt to
disconnection
reconnect with the Manager, if the Manager becomes disconnected.
Try to reconnect
Type the number of seconds the Console is to wait before attempting a new
every xx seconds
connection with the Manager.
Timeout
Select this check box to have the Console quit its reconnection attempts
reconnection
with the Manager after a given number of tries, if the previous connection
attempts after xx
attempts have been unsuccessful.
tries
Then type the number of tries the Console is to attempt to reconnect with
the Manager before giving up.
Save
Click Save to save the configuration settings.
Cancel
Click Cancel to discard any configuration settings you may have entered
since the last time you saved.
184
Chapter 11: Manage
The License Tab
The License tab summarizes your available and allocated licenses.It is also used to activate your
SolarWinds LEM license.
The following table explains the License tab's remaining reference information.
Field
Total Nodes
Description
Displays the total number of nodes allowed by your SolarWinds LEM
license.
Total Unused
Displays the number of nodes that have not yet been allocated.
Nodes
Total Agent
Displays the number of nodes that have been allocated to LEM Agent
Nodes
devices such as workstations or servers.
Total Non-Agent
Displays the number of nodes that have been allocated to non-Agent
Nodes
devices such as firewalls or switches.
Maintenance
Displays the date your current maintenance contract with SolarWinds
Expiration Date
Support expires.
For more information on activating your SolarWinds LEM license, see "Going from evaluation to
production" on page 1.
License Recycling
Each time a VM desktop is created, an agent connects to LEM and a license is used. This continues
to happen as desktops are created and destroyed, eventually causing all licenses to be used up.
License recycling allows you to collect and reuse licenses from nodes that have not sent an event to
the LEM manager within a specified amount of time.
185
The Settings Tab
To enable license recycling:
1. Select the Enable license recycling checkbox.
2. Select a defined time frame from the options shown for when to recycle license if a
node has not sent an event.
3. Select when you would like the system to check for recyclable licenses.
4. Select the nodes to be checked.
The Settings Tab
The Settings tab defines the Manager’s password policy settings and global automatic update
settings. Global automatic updates allow the Manager to automatically send software updates to
Agents as new software becomes available.
Use the following table to complete the Properties pane’s Settings tab.
Option
Description
Password Policy
Minimum
Type or select the minimum number of characters that must be used on
Password Length
passwords for user account that are to connect to the Console and its
Managers. Passwords must have at least six characters, but no more than
40 characters.
186
Chapter 11: Manage
Option
Description
Must meet
Select this check box if passwords must meet the following complexity
complexity
requirements:
requirements
n
Passwords must not match or contain part of the user’s user name.
n
Passwords must be at least six characters long.
n
Passwords must contain characters from three of the following four
categories:
n
English uppercase characters (A through Z).
n
English lowercase characters (a through z).
n
Base 10 digits (0 through 9).
n
Non-alphanumeric characters (!, $, #, %, ^, etc.).
Remote Updates
Enable Global
This check box indicates whether or not the Manager can automatically
Automatic
update its Agents with new software.
Updates
n
Select this check box to have the Manager automatically issue the latest
software updates to qualifying Agents as they become available.
n
If this check box is not selected, then global automatic updates for this
Manager are Disabled. This means its Agents will not automatically
receive new software updates from the Manager.
Note that each Agent is also controlled by itsAutomatic Updates setting
on the Agents grid (see "Changing an Agent’s Remote Updates setting" on
page 1). The Agent’s Automatic Updates setting will not work if you do not
also select this Enable Global Automatic Updates check box.
Here is how it works. If you do not select this check box, but you have an
Agent set to automatically receive updates, nothing will happen. The Agent
will not receive its updates. But if you do select this check box and if you
have an Agent set to automatically update, the Agent will automatically
receive updates when they become available.
187
Configuring Event Distribution Policy
Option
Description
Maximum
Select how many Agents the Manager can update at one time. The default
Concurrent
value is 10.
Updates
If the number of Agents that require updates is greater than the value you
have entered here, the remaining Agents will be queued for updating as
soon as an update slot becomes available.
Explorer Command Agent
Current Default
Select the default Agent for performing SolarWinds explorer functions, such
Agent
as NSLookup and Whois. For best results, choose an Agent that is
normally online and will return the expected results.
Connection
Set the value for the amount of time before a timeout request is initiated.
Requests
Configuring Event Distribution Policy
The topics in this section explain how to configure event distribution policy for Managers. Event
distribution policy lets you control how events are routed through the LEM system. With the Event
Distribution Policy window, you can choose—at the event level—which events are to go to the
LEM Console, and to the local LEM database.
Practical Uses for Event Distribution Policy
Event distribution policy has several practical uses that are explained in the following examples.
l
Many data sources generate events that are difficult to control at a granular level; or,
they generate events of little or no value. You are better off removing these events from
the system to reduce the volume and noise being sent to your Console and database.
By configuring event distribution policy, you can disable (exclude) specific event types,
at the event level, from being sent to any or all of these destinations. The data sources
will continue to generate these events, so you can always enable them at any time.
Until then, the selected system destinations will ignore them.
188
Chapter 11: Manage
l
There may be events that you want to monitor in the LEM Console, but do not need for
long-term storage and reporting. In this case, you can use event distribution policy to
disable database storage for certain events, while enabling processing by the Console.
Opening the Event Distribution Policy Window
1. At the top of the LEM Console, click Manage >Appliances.
2. In the Appliances grid, click the gear
button for the Manager you want to work
with, and then click Policy. The Event Distribution Policy for [Manager] window
appears.
If you open the Event Distribution Policy window while another user is currently
using it, a Policy Locked message appears. You can choose to take over the window,
or to view it in read-only mode. Any Full User can unlock any other user.
189
About the Event Distribution Policy Window
About the Event Distribution Policy Window
The following table describes the key features of the Event Distribution Policy window.
Item
Event/Field
Description
The window’s grid is a hierarchical node tree. The Event/Field column lists event
categories and event types. Opening an event category node displays the lowerlevel event types that are associated with that category. Click a node ▼ to open
it, showing its lower-level event type nodes. Click the node again to close it,
hiding its lower-level event type nodes.
Check Boxes
The check boxes in the grid’s Console, Database, Warehouse, and Rules
columns indicate whether or not a particular event type (or entire event category)
is to be sent to the LEM Console, or to the local database. A check mark means
the event type will be routed to that particular destination. An empty check box
means the event type will not be routed to that destination.
190
Chapter 11: Manage
Item
Description
Export Button The Export button exports a Manager’s event policy to a spreadsheet file.
Click the gear
button to use the
Apply State to Branch
command. This
command pushes, or propagates, the selected event node’s check box settings
down to the related, lower-level event types in the node tree hierarchy.
Description
The Description box provides a description of the event type or event category
that is currently selected in the grid.
Configuring Event Distribution Policy
The Event Distribution Policy window makes configuring your event distribution policy a
straightforward matter. First, you find the event types you want to work with, and then you select
check boxes to determine whether or not those events types are to be routed to a particular
destination.
To configure event distribution policy:
1. Open the Event Distribution Policy window for the Manager you want to work with.
2. In the Event/Fields grid, locate the event type you want to work with. You can do this
several different ways:
l
In the Event/Field list, click any node to show its lower-level event type
nodes.
l
In the Event/Field list, double-click any event type row to show its lowerlevel event type nodes.
3. Once you have found the event type you want, configure it as follows:
l
Select the row’s Console check box to have that event type appear in
the LEM Console.
l
Select the row’s Database check box to have that event type stored in
the local database.
191
Pushing event policy to lower-level event types
l
Clear a check box to exclude the event type from that particular
destination.
4. To save or cancel your changes, do one of the following:
l
Click OK to save your event distribution policy changes, close the
window, and return to the Console.
l
Click Apply to save your changes, but keep the window open so you can
continue working.
l
Click Cancel to close the window without saving your changes and
return to the Console.
Upon saving, the Applying Changes status bar appears. Updating the Manager with
the new event policy configuration changes can take anywhere from 30 seconds to
several minutes.
Pushing event policy to lower-level event types
With the Apply State to Branch command, you can propagate or “push” event distribution policy
settings from a high-level event type to each of its lower-level “child” event types in the event
hierarchy.
For example, let’s say you select the topmost Security Event row and then select its Console and
Warehouse check boxes. Clicking Apply State to Branch assigns the same Console and
Warehouse check box settings to every child item that is associated with Security Event. Upon
saving, this policy causes all event types that are child items of Security Event to begin sending
events to all user’s Consoles and your data warehouse.
To push policy configure event distribution policy downward:
Open the Event Distribution Policy window for the Manager you want to work with.
1. In the Event/Field grid, locate the event type that is a “parent” to the event types you
want to configure.
192
Chapter 11: Manage
2. In the parent row, define the policy by selecting or clearing the Console, Database,
Warehouse, and Rules check boxes.
3. Click the row’s gear
button and then click Apply State to Branch.
The Console pushes, or propagates, the parent row’s check box settings down to each
of its lower-level event types in the node tree hierarchy.
l
If you select one or more of the parent row’s check boxes, the Console
selects the same check box settings for each related lower-level event
type in the node tree. Upon saving, the policy begins sending the “child”
event types to the selected destinations.
l
If you clear any of the parent row’s check boxes, the Console disables
the same check box settings from each related lower-level event type in
the node tree. Upon saving, the policy stops sending those event types
to those destinations.
4. Click OK to save your changes. The Console implements the new policy.
Exporting a Manager’s Event Policy
When needed, you can export a Manager’s event policy to a spreadsheet file. You may want to do
this for any of the following reasons:
l
You can view and manipulate the policy information in a spreadsheet application, such
as Microsoft Excel.
l
You can provide SolarWinds with a copy of your policy information for technical support
or troubleshooting purposes.
To export a Manager’s policy:
1. Open the Event Distribution Policy window for the Manager you want to work with.
2. At the top of the window, click Export. The Save As form appears.
3. In the Save In box, select the folder you want to export to.
193
Nodes
4. In the File Name box, type a name and file type for the exported file. In the file name,
include a file type of .xls to save the file as a Microsoft Excel spreadsheet.
5. Click Save to save the file. The Console saves the file to the folder and with the file
name you specified. You may now view the Manager’s policy information in a
spreadsheet file, such as Excel.
Nodes
The Manage >Nodes view displays the Agents that are monitored by each of your Managers.
Once you have installed the Agents on your client PCs, you can use the Nodes view to do the
following:
l
Add a new Node or Scan for a New Node.
l
Integrate the Agent’s network security connectors with the LEM system. You are
actually integrating the Agents themselves, but the Agents forward messages from the
network security connectors to the Manager for event processing.
l
Connect an Agent to a Manager.
l
View the name, connection status, event status, and IP address of each Agent.
l
Determine whether or not the Agent is using USB-Defender.
l
View an Agent’s properties.
l
Control an Agent’s automatic update settings for installing new software from the
Manager.
l
Actively respond to events that affect Agents.
l
Copy Agent information to the clipboard for use with the Remote Agent Installer, or for
analysis with programs such as Microsoft Excel.
l
Remove an Agent from a Manager.
Nodes View Features
This topic describes the key features of the Nodes view and the Nodes grid, and how to refine the
Nodes grid.
194
Chapter 11: Manage
The following table describes the key features of the Manage >Nodes view.
Name
Description
Sidebar
Click the Sidebar button to alternately hide and open the Refine Results pane.
Refine
By default, the Nodes grid shows all Nodes that are associated with all of your
Results
Managers. The Refine Results pane lets you apply filters to the Nodes grid to reduce
pane
the number of Nodes it shows. This way, you can show only those Nodes that are
associated with a particular Manager, Connector Profile, status, etc.
Nodes
The Nodes grid lists all of the Agent and Non-Agent nodes that are associated with
grid
each Manager and appliance that is monitored by the LEM Console. You can also Add a
New Node and Scan for a New Node with the buttons in the toolbar.
Respond Use the Respond menu to perform an action on a particular Agent. For example, you
menu
can send an Agent a pop-up message, or shut the computer down.
This menu behaves exactly as it does in the Monitor view’s event grid.
Remote
This menu lets you control the Agent’s automatic update status. Remote updates are a
Updates
way for the Agent to automatically accept updated Agent software from the Manager
menu
when new software becomes available.
The gear button at the top of the grid opens commands that you can perform on multiple
selections in the grid, and commands that do not require a grid selection. It includes commands for copying Agent information and for deleting Agents.
195
Nodes Grid Columns
Nodes Grid Columns
The following table briefly describes the meaning of each column of the Nodes grid.
Column
Description
Add Node
Displays a wizard to assist you in adding Nodes.
Scan for New Nodes
Scans syslog data that has been sent to LEM.
The gear button in each row opens a menu of commands that you can
perform on the item that is currently selected in the grid.
n
The Connectors command lets you configure the Agent’s connectors.
n
The Delete command lets you delete Agent licenses from a Manager.
n
The Copy command lets you copy Agent information to the clipboard
for use with the Remote Agent Installer, or for analysis in another
program, such as Microsoft Excel.
Status
The Agent’s current connection status:
Icon
Status
Description
Enabled
Agent is Connected to a Manager.
Disabled
Agent is Not Connected to a Manager (that is, it is
an open license).
Node IP
The Node’s IP address.
Node Name
The name of the system where the Node is installed. Typically, this is the
computer name or host name assigned to the Note.
Agent Node
The LEM Manager or Agent on which the node's logs are stored.
Note: This column is blank for LEM Agents.
196
Chapter 11: Manage
Column
USB
Description
The Nodes’s current USB-Defender status. An icon ( ) means USB Defender is installed on the Node. If no icon is present USB Defender is
not installed on the Node.
Note: This column is blank for non-Agent nodes.
Version
The version number of the Node software.
Note: This column is blank for non-Agent nodes.
OS
The operating system of the computer where the Node is installed.
Note: This column is blank for non-Agent nodes.
Profile
The Connector Profile associated with the Node, if applicable.
Note: This column is blank for non-Agent nodes.
FIM
The Nodes current FIM status.
Icon
Status
Description
Operational At least 1 FIM Connector for this Node has been created and is running. Connector is configured and running.
No
Non-oper-
At least 1 FIM Connector or FIM Connector Profile
ational
configured for this Node and driver disabled
Not con-
Node is not assigned to a FIM Connector or FIM Con-
icon figured
nector Profile. Connector is not configured and not
running.
Updates Enabled
This field indicates whether or not the Node is enabled for receiving
remote updates.
Icon
Status
Description
Enabled The Node is enabled for receiving remote updates.
Disabled The Node is disabled from receiving remote updates.
197
Adding a Syslog Node
Column
Update Status
Description
This field indicates the Agent’s current software update status.
Icon
Status
Current
Description
The Agent's software is current.
Outdated The Manager has an update newer than the version
being used by this Agent.
Updating The Manager is currently sending an update to this
Agent.
Queued
The Agent is waiting to be updated while other Agents
get updated. The number of Agents that can be
updated at one time is determined by the Maximum
Concurrent Updates setting in the Appliances
view's Settings tab.
Unknown The Manager does not yet know the Agent’s software
status.
Canceled The user canceled updating during update process.
Error
An error has occurred while updating.
ID
The Agent’s unique identification number.
Manager
The Manager that this Agent is connected to. An Agent can only be
connected to one Manager.
Install Date
The time and date the Agents was first installed and connected to the
Manager.
Last Connected
The time and date the Agent was last connected to the Manager.
Adding a Syslog Node
The Add Node button displays a wizard that walks you through adding a Node to monitor a network
device. The wizard locates the new node and then recommends an appropriate connector.
198
Chapter 11: Manage
1. Click the Add Node button.
2. Select Syslog node.
3. Enter the IP Address of the node.
4. Select the Node Vendor from the list.
5. Configure the node so LEM can receive syslog messages. If you need help, click the
links provided for enabling specific vendor devices.
6. Select the I have configured this node so that LEM can receive its Syslog
messages check box.
7. Click Next and LEM then scans for new devices.
Scan for New Nodes
The Scan for New Nodes button scans the syslog data that has been sent to LEM and detects new
nodes. You can use this if you have enabled many devices to send syslog to LEM and want to add
and configure them all at once.
To scan for a new node:
1. Click the Scan for New Nodes button.
Note: Scanning for new nodes may take a few minutes. If it does, you'll get a message
that the scan is continuing in the background.
2. A New Connector(s) Found message displays as data is found from new devices.
3. Click View Now to add the recommended connectors for these devices.
4. Click Next.
Note: Click the Summary tab to display a summary of the nodes and connectors that
will be added or updated to LEM as a result of the Scan for New Nodes.
5. Click Finish. Events from the new nodes appear in the LEM console as they are
received from the devices.
199
Adding Nodes Manually
Adding Nodes Manually
1. To configure additional nodes, navigate to Manage > Nodes to see a listing of all the
nodes being monitored by LEM.
2. Select the desired node, then click the gear button next to it and select Connectors.
Here you can search agent nodes by category or use the search box to find a node by
keyword, such as DNS.
3. Click the gear
icon next to the search result and select New to create a new
node.
4. Configure the new node and select Start to start the node.
Refining the Agents Grid
By default, the Agents grid shows every Agent that is associated with every Manager that is
monitored by the LEM Console. To help you work more efficiently with a long list of Agents, the
Refine Results pane lets you apply filters to the Agents grid to reduce the number of Agents it
shows.
When you select options in the Refine Results pane, the grid refreshes to show only those items that
match the refinement options you have selected. The other items in the grid are still there; however,
they are hidden. To restore them, click the Reset button or select All in the refinement lists you are
using.
The following table explains how to use the Refine Results form.
Field
Reset
Description
Click Reset to clear the form. This returns the form and the Agents grid to their default
settings (showing all Agents for all Managers.)
Search
Use this field to perform a keyword search for a specific Agent in the Name field. To
search, type the text you want to search for in the text box. The grid displays only those
Agents that match or include the text you entered.
200
Chapter 11: Manage
Field
Description
Manager Select the Manager you want to work with. Select All to include Agents from every
Manager.
Profile
Select the Connector profile you want to work with. Select All to include Agents from
every Connector Profile.
Node
Select whether you want to view Agent or Non-Agent nodes.
Status
Select the connection status of the Agents you want to work with (Connected or Not
Connected). Select All to include both.
Version
Select the version of the software on the Agent. Select All to include Agents of every
version.
OS
Select the operating system (OS) of the computer the Agent is installed on. Select All to
include all operating systems.
USB
Select the Agent’s USB-Defender status (Installed or Not Installed). Select All to
include both.
201
Chapter 12: Access Controls
This chapter discusses procedures for working with users and managing restrictions for LEM Reports
and the LEM desktop console.
Adding New Users
The following procedure explains how to add and configure new users. You add each new user by
opening and completing the User Information form. This form records each user’s individual
settings. It also allows you to record a user’s email addresses, which the Manager can use to notify
the user when an appropriate alert event occurs.
Starting with LEM version 5.4, the Build > Users component of the LEM console integrates with
Microsoft Active Directory. Import domain users or groups to create LEM console users with domain
credentials.
Note: Before you import any user into LEM, be sure the account in Active Directory includes a valid
email address if you plan to send that user email messages for LEM rules. After you import a user,
you cannot change or add the email address for the LEM user account.
To add a new user:
1. Open the Build >Users view.
2. At the top of the Users grid, click Add User. Below the grid, a blank User Information
form appears. A completed form is shown here for reference purposes.
202
Chapter 12: Access Controls
3. Complete the User Information form, as described in the following table.
Field
Manager list
Description
In the upper-right corner of the form, select the Manager this user will
be associated with.
User Name
Type the user’s system user name. This is the name the user will
use when logging into the Manager.
Note: User names admin_role,audit_role, and reports_role
cannot be used.
First Name
Type the user’s first name.
Last Name
Type the user’s last name.
Password
Type the user’s system password. This is the password the user will
use when logging into the Manager. This can be an initial system
password or a temporary password that is assigned to replace a
forgotten password.
If you have the Must Meet Complexity Requirements option
checked in the Appliances view's Settings tab, the Console
enforces the following password policy: n
Passwords must have a minimum of six characters. Spaces
are not allowed.
n
Passwords must have two of the following three attributes: n
At least one special character
n
At least one number
n
A mix of lowercase and uppercase letters.
Confirm
Type the password a second time to verify that you entered it
Password
correctly.
203
Adding New Users
Field
Role
Description
Select the appropriate role for this user:
n
Administrators are users who have full access to the
system, and can view and modify everything.
n
Auditors are users who have extensive view rights to the
system, but cannot modify anything other than their own
filters.
n
Monitors are users who can access the Console, but cannot
view or modify anything, and must be provided a set of
filters.
n
Contacts are users who cannot access the Console, but do
receive external notification.
n
Guests are users who have extensive view rights to the
system, but cannot modify anything other than their own
filters.
View Role
After selecting a user role, you can click the View Role button to
open the Privilegesform, which shows the system privileges for that
role. This information is provided here for reference purposes and
cannot be changed.
Description
Type a brief description (up to 50 characters) of the user’s title,
position, or area of responsibility.
204
Chapter 12: Access Controls
Field
Description
Contact
Use this section to record the user’s email addresses, so the
Information
Manager can notify users of network security events by email. You
can add as many email addresses as you need for each user.
It is always a good idea to test each email address to confirm that it
has been entered correctly and that it works properly.
To add the user’s email address:
1. Click the “add” button.
2. In the box that appears (shown here), type the user’s
email address and then click Save.
3. The email address appears in the Contact
Information section.
4. Repeat this procedure as needed, to record each email
address that applies to the user.
To test an email address:
In the User Information form’s Contact Information area, click the
test
button for the email address you want to test.
Verify that the user has received the email test message. If the
message was not received, you may need to edit email address.
Note: In order for the Manager’s notification system to work, you
must have the Manager’s Email Connector Settings set up
properly..
4. When you are finished, click Save to save the new user; otherwise, click Cancel.
To create a user from an Active Directory user:
1. Open your LEM console and log in to your LEM appliance.
205
Adding New Users
2. Configure the Directory Service Query connector on your LEM appliance if you
haven't already. For additional information, see the KB article "How to Configure the
Directory Service Query Tool".
3. Click Build and then select Users.
4. Click the plus
button, and then select Directory Service User.
5. Select the Organizational Unit and Group where you want to add the user.
6. Select the user you want to add from the Available Users column, and then click Select
User.
7. Select a LEM Role in the User Information form. Click View Role to see details about
each role.
8. Enter a user description. If you change the Description field, your changes only apply to
the LEM user account, not the Active Directory account.
9. Click Save.
To create users from an Active Directory group:
1. Open your LEM console and authenticate to your LEM appliance.
2. Configure the Directory Service Query connector on your LEM appliance if you
haven't already. For additional information, see the KB article "How to Configure the
Directory Service Query Connector".
3. Click Build , and then select Users.
4. Click the plus
button, and then select Directory Service Group.
5. Select the Organizational Unit to which the group you want to add belongs.
6. Select the group you want to add from the Available Groups column, and then click
Select Group.
7. Select a LEM Role in the User Information form. Click View Role to see details about
each role.
Note: If you want members of this group to have different LEM user roles, change their roles
individually after you complete this procedure.
206
Chapter 12: Access Controls
8. Enter a description for these users if you want. If you change the Description field, your
changes only apply to the LEM user accounts, not the Active Directory accounts.
9. Click Save.
Editing User Settings
Follow this procedure to edit an existing user’s configuration settings. You can also edit the user’s
email addresses to make corrections or keep them current. If an email address becomes obsolete,
you can also easily remove it.
Only the description and the role can be edited for Active Directory users.
To edit a user’s settings:
1. Open the Build >Users view.
2. In the Users grid, do one of the following: l
Double-click the user you want to work with.
l
Click to select the user you want to work with. Then click the row’s gear
button and click Edit.
Below the grid, the User Information pane displays the user’s current settings and
becomes an editable form.
3. Make the necessary changes to the User Information form.
4. Click Save.
To delete a user’s email address:
1. Open the Build >Users view.
2. In the Users grid, click to select the user you want to work with.
3. Click the row’s gear
button and then click Edit.
4. In the User Information form’s Contact Information section, click the delete
button next to each email address you want to delete. The system removes that
207
Deleting Users
particular contact information.
5. Click Save.
Deleting Users
Follow this procedure to delete a user from a Manager.
To delete a user:
1. Open the Build >Users view.
2. In the Users grid, click to select the user you want to delete.
3. Click the gear
button and then click Delete.
Note: You cannot delete the admin user from the system.
4. At the Confirmation prompt, click Yes to delete the user; otherwise, click No. The
user is removed from the Users list. This user is no longer authorized to use the
Manager.
Restricting LEM Reports
Access to LEM Reports is completely restricted by default. In order to run reports in LEM Reports for
the first time, complete one of the procedures to specify which computers have access to your LEM
database. Add the computer on which you want to run reports to the list of "allowed" computers on
your LEM Manager, or remove all LEM Reports restrictions.
To configure your LEM Manager to allow specific computers to run LEM Reports:
1. Log in to your LEM virtual appliance using either the vSphere "console" view, or an
SSH client such as PuTTY.
2. At the cmc> prompt, enter service.
3. At the cmc::scm# prompt, enter restrictreports.
4. Press Enter.
5. Separate each IP address of the computers you want to run LEM Reports with a space.
208
Chapter 12: Access Controls
Note: Your entry overrides any previous entries, so ensure the list you provide is complete.
6. Enter y to confirm your entry.
7. Enter exit to return to the cmc> prompt.
8. Enter exit to log out of your LEM virtual appliance.
To remove all LEM Reports restrictions:
1. Log in to your LEM virtual appliance using either the vSphere "console" view, or an
SSH client such as PuTTY.
2. At the cmc> prompt, enter service.
3. At the cmc::scm# prompt, enter unrestrictreports.
4. Press Enter.
Note: Unrestricting LEM Reports make the LEM database accessible on any computer on your
network running LEM Reports.
5. Enter exit to return to the cmc> prompt.
6. Enter exit to log out of your LEM virtual appliance.
209
Chapter 13: Utilizing the Console
The LEM console displays normalized information about the events on your monitored devices in real
time. The sections in this chapter address how to use the LEM console to view, respond to, and
search for these events on a day-to-day basis. Unless otherwise stated, the functionality described in
this chapter is identical between the web and desktop consoles.
Filters
The topics in this section explain how to create and manage event filters.
Creating Filters for Real-time Monitoring
You can create custom filters from the Monitor view in your LEM Console to display real-time traffic
from your monitored computers and devices.
To create a filter in your LEM Console:
1. Open the LEM Console and log in to your LEM Manager as an administrator or auditor.
2. Click the Monitor tab.
3. Click the
button at the top of the Filters pane, and then select New Filter to open
Filter Creation.
4. Enter a Name and Description (optional) at the top of the Filter Creation view.
5. To modify the number of events your filter can store in memory, edit the Lines
Displayed value next to the Name field. The default value is 1000.
6. Drag one of the following elements into the Conditions box.
l
Events: Drag a single Event into your Conditions to filter for any instance of the
Event you specify. This type of Condition does not require a value.The field at
the top of the Events list is a search box.
l
Event fields: Drag an Event field into your Conditions to filter for any Event that
210
Chapter 13: Utilizing the Console
contains the value you specify.
Features of the List Pane
The list pane is the “accordion” list on the left side of Filter Creation, Rule
Creation, and the nDepthexplorer.It contains categorized lists of events,
Event Groups, event fields, Groups (from the Groups grid), profiles, and
constants that you can use when creating conditions for your filters, rules, and
search queries.
If more than one Manager is linked to the Console, each item in the list pane
lists the Manager it is associated with. Therefore, some list items may appear
to be listed multiple times. But in reality, they are listed once for each
Manager. Events are universal to all Managers, so they do not show a
Manager association.
The following table describes the contents of each list in the list pane. They
are listed in the order in which they appear. If a list does not apply to a
particular view, then it will not appear in that view.
211
Filters
List
Description
Refine
This list only appears with nDepth. It categorizes and lists the top 100 data details
Fields
for each listed field found within your nDepth search results. The details change,
depending on whether you are searching event data or log messages. You can use
these details to create, refine, or append nDepth search conditions.
n
The data categories are expanded by default.
o
Click ▼ All to collapse all of the category nodes.
o
Click >All to open all of the category nodes.
o
Click >next to a category to open that category.
o
Click ▼ next to a category to close that category.
o
The number in parentheses next to each category indicates how many
unique details are in that category.
o
The number next to each detail indicates how many times that detail is
reported in the search result's data.
n
Click the ABC button to sort the details within each category alphabetically.
n
Click the 321 button to sort the details within each category by frequency—the
items that occur most often appear first within each category.
n
Double-click a detail to add that detail to the search string.
n
Drag a detail into the search bar to include that item in the search string.
n
When using Search Builder, drag a detail into the Conditions box to add that
item to the search string.
212
Chapter 13: Utilizing the Console
List
Managers
Description
This list only appears in nDepth. It includes the various appliances that are being
monitored by the Console.
Use this list to select the Manager on which you want to perform an nDepth search.
If you are storing the original event log data on a separate nDepth appliance, then
you would select that appliance here when you want to search that data.
n
In Drag & Drop Mode, you can drag an item from this list into the search box to
include that item in the search string.
n
When using Search Builder, you can drag an item from this list into the
Conditions box.
Events
The Events list includes all of the Console’s event types. You can show the events
either of two ways—as a hierarchical node tree, or as an alphabetized list. Both
views contains the same events—they are just presented differently.
You can search either view. To do so, begin typing a word or phrase in the box at
the top of the list. The Events list will refresh to show any event types that include
your word or phrase. Then use the list to select each event type that you want to
include as a filter condition or a rule correlation.
In the Events list, click this button to display the list as a hierarchical node tree.
This is the Events list's default view. This view also has the following attributes:
n
Lower-level event types are hidden by nodes in the event tree. To open a node,
click the >icon. This displays the node’s next level of events.
n
Using the search box displays the event and its parent event types, so you can
see how the event appears in the event hierarchy.
In the Events list, click this button to list event types alphabetically, regardless of
their position in the hierarchy.
Event
The Event Groups list displays pre-configured groups of events that can be used to
Groups
initiate a particular event filter condition or rule correlation. The top box lists the
names of Event Groups. The Fields list displays those fields that apply to the
Event Group that is currently selected.
213
Filters
List
Fields
Description
The Fields list displays those data fields that apply to whichever event is selected
in the Events or Event Groups list.
User-
This list displays the different preconfigured User-Defined Groups that apply to the
Defined
Managers. User-Defined Groups are groups of preferences used in rules and event
Groups
filters that allow you to match, include, or exclude events, information, or data fields
based on their membership with a particular Group. In most cases, User-Defined
Groups are used in rules as a type of white list or blacklist for choosing which
events to include or to ignore.
User-Defined Groups are created in the Group Builder.
Connector
This list displays all the different Connector Profiles that apply to the Managers.
Profiles
Connector Profiles are groups of Agents that have common Connector
configurations. You can use them to have your rules and filters include or exclude
the Agents associated with a particular profile.
Connector Profiles are created in the Groups grid.
Directory
This list displays the Directory Service Groups that are synchronized with the
Service
Managers. Directory Service Groups are preconfigured groups of network
Groups
computers and system users that you can use in rules and filters. They allow you to
match, include, or exclude events to specific users or computers based on their
Group membership.
Directory service groups are synchronized to LEM through the Groups grid. .
Time Of Day This list displays all of the different Time Of Day Sets that apply to the Managers.
Sets
Time Of Day Sets are specific groups of hours that you can associate with rules
and event filters. You can use them to have your filters include or exclude
messages that occur during the hours associated with a particular Time of Day Set,
or to have your rules take different actions at different times of day.
Time of Day Sets are created in the Groups grid.
Note: This list does not appear in nDepth.
214
Chapter 13: Utilizing the Console
List
Description
State
This list displays all of the different State Variables that apply to this Manager. The
Variables
upper box lists the names of State Variables. The lower box lists the various fields
that apply to whichever State Variable is selected in the upper box.
State Variables are created within the Groups grid.
Note: This list only applies to rules.
Subscription This list displays all of the Console user names, and the Manager each user is
Groups
currently associated with. Each name in the list represents the list of rules that each
individual user is subscribed to. By adding a Subscription Group to a filter, you can
build the filter so that it only displays events messages that are related to specific
rules that a particular user is interested in (or “subscribed to”).
Note: This list only applies to filters and nDepth searches.
Constants
This list displays the three types of constants that rules and filters can use for
comparing event data—text, number, or time.
Actions
This list displays all of the active responses that a rule can initiate, such as sending
an email message, sending a pop-up message, blocking an IP address, etc.
Note: This list only applies to rules.
Notifications This list includes the various notification methods the Console can use to announce
an event message for the filter. You can have the Console display a pop-up
message, display the new event as “unread,” play a sound, or have the filter name
blink. If needed, you can configure multiple notification methods for the same filter.
Note: This list only applies to filters.
Features of the Conditions Box
Use the Conditions box to configure the conditions that determine which events a filter is to report.
Conditions are the various rules that state when the filter is to display an event message.
To define conditions, you drag event variables from the Events, Event Groups, and Fields lists into
the Conditions box. Then use the Conditions connectors (described below) to configure how these
215
Features of the Conditions Box
variables are to compare to other items, such as Time Of Day sets, Connector Profiles, User-defined
Groups, Constants, and other event fields.
You can also compare groups with AND/OR conditions. AND conditions state which events must all
occur together before the filter shows an event. OR conditions state that if any one of several
conditions occur, the filter shows the event.
The combined conditions dictate when the event filter is to display an event. The filter ignores (and
does not display) any events that do not meet these conditions.
The Conditions Connectors allow you to configure relationships between events in the Conditions
box, and to establish conditions for when the event filter is to display the event message. The
following table describes each item condition connector.
The Conditions box
The following table describes each feature of the Conditions box.
216
Chapter 13: Utilizing the Console
Item
Name
►
▼
Description
Individual groups (and the entire Conditions box) can be expanded or collapsed
to show or hide their settings:
n
Click to >expand a collapsed group.
n
Click to ▼ collapse an expanded group. The number that appears in
parentheses indicates how many conditions are contained in the group.
Once a group is properly configured, you may want to collapse it to avoid
accidentally changing it.
This is the Add Group button. It appear at the top of every group box. Click it to
create a new group within the group box. A group within a group is called a nested
group.
Each group is subject to AND and OR relationships with the groups around it and
within it. By default, new groups appear with AND comparisons.
This is the Delete button. It appears at the top of every Group box. When you
point to a condition, it also appears next to that condition. Click this button to
delete a condition or a group. Deleting a group also deletes any groups that are
nested within that group.
Event
From the Events, Event Groups, or Fields list, drag an event, Event Group, or
variable
event field into the Conditions box. This is called the event variable.
You can think of an event variable as the subject of each group of conditions. As
event messages stream into the Console, the filter analyzes the values
associated with each event variable to determine if the event message meets the
filter’s conditions.
217
Features of the Conditions Box
Item
Name
Description
Operators Whenever you drag a list item or a field next to event variable, an operator icon
appears between them. The operator states how the filter is to compare the event
variable to the other item to determine if the event meets the filter’s conditions.
n
Click an operator to cycle through the various operators that are available for
that comparison. Just keep clicking until you see the operator you want to use.
n
Ctrl+click an operator to view all of the operators that are available for that
comparison. Then click to select the specific operator you want to use.
List item
List items are the various non-event items from the list pane. You drag and drop
them into groups to define conditions based on your Time Of Day Sets,
Connector Profiles, User-Defined Groups, Constants, etc.
Some event variables automatically add a blank Constant as its list item. You
can overwrite the Constant with another list item, or you can click the Constant
to add a specific value for the constant. For example, clicking a text Constant
turns the field into an editable text box so you can type specific text. The text
field also allows wildcard characters.
Note that each list item has an icon that corresponds to the list it came from.
These icons let you to quickly identify what kinds of items are defining your
filter’s conditions.
Nested
A group within a group is called a nested group. You may drag event variables
group
and other items from the list pane into the nested group boxes. By using nested
groups, you can refine conditions by combining or comparing one group of
conditions to another. This allows you to create the logic for highly complex and
exact conditions.
This example above shows one nested group. It represents a set of conditions
within a higher-level group.
Conditions (and groups of conditions) are subject to AND and ORcomparisons.
AND
If you click an AND operator, it changes to an OR, and vice versa.
OR
218
Chapter 13: Utilizing the Console
Creating a New Filter
Use the following procedure whenever you need to create a new filter. You will configure the filter with
the Filter Creation connector.
To create a new filter:
1. Open the Monitor view.
2. In the Filters pane, click the title bar of the filter group you want the new filter to reside
in. If you change your mind later, you can always move the filter to a different group.
The filter group opens to list the filters that are available for that group.
3. On the Filters pane, click the plus
button and then click New Filter. The Monitor
view changes from showing the event grid to showing the Filter Creation connector.
The connector shows a new filter with the name of [New Filter].
4. In the Name box, type a name for the filter. This is the name that will be used to identify
the filter in the Filters pane.
5. In the Lines Displayed box, type or select the total number of events that are to be
displayed in this filter. You can use the up and down arrow buttons to the right of the
box to select a value. The default value is 1000 lines. You can select up to a maximum
of 2000 lines.
6. In the Description box, type a brief description of what the filter does, or the situation
for which the filter is intended.
7. Use the list pane and the Conditions box to configure the conditions that define the
filter. These are conditions between events, Event Groups, event fields, and other
components.
8. If you want special notification whenever the filter captures an event event, drag an
option from the Notifications list to the Notification box. Then configure the
notification method.
9. Click Save to save the filter’s settings.
10. If applicable, use the Filter Status section to verify, troubleshoot, and resolve any
219
Editing an Existing Filter
problems with the filter’s logic. When finished, the new filter appears in the filter group
you selected in Step 2.
Editing an Existing Filter
Use the following procedure whenever you need to edit or rename an existing filter. Once the filter is
open for editing, you can change its name, description, configuration, or notification settings, as
needed.
To edit an existing filter:
1. Open the Monitor view.
2. In the Filters pane, open the filter group that contains the filter you want to edit.
3. Select the filter you want to edit.
4. On the Filters pane, click the gear
button and then click Edit. The Monitor view
changes from showing the event grid to showing the Filter Creation connector.
5. Click Save to save the filter’s settings.
6. If applicable, use the Filter Status section to verify, troubleshoot, and resolve any
problems with the filter’s logic.
Cloning an Existing Filter
Cloning a filter lets you copy an existing filter, but save it with a new name. Cloning allows you to
quickly create variations on existing filters.
To clone a filter:
1. Open the Monitor view.
2. In the Filters pane, select the filter you want to clone.
3. On the Filters pane, click the gear
button and then click Edit.
220
Chapter 13: Utilizing the Console
4. Click the row’s gear
button and then click Clone. The newly cloned filter appears
in the filter group, just below the original filter. A clone always uses the same name as
the filter it was cloned from, followed by the word Clone. For example, a clone of the
Virus Attacks filter would is called Virus Attacks Clone. A second clone of the Virus
Attacks filter is called Virus Attacks Clone 2, and so on.
5. Edit the cloned Group, as needed, to give it its own name and to assign its own specific
settings.
Pausing Filters
At any time, you can pause a filter to stop the stream of event messages that are appearing on that
filter. This allows you to inspect a set of event messages without being interrupted by new incoming
messages. You can pause each filter independently, or you can pause every filter on the Console.
To pause a filter:
1. Open the Monitor view.
2. In the Filters pane, click to select the filter you want to pause.
The event grid changes to display the filter you selected.
3. Do either of the following:
l
On the event grid’s title bar, click Pause.
l
On the Filters pane, click the gear
button and then click
Pause/Resume.
In the Filters pane, the word Paused appears next to the filter.
To pause all filters:
1. Open the Monitor view.
2. On the Filters pane, click the gear
221
Resuming Paused Filters
button and then click Pause All.
In the Filters pane, the word Paused appears next to every filter, except those that
have been turned off.
Resuming Paused Filters
When a filter is paused, it ceases to receive any event traffic. To begin receiving event traffic again,
you must resume the filter. You can resume each filter independently, or you can resume every
paused filter on the Console.
To resume running a filter:
1. Open the Monitor view.
2. In the Filters pane, click to select the filter you want to resume. The event grid changes
to display the filter you selected.
3. Do either of the following:
l
On the event grid’s title bar, click Resume.
l
On the Filters pane, click the gear
button and then click
Pause/Resume.
In the Filters pane, the word Paused is replaced by the number of events that are
currently associated with the filter.
To resume running all filters:
1. Open the Monitor view.
2. On the Filters pane, click the gear
button and then click Resume All. In the
Filters pane, the word Paused is replaced by the number of events that are currently
associated with each filter.
222
Chapter 13: Utilizing the Console
Turning Filters On and Off
Perhaps you only use a few filters on a regular basis. If so, you can turn off any unused filters. If you
later decide you need the filter, you can easily turn it back on again. This “on/off” feature lets you
conserve resources and not monitor a filter without taking the drastic measure of deleting the filter.
When you turn a filter back on, it starts from that moment in time—it does not pull prior events from
memory.
Filters are turned on and off from the Filters pane. Filters that are off appear in italic type and show a
status of Off. Filters that are on appear normal.
To turn a filter off:
1. Open the Monitor view.
2. In the Filters pane, select the filter you want to turn off.
3. On the Filters pane, click the gear
button and then click Turn Off. In the Filters
pane, the filter title is now italicized and reads Off in its status column. While the filter is
no longer in use now, it remains available for later use.
To turn on filter back on:
1. Open the Monitor view.
2. In the Filters pane, select the filter you want to turn on.
3. On the Filters pane, click the gear
button and then click Turn On. The filter
appears in the event grid and begins processing data. In the Filters pane, the filter’s
status column changes from Off to showing the total number of events associated with
the filter.
Copying a Filter
You can copy a filter. This allows you to quickly create variations on existing filters, or the same the
223
Importing a Filter
same filter in multiple filter groups.
To copy a filter:
1. Open the Monitor view.
2. In the Filters pane, open the filter group that contains the filter you want to copy.
3. Now open the filter group that is to receive the copied filter.
4. In the first folder, click the filter you want to copy. Then press Ctrl while dragging the
filter to the group that is to receive the copy. A copy of the filter appears in the new filter
group.
To create a variation of the original filter:
1. In the Filters pane, click the select the newly copied filter.
2. Click the Filters pane gear
button and then click Edit.
3. In Filter Creation, rename and reconfigure the filter, as desired.
4. Click Save.
Importing a Filter
Event filters are saved on the workstation that is running the Console. If you move to another
workstation, the filters will not follow. However, you can export the filters from one workstation and
import them into another workstation. This allows you to move filters from one Console to another, so
that another user can use the same filters on their Console, too. It also allows you to import filters that
are provided by SolarWinds You may import more than one filter at a time.
To import a filter:
1. Open the Monitor view.
2. In the Filters pane, select the filter group that is receive the new filters.
3. On the Filters pane, click the gear
button and then click Import Filters.The
224
Chapter 13: Utilizing the Console
Select Filter File(s) to Import form appears.
4. In the Look In box, browse to the folder that contains the filters you want to import.
5. Select the filter files you want to import, and then click Open. To select multiple files,
press Ctrl key while clicking each file you want to import.
The imported filters appears in the filter group you selected in Step 2.
Exporting a Filter
When needed, you can export a filter. Exporting does not remove the filter; it copies the filter to
another location. Exporting filters is useful for the following reasons:
l
You can move filters from one Console workstation to another, so that another Console
users can use the same filters.
l
You can save a export your filters to a computer folder or network folder for archival
purposes.
l
You can provide SolarWinds with a copy of a filter for technical support or
troubleshooting purposes.
Filters are exported from the Filters pane. You may export only one filter at a time.
To export a filter:
1. Open the Monitor view.
2. In the Filters pane, select the filter you want to export.
3. On the Filters pane, click the gear
button and then click Export Filter.
4. In the Browse For Folder form, browse to the folder in which you want to save the
exported file. If needed, you can click Make New Folder to create a new folder for the
file.
5. Click OK. The system exports the folder file to the folder.
Deleting a Filter
When needed, you can delete a filter, which removes the filter from the both the event grid and the
225
Managing Filter Groups
Filters pane. Deleting a filter also deletes all of the widgets associated with that filter.
Use caution when deleting a filter. The only way to restore it and its widgets is to recreate them.
To delete a filter:
1. Open the Monitor view.
2. In the Filters pane, click to select the filter you want to delete.
3. Do either of the following:
l
Click the selected filter’s delete
l
Click the pane’s gear
button.
button, and then click Delete.
4. At the confirmation prompt, click Yes. The filter is deleted and no longer appears in the
Filters pane.
Managing Filter Groups
The topics in this section explain how to create and manage filter groups in the Filters pane.
Adding a New Filter Group
1. Open the Monitor view.
2. Click the Filters pane plus
button and then click New Group.
3. A new filter group appears, and its title bar is an editable text box.
4. Type a name for the new group and then press Enter.
5. The new filter group appears in the Filters list. Filter groups are listed in the order in
which you create them. However, you can rearrange them, as desired.
Renaming a Filter Group
1. Open the Monitor view.
226
Chapter 13: Utilizing the Console
2. In the Filters pane, do one of the following: l
Double-click the title bar of the filter group you want to rename.
l
Click to select the title bar of the filter group you want to rename. Click
the Filters pane gear
button and then click Edit.
The filter group’s title bar changes to an editable text box.
3. Type a new name for the filter group and then press Enter.
Rearranging Filter Groups
By default, new filter groups appear at the bottom of the Filters pane. However, you can rearrange
your filter groups so they appear in the different order. For example, you may want to put your most
frequently used filter groups toward the top of the pane, and your lesser used groups toward the
bottom.
To move a filter group:
1. Open the Monitor view.
2. In the Filters pane, click the title bar of the filter group you move, and then drag it to its
new position.
Moving a Filter From One Group to Another
Once you have created your filter groups, you can organize your filters to them by dragging them from
one group to another.
To move a filter from one group to another:
1. Open the Monitor view.
2. In the Filters pane, open the filter group that contains the filter you want to move.
227
Deleting a Filter Group
3. Do either of the following:
l
Click the filter you want to move; then drag and drop it just below the title
bar of the group that is to receive the filter.
l
Open the filter group that is to receive the filter. Then drag the filter from
its original group into position in the new group.
The filter appears in its new filter group.
Deleting a Filter Group
When needed, you can delete an entire filter group. Deleting a filter group deletes all of the filters that
are stored within that group and all of the widgets that are associated with those filters. Before
deleting a filter group, be sure to move any filters you want to save into another filter group.
To delete a filter group:
1. Open the Monitor view.
2. In the Filters pane, click to select the filter group you want to delete.
228
Chapter 13: Utilizing the Console
3. Do either of the following:
l
Click the filter group’s delete
l
Click the pane’s gear
button.
button, and then click Delete.
4. At the confirmation prompt, click Yes. The filter group and all of its filters are deleted
and no longer appear in the Filters pane.
Responding to Events
The event grid’s Respond menu lets you take direct action on a particular event message. Each
Respond command opens the Respond form. The Respond form includes data from the field you
selected and options for customizing the action, just as you would configure a rule’s active response
in Rule Creation.
The Respond menu is context-sensitive. The event type or cell that is currently selected in the event
grid determines which responses you may choose from.
1. In the Monitor view’s event grid, click the specific cell of the event message you want
to respond to.
2. Click the event grid’s Respond menu, and then select the type of response you want to
make. You can choose between All Actions and a list of commonly used actions. The
Respond form appears, which has three main sections:
3. In the middle of the form, complete the action’s configuration fields. You can do this by
typing text into each field, by dragging and dropping information from the form’s event
information section, or some combination of the two.
4. Click OK to execute the action. Otherwise, click Cancel.
Using the Respond Form’s Drag and Drop Functionality
In the Respond form, you can drag and drop information from the form’s event information section (at
the bottom of the form) into its action configuration fields (in the middle of the form). You can use this
method to do any of the following:
229
Using the Respond Form’s Drag and Drop Functionality
l
add content to a blank field
l
replace the content of a field
l
add to the content that is already in a field.
You can also use a combination of typing and drag and drop to configure an action.
To place event information into a field:
Follow this procedure to add content to a blank configuration field or to replace the content of an
existing configuration field.
1. In the Respond form’s event information grid, scroll to locate the field that contains the
data element needed to configure the action.
2. Click the data and then drag it into the appropriate action configuration field (in the
middle of the Respond form). The the new data element appears in the configuration
field.
230
Chapter 13: Utilizing the Console
To add to the contents of a field from the event information:
Follow this procedure to add new field information to a configuration box, rather than replace it.
Typically, you will use this procedure to add multiple data elements to the Message box.
1. In the Respond form’s event information section, scroll to locate the field that contains
the data element you want to add to the configuration field.
2. Select the information field’s contents by clicking its data in the Information column.
3. Press Ctrl, then drag the data into the appropriate action configuration field (in the
middle of the form) to add the new data element to the configuration field.
Event Explorer
The Event explorer, which can only be opened from the Monitor view, lets you view all of the events
that are related to the event message currently selected in the Console. The Event explorer displays
both sequential and concurrent events. That is, you can view the events that occurred before, during,
and after the event message occurred. You can also monitor events in real time, to see where they
came from and where they are going.
You can explore events for any event in the Console. When you explore an event, the Console makes
a request to the Manager to determine which events are related to that event. The Event explorer then
displays a summary of events that occurred before, during, and after the system issued the event.
The Event explorer shows only those events that relate to the event that you selected. That is, it
shows the event that triggered the event, and any events that occurred because of that event (such
as a response, notification, other event, etc.).
With its straightforward graphical display, the Event explorer can help you visualize how an event
occurred and the system’s response to that event. You can follow the chain of events that caused the
event, and help determine its root cause.
Opening the Event Explorer
You can only open the Event explorer from the Monitor view’s event grid. You may explore any event
that appears in the grid.
231
Event Explorer Features
To open the Event explorer:
1. In the Monitor view’s event grid, click to select the event you want to explore.
2. In the event grid’s Explore menu, click Event. The Explore view opens, showing the
Event explorer. The Event explorer shows all of the events that are associated with the
event you are exploring. The event that you are currently focusing on appears in the
History pane. In this case, it is the event itself.
Event Explorer Features
The Event explorer has three main sections – the information pane, the event map, and the event grid.
The following table describes the key features of each section. The following topics explain how to
use each feature in detail.
Name
Description
Event Details
Click this button to alternately open and close the Event Details pane.
Event Details
The Event explorer's Event Details displays information about the event is
pane
currently selected in the event map or the event grid.
n
It provides detailed information about the event.
n
It displays a written definition of the event.
n
It allows you to create a new filter based on the event.
n
You can also copy text from this pane and paste it into explorers to explore
specific data.
This pane works exactly like Event Details pane in the Monitor view.
Event map
The event map displays a graphical view of the event you are exploring, as well as
the related events that came before and after the central event. The event you are
exploring appears in the middle. Prior events appear to the left. Events that follow
appear to the right. You can double-click any event to move that event to the
middle, which allows you to view its relationship with other events.
232
Chapter 13: Utilizing the Console
Name
Stop
Description
Click Stop to cancel an explorer lookup at any time.
Next/Previous You can step through the events in the map by clicking the Next and Previous
buttons.
Pane divider
Drag this bar up or down to resize the event map and event grid panes.
Event grid
The event grid provides a tabular version of the event map. The events are listed
chronologically, from earliest to latest.
Clicking an event in the grid highlights the corresponding item in the event map.
The information pane also changes to show information about the event you have
selected.
You can sort the event grid by each of its columns, so long as you click Pause
first.
Scroll bars
The vertical and horizontal scroll bars let you quickly scroll through the information
pane, larger event maps, and the event grid. For example, you can use the event
grid’s scroll bars to view the full range of events and all of the data associated with
each event.
Exploring Events
The event grid’s Explore menu lets you use an explorer to investigate a particular event or one of its
data fields.For example, if you select an InsertionIP cell, your explorer options include the Whois,
Traceroute, and NSLookup explorers. If you click the EventInfo cell, your only explorer options is
nDepth, because only that explorer can search the raw data for a random string.
To explore an event:
1. Open the Monitor view.
2. In the Filters pane, select the filter you want to work with. The event grid displays the
filter you have selected.
3. In the event grid, click the row (or cell) you want to explore.
233
Using the Event Map
4. In the filter's Explore menu, select the explorer you want to work with. The Explore
view appears, showing the explorer you selected. The explorer contains the data for the
cell you selected.
Using the Event Map
The top section of the Event explorer is called the event map. The event map displays a graphical
view of the event you are exploring, as well as related events that came before and after the central
event. Each event in the map can be thought of as a node that links to other events.
When you first open an event in the Event explorer, that event is always the central event in the event
map. However, you can double-click any related event to move that event to the center of the map.
This lets you see the events that came before and after that event. In this way, you can move through
the entire chain of events to analyze the relationships between them.
Reading an Event Map
l
Read the map from left to right.
l
The Event explorer always places the event you are currently exploring in the middle of
the map.
l
Related events prior to the central event appear to the left. These events “caused” the
event you are exploring. If there are no prior events, this appears as a box labeled
None.
l
Related events that follow the central event appear to the right. These events followed
or were “caused by” the central event. These are the various system responses (if any)
that were triggered by the central event. If there are no events that follow, this appears
as a box labeled None.
l
If the same event occurs multiple times, they appear together in a box, like the one
shown above for the prior events. In this example, WebTrafficAudit occurred 10 times
before triggering the rule, so they are grouped together. You can use the scroll bar to
view each event. You can also select each event in the box to view information about it
in the information pane.
234
Chapter 13: Utilizing the Console
l
Double-click an event in the event map to move that event to the center position. The
map then displays the related events that came before and after the new central event.
As before, events prior to the central event appear to the left; events that follow the
central event appear to the right.
When you select a new central event, the information pane changes to show
information about that event. The event grid also refreshes to reflect the new central
event.
l
Click Prev (previous) to move the previous event in the map to the center
position.
l
Click Next to move the next event in the map to the center position.
l
Click Stop to cancel an explorer lookup at any time.
l
Click an event in the event map to highlight the corresponding item in the
event grid.
Event Map Legend
Events that appear in the event map can be events, rules, or commands (system responses to an
event). Each type of event in the map has its own icon. The following table explains each icon.
Icon
Meaning
An event from the Audit Events tree.
An event from the Security Event tree.
An event from the Asset Event tree.
An event from the Incident event tree.
An event from the Internal Event tree that is not related to rules or active response activity.
An internal command that indicates the system has taken action to respond to an event.
Rule activity, either from a rule in test mode, or from a rule that has initiated an actual active
response.
235
Using the Event Grid
Using the Event Grid
The event grid lists all of the events that appear in the event map in a tabular form. Events are listed
chronologically, from the earliest event (top) to the latest event (bottom). The grid is useful for
comparing events and for exploring event data.
The event grid’s Order column icons indicate when each event occurred, as described in the
following table.
Icon
Meaning
The event occurred before the central event shown in the event map.
The event occurred during (as part of) the central event.
The event occurred after the central event shown in the event map.
The columns in the event grid show detailed information about the event. The columns vary,
depending on the event you are viewing. For a description of each data field that can appear in the
grid, see "Table of event data fields" on page 1.
Viewing information in the event grid
l
Click an event in the grid to highlight the corresponding item in the event map. The
information pane also changes to show information about the event you have selected.
l
When needed, you can use the vertical scroll bar to view all of the events.
l
Use the horizontal scroll bar to view all of the data fields associated with a particular
event. This same data also appears in the information pane, but as text.
l
Click an individual cell in the grid to explore that field.
l
Point to an individual cell in the grid to see a ToolTip that displays the complete
contents of the cell.
236
Chapter 13: Utilizing the Console
Exploring From the Event Grid
1. In the event map or the event grid, select the event you want to explore.
2. In the event grid, select the specific field you want to explore.
3. In the Explore menu, select the explorer you want to work with. Only those explorers
that are valid for the selected fields are available.The explorer appears, with the field
data you selected appearing in the Search box.
4. If you are using the nDepth Explorer, click Search. The other explorers begin searching
automatically.
To respond from the event grid:
1. In the event map or the event grid, select the event you want to respond to.
2. In the event grid, select the specific field you want to respond to.
3. In the Respond menu, select the response you want.
4. Complete the Respond form. See the "Actions table" on page 1 for details on
configuring each response.
Using the Event Details Pane
In the Event explorer, the upper-left pane is called the Event Details pane. It has two different views
to show the properties of the event that is currently selected in the event map or the event grid: l
The Event Details view displays detailed information about the event that is currently
selected in the grid. If more than one event is selected, it shows the properties of the
last event to be selected.
l
The Event Description view displays a written description of the last event to be
selected in the grid.
You can also use this pane to create a filter based on the selected event, to scroll through the
contents of the event grid, or to explore specific event data with other explorers.
237
Opening and Closing the Event Details Pane
Opening and Closing the Event Details Pane
You can open and close the Event explorer’s Event Details pane of two ways:
l
Click the event map’s Event Details button.
l
Position your pointer over two thin lines next to the Event Details pane (or if the pane is
closed, next to the left side of the event map). When the pointer turns into a doubleheaded arrow, double-click to open or close the pane. When the Event Details pane
opens, it shows information about the event that is currently selected in the event map
or event grid.
Viewing an Event’s Event Details
To view details information about a particular event or event:
l
Click the event in the event map.
l
Click the event in the event grid.
The Event Details pane displays information about the event you selected.
Exploring From the Event Details Pane
1. The following table explains how to use the toolbar at the top of the Event Details
pane.
Button
Description
Click this button to create a new filter that captures the currently selected
event type. Upon doing so, the Monitor view opens, with the new filter open
in the event grid. The new filter appears in the Filters pane, under the last
selected filter. If needed, you can edit the filter so it captures events of an
even more specific nature. See "Editing an existing filter" on page 1.
238
Chapter 13: Utilizing the Console
Button
Description
Click these buttons to move up and down among the events in the event
event grid. The pane shows detailed technical information about each event
that is selected. This lets you view the technical details and written
descriptions of each event in the grid.
Remember, you can also use your keyboard's up (↑) and down (↓) arrow
keys: n
To cycle through the events in the event grid, click anywhere in the
event event grid. Then use your up and down arrow keys.
n
To cycle through the fields in the Event Details pane, click
anywhere in the Event Details grid. Then use your up and down
arrow keys.
Click this button to open the pane’s Event Details view. This view shows
detailed information about each of the selected event's data fields. The
actual fields that appear here vary, according to the event type that is
currently selected. For example, network-oriented events show fields for IP
addresses and ports. Account-oriented events show account names and
domains.
Click this button to open the pane’s Event Description view, which provides
a detailed written description of the event type that is currently selected.
2. In the event map or the event grid, select the event you want to explore.
3. In the Event Details pane's Information column, click the event field you want to
explore.
4. In the Explore list, select the explorer you want to work with. The explorer appears,
with the field data you selected appearing the Search box.
5. If you are using the nDepth Explorer, click Search. The other explorers begin searching
automatically.
Performing nDepth Searches
Data searches are at the heart of nDepth. For that reason,SolarWinds has invested a lot of effort to
239
Performing nDepth Searches
provide you with useful search results with the least amount of effort. Mastering a few basic
techniques can provide you with most of the information you will ever need.
The topics in this section explain the most common procedures you need to get the most out of your
nDepth searches.
Data searches are at the heart of nDepth. For that reason,SolarWinds has invested a lot of effort to
provide you with useful search results with the least amount of effort. Mastering a few basic
techniques can provide you with most of the information you will ever need.
The topics in this section explain the most common procedures you need to get the most out of your
nDepth searches.
Use the following procedure to perform an nDepth search. This method is the same, regardless of
which nDepth view you are using.
To perform a search:
1. Open the Explore >nDepth view.
2. Use the search bar's far-right toggle switch to choose the type of data you want to
explore:
l
Select Events (left position) to search the normalized event data that
appears in the Monitor view.
l
Select Log Messages (right position) to search the actual log entries that
are recorded on your network products' log files. If this position is
disabled, it means your equipment does not have the capacity to store
and search the original log messages.
3. Use the search bar's far-left toggle switch to select how you want to enter the search
string:
l
Select Drag & Drop Mode (upper position) to drag items from the list
pane or the Result Details view directly into the search box. This is the
recommended position, as it is it the easiest to use and the best way to
avoid mistakes.
l
Select Text Input Mode (lower position) to type search strings directly in
the search box.
240
Chapter 13: Utilizing the Console
4. In the search box, enter your search string. By default, the search box includes a "this
item exists" condition, so you can begin searching right away, without having to drag
and drop anything. To use this condition, click an item on one of nDepth's graphical
tools, or type or paste a search string directly in the text box.
In Drag & Drop Mode, the search box indicates when a particular configuration is
invalid:
l
If a condition field is yellow, it means the search's configuration is invalid.
l
If a condition field is red , it means the search conditions do not apply to
the type of data you are currently searching. For example, you are
searching log messages with conditions that are meant for event data.
5. If you select more than one condition, determine the AND/OR relationship between
each condition. Click the operator icon to toggle between AND and OR relationships.
By default, searches use AND operators for each condition in the search string. But
there is one exception—if you are selecting multiple items from a widget, it defaults to
an OR relationship for the group of items from that widget.
6. In the time selector, select the time frame for which you want to search the data. By
default, nDepth reports your network event activity over the last 10 minutes (the end
time is now, and the start time is 10 minutes ago).
See create your own custom time frame.Be aware that the longer the time frame, the
more numerous your search results will be.
7. Click the Search
any time by clicking
button to run the search. If needed, you can stop a search at
.After a moment, nDepth's graphical tools summarize your
search results. The Result Details view shows the actual data.
Creating Search Conditions
nDepth lets you create search conditions many different ways. The following table explains how to
241
Creating Search Conditions
add search conditions, both in Drag & Drop Mode and in Text Input Mode.
Mode
To
D&D Text
Do this
Clear a search from the
On the search bar, click the round Delete All
search box
(next to the
●
button).
1. On the search bar, click
Add a new search
button ●
to clear the
●
●
●
●
●
●
In the Refine Fields list, double-click an item.
●
●
In any list, select the item you want to work with, then
●
search box.
2. Add new search conditions by using any
of the techniques in this table.
Add conditions to an existing Use any of the techniques listed in this table. nDepth
search
automatically adds new search conditions to the search
string.
Add a search
Click an item in a graphical tool to add that item to the
condition from a widget or
search box.
other graphical tool
Add a search
condition
from the list pane
drag that item directly into the search box.
Add a search from
Configure a search with Search Builder. Search Builder ●
Search Builder
automatically populates the search bar with its search
configuration. This is because the search bar and the
Search Builder are different views of the same search.
242
●
Chapter 13: Utilizing the Console
Mode
To
Do this
Add a search
Select a character string from the data. Then double-
condition from the Result
click the string to add it to the search box.
Details view
D&D Text
●
●
Select a character string from the data, and then drag it ●
into the search box.
Select a character string from the data. Then copy
●
(Ctrl+C) the search string and paste (Ctrl+V) it in the
text box.
Type a search string
Type a search string directly in the search box.
Perform the search
On the search bar, click
.
●
●
●
Deleting Items From Search Strings
As with the Search Builder, you can use the search bar to delete search conditions from a search
string. There are buttons to delete individual conditions, groups of conditions, or the entire string.
The following table explains how to delete search conditions directly from the search bar. For the
examples in this table, suppose you have a set of search conditions that looks like this:
Severity = 4
AND
( InsertionIP = SolarWinds-demo50 OR
InsertionIP = intrepid )
243
Creating Custom time frames
To
Delete an individual search
Do this
Click the
button next to the condition in the search string.
condition
Example:
Use this method to delete Severity = 4.
To delete a group of con-
Click the
button at the far right of the search box
ditions
Example:
Use this method to delete the OR group containing the two Insertion
IPs.
Delete the entire search
Click the round Delete All
button (next to the Search) button.
string
Example:
Use this method when you want to delete the entire search string to
begin a new search.
Creating Custom time frames
Use the following procedure to create a custom time frame for your nDepth queries.
To create a custom time frame:
1. In the search bar's time selector list, click Custom range. You can use the calendars
that appear to set your From and To date and time range. By default, the custom time
frame shows the time frame of your last search.
2. Use the two calendars to select the start (From) date and time, and the end (To) date
and time, as described in the following table.
244
Chapter 13: Utilizing the Console
To
Pick a date in the
Do this
Click the date.
month shown
Go to an earlier
Click ◄.
month
Go to a later
Click ►.
month
Go to an earlier
Click ▼.
year
Go to a later year
Click ▲.
Select a different
Type a new time directly in the time box.
time
Or in the hour, minute, and second fields, click ▼ for an earlier
value, or click ▲ for a later value, respectively.
Note: You can use your keyboard’s up, down, right, and left arrows to move within the
calendar and to select a time.
3. To close the calendar, click anywhere outside of its boundary.
Saving a Search
You can save any search that you create so you can reuse it at any time. Saved searches include
your entire search string as well as the time frame you have selected.
To save a search:
1. In nDepth, perform a search as described above, until your results are satisfactory.
2. Click the gear
button and then click Save As. The Save This Search form
appears.
245
Using a Saved Search
3. In the Search Name box, type a name that will easily help you remember the focus of
this search. You can type up to 200 characters.
4. Click OK. Your search appears in the Saved Searches pane. Saved searches use the
following icons:
represents a search for event data. represents a search for original log messages.
Using a Saved Search
One of the great benefits of saving a search is that you can reuse it at any time. Saved searches are
stored in the Saved Searches pane. Saved searches are listed alphabetically.
To use a saved search:
1. Open the Explore >nDepth view.
2. If the Saved Searches pane is not visible, click the History button to open it.
3. On the search bar, select the type of data you want to search — Events or Log
Messages.
4. In the Saved Searches pane, click the search you want run. After a moment, nDepth
shows the search results.
Tip: Pointing to a search in the Saved Searches pane displays a ToolTip with the full
name of the search.
Making Changes to a Saved Search
When needed, you can make changes to any of your saved searches, and then save your changes as
the search's new configuration.
246
Chapter 13: Utilizing the Console
To save your changes to a search:
1. Open the Explore >nDepth view.
2. If the Saved Searches pane is not visible, click the History button to open it.
3. In the Saved Searches pane, click the name of the search you want to perform.
4. Use the search bar to reconfigure the search, as needed.
5. Click the gear
button and then click Save. The search is now saved with the new
configuration. The next time you run it from the Saved Searches pane, it will run with
this configuration.
Exporting nDepth Search Results to PDF
The results of any nDepth search can be exported to a full-color, printable report. The report is
exported as a PDF file for easy storage, printing, and e-mail attachment.
Note: PDF reports are limited to 25,000 events or log messages. If you need a larger report, you can
use the Result Details view to export your search results to a spreadsheet in CSV format.
To export nDepth search results to PDF:
1. In nDepth, perform a search so nDepth shows the information you want reported.
2. Click the gear
button and then click Export.
3. Customize your report in the nDepth Export window using the following options.
a. Use the navigation bar at the bottom to preview your search results in the default
format.
b. Use Insert Page Before Current Page on the navigation bar to add a blank
247
Exploring Search Results from Graphical Views
report page.
c. Use Toggle…orientation on the navigation bar or on an individual report page
thumbnail to switch between portrait and landscape page orientation.
d. Click Items on the left to open a list of report items that you can drag into your
report body.
e. Click Saved Layouts on the right to open a list of options related to saving and
applying report layouts.
f. Hover over report pages and other elements, such as titles, graphs, and text, to
access additional configuration options. Options to clear all page contents, enter
static text, and delete pages or other elements appear as you hover over each
element.
g. Drag charts and graphs to rearrange them in the report body.
4. Click Export to PDF to export the report in the Preview pane.
5. In the Save PDF As window, choose a destination and file name for your report.
6. Click Save.
Exploring Search Results from Graphical Views
When using nDepth's graphical views, you can explore event details with other explorers. This allows
you to use other explorers to investigate specific event details in your nDepth search results. For
example, you could investigate a suspicious IP address with the NSLookup, Traceroute, or Whois
explorers to figure out where that IP is.
Note: When using explorers with nDepth's graphical views, you must manually type the event detail
you want to explore. This information is not automatically "fed" into the explorer, like it is with
nDepth's Result Details view.
248
Chapter 13: Utilizing the Console
To explore details with other explorers:
1. From any of nDepth's graphical views, click the Explore menu. Then select the
explorer you want to use to explore the event detail.
The Explore >Utilities view appears.
2. Type the event detail into the appropriate explorer field.
3. Click Search or Analyze, as applicable to the explorer.
Taking Action on Event Details
When using nDepth's graphical views, you can respond to any item that is reported in nDepth's
search results. If you see something unusual, you may want to take some kind of corrective action.
For example, you could send a user account a popup message, or block a hostile IP address. Use the
following procedure to initiate a response or corrective action to a particular event or event detail.
To initiate a response:
1. From any of nDepth's graphical views, click the Respond menu. Then select the
response you want.
2. Complete the Respond form, as applicable for the response.
Deleting a Saved Search
When needed, you can easily delete any unwanted searches from your Saved Searches pane.
Deleting a saved search is permanent. If you want to restore the search, you will have to recreate it
and save it.
To delete a saved search:
1. Open the Explore >nDepth view.
2. If the Saved Searches pane is not visible, click the History button to open it.
249
Creating Search Conditions
3. In the Saved Searches pane, point to the search you want to delete; then click the
icon next to the search.
4. At the confirmation prompt, click Yes.
Creating Search Conditions
nDepth lets you create search conditions many different ways. The following table explains how to
add search conditions, both in Drag & Drop Mode and in Text Input Mode.
Mode
To
D&D Text
Do this
Clear a search from On the search bar, click the round Delete All
the search box
Add a new search
the
button (next to
●
●
to clear the search box. ●
●
button).
1. On the search bar, click
2. Add new search conditions by using any of the
techniques in this table.
Add conditions to
Use any of the techniques listed in this table. nDepth auto-
●
●
an existing search
matically adds new search conditions to the search string.
Add a search
Click an item in a graphical tool to add that item to the search box. ●
●
In the Refine Fields list, double-click an item.
●
●
In any list, select the item you want to work with, then drag that
●
condition from a
widget or other
graphical tool
Add a search
condition
from the list pane
item directly into the search box.
Add a search from
Configure a search with Search Builder. Search Builder
Search Builder
automatically populates the search bar with its search
configuration. This is because the search bar and the Search
Builder are different views of the same search.
250
●
●
Chapter 13: Utilizing the Console
Mode
To
Do this
Add a search
Select a character string from the data. Then double-click the
condition from the
string to add it to the search box.
Result Details
view
Select a character string from the data, and then drag it into the
D&D Text
●
●
●
search box.
Select a character string from the data. Then copy (Ctrl+C) the
●
search string and paste (Ctrl+V) it in the text box.
Type a search
Type a search string directly in the search box.
●
string
Perform the search On the search bar, click
.
251
●
●
Deleting Items From Search Strings
Deleting Items From Search Strings
As with the Search Builder, you can use the search bar to delete search conditions from a search
string. There are buttons to delete individual conditions, groups of conditions, or the entire string.
The following table explains how to delete search conditions directly from the search bar. For the
examples in this table, suppose you have a set of search conditions that looks like this:
Severity = 4
AND
( InsertionIP = SolarWinds-demo50 OR
InsertionIP = intrepid )
Item
To
Delete an individual
Do this
Click the
button next to the condition in the search string.
search condition
Example:
Use this method to delete Severity = 4.
To delete a group of con-
Click the
button at the far right of the search box
ditions
Example:
Use this method to delete the OR group containing the two
Insertion IPs.
Delete the entire search
Click the round Delete All
string
button.
button (next to the Search)
Example:
Use this method when you want to delete the entire search
string to begin a new search.
252
Chapter 13: Utilizing the Console
Creating Custom time frames
Use the following procedure to create a custom time frame for your nDepth queries.
To create a custom time frame:
1. In the search bar's time selector list, click Custom range. You can use these
calendars to set your From and To date and time range. By default, the custom time
frame shows the time frame of your last search.
2. Use the two calendars to select the start (From) date and time, and the end (To) date
and time, as described in the following table.
To
Pick a date in the
Do this
Click the date.
month shown
Go to an earlier
Click ◄.
month
Go to a later
Click ►.
month
Go to an earlier
Click ▼.
year
Go to a later year
Click ▲.
Select a different
Type a new time directly in the time box.
time
Or in the hour, minute, and second fields, click ▼ for an earlier
value, or click ▲ for a later value, respectively.
Note: You can use your keyboard’s up, down, right, and left arrows to move within the
calendar and to select a time.
3. To close the calendar, click anywhere outside of its boundary.
253
Managing Connectors
Managing Connectors
Use the following procedure whenever you need to open the Connector Configuration form. This
form is used for the following reasons:
l
To configure and manage a Manager’s sensor, actor, and notification connectors.
l
To configure and manage an Agent’s sensor and actor connectors.
l
To change the connectors configured in an Agent’s Connectors Profile.
Note: To change a Connector Profile's membership and properties, edit the Connector
Profile in the Build >Groups view.
Opening a Manager’s Connector Configuration form:
1. On the LEM Console, click Manage >Appliances.
2. In the Appliances grid, click to select the Manager you want to work with.
3. If needed, log in to the Manager. To do so, click the gear
button and then click
Login.
4. Click the gear
button and then click Connectors. The Connector Configuration
for [Manager] form appears. You may now add the connector instances for each
network security product or device this Manager is to monitor or interact with on the
Manager computer.
Opening an Agent’s Connector Configuration form:
1. If needed, log in to the Manager you want to work with.
2. On the LEM Console, click Manage >Agents.
3. In the Agents grid, click to select the Agent you want to work with.
254
Chapter 13: Utilizing the Console
4. Click the gear
l
button and then click Connectors.
If the Agent is not in a Connector Profile, the Connector Configuration
for [Agent] form appears. You may now add the connector instances for
each network security product or device this Agent is to monitor or
interact with on the Agent’s computer.
l
If the Agent is in a Connector Profile, the Agent Connector
Configuration prompt appears. A prompt warns you that the Agent
belongs to a Connector Profile.
You can choose to edit the Connector Profile, which affects every Agent
in that profile; or you can remove the Agent from the profile to configure
the Agent separately.
5. Do one of the following:
l
To edit the connector Profile, click Connector Profile.
The Connector Configuration for [Connector Profile] form appears.
You may now begin adding, editing, or deleting the connector instances
associated with that Connector Profile.
l
To remove the Agent from the Connector Profile and configure its
connectors separately, click Agent Connector Configuration.
The Connector Configuration for [Agent] form appears. You may now
add the connector instances for each network security product or device
this Agent is to monitor or interact with on the Agent’s computer.
Adding New Connector Instances
In this procedure, use the Connector Configuration form to do the following:
l
Configure the connector settings for each sensor that is to gather data from a network
security product’s event logs.
255
Adding New Connector Instances
l
Configure the connector settings for each actor that is to initiate an active response
from a network security product or device.
Each configuration of a sensor or actor connector is called a connector instance. Most products
typically write to only one log source. For these products, a single connector instance will suffice.
However, some products write to more than one log. For these products, create separate connector
instances—one instance for each log source. When a product requires more than one instance, you
can differentiate between them by assigning each instance a unique name, called an alias.
To add a new connector instance:
1. Open the Connector Configuration form for the Manager or Agent you want to work
with.
2. If desired, use the Refine Results pane to select the connector Category you want to
work with.
3. In the Connectors grid, click to select the connector to be configured.
l
The
icon means the connector is for a sensor.
l
The
icon means the connector is for an actor.
4. Do either of the following:
l
At the top of the Connectors grid, click New.
l
Click the connectorrow’s gear
button and then click New.
The Properties pane opens as an editable form. The fields on the form vary from one
connector to another, in order to support the product or device you are configuring. For
new instances, the form displays the default connector settings needed to configure the
associated product or device. In most cases, you can save the connector with its
default settings; however, you can change the settings, as needed.
5. Complete the Properties form, as needed. To assist you, we have prepared some
reference tables that explain the meaning of each field you may encounter in the
Properties form.
256
Chapter 13: Utilizing the Console
6. Click Save to save the connector configuration as a new connector instance;
otherwise, click Cancel. Upon saving, the following things happen in the connectors
grid:
l
If you configured a sensor, a sensor connector instance
icon appears
below the connector you are working with.
l
If you configured an actor, an actor connector instance
icon appears
below the connector you are working with.
l
The
icon in the Status column means the connector instance is
stopped. All new connector instances automatically have a status of
Stopped. To begin using the connector, you must start it.
7. To start the connector instance, click its gear
button and then click Start. After a
moment, the system starts the connector instance. Upon starting, the connector’s
Status icon changes to
. The selected connector instance is now running.
8. If needed, repeat Steps 3–7 for each additional connector instance that is required to
fully integrate this product or device with the LEM.
Starting a Connector Instance
Whenever you finish adding or reconfiguring a connector instance, you must start it so it can begin
running. Starting a connector instance enables that particular connector configuration. If the
connector instance is for a sensor, starting it enables the sensor to begin monitoring the product’s
event log. If the connector instance is for an actor, starting it enables the actor to begin initiating
active responses on that product when requested to do so by policy.
To start a connector instance:
1. Open the Connector Configuration form for the Manager or Agent you want to work
with.
2. In the Connectors grid, click to select the connector instance you want to start.
3. Click the connector instance’s gear
257
button and then click Start.
Stopping a Connector Instance
After a moment, the system starts the connector instance. Upon starting, the
connector’s Status icon changes to
. The selected connector instance is now
running.
Common problems with starting connector instances
If the connector fails to start, the Console will display a Warning or a Failure event that states the
problem. Normally, connectors fail to start for either of the following reasons:
l
The network security device’s log file does not exist.
l
The Agent does not have permission to access the file.
Stopping a Connector Instance
Use this procedure to stop a connector instance. You must always stop a connector instance before
you can edit or delete that connector instance. However, you can also stop a connector instance to
prevent the connector from gathering data for the Console, or to prevent it from initiating active
responses on a network security product or notification system.
To stop a connector instance:
1. Open the Connector Configuration form for the Manager or Agent you want to work
with.
2. In the Connectors grid, click to select the connector instance you want to stop.
3. Click the connector instance’s gear
button and then click Stop.
After a moment, the system stops the connector instance. When the connector’s
Status icon changes to
, it means the connector has stopped.
Once a connector instance has been stopped, it can be edited, deleted, or restarted, as
needed. The connector instance will remain stopped until you restart it.
258
Chapter 13: Utilizing the Console
Editing a Connector Instance
When needed, you can edit an existing connector instance’s configuration settings. However, you
cannot edit its name (alias). If you need to rename a connector instance alias, you must delete the
current connector instance and create a new one with the new name. Also, you cannot edit the Log
File value for some Windows event log sensors.
Use this procedure whenever you need to correct or change a connector’s configuration.
To edit a connector instance:
1. Open the Connector Configuration form for the Manager or Agent you want to work
with.
2. In the Connectors grid, click to select the connector instance you want to edit.
3. Click the connector instance’s gear
button and then click Stop. After a moment,
the system stops the connector instance. When the connector’s Status icon changes
to
, it means the connector has stopped.
4. To edit the connector, click the gear
button and then click Edit.
5. In the Properties form, update the connector settings, as needed:
To assist you, we have prepared some reference tables that explain the meaning of
each field you may encounter in the Properties form.
6. Click Save to save your changes.
7. When you are finished, restart the connector instance by clicking the gear
and then clicking Start.
Deleting a Connector Instance
When needed, you can delete an obsolete or incorrect connector instance.
259
button
Creating Connector Profiles to Manage and Monitor LEM Agents
To delete a connector instance:
1. Open the Connector Configuration form for the Manager or Agent you want to work
with.
2. In the Connectors grid, click to select the connector instance you want to delete.
3. Click the connector instance’s gear
button and then click Stop.After a moment,
the system stops the connector instance. When the connector’s Status icon changes
to
, it means the connector has stopped.
4. Click the connector instance’s
button and then click Delete.
5. At the confirmation prompt, click Yes to delete the connector instance. After a moment,
the connector instance disappears from the Connectors grid.
Note: Do not recreate this connector until it has been completely removed. It may take
up to two minutes for the connector to be deleted from your system.
Creating Connector Profiles to Manage and Monitor LEM Agents
Use Connector Profiles to manage and monitor similar LEM Agents across your network. The
following two use cases are the most common for this type of component.
l
Configure and manage connectors at the profile level to reduce the amount of work you
have to do for large LEM Agent deployments.
l
Create filters, rules, and searches using your Connector Profiles as Groups of LEM
Agents. For example, create a filter to show you all Web traffic from computers in your
Domain Controller Connector Profile.
Complete the two procedures below to create a Connector Profile using a single LEM Agent as its
template.
To create a Connector Profile using a LEM Agent as a template:
1. Configure the Connectors on the LEM Agent to be used as the template for the new
Connector Profile. These connectors are applied to any LEM Agents that are later
260
Chapter 13: Utilizing the Console
added to the Connector Profile.
2. Click Build , and then select Groups.
3. Click the
button, and then select Connector Profile.
4. Enter a name and description for the Connector Profile.
5. Select the desired LEM Agent template from the Template list next to the Description
field.
6. Click Save.
To add LEM Agents to your new Connector Profile:
1. Locate the new Connector Profile in the Build > Groups view.
2. Click the gear
button next to your Connector Profile, and then select Edit.
3. Move LEM Agents from the Available Agents list to the Connector Profile by clicking
the arrow next to them.
4. If you are finished adding LEM Agents to your Connector Profile, click Save.
5. The connector configurations set for the template agent will be applied to any agent
added to the Connector Profile.
Using an Agent to edit a Connector Profile
You can use an Agent that is a member of a Connector Profile as a vehicle for editing that profile’s
connector settings. You can add new connector instances to the profile, or edit or delete its existing
instances. Use caution when editing a Connector Profile. The changes you make will apply to every
Agent that is a member of that profile.
You can also edit a Connector Profile's connector settings from the Manage > Agents view.
To use an Agent to edit a Connector Profile’s connector settings
1. Open the Manage >Agents view.
2. In the Agents grid, click to select the Agent that is in the Connector Profile you want to
edit.
261
File Integrity Monitoring Connectors
3. Click the gear
button and then click Connectors. The Agent Connector
Configuration prompt appears to warn you that the Agent belongs to a Connector
Profile.
4. Click Connector Profile. The Connector Configuration for [Connector Profile]
form appears. You may now begin adding, editing, or deleting the Connector instances
that are associated with that Connector Profile.
File Integrity Monitoring Connectors
File Integrity Monitoring (FIM) provides the ability to monitor files of all types for any unauthorized
changes that may lead to a data breach by a malicious attack. Using FIM, you can detect changes to
critical files, both to ensure systems are free of compromise and to ensure critical data is not being
changed by unauthorized modifications of systems, configurations, executables, log and audit files,
content files, database files, and web files. If FIM detects a change in a file you are monitoring, it is
logged. LEM then takes those logs and performs the configured action. Correlation rules can be built
to act as a second-level filter to only actively send an alert to certain patterns of activity (not just
single instances), and when an alert is triggered, the data is in context with your network and other
system log data With a SIEM like LEM, you can also respond with administrative action.
Features of FIM
l
On Windows (XP, Vista, 7, 8, Server 2003, 2008, 2012), monitors for real-time access
and changes to files and registry keys and WHO changed them
l
Allows you to configure the logic of files/directories and registry keys/values to monitor
for different types of access (create, write, delete, change permissions/metadata)
l
Provides the ability to standardize configurations across many systems
l
Provides monitoring templates which can be used to monitor the basics. Also allows
the option of creating and customizing your own monitors.
l
Provides templates for rules, filters, and reports to assist in including FIM events
quickly
262
Chapter 13: Utilizing the Console
What can FIM detect?
l
Insider abuse by auditing files directly through intelligent correlation rules. Active
integration with active directory settings can disable accounts, change user groups and
rights.
l
If a critical registry key is changed (if registry is supported). For example, a new service
is installed, software is installed, a key gets added to "hide" data in an unexpected
area.
l
If a new driver or a similar device is installed. Adds a layer of defense to anti virus
software for detecting viruses that mask as "similarly" named files (like ntkernl.sys vs.
ntkernI.sys).
l
If critical business files are accessed and who is accessing them. Detects potential
abuse, unexpected access, or changes to sensitive data.
l
If files are moved. Usually when users move directories into other directories.
l
Zero-day exploits, which is an attack that takes advantage of security vulnerabilities
the same day the vulnerability becomes known. FIM can trigger an alert letting you
know there has been a file change by a potential malware or Trojan and can
automatically stop the running malware process.
l
Advanced Persistent Threats by inserting a granular, file-based auditing into the
existing event stream to pinpoint attacks and help block them in progress.
Adding a FIM Connector
To add a FIM connector:
1. Navigate to Manage > Nodes to see a listing of all the nodes being monitored by LEM.
2. Select the desired node, then click the gear
icon next to it and select
Connectors.
3. Enter FIM in the Refine Results pane. The search results in FIM Registry and also FIM
File and Directory.
4. Select either a FIM file and Directory or a FIM Registry.
263
Monitors
5. Click the gear
icon next to the FIM Connector profile you want to work with, then
select New to create a new connector. The Connector Configuration window displays.
6. Select a Monitor from the Monitor Templates pane, and then click the gear
icon
and select Add to selected monitors. The Monitor Template then moves to the
Selected Monitor pane.
7. Click Save, or click Add Custom Monitor to modify the monitor to your requirements.
Monitors
Monitors allow you to configure rules for which files to watch, and which actions to watch for those
files. Different monitoring templates have been provided to use right away, and to assist in creating
custom templates or configurations.
Adding Custom Monitors
1. Click Add Custom Monitor in the Connector Configuration window.
2. Enter a Monitor Name.
3. Enter a Description for the monitor.
4. Click Add New. The Add Condition window displays. See Adding Conditions for more
information on how to add conditions to monitors.
Editing Monitors
1. Select a Monitor from the Selected Monitors pane.
2. Click the gear
icon and select Edit monitor
Promoting a Monitor to a Template
1. Select the Monitor to be promoted.
2. Click the gear
icon and select Promote monitor to template.
264
Chapter 13: Utilizing the Console
3. Click Yes to promote this monitor to a template. The monitor is now available in the
Monitor Templates pane.
Deleting a Monitor
1. Select the monitor to be deleted.
2. Click the gear
icon and select Delete.
3. Click Remove. The monitor is then removed from the Selected Monitors pane.
Adding Conditions
1. Click Add New in the Conditions window.
2. Click Browse to select a File and Directory or a Registry key to watch.
3. Click OK.
4. Select whether the files are recursive or non-recursive. Refer to the table below for
more information.
Recursive
The folder selected and all its sub-folders which
match the given mask will be monitored for
corresponding selected operations.
Non-recursive
Only the files in the selected folders will be
monitored.
5. Enter a Mask. For example, *exe or directory*.
6. For a FIM File and Directory, select Create, Read, Write, and Delete for Directory,
File, Permissions, and Other operations. For a FIM Registry, select Create, Read,
Write, and Delete for Key and Value operations. For more information on Other, refer
to the Microsoft MSDN information.
7. Click Save.
265
Editing Conditions
Editing Conditions
1. Select the condition to be edited in the Conditions window.
2. Click Edit.
3. Click Browse to select a File and Directory or a Registry key to watch.
4. Click OK.
5. Select whether the files are recursive or non-recursive. Refer to the table below for
more information.
Recursive
The folder selected and all its sub-folders which
match the given mask will be monitored for
corresponding selected operations.
Non-recursive
Only the files in the selected folders will be
monitored.
6. Enter a Mask. For example, *exe or directory*.
7. For a FIM File/Directory, select Create, Read, Write, and Delete for Directory, File,
Permissions, and Other operations. For a FIM Registry, select Create, Read, Write,
and Delete for Key and Value operations. For more information on Other, refer to the
Microsoft MSDN information.
8. Click Save.
Deleting Conditions
1. Select the condition to be deleted in the Conditions window.
2. Click Delete.
3. Click Remove.
FIM Connector Advanced Settings
1. Complete the Advanced Connector Settings form according to the device you're
configuring. The following fields/descriptions are common for most connectors:
266
Chapter 13: Utilizing the Console
Log Directory
When you create a new alias for a connector, LEM automatically places a
default log file path in the Log Directory field. This path tells the connector
where the operating system stores the product’s event log file.
In most cases, you should be able to use the default log file path that is
shown for the connector. These paths are based on the default vendor
settings and the product documentation for each product. If a different log
path is needed,
To manually change the log file location:
1. Enter or paste the correct path in the Log Directory field.
2. Stop the Agent.
3. Manually update the Agent's spop.conf property
o
com.solarwinds.lem.fim.minifilter.fsLogLocation for a
file and directory connector. This appears as
%SystemDrive%\\Mylocation\\FileSystem in the config
file.
o
com.solarwinds.lem.fim.minifilter.registryLogLocation
for a registry connector . This appears as C:\\My other
log location\\Registry in the config file.
4. Restart the Agent.
Log Data Type to
Select either nDepth, Alert, or Alert, nDepth. To store a copy of the original
Save
log data in addition to normalized data, change the Log Data Type to Save to
Alert, nDepth. Storage for original log data must also be enabled on the appliance.
nDepth Host
If you are using a separate nDepth appliance (other than LEM), type the IP
address or host name for the nDepth appliance. Generally, the default setting
is correct. Only change it if you are advised to do so.
nDepth Port
If you are using a separate nDepth appliance (other than the SolarWinds
LEM), type the port number to which the connector is to send nDepth data.
Generally, the default setting is correct. Only change it if you are advised to
do so.
267
Managing Widgets
Sleep Time
Type or select the time (in seconds) the connector sensor is to wait between
event monitoring sessions. The default (and minimum) value for all
connectors is one (1) second. If you experience adverse effects due to too
many rapid readings of log entries, increase the Sleep Time for the
appropriate connectors.
Windows NT-based connectors automatically notify Windows Event Log
sensors of new events that enter the log file. Should automatic notification
stop for any reason, the Sleep Time dictates the interval the sensor is to use
for monitoring new events.
Wrapper Name
This is an identification key that the SolarWinds LEM uses to uniquely
identify the properties that apply to this particular connector. This is read-only
information for SolarWinds reference purposes.
Tool Version
This is the release version for this connector. This is read-only information for
reference purposes.
Enable Connector
When this option is selected, the connector starts when you click Save.
Upon Save
7. After completing the form, click Save.
8. If you did not select the Enable Connector Upon Save option, navigate to the
Connectors list and click the gear
button next to the new connector (denoted by
an icon in the Status column), and then select Start.
9. After starting the connector, verify that it is working by checking for events on the
Monitor tab.
Managing Widgets
The topics in this section explai n how to use the Widget Manager to create and manage your
widgets.
268
Chapter 13: Utilizing the Console
Opening and Closing the Widget Manager
l
At the top of the Ops Manager view, click Widget Manager to alternately open and
close the Widget Manager.
The Widget Manager includes the Filters pane and the Widgets pane.
Creating New Master Widgets
In the Ops Center, you can use the Widget Manager to create a new master widget for any of your
filters. Widgets are created with a tool called the Widget Builder, which allows you to define the new
widget’s foundational and aesthetic settings. It also allows you to save a copy of the new widget to
the Ops Center dashboard.
To create a new master widget from the Ops Center:
1. Open the Ops Center view.
2. If needed, click Widget Manager to open the Filters and Widgets panes.
3. Click the
button. The Widget Builder appears.
4. Complete the Widget Builder.
5. Select the Save to Dashboard check box if you want to save a copy of the new widget
to the Ops Center dashboard.
6. When you are finished, click Save. Upon saving the new widget, several things
happen:
l
In the Filters pane, the Count value of the associated filter increases by
one to account for the new widget.
l
The new widget appears in the Widgets pane for the associated filter.
l
The next time you open the widget’s source filter in the Monitor view, the
new widget will appear in the Widgets pane’s widget list.
269
Editing Master Widgets
l
If you selected the Save to Dashboard option, a copy of the widget also
appears in the Ops Center dashboard.
Editing Master Widgets
In the Ops Center, you can use the Widget Manager to edit any of the master widgets that are
associated with a filter. Typically, you will edit a master widget when you want to change a master
widget’s name, behavior, or appearance, or whenever you want to use the master widget as a
template to create a new dashboard widget based on the master widget’s current configuration.
Once saved, an updated master widget appears with its new configuration in the Ops Center’s
Widget Manager and in the Monitor view’s Widgets pane.
Once created, each dashboard widget operates independently of the master widget it was created
from. Therefore, editing a master widget does not affect any previous copies (dashboard widgets) that
were created from that master. This independence lets you use a master widget as a template for
creating variations of the same widget for the Ops Center dashboard.
To edit a master widget in the Ops Center:
1. Open the Ops Center view.
2. If needed, click Widget Manager to open the Filters and Widgets panes.
3. In the Filters pane, select the filter you want to work with.The widgets associated with
this filter appear in the Widgets pane.
4. Drag the pane’s scroll bar left or right to browse the filter's widgets.
5. When you find the widget you want to edit, click the Filters pane gear
button. The
Widget Builder appears.
6. Use the Widget Builder to reconfigure the widget, as needed.
7. Select Save to Dashboard if you want to save a copy of the reconfigured master
widget to the Ops Center dashboard.
8. Click Save to save your changes to the widget. The master widget’s new configuration
appears in the Widgets pane. If you selected the Save to Dashboard option, a copy of
the newly configured widget also appears in the Ops Center dashboard.
270
Chapter 13: Utilizing the Console
Adding Widgets to the Dashboard
Use either of the following procedures to add a copy of a master widget to the Ops Center
dashboard. The original remains with its filter. Once a copy is on the dashboard, you may edit its
graphical presentation, as needed.
To add a widget from the Widgets pane to the dashboard:
1. Open the Ops Center view.
2. Click Widget Manager to open the Filters and Widgets panes.
3. In the Filters pane, select the filter you want to work with.The widgets associated with
this filter appear in the Widgets pane.
4. To preview the widgets in the Widgets pane, do one of the following: l
Drag the pane’s scroll bar left or right to browse the filter's widgets.
l
Click any widget to move it to the front of the pane.
5. When you find the widget you want to add to the dashboard, do either of the following:
l
Click Add to Dashboard.
l
Click anywhere on the widget. Drag it to the dashboard, and then drop it
in the position you want.
To add a widget to the dashboard from the Widget Builder:
1. When creating or editing a master widget with the Widget Builder, configure the form
so the widget appears the way you want it to on the dashboard.
2. Select the Save to Dashboard check box.
3. Click Save. A copy of the widget appears at the bottom of the Ops Center dashboard.
Deleting Master Widgets
Widgets can only be deleted from the Ops Center, and master widgets can only be deleted from the
271
Editing a Dashboard Widget
Widget Manager. Deleting a master widget does not delete any of the dashboard widgets that came
from that master.
To delete a master widget:
1. Open the Ops Center view.
2. If needed, click Widget Manager to open the Filters list and the Widgets pane.
3. In the Filters list, select the filter that contains the widget you want to delete.
4. In the Widgets pane, use the scroll bar to select the widget you want to delete.
5. Click Delete Widget.
6. At the confirmation prompt, click Yes.
Editing a Dashboard Widget
In the Ops Center dashboard, you can edit any dashboard widget. Editing a dashboard widget does
not affect the master widget it came from, or any other widget. You are editing only that particular
widget.
When editing a dashboard widget, the Save to Dashboard option is disabled, because dashboard
widgets can only be created from a master widget.
To edit a dashboard widget:
1. In the Ops Center dashboard, locate the widget you want to work with.
2. Click the gear
button on the widget toolbar. The Widget Builder appears.
3. Make the necessary changes to the Widget Builder.
4. When you are finished, click Save. The widget appears in the dashboard with its new
configuration.
Deleting Dashboard Widgets
Widgets can only be deleted from the Ops Center. You can delete dashboard widgets directly from
272
Chapter 13: Utilizing the Console
the dashboard.
To delete a widget from the dashboard:
1. Open the Ops Center view.
2. In the dashboard, locate the widget you want to delete.
3. Click the delete
button on the widget toolbar.
4. At the confirmation prompt, click Yes. The widget is deleted from the dashboard.
Note: If needed, you can readily recreate the dashboard widget, so long as you do not
delete the master widget it came from.
273
Chapter 14: Advanced Configurations
Setting up an Appliance
If you are setting up a Manager for the first time, you should follow this order of events:
l
On the Console, open the Manage > Appliances view.
l
Add a Manager to the Console.
l
Log on to the Manager through the Console.
l
Configure the Manager’s properties with the Properties form.
l
Configure the Manager’s connectors with the Connector Configuration window.
l
(Optional) Assign the Manager’s alert distribution policy with the Event Distribution
Policy window.
Adding Appliances to the Console
Use this procedure whenever you want to add a new Manager or other network appliance to the LEM
Console.
To add a new appliance:
1. At the top of the LEM Console, click Manage and then click Appliances.
2. At the top of the Appliances grid, click the
symbol.
3. Enter the IP Address of the virtual appliance.
4. Click
to display the Advance Properties form. The following table describes the form
fields:
274
Chapter 14: Advanced Configurations
Field
Description
Username
Enter the username used to connect to the virtual appliance.
Password
Enter the password for the virtual appliance.
Appliance
Select the appliance type you are adding—Manager, Database
Type
Server, nDepth, Logging Server, or Network Sensor.
Connection Type the port number the Console must use to communicate with the
Port
Manager network appliance or the database. The secure port number is
8443. This value will default to 8080 for virtual appliances in the
evaluation phase.
Note: This field only applies when the Appliance Type field is set to
Manager.
Model
Select the appliance's appropriate model. If you are uncertain which
model you have, select Unknown. If you know your model but it is not
listed, select Other. Your selection here has no affect on the
Manager’s operation.
If you selected any of the specific models, a picture of the appliance
appears at the top of the Details pane.
Level
The appliance’s level. Its level is directly related to the appliance's
capacity and performance, ranging from Level 1 to Level 4. If you are
uncertain which level the Manager belongs to, select Unknown. If you
are adding a Database Server, Level 4 is automatically selected. This
option is disabled if you are using a virtual appliance.
Service
Type the Dell serial number or registration number found on the
Tag
appliance. It uniquely identifies this piece of equipment and its specific
configuration properties.
Icon Color
Select the desired color for your icon.
Reset
At any time, you can click Reset to reset the form to its default
settings.
275
Copying Appliance Data
5. Click Connect to add the appliance and close the form. Otherwise, click Cancel to
return to the Console without adding the appliance.
6. Enter the IP Address of the virtual appliance and then click Connect.
Note: The LEM desktop software requires that you change your LEM password after
installation. This password must be between 6 and 40 characters, and must contain at
least one capital letter and one number. The default username/password is
Admin/Password.
7. Click OK.
Copying Appliance Data
If needed, you can copy your the data from the Appliances grid to your clipboard. This allows you to
page the data into another application, such as Microsoft Excel for analysis or the Remote Agent
Installer for updates. You can copy the data for a single appliance, multiple appliances, or for every
appliance in the grid.
To copy data for a single appliance:
1. Open the Manage >Appliances view.
2. In the Appliances grid, select the appliances you want to copy.
3. Click the
button, and then do one of the following: l
Click Copy Selected to copy the data for the selected appliances.
l
Click Copy All to copy the data for every appliance in the grid.
The appliance data is now copied to your clipboard, where it can be pasted into another
application.
Removing an Appliance
When needed, you can remove a Manager or other network appliance from the Console.
276
Chapter 14: Advanced Configurations
To remove an appliance:
1. At the top of the Console, click Manage, and then click Appliances.
2. In the Appliances grid, click to select the appliance you want to remove.
3. Click the gear
button and then click Delete.
4. At the confirmation prompt, click Yes to remove the appliance. Otherwise, click No to
return to the Console without removing the appliance. The appliance disappears from
the Appliances grid.
Managing Connectors
Configuring Manager Connectors (general procedure)
Follow this procedure to configure a Manager’s connectors (sensors and actors). It lets the Manager
monitor and interact with the supported security products or devices that are installed on or remotely
logging to the Manager computer.
To configure a Manager’s connectors:
1. Start the LEM Console.
2. Open the Manage >Appliances view.
3. If you have not already done so, add and configure each Manager you will be using with
your network.
4. Log on to the Manager you want to work with.
5. Open the Connector Configuration for [Manager] form.
6. Add a connector instance for each of the product’s event log sources.
7. When you are finished, start the Connector instance. See Advanced Configurations
8. Repeat Steps 6 and 7 for each product or device that is logging to the Manager
computer.
277
Configuring Agent Connectors (general procedure)
9. Repeat Steps 4–8 for each Manager, until you have configured Connectors for each
point on your network.
Configuring Agent Connectors (general procedure)
Follow this procedure to configure the connectors (sensors and actors) the Agent uses to monitor and
interact with each network’s security product and device that is running on the Agent computer.
To configure an Agent’s connectors:
1. Open the Manage > Agents view.
2. Open the Connector Configuration for [Agent] form.
3. Add a connector instance for each of the product’s event log sources.
4. When you are finished, start the connector instance.
5. Repeat Steps 3 and 4 for each product or device the Agent is monitoring on the Agent’s
computer.
6. If you are not using Connector Profiles, repeat Steps 2–5 for each Agent, until you have
configured the connectors for each point on your network. If you are using Connector
Profiles, you can use a configured Agent as a template for a Connector Profile.
Using Connector Profiles to Configure Multiple Agents
Most Agents in a network have only a few different connector configurations. Therefore, you can
greatly speed up the connector configuration process by creating Connector Profiles. A Connector
Profile is a group of Agents that share the same connector configuration. It allows you to configure a
set of standardized connector settings, and then apply those settings to all of the Agents that are
assigned to that profile. Once applied, every Agent in the profile will then have the exact same
connector settings.
One of the great benefits of using Connector Profiles is that you can maintain all of the Agents in a
profile at once by updating only the Connector Profile’s connector configuration. The system then
propagates your changes to all of the Agents in the profile.
By using Connector Profiles, you can greatly speed up the process of connecting your network
security products to LEM. If you do not use Connector Profiles, you will have to create at least one
278
Chapter 14: Advanced Configurations
connector instance for every product that you intend to integrate with LEM, and then repeat this
process for every one of your Agents.
A well-planned set of Connector Profiles provides you with a versatile and efficient method for
configuring and maintaining your Agents’ connector configurations.
Managing Groups
The topics in this section explain how to create and manage Groups.
Adding a New Group
1. Open the Build >Groups view.
2. In the Groups grid, click
and then click the Group type you want to create.
The Group Details pane opens to show an editable form for the Group type you have
selected.
3. In the Name box, type a name for Group.
4. In the Description box, type a brief description of the Group and its intended use.
5. In the Manager list, select the Manager on which the Group is to reside.
6. When you are finished, click Save. The new Group appears in the Groups grid.
Editing a Group
Editing a Group is very much like creating a new one. The only difference is that you are reconfiguring
an existing item.
279
Cloning a Group
To edit a Group:
1. Open the Build >Groups view.
2. In the Groups grid, do one of the following:
l
Double-click the Group you want to edit.
l
Click the gear
button for the Group you want to edit and click Edit.
The Edit pane opens as an editable form, showing the selected Group’s current
configuration.
3. Make any necessary changes to the Edit form to reconfigure the Group.
4. When you are finished, click Save.
The revised Group is applied to the Manager and appears in the Groups grid.
Cloning a Group
Cloning a Group lets you copy an existing Group, but save it with a new name. Cloning allows you to
quickly create variations on existing Groups for use with your rules, filters, and Agents.
Cloned Groups must be for the same Manager as the original Group. That is, you cannot clone a
Group from one Manager for use with another Manager.
To clone a Group:
1. Open the Build >Groups view.
2. In the Groups grid, click to select the Group you want to clone.
3. Click the row’s gear
button and then click Clone. The newly cloned Group
appears in the Groups grid in the row just below the original Group.
A clone always uses the same name as the Group it was cloned from, followed by the
word Clone. For example, a clone of the Disk Warning Group would be called Disk
280
Chapter 14: Advanced Configurations
Warning Clone. A second clone of the Disk Warning Group would be called Disk
Warning Clone 2, and so on.
4. Edit the cloned Group, as needed, to give it its own name and to assign its own specific
settings.
Importing a Group
You can import Groups from a remote source into the Groups grid. You can import a Group that you
have exported from another Manager, or you can import Groups that are provided by SolarWinds. You
may import only one Group at a time.
To import a Group:
1. Open the Build >Groups view.
2. On the Groups grid connector bar, click the gear
button and then click
Import.The Open form appears.
3. In the Look In box, browse to the folder that contains the Group file you want to import.
4. Do either of the following:
l
Double-click the file to open it.
l
Click to select the file you want to import, and then click Open.
The Group appears in the Groups grid and in the Group Details form for editing.
5. In the Group Details form, select the Manager this Group is to be assigned to.
6. Make any other desired changes in the Group Details form.
7. Click Save to send the Group to the Manager.
8. If you are working with Email Templates or State Variables, drag the new Group from
the Groups grid into the folder (in the Folders pane) that is to store the Group.
281
Exporting a Group
Exporting a Group
When needed, you can export Groups. Exporting Groups is useful for three reasons:
l
Once exported, you can import the Group into another Manager.
l
You can save a copy off of the Manager for any reason.
l
You can provide SolarWinds with a copy of your Group for technical support or
troubleshooting purposes.
You may export only one Group at a time.
To export a Group:
1. Open the Build >Groups view.
2. In the Groups grid, click to select the Group you want to export.
3. Click the row’s gear
button and then click Export.
4. After a moment, the Save As form appears.
5. Use the Save As form to select the folder in which you want to save the exported
Group.
6. In the File name box, type a name for the exported Group.
7. Click Save to export and save the Group; otherwise, click Cancel. You can now import
the Group for use with another Manager.
Deleting a Group
When needed, you can delete any of your Groups.
282
Chapter 14: Advanced Configurations
To delete a Group:
1. Open the Build >Groups view.
2. In the Groups grid, select the Group you want to delete.
3. Click the row’s gear
button and then click Delete.
4. At the confirmation prompt, click Yes to delete the Group. The item disappears from the
Groups grid.
Configuring Event Groups
Whenever you create or edit an Event Group, the Build >Groups view’s Edit pane opens and
becomes the Event Group form. The Event Group form lets you create custom families of alerts
that you can save as a Group. You can then associate the Event Group with your rules and filters.
For example, you might create an Event Group made up of similar alerts that all need to trigger the
same response from the Console. When you apply the Event Group to a rule, the Console
implements the rule when any one of the alerts in the Group occurs.
Each Event Group you create only applies to the Manager that is selected when you create the
Group. If you need a similar Event Group for a different Manager, you must create it separately for the
other Manager.
Configuring an Event Group
1. Open the Build >Groups view.
2. On the Groups grid, click
and then click Event Group. The Edit pane opens,
showing the Event Group form.
3. In the Name box, type a name for the new Event Group.
4. In the Description box, type a brief description of the Event Group’s contents.
5. In the Manager list, select the Manager on which this Group is to reside. If you are
283
Event List Features
editing an existing Group, this field shows the Manager on which it resides.
Now you will configure the Event Group by selecting the alerts you want in the Group.
The Events box lists alerts in a hierarchical tree. You may need to open the nodes in
the alert tree to see the alert you are looking for.
6. In the Events list, select each alert that you want to include in this Group.
l
To choose an alert, click its check box.
l
To remove an alert, clear its check box.
Note: In the node-tree view, you can Ctrl+Click to select (or clear) an alert and all of
the alerts below that item (that is, its child alerts). For example, press Ctrl and click
Security Event to select Security Event and all of its child alerts.
7. Click Save. The new Event Group appears in the Groups grid.
Event List Features
The following table explains how to use each feature of the Events list.
284
Chapter 14: Advanced Configurations
Icon
Description
Click this button to display the Events list as a hierarchical node tree. Then use the list to
select each alert type that you want to include in this Group. This is the default view.
This view also has the following attributes:
n
Lower-level alert types are hidden by nodes in the alert tree. To open a node, click the
>icon. This displays the node’s next level of alerts.
n
Using the search box displays the alert and its parent alert types, so you can see how the
alert appears in the alert hierarchy.
n
You can Ctrl+Click to select (or clear) an alert and all of the alerts below that item (that is,
its child alerts). For example, if you press Ctrl and click Security Event, you will select
Security Event and all of its child alerts.
Click this button to list alert types alphabetically, regardless of their position in the hierarchy.
Then use the list to select each alert type that you want to include in this Group.
You can use this box to search either view of the Events list. To do so, type a word or phrase
in the text box. The Events list will refresh to show any alerts that include your word or
phrase.
►
This icon represents a closed (or collapsed) alert node in the alert tree hierarchy. Each time
you see this icon, it means the alert node contains lower-level alerts.
To open a node, click it. Opening the node expands the alert tree, displaying the next level of
related alerts.
▼
This icon represents an open (or expanded) alert node in the alert tree hierarchy. Each time
you see this icon, the node is displaying its related lower-level alerts.
To close (or collapse) the node, click it. This collapses the alert tree at that level, hiding its
lower-level alerts.
This item has not been selected; nor have any of its lower-level items.
This item has been selected; but not any of its lower-level items.
This item has not been selected, but one or more if its lower-level items has been selected.
This item has been selected, and so have one or more of its lower-level items.
285
Configuring Directory Services Groups
Configuring Directory Services Groups
Many companies use a directory service, such as Active Directory, to organize and administer their
network’s computers and system users. This computer and user information is organized into
Directory Service Groups (DS Groups) that are managed with the directory service.
If you use such a directory service, you can connect LEM to the server that stores your existing DS
Groups, synchronize your Groups with LEM, and apply your Groups to your rules and filters.
Once your directory service is connected, your DS Groups become seamlessly integrated with the
LEM. Whenever you make a change to a Group in the directory service, LEM automatically updates
your rules and filters to reflect the change.
The topics in this section explain how to retrieve and synchronize information from your directory
service for use with LEM.
How to Use Directory Services Groups
DS Groups allow you to match, include, or exclude events to specific users or computers based on
their Group membership, to determine if a particular alert event is relevant or not.
In most cases, DS Groups are used in rules and filters as a type of white list or blacklist for choosing
which users or computers to include or to ignore. When used by a filter, a DS Group lets you limit the
scope of the alerts included in the filter to those users or computers that have membership in a
particular Group.
For example, you may want to use a DS Group that you created in your directory services that
contains the names of high-risk network users. You can then refer to this Group in a rule or filter. For
instance, your rule may dictate to always disable these users if you detect malicious activity.
Synchronizing Directory Service Groups with LEM
This procedure explains how to retrieve Group data from your directory service and select which DS
Groups are to be synchronized with LEM. This procedure ensures that you capture the most current
information from any Groups that are not currently synchronized with LEM.
286
Chapter 14: Advanced Configurations
You can also use this procedure to remove DS Groups that no longer require synchronization.
Note: To use DS Groups, first make sure the Directory Service Query Connector is configured and
running on the LEM Manager for which you want to use DS Groups.
DS Groups only apply to Managers that are connected to them. If you need a similar DS Group for
another Manager, you must connect to the directory service with the other Manager.
To retrieve DS Group data from your directory service:
1. Open the Build >Groups view.
2. On the Groups grid, click
and then click Directory Services Group. The Select
Directory Services Group form appears. You will use this form to select which
directory service Groups you want to synchronize for use with LEM.
3. In the Manager list (the upper-right drop-down list), select the Manager that is going to
use the DS Groups.
4. In the other drop-down list, select the directory services domain you want to work with.
The form displays the actual contents (folders and Group categories) of your directory
service system:
l
Each folder to the left contains the Group categories that are associated
with that area of your directory service. You can click a folder node (►) to
display the Group categories contained within that folder.
287
Viewing a Directory Services Group Members
l
The Available Groups box lists a different set of Group categories with
each folder you select. For example, clicking the Users folder shows a
different set of Group categories than if you click the Laptops folder.
5. In the folder list, click the Group category you want to work with.
6. In the Available Groups list, do the following:
l
Click the check box for each Group you want to synchronize with LEM.
l
Clear the check box for each Group you want to remove from
synchronization.
7. Repeat Steps 5 and 6 until you have selected all of the DS Groups you want
synchronized with LEM.
8. Click Save.
The system synchronizes the DS Groups to LEM and adds them to the Groups grid.
The DS Groups are now ready for use with your rules and filters.
Viewing a Directory Services Group Members
The Groups grid shows each DS Group that is synchronized with LEM. When you select a DS Group
in the Groups grid, the Directory Service Groups pane appears to show the members of that DS
Group.
To view a DS Group:
1. Open the Build >Groups view.
2. In the Groups grid, select the DS Group you want to view. The Edit pane opens,
showing the Directory Services Group form. The form displays the contents of the
Group,.
Directory Services Group Grid Columns
The grid in the Directory Services Group form provides information on each specific computer
account and user account that is currently associated with the DS Group. The following table
describes the meaning of each grid column.
288
Chapter 14: Advanced Configurations
Column
Type
Description
Displays an icon that shows if the group member is a User or a Computer. The
computer icon represents a computer account. The person icon represents a user
account.
Name
Displays the display name of the group member.
Description Displays the description associated with the group member in directory services.
SAM Name Displays the account name of the member.
Principal
Displays the principal name of the member.
Name
Distinguish Displays the complete distinguished name of the member.
Name Date
Email
Displays the email address of the member.
Deleting DS Groups
You can delete DS Groups from the Console, just as you would any other Group. Deleting a DS
Group does not remove the Group from your original directory service. You can restore a DS Group at
any time if you ever need to use it again.
Configuring Email Templates
Email templates allow you to create pre-formatted email messages that rules can use to notify you of
an alert event. These templates become available in the Actions component list, whenever you drag
Send Email Message or Send Pager Message to the Actions box. You will then be prompted to fill
in the message variables from the Events or Event Groups lists.
You create and manage templates in the Build >Groups view’s Email Template form. As with
rules, you can add, edit, clone, and delete templates, and you can organize them in folders.
Step 1: Creating the Email Template
This section describes how to create the actual email template. Email templates allow you to report
specific information about an alert event, because you can include variables that capture specific
289
Step 1: Creating the Email Template
parameters about that event. For example, you can report which server is affected, what time the
event occurred, or which Agent was shut down. The possibilities for message templates are endless.
To create an email template:
1. Open the Build >Groups view.
2. In the Groups grid, do one of the following:
l
Click
and then click Email Template to add a new email
template
l
Double-click the email template you want to edit.
The Email Template form appears. If you are editing an existing template, the form
shows any parameters that have already been configured for the template.
3. In the Manager list, select the Manager on which this template resides. If you are
editing an existing template, this field shows the Manager this template is associated
with.
4. In the Name box, type a name for the template. This should be a name that makes it
easy to identify the type of event that has occurred, or where or to whom the email
message is going.
5. In the From box, type whom the message is from. Typically, this is “SolarWinds” or
“Manager.”
290
Chapter 14: Advanced Configurations
6. In the Subject line, type a subject for the message. Typically, you will want a subject
that indicates the nature of the alert event.
7. Click Save to save the template.
Step 2: Adding Message Parameters
In the Parameters list, you will add variables that are placeholders for specific items within the
message text. When the Manager sends the message, it will complete the message by filling in the
variable parameters with the appropriate text. You can add as many parameters as you like.
For example, you may want a message to tell you which Agent or server was affected. Or you may
want to know the time the event occurred. So you can create a variables for Agents, servers, or time.
In the previous example, there are parameters for the server and for the destination computer.
If you add too many or unnecessary parameters, you can easily delete the ones you don’t need.
To add message parameters:
1. In the Name box, type the name of the parameter you want to capture in the email
message.
2. Click the Add
button. The new parameter appears in the Parameters list.
3. Repeat Steps 1 and 2 for each parameter you want to capture in this message.
4. Click Save so save your changes to the template.
To delete a parameter:
1. In the Parameters list, select the parameter you want to delete.
2. Click the Delete
button.
3. The parameter disappears from the Parameters list.
4. Click Save to permanently delete the parameter.
291
Step 3: Creating the message
Step 3: Creating the message
Now, in the Message box, you will create the actual text of the email message.
To create an email template message:
1. In the Message box, type the email message that the Manager is to send when an
event occurs, like in the example shown here.
2. In the Parameters list, select a parameter. Then drag it to the appropriate spot in the
message text. The parameters serve as placeholders for information that the Manager
will fill in.
3. Repeat Step 2 for each parameter.
4. When you have finished with the template, click Save. The new template appears in
Groups grid.
Managing email template folders
As with rules and State Variables, you can use the Folders pane to organize your email templates
into folders and sub-folders. You can add, rename, move, and delete template folders.
292
Chapter 14: Advanced Configurations
Configuring State Variables
You can use the Groups grid to add, edit, and delete State Variables and the number, text, and time
fields associated with each State Variable.
State Variables are used in rules. They represent temporary or transitional states. For example, you
can create a State Variable to track the “state” of a particular system, setting it to a different value
depending on whether the system comes online or goes offline.
You can also configure rules to monitor the contents of a State Variable to validate or invalidate a rule.
For example, you can set a DEFCON value and ensure that the DEFCON value is over 3 before
notifying on-call staff.
Note: If you require permanent lists of data that can be preserved over long periods of time, you can
use User-Defined Groups in a similar manner.
Adding new State Variable fields
1. Open the Build >Groups view.
2. In the Groups grid, do one of the following:
l
To add a new State Variable, click
and then click State Variable.
l
Double-click the State Variable you want to edit.
l
Click the gear
icon for the State Variable you want to edit, and then
click Edit.
The State Variables pane opens as an editable form. If you are editing an existing
State Variable, the form shows any fields that have already been configured.
293
Adding new State Variable fields
3. In the Name box, type a name for the State Variable.
4. In the Manager list, select the Manager on which this State Variable is to reside. If you
are editing an existing Group, this field shows the Manager on which it resides.
Now add the State Variable fields that make up the Group. Adding State Variable fields
is a straightforward process. You name the field, and then select what the variable
represents—text, a number, or time.
5. Click the Add
button. The Add Variable Field form becomes active.
6. In the Name box, type a name for the State Variable field.
7. In the Type list, select the type of State Variable the field represents—Text, Number,
or Time.
8. Click the left Save button to save the field; otherwise, click Cancel. The new State
Variable field appears in the State Variables grid, showing the field’s name and
comparison type.
9. Repeat Steps 5–8 for each field you want to add to the State Variable.
10. Click the rightmost Save button to save the State Variable settings.The new State
Variable appears in the Groups grid and the Rule Builder’s State Variables list. You
can now incorporate this State Variable whenever you add or edit a rule.
294
Chapter 14: Advanced Configurations
Editing State Variable fields
1. Open the Build >Groups view.
2. In the Groups grid, do either of the following:
l
Double-click the State Variable you want to edit.
l
Click the gear
icon for the State Variable you want to edit, and then
click Edit.
The State Variables pane opens as an editable form.
3. In the fields grid, select the State Variable field you want to edit. The Add Variable
Field form becomes active, showing the field’s current configuration.
4. Make the necessary changes to the field’s Name or Type.
5. Click the form’s Save button to apply your changes to the field. The updated field
appears in the fields grid.
6. Click the rightmost Save button to save your changes to the State Variable.
Deleting State Variable fields
1. Open the Build >Groups view.
2. In the Groups grid, do either of the following:
l
Double-click the State Variable you want to edit.
l
Click the gear
icon for the State Variable you want to edit, and then
click Edit.
The State Variables pane opens as an editable form.
3. In the fields grid, select the field you want to delete.
4. Click the Delete
295
Managing State Variable Folders
button. The field disappears from the fields grid.
5. Click Save to save the changes to the State Variable.
Managing State Variable Folders
As with rules and email templates, you can use the Folders pane to organize your State Variables
into folders and sub-folders. You can add, rename, move, and delete State Variable folders.
Configuring Time of Day Sets
Time of Day Sets are Groups of hours that you can associate with rules and filters. Time of Day Sets
allow your rules and filters to take different actions at different times of day.
For example, if you define two different Time of Day Sets for “Business Hours” and “Outside
Business Hours,” you can assign different rules to each of these Time of Day Sets. For instance, you
may want your rules to alert your system administrator via email and pager during working hours.
Outside of business hours, you may want your rules to alert your administrator by pager only, and
automatically shut down the offending PC.
You can easily create as many Time of Day Sets as you needed, to reflect all of your business needs.
A well-planned group of Time of Day Sets provides you with versatile and responsive rules that
perform the way you want, when you want.
Each Time of Day Set you create only applies to the Manager that is selected when you create it. If
you need a similar Time of Day Set for another Manager, then you must create it separately with that
other Manager.
Configuring a Time of Day Set
1. Open the Build >Groups view.
296
Chapter 14: Advanced Configurations
2. In the Groups grid, do either of the following:
l
To add a new Time of Day Set, click
and then click Time of Day
Set.
l
Double-click the Time of Day Set you want to edit.
The Edit pane opens, showing the Time of Day Set form.
3. In the Name box, type a name for the new Time of Day Set.
4. In the Description box, type a brief description of the Time of Day Set and its intended
use.
5. In the Manager list, select the Manager on which this Time of Day Set is to reside. If
you are editing an existing Group, this field shows the Manager on which it resides.
The form has a time grid that lets you define a Time of Day Set for the Manager. The
time grid is based on a one-week period, and is organized as follows:
l
It has seven rows, where each row represents one day of the week.
l
It has 24 numbered columns, where each column represents one hour of
the day. The white column headers represent morning hours (midnight to
297
Selecting periods in the time grid
noon). The shaded column headers represent evening hours (noon to
midnight).
l
Each column has two check boxes that divide each hour into two halfhour (30-minute) periods.
Together, the rows, columns, and check boxes divide an entire week into 30-minute
periods.
6. In the time grid, click to select the half-hour periods that are to define this Time of Day
Set. For assistance, see the table in the topic, below.
7. Click Save. The new Time of Day Set appears in the Groups grid.
Selecting periods in the time grid
1. In the Connectors grid, click to select the connector instance you want to delete.
2. Click the gear
button and then click Delete.
3. At the confirmation prompt, click Yes.
4. Do one of the following:
l
Click Activate to apply your changes to every Agent associated with the
Connector Profile.
l
Click Discard to discard your changes and reload the previous
configuration.
5. Click Close to return to the Groups grid.
Configuring User-Defined Groups
User-Defined Groups are groups of preferences that are used in rules and filters. User-Defined
Groups allow you to match, include, or exclude events, information, or data fields based on their
membership in a particular Group.
298
Chapter 14: Advanced Configurations
Examples of User-Defined Groups
In most cases, User-Defined Groups are used as a type of white list or blacklist for choosing which
events to include or to ignore. When used by a filter, a User-Defined Group lets you limit the scope of
the alerts included in the filter to those items that have membership in a particular Group.
Each User-Defined Group is made up of one or more elements that define the Group. The elements
can be almost anything: IP addresses, user names, email addresses, web site URLs, etc. Because
of their versatility, the possibilities of User-Defined Groups are almost endless.
For example, you may want to create a Group of trusted IP addresses that you can use in rules and
filters. You can then refer to this Group in a rule. For instance, your rule may dictate to never block
these IP addresses.
Or you may want to create a Group of trusted accounts for the local administrator. You could then
format your rules so that they never block these accounts. Or, because these accounts are trusted,
you may want to watch them more carefully so that you are notified whenever they log on or make
changes.
You can create as many User-Defined Groups as you need to reflect all of your different rule and
filtering needs. Well-planned User-Defined Groups can provide you with the precise feedback active
responses you need to manage and maintain your network security.
Each User-Defined Group you create only applies to the Manager that is selected when you create it.
If you need a similar User-Defined Group for another Manager, then you must create it separately with
that other Manager.
Configuring a User-Defined Group
1. Open the Build >Groups view.
2. In the Groups grid, do one of the following:
l
To add a new User-Defined Group, click
and then click User-
Defined Group.
l
Double-click the User-Defined Group you want to edit.
299
Adding data elements to a User-Defined Group
The Edit pane opens, showing the User-Defined Group form. If you are editing an
existing User-Defined Group, the form shows any parameters that have already been
configured for the Group.
3. In the Name box, type a name for the Group.
4. In the Description box, type a brief description of the Group and its intended use.
5. In the Manager list, select the Manager on which this Group resides. If you are editing
an existing Group, this field shows the Manager on which it resides.
6. Make any necessary additions, changes, or deletions to the Group’s Element Details
grid,
7. Click Save to save your changes to the User-Defined Group.
Adding data elements to a User-Defined Group
Once you have created a User-Defined Group, you can add the data elements that make up the
Group.
300
Chapter 14: Advanced Configurations
To add a User-Defined Group’s data elements:
1. Open the Build >Groups view.
2. In the Groups grid, double-click the User-Defined Group you want to work with.
The Edit pane opens, showing the Group’s current configuration.
3. At the bottom of the Edit pane, click the Add
button.
The Element Details form becomes active.
4. Complete the Element Details form as described in the following table.
Field
Description
Name
Type a name for the data element.
Data
Type the specific data element that you want to include or ignore in
your rules and filters. You can use an asterisk ( * ) as a wild card to
include all similar data elements.
Description Type a detailed description of the data element and its intended use, if
appropriate.
In this example, the data elements are a list of anti-virus firewall processes.
5. Click Save.
The new element appears in the data element grid. Note that the table displays each
element’s name, data element, and description.
301
Editing a data element in a User-Defined Group
6. Repeat Steps 3–5 for each data element you want to add to the Group.
Editing a data element in a User-Defined Group
1. Open the Build >Groups view.
2. In the Groups grid, double-click the User-Defined Group you want to work with.The
Edit pane opens, showing the Group’s current configuration.
3. In the form’s data element grid, select the data element you want to edit. The Element
Details form displays the data element’s current configuration.
4. Make the necessary changes to the Element Details form.
5. Click Save to save your changes to the Group. The revised data element appears in the
data element grid.
Deleting a data element from a User-Defined Group
1. Open the Build >Groups view.
2. In the Groups grid, double-click the User-Defined Group you want to work with.The
302
Chapter 14: Advanced Configurations
Edit pane opens, showing the Group’s current configuration.
3. In the form’s data element grid, select the data element you want to delete.
4. Click the Delete
button. The element is removed from the Group’s data element
grid.
5. Click Save to save the changes to the Group.
The following table explains how to select periods in the Time of Day Sets time grid.
To
Select a
Do this
Click an individual check box to select that period.
period
Select a
Click and drag to select a range of periods. You can drag up, down, or diagonally.
group of
periods
Move a
Click the block of hours you want to move, holding down the mouse button so the
block of
pointer turns into a “grabbing” hand. Then drag the hour block into its new position.
selected
hours
Duplicating Press the Ctrl key. Then click the block of hours you want to copy, holding down the
a block of
mouse button so the pointer turns into a “grabbing” hand. Then drag a copy of the hour
selected
block into position.
hours
303
Configuring Connector Profiles
To
Do this
Invert your Click the Invert button to select the opposite hours of the ones you have manually
selection
selected
This feature is useful when you want to select all but a few hours of the day. You can
select the hours that do not apply to the Time of Day Set, and then click Invert to
automatically select all of the hours that do apply to the Time of Day Set. For example,
if you have your business hours selected, clicking Invert would select everything
outside of your business hours.
Delete a
Click the check box to clear that selection. You can also click and drag over a range of
selected
selected periods to clear those selections.
period
Configuring Connector Profiles
Most Agents in a network have only a few different connector configurations. Because of this, the
Group Builder lets you group Agents that share the same configurations into Connector Profiles.
Once you define a Connector Profile, your rules and filters can use it to include or exclude the Agents
associated with that profile.
You can create as many Connector Profiles as you need to reflect each of your common network
security connector configurations. For example, you might set up a standard user workstation profile,
a web sever profile, etc. SolarWinds provides several default Connector Profiles that address
common configurations.
One of the great benefits of using Connector Profiles is that you can maintain all of the Agents in a
profile at once by updating only the Connector Profile’s connector configuration. The Group Builder
then propagates your changes to all of the Agents in the profile.
A well-planned set of Connector Profiles provides you with a versatile and efficient method to update
and maintain your Agents’ connector configurations.
304
Chapter 14: Advanced Configurations
Connector Profile Rules
l
An Agent can only be a member of one Connector Profile. It cannot be in multiple
profiles.
l
Each Connector Profile you create only applies to the Manager that is selected when
you create it. If you need a similar Connector Profile for another Manager, you must
create it separately for the other Manager.
Creating a Connector Profile (general procedure)
Connector Profiles are created in the Build >Groups view. Creating a Connector Profile is a twostep process:
1. Select the Agent that is to act as a template for the profile.
2. Add the Agents that are to be members of the profile. Upon saving, the system applies
the template Agent’s connector configuration to every other Agent that you added to the
profile.
When you select an Agent for use as a template, select one that has a very similar configuration to
how you want profile’s final connector configuration to look.
One trick is to prepare a template Agent in advance, by manually configuring an Agent that you know
will be a member of the new profile. Edit them exactly how you want them. Then use the Agent as the
template for the new profile. This minimizes your need to edit the profile’s connector configuration
later on.
The complete procedure for creating at Connector Profile is given below.
Step 1: Selecting a template for the profile
In this procedure, you will create, name, describe, and select a template for the new Connector
Profile.
305
Step 1: Selecting a template for the profile
To create a Connector Profile:
1. Open the Build >Groups view.
2. On the Groups grid connector bar, click
and then click Connector Profile. The
Connector Profile form appears.
3. In the Name box, type a name for the Connector Profile.
4. In the Description box, type a brief description of the Connector Profile and its
intended use.
5. In the Manager list, select the Manager on which this Connector Profile is to reside. If
you are editing an existing Group, this field shows the Manager on which its resides.
Note: If the Manager you want is not listed, go to Manage >Appliances and log on to
that Manager. You must be logged on to a Manager before you can create Groups for it.
6. In the Template list, select the Agent with the connector configuration this profile is to
be based on. If you do not want to use a template, select None.
Note: For best results, always select a template when creating a new Connector
Profile. Otherwise, the profile will delete the connectors on every Agent in the profile.
If you do not want to use a template, then be sure click Edit Connectors and add
connectors to the profile before you add Agents and save the profile. If you do not, there
306
Chapter 14: Advanced Configurations
will be no connectors in the profile; and upon saving, any Agents in that profile will have
theirs deleted.
7. Click Save. The new Connector Profile appears in the Groups grid.
Step 2: Selecting the Agents that are members of the profile
Now you will select the Agents that are to be members of the Connector Profile. These Agents are
governed by the Connector Profile’s connector configuration.
The Connector Profile form contains two list boxes. The Available Agents box lists each Agent
that is associated with the Manager but is not in the Connector Profile. The Selected Agents box
lists those Agents that are in the Connector Profile.
To add Agents to a Connector Profile:
1. In the Groups grid, locate the new Connector Profile you just created.
2. Double-click the Connector Profile to re-open it. The profile appears in the Connector
Profile form. As you can see, the Agent you selected as a template appears in the
Selected Agents list, by default.
3. In the Available Agents list, select an Agent that you want to add to the Connector
Profile. Or, in the Selected Agents list, select an Agent that you want to remove from
the Connector Profile.
4. Use the appropriate arrow button to add or remove Agents to or from the profile, as
described in the following table.
Button
Function
Moves the selected Agent from the Available Agents list to the Selected
Agents list (and into the profile).
Moves all Agents from the Available Agents list to the Selected Agents
list (and into the profile).
307
Editing a Connector Profile’s Connector Settings
Button
Function
Removes the selected Agent from the Selected Agents list to the
Available Agents list (and out of the profile).
Removes all Agents from the Selected Agents list to the Available Agents
list (and out of the profile).
5. Click Save to save the Connector Profile. Upon saving, the system applies the
template Agent’s connector configuration to every other Agent that you added to the
profile.
Note: If you remove an Agent from a Connector Profile (that was previously saved with
that profile), the Agent retains the profile's connector configuration, but will no longer
have membership in the profile.
Troubleshooting tip
At times, not all of the Agents in a Connector Profile will use the same logging path for a particular
connector. You can verify this by checking the Agent’s configured connector status. If a connector
has a status of
(Not Running), it is likely that connector has a different logging path.
To correct this problem, you may want to add another connector instance to the profile’s connector
catalog that points to the alternative logging path. Or, you can create a new profile that has the
alternative logging path.
Editing a Connector Profile’s Connector Settings
When editing a Connector Profile, you can use the Connector Profile form’s Edit Connectors
command to add, edit, or delete the connector instances associated with the profile. When doing this,
be aware that when you change a Connector Profile, you change the connector configuration of every
Agent that is associated with that Connector Profile.
When editing an individual Agent, you have to stop and start each connector instance, because you
are making direct changes to the running configuration of the Agent. But when editing a Connector
308
Chapter 14: Advanced Configurations
Profile’s configuration, you do not need to stop or start each connector instances. However, you must
still activate the changes.
This difference is because any time you edit a Connector Profile’s connector configuration, you are
working on the profile’s configuration data, not an actual Agent. When editing a Connector Profile, you
do not actually change the Agents that are members of the profile until you click Activate. Upon
activating, the system automatically sends the changes out to every Agent that is a member of that
profile, stops each connector instance, makes the changes, and then restarts each connector
instance.
Opening a Connector Profile’s Settings
1. Open the Build >Groups view.
2. In the Groups grid, locate the Connector Profile you want to edit.
3. Do one of the following:
l
Double-click the Connector Profile you want to edit.
l
Click the gear
button and then click Edit.
The Connector Profile pane opens, showing the Agents that are in the profile.
4. At the bottom of the Connector Profile pane, form, click Edit Connectors.The
Connector Configuration for [Connector Profile] form appears. The form’s
Connectors grid contains all of the connector instances that define the Connector
Profile.
Adding a New Connector Instance
1. On the Connectors grid, select the connector you want to configure.
2. Click New.
3. Update the connector settings using the Properties form:
309
Editing a Connector Profile’s Connector Settings
4. Click Save.
5. Do one of the following:
l
Click Activate to apply your changes to every Agent associated with the
Connector Profile.
l
Click Discard to discard your changes and reload the connectors
previous configuration.
6. Click Close to return to the Groups grid.
Editing a Connector Profile’s Connector Settings
1. In the Connectors grid, select the connector instance you want to edit.
2. Click the row’s gear
button and then click Edit.
3. In the Properties form, update the connector settings, as needed:
4. Click Save.
5. Do one of the following:
l
Click Activate to apply your changes to every Agent associated with the
Connector Profile.
l
Click Discard to discard your changes and reload the previous
connectors configuration.
At times, not all of the Agents in a profile will use the same logging path for a particular
connector. You can verify this by checking the Agent’s configured connector status. If
a connector has a status of
(Not Running), it is likely that connector has a different
logging path.
To correct this problem, you may want to add another instance to the connector
profile’s connector catalog that points to the alternative logging path. Or, you can create
a new profile that has the alternative logging path.
310
Chapter 14: Advanced Configurations
6. Repeat this procedure for each connector instance you want to reconfigure.
7. Click Close to return to the Groups grid.
Managing Rules
The topics in this section explain how to manage your rules. Many management tasks can be done
from the Rules grid, or in Rule Builder as you are configuring a rule.
Rule Creation
In the Build > Rules view, the Rule Creation tool is used to configure new rules and to edit existing
rules.
Like filters, you create rules by configuring conditions between alert variables other components,
such as Time of Day Sets, User-Defined Groups, Constants, etc. However, rules go a step further.
They let you correlate alert variables with other alerts and their alert variables.
By correlate, we mean you can specify how often and in what time frame the correlations must be
met before the rule is triggered. The combined correlations dictate when the rule is to initiate an active
response.
You can configure rules to fire after multiple alerts occur. The Manager will remember alerts if they
meet the rule's basic conditions. It waits for the other conditions to be met, too. If they are, the
Manager fires the rule. The rule does not take action until the alerts meet all of the conditions and
correlations defined for that rule.
The possibilities for rules are endless. Therefore, this section describes how to create rules only in
very general terms. This section is not intended to be a tutorial, but rather a reference for you to fall
back on if you are unclear about how any part of Rule Creation works.
(missing or bad snippet)
Caution: Practice with filters before creating rules
The connectors in Rule Creation are very similar to those found in Filter Creation. However, filters
report event occurrences; rules act on them. There is no harm if you create a filter that is unusual or
311
Rule Creation Features
has logic problems. But this is not the always case with rules. Rules can have unexpected and
sometimes unpleasant consequences if they are not configured exactly as you intend them to be.
Inexperienced users should use caution when creating rules. Creating filters is an excellent way to
familiarize yourself with the logic and connectors needed to create well crafted rules. You should only
begin configuring rules after you are at ease with configuring filters. Even then, always test your rules
before implementing them.
Rule Creation Features
The topics in this section describe the key features of the Rule Creation view, the rule window, and
the Correlations box, which are all used to configure and edit policy rules.
l
The Rule Creation view is a different view of the Rules view that allows you to
configure and edit policy rules.
l
The rule window is the window that you will use to view, configure, and edit your policy
rules.
l
The Correlations box is a component of the rule window that is used to configure the
specific correlations that define the rule.
The following table descries the key features of the Rule Creation connector. The topics that follow
discuss some of these features in greater detail.
Name
Description
Back to
Click this button to hide Rule Creation and return to the Rules grid. Rule Creation
Rules
remains open in the background, so you can return to it to continue working on your
Listing
rules.
In the Rules grid, clicking Back to Rule Creation will return you to Rule Creation.
List pane
The list pane is the “accordion” list to the left. It contains categorized lists of the
components you can use when configuring policy rules.
It behaves exactly like the list pane in Filter Creation. To view the contents of a
component list, click its title bar. To add a component to a rule, select it from its list and
then drag it into the appropriate correlation box.
312
Chapter 14: Advanced Configurations
Name
Description
Rule
Each rule you create or edit appears in its own rule window. This is where you configure
window
name, describe, configure, edit, test, verify, and enable each rule.
You can have multiple rule windows open at the same time. You can also minimize,
maximize, resize, and close each window, as needed.
Minimized Any minimized rule windows appear in the bar at the bottom of the Rule Creation
rule
pane, behind the active rule window. Each minimized window shows the name of its
window
rule. Clicking a minimized rule opens that rule in the Rule Creation pane.
bar
Advanced Thresholds
Whenever a Group threshold or the Correlation Time form’s Events within box has a value greater
than 1, the Set Advanced Thresholds
button becomes enabled. This button opens the Set
Advanced Thresholds form, so you can define an alert event threshold and the re-inference period
for that threshold. The threshold tells the Manager which specific alert fields to monitor to determine if
a valid alert event has occurred (i.e., when to “count” the alert).
For example:
l
Threshold event x must occur multiple times on the same destination computer with the
frequency defined in the Correlation Time box.
l
Or, threshold event y must occur on different destination computers with the frequency
defined in the Correlation Time box.
When the threshold event counter increases to the number shown in the Events box, the threshold
itself becomes true and triggers the next set of conditions in the rule.
Opening the Set Advanced Threshold form
l
In the Correlations box, click the
button on the nested group you want to work with.
l
In the Correlation Time box, click the
313
button.
Setting an advanced threshold
Setting an advanced threshold
1. Open the Set Advanced Thresholds form.
2. Select the Re-Infer (TOT) check box if you want to define a second threshold. Then
use the adjacent fields to type or select the threshold’s time interval and unit of
measure.
The Re-Infer (TOT) option defines the period in which an alert must remain above the
threshold before the system issues a new notification and/or active response.
For example, suppose an alert has exceeded the threshold, and the alert’s Re-Infer
(TOT) period is 1 Hour. If the alert stays above the threshold for more than 1 hour, the
system will issue an additional notification or active response at the end of 1 hour.
Adding a Threshold Field
1. Click
to open the Set Advanced Thresholds form.
2. At the bottom of the form, click Add.
The Available Fields pane has two boxes. The top box lists all of the alerts that have
been applied to the rule’s Correlations box. The bottom box lists the alert fields
associated with whichever alert is currently selected in the top box.
3. In the top Available Fields box, select an alert. The fields associated with that alert
appear in the lower Available Fields box.
4. In the lower Available Fields box, select the alert field that is to help define the alert
threshold.
314
Chapter 14: Advanced Configurations
5. Below the Available Fields boxes, there is a drop-down list. It is called the Select
Modifier list. In the Select Modifier list, select the appropriate option:
l
Select Same if the threshold is to be defined by the selected field being
the same multiple times.
l
Select Distinct if the threshold is to be defined by the selected field being
different each time.
6. Click
.
The field and its modifier appear in the Selected Fields grid.
7. Repeat Steps 2 – 6 for any additional threshold fields.
8. Click OK to save the fields to the threshold and close the form; otherwise, click
Cancel.These fields now raise the threshold for the correlation event and its active
response to occur.
Editing threshold fields
You cannot actually edit a threshold field. Instead, you must delete it, and then replace it with a
corrected field configuration.
To replace a threshold field:
1. Click
to open the advanced threshold you want to work with.
2. In the Selected Fields list, click
to remove the field you want to change.
3. In the Available Fields list, select the appropriate alert, and then the alert field.
4. in the Select Modifier list, select the new modifier for the field (Same or Distinct).
5. Click
.
The corrected field and its modifier appear in the Selected Fields box.
6. Click OK to close the form.
315
Deleting a threshold field
Deleting a threshold field
1. Click
to open the advanced threshold you want to work with.
2. In the Selected Fields list, select the field you want to delete.
3. Click the Delete
button.
The threshold field disappears from the Selected Fields list.
4. Click OK to close the form.
Using the Actions box
In Rule Creation, the Actions box defines which action response the Manager is to take whenever
the correlation events specified by the rule occurs. You can assign more than one action to a rule. For
example, you may want to shut down an Agent, and then notify your system administrator of the
event via email.
The fields in the Actions box indicate where the action is to be performed, what the action is
supposed to do, and to whom it is supposed to happen. For example, if you want a rule to disable a
user, you could select the action called Disable Domain User Account. For the action to apply, you
must specify which account you want to disable, and where you want to disable it (that is, which
Agent).
Using constants and fields to make actions flexible
When configuring an action, you can assign constants that define fixed parameters for a rule. Or you
can assign alert fields (from the alerts in the Correlations box). Fields determine a rule’s parameters
when some degree of flexibility is required. Constants and fields both have their uses. But fields can
provide actions with a great deal of flexibility.
Say you have two network users: Bob and Jane. To disable Bob’s user account, you could assign a
constant to the rule that explicitly represents Bob’s account. But doing so limits the rule to Bob's
account.
316
Chapter 14: Advanced Configurations
Now if you assign a field to the rule, the rule can be interpreted as follows: “When user activity meets
the conditions in the Correlations box to prompt the Disable Domain User Account action, use the
alert's UserDisable.SourceAccount field to determine which user account to disable.”
If Bob triggered the rule, the Manager disables Bob’s account. But if Jane also triggers the rule, the
Manager can disable her account, too.
Configuring a Rule’s Actions
Use the following high-level procedure to configure a rule’s actions.
To configure a rule's actions:
1. In the list pane, click the Actions list to open it.
2. Select the action you want, then drag it to the rule window’s Actions box.
The top left of the Actions box shows the name the action that is to be taken. In most
cases, the Actions form will prompt you for specific parameters about the computer, IP
address, port, alert, user, etc., that is to receive the action.
3. Use the list pane to assign the appropriate alert field or constant to each parameter:
l
In the Events or Event Groups lists, select an appropriate alert field for
each parameter, and drag it to the appropriate parameter box in the
Actions form.
l
When needed, in the Constants list, select a constant for a parameter,
and then drag it to the appropriate parameter box in the Actions form.
317
Adding a New Rule
Typically, you will select a text constant. Once the constant is in place,
double-click the parameter box to edit the constant.
4. Click Save to save your changes.
Adding a New Rule
Follow this general procedure whenever you want to create a new rule. Be sure to test your rules
before fully implementing them. Testing helps ensure that your rules do not cause any unpleasant
consequences.
To add a new rule:
1. Open the Build >Rules view.
2. On the Rule grid connector bar, click
. The Rule Creation connector appears.
Note: At any time while you are configuring a rule, you can click the Back to Rules
Listing button to return to the Rules grid. Rule Creation remains open in the
background.
3. In the Name box, type a name for the rule. Note that the name also appears on the
form’s title bar.
4. In the on list, select the Manager on which this rule is to reside.
5. In the in list, select the folder and sub-folder in which this rule is to be stored in the
Folders pane.
6. In the Description box, type a complete description of the rule, such its use, purpose,
or behavior.
7. Configure the rule's correlations.
8. If needed, configure the rule's correlation time and advanced threshold.
9. Configure the rule's active response.
318
Chapter 14: Advanced Configurations
10. Apply the appropriate Enabled, Test, and Subscription settings.
l
To assign rule subscribers, click the Subscribe list, and then click the
check box for each user who is to subscribe to the rule.
l
If you want to use the rule immediately upon saving it, select the
Enabled check box.
l
If you want to operate the rule in test mode before fully activating it,
select the Test check box. It is highly recommended that you operate
each new rule in test mode to confirm that the rule behaves as expected.
11. When you are satisfied with the rule’s configuration, click Save.
Note: You can also click Apply to save your changes without closing the form.
The Rules grid appears. The new rule appears in the Rules grid and in the Folders
pane, in the folder you designated for the rule.
12. To begin using (or testing) the revised rule, click Activate Rules.
Rule Window Features
Each rule you create or edit appears in its own rule configuration window. You will use these windows
to design and edit custom policy rules. You can use the rule window to name, describe, configure,
edit, enable, and test your custom rules.
319
Rule Window Features
320
Chapter 14: Advanced Configurations
The following table describes each key feature and field of a rule window.
Item
Name
Title bar
Description
Each rule you create or edit appears in its own configuration window.
Upon naming a rule, the window’s title bar displays the name of the rule.
You can also use the title bar to minimize, maximize, and resize rule
window. Minimized rule windows appear at the bottom of the Rule
Creation pane.
Name
Type a name for the rule.
on
When creating a new rule, use this list to select which Manager the rule
is to be associated with. Otherwise, when editing a rule, this field
displays which Manager the rule is associated with.
in
Select the folder (in the Folders pane) in which the rule is to be stored.
Description
Type a description of what the rule does, or the situation for which the
rule is intended.
If the description extends beyond the visible area of the text box, a
larger text box appears, so you can type a detailed description of the
rule, its logic, its expected behavior, and its active response. When you
are done typing, either press Tab or click anywhere outside the text box
to close it.
Enable
Select this check box to enable the rule. Clear this check box to disable
the rule.
Test
Select this check box to place the rule in test mode. Clear this check
box to take the rule out of test mode.
Note: You must enable a rule before you can test it.
Subscribe
Use this list to select which Console users are to subscribe to the rule.
This means the system will notify the subscribing users Consoles each
time one of the subscribed-to rules triggers an alert. The alerts will
appear in their alert grid.
321
Rule Window Features
Item
Name
Rule Status
Description
The Rule Status bar lists warnings and error messages about your
rule's current configuration logic.
n
Click >to view a list of warning and error messages.
n
Click a message flag to provide detailed information about the nature
of that problem.
n
Click a message to highlight the specific area or field that is the
source of that problem.
Correlations
Use the Correlations box to configure correlations between groups of
alert events. You can coordinate multiple alert events into a set of
conditions that will prompt the Manager to issue a particular active
response.
You set up correlations by dragging items from the Events and Event
Groups lists into this box, and then setting the specific conditions or for
the alert that are to prompt action.
The Correlations connector bar lets you group alert conditions, and
determine if they must all apply (an AND correlation) or if any of them
may apply (an OR correlation) to prompt a response.
Correlation Time Use the Correlation Time box to establish the allowable frequency and
time span in which the correlation events must occur before the rule
applies.
The Advanced section lets you define an alert event threshold, and to
define the re-inference period for the threshold. The threshold tells the
Manager which specific fields to monitor to determine if a valid alert
event has occurred (i.e., when to “count” the alert).
The box’s Advanced section lets you define a Response Window that
lets the rule ignore any events that occur outside (past or future) of the
established period.
322
Chapter 14: Advanced Configurations
Item
Name
Actions
Description
Use the Actions box to dictate which actions the rule is to execute
when the events described in the Correlations and Correlation Time
boxes occur. Examples of actions include sending an email message to
your system administrator, or blocking an IP address.
Undo/Redo
Click the Undo button to undo your last desktop action. You can click
the Undo button repeatedly to undo up to 20 steps.
Click the Red button to redo a step that you have undone. You can click
the Redo button repeatedly to redo up to 20 steps.
You can only use Undo or Redo for any steps you made since the last
time you clicked Apply.
Save/Cancel/
Apply
Use these commands to save or cancel your work:
n
Click Save to save your changes to a rule and close the rule window.
n
Click the Cancel button to cancel any changes you have made to a
rule since the last time you clicked Save, and close the rule window.
If you have any unsaved changes, the system will prompt you to save
or discard them.
n
Click Apply to save your changes to a rule, but keep the rule window
open so you can continue working. You can click Apply at any time.
323
Correlations Box Features
Correlations Box Features
To create a rule, you drag items from the list pane into the rule window’s Correlations box to
configure the relationships (or correlations) that define the rule. These correlations define the events
that must occur for the rule to take effect.
Creating rule correlations is a lot like configuring conditions for custom filters, so the Correlations
box in Rule Creation behaves a lot like the Conditions box in Filter Creation. The following table
describes each item shown in the Correlations box, above.
Name
Description
►
Groups can be expanded or collapsed to show or hide their settings:
▼
n
Click to >expand a collapsed group.
n
Click to ▼ collapse an expanded group.
Once a group is configured properly, you may want to collapse it to avoid accidentally
changing it.
This is the Group button. It appear at the top of every group box. Click it to create a new
group within the group box. A group within a group is called a nested group. You may
then drag alert variables and other items from the list pane into the nested group box.
By using nested groups, you can refine correlations by combining or comparing one
group of correlations to another to create the logic for complex correlations.
Each group is subject to AND and OR relationships with the groups around it and within
it. By default, new groups appear with AND comparisons.
This is the Threshold button, which opens the Threshold form for a group. The
Threshold form is described below.
This is the Delete button. It appears at the top of every Group box and every
correlation. Click this button to delete a correlation or a particular group. Deleting a
group also deletes any groups that are nested within that group.
324
Chapter 14: Advanced Configurations
Name
Description
Event
From the Events, Event Groups, or Fields list, drag an alert, Event Group, or alert field
variable
into the Correlations box. This is called the alert variable. A rule can have multiple
alerts and Event Groups in its correlation configuration.
You can think of an alert variable as the subject of each group of correlations. As alerts
stream through the Manager, the rule analyzes the values associated with each alert
variable to determine if the alert meets the rule’s conditions. If so, the Manager either
initiates an active response, or stores the alert for comparison with other alerts that may
occur within the rule's allotted time frame.
Operators Whenever you drag a list item or a field next to alert variable, an operator icon appears
between them. The operator states how the filter is to compare the alert variable to the
other item to determine if the alert meets the rule’s conditions.
n
Click an operator to cycle through the various operators that are available for that
comparison. Just keep clicking until you see the operator you want to use.
n
Ctrl+click an operator to view all of the operators that are available for that
comparison. Then click to select the specific operator you want to use.
List item
List items are the various non-alert items from the list pane. You drag and drop them into
groups to define rule correlations based on your Time Of Day Sets, Connector Profiles,
User-Defined Groups, Constants, etc.
Some alert variables automatically add a blank Constant as its list item. You can
overwrite the Constant with another list item, or you can click the Constant to type or
select a specific value for the constant.
Note that each list item has an icon that corresponds to the list it came from. These
icons let you to quickly identify what kinds of items are defining your rules’s
correlations.
Threshold The Threshold section lets you define a threshold for the correlations in a Group box.
You can think of a threshold as a correlation frequency for the grouping; that is, the
number of times the events defined by the group must occur within a specified period
before the rule takes effect.
325
Editing Rules
Name
Description
This is the Set Advanced Threshold button. Whenever a group threshold’s number of
Events within [time] is greater than 1, this button becomes enabled so you can open
the Set Advanced Thresholds form. This form lets you specify advanced threshold
fields and define an advanced response window for the alert fields within the grouping.
Rule correlations and groups of correlations are subject to AND and OR comparisons.
AND
If you click an AND operator, it changes to an OR, and vice versa.
OR
Editing Rules
Whenever you need to edit a rule’s name or configuration, you use the Rule Creation connector to
make the necessary changes to the rule. When needed, you can edit multiple rules at the same time.
It is not necessary to disable a rule before editing it. When you edit a rule, you are editing a local copy
until you save and activate it. If the rule was enabled when you began editing it, it will continue to be
enabled while you work on the new version. When you save the new version and then click Activate
Rules, the Manager replaces the original rule with the new version.
To open rules for editing:
1. Open the Build >Rules view.
2. In the Folders pane, click the folder that contains the rules you want to edit.
The Rules grid displays the rules associated with the selected folder and its subfolders.
3. In the Rules grid, click to select the rule (or rules) you want to edit.
326
Chapter 14: Advanced Configurations
4. Open the rules for editing as follows: l
To edit a single rule, either double-click the rule, or click the row's gear
button and then click Edit.
l
To edit multiple rules, click the grid's gear
button and then click and
then click Edit.
Rule Creation appears, showing the rule’s current configuration. If you opened
multiple rules, they all appear as "cascaded" windows. You may now edit the rules.
Locked rules
If a prompt like the one shown here appears, it means another user is already editing one of the
selected rules and has those rules "locked."
In this case, you can do either of two things:
l
You can proceed in a read-only fashion, which allows you to see the details of a rule.
l
You can break the lock and take control over the rule, which means the other person
will not be able to save any changes he or she makes to the rule.
To edit the rule:
1. Use Rule Creation to make any necessary changes to the rule’s name, Manager,
folder, description, enabled status, test-mode state, correlations, correlation time, or
actions.
l
If you want to use the rule immediately upon saving it, select the Enable
check box.
l
If you want to try the rule in test mode, select the Test check box.
2. Click Save.
The Rules grid appears.
3. To begin using (or testing) the rule’s new configuration, click Activate Rules.
327
Subscribing to a rule
Subscribing to a rule
You can assign rules to specific Console users, which means those users will subscribe to those
rules. This means the system will notify the subscribing users' Consoles each time one of the
subscribed-to rules triggers an alert. The alerts will appear in their Monitor view’s alert grid.
Rule subscriptions can be used in conjunction with filters and reports to monitor activity for specific
rules. Each user can subscribe to as many different rules as needed.
You can assign subscriptions in Rule Creation while you are creating the rule, or anytime later
directly from the Rules grid.
To manage rule subscribers from the Rules grid:
1. Open the Build >Rules view.
2. In the Folders pane, click the folder that contains the rule you want to work with.
3. In the Rules grid, select the rules you want to work with.
4. On the Rules grid connectorbar, click Subscribe.
The Subscribe list opens. It only includes those Console uses who are associated
with the same Manager as the selected rule.
A check box with a gray background means the user already subscribes to one or more
of the selected rules, but not all of them.
5. Select the check box for each Console user who is to subscribe to the selected rules: l
Select an empty user's check box to have that user subscribe to all of the
selected rules.
l
Clear a gray user's check box to remove the user's subscription to all of
the selected rules.
l
Clear a gray user's check box and then select it again, to have that user
subscribe to all of the selected rules. Remember, these users are already
328
Chapter 14: Advanced Configurations
subscribed to some rules, but not all of them. This procedure assigns all
of the selected rules to that user.
As you can see, if you have multiple rules selected, each subscription change affects
every selected rule.
6. Click Subscribe again to close the list. The selected Console users now subscribe to
the selected rules.
To add rule subscribers from Rule Creation:
1. With a rule open in Rule Creation, click Subscribe.
The Subscribe list opens. It only includes those Console uses who are associated
with the same Manager as the selected rule.
2. Manage the rule's subscribers as follows: l
Select the check box for each Console user who is to subscribe to this
rule.
l
Clear the check box for each subscriber who is no longer to subscribe to
this rule.
3. Click Subscribe again to close the list.
4. Click Save.
The selected Console users now subscribe to the rule.
Enabling a rule
The Manager only uses rules that are enabled. It ignores all other rules. Therefore, the Manager
cannot use rules until you enable them. You can enable rules from the Rules grid, or directly from
Rule Creation. In either case, the Enable check box lets you turn a rule on and off.
329
Enabling a rule
Note: In the Rules grid, you can enable multiple rules at the same time. However, this command
acts as a toggle on each individual rule that is selected. For example, if one rule is disabled and
another is enabled, performing this command on both rules at the same time will invert the settings of
both rules. So the first rule would become enabled, and the second would become disabled.
Therefore, when performing this command on multiple rules, you will typically want to select only
those rules that already have the same Enabled/Disabled state.
To enable rules from the Rules grid:
1. Open the Build >Rules view.
2. In the Folders pane, select the folder that contains the rules you want to enable.
3. In the Rules grid, select the rule (or rules) you want to enable.
4. Enable the rules as follows:
l
To enable a single rule, click the row's gear
button and then click
Enable.
l
To enable multiple rules, click the grid's gear
button and then click
Enable.
In the Rules grid, the rules’ Enabled
icons become active, which means the rules
are now enabled. However, the Manager cannot begin using these rules until you
activate them.
5. Click Activate Rules to begin using the rule.
To enable a rule from Rule Creation:
1. With a rule open in Rule Creation, select the Enable check box.
2. When you are finished configuring the rule, click Save.
The Rules grid appears, with the
icon appearing in the rule's Enabled column. This
icon means the rule is now enabled. However, the Manager cannot begin using the rule
330
Chapter 14: Advanced Configurations
until you activate it.
3. Click Activate Rules to begin using the rule.
Placing rules in test mode
Before fully enabling a rule, you can try it out in test mode. In test mode, the Manager processes the
rule’s alert messages as it normally would, but without performing any of the rule’s actions. This lets
you see how the rule will behave when it is activated, without any possible disruption to your network.
Note: In the Rules grid, you can change the test mode of multiple rules at the same time. However,
this command acts as a toggle on each individual rule that is selected. For example, if one rule is in
test mode and another isn't, performing this command on both rules at the same time will invert the
settings of both rules. So the first rule would move out of test mode, and the second would move into
test mode. Therefore, when performing this command on multiple rules, you will typically want to
select only those rules that already have the same Test On/Test Off state.
To place rules in test mode in the Rules grid:
1. Open the Build >Rules view.
2. In the Folders pane, select the folder that contains the rules you want to test.
3. Check the rules' Enabled status. If any of the rules you want to test show a "disabled"
icon), then they need to be enabled. You can do this by clicking the row's gear
button and then clicking Enable.
In the Rules grid, the
icon appears in the rule’s Enabled column to indicate that the
rule has been enabled.
4. In the Rules grid, select the rule (or rules) you want to test.
331
Placing rules in test mode
5. Place the rules in test mode as follows: l
To put a single rule in test mode, click the row's gear
button and
then click Test On.
l
To put multiple rules in test mode, click the grid's gear
button and
then click Test On.
In the Rules grid, the
icon appears in the rules’ Test column to indicate that the
rules are in test mode.
6. Click Activate Rules.
The rules are now functional, but in test mode.
To remove a rule from test mode in the Rules grid:
1. Open the Build >Rules view.
2. In the Folders pane, select the folder that contains the rules you want to work with.
3. In the Rules grid, select the rule (or rules) you want to work with.
4. Remove the rules from test mode as follows: l
To remove a single rule from test mode, click the row's gear
button
and then click Test Off.
l
To remove multiple rules from test mode, click the grid's gear
button and then click Test Off.
In the Rules grid, the "disabled"
icon appears in the rules’ Test column to indicate
that the rules are no longer in test mode.
5. Click Activate Rules. The rules are now fully functional.
332
Chapter 14: Advanced Configurations
To place a rule in test mode from Rule Creation:
1. Open the Build >Rules view.
2. In the Folders pane, click the folder that contains the rule you want to test.
3. In the Rules grid, click to select the rule you want to test.
4. On the Rules grid connectorbar, click Edit.Rule Creation appears, showing the rule’s
current configuration.
5. Select the Enable check box.
6. Select the Test check box.
Note: To test a rule, you must have both Enable and Test checked. If only Enable is
checked, the rule is completely enabled (that is, it is fully in use). If only Test is
checked, the rule will not be enabled, which means the Manager will not be able to use
it for testing.
7. Click Save. The Rules grid appears.
8. Click Activate Rules.The rule is now in test mode.
To fully activate a rule from in Rule Creation:
1. Open the rule in Rule Creation, as described above.
2. Clear the Test check box.
3. Click Save.
4. On the Rule Builder connectorbar, click Activate Rules. The rule is now fully
functional.
Activating rules
Whenever you create a new rule or change an existing rule, you are working on a “local copy” of the
rule. The Manager has no way of using the rule change until you activate it. Activating a rule tells the
333
Disabling a rule
Manager to reload the enabled rules it is working on, which allows it to upload up the changes you just
made. You must activate rules whenever you create a new rule, edit an existing rule, or make
changes to a rule’s Enabled/Disabled or Test On/Test Off status. Otherwise, the Manager will not
recognize the change.
To activate rule changes, both the Rules grid and Rule Creation have an Activate Rules command.
This command sends any new rule changes to the Manager for immediate use. In Rule Creation, the
Activate Rules command leaves Rule Creation open so you can continue working.
To activate rules from the Rules grid:
1. Open the Build >Rules view.
2. Many any necessary changes to your rules.
3. On the Rules grid connectorbar, click Activate Rules.
The Manager activates any new rule changes and begins processing all enabled rules.
To activate rules from Rule Creation:
l
At any time, in Rule Creation, click Activate Rules.
The Manager activates any new rule changes and begins processing all enabled rules.
However, Rule Creation stays open so you can continue working. The rule you are
currently working on is not activated. It cannot be activated until it is first saved.
Disabling a rule
The Manager will continue to use any active rules, so long as they are enabled. If needed, you can
easily turn off rules by disabling them. However, the Manager will continue to use those rules until
you activate their new “disabled” status with the Activate Rules command.
Note: In the Rules grid, you can disable multiple rules at the same time. However, this command
acts as a toggle on each individual rule that is selected. For example, if one rule is disabled and
another is enabled, performing this command on both rules at the same time will invert the settings of
both rules. So the first rule would become enabled, and the second would become disabled.
334
Chapter 14: Advanced Configurations
Therefore, when performing this command on multiple rules, you will typically want to select only
those rules that already have the same Enabled/Disabled state.
To disable rules from the Rules grid:
1. Open the Build >Rules view.
2. In the Folders pane, select the folder that contains the rules you want to disable.
3. In the Rules grid, select the rule (or rules) you want to disable.
4. Disable the rules as follows: l
To disable a single rule, click the row's gear
button and then click
Disable.
l
To disable multiple rules, click the grid's gear
button and then click
Disable.
In the Rules grid, the Enabled column for each rule shows a “disabled”
icon to
indicate the rules are now inactive.
5. Click Activate Rules. The Manager stops processing the disabled rules.
To disable a rule from Rule Creation:
1. Open the rule you want to disable in Rule Creation.
2. Clear the Enable check box.
3. Click Save. The Rules grid appears.
4. Click Activate Rules. The Manager stops processing the disabled rule.
Cloning rules
The Clone command lets you copy any existing rule, make changes to the copy, and then save the
335
Importing a rule
copy with a new name in one of your Custom Rules sub-folders.
The benefit of cloning is that you can quickly create variations on existing rules. You clone a
preconfigured rule, such as a rule from the Rules or NATO5 Rules folder, and then adjust the cloned
copy to suit your specific needs.
Note: A cloned rule must be for the same Manager as the original rule. That is, you cannot clone a
rule from one Manager and save it for another Manager.
To clone rules:
1. Open the Build >Rules view.
2. In the Folders pane, click the folder that contains the rule you want to clone.
3. In the Rules grid, click to select the rule you want to clone.
4. Click the row's gear
button and then click Clone. The Clone Rule form appears.
5. In the Clone Name box, type a name for the cloned rule.
6. In the Folders list, select which Custom Rules folder is to store the cloned rule.
7. Click OK to save the cloned rule; otherwise, click Cancel.
The newly cloned copy of the rule automatically opens in Rule Creation so you can
begin making changes.
Importing a rule
You can import a rule from a remote source into a particular rule folder. For example, you may want to
import a rule from one Manager to another. Or you can import a rule that is provided by SolarWinds.
You may only import one rule at a time.
336
Chapter 14: Advanced Configurations
To import a rule to a rule folder:
1. Open the Build >Rules view.
2. On the Rules grid connectorbar, click
and then click Import. The Open form
appears.
3. In the Look In box, browse to and open the folder that contains the rule you want to
import.
4. Select the rule file you want to import.Rrule files are always .xml files.The file you
selected appears in the File Name box.
5. Click Open to import the file; otherwise, click Cancel. The Import Rules form
appears.
6. In the Manager list, select which Manager the imported rule is to be associated with.
7. In the Folders list, click to select the rule folder that is to store the imported rule. You
will need to click a folder’s >icon to view its sub-folders.
8. Click Import. The system imports the rules into the designated rule folder.
Exporting rules
Exporting rules is useful for three reasons:
l
You can export a rule from one Manager and import it into another Manager.
l
You can export rules to save archived copies in a safe place.
l
You can export rules to provide SolarWinds with a copy of your rule for technical
support or troubleshooting purposes.
You can export multiple rules at the same time. The rules will be saved to a new folder that contains
each rule.
337
Deleting Rules
To export rules:
1. Open the Build >Rules view.
2. In the Folders pane, select the folder that contains the rule you want to export. The
Rules grid displays the rules in that folder.
3. In the Rules grid, select the rules you want to export.
4. On the Rules grid connectorbar, click
and then click Export.The Select
Directory to Export Rule to form appears.
5. In the Save in box, locate the general area in which you want to save the exported rule
folder.
6. In the File name box, type a name for the folder that is to contain the exported rules.
Note: Rules are saved as .xml files.
7. Click Save.
The rules are exported and saved in the folder you specified. Each exported rule retains
its name and the date and time on which it was exported.
If an Export Error message appears, it means one or more of the rules failed to export.
If you are exporting multiple rules, the system exports as many as it can, and the
message lists which rules failed to export and which ones succeeded. Click OK to
close the form.
Deleting Rules
When needed, you can easily delete rules. You can delete one rule at a time, or you can delete
multiple rules. Deleting a rule is permanent. Once a rule is deleted, it can only be restored by recreating it or by importing a previously exported rule.
338
Chapter 14: Advanced Configurations
To delete rules:
1. Open the Build >Rules view.
2. In the Folders pane, select the folder that contains the rule you want to delete.The
Rules grid displays the rules in that folder.
3. In the Rules grid, select the rule (or rules) you want to delete.
4. Delete the rules as follows: l
To delete a single rule, click the row's gear
button and then click
Delete.
l
To delete multiple rules, click the grid's gear
button and then click
Delete.
5. At the Confirm Delete prompt, click Yes to delete the rules; otherwise, click No. The
rules disappear from the Rules grid.
6. Click Activate Rules to notify the Manager that the rules were deleted.
Connector Configuration Features
The topics in this section describe key features of the Connector Configuration form, its grid
columns, its icons, and how to use its Refine Results form.
After configuring a Manager’s connectors, you must configure the sensor and actor connectors for
each Agent that is associated with that Manager. The Connector Configuration form lets you
connect the Agent’s connectors to any supported products that are installed on or remotely logging to
the Agent’s computer. After the Agent connectors are configured, the Manager can monitor and
interact with the products and devices on that computer.
Agents connectors run locally to monitor data on the Agent’s computer. An Agent’s sensors generally
monitor log files, as well as data that is logged to the Agent’s computer from remove devices that
cannot have their own Agents. An Agent’s active response connectors (actors) allow the Agent to
receive instructions from the Manager and perform active responses locally, on the Agent’s
computer, such as sending pop-up messages or detaching USB devices.
339
Connector Configuration Features
Once you understand how the connectors work, the following procedures guides you through the
configuration process needed to integrate LEM with your network security products and devices.
The Connector Configuration form has similar features, whether you are configuring or editing a
Manager, an Agent, or a Connector Profile.
The following table describes the key features of the Connector Configuration form.
Name
Description
Sidebar
Click the Sidebar button to alternately hide and open the form’s Refine Results
button
pane.
Refine
By default, the Connectors grid shows all of the products that are supported. The
Results
Refine Results pane lets you apply filters to the grid to reduce the number of
pane
products it shows. This way, you can show only those products that are configured
for use with this Agent, or that are associated with a particular product category or
status (Running or Stopped).
Connectors The Connectors grid lists all of the sensor and actor connectors that are available to
grid
each Agent. These connectors are what allow LEM to monitor and interact with your
network security products and devices.
Connectors are organized by category and product name. Each connector is named
after the third-party product it is designed to configure for use with LEM.
Click this button to create a new connector instance the sensor or actor that is
currently selected in the Connectors grid.
Properties
This pane displays detailed information about the connector that is currently selected
pane
in the Connectors grid.
n
If the connector is not configured, this pane displays a description of the
connector.
n
If the connector is configured, this pane displays the configuration settings as
read-only information.
Whenever you add or edit a connector , this pane turns into an editable form for
recording the configuration settings.
340
Chapter 14: Advanced Configurations
Connectors Grid Columns
The following table briefly describes the meaning of each column in the Connector Configuration
form’s Connectors grid.
Column
Description
The gear button opens a menu of commands that apply to the connector that is currently
selected in the grid.
Status
Shows the connector’s current connection status:
means the connector is connected and running.
means the connector is disconnected and not running.
Category The high-level connector category, such as anti-virus connectors, firewall connectors,
operating system connectors, etc..
Name
The name of the actor, sensor, or connector instance. Typically, connectors are named
after the third-party products they are designed to configure for use with LEM.
Connectors Grid Icons
The following table describes the icons used in the Connector Configuration utility’s node tree.
Icon
Description
A blue connector icon represents a sensor for a particular product. The sensor displays the
name of the product it is designed to monitor.
Each connector instance (or alias) that is currently configured to monitor that product is listed
below the connector. If no connector instances are listed, it means the product, on this Agent
computer, has not been configured for use with LEM.
Whenever you select a sensor in the grid, the lower pane displays the connector’s name and
a description of the sensor, when available.
341
Refining the Connectors Grid
Icon
Description
The orange connector icon represents an actor for a product that can perform an active
response. The actor displays the name of the product it is designed to interact with.
Each connector instance (or alias) that is currently configured to initiate an active response
on that product is listed below the connector. If no connector instances are listed, it means
the product, on this Agent computer, has not been configured for use with LEM.
Whenever you select an actor in the grid, the lower pane displays the connector’s name and a
description of the actor, when available.
This icon represents a configured instance of a sensor connector. Each sensor can have
more than one instance, where each configuration is identified by a different name, called an
alias. In the grid, each configured connector instance appears below its connector.
Whenever you select a sensor connector instance in the grid, the lower pane displays the
sensor connector’s name, and the connector instance’s name (or alias) and configuration
settings. The Status column displays each instance’s current status—Stopped ( ) or
Running (
).
This icon represents a configured instance of an actor connector. Each actor can have more
than one instance, where each configuration is identified by a different name, called an alias.
In the grid, each configured connector instance appears below its connector.
Whenever you select an actor connector instance in the grid, the lower pane displays the
actor connector’s name, and the connector instance’s name (or alias) and configuration
settings. The Status column displays each instance’s current status—Stopped ( ) or
Running (
).
Refining the Connectors Grid
By default, the Connectors grid shows every connector (sensor and actor) that can be configured for
use with a particular Agent or Manager. To help you work more efficiently with a long list of
connectors, the Refine Results pane lets you apply filters to the Connectors grid to reduce the
number of connectors it shows.
342
Chapter 14: Advanced Configurations
When you select options in the Refine Results pane, the Connectors grid refreshes to show only
those sensor and actors that match the options you have selected. The other connectors are still
there; however, they are hidden. To restore them to the grid, click the Reset button or select All in the
refinement lists you are using.
The following table explains how to use the Refine Results pane.
Field
Reset
Description
Click Reset to clear the form and return the Connectors grid to its default state
(showing all connectors).
Search
Use this field to perform keyword searches for specific products, such as “Cisco” or
“McAfee.” To search, type the text you want to search for in the text box. Then press
Enter or click the magnifying glass symbol. The grid displays only those products
that match or include the text you entered.
Configured Select this check box to have the Connectors grid show only those connector
Connectors instances that are currently configured for the Manager or Agent you are working
with.
Clear this check box to have the grid list both configured and unconfigured
connectors.
Category
Select a high-level category to list the connectors that are available to support thirdparty products in that category. Each connector is named after the product it is
designed to configure for use with LEM.
Note: If you cannot find a particular product, it is either not supported, or it is in a
different category.
Status
Select Running to list all of the connectors that are currently running on the Manager
or Agent you are working with.
Select Stopped to list all of the connectors that are currently stopped on the Manager
or Agent you are working with.
343
Chapter 15: Scalability
Setting up an Addition nDepth Appliance
The topics in this section are about configuring nDepth to store and access your original log
messages:
l
Setting up the nDepth Appliance (if you are using a separate nDepth Appliance to store
original log messages).
l
Configuring your network connectors (sensors) for use with nDepth to store original log
messages.
Using a separate nDepth appliance
If needed, you can use a separate nDepth appliance for long-term storage and retrieval of your
network's original event log messages. In this configuration, each Manager has its own dedicated
nDepth appliance. The appliance stores all of the original log file source data that passes through a
particular Manager. The log data is stored in its entirety, in real time, as it originally occurs from each
host (network device) and source (application or connector) that is monitored by the Manager. Even when you use a separate appliance, you can still access and explore this information from the
Console's nDepth view.
The primary advantage of using a separate nDepth appliance is that it provides you with the capacity
for long-term storage and retrieval of the original log messages. If long-term storage of this information
is a high priority, then you will want to consider a separate appliance; otherwise, a separate appliance
is probably unnecessary. If you have questions, contact your SolarWinds sales representative or
SolarWinds Technical Support.
344
Chapter 15: Scalability
Installing a Separate nDepth Appliance
If you would like to use a separate nDepth appliance for long-term storage and retrieval of the original
log messages, then you must install that appliance before you begin using nDepth. Contact
SolarWinds Technical Support for instructions on installing a separate appliance.
If you are not using a separate appliance, this procedure is not required, because short-term log
messages are stored directly on LEM.
Configuring Network Connectors for Use with nDepth
To use nDepth to explore your network's original log messages, you must configure each connector
(sensors) for use with nDepth with the Console's Connector Configuration form.
First, decide which network devices, applications, and connectors that are monitored by the Manager
are to also send their log messages to nDepth. Then configure each of these connectors for use with
nDepth. You can choose to route a connector’s log messages to LEM, directly to nDepth, or to both.
SolarWinds recommends that you configure each connector so it routes its log messages to both
nDepth and LEM. This allows you to receive events on these connectors, and to search log
messages stored on the separate nDepth appliance.
l
How many days of live data will the LEM database store?
l
The number of days' worth of live data that the LEM database will store varies for every
implementation. The information below should help you determine this number for your
environment, while also promoting a more detailed understanding of how the database
works in general.
l
This article contains the following sections.
l
What the LEM Database Stores
l
Where to Find the Numbers
Alternate Storage Methods
By default, the LEM database is allowed 230 GB of the 250 GB allocated to the LEM virtual appliance.
This partition consists of three data stores:
345
Where to Find the Numbers
l
Syslog/SNMP data from devices logging to the LEM appliance;
l
Normalized Event data; and
l
Original, or "raw," log data, if enabled.
For the sake of this article, we'll call #1 the Syslog store. The Syslog store consists of all
Syslog/SNMP log data that is sent to the LEM appliance. The LEM appliance reads and processes
the data in real time, and then sends it to the Event store for long-term storage. The LEM appliance
stores the original data for 50 days in its original format, just in case you need to review it, and
compresses and rotates the data in the Syslog store daily, maintaining a consistent 50 days' worth of
data. The amount of data being stored here should level off at around the 50-day mark.
The Event store, #2 above, consists of all of the normalized Events generated by the LEM Manager
and LEM Agents. Data in this store is compressed at a ratio of 40:1 to 60:1, which equates to an
average compression rate of about 95-98%. LEM Reports and nDepth query this store for Event data
whenever they're run.
Finally, the original log store, #3 above, is an optional store for original, or "raw," log messages, which
is searchable using Log Message queries in nDepth. The data in this store can come from LEM
Agents or other devices that are logging to the LEM appliance. You can define whether data is sent to
this store at the connector level, so not all devices have to log in this manner. For more information,
see Configuring Your LEM Appliance for Log Message Storage and nDepth Search in the SolarWinds
Knowledge Base.
Where to Find the Numbers
There are three primary sources for statistics related to how your LEM database is being used: the
Disk Usage summary in the CMC, the Database Maintenance Report, and the Log Storage
Maintenance Report.
Disk Usage Summary
When you initially log into your LEM virtual appliance using the vSphere "console" view or an SSH
client such as PuTTY, the LEM appliance automatically generates a Disk Usage summary. You can
also generate an ad hoc Disk Usage summary by running the diskusage command from the
cmc::acm# (cmc > appliance) prompt. The two lines to note here are:
346
Chapter 15: Scalability
Logs/Data: This figure represents the total space being utilized by your LEM database. This value is
presented in the percent% (usedG/allocatedG) format, where percent is the percent of the allocated
space that is currently being used, used is the actual amount of space that is currently being used,
and allocated is the total amount of space that is currently allocated to the LEM database.
Logs: This figure represents the amount of space being utilized by the Syslog store. This figure is
included in the used figure noted above.
To figure out how much space is currently being utilized by your Event store, subtract the Logs value
from the used value.
Note: If you are storing original log messages in your LEM database, the calculation above will show
you the combined space being utilized by both your Event and original log stores.
Database Maintenance Report
Run the Database Maintenance Report in LEM Reports to see a snapshot of your current database
utilization. For the sake of this discussion, note the following sections:
Disk Usage Summary: This section provides disk usage figures as percentages of the space
allocated to the LEM database.
Disk Usage Details: This section provides the actual amounts related to the percentages in the Disk
Usage Summary section.
Database Time Span (days): Note the Event DB value in this section. This value tells you how many
days' worth of live Event data is currently stored on your LEM database. For detailed information
about this value, see the second page of the Database Maintenance Report.
Note: The Other Files figure in the Database Maintenance Report consists primarily of the data in the
Syslog store noted above.
Log Storage Maintenance Report
Run the Log Storage Maintenance Report in LEM Reports to get detailed information about the
original log store noted above. If you have not enabled your LEM appliance and connectors to store
original log messages, this report will be blank.
347
Alternate Storage Methods
Alternate Storage Methods
Depending on the needs of your environment, you might want to utilize one or more of the alternate
storage methods listed below. For more details or assistance with any of these methods, please open
a ticket with Support.
l
Backup your LEM virtual appliance on a regular basis. This will give you "offline"
storage for all of your LEM data stores and configuration settings. For instructions and
recommendations, see the Log & Event Manager > Backup section of the SolarWinds
Knowledge Base.
l
Decrease the number of days for which Syslog/SNMP data is stored on your LEM
virtual appliance.
l
Deploy another LEM virtual appliance to be used as a Syslog server.
l
Deploy another LEM virtual appliance to be used as a database server.
l
Increase the space allocated to your LEM virtual appliance.
348
Chapter 16: Enabling Transport Layer Security
The Transport Layer Security (TLS) option introduces an extra level of security for data transfers
between a LEM database and the Reports application. By default, TLS is disabled on both newly
deployed 6.0.1 and LEM appliances updated from previous versions. The enabling procedure differs
depending on your LEM configuration (standalone or with dedicated database appliance).
Note: During the process, the LEM certificate for accessing the Web or AIR Console needs to be
rebuilt. This means that machines used to access LEM Web or AIR Console need to have the
certificate re-imported.
Enabling Standalone LEM Appliance
1. Access the cmc prompt, either from the vSphere/Hyper-V Client console or via the
SSH client.
Note: The following steps are mandatory for upgraded LEM Appliances. If you have a
freshly deployed 6.0.1 appliance, proceed to step 7, the default hostname is swi-lem.
2. At the cmc> prompt, enter appliance.
3. At the cmc::acm# prompt, enter hostname.
4. Enter the name of your manager at the prompt “Please enter the new hostname…”
Note: Enter the currently used hostname if you do not want the LEM manager name to
change
5. At the cmc::acm# prompt, enter exit.
6. At the cmc> prompt, enter manager.
7. At the cmc::cmm# prompt, enter exportcert.
8. Follow the prompts to export LEM Manager CA certificate.
349
Chapter 16: Enabling Transport Layer Security
Note: An accessible network share is required. Once the export is successful, you will
see the following message: Exporting CA Cert to \\server\share\SWICAer hostname.crt ... Success.
9. At the cmc::cmm# prompt, enter enabletls.
11. At the cmc::cmm# prompt, enter restart.
This concludes the TLS configuration of standalone LEM Manager. Follow Setting up a Dedicated
LEM User for Reports Accessing to set up a user for accessing Reports and Configuring Reports
Application to configure the Reports application itself.
Setting up a Dedicated LEM User for Reports Accessing
Note: LEM 6.0.1 requires authorization to access LEM from the Reports application. This means that
a user with Reports role has to be created in the LEM Console. If you already have a suitable user,
proceed to Configuring Reports Application
1. Login to the LEM Web or AIR Console as a user with Administrator rights.
2. Navigate to Build > Users page.
3. Click + to create new LEM User.
4. Fill in the text fields. Username and Password are mandatory.
5. Select the Reports option form the LEM Role dropdown.
Note: Other roles that cay query LEM via Reports are Administrator and Auditor.
6. Save the new user.
Note: If you have an Active Directory Connector configured, you can utilize a directory Service user
as a Reports user instead of in-built LEM one.
Configuring Reports Application
1. Start the LEM Reports 6.0.1 application.
2. Select Managers – Credentials and Certificates option under the Configure button.
3. Click the green button.
350
Enabling TLS on a LEM Manager with a Dedicated Database Appliance
4. Specify the manager IP or hostname.
5. Fill in the credentials of the user created previously in Web Console.
6. Check the Use TLS connection? box.
Note: You can also ping the address you specified by pressing Test Connection button. This option
does not perform credentials validation or TLS availability check.
7. Click the green button again to add a new Manager.
8. Select the Certificates tab.
9. Click the Import Certificate button.
10. Browse and Open LEM certificate (e.g. the network share folder specified during
certificate export).
11. Use the certificate from the Database Appliance in case you have LEM configured with
a dedicated Database.
12. Close the Manager Configuration window.
Note: There is no need to import the LEM CA certificate again if the LEM changed its hostname.
Enabling TLS on a LEM Manager with a Dedicated
Database Appliance
1. Access the cmc prompt (either from vSphere/Hyper-V Client console or via SSH
client).
2. At the cmc> prompt, enter appliance.
3. At the cmc::acm# prompt, enter hostname.
4. At the prompt “Please enter the new hostname…” specify desired name of your
manager.
Note: If you don’t want your LEM manager name to change, enter the currently used
hostname.
5. At the cmc::acm# prompt, enter exit.
351
Chapter 16: Enabling Transport Layer Security
6. At the cmc> prompt, enter manager.
7. At the cmc::cmm# prompt, enter exportcert.
8. Follow the prompts to export LEM CA certificate.
Note: An accessible network share is required. Once the export is successful, you will
see the following message: Exporting CA Cert to \\server\share\SWICAerthostname.crt ... Success.
9. At the cmc::cmm# prompt, enter enabletls.
Enabling TLS on LEM Database
1. Access the cmc prompt (either from vSphere/Hyper-V Client console or via SSH
client).
2. At the cmc> prompt, enter appliance.
3. At the cmc::acm# prompt, enter hostname.
4. At the prompt “Please enter the new hostname…” specify desired name of your
manager.
Note: If you don’t want your LEM manager name to change, enter the currently used
hostname.
5. At the cmc::acm# prompt, enter exit.
6. At the cmc> prompt, enter manager.
7. At the cmc::cmm# prompt, enter exportcert.
8. Follow the prompts to export LEM CA certificate.
Note: An accessible network share is required. Once the export is successful, you will
see the following message: Exporting CA Cert to \\server\share\SWICAerthostname.crt ... Success.
9. At the cmc::cmm# prompt, enter enabletls.
352
Importing Certificates into the Manager and Database
Note: To use the custom CA to sign Database or Manager certificate, it is necessary to
generate and sign the certificate after changing the hostname. This is used
Importing Certificates into the Manager and Database
Manager and Database nodes need to trust each other’s certificates. This can be done by importing
certificates from both sides.
Note: It is not required to perform steps of this chapter on any appliance in these two cases:
l
You have upgraded from 6.0.0 or earlier.
l
A clean 6.0.1 or newer was deployed and CA used to sign both LEM certificates.
1. Access the cmc prompt of LEM Manager.
2. At the cmc> prompt, enter manager.
3. At the cmc::cmm# prompt, enter importl4ca.
4. Choose the network share location specified during certificate export of Database.
5. When prompted for a file name, specify the name of Database certificate.
6. Enter the full filename required including the file extension.
7. Access the cmc prompt of LEM Database.
8. At the cmc> prompt, enter manager.
9. At the cmc::cmm# prompt, enter importl4ca.
10. Choose the network share location specified during certificate export of Manager.
11. When prompted for a file name, specify the name of Manager certificate.
Note: Full filename required including the file extension.
This concludes the TLS configuration of a LEM Manager with a dedicated database appliance. Follow
the instructions for Setting up a Dedicated LEM User for Reports Accessing to set up a user for
accessing reports, and Configuring Reports Application to configure the Reports application.
353
Chapter 17: Troubleshooting
If you do not see the events you expected to see in the LEM Console, use the following procedures to
troubleshoot your LEM Agents and network devices.
Troubleshooting the LEM Agent
Start by determining whether the LEM Agent is connected to the LEM appliance:
1. Open the LEM Console and log in to your LEM appliance.
2. Click the Manage tab, and then select Nodes.
3. To filter this list to show just LEM Agents, select Agent from the Nodes menu on the
Refine Results pane.
Note: Refer to the icon in the Status column to determine which procedures to use.
Disconnected or Missing LEM Agents
Complete these procedures for LEM Agents that show in the LEM Console as "Disconnected," or do
not show in the LEM Console at all.
To troubleshoot LEM Agents that you cannot see in the LEM Console:
1. Verify you have installed the LEM Agent on the host computer.
2. If you have installed the LEM Agent, complete the procedure for how to troubleshoot
LEM Agents that show as "Disconnected" in the LEM Console.
To troubleshoot LEM Agents that show as "Disconnected" in the LEM Console:
1. Verify the LEM Agent service is running on the host computer.
2. Verify you can ping the LEM appliance by hostname from the LEM Agent computer.
3. If you can ping the appliance by hostname, clear the LEM Agent certificate.
4. If you cannot ping the appliance by hostname, try pinging the appliance by IP address.
5. If you can ping the appliance by IP address, do one of the following:
354
Chapter 17: Troubleshooting
l
Edit spop.conf so the LEM Agent calls the LEM appliance by its IP address
instead of its hostname. For instructions, see the spop.conf procedure later in
this section.
l
Change your DNS settings so the LEM Agent computer can resolve the LEM
appliance's hostname (recommended).
6. If you cannot ping the appliance by IP address, resolve any network or firewall issues
between the LEM Agent and appliance.
To edit spop.conf so the LEM Agent calls the LEM appliance by its IP address (Windows):
1. Stop the SolarWinds Log and Event Manager Agent service.
2. Delete the spop folder (do not delete the ContegoSPOP folder):
l
32-bit computers: C:\Windows\System32\ContegoSPOP\spop
l
64-bit computers: C:\Windows\SysWOW64\ContegoSPOP\spop
3. In the ContegoSPOP folder, open and modify the spop.conf file by replacing
the ManagerAddress value with the LEM appliance's IP address.
4. Save and close the file.
5. Start the SolarWinds Log and Event Manager Agent service.
Connected LEM Agents
Complete the following procedures for LEM Agents that show in the LEM Console as Connected.
To troubleshoot LEM Agents that show as "Connected" in the LEM Console:
1. Verify you have configured the appropriate connectors on the LEM Agent. For example,
the LEM Agent for Windows runs the connectors for the Windows Application and
Security Logs by default, but you must configure the connector for the DNS server role.
2. Verify the connectors you have configured are running.
3. If the necessary connectors are configured and running, delete and recreate the
connectors that are not working.
355
Troubleshooting Network Devices Logging to LEM
Contacting Support
If you still do not see events from your LEM Agents after completing these procedures, send the
following files to SolarWinds Support (default paths):
32-bit Windows OS:
l
C:\Windows\System32\ContegoSPOP\spoplog.txt (the most recent version)
l
C:\Windows\ System32\ContegoSPOP\tools\readerState.xml
64-bit Windows OS:
l
C:\Windows\SysWOW64\ContegoSPOP\spoplog.txt (the most recent version)
l
C:\Windows\SysWOW64\ContegoSPOP\tools\readerState.xml
Troubleshooting Network Devices
Start by determining whether the device is sending data to the LEM appliance:
1. Connect to your LEM appliance using the VMware "console" view, or an SSH client
such as PuTTY.
2. If you're connecting to your appliance through SSH, log in as the CMC user, and
provide the appropriate password.
3. If you're connecting to your appliance using VMware, select Advanced
Configuration on the main console screen, and then press Enter to get to the
command prompt.
4. At the cmc> prompt, enter appliance.
5. At the cmc::acm# prompt, enter checklogs.
6. Enter an item number to select a log file to view.
7. Check each log file that is not empty for evidence that the device is logging to the
appliance, such as the device's product name, device name, or IP address.
Troubleshooting Network Devices Logging to LEM
To monitor a network device with LEM, you must first configure the device to send its log messages
356
Chapter 17: Troubleshooting
to the LEM appliance. Determine whether or not the device you are troubleshooting is logging to LEM
prior to completing the following troubleshooting procedures.
To determine whether the LEM appliance is receiving data from the device:
1. Connect to your LEM appliance using a virtual console or SSH client.
2. Access the CMC prompt:
l
Virtual Console: Arrow down to Advanced Configuration, and then press
Enter.
l
SSH Client: Log in using your CMC credentials.
3. At the cmc> prompt, enter appliance.
4. At the cmc::acm# prompt, enter checklogs.
5. Enter an item number to select a log file to view.
6. Check each log file that is not empty for evidence that the device is logging to the
appliance, such as the device's product name, device name, or IP address.
Devices Not Logging to a Log File on the Appliance
1. Complete the following procedures for network devices that do not show data on the
LEM appliance.
2. To troubleshoot network devices that have not sent logs to the LEM appliance:
3. Verify you have configured the device to log to the LEM appliance.
4. Verify the device is logging to the correct IP address for the LEM appliance.
5. If the device is sending SNMP traps to the LEM appliance, verify you have configured
the LEM appliance to accept SNMP traps.
6. Verify a firewall is not blocking communication between the device and the LEM
appliance.
To configure your LEM Manager to accept SNMP traps:
1. Connect to your LEM appliance using a virtual console or SSH client.
357
Devices Logging to a Log File on the Appliance
2. Access the CMC prompt:
l
Virtual Console: Arrow down to Advanced Configuration, and then press
Enter.
l
SSH Client: Log in using your CMC credentials.
3. At the cmc> prompt, enter service.
4. At the cmc::scm# prompt, enter enablesnmp.
5. Press Enter to confirm your entry.
6. After you see the message, Done starting the SNMP service, enter exit to return to
the cmc> prompt.
Devices Logging to a Log File on the Appliance
Complete the following procedure for network devices that show data on the LEM appliance.
To troubleshoot network devices that have sent logs to the LEM appliance:
1. Verify you have configured the appropriate connector on the LEM appliance. For
information about how to troubleshoot connectors that are out of date, see
Troubleshooting "Unmatched Data" or "Internal New Tool Data" events in your LEM
Console.
2. Verify the connector you have configured is running.
3. If the necessary connector is configured and running, delete and recreate the connector
instance.
Contacting Support
If you still do not see events from your network device after completing these procedures, send a
screenshot of your device's logging configuration screens to SolarWinds Support.
358
Appendix A: Standard Widget Tables
The following table briefly describes the widgets that ship with the LEM Console.
Widget name/Filter
Description
All Events
Displays all events from all filters.
Events by Event Type
Displays a count of the top 10 events by event type (event name).
Events by Connector
Displays the number of events being captured by each configured con-
Name
nector, over time.
Events per Minute
Displays the total count of events per minute for the last 15 minutes.
Change Management
Displays events related to changes occurring on the network.
Change Management
Displays the top 10 Agents generating change management events
Events by Agent
Change Management
Displays the top 10 change management events by event type.
Events by Type
Failed Logons
Displays all user account failed logon attempts.
Failed Logons by User
Displays the top 5 Failed Logons by User Account name.
Account
File Audit Failures
Displays FileAuditFailure events, which show failed attempts to
access audited files.
File Audit Failures by File Displays the top 10 file names generating file audit failures.
Name
File Audit Failures by
Displays the top 10 source accounts generating file audit failures.
Source Account
Firewall
Displays all events from firewall devices.
Firewall Events by Fire-
Displays the top 5 firewalls generating firewall events
wall
359
Appendix A: Standard Widget Tables
Widget name/Filter
Description
Firewall Events by Type
Displays the top 5 firewall events by event type.
Incidents
Displays all Incident events.
Incidents by Rule Name
Displays the top 5 incidents by the name of the rule that generated the
Incident.
Interactive Logons by
Displays the top 10 user logons by user account name.
User Account
My Rules Fired by Rule
Displays the top 5 subscribed events by the name of the rule that gen-
Name
erated them.
Network Events
Displays all Network events.
Network Events by
Displays the top 10 machines generating network events.
Source Machine
Network Event Trends
Displays the top 10 network-related events by event type.
Rule Activity
Shows all of the rules that have fired.
Rules Fired by Rule
Displays the top 5 rules fired by rule name.
Name
Security Processes
Displays process launches and exits from processes in the "Security
Processes" User-Defined Group, which is used to monitor critical security-related processes.
Security Processes by
Displays the top 10 Agents generating security process events.
Agent
Subscriptions
Displays events created by rules you are "Subscribed" to in the Rules
area.
SolarWinds Events
Displays all Internal events (events generated during operation of the
LEM).
Unusual Network Traffic
Displays events that indicate unusual or suspicious network traffic.
Unusual Network Traffic
Displays the top 5 destinations for unusual network traffic.
by Destination
360
Appendix A: Standard Widget Tables
Widget name/Filter
Unusual Network Traffic
Description
Displays the top 10 sources of unusual network traffic.
by Source
USD Defender
Displays all USB-Defender events.
USB-Defender Activity
Displays the top 5 Agents with the most USB-Defender events.
by Detection IP
USB File Auditing
Displays USB-Defender's File Auditing events.
USB File Auditing by
Displays the top 5 Agents with the most USB file auditing events.
Detection IP
User Logons
Displays all user account logons
User Logons by Agent
Displays the top 5 Agents reporting user logons.
User Logons by Source
Displays the top 5 user logons by source machine.
Machine
User Logons by User
Displays the top 10 user logons by user account name.
Account
User Logons (Interactive) Displays interactive user account logons.
Virus Attacks
Displays all virus attack events.
Virus Attacks by Source
Displays the top 5 sources of virus attacks or infections.
Machine
361
Appendix B: Events
This appendix describes every event type that is displayed in the Events Panel and that can be
configured with the Policy commands.
Types of Events
Note: LEM reports events in a hierarchical node tree, shown here. When you click a node to open it,
you will see that most nodes also have lower-level nodes. Each node that has lower-level nodes is
called a parent node. Similarly, all lower-level nodes below a particular parent node can be thought of
as child nodes or children to that parent node. Naturally, the term parent and child applies to the node,
relative to its position and role on the node tree. That is, a node can be a child to one node, and a
parent to others.
362
Appendix B: Events
LEM automatically assigns alerts to the nodes of the alert tree based on the specific nature of the
alert and its severity.
Event types
There are five types of alerts:
l
Security Events are generally related to network activity that is consistent with an
internal or external attack, a misuse or abuse of resources, a resource compromise,
resource probing, or other abnormal traffic that is noteworthy. Security Events indicate
aggressive behavior that may lead to an attack or resource compromise, or suspicious
behavior that may indicate unauthorized information gathering.LEM infers some
Security Events from what is normally considered audit traffic, but it escalates the
events to alert status based on thresholds that are defined by Rules.
l
Internal Events are related to the operation of the LEM system. Any events generated
by LEM relating to Active Response, LEM users, or LEM errors will appear under one of
the many children. These alerts are for informational purposes. They do not necessarily
reflect conditions that should cause alarm. Events that may reflect potential issues
within LEM are specifically marked for forwarding to SolarWinds.
l
Audit Events are generally related to normal network activity that would not be
considered an attack, compromise, or misuse of resources. Many of the audit alerts
have rules that can be used to threshold and escalate “normal” behavior into something
which may be considered a security event.
l
Incident alerts are used to raise global enterprise-wide visibility in response to any
issue detected by Rules. Incidents generally reflect serious issues that should be
addressed. Since Incidents are created by Rules, any combination of malicious or
suspicious traffic from any other single alert or combination of alerts can create an
Incident.
l
Asset alerts relate to the changing state of different types of enterprise assets,
including software, hardware, and users. These alerts can indicate changes made to
system configurations, software updates, patch applications, vulnerability information,
and other system events.
363
Asset Events
Asset Events
Asset Events deal with assets and asset scan results. They relate to the changing state of different
types of enterprise assets, including software, hardware, and users. Asset information can come
from centralized directory service connectors, or it can be scan information from security scan
connectors, including Vulnerability Assessment and Patch Management connectors. Therefore,
these alerts indicate changes made to system configurations, software updates, patch applications,
vulnerability information, and other system events.
Each Asset Event is described below. For your convenience, they are listed alphabetically.
AssetManagement
AssetManagement alerts are for gathering non-realtime data about system assets (computer,
software, users). The data will come from various sources, including Directory Service connectors.
AssetManagement > MachineAsset
MachineAsset is a specific type of AssetManagement alert that indicates additions, removals, and
updates (including software installation) of specific nodes that exist in the enterprise.
AssetManagement > MachineAsset > MachineAssetAdded
MachineAssetAdded alerts indicate a new presence of a node (host or network device) in the
enterprise.
AssetManagement > MachineAsset > MachineAssetRemoved
MachineAssetRemoved alerts indicate the removal of a node (host or network device) from the
enterprise.
AssetManagement > MachineAsset > MachineAssetUpdated
MachineAssetUpdated alerts indicate a change to an existing node (host or network device) in the
enterprise, including new software and software patch installations on the node.
AssetManagement > MachineAsset > MachineAssetUpdated > SoftwareAssetUpdated
SoftwareAssetUpdated alerts indicate an attempted software change (including application of a
software patch) to an existing node (host or network device) in the enterprise, successful or failed.
364
Appendix B: Events
AssetManagement > MachineAsset > MachineAssetUpdated > SoftwareAssetUpdated >
SoftwareAssetPatched
SoftwareAssetPatched alerts indicate a successful application of a software patch to an existing
node (host or network device) in the enterprise.
AssetManagement > MachineAsset > MachineAssetUpdated > SoftwareAssetUpdated >
SoftwareAssetPatchFailed
SoftwareAssetPatchFailed alerts indicate a failed application of a software patch to an existing node
(host or network device) in the enterprise.
AssetManagement > SoftwareAsset
SoftwareAsset is a specific type of AssetManagement alert that indicates additions, removals, and
updates of specific software and software versions that exist in the enterprise.
AssetManagement > SoftwareAsset > SoftwareAssetAdded
SoftwareAssetAdded alerts indicate a new presence of an installation of specific software
applications or operating systems in the enterprise.
AssetManagement > SoftwareAsset > SoftwareAssetAdded > SoftwareAssetVersionAdded
SoftwareAssetVersionAdded alerts indicate a new version installation of specific known software
applications or operating systems in the enterprise.
AssetManagement > SoftwareAsset > SoftwareAssetRemoved
SoftwareAssetRemoved alerts indicate removals of specific software applications or operating
systems from the enterprise.
AssetManagement > UserAsset
UserAsset is a specific type of AssetManagement alert that indicates additions, removals, and
updates to users and user groups that exist in the enterprise.
AssetManagement > UserAsset > GroupAssetAdded
GroupAssetAdded alerts indicate a new presence of a user group in the enterprise.
365
Asset Events
AssetManagement > UserAsset > GroupAssetRemoved
GroupAssetRemoved alerts indicate the removal of a user group from the enterprise.
AssetManagement > UserAsset > GroupAssetUpdated
GroupAssetUpdated alerts indicate a change to a user group that exists in the enterprise, including
group member additions and deletions.
AssetManagement > UserAsset > GroupAssetUpdated > GroupAssetMemberAdded
GroupAssetMemberAdded alerts indicate an addition of a user member to a user group that exists in
the enterprise.
AssetManagement > UserAsset > GroupAssetUpdated > GroupAssetMemberRemoved
GroupAssetMemberRemoved alerts indicate a removal of a user member from a user group that
exists in the enterprise.
AssetManagement > UserAsset > UserAssetAdded
UserAssetAdded alerts indicate a new presence of a user in the enterprise.
AssetManagement > UserAsset > UserAssetRemoved
UserAssetRemoved alerts indicate the removal of a user from the enterprise.
AssetManagement > UserAsset > UserAssetUpdated
UserAssetUpdated alerts indicate a change to a user that exists in the enterprise.
AssetScanResult
AssetScanResult contains alerts useful for data gathered from security scan results (reports). These
alerts are commonly gathered from Vulnerability Assessment and Patch Management connectors.
AssetScanResult > ExposureFound
ExposureFound alerts indicate scan results that are not high risk but demonstrate configuration
issues or potential risks. These alerts may indicate exposures that can potentially cause future
366
Appendix B: Events
exploits or have been common sources of exploits in the past, such as common open ports or host
configuration issues.
AssetScanResult > VulnerabilityFound
VulnerabilityFound alerts indicate scan results that demonstrate high risk vulnerabilities. These alerts
can indicate the presence of serious exposures that should be addressed and can represent
significant risk of exploit or infection of enterprise assets.
GeneralAsset
GeneralAsset alerts are generated when a supported product outputs data that has not yet been
normalized into a specific alert, but is known to be asset issue-related.
Audit Events
Events that are children of AuditEvent node are generally related to normal network activity that
would not be considered an attack, compromise, or misuse of resources. Many of the audit alerts
have rules that can be used to threshold and escalate “normal” behavior into something which may be
considered a security event.
Each Audit Event is described below. For your convenience, they are listed alphabetically.
AuthAudit
Events that are part of the AuthAudit tree are related to authentication and authorization of accounts
and account ''containers'' such as groups or domains.
These alerts can be produced from any network node including firewalls, routers, servers, and clients.
AuthAudit > DomainAuthAudit
DomainAuthAudit events are authentication, authorization, and modification events related only to
domains, subdomains, and account containers. These alerts are normally operating system related,
however could be produced by any network device.
AuthAudit > DomainAuthAudit > NewDomainMember
NewDomainMember events occur when an account or account container has been added to a
domain. Usually, these additions are made by a user account with administrative privileges, but
367
Audit Events
occasionally a NewDomainMember alert will also happen when local system maintenance activity
takes place.
AuthAudit > DomainAuthAudit > DeleteDomainMember
DeleteDomainMember events occur when an account or account container has been removed from a
domain. Usually, these changes are made by a user account with administrative privileges, but
occasionally a DeleteDomainMember alert will also happen when local system maintenance activity
takes place.
AuthAudit > DomainAuthAudit > ChangeDomainMember
A ChangeDomainMember alert occurs when an account or account container within a domain is
modified. Usually, these changes are made by a user account with administrative privileges, but
occasionally a ChangeDomainMember alert will also happen when local system maintenance activity
takes place.
AuthAudit > DomainAuthAudit > ChangeDomainMember > DomainMemberAlias
DomainMemberAlias events happen when an account or account container within a domain has an
alias created, deleted, or otherwise modified. This event is uncommon and is used to track links
between domain members and other locations in the domain where the member may appear.
The alias for a domain member has been changed.
AuthAudit > DomainAuthAudit > NewDomain
NewDomain events occur upon creation of a new trust relationship between domains, creation of a
new subdomain, or creation of new account containers within a domain. Usually, these creations are
done by a user account with administrative privileges.
AuthAudit > DomainAuthAudit > ChangeDomainAttribute
ChangeDomainAttribute events occur when a domain type is changed. These events are uncommon
and usually provided by the operating system. Usually, these changes are made by a user account
with administrative privileges, but occasionally a ChangeDomainAttribute alert will also happen when
local system maintenance activity takes place.
AuthAudit > DomainAuthAudit > DeleteDomain
368
Appendix B: Events
DeleteDomain events occur upon removal of a trust relationship between domains, deletion of a
subdomain, or deletion of account containers within a domain. Usually, these changes are made by a
user account with administrative privileges.
AuthAudit > GroupAudit
GroupAudit events are authentication, authorization, and modification events related only to account
groups. These alerts are normally operating system related, however could be produced by any
network device.
AuthAudit > GroupAudit > ChangeGroupAttribute
ChangeGroupAttribute events occur when a group type is modified. Usually, these changes are made
by a user account with administrative privileges, but occasionally a ChangeGroupAttribute alert will
also happen when local system maintenance activity takes place.
AuthAudit > GroupAudit > DeleteGroup
DeleteGroup events occur upon deletion of a new group of any type. Usually, these deletions are
made by a user account with administrative privileges.
AuthAudit > GroupAudit > DeleteGroupMember
DeleteGroupMember events occur when an account or group has been removed from a group.
Usually, these changes are made by a user account with administrative privileges, but occasionally a
DeleteGroupMember alert will also happen when local system maintenance activity takes place.
AuthAudit > GroupAudit > NewGroup
NewGroup events occur upon creation of a new group of any type. Usually, these additions are made
by a user account with administrative privileges.
AuthAudit > GroupAudit > NewGroupMember
NewGroupMember events occur when an account (or other group) has been added to a group.
Usually, these additions are made by a user account with administrative privileges, but occasionally
a NewGroupMember alert will also happen when local system maintenance activity takes place.
A new user, machine, or service account has been added to the group.
AuthAudit > MachineAuthAudit
369
Audit Events
MachineAuthAudit events are authentication, authorization, and modification events related only to
computer or machine accounts. These alerts can be produced from any network node including
firewalls, routers, servers, and clients, but are normally operating system related.
AuthAudit > MachineAuthAudit > MachineAuthTicketFailure
MachineAuthTicketFailure alerts reflect failed computer or machine account ticket events from
network devices that use a ticket-based single-sign-on system (such as Kerberos or Windows
domains). Each alert will reflect the point on the network where the computer or machine was
attempting logon. In larger quantities, these alerts may reflect a potential issue with a computer or set
of computers, but as individual events they are generally not a problem.
AuthAudit > MachineAuthAudit > MachineAuthTicket
MachineAuthTicket alerts reflect computer or machine account ticket events from network devices
monitored by Contego that use a ticket-based single-sign-on system (such as Kerberos or Windows
domains). Each alert will reflect the type of device the logon was intended for along with all other
relevant fields.
AuthAudit > MachineAuthAudit > MachineDisable
MachineDisable events occur when a machine account is actively disabled and/or when an account
is forcibly locked out by the operating system or other authentication connector. These events are
usually operating system related and could reflect a potential issue with a computer or set of
computers.
AuthAudit > MachineAuthAudit > MachineEnable
MachineEnable alerts reflect the action of enabling a computer or machine account. These events are
normally OS-related and will trigger when a machine is 'enabled', normally by a user with
administrative privileges.
AuthAudit > MachineAuthAudit > MachineLogoff
MachineLogoff alerts reflect computer or machine account logoff events from network devices
(including network infrastructure devices, where appropriate). Each alert will reflect the type of device
from which the user was logging off. These alerts are usually normal events but are tracked for
consistency and auditing purposes.
AuthAudit > MachineAuthAudit > MachineLogonFailure
370
Appendix B: Events
MachineLogonFailure alerts reflect failed computer or machine account logon events from network
devices (including network infrastructure devices, when appropriate). Each alert will reflect the point
on the network where the computer or machine was attempting logon. In larger quantities, these
alerts may reflect a potential issue with a computer or set of computers, but as individual events they
are generally not a problem.
AuthAudit > MachineAuthAudit > MachineLogon
MachineLogon events reflect computer or machine account logon events from network devices
monitored by Contego (including network infrastructure devices, when appropriate). Each alert will
reflect the type of device that the logon was intended for along with all other relevant fields. These
events are normally operating system related.
AuthAudit > MachineAuthAudit > MachineModifyAttribute
MachineModifyAttribute events occur when a computer or machine type is changed. These events
are uncommon and usually provided by the operating system.
AuthAudit > MachineAuthAudit > MachineModifyPrivileges
MachineModifyPrivileges events are created when a computer or machine's privileges are elevated or
demoted based on their logon or activities they are performing. These events are uncommon.
AuthAudit > UserAuthAudit
UserAuthAudit events are authentication, authorization, and modification events related only to user
accounts. These alerts can be produced from any network node including firewalls, routers, servers,
and clients.
AuthAudit > UserAuthAudit > UserAuthTicketFailure
UserAuthTicketFailure alerts reflect failed user account ticket events from network devices that use
a ticket-based single-sign-on system (such as Kerberos or Windows domains). Each alert will reflect
the point on the network where the user was attempting logon. In larger quantities, these alerts may
reflect a potential issue with a user or set of users, but as individual events they are generally not a
problem.
AuthAudit > UserAuthAudit > UserAuthTicket
UserAuthTicket alerts reflect user account ticket events from network devices monitored by Contego
371
Audit Events
that use a ticket-based single-sign-on system (such as Kerberos or Windows domains). Each alert
will reflect the type of device that the logon was intended for along with all other relevant fields.
AuthAudit > UserAuthAudit > UserDisable
UserDisable events occur when a user account is actively disabled and/or when a user is forcibly
locked out by the operating system or other authentication connector. These events are usually
operating system related and could reflect a potential issue with a user or set of users.
AuthAudit > UserAuthAudit > UserEnable
UserEnable alerts reflect the action of enabling a user account. These events are normally OS-related
and will trigger both when an account is ''unlocked'' after lockout due to unsuccessful logons and
'enabled' in the traditional sense.
AuthAudit > UserAuthAudit > UserLogoff
UserLogoff alerts reflect account logoff events from network devices (including network infrastructure
devices). Each alert will reflect the type of device from which the user was logging off. These alerts
are usually normal events but are tracked for consistency and auditing purposes.
AuthAudit > UserAuthAudit > UserLogon
UserLogon alerts reflect user account logon events from network devices monitored by Contego
(including network infrastructure devices). Each alert will reflect the type of device that the logon was
intended for along with all other relevant fields.
AuthAudit > UserAuthAudit > UserLogonFailure
UserLogonFailure alerts reflect failed account logon events from network devices (including network
infrastructure devices). Each alert will reflect the point on the network where the user was attempting
logon. In larger quantities, these alerts may reflect a potential issue with a user or set of users, but as
individual events they are generally not a problem.
With SolarWinds policy, you can configure combinations of this event to escalate to
FailedAuthentication in the Security tree, reflecting the increase in severity of the event over several
occurrences.
AuthAudit > UserAuthAudit > UserModifyAttribute
372
Appendix B: Events
UserModifyAttribute events occur when a user type is changed. These events are uncommon and
usually provided by the operating system.
AuthAudit > UserAuthAudit > UserModifyPrivileges
UserModifyPrivileges events are created when a user's privileges are elevated or demoted based on
their logon or activities they are performing. These events are uncommon.
GeneralAudit
GeneralAudit alerts are generated when a supported product outputs data that has not yet been
normalized into a specific alert, but is known to be audit-related.
MachineAudit
MachineAudit alerts are used to track hardware or software status and modifications. These events
are generally acceptable, but do indicate modifications to the client system that may be noteworthy.
MachineAudit > SoftwareInstall
SoftwareInstall alerts reflect modifications to the system at a software level, generally an OS level (or
equivalent, in the case of a network infrastructure device). These alerts are generated when a user
updates a system or launches system-native methods to install third party applications.
MachineAudit > SoftwareInstall > SoftwareUpdate
SoftwareUpdate is a specific type of SoftwareInstall that reflects a more current version of software
being installed to replace an older version.
MachineAudit > SystemScan
SystemScan alerts reflect information related to scheduled or on-demand scans of systems. These
alerts are generally produced by Anti-Virus, Patch Management, and Vulnerability Assessment
connectors, and indicate the start, finish, and information related to a scan.
MachineAudit > SystemScanInfo
SystemScanInfo is a specific type of SystemScan alert that reflects information related to a system
scan. Most of these events can safely be ignored, as they are generally normal activity that does not
reflect a failure or abnormal state.
373
Audit Events
MachineAudit > SystemScanStart
SystemScanStart is a specific type of SystemScan alert that indicates initiation of a system scan.
MachineAudit > SystemScanStop
SystemScanStop is a specific type of SystemScan alert that indicates completion of a system scan.
This activity is generally normal, however, in the error or failure state a specific alert will be generated.
MachineAudit > SystemScanWarning
SystemScanWarning is a specific type of SystemScan alert that indicates a scan has returned a
'Warning' message indicating an issue. These alerts may indicate scan issues that should be
corrected for future scans.
MachineAudit > SystemStatus
SystemStatus alerts reflect general system state events. These events are generally normal and
informational, however, they could potentially reflect a failure or issue which should be addressed.
MachineAudit > SystemStatus > SystemReboot
SystemReboot is a specific type of SystemStatus alert that is used to audit system restarts. This
alert will only be generated if the system restart was normal and not a result of a crash or other failure
condition.
MachineAudit > SystemStatus > SystemReboot > SystemShutdown
SystemShutdown is a specific type of SystemStatus alert that is used to audit system shutdowns,
including both expected and unexpected shutdowns. In the event the shutdown was unexpected, the
event detail will note the information provided by the connector related to the abnormality.
PolicyAudit
PolicyAudit events are used to track access, modification, scope change, and creation of
authentication, domain, account, and account container policies. Many of these alerts reflect normal
system traffic. Most PolicyAudit alerts are provided by the Operating System.
PolicyAudit > NewAuthPolicy
NewAuthPolicy alerts occur when a new authorization or authentication package, process, or logon
374
Appendix B: Events
handler is applied to an item (usually an account or domain). In the operating system context, these
events will often occur on boot as the system initializes the appropriate authentication policies for
itself.
PolicyAudit > PolicyAccess
PolicyAccess alerts reflect all levels of access to policy, mostly targeting domain, account, access,
and logon policy modifications.
PolicyAudit > PolicyAccess > PolicyModify
PolicyModify alerts reflect all types of modifications to contained policies, both at a local and
domain/account container level. In the context of a network infrastructure device, this would be a
modification to access control lists or other similar policies on the device.
PolicyAudit > PolicyAccess > PolicyModify > DomainPolicyModify
DomainPolicyModify alerts are a specific type of PolicyModify alerts that reflect changes to domain
and account container level policies. These types of policies are generally related to the operating
system. Usually these modifications are made by a user with administrative privileges, but
occasionally these changes can also be triggered by the local system.
PolicyAudit > PolicyAccess > PolicyScopeChange
PolicyScopeChange alerts are a specific type of PolicyAccess alert that reflect a new scope or
assignment of policy to users, groups, domains, interfaces, or other items.
In the context of the operating system, these events are usually describing elevation of user
privileges according to predefined policies. The process of this elevation is considered a scope
change as the user is being brought under a new scope of privileges appropriate to the type of access
they are requesting (and being granted). These events may accompany or precede object or file
opens, including other policies.
PolicyAudit > PolicyAccess > GroupPolicyModify
GroupPolicyModify alerts are specific PolicyAccess alerts used to describe modifications to account
group policies. Usually these modifications are made by a user with administrative privileges, but
occasionally these changes can also be triggered by the local system.
ResourceAudit
375
Audit Events
Members of the ResourceAudit tree are used to define different types of access to network
resources. These resources may be network bandwidth/traffic, files, client processes or services, or
other types of shared security-related 'commodities'.
ResourceAudit > FileAudit
FileAudit alerts are used to track file activity on monitored network devices, usually through the
Operating System or a Host-Based IDS. These events will note success or failure of the requested
operation.
ResourceAudit > FileAudit > FileAuditFailure
FileAuditFailure alerts are used to track failed file activity on monitored network devices, usually
through the Operating System or a Host-Based IDS. These events will note what requested operation
failed.
ResourceAudit > FileAudit > FileRead
FileRead is a specific FileAudit alert generated for the operation of reading files (including reading
properties of a file or the status of a file). These alerts may be produced by any connector that is used
to monitor the activity of file usage, including a Host-Based IDS and some Operating Systems.
ResourceAudit > FileAudit > FileRead > FileExecute
FileExecute is a specific FileRead alert generated for the operation of executing files. These alerts
may be produced by any connector that is used to monitor the activity of file usage, including a HostBased IDS and some Operating Systems.
ResourceAudit > FileAudit > FileRead > FileDataRead
FileDataRead is a specific FileRead alert generated for the operation of reading data from a file (not
just properties or status of a file). These alerts may be produced by any connector that is used to
monitor the activity of file usage, including a Host-Based IDS and some Operating Systems.
ResourceAudit > FileAudit > FileWrite
FileWrite is a specific FileAudit alert generated for the operation of writing to a file (including writing
properties of a file or changing the status of a file). These alerts may be produced by any connector
that is used to monitor the activity of file usage, including a Host-Based IDS and some operating
systems.
376
Appendix B: Events
ResourceAudit > FileAudit > FileWrite > FileDataWrite
FileDataWrite is a specific FileWrite alert generated for the operation of writing data to a file (not just
properties or status of a file). These alerts may be produced by any connector that is used to monitor
the activity of file usage, including a Host-Based IDS and some Operating Systems.
ResourceAudit > FileAudit > FileWrite > FileCreate
FileCreate is a specific FileWrite alert generated for the initial creation of a file. These alerts may be
produced by any connector that is used to monitor the activity of file usage, including a Host-Based
IDS and some Operating Systems.
ResourceAudit > FileAudit > FileWrite > FileMove
FileMove is a specific FileWrite alert generated for the operation of moving a file that already exists.
These alerts may be produced by any connector that is used to monitor the activity of file usage,
including a Host-Based IDS and some Operating Systems.
ResourceAudit > FileAudit > FileWrite > FileDelete
FileDelete is a specific FileWrite alert generated for the deletion of an existing file. These alerts may
be produced by any connector that is used to monitor the activity of file usage, including a HostBased IDS and some Operating Systems.
ResourceAudit > FileAudit > FileWrite > FileAttributeChange
FileAttributeChange is a specific FileWrite alert generated for the modification of file attributes
(including properties such as read-only status). These alerts may be produced by any connector that
is used to monitor the activity of file usage, including a Host-Based IDS and some Operating
Systems.
ResourceAudit > FileAudit > FileWrite > FileLink
FileLink is a specific FileWrite alert generated for the creation, deletion, or modification of links to
other files. These alerts may be produced by any connector that is used to monitor the activity of file
usage, including a Host-Based IDS and some Operating Systems.
ResourceAudit > FileHandleAudit
FileHandleAudit alerts are used to track file handle activity on monitored network devices, usually
377
Audit Events
through low level access to the Operating System, either natively or with or a Host-Based IDS. These
events will note success or failure of the requested operation.
ResourceAudit > FileHandleAudit > FileHandleClose
FileHandleClose is a specific FileHandleAudit alert generated for the closing of file handles. These
alerts may be generated by a connector that has low-level file access, such as an Operating System
or some Host-Based IDS'.
ResourceAudit > FileHandleAudit > FileHandleCopy
FileHandleCopy is a specific FileHandleAudit alert generated for the copying of file handles. These
alerts may be generated by a connector that has low-level file access, such as an Operating System
or some Host-Based IDS'.
ResourceAudit > FileHandleAudit > FileHandleOpen
FileHandleOpen is a specific FileHandleAudit alert generated for the opening of file handles. These
alerts may be generated by a connector that has low-level file access, such as an Operating System
or some Host-Based IDS'.
ResourceAudit > FileSystemAudit
FileSystemAudit alerts reflect hardware to filesystem mapping events and usage of filesystem
resources. These events are generally normal system activity, especially during system boot.
ResourceAudit > FileSystemAudit > MountFileSystem
MountFileSystem alerts are a specific type of FileSystemAudit that reflect the action of creating an
active translation between hardware to a usable filesystem. These events are generally normal during
system boot.
ResourceAudit > FileSystemAudit > UnmountFileSystem
UnmountFileSystem alerts are a specific type of FileSystemAudit that reflect the action of removing
a translation between hardware and a usable filesystem. These events are generally normal during
system shutdown.
ResourceAudit > NetworkAudit
378
Appendix B: Events
Members of the NetworkAudit tree are used to define events centered on usage of network
resources/bandwidth.
ResourceAudit > NetworkAudit > ConfigurationTrafficAudit
ConfigurationTrafficAudit alerts reflect application-layer data related to configuration of network
resources. Included in ConfigurationTrafficAudit are protocols such as DHCP, BootP, and SNMP.
ConfigurationTrafficAudit alerts generally indicate normal traffic, however, alerts of this type could
also be symptoms of misconfiguration, inappropriate usage, attempts to enumerate or access
network devices or services, attempts to access devices that are configured via these services, or
other abnormal traffic.
ResourceAudit > NetworkAudit > CoreTrafficAudit
CoreTrafficAudit alerts reflect network traffic sent over core protocols. Events that are children of
CoreTrafficAudit are all related to the TCP, IP, UDP, and ICMP protocols. Events of this type and its
children do not have any application-layer data.
Events placed in the parent CoreTrafficAudit alert itself are known to be a core protocol, but are not
able to be further categorized based on the message provided by the connector.
ResourceAudit > NetworkAudit > CoreTrafficAudit > TCPTrafficAudit
TCPTrafficAudit alerts are a specific subset of CoreTrafficAudit alerts where the protocol is known to
be TCP.
TCPTrafficAudit alerts may indicate normal traffic inside the network, normal traffic pass-through,
denied traffic, or other non-application TCP traffic that is not known to have any immediate attack
basis.
ResourceAudit > NetworkAudit > CoreTrafficAudit > IPTrafficAudit
IPTrafficAudit alerts are a specific subset of CoreTrafficAudit alerts where the protocol is known to be
IP.
IPTrafficAudit alerts generally indicate normal traffic, however, alerts of this type could also be
symptoms of spoofs, routing issues, or other abnormal traffic. Generally, for the abnormal traffic that
379
Audit Events
is appropriate to escalate, a Contego Policy has been defined to escalate this to an alert in the
Security tree based on a threshold.
ResourceAudit > NetworkAudit > CoreTrafficAudit > UDPTrafficAudit
UDPTrafficAudit alerts are a specific subset of CoreTrafficAudit alerts where the protocol is known to
be UDP.
UDPTrafficAuditEvents may indicate normal traffic inside the network, normal traffic pass-through,
denied traffic, or other non-application UDP traffic that is not known to have any immediate attack
basis.
ResourceAudit > NetworkAudit > CoreTrafficAudit > ICMPTrafficAudit
ICMPTrafficAudit alerts are a specific subset of CoreTrafficAudit alerts where the protocol is known
to be ICMP.
ICMPTrafficAudit alerts generally indicate normal traffic, however, alerts of this type could also be
symptoms of scans, floods, or other abnormal traffic. Generally, for the abnormal traffic that is
appropriate to escalate, a Contego Policy has been defined to escalate this to an alert in the Security
tree based on a threshold.
ResourceAudit > NetworkAudit > CoreTrafficAudit > IPSecTrafficAudit
IPSecTrafficAudit alerts are a specific subset of CoreTrafficAudit alerts where the traffic is known to
be related to non-application layer IPSec events (such as key exchanges).
IPSecTrafficAudit alerts generally indicate normal traffic, however, alerts of this type could also be
symptoms of misconfigured IPSec peers, problems with IPSec communication, or other abnormal
traffic.
ResourceAudit > NetworkAudit > LinkControlTrafficAudit
LinkControlTrafficAudit alerts are generated for network events related to link level configuration.
LinkControlTrafficAudit alerts generally indicate normal traffic, however, alerts of this type could also
be symptoms of misconfiguration at the link level, inappropriate usage, or other abnormal traffic.
ResourceAudit > NetworkAudit > RoutingTrafficAudit
380
Appendix B: Events
RoutingTrafficAudit alerts are generated for network events related to configuration of network routes,
using protocols such as IGMP, IGRP, and RIP.
RoutingTrafficAudit alerts generally indicate normal traffic, however, alerts of this type could also be
symptoms of misconfigured routing, unintended route configuration, or other abnormal traffic.
ResourceAudit > NetworkAudit > RoutingTrafficAudit > RIPTrafficAudit
RIPTrafficAudit alerts are a specific subset of RoutingTrafficAudit alerts where the protocol is known
to be RIP.
RoutingTrafficAudit alerts generally indicate normal traffic, however, alerts of this type could also be
symptoms of misconfigured routing, unintended route configuration, or other abnormal traffic.
ResourceAudit > NetworkAudit > NamingTrafficAudit
NamingTrafficAudit alerts are generated for network events related to the naming of network
resources and nodes, using protocols such as WINS and DNS.
NamingTrafficAudit alerts generally indicate normal traffic, however, alerts of this type could also be
symptoms of inappropriate DNS authority attempts, misconfiguration of naming services, and other
abnormal traffic. In several cases, for traffic that is appropriate to escalate, a Contego Policy has
been defined to escalate this to an alert in the Security tree based on a threshold.
ResourceAudit > NetworkAudit > FileSystemTrafficAudit
FileSystemTrafficAudit alerts are generated for network events related to requests for remote
filesystems, using protocols such as SMB and NFS.
FileSystemTrafficAudit alerts generally indicate normal traffic for networks that have remote
filesystem resources such as SMB and NFS shares; however, alerts of this type could also be
symptoms of attempts to enumerate shares or services, misconfiguration of such resources, or other
abnormal traffic. For networks that do not have remote filesystem resources, these alerts will
generally indicate abnormal traffic.
ResourceAudit > NetworkAudit > ApplicationTrafficAudit
ApplicationTrafficAudit alerts reflect network traffic that is mostly or all application-layer data. Events
that are children of ApplicationTrafficAudit are also related to application-layer resources.
381
Audit Events
Events placed in the parent ApplicationTrafficAudit alert itself are known to be application-related, but
are not able to be further categorized based on the message provided by the connector or because
they are uncommon and rarely, if ever, imply network attack potential.
ResourceAudit > NetworkAudit > ApplicationTrafficAudit > EncryptedTraffic
EncryptedTraffic alerts reflect application-layer traffic that has been encrypted and is intended for a
secure host. Included in EncryptedTraffic alerts are client and server side application events, such as
key exchanges, that normally occur after the low-level session creation and handshaking have
completed.
ResourceAudit > NetworkAudit > ApplicationTrafficAudit > EncryptedTraffic > EncryptedTrafficError
EncryptedTrafficError alerts are a specific subnet of EncryptedTraffic alerts that reflect problems
while exchanging keys or data.
ResourceAudit > NetworkAudit > ApplicationTrafficAudit > MailTrafficAudit
MailTrafficAudit alerts reflect application-layer data related to mail services. Included in
MailTrafficAudit are client and server mail events from protocols such as IMAP, POP3, and SMTP.
MailTrafficAudit alerts generally indicate normal traffic, however, alerts of this type could also be
symptoms of excessive mail usage, unintended mail traffic, abnormal command exchanges to a
server, or generally abnormal traffic.
ResourceAudit > NetworkAudit > ApplicationTrafficAudit > WebTrafficAudit
WebTrafficAudit alerts reflect application-layer data related to web services. Included in
WebTrafficAudit are client and server web events from web servers, web applications, content filter
related events, and other web services.
WebTrafficAudit alerts generally indicate normal traffic, however, alerts of this type could also be
symptoms of inappropriate web usage, potential abuse of web services, or other abnormal traffic.
ResourceAudit > NetworkAudit > ApplicationTrafficAudit > TimeTrafficAudit
TimeTrafficAudit alerts reflect application-layer data related to network time configuration. Included in
TimeTrafficAudit are protocols such as NTP and activities, such as detection of client-side network
time updates.
382
Appendix B: Events
TimeTrafficAudit alerts generally indicate normal traffic, however, alerts of this type could also be
symptoms of misconfiguration, inappropriate usage, or other abnormal traffic.
ResourceAudit > NetworkAudit > ApplicationTrafficAudit > TimeTrafficAudit > NTPTrafficAudit
NTPTrafficAudit alerts are a specific type of TimeTrafficAudit related to the Network Time Protocol.
ResourceAudit > NetworkAudit > ApplicationTrafficAudit > FileTransferTrafficAudit
FileTransferTrafficAudit alerts reflect application-layer data related to file retrieval and send to/from
remote hosts. Included in FileTransferTrafficAudit are protocols such as TFTP and FTP.
FileTransferTrafficAudit alerts generally indicate normal traffic, however, alerts of this type could also
be symptoms of misconfiguration, inappropriate usage, attempts to enumerate or access file transfer
services, attempts to access devices that require file transfer services for configuration, or other
abnormal traffic.
ResourceAudit > NetworkAudit > PointToPointTrafficAudit
PointToPointTrafficAudit alerts reflect application-layer data related to point-to-point connections
between hosts. Included in PointToPointTrafficAudit are encrypted and unencrypted point-to-point
traffic.
ResourceAudit > NetworkAudit > PointToPointTrafficAudit > PPTPTrafficAudit
PPTPTrafficAudit alerts are a specific type of PointToPointTrafficAudit alerts that reflect applicationlayer encrypted Peer-to-Peer Tunneling Protocol activities. Included in PPTPTrafficAudit alerts are
tunnel creation, tunnel deletion, session creation, and session deletion, among other PPTP-related
events.
PPTPTrafficAudit alerts generally indicate normal traffic for networks that have PPTP-accessible
devices on the network; however, alerts of this type could also be symptoms of inappropriate access,
misconfiguration of the PPTP server or clients, other communications errors, or other abnormal
traffic. For networks that do not have remote filesystem resources, these alerts will generally indicate
abnormal traffic.
ResourceAudit > NetworkAudit > RemoteProcedureTrafficAudit
RemoteProcedureTrafficAudit alerts reflect application-layer data related to remote procedure
services. Included in RemoteProcedureTrafficAudit are the traditional RPC services used to service
383
Audit Events
remote logons and file shares, and other services which require remote procedure access to complete
authentication, pass data, or otherwise communicate.
RemoteProcedureTrafficAudit alerts generally indicate normal traffic for networks that have remote
procedure services on their network; however, alerts of this type could also be symptoms of
inappropriate access, misconfiguration of the remote procedure services, errors in the remote
procedure calls, or other abnormal traffic.
ResourceAudit > NetworkAudit > RemoteProcedureTrafficAudit > RPCTrafficAudit
RPCTrafficAudit is a specific subset of RemoteProcedureTrafficAudit related to traditional RPC
services, including portmapper.
ResourceAudit > NetworkConnectionAudit
NetworkConnectionAudit alerts are generated when a connection is initiated on a network client.
ResourceAudit > NetworkConnectionAudit > LANConnection
LANConnection is a specific type of NetworkConnectionAudit that reflects a successful connection
on a physical network interface such as an Ethernet card.
ResourceAudit > NetworkConnectionAudit > VPNConnection
VPNConnection is a specific type of NetworkConnectionAudit that reflects a successful connection
to a remote VPN.
ResourceAudit > NetworkConnectionAudit > DialupConnection
DialupConnection is a specific type of NetworkConnectionAudit that reflects a successful
connection through a traditional modem.
ResourceAudit > ObjectAudit
ObjectAudit alerts are used to track special object activity on monitored network devices, usually
through the Operating System or a Host-Based IDS. Generally, Objects are special types of system
resources, such as registry items or user account databases. These objects may be actual 'files' on
the system, but are not necessarily human readable. These events will note success or failure of the
requested operation.
ResourceAudit > ObjectAudit > ObjectAuditFailure
384
Appendix B: Events
ObjectAuditFailure alerts are used to track special object activity on monitored network devices,
usually through the Operating System or a Host-Based IDS. Generally, Objects are special types of
system resources, such as registry items or user account databases. These objects may be actual
'files' on the system, but are not necessarily human readable. These events will note a failure of the
requested operation.
ResourceAudit > ObjectAudit > ObjectDelete
ObjectDelete is a specific ObjectAudit alert generated for the deletion of an existing object. These
alerts may be produced by any connector that is used to monitor the activity of file and object usage,
including a Host-Based IDS and some Operating Systems.
ResourceAudit > ObjectAudit > ObjectLink
ObjectLink is a specific ObjectAudit alert generated for the creation, deletion, or modification of links
to other objects. These alerts may be produced by any connector that is used to monitor the activity
of file and object usage, including a Host-Based IDS and some Operating Systems.
ResourceAudit > ProcessAudit
ProcessAudit alerts are generated to track launch, exit, status, and other events related to system
processes. Usually, these events reflect normal system activity. Process-related activity that may
indicate a failure will be noted separately from normal activity in the alert detail.
ResourceAudit > ProcessAudit > ProcessStop
ProcessStop is a specific type of ProcessAudit alert that indicates a process has exited. Usually,
ProcessStop reflects normal application exit, however in the event of an unexpected error the
abnormal state will be noted.
ResourceAudit > ProcessAudit > ProcessStart
ProcessStart is a specific type of ProcessAudit alert that indicates a new process has been
launched. Usually, ProcessStart reflects normal system activity
ResourceAudit > ProcessAudit > ProcessWarning
ProcessWarning is a specific type of ProcessAudit alert that indicates a process has returned a
'Warning' message that is not a fatal error and may not have triggered an exit of the process.
385
Incident Events
ResourceAudit > ProcessAudit > ProcessInfo
ProcessInfo is a specific type of ProcessAudit alert that reflects information related to a process.
Most of these events can safely be ignored, as they are generally normal activity that does not reflect
a failure or abnormal state.
ResourceAudit > ServiceAudit
ServiceAudit alerts are generated to track information and other events related to system
components. Usually, these events reflect normal system activity. System service-related activity
that may indicate a failure will be noted separately from normal activity in the alert detail.
ResourceAudit > ServiceAudit > ServiceInfo
ServiceInfo is a specific type of ServiceAudit alert that reflects information related to a service. Most
of these events can safely be ignored, as they are generally normal activity that does not reflect a
failure or abnormal state.
ResourceAudit > ServiceAudit > ServiceStart
ServiceStart events are a specific type of ServiceAudit alert that indicates a new system service is
starting.
ResourceAudit > ServiceAudit > ServiceStop
ServiceStop events are a specific type of ServiceAudit alert that indicates a system service is
stopping. This activity is generally normal, however, in the event of an unexpected stop the abnormal
state will be noted.
ResourceAudit > ServiceAudit > ServiceWarning
ServiceWarning is a specific type of ServiceAudit alert that indicates a service has returned a
'Warning' message that is not a fatal error and may not have triggered an exit of the service.
Incident Events
Incident Events reflect global enterprise-wide issues that should be raised for system-wide visibility.
These alerts generally reflect serious issues that should be monitored and addressed. They are subcategorized into different types of Incidents Events that can provide more detailed information.
386
Appendix B: Events
Because Incident Events are created by Rules, any combination of malicious or suspicious traffic
from any other single alert or combination of alerts can create an Incident Event.
Each Incident alert is described below. For your convenience, they are listed alphabetically.
HostIncident
HostIncident alerts reflect global enterprise-wide host system issues that should be raised for
system-wide visibility. These alerts are used to indicate issues on hosts that should be tracked and
addressed, including security and administrative issues that apply specifically to host-based
information.
HybridIncident
HybridIncident alerts reflect global enterprise-wide combined network and host system issues that
should be raised for system-wide visibility. These alerts are used to indicate the combination of
network and host-based issues that should be tracked and addressed, including security and
administrative issues that span both network and host-based information.
NetworkIncident
NetworkIncident alerts reflect global enterprise-wide network system issues that should be raised for
system-wide visibility. These alerts are used to indicate network-based issues that should be tracked
and addressed, including security and administrative issues that apply specifically to network-based
information.
Internal Events
Events that are a part of the InternalEvent node are related to the operation of the LEM system. Any
events generated by the system relating to Active Response, Internal users, or Internal errors will
appear under one of the many children.
These alerts are for informational purposes and do not necessarily reflect conditions that should
cause alarm. Events that may reflect potential issues within the system are specifically marked for
forwarding to SolarWinds.
Each Internal Event is described below. For your convenience, they are listed alphabetically.
InternalAudit
InternalAudit alerts reflect attempted accesses and changes to components of the LEM system by
387
Internal Events
existing SolarWinds users. Both successful and failed attempts will generate alerts in this part of the
tree.
InternalAudit > InternalAuditFailure
InternalAuditFailure is a specific type of InternalAudit alert that indicates failed audit information.
These alerts are generated when a user fails to view or modify (including creation, update, and
deletion) anything within the SolarWinds system. The alert will include the user, type of access, and
item being accessed. InternalAuditFailure events are uncommon and can indicate an attempted
privilege escalation within the LEM system by unprivileged users.
InternalAudit > InternalAuditSuccess
InternalAuditSuccess is a specific type of InternalAudit alert that indicates successful audit
information. These alerts are generated when a user successfully views or modifies (including
creation, update, and deletion) anything within the LEM system. The alert will include the user, type of
access, and item being accessed.
InternalCommands
InternalCommands alerts are only used internally with few exceptions. These alerts are used for
sending Commands through the system to complete active responses.
InternalCommands > InternalAgentToolCommand
InternalAgentToolCommand alerts are internal only. They are fired between Managers and Agents to
manage connector settings.
InternalCommands > InternalAgentFastPack
InternalAgentFastPack alerts are internal only. They are fired between Managers and Agents to
configure updated connector signatures.
InternalFailure
Events that are a part of the InternalFailure tree reflect potential issues within the system. These
alerts could reflect configuration issues, issues that cannot be resolved without contacting
SolarWinds, and potential serious issues which also merit contacting SolarWinds.
InternalFailure > InternalError
388
Appendix B: Events
InternalError alerts reflect configuration or install issues that should be reported to SolarWinds. These
are generally internal errors related to connectors that may be producing unexpected log entries or
conditions that were not expected. These issues generally cannot be solved without contacting
SolarWinds, however they should not be fatal errors.
InternalFailure > InternalException
InternalException alerts reflect more serious problems within the system. These problems generally
lie within the product implementation and may require a software update to eliminate. These alerts
and their surrounding conditions should be reported to SolarWinds.
InternalFailure > InternalWarning
InternalWarning alerts are generally problems which can be solved by the user. Usually, these alerts
are configuration related and may assist in debugging the underlying issue.
InternalWarning alerts do not reflect internal problems within the system and thus should not be
immediately reported to SolarWinds, however they may assist with solving a technical support issue
should the need arise.
InternalGeneralEvent
InternalGeneralEvent events are uncommon events used to track Internal information that has not yet
been placed into a more specific InternalEvent. Events of the InternalFailure family providing more
information will be generated in addition to this event if the event is serious.
InternalInfo
Events within the InternalInfo family are related to events that are happening within the system.
Generally, these informational alerts are confirming or reporting normal activity such as user updates,
user logons, policy updates, and Agent connection-related events.
InternalInfo > InternalAgentOffline
InternalAgentOffline alerts reflect detection of disconnection of an Agent to its Manager. These alerts
will happen when the Manager has detected that the Agent closed the connection, whether that be
due to network down time of the Agent or due to a shut down of the Agent service.
InternalInfo > InternalAgentOnline
389
Internal Events
InternalAgentOnline alerts reflect successful connection of Agents to their respective Managers.
These alerts will happen when an Agent initiates successful communication with the Manager,
whether that be due to network down time of the Manager or Agent or due to an update of the Agent in
question.
InternalInfo > InternalDuplicateConnection
InternalDuplicateConnection alerts occur when an Agent has attempted to connect to their given
Manager more than once. Usually these alerts are triggered by network issues on the Agent end, due
to a possible asynchronous disconnection detection (for example, the Manager was not able to detect
the Agent went offline, but the Agent service was restarted).
Usually this issue can be resolved by stopping the Agent service, waiting for the InternalAgentOffline
alert, and then restarting the Agent service.
InternalInfo > InternalInvalidConnection
InternalInvalidConnection alerts occur when an Agent that the Manager recognizes, but cannot
communicate with, attempts to connect. These alerts usually reflect Agents that are missing an
update that has already been applied to the Manager.
Please ensure that the indicated Agent has been upgraded to the same release version of the system
that is installed on your Manager. If this alert persists: uninstall and reinstall the Agent triggering the
alert. This will force the Agent to re-initialize connection to the Manager.
InternalInfo > InternalInvalidInstallation
InternalInvalidInstallation alerts occur in the unlikely case that the Manager can communicate with
the Agent but there are errors detected in the Manager-to-Agent relationship. These alerts are very
uncommon, but may be triggered during an upgrade process.
Please ensure that the indicated Agent has been upgraded to the same release version of the system
that is installed on your Manager. If this alert persists: uninstall and reinstall the Agent triggering the
alert. This will force the Agent to re-initialize connection to the Manager.
InternalInfo > InternalLicenseMaximum
InternalLicenseMaximum alerts reflect an attempt to add more Agents to a Manager than that
Manager is licensed for. The number of Agents that can be added is a hard limit that the Manager
stores and this limit is also enforced by the Console.
390
Appendix B: Events
If more licenses are needed, this issue can be resolved by contacting SolarWinds Sales for an
update.
InternalInfo > InternalNewToolData
InternalNewToolData alerts generally reflect issues related to connectors with unexpected log entries
or other conditions that were not expected. These issues generally cannot be solved without
contacting SolarWinds, however they are not fatal.
InternalInfo > InternalPolicyConfiguration
InternalPolicyConfiguration alerts reflect successful or unsuccessful attempts to update Policy on a
given Manager. These alerts are generated after Policy has been successfully installed to the
Manager or after an error has been detected. Generally, an error in updating Policy will also produce
an alert from the InternalFailure family, providing more information.
InternalInfo > InternalToolOffline
InternalToolOffline alerts reflect successful stop of an Internal Tool. These alerts are generated after
a connector has stopped the log file reader that was created when the connector was brought online.
Generally, an error in an attempt to stop a connector will produce an alert from the InternalFailure
family providing more information.
InternalInfo > InternalToolOnline
InternalToolOnline alerts reflect successful startup of an Internal Tool. These alerts are generated
after a connector has successfully created a log file reader and has begun the reading process.
Generally, an error in an attempt to start a connector will produce an alert from the InternalFailure
family providing more information.
InternalInfo > InternalUnknownAgent
InternalUnknownAgent alerts occur when an Agent that the Manager does not recognize has
attempted to connect. Commonly, this alert is caused by removing the Agent from the Console before
removing the Agent service on the client. These alerts may also be triggered during an upgrade
process; in that case, they may reflect Agents that have not yet been brought up to date.
Usually this issue can be resolved by Uninstalling and Reinstalling the Agent triggering the alert. This
will force the Agent to re-initialize connection to the Manager.
391
Internal Events
InternalInfo > InternalUnsupportedAgent
InternalUnsupportedAgent alerts are generated when a valid Agent connects and has not been
upgraded to the same release version as the Manager. The Agent in question failed to properly
negotiate its connection or respond to a query and has been assumed to be missing a feature required
of it. Please ensure that the indicated Agent has been upgraded to the same release version of
SolarWinds that is installed on your Manager. If this alert persists: uninstall and reinstall the Agent
triggering the alert, this will force the Agent to re-initialize connection to the Manager.
InternalInfo > InternalUserLogoff
InternalUserLogoff alerts are generated when a user logs off or is disconnected from the Console.
InternalInfo > InternalUserLogon
InternalUserLogon alerts are generated when a user successfully completes the logon process to a
Manager via the Console. Failed log-on attempts are produced in a separate alert,
InternalUserLogonFailure.
InternalInfo > InternalUserLogonFailure
InternalUserLogonFailure alerts are generated when a user has completed initialization of a
connection to the Console, but enters an incorrect user name and/or password.
InternalInfo > InternalUserUpdate
InternalUserUpdate alerts are generated when a user is modified and the update has successfully
been sent to the Manager, or when the update has failed to apply. These updates include change or
addition of an email address, change or addition of a pager, and change or addition of blocked alerts
from selected Agents. Generally, an error in updating a user will also produce an alert from the
InternalFailure family.
InternalPolicy
InternalPolicy alerts reflect information related to correlation rules. These alerts are used to indicate
that a rule has been triggered, either in test mode or in normal operating conditions.
InternalPolicy > InternalTestRule
InternalTestRule alerts reflect rule activity where a correlation rule has triggered and is set in “Test”
392
Appendix B: Events
mode. It indicates the trigger of the rule and includes an enumeration of what actions would take
place, if any, if the rule were fully enabled. To remove a rule from Test mode, clear the “Test”
checkbox for the Rule in the Rule Builder.
InternalPolicy > InternalRuleFired
InternalRuleFired alerts reflect rule activity, specifically where a correlation rule has triggered. It
indicates the trigger of the rule and includes an enumeration of what actions were triggered in
response to the correlation.
Security Events
Events that are a part of the SecurityEvent node are generally related to network activity that is
consistent with an internal or external attack, a misuse or abuse of resources, a resource
compromise, resource probing, or other abnormal traffic that is noteworthy.
Security Event events indicate aggressive behavior that may lead to an attack or resource
compromise, or suspicious behavior that may indicate unauthorized information gathering. LEM infers
some Security Events from what is normally considered audit traffic, but it escalates the events to
alert status based on thresholds that are defined by Rules.
Each Security Event is described below. For your convenience, they are listed alphabetically.
AttackBehavior
Events that are children of AttackBehavior are generally related to network activity that may be
consistent of an attack, misuse or abuse of resources, a resource compromise, or other abnormal
behavior that should be considered indicative of a serious security event.
AttackBehavior > InferredAttack
InferredAttack alerts are reserved AttackBehavior alerts used for describing attacks that are a
composite of different types of alerts. These events will be defined and inferred by Contego Policy.
AttackBehavior > ResourceAttack
Members of the ResourceAttack tree are used to define different types of malicious or abusive
access to network resources, where these resources may be network bandwidth/traffic, files, client
processes or services, or other types of shared security-related 'commodities'.
393
Security Events
AttackBehavior > ResourceAttack > NetworkAttack
Members of the NetworkAttack tree are used to define events centered on malicious or abusive
usage of network bandwidth/traffic. These events include access to network resources, relaying
attacks via network resources, or denial of service behavior on network resources.
AttackBehavior > ResourceAttack > NetworkAttack > Access
Children of the Access tree define events centered on malicious or abusive usage of network
bandwidth/traffic where the intention, or the result, is inappropriate or abusive access to network
resources.
AttackBehavior > ResourceAttack > NetworkAttack > Access > ApplicationAccess
ApplicationAccess alerts reflect malicious or abusive usage of network resources where the
intention, or the result, is gaining access to resources where the related data is mostly or all
application-layer. Generally, ApplicationAccess alerts will reflect attempted exploitation of
weaknesses in server or client software, or information that is restricted/prohibited by device access
control or policy.
These alerts are generally provided by network-based intrusion detection systems; in some cases,
network infrastructure devices such as firewalls or proxy servers may also provide them.
Events placed in the parent ApplicationAccess alert itself are known to be application-related, but not
able to be further categorized based on the message provided by the connector or because they are
uncommon.
AttackBehavior > ResourceAttack > NetworkAttack > Access > ApplicationAccess >
DataBaseAccess
DataBaseAccess alerts reflect malicious or abusive usage of network resources where the intention,
or the result, is gaining access to resources via application-layer database traffic. Generally, these
alerts will reflect attempted exploitation of weaknesses in database server or client software.
These alerts are generally provided by network-based intrusion detection systems, the database
server, or the client software itself. Appropriate response to these alerts may entail better access
control of database servers (e.g. restriction by IP address and/or user name to ensure only trusted
clients are connecting), applying updates or patches to database servers and/or clients, or the
possible removal of the database service or client application related to this event.
394
Appendix B: Events
AttackBehavior > ResourceAttack > NetworkAttack > Access > ApplicationAccess >
FileTransferAccess
FileTransferAccess alerts reflect malicious or abusive usage of network resources where the
intention, or the result, is gaining access to resources via application-layer file transfer traffic.
Generally, these alerts will reflect attempted exploitation of weaknesses in file transfer server or
client software.
These alerts are generally provided by network-based intrusion detection systems, the file transfer
server, or the client software itself. Appropriate response to these alerts may entail better access
control of file transfer servers (e.g. restriction by IP address and/or user name to ensure only trusted
clients are connecting), applying updates or patches to file transfer servers and/or clients, or the
possible removal of the file transfer service or client application related to this event.
AttackBehavior > ResourceAttack > NetworkAttack > Access > ApplicationAccess >
FileTransferAccess > FTPFileAccess
FTPFileAccess alerts reflect malicious or abusive usage of network resources where the intention, or
the result, is gaining access to filesystems of resources via application-layer file transfer traffic.
Generally, these alerts will reflect attempted exploitation of weaknesses in file transfer server or
client software with the intent of information gathering or low-level filesystem access of the server or
client.
These alerts are generally provided by network-based intrusion detection systems, the file transfer
server, or the client software itself. Appropriate response to these alerts may entail better access
control of file transfer servers (e.g. restriction by IP address and/or user name to ensure only trusted
clients are connecting), applying updates or patches to file transfer servers and/or clients, or the
possible removal of the file transfer service or client application related to this event.
AttackBehavior > ResourceAttack > NetworkAttack > Access > ApplicationAccess >
FileTransferAccess > FTPInvalidFormatAccess
FTPInvalidFormatAccess alerts reflect malicious or abusive usage of network resources where the
intention, or the result, is gaining access to resources via application-layer file transfer traffic.
Generally, these alerts will reflect attempted exploitation of weaknesses in file transfer server or
client software with the intent of information gathering or low-level access to the server or client.
These attacks are always abnormal traffic that the file transfer server or client is not prepared to
respond to; attacks, such as buffer overflows, may also result in the server or client software or
system being halted.
395
Security Events
These alerts are generally provided by network-based intrusion detection systems, the file transfer
server, or the client software itself. Appropriate response to these alerts may entail better access
control of file transfer servers (e.g. restriction by IP address and/or user name to ensure only trusted
clients are connecting), applying updates or patches to file transfer servers and/or clients, or the
possible removal of the file transfer service or client application related to this event.
AttackBehavior > ResourceAttack > NetworkAttack > Access > ApplicationAccess >
FileTransferAccess > FTPCommandAccess
FTPCommandAccess alerts reflect malicious or abusive usage of network resources where the
intention, or the result, is gaining access to resources via application-layer file transfer traffic.
Generally, these alerts will reflect attempted exploitation of weaknesses in file transfer server
software with the intent of information gathering or low-level access to the server or client. These
attacks are always abnormal command traffic that the file transfer server is not prepared to respond
to, but may provide access to (e.g. debug or legacy commands).
These alerts are generally provided by network-based intrusion detection systems, the file transfer
server, or the client software itself. Appropriate response to these alerts may entail better access
control of file transfer servers (e.g. restriction by IP address and/or user name to ensure only trusted
clients are connecting), applying updates or patches to file transfer servers and/or clients, restriction
of allowed commands, or the possible removal of the file transfer service or client application related
to this event.
AttackBehavior > ResourceAttack > NetworkAttack > Access > ApplicationAccess > MailAccess
MailAccess alerts reflect malicious or abusive usage of network resources where the intention, or the
result, is gaining access to resources via application-layer mail transfer, retrieval, or service traffic.
Generally, these alerts will reflect attempted exploitation of weaknesses in mail-related server or
client software.
These alerts are generally provided by network-based intrusion detection systems or the mail server,
service, or client software itself. Appropriate response to these alerts may entail better access control
of mail servers (e.g. restriction by IP address and/or user name to ensure only trusted clients are
connecting), applying updates or patches to mail servers and/or clients, or possible removal of the
mail server, service, or client application related to this event.
AttackBehavior > ResourceAttack > NetworkAttack > Access > ApplicationAccess > MailAccess >
MailTransferAccess
396
Appendix B: Events
MailTransferAccess alerts reflect malicious or abusive usage of network resources where the
intention, or the result, is gaining access to resources via application-layer mail transfer traffic.
Generally, these alerts will reflect attempted exploitation of weaknesses in SMTP server software.
These alerts are generally provided by network-based intrusion detection systems, or the SMTP
server software itself. Appropriate response to these alerts may entail better access control of the
SMTP server (e.g. restriction by IP address and/or user name to ensure only trusted clients are
connecting, especially for SMTP servers that relay mail for external/remote entities), applying
updates or patches to SMTP servers, or the possible removal of the SMTP server related to this
event.
AttackBehavior > ResourceAttack > NetworkAttack > Access > ApplicationAccess > MailAccess >
MailTransferAccess > SMTPInvalidFormatAccess
SMTPInvalidFormatAccess alerts reflect malicious or abusive usage of network resources where the
intention, or the result, is gaining access to resources via application-layer mail transfer traffic.
Generally, these alerts will reflect attempted exploitation of weaknesses in SMTP server software
with the intent of information gathering or low-level access to the server. These attacks are always
abnormal traffic that the SMTP server is not prepared to respond to; attacks, such as buffer
overflows, may also result in the server software or system being halted.
These alerts are generally provided by network-based intrusion detection systems, or the SMTP
server software itself. Appropriate response to these alerts may entail better access control of the
SMTP server (e.g. restriction by IP address and/or user name to ensure only trusted clients are
connecting, especially for SMTP servers that relay mail for external/remote entities), applying
updates or patches to SMTP servers, or the possible removal of the SMTP server related to this
event.
AttackBehavior > ResourceAttack > NetworkAttack > Access > ApplicationAccess > MailAccess >
MailTransferAccess > SMTPInvalidFormatAccess > SmailAccess
SmailAccess alerts reflect malicious or abusive usage of network resources where the intention, or
the result, is gaining access to resources via application-layer mail transfer traffic. Generally, these
alerts will reflect attempted exploitation of weaknesses in SMTP server software with the intent of
information gathering or low-level access to the server. These attacks are always abnormal traffic
that the SMTP server is not prepared to respond to; they may also result in the server software or
system being halted. The smail attack specifically attempts to execute applications resulting in
compromise of the SMTP server system.
397
Security Events
These alerts are generally provided by network-based intrusion detection systems, or the SMTP
server software itself. Appropriate response to these alerts may entail better access control of the
SMTP server (e.g. restriction by IP address and/or user name to ensure only trusted clients are
connecting, especially for SMTP servers that relay mail for external/remote entities), applying
updates or patches to SMTP servers, or the possible removal of the SMTP server related to this
event.
AttackBehavior > ResourceAttack > NetworkAttack > Access > ApplicationAccess > MailAccess >
MailTransferAccess > SMTPCommandAccess
SMTPCommandAccess alerts reflect malicious or abusive usage of network resources where the
intention, or the result, is gaining access to resources via application-layer mail transfer traffic.
Generally, these alerts will reflect attempted exploitation of weaknesses in SMTP server software
with the intent of information gathering or low-level access to the server. These attacks are always
abnormal command traffic that the SMTP server is not prepared to respond to, but may provide
access to (e.g. debug or legacy commands).
These alerts are generally provided by network-based intrusion detection systems, or the SMTP
server software itself. Appropriate response to these alerts may entail better access control of the
SMTP server (e.g. restriction by IP address and/or user name to ensure only trusted clients are
connecting, especially for SMTP servers that relay mail for external/remote entities), applying
updates or patches to SMTP servers, restriction of allowed commands, or the possible removal of the
SMTP server related to this event.
AttackBehavior > ResourceAttack > NetworkAttack > Access > ApplicationAccess > MailAccess >
MailDeliveryAccess
MailDeliveryAccess alerts reflect malicious or abusive usage of network resources where the
intention, or the result, is gaining access to resources via application-layer mail retrieval traffic.
Generally, these alerts will reflect attempted exploitation of weaknesses in mail retrieval related
server or client software - the MDA (mail delivery Agent) or MUA (mail user Agent).
These alerts are generally provided by network-based intrusion detection systems, or the mail server,
service, or client software itself. Appropriate response to these alerts may entail better access control
of mail servers (e.g. restriction by IP address and/or user name to ensure only trusted clients are
connecting), applying updates or patches to mail servers and/or clients, or the possible removal of the
mail server, service, or client application related to this event.
398
Appendix B: Events
AttackBehavior > ResourceAttack > NetworkAttack > Access > ApplicationAccess > MailAccess >
MailServiceAccess
MailServiceAccess alerts reflect malicious or abusive usage of network resources where the
intention, or the result, is gaining access to resources via application-layer mail service traffic.
Generally, these alerts will reflect attempted exploitation of weaknesses in mail service-related
server or client software, including services such as mailing list software, spam filters, email
redirection software, and other mail filtering software.
These alerts are generally provided by network-based intrusion detection systems, the mail service,
or the client software itself. Appropriate response to these alerts may entail better access control of
mail services or servers (e.g. restriction by IP address and/or user name to ensure only trusted clients
are connecting), applying updates or patches to mail services and/or clients, or the possible removal
of the mail service or client application related to this event.
AttackBehavior > ResourceAttack > NetworkAttack > Access > ApplicationAccess > MailAccess >
MailServiceAccess > MajordomoAccess
MailServiceAccess alerts reflect malicious or abusive usage of network resources where the
intention, or the result, is gaining access to resources via application-layer mail service traffic.
Generally, these alerts will reflect attempted exploitation of weaknesses in Majordomo, a specific
type of mailing list software.
These alerts are generally provided by network-based intrusion detection systems, or the mail service
itself. Appropriate response to these alerts may entail better access control of mail services or
servers (e.g. restriction by IP address and/or user name to ensure only trusted clients are
connecting), applying updates or patches to the mail service, or the possible removal of the mail
service related to this event. Generally, the most appropriate response will be updates or patches that
can be retrieved from the Majordomo web site (http://www.greatcircle.com/majordomo) or your
operating system vendor.
AttackBehavior > ResourceAttack > NetworkAttack > Access > ApplicationAccess > NewsAccess
NewsAccess alerts reflect malicious or abusive usage of network resources where the intention, or
the result, is gaining access to resources via application-layer news traffic (over protocols such as
NNTP). Generally, these alerts will reflect attempted exploitation of weaknesses in the news server
or client software.
These alerts are generally provided by network-based intrusion detection systems, the news server,
399
Security Events
or the client software itself. Appropriate response to these alerts may entail better access control of
news servers (e.g. restriction by IP address and/or user name to ensure only trusted clients are
connecting), applying updates or patches to news servers and/or clients, or the possible removal of
the news service or client application related to this event.
AttackBehavior > ResourceAttack > NetworkAttack > Access > ApplicationAccess > PrinterAccess
PrinterAccess alerts reflect malicious or abusive usage of network resources where the intention, or
the result, is gaining access to resources via application-layer remote printer traffic. Generally, these
alerts will reflect attempted exploitation of weaknesses in the remote printer server or client software.
These alerts are generally provided by network-based intrusion detection systems, the remote printer
server, or the client software itself. Appropriate response to these alerts may entail better access
control of remote printer servers (e.g. restriction by IP address and/or user name to ensure only
trusted clients are connecting), applying updates or patches to remote printer servers and/or clients,
or the possible removal of the remote printer service or client application related to this event.
AttackBehavior > ResourceAttack > NetworkAttack > Access > ApplicationAccess > WebAccess
WebAccess alerts reflect malicious or abusive usage of network resources where the intention, or the
result, is gaining access to resources via application-layer WWW traffic. Generally, these alerts will
reflect attempted exploitation of weaknesses in the web server or client software.
These alerts are generally provided by network-based intrusion detection systems, the web server, or
client software itself. Appropriate response to these alerts may entail better access control of web
servers (e.g. restriction by IP address and/or user name to ensure only trusted clients are
connecting), applying updates or patches to web servers and/or clients, or the possible removal of the
web service or client application related to this event.
AttackBehavior > ResourceAttack > NetworkAttack > Access > ApplicationAccess > WebAccess >
HTTPClientAccess
HTTPClientAccess alerts reflect malicious or abusive usage of network resources where the
intention, or the result, is gaining access to resources via application-layer WWW traffic where the
information flow is from server to client. Generally, these alerts will reflect attempted exploitation of
weaknesses in the client software or abuse and/or misuse of resources from clients.
These alerts are generally provided by network-based intrusion detection systems, the web client
software itself, proxy servers, content filters, and/or firewalls with capability to monitor incoming web
400
Appendix B: Events
traffic. Appropriate response to these alerts may entail applying updates or patches to web client
software, or restriction of incoming/outgoing web requests/responses to reflect inappropriate or
abusive access.
AttackBehavior > ResourceAttack > NetworkAttack > Access > ApplicationAccess > WebAccess >
HTTPClientAccess > FraudulentCertificateAccess
FraudulentCertificateAccess alerts reflect malicious or abusive usage of network resources where
the intention, or the result, is gaining access to resources via application-layer WWW traffic in which
the information flow is from server to client. Generally, these alerts will reflect attempted exploitation
of weaknesses in the client software through fraudulent certificates. The intent of these attacks may
be to forge certificates that convince the client that the site is trusted, when in fact it is not, passing
data along with those certificates that may be inappropriate and/or contain exploits.
These alerts are generally provided by network-based intrusion detection systems, the web client
software itself, proxy servers, content filters, and/or firewalls with capability to monitor incoming web
traffic. Appropriate response to these alerts may entail applying updates or patches to web client
software, or restriction of incoming/outgoing web requests/responses to reflect the abusive access.
AttackBehavior > ResourceAttack > NetworkAttack > Access > ApplicationAccess > WebAccess >
HTTPClientAccess > ProhibitedHTTPControlAccess
ProhibitedHTTPControlAccess alerts reflect malicious or abusive usage of network resources where
the intention, or the result, is gaining access to resources via application-layer WWW traffic in which
the information flow is from server to client. Generally, these alerts will reflect attempted exploitation
of weaknesses in the client software or abuse and/or misuse of resources from clients through client
controls such as ActiveX and Java.
These alerts are generally provided by network-based intrusion detection systems, the web client
software itself, proxy servers, content filters, and/or firewalls with capability to monitor incoming web
traffic. Appropriate response to these alerts may entail applying updates or patches to web client
software, or restriction of incoming/outgoing web requests/responses to reflect inappropriate or
abusive access.
AttackBehavior > ResourceAttack > NetworkAttack > Access > ApplicationAccess > WebAccess >
HTTPServerAccess
HTTPServerAccess alerts reflect malicious or abusive usage of network resources where the
intention, or the result, is gaining access to resources via application-layer WWW traffic where the
401
Security Events
information flow is from client to server. Generally, these alerts will reflect attempted exploitation of
weaknesses in the server software or abuse and/or misuse of server resources.
These alerts are generally provided by network-based intrusion detection systems, the web server or
service software itself, and/or firewalls with the capability to monitor incoming/outgoing web traffic.
Appropriate response to these alerts may entail better access control of web servers (e.g. restriction
by IP address and/or user name to ensure only trusted clients are connecting), applying updates or
patches to web servers, services, and/or clients, or the possible removal of the web service or client
application related to this event.
AttackBehavior > ResourceAttack > NetworkAttack > Access > ApplicationAccess > WebAccess >
HTTPServerAccess > HTTPApplicationAccess
HTTPApplicationAccess alerts reflect malicious or abusive usage of network resources where the
intention, or the result, is gaining access to resources via application-layer WWW traffic in which the
information flow is from client to server. Generally, these alerts will reflect attempted exploitation of
weaknesses in applications running on top of the server software, such as PHP, CGI, administrative
sites, and other application services.
These alerts are generally provided by network-based intrusion detection systems, the web server,
the service software itself, and/or firewalls with capability to monitor incoming/outgoing web traffic.
Appropriate response to these alerts may entail better access control of web servers or the service
itself (e.g. restriction by IP address and/or user name to ensure only trusted clients are connecting),
applying updates or patches to web servers, services, and/or clients, or the possible removal of the
web service application related to this event.
AttackBehavior > ResourceAttack > NetworkAttack > Access > ApplicationAccess > WebAccess >
HTTPServerAccess > HTTPApplicationAccess > HTTPAdministrationAccess
HTTPAdministrationAccess alerts reflect malicious or abusive usage of network resources where the
intention, or the result, is gaining access to resources via application-layer WWW traffic in which the
information flow is from client to server. Generally, these alerts will reflect attempted exploitation of
weaknesses in applications run on top of server software that are related to remote administration of
sites, services, and/or systems.
These alerts are generally provided by network-based intrusion detection systems, the web server,
the service software itself, and/or firewalls with capability to monitor incoming/outgoing web traffic.
Appropriate response to these alerts may entail better access control of web servers or the service
itself (e.g. restriction by IP address and/or user name to ensure only trusted clients are connecting),
402
Appendix B: Events
applying updates or patches to web servers, services, administrative sites, and/or clients, or the
possible removal of the web service application or administrative site related to this event.
AttackBehavior > ResourceAttack > NetworkAttack > Access > ApplicationAccess > WebAccess >
HTTPServerAccess > HTTPApplicationAccess > HTTPDynamicContentAccess
HTTPDynamicContentAccess alerts reflect malicious or abusive usage of network resources where
the intention, or the result, is gaining access to resources via application-layer WWW traffic in which
the information flow is from client to server. Generally, these alerts will reflect attempted exploitation
of weaknesses in applications, running on top of the server software, that generate dynamic content
such as PHP, CGI, and ASP.
These alerts are generally provided by network-based intrusion detection systems, the web server,
the service software itself, and/or firewalls with capability to monitor incoming/outgoing web traffic.
Appropriate response to these alerts may entail better access control of web servers or the service
itself (e.g. restriction by IP address and/or user name to ensure only trusted clients are connecting),
applying updates or patches to web servers, services, dynamic content, and/or clients, or the
possible removal of the web service application or dynamic content related to this event.
AttackBehavior > ResourceAttack > NetworkAttack > Access > ApplicationAccess > WebAccess >
HTTPServerAccess > HTTPApplicationAccess > HTTPFileRequestAccess
HTTPFileRequestAccess alerts reflect malicious or abusive usage of network resources where the
intention, or the result, is gaining access to resources via application-layer WWW traffic in which the
information flow is from client to server. Generally, these alerts will reflect attempted exploitation of
weaknesses in applications running on top of server software that are related to remote administration
of sites, services, and/or systems with the intent of information gathering or low-level filesystem
access of the server or client.
These alerts are generally provided by network-based intrusion detection systems, the web server,
the service software itself, and/or firewalls with capability to monitor incoming/outgoing web traffic.
Appropriate response to these alerts may entail better access control of web servers or the service
itself (e.g. restriction by IP address and/or user name to ensure only trusted clients are connecting),
applying updates or patches to web servers, services, and/or clients, or the possible removal of the
web service application related to this event.
AttackBehavior > ResourceAttack > NetworkAttack > Access > ApplicationAccess > WebAccess >
HTTPServerAccess > HTTPApplicationAccess > HTTPServiceAccess
403
Security Events
HTTPServiceAccess alerts reflect malicious or abusive usage of network resources where the
intention, or the result, is gaining access to resources via application-layer WWW traffic in which the
information flow is from client to server. Generally, these alerts will reflect attempted exploitation of
weaknesses in applications running on top of server software that are related to remote services such
as printing or console access.
These alerts are generally provided by network-based intrusion detection systems, the web server,
the service software itself, and/or firewalls with capability to monitor incoming/outgoing web traffic.
Appropriate response to these alerts may entail better access control of web servers or the service
itself (e.g. restriction by IP address and/or user name to ensure only trusted clients are connecting),
applying updates or patches to web servers, services, and/or clients, or the possible removal of the
web service application or site related to this event.
AttackBehavior > ResourceAttack > NetworkAttack > Access > ApplicationAccess > WebAccess >
HTTPServerAccess > HTTPInvalidFormatAccess
HTTPInvalidFormatAccess alerts reflect malicious or abusive usage of network resources where the
intention, or the result, is gaining access to resources via application-layer web traffic in which the
information flow is from client to server. Generally, these alerts will reflect attempted exploitation of
weaknesses in web server software with the intent of information gathering or low-level access to the
server. These attacks are always abnormal traffic that the web server is not prepared to respond to;
attacks, such as buffer overflows, may also result in the server software or system being halted.
These alerts are generally provided by network-based intrusion detection systems, the web server,
the service software itself, and/or firewalls with capability to monitor incoming/outgoing web traffic.
Appropriate response to these alerts may entail better access control of the web server (e.g.
restriction by IP address and/or user name to ensure only trusted clients are connecting), applying
updates or patches to web servers or services, or the possible removal of the web server related to
this event.
AttackBehavior > ResourceAttack > NetworkAttack > Access > ApplicationAccess >
NamingAccess
NamingAccess alerts reflect malicious or abusive usage of network resources where the intention, or
the result, is gaining access to resources via application-layer naming service traffic (using protocols
such as DNS and WINS). Generally, these alerts will reflect attempted exploitation of weaknesses in
the naming server or client software.
404
Appendix B: Events
These alerts are generally provided by network-based intrusion detection systems, the naming
server, or the client software itself. Appropriate response to these alerts may entail better access
control of name servers (e.g. restriction by IP address and/or user name to ensure only trusted clients
are connecting), applying updates or patches to naming servers and/or clients, or the possible
removal of the naming service or client application related to this event.
AttackBehavior > ResourceAttack > NetworkAttack > Access > ApplicationAccess >
RemoteConsoleAccess
RemoteConsoleAccess alerts reflect malicious or abusive usage of network resources where the
intention, or the result, is gaining access to resources via application-layer remote console service
traffic (services such as telnet, SSH, and terminal services). Generally, these alerts will reflect
attempted exploitation of weaknesses in the remote console server or client software.
These alerts are generally provided by network-based intrusion detection systems, the remote
console server, or the client software itself. Appropriate response to these alerts may entail better
access control of remote console servers (e.g. restriction by IP address and/or user name to ensure
only trusted clients are connecting), applying updates or patches to remote console servers and/or
clients, or the possible removal of the remote console service or client application related to this
event.
AttackBehavior > ResourceAttack > NetworkAttack > Access > ApplicationAccess > TimeAccess
TimeAccess alerts reflect malicious or abusive usage of network resources where the intention, or
the result, is gaining access to resources via application-layer remote time service traffic (using
protocols such as NTP). Generally, these alerts will reflect attempted exploitation of weaknesses in
the remote time server or client software.
These alerts are generally provided by network-based intrusion detection systems, the time server, or
client software itself. Appropriate response to these alerts may entail better access control of remote
time servers (e.g. restriction by IP address and/or user name to ensure only trusted clients are
connecting), applying updates or patches to remote time servers and/or clients, or the possible
removal of the remote time service or client application related to this event.
AttackBehavior > ResourceAttack > NetworkAttack > Access > ConfigurationAccess
ConfigurationAccess alerts reflect malicious or abusive usage of network resources where the
intention, or the result, is gaining access to resources via resource configuration traffic (using
protocols such as DHCP, BootP, and SNMP). Generally, these alerts will reflect attempted
405
Security Events
exploitation of weaknesses in the configuration server or client software or attempts to gain systemlevel access to configuration servers themselves. In the case of SNMP and similar configuration
protocols, it could reflect an attempt to enumerate a device or devices on the same network for further
attack.
These alerts are generally provided by network-based intrusion detection systems, the configuration
server, or the client software itself. Appropriate response to these alerts may entail better access
control of configuration servers and services (e.g. restriction by IP address and/or user name to
ensure only trusted clients are connecting), applying updates or patches to configuration servers
and/or clients, or the possible removal of the configuration service or client application related to this
event.
AttackBehavior > ResourceAttack > NetworkAttack > Access > CoreAccess
CoreAccess alerts reflect malicious or abusive usage of network resources where the intention, or
the result, is gaining access to resources where the related data is mostly or all core protocols (TCP,
UDP, IP, ICMP). Generally, CoreAccess alerts will reflect attempted exploitation of weaknesses in
network protocols or devices with intent to gain access to servers, clients, or network infrastructure
devices.
These alerts are generally provided by network-based intrusion detection systems; in some cases,
network infrastructure devices such as firewalls or routers may also provide them. In some cases,
these events are escalated from the Audit tree via Contego Policy.
Events placed in the parent CoreAccess alert itself are known to be a core protocol-related but not
able to be further categorized based on the message provided by the connector or because they are
uncommon.
AttackBehavior > ResourceAttack > NetworkAttack > Access > CoreAccess >
ICMPRedirectAccess
ICMPRedirectAccess alerts reflect a specific type of CoreAccess alert where the attack traffic is all
ICMP Redirects (ICMP type 5) and the intent is to redirect traffic to either enumerate devices or client
machines, or to gather information on devices or client traffic to further attack those or other
resources. ICMP Redirects are generally benign ICMP messages sent to hosts to redirect traffic
intended for a network that another gateway can control. In the cases where ICMP Redirects are
used for attacking, a host will generally feign themselves as a router, pass a redirect to a client
machine to modify it's routing table to send traffic to the false router instead of their normal network
gateway, and proceed to enumerate, gather information, or attack the redirected host. The false router
406
Appendix B: Events
will then send the traffic on to the correct gateway, and the host has no idea of what has occurred
(unless another device or connector detects it). This is one type of what is commonly referred to as a
man-in-the-middle attack.
These alerts are generally provided by network-based intrusion detection systems and network
infrastructure devices such as firewalls or routers. Appropriate response to these alerts may entail
blocking or resetting the local or remote user's connection/IP address, updates to network
infrastructure devices, or restriction of incoming/outgoing ICMP redirect requests/responses to
reflect inappropriate or abusive access. Appropriate methods of prevention of ICMP redirect attacks
would be to limit hosts who can broadcast ICMP Redirects across network devices to correct routers
and gateways, limit ingress and egress ICMP traffic, and to make sure clients, servers, and network
infrastructure devices are current with regards to operating system or other networking software to
ensure that other attacks related to ICMP Redirect attacks of this type (such as denial of service
attacks) do not occur.
AttackBehavior > ResourceAttack > NetworkAttack > Access > CoreAccess >
IPFragmentationAccess
IPFragmentationAccess alerts reflect a specific type of CoreAccess alert where the attack traffic is
all IP and the intent is to mask possible malicious or abusive data past an IDS or other detection
device by using many IP fragments (usually either much larger or smaller than normal fragments).
The network infrastructure devices handling the traffic will reassemble and pass on the traffic
correctly, however, an IDS on the network may not be able to detect the malicious traffic, only the
presence of fragments (if even that). The attack may be allowed to pass through the network either
incoming or outgoing, thereby eliminating one line of defense. Normal IP fragmentation (data that has
been taken apart because it is too large based on network parameters) should not trigger an
IPFragmentationAccess alert.
Fragmentation alerts themselves are generally provided by network-based intrusion detection
systems and network infrastructure devices such as firewalls or routers. Appropriate response to
these alerts may entail blocking or resetting the local or remote user's connection/IP address,
applying updates or patches to server and/or client software (especially the IDS), updates to network
infrastructure devices, or restriction of incoming/outgoing network requests/responses to reflect
inappropriate or abusive access.
AttackBehavior > ResourceAttack > NetworkAttack > Access > CoreAccess >
IPSourceRouteAccess
407
Security Events
IPSourceRouteAccess alerts reflect a specific type of CoreAccess alert where the attack traffic is all
IP and the intent is generally to misrepresent the originating address to bypass detection.
IPSourceRouteAccess is a type of IP Spoofing where an attacker falsifies network information to
convince the destination that the given source is something other than the actual source, directing the
destination to return the traffic through an IP Source Route option that traces the traffic to the trusted
host and then on to the untrusted attacker. The trusted host receives the traffic from the destination
and because of the IP Source Route, it passes the traffic on to the untrusted attacker. The data is not
modified and the attacker has 'tricked' the network into passing the traffic on. Generally, while
spoofed, clients will attempt to gather information, perform actual attacks on internal or external
devices, or perform denial of service attacks.
These alerts are generally provided by network-based intrusion detection systems and network
infrastructure devices such as firewalls or routers. Response to IP Spoofing itself is difficult as the
originating host may be alternating spoofed hostnames or IP addresses in order to continually
circumvent detection; however, response to IP spoofing which utilizes the IP source route could
entail removing the ability to pass traffic through routers or gateways that contains an IP Source
Route option. Initial appropriate response to these alerts may entail blocking or resetting the local or
remote user's connection/IP address, however this may prove ineffective or unrealistic. Other
responses may include applying updates or patches to server and/or client software, updates to
network infrastructure devices, or restriction of incoming/outgoing network requests/responses to
reflect inappropriate or abusive access. Unfortunately, it may prove difficult to derail an attempted
attack through IP Spoofing, however, routing and firewalling policies (including disallowing traffic with
the IP Source Route option) should prevent further access through spoofed addresses.
AttackBehavior > ResourceAttack > NetworkAttack > Access > CoreAccess > IPSpoofAccess
IPSpoofAccess alerts reflect a specific type of CoreAccess alert where the attack traffic is all IP and
the intent is to misrepresent the originating address to either bypass detection or misdirect response
to attack activity. IP Spoofing is done by falsifying network information to convince the destination
(and any network hops in between) that the given source is something other than the actual source.
Generally, while spoofed, clients will attempt to gather information, perform actual attacks on internal
or external devices, or perform denial of service attacks.
These alerts are generally provided by network-based intrusion detection systems and network
infrastructure devices such as firewalls or routers. Response to IP Spoofing is difficult as the
originating host may be alternating spoofed hostnames or IP addresses in order to continually
circumvent detection. Initial appropriate response to these alerts may entail blocking or resetting the
local or remote user's connection/IP address, however this may prove ineffective or unrealistic. Other
408
Appendix B: Events
responses may include applying updates or patches to server and/or client software, updates to
network infrastructure devices, or restriction of incoming/outgoing network requests/responses to
reflect inappropriate or abusive access. Unfortunately, it may prove difficult to derail an attempted
attack through IP Spoofing, however, routing and firewalling policies should prevent further access
through spoofed addresses.
AttackBehavior > ResourceAttack > NetworkAttack > Access > CoreAccess > TCPHijackAccess
TCPHijackAccess alerts reflect a specific type of CoreAccess alert where the attack traffic is all
TCP and the intent is to hijack a user's connection. TCP Hijacking is done with the intent to take over
another network user's connection by sending malformed packets to 'confuse' the server into thinking
that the new user is the original user. In doing so, the original user gets removed from his connection
to the server and the new user has injected himself, taking over all attributes the server assumed from
the original - including levels of security and/or trust. TCP Hijacking can be used to place future
attack connectors on client systems, gather information about networks and/or client systems,
immediately attack internal networks, or other malicious and/or abusive behavior.
These alerts are generally provided by network-based intrusion detection systems; in some cases,
network infrastructure devices such as firewalls or routers may also provide them. Appropriate
response to these alerts may entail blocking or resetting the remote hijacker's connection/IP address,
applying updates or patches to server and/or client software, updates to network infrastructure
devices, or restriction of incoming/outgoing network requests/responses to reflect inappropriate or
abusive access.
AttackBehavior > ResourceAttack > NetworkAttack > Access > CoreAccess >
TCPTunnelingAccess
TCPTunnelingAccess alerts reflect a specific type of CoreAccess alert where the attack traffic is all
TCP and the intent is to tunnel a possible malicious or abusive connection through other TCP traffic.
TCP tunneling uses permitted TCP traffic to bypass access policies on network devices, content
filtering, monitoring, and other traffic shaping or behavior policies. TCP tunneling is done by initiating
a known 'acceptable' TCP connection through allowed policies and piggybacking an unacceptable
connection atop the granted one. On the new 'tunnel' that the user has built, they are allowed to pass
any traffic through that does not match other policies - often after the connection has been initiated, it
may be difficult to detect and prevent further malicious or abusive activity.
These alerts are generally provided by network-based intrusion detection systems; in some cases,
network infrastructure devices such as firewalls or routers may also provide them. Appropriate
409
Security Events
response to these alerts may entail blocking or resetting the local or remote user's connection/IP
address, applying updates or patches to server and/or client software, updates to network
infrastructure devices, or restriction of incoming/outgoing network requests/responses to reflect
inappropriate or abusive access.
AttackBehavior > ResourceAttack > NetworkAttack > Access > FileSystemAccess
FileSystemAccess alerts reflect malicious or abusive usage of network resources where the
intention, or the result, is gaining access to resources via remote filesystem traffic (using protocols
such as SMB and NFS). Generally, these alerts will reflect attempted exploitation of weaknesses in
the remote filesystem server or client software or attempts to gain system-level access to remote
filesystem servers themselves.
These alerts are generally provided by network-based intrusion detection systems, the remote
filesystem server, or the client software itself. Appropriate response to these alerts may entail better
access control of remote filesystems (e.g. restriction by IP address and/or user name to ensure only
trusted clients are connecting), applying updates or patches to remote filesystem servers and/or
clients, or the possible removal of the remote filesystem service or client application related to this
event
AttackBehavior > ResourceAttack > NetworkAttack > Access > FileSystemAccess > NFSAccess
NFSAccess alerts are a specific type of FileSystemAccess alert that reflects malicious or abusive
usage of network resources where the intention, or the result, is gaining access to resources via NFS
(network file share) remote filesystem traffic. Generally, these alerts will reflect attempted
exploitation of weaknesses in the NFS server or client software or attempts to gain system-level
access to NFS servers themselves.
These alerts are generally provided by network-based intrusion detection systems, the remote
filesystem server, or the client software itself. Appropriate response to these alerts may entail better
access control of remote filesystems (e.g. restriction by IP address and/or user name to ensure only
trusted clients are connecting), applying updates or patches to remote filesystem servers and/or
clients, or the possible removal of the remote filesystem service or client application related to this
event.
AttackBehavior > ResourceAttack > NetworkAttack > Access > FileSystemAccess > SMBAccess
SMBAccess alerts are a specific type of FileSystemAccess alert that reflects malicious or abusive
usage of network resources where the intention, or the result, is gaining access to resources via SMB
410
Appendix B: Events
(server message block) remote filesystem traffic. Generally, these alerts will reflect attempted
exploitation of weaknesses in the SMB server or client software or attempts to gain system-level
access to SMB servers themselves.
These alerts are generally provided by network-based intrusion detection systems, the remote
filesystem server, or the client software itself. Appropriate response to these alerts may entail better
access control of remote filesystems (e.g. restriction by IP address and/or user name to ensure only
trusted clients are connecting), applying updates or patches to remote filesystem servers and/or
clients, or the possible removal of the remote filesystem service or client application related to this
event.
AttackBehavior > ResourceAttack > NetworkAttack > Access > LinkControlAccess
LinkControlAccess alerts reflect malicious or abusive usage of network resources where the
intention, or the result, is gaining access to resources where the related data is low-level link control
(using protocols such as ARP). Generally, LinkControlAccess alerts will reflect attempted
exploitation of weaknesses in switching devices by usage of malformed incoming or outgoing data,
with intent to enumerate or gain access to or through switching devices, clients that are also on the
switching device, and entire networks attached to the switching device. In some cases, a managed
switch with restrictions on port analyzing activity may be forced into an unmanaged switch with no
restrictions - allowing a malicious client to sniff traffic and enumerate or attack.
These alerts are generally provided by network-based intrusion detection systems and network
infrastructure devices with link level control (such as switches). Appropriate response to
LinkControlAccess events may be to clear the link-level control mechanisms of the switching device
(things such as flushing the ARP cache), applying updates or patches to switching devices, or better
segmentation of networks to prevent information disclosure if an attack occurs.
AttackBehavior > ResourceAttack > NetworkAttack > Access > PointToPointAccess
PointToPointAccess alerts reflect malicious or abusive usage of network resources where the
intention, or the result, is gaining access to resources via point to point traffic (using protocols such
as PPTP). Generally, these alerts will reflect attempted exploitation of weaknesses in point to point
server or client software, attempts to enumerate networks, or attempts to further attack devices on
trusted networks.
These alerts are generally provided by network-based intrusion detection systems; in some cases,
network infrastructure devices such as firewalls, routers, or VPN servers may also provide them.
Appropriate response to these alerts may entail better access control of remote access services (e.g.
411
Security Events
restriction by IP address and/or user name to ensure only trusted clients are connecting), applying
updates or patches to remote access servers and/or clients, or the possible removal of the remote
point to point service or client application related to this event.
AttackBehavior > ResourceAttack > NetworkAttack > Access > PointToPointAccess > PPTPSpoof
PPTPSpoof alerts reflect a specific type of PointToPointAccess alert where the attack traffic is all
PPTP and the intent is to misrepresent the originating address to either bypass detection or misdirect
response to attack activity; often times the target of these attacks are internal trusted networks that
allow remote access through PPTP tunneling. PPTP Spoofing is done by falsifying network
information to convince the destination (and any network hops in between) that the given source is
something other than the actual source. Generally, while spoofed, clients will attempt to gather
information, perform actual attacks on internal devices, or perform denial of service attacks.
These alerts are generally provided by network-based intrusion detection systems and network
infrastructure devices such as firewalls or routers. Response to PPTP Spoofing is difficult, as the
originating host appears to be coming from a 'trusted' address that has already completed initial
handshaking and key sharing. Initial appropriate response to these alerts may entail blocking or
resetting the local or remote user's connection/IP address, applying updates or patches to server
and/or client software, updates to network infrastructure devices, or restriction of incoming/outgoing
PPTP traffic requests/responses to reflect inappropriate or abusive access.
AttackBehavior > ResourceAttack > NetworkAttack > Access > RemoteProcedureAccess
RemoteProcedureAccess alerts reflect malicious or abusive usage of network resources where the
intention, or the result, is gaining access to resources via remote procedure call traffic (using
protocols such as the traditional RPC services, RMI, and CORBA). Generally, these alerts will
reflect attempted exploitation of weaknesses in the remote procedure server or client software or
attempts to gain system-level access to remote procedure servers themselves.
These alerts are generally provided by network-based intrusion detection systems, the remote
procedure server, or the client software itself. Appropriate response to these alerts may entail better
access control of remote procedure (e.g. restriction by IP address and/or user name to ensure only
trusted clients are connecting), applying updates or patches to remote procedure servers and/or
clients, or the possible removal of the remote procedure service or client application related to this
event.
AttackBehavior > ResourceAttack > NetworkAttack > Access > RemoteProcedureAccess >
RPCPortmapperAccess
412
Appendix B: Events
RPCPortmapperAccess alerts reflect malicious or abusive usage of network resources where the
intention, or the result, is gaining access to resources via remote procedure call traffic using the
traditional RPC portmapper service. Generally, these alerts will reflect attempted exploitation of
weaknesses in the remote procedure server or client software or attempts to gain system-level
access to remote procedure servers themselves.
These alerts are generally provided by network-based intrusion detection systems, the remote
procedure server, or the client software itself. Appropriate response to these alerts may entail better
access control of remote procedure (e.g. restriction by IP address and/or user name to ensure only
trusted clients are connecting), applying updates or patches to remote procedure servers and/or
clients, or the possible removal of the remote procedure service or client application related to this
event.
AttackBehavior > ResourceAttack > NetworkAttack > Access > RoutingAccess
RoutingAccess alerts reflect malicious or abusive usage of network resources where the intention, or
the result, is gaining access to resources where the related data is routing-related protocols (RIP,
IGMP, etc.). Generally, RoutingAccess alerts will reflect attempted exploitation of weaknesses in
routing protocols or devices with intent to enumerate or gain access to or through routers, servers,
clients, or other network infrastructure devices. These routing protocols are used to automate the
routing process between multiple devices that share or span networks.
These alerts are generally provided by network-based intrusion detection systems and network
infrastructure devices that utilize routing protocols such as firewalls and routers. Appropriate
response to RoutingAccess events may be better access control of routing devices (e.g. restriction of
what devices are allowed to update routing by IP address to ensure only trusted devices are passing
data), applying updates or patches to routing servers and/or devices, or the possible removal of the
automated routing protocols from servers and/or devices.
AttackBehavior > ResourceAttack > NetworkAttack > Access > RoutingAccess >
MalformedRIPAccess
MalformedRIPAccess alerts reflect malicious or abusive usage of network resources where the
intention, or the result, is gaining access to resources where the related data is all RIP (Routing
Information Protocol). Generally, MalformedRIPAccess alerts will reflect attempted exploitation of
weaknesses in RIP by usage of malformed incoming or outgoing data, with the intent to enumerate or
gain access to or through routers, servers, clients, or other network infrastructure devices. RIP is
used to automate the routing process between multiple devices that share or span networks.
413
Security Events
These alerts are generally provided by network-based intrusion detection systems and network
infrastructure devices that utilize routing protocols such as firewalls and routers. Appropriate
response to RIP Access events may be better access control of routing devices (e.g. restriction of
what devices are allowed to update routing by IP address to ensure only trusted devices are passing
data), applying updates or patches to routing servers and/or devices, or the possible removal of the
automated routing protocols from servers and/or devices.
AttackBehavior > ResourceAttack > NetworkAttack > Access > TrojanTrafficAccess
TrojanTrafficAccess alerts reflect malicious or abusive usage of network resources where the
intention, or the result, is gaining access to resources through malicious code commonly known as a
Trojan Horse. This alert detects the communication related to Trojans over the network (generally,
'trojaned' clients calling home to the originator). Trojans are generally executables that generally
require no user intervention to spread and contain malicious code that is placed on the client system
and used to exploit the client (and return access to the originator of the attack) or exploit other clients
(used in attacks such as distributed denial of service attacks).
These alerts are generally provided by a virus scanner, a network-based intrusion detection system,
or in some cases, the operating system or network infrastructure devices such as firewalls and
routers. Appropriate response to these alerts may entail a quarantine of the node from the network to
prevent internal attacks and further compromise of the client system, updates of virus scanner
pattern files on this and other network nodes to prevent future or further infection, virus scans on this
and other network nodes to detect further infection if any has taken place, and research into the
offending Trojan to find out methods of removal (if necessary).
AttackBehavior > ResourceAttack > NetworkAttack > Access > TrojanTrafficAccess >
TrojanCommandAccess
TrojanCommandAccess alerts reflect malicious or abusive usage of network resources where the
intention, or the result, is gaining access to resources through malicious code commonly known as
Trojan Horses. This alert detects the communication related to Trojans sending commands over the
network (infecting other clients, participating in a denial of service activity, being controlled remotely
by the originator, etc.). Trojans are generally executables that generally require no user intervention to
spread and contain malicious code that is placed on the client system and used to exploit the client
(and return access to the originator of the attack) or exploit other clients (used in attacks such as
distributed denial of service attacks).
These alerts are generally provided by a virus scanner, a network-based intrusion detection system,
414
Appendix B: Events
or in some cases, the operating system or network infrastructure devices such as firewalls and
routers. Appropriate response to these alerts may entail a quarantine of the node from the network to
prevent internal attacks and further compromise of the client system, updates of virus scanner
pattern files on this and other network nodes to prevent future or further infection, virus scans on this
and other network nodes to detect further infection if any has taken place, and research into the
offending Trojan to find out methods of removal (if necessary).
AttackBehavior > ResourceAttack > NetworkAttack > Access > TrojanTrafficAccess >
TrojanInfectionAccess
TrojanInfectionAccess alerts reflect malicious or abusive usage of network resources where the
intention, or the result, is gaining access to resources through malicious code commonly known as a
Trojan Horse. This alert detects the infection traffic related to a Trojan entering the network (generally
with intent to infect a client). Trojans are generally executables that generally require no user
intervention to spread and contain malicious code that is placed on the client system and used to
exploit the client (and return access to the originator of the attack) or exploit other clients (used in
attacks such as distributed denial of service attacks).
These alerts are generally provided by a virus scanner, a network-based intrusion detection system,
or in some cases, the operating system or network infrastructure devices such as firewalls and
routers. Appropriate response to these alerts may entail a quarantine of the node from the network to
prevent internal attacks and further compromise of the client system, updates of virus scanner
pattern files on this and other network nodes to prevent future or further infection, virus scans on this
and other network nodes to detect further infection if any has taken place, and research into the
offending Trojan to find out methods of removal (if necessary).
AttackBehavior > ResourceAttack > NetworkAttack > Access > VirusTrafficAccess
VirusTrafficAccess alerts reflect malicious or abusive usage of network resources where the
intention, or the result, is gaining access to resources through malicious code commonly known as
viruses. This alert detects the communication related to viruses over the network (generally, the
spread of a virus infection or an incoming virus infection). Viruses are generally executables that
require user intervention to spread, contain malicious code that is placed on the client system, and
are used to exploit the client and possibly spread itself to other clients.
These alerts are generally provided by a virus scanner, a network-based intrusion detection system,
or in some cases, the operating system or network infrastructure devices such as firewalls and
routers. Appropriate response to these alerts may entail a quarantine of the node from the network to
415
Security Events
prevent internal attacks and further compromise of the client system, updates of virus scanner
pattern files on this and other network nodes to prevent future or further infection, virus scans on this
and other network nodes to detect further infection if any has taken place, and research into the
offending virus to find out methods of removal (if necessary).
AttackBehavior > ResourceAttack > NetworkAttack > Denial
Children of the Denial tree define events centered on malicious or abusive usage of network
bandwidth/traffic where the intention, or the result, is inappropriate or abusive access to network
resources through a denial of service attack.
These alerts are generally provided by network-based intrusion detection systems, but may also be
provided by firewalls or other network infrastructure devices.
AttackBehavior > ResourceAttack > NetworkAttack > Denial > ApplicationDenial
ApplicationDenial events are a specific type of Denial event where the transport of the malicious or
abusive usage is application-layer protocols. The intent, or the result, of this activity is inappropriate
or abusive access to network resources through a denial of service attack. ApplicationDenial events
may be attempts to exploit weaknesses in software to gain access to a host system, attempts to
exploit weaknesses in network infrastructure equipment to enumerate or reconfigure devices, or other
denial of service activities.
These alerts are generally provided by network-based intrusion detection systems, but may also be
provided by firewalls or other network infrastructure devices.
AttackBehavior > ResourceAttack > NetworkAttack > Denial > ApplicationDenial >
FileTransferDenial
FileTransferDenial events are a specific type of Denial event where the transport of the malicious or
abusive usage is application-layer file transfer-related protocols (FTP, TFTP, etc.). The intent, or the
result, of this activity is inappropriate or abusive access to network resources through a denial of
service attack. FileTransferDenial events may be attempts to exploit weaknesses in file transferrelated software to gain access to a host system, attempts to exploit weaknesses in the software to
enumerate or reconfigure, or other denial of service activities.
These alerts are generally provided by network-based intrusion detection systems, but may also be
provided by firewalls or other network infrastructure devices.
416
Appendix B: Events
AttackBehavior > ResourceAttack > NetworkAttack > Denial > ApplicationDenial > MailDenial
MailDenial events are a specific type of Denial event where the transport of the malicious or abusive
usage is application-layer mail-related protocols (SMTP, IMAP, POP3, etc.) or services (majordomo,
spam filters, etc.). The intent, or the result, of this activity is inappropriate or abusive access to
network resources through a denial of service attack. MailDenial events may be attempts to exploit
weaknesses in mail-related software to gain access to a host system, attempts to exploit
weaknesses in the software to enumerate or reconfigure, or other denial of service activities.
These alerts are generally provided by network-based intrusion detection systems, but may also be
provided by firewalls or other network infrastructure devices.
AttackBehavior > ResourceAttack > NetworkAttack > Denial > ApplicationDenial > MailDenial >
MailServiceDenial
MailServiceDenial events are a specific type of Denial event where the transport of the malicious or
abusive usage is application-layer mail-related services (majordomo, spam filters, etc.). The intent, or
the result, of this activity is inappropriate or abusive access to network resources through a denial of
service attack. MailServiceDenial events may be attempts to exploit weaknesses in mail-related
software to gain access to a host system, attempts to exploit weaknesses in the software to
enumerate or reconfigure, or other denial of service activities.
These alerts are generally provided by network-based intrusion detection systems, but may also be
provided by firewalls or other network infrastructure devices.
AttackBehavior > ResourceAttack > NetworkAttack > Denial > ApplicationDenial > MailDenial >
MailServiceDenial > MailSpamDenial
MailSpamDenial events are a specific type of Denial event where the transport of the malicious or
abusive usage is application-layer mail-related services (usually SMTP). The intent, or the result, of
this activity is inappropriate or abusive access to network resources through a denial of service
attack through excessive mail relaying. MailSpamDenial events reflect excessive attempts to relay
mail through an SMTP server from remote sites that should not typically be relaying mail through the
server, let alone excessive quantities of mail. The goal of these attacks may not be to enumerate or
exploit weaknesses in the mail server, but to relay as much mail through an open relay mail server as
quickly as possible, resulting in a denial of service attack.
These alerts are generally provided by network-based intrusion detection systems, but may also be
provided by the mail server itself, firewalls, or other network infrastructure devices. These alerts may
417
Security Events
indicate an open relay on the network or an attempt to find an open relay; appropriate response may
be to close access to SMTP servers to only internal and necessary external IP addresses.
AttackBehavior > ResourceAttack > NetworkAttack > Denial > ApplicationDenial > WebDenial
WebDenial events are a specific type of Denial event where the transport of the malicious or abusive
usage is application-layer web-related protocols (HTTP, HTTPS, etc.) or services (CGI, ASP, etc.).
The intent, or the result, of this activity is inappropriate or abusive access to network resources
through a denial of service attack. WebDenial events may be attempts to exploit weaknesses in webrelated software to gain access to a host system, attempts to exploit weaknesses in the software to
enumerate or reconfigure, or other denial of service activities.
These alerts are generally provided by network-based intrusion detection systems, but may also be
provided by firewalls or other network infrastructure devices.
AttackBehavior > ResourceAttack > NetworkAttack > Denial > CoreDenial
CoreDenial events are a specific type of Denial event where the transport of the malicious or abusive
usage is core protocols (TCP, IP, ICMP, UDP). The intent, or the result, of this activity is
inappropriate or abusive access to network resources through a denial of service attack. CoreDenial
events may be attempts to exploit weaknesses in software to gain access to a host system,
attempts to exploit weaknesses in network infrastructure equipment to enumerate or reconfigure
devices, or other denial of service activities.
These alerts are generally provided by network-based intrusion detection systems, but may also be
provided by firewalls or other network infrastructure devices.
AttackBehavior > ResourceAttack > NetworkAttack > Denial > CoreDenial > ChargenDenial
ChargenDenial alerts reflect a specific type of CoreDenial alert where the intent, or the result, of this
activity is inappropriate or abusive access to network resources through a denial of service via UDP
chargen or echo services. This attack attempts to exploit network infrastructure devices and hosts by
pointing two chargen or echo hosts at each other and forcing so many responses that the network and
hosts are flooded. In response to a request to the echo or chargen port, the second device will send a
response, which will trigger another request, which will trigger a response, etc. The source of the
initial request is a spoofed IP address, which appears as one of the hosts which will be a party in the
attack (sent to the second host). This will render both devices and possibly the network they are on
useless either temporarily or for a significant amount of time by the sheer amount of traffic that is
created.
418
Appendix B: Events
ChargenDenial alerts are generally provided by network-based intrusion detection systems and
network infrastructure devices such as firewalls or routers.
AttackBehavior > ResourceAttack > NetworkAttack > Denial > CoreDenial > ICMPFloodDenial
ICMPFloodDenial alerts reflect a specific type of CoreDenial alert where the intent, or the result, of
this activity is inappropriate or abusive access to network resources through a denial of service by an
ICMP-based 'flood' attack (which uses many very large ICMP packets). The network infrastructure
devices handling the traffic may pass on the traffic correctly, however, any vulnerable client or device
on the network may not be able to process the incoming traffic (it may use up system resources to the
point where the device is rendered useless and cannot accept network connections). Normal ICMP
Traffic should not trigger an ICMPFloodDenial alert.
ICMPFloodDenial alerts are generally provided by network-based intrusion detection systems and
network infrastructure devices such as firewalls or routers.
AttackBehavior > ResourceAttack > NetworkAttack > Denial > CoreDenial >
ICMPFragmentationDenial
ICMPFragmentationDenial alerts reflect a specific type of CoreDenial alert where the intent, or the
result, of this activity is inappropriate or abusive access to network resources through a denial of
service attack by using many ICMP fragments (usually either much larger or smaller than normal
fragments). The network infrastructure devices handling the traffic will reassemble and pass on the
traffic correctly, however, any vulnerable client on the network may not be able to reassemble the
fragmented traffic (it may overflow the stack, triggering a host or service crash). Normal ICMP
fragmentation (data that has been taken apart because it is too large based on network parameters)
should not trigger an ICMPFragmentationDenial alert.
Fragmentation alerts themselves are generally provided by network-based intrusion detection
systems and network infrastructure devices such as firewalls or routers.
AttackBehavior > ResourceAttack > NetworkAttack > Denial > CoreDenial >
ICMPSourceQuenchDenial
ICMPSourceQuenchDenial alerts reflect a specific type of CoreDenial alert where the intent, or the
result, of this activity is inappropriate or abusive access to network resources through a denial of
service by an ICMP-based attack (which uses many ICMP packets set to type 4 - Source Quench).
The network infrastructure devices handling the traffic may pass on the traffic correctly, however, any
client listening and responding to source quench traffic may be slowed down to the point where
419
Security Events
rendered useless by way of correct response to the quench request. Normal ICMP traffic (including
single, normal, source quench packets) should not trigger an ICMPSourceQuenchDenial alert.
ICMPSourceQuenchDenial alerts are generally provided by network-based intrusion detection
systems and network infrastructure devices such as firewalls or routers.
AttackBehavior > ResourceAttack > NetworkAttack > Denial > CoreDenial > IPFloodDenial
IPFloodDenial alerts reflect a specific type of CoreDenial alert where the intent, or the result, of this
activity is inappropriate or abusive access to network resources through a denial of service by an IPbased 'flood' attack (which uses many very large IP packets). The network infrastructure devices
handling the traffic may pass on the traffic correctly, however, any vulnerable client or device on the
network may not be able to process the incoming traffic (it may use up system resources to the point
where the device is rendered useless and cannot accept network connections). Normal IP Traffic
should not trigger an IPFloodDenial alert.
IPFloodDenial alerts are generally provided by network-based intrusion detection systems and
network infrastructure devices such as firewalls or routers.
AttackBehavior > ResourceAttack > NetworkAttack > Denial > CoreDenial > IPFragmentationDenial
IPFragmentationDenial alerts reflect a specific type of CoreDenial alert where the intent, or the result,
of this activity is inappropriate or abusive access to network resources through a denial of service
attack by using many IP fragments (usually either much larger or smaller than normal fragments). The
network infrastructure devices handling the traffic will reassemble and pass on the traffic correctly,
however, any vulnerable client on the network may not be able to reassemble the fragmented traffic (it
may overflow the stack, triggering a host or service crash). Normal IP fragmentation (data that has
been taken apart because it is too large based on network parameters) should not trigger an
IPFragmentationDenial alert.
Fragmentation alerts themselves are generally provided by network-based intrusion detection
systems and network infrastructure devices such as firewalls or routers.
AttackBehavior > ResourceAttack > NetworkAttack > Denial > CoreDenial > IPFragmentationDenial
> PingOfDeathDenial
PingOfDeathDenial alerts reflect a specific type of CoreDenial alert where the intent, or the result, of
this activity is inappropriate or abusive access to network resources through a denial of service by a
'ping of death' attack (which uses many large ICMP Echo Request packets). The network
420
Appendix B: Events
infrastructure devices handling the traffic will pass on the traffic correctly, however, any vulnerable
client on the network may not be able to process the incoming traffic (it may be processed in such a
way that triggers a host or service crash). Unpatched Windows NT and 95/98 clients are especially
vulnerable to this type of attack. Normal ICMP Echo Traffic should not trigger a PingOfDeathDenial
alert.
PingOfDeathDenial alerts are generally provided by network-based intrusion detection systems and
network infrastructure devices such as firewalls or routers.
AttackBehavior > ResourceAttack > NetworkAttack > Denial > CoreDenial > LandAttackDenial
LandAttackDenial alerts reflect a specific type of CoreDenial alert where the intent, or the result, of
this activity is inappropriate or abusive access to network resources through a denial of service by a
'land' attack (which uses TCP traffic with the SYN bit set and the same source IP and port as the
destination). The network infrastructure devices handling the traffic will pass on the traffic correctly,
however, any vulnerable client on the network may not be able to process the incoming traffic (it may
be processed in such a way that triggers a host or service crash). Unpatched Windows 3.11, NT, and
95 clients are especially vulnerable to this type of attack. Normal TCP traffic (with or without the SYN
bit) should not trigger a LandAttackDenial alert.
LandAttackDenial alerts are generally provided by network-based intrusion detection systems and
network infrastructure devices such as firewalls or routers.
AttackBehavior > ResourceAttack > NetworkAttack > Denial > CoreDenial > SmurfDenial
SmurfDenial alerts reflect a specific type of CoreDenial alert where the intent, or the result, of this
activity is inappropriate or abusive access to network resources through a denial of service by a
'Smurf' attack. A Smurf attack attempts to exploit a vulnerability in some network infrastructure
devices by sending ICMP Echo Requests to devices that will re-broadcast the traffic to internal
devices. In response to the broadcast Echo Request, all of the devices will send an ICMP Echo
Reply, which will effectively overflow the device. The destination of the ICMP Echo Reply is a
spoofed 'victim' IP address which will also be overflowed by the actual replies sent to their host. This
will render both devices useless either temporarily or for a significant amount of time.
SmurfDenial alerts are generally provided by network-based intrusion detection systems and network
infrastructure devices such as firewalls or routers.
AttackBehavior > ResourceAttack > NetworkAttack > Denial > CoreDenial > SnorkDenial
421
Security Events
SnorkDenial alerts reflect a specific type of CoreDenial alert where the intent, or the result, of this
activity is inappropriate or abusive access to network resources through a denial of service by a
'Snork' attack. A Snork attack attempts to exploit a vulnerability in Windows NT devices by using the
Windows RPC service and sending packets to devices that will broadcast the traffic to other internal
Windows NT devices using RPC. In response to the broadcast, all of the Windows NT devices will
send another packet, and this process will continue until it effectively overflows the device and
possibly the network. The destination or source of the initial packet is a spoofed 'victim' IP address
which will create the illusion of internal activity. This will render both devices useless either
temporarily or for a significant amount of time.
SnorkDenial alerts are generally provided by network-based intrusion detection systems and network
infrastructure devices such as firewalls or routers.
AttackBehavior > ResourceAttack > NetworkAttack > Denial > CoreDenial > SynFloodDenial
SYNFloodDenial alerts reflect a specific type of CoreDenial alert where the intent, or the result, of
this activity is inappropriate or abusive access to network resources through a denial of service by a
TCP-based 'flood' attack (which uses many very large TCP packets with the SYN bit set). The
network infrastructure devices handling the traffic may pass on the traffic correctly, however, any
vulnerable client or device on the network may not be able to process the incoming traffic (it may use
up system resources to the point where the device is rendered useless and cannot accept network
connections). Normal TCP Traffic (with or without the SYN flag) should not trigger a SYNFloodDenial
alert.
SYNFloodDenial alerts are generally provided by network-based intrusion detection systems and
network infrastructure devices such as firewalls or routers.
AttackBehavior > ResourceAttack > NetworkAttack > Denial > CoreDenial > TeardropDenial
TeardropDenial alerts reflect a specific type of CoreDenial alert where the intent, or the result, of this
activity is inappropriate or abusive access to network resources through a denial of service by a
teardrop attack (which uses many overlapping IP fragments, usually either much larger or smaller
than normal fragments). The network infrastructure devices handling the traffic will reassemble and
pass on the traffic correctly, however, any vulnerable client on the network may not be able to
reassemble the fragmented traffic (it may be reassembled in such a way that triggers a host or
service crash). Unpatched Windows NT and 95/98 clients are especially vulnerable to this type of
attack. Normal IP fragmentation (data that has been taken apart because it is too large based on
network parameters) should not trigger a TeardropDenial alert.
422
Appendix B: Events
TeardropDenial alerts are generally provided by network-based intrusion detection systems and
network infrastructure devices such as firewalls or routers.
AttackBehavior > ResourceAttack > NetworkAttack > Denial > CoreDenial > UDPBombDenial
UDPBombDenial alerts reflect a specific type of CoreDenial alert where the intent, or the result, of
this activity is inappropriate or abusive access to network resources through a denial of service by a
UDP-based 'bomb' attack (which uses many large UDP packets). The network infrastructure devices
handling the traffic may pass on the traffic correctly, however, any vulnerable client or device on the
network may not be able to process the incoming traffic (it may be processed in such a way that
triggers a host or service crash). Normal UDP Traffic should not trigger a UDPBombDenial alert.
UDPBombDenial alerts are generally provided by network-based intrusion detection systems and
network infrastructure devices such as firewalls or routers.
AttackBehavior > ResourceAttack > NetworkAttack > Denial > ConfigurationDenial
ConfigurationDenial events are a specific type of Denial event where the transport of the malicious or
abusive usage is protocols related to configuration of resources (DHCP, BootP, SNMP, etc.). The
intent, or the result, of this activity is inappropriate or abusive access to network resources through a
denial of service attack. ConfigurationDenial events may be attempts to exploit weaknesses in
configuration-related software to gain access to a host system, attempts to exploit weaknesses in
network infrastructure equipment to enumerate or reconfigure devices, or other denial of service
activities.
These alerts are generally provided by network-based intrusion detection systems, but may also be
provided by firewalls or other network infrastructure devices.
AttackBehavior > ResourceAttack > NetworkAttack > Denial > FileSystemDenial
FileSystemDenial events are a specific type of Denial event where the transport of the malicious or
abusive usage is remote filesystem-related protocols (NFS, SMB, etc.). The intent, or the result, of
this activity is inappropriate or abusive access to network resources through a denial of service
attack. FileSystemDenial events may be attempts to exploit weaknesses in remote filesystem
services or software to gain access to a host system, attempts to exploit weaknesses in network
infrastructure equipment to enumerate or reconfigure devices, or other denial of service activities.
These alerts are generally provided by network-based intrusion detection systems, but may also be
provided by firewalls or other network infrastructure devices.
423
Security Events
AttackBehavior > ResourceAttack > NetworkAttack > Denial > LinkControlDenial
LinkControlDenial events are a specific type of Denial event where the transport of the malicious or
abusive usage is link level protocols (such as ARP). The intent, or the result, of this activity is
inappropriate or abusive access to network resources through a denial of service attack.
LinkControlDenial events may be attempts to exploit weaknesses in link-level control software to
gain access to a host system, attempts to exploit weaknesses in network infrastructure equipment to
enumerate or reconfigure devices, or other denial of service activities.
These alerts are generally provided by network-based intrusion detection systems, but may also be
provided by firewalls or other network infrastructure devices.
AttackBehavior > ResourceAttack > NetworkAttack > Denial > RemoteProcedureDenial
RemoteProcedureDenial events are a specific type of Denial event where the transport of the
malicious or abusive usage is remote procedure-related protocols (traditional RPC, RMI, CORBA,
etc.) or service (portmapper, etc.). The intent, or the result, of this activity is inappropriate or abusive
access to network resources through a denial of service attack. RemoteProcedureDenial events may
be attempts to exploit weaknesses in remote procedure services or software to gain access to a host
system, attempts to exploit weaknesses in the software to enumerate or reconfigure, or other denial
of service activities.
These alerts are generally provided by network-based intrusion detection systems, but may also be
provided by firewalls or other network infrastructure devices.
AttackBehavior > ResourceAttack > NetworkAttack > Denial > RemoteProcedureDenial >
RPCPortmapperDenial
RPCPortmapperDenial events are a specific type of Denial event where the transport of the
malicious or abusive usage is remote procedure-related protocols, specifically related to the RPC
portmapper service. The intent, or the result, of this activity is inappropriate or abusive access to
network resources through a denial of service attack. RPCPortmapperDenial events may be
attempts to exploit weaknesses the remote procedure service or software to gain access to a host
system, attempts to exploit weaknesses in the software to enumerate or reconfigure, or other denial
of service activities.
These alerts are generally provided by network-based intrusion detection systems, but may also be
provided by firewalls or other network infrastructure devices.
424
Appendix B: Events
AttackBehavior > ResourceAttack > NetworkAttack > Denial > RoutingDenial
RoutingDenial events are a specific type of Denial event where the transport of the malicious or
abusive usage is routing-related protocols (RIP, IGMP, etc.). The intent, or the result, of this activity
is inappropriate or abusive access to network resources through a denial of service attack.
RoutingDenial events may be attempts to exploit weaknesses in routers or routing software to gain
access to a host system, attempts to exploit weaknesses in the routing software or service to
enumerate or reconfigure, or other denial of service activities.
These alerts are generally provided by network-based intrusion detection systems, but may also be
provided by firewalls or other network infrastructure devices.
AttackBehavior > ResourceAttack > NetworkAttack > Denial > TrojanTrafficDenial
TrojanTrafficDenial events are a specific type of Denial event where the transport of the malicious or
abusive usage originates with malicious code on a client system known as a Trojan. The intent, or the
result, of this activity is inappropriate or abusive access to network resources through a denial of
service attack. TrojanTrafficDenial events may be attempts to exploit weaknesses in software to
gain access to a host system, attempts to exploit weaknesses in network infrastructure equipment to
enumerate or reconfigure devices, attempts to spread the Trojan to other hosts, or other denial of
service activities.
These alerts are generally provided by network-based intrusion detection systems, but may also be
provided by firewalls or other network infrastructure devices.
AttackBehavior > ResourceAttack > NetworkAttack > Relay
Children of the Relay tree define events centered on malicious or abusive usage of network
bandwidth/traffic where the intention, or the result, is relaying inappropriate or abusive access to other
network resources (either internal or external). Generally, these attacks will have the perimeter or an
internal host as their point of origin. When sourced from remote hosts, they may indicate a successful
exploit of an internal or perimeter host.
These alerts are generally provided by network-based intrusion detection systems, but may also be
provided by firewalls or other network infrastructure devices.
AttackBehavior > ResourceAttack > NetworkAttack > Relay > DDOSToolRelay
DDOSToolRelay events reflect potential network traffic related to known Distributed Denial of
425
Security Events
Service connectors. These connectors are used to relay attacks to new remote (and possibly local)
hosts to exploit or inundate the remote host with data in an attempt to cripple it. Generally, these
attacks will have a perimeter or an internal host as their point of origin. When sourced from remote
hosts, they may indicate a successful exploit of an internal or perimeter host.
These alerts are generally provided by network-based intrusion detection systems, but may also be
provided by firewalls or other network infrastructure devices.
Appropriate response to these events may be to restrict the source from accessing any external
network, running a virus scanner or other detection utility to detect and remove the presence of any
relay connector (in some cases known as a 'zombie'), and if necessary, to quarantine the source
node from the network to further isolate the issue. If these events are sourced from a completely
external network, blocking the remote host, better access control of clients, servers, and services
(e.g. restriction by IP address and/or user name to ensure only trusted clients are connecting),
application of updates or patches to servers and/or clients, or the possible removal of the service
related to this event may also be appropriate actions.
AttackBehavior > ResourceAttack > NetworkAttack > Relay > FileTransferRelay
FileTransferRelay events reflect potential network traffic related to known attack connectors that
operate over file transfer protocols. These connectors are used to relay attacks to new remote (and
possibly local) hosts to exploit or abuse services. Generally, these attacks will have a perimeter or an
internal host as their point of origin. When sourced from remote hosts, they may indicate a successful
exploit of an internal or perimeter host.
These alerts are generally provided by network-based intrusion detection systems, but may also be
provided by the file transfer software itself, and firewalls or other network infrastructure devices.
Appropriate response to these events may be to restrict the source from accessing any external
network, running a virus scanner or other detection utility to detect and remove the presence of any
relay connector, and if necessary, to quarantine the source node from the network to further isolate
the issue. If these events are sourced from a completely external network, blocking the remote host,
better access control of file transfer servers (e.g. restriction by IP address and/or user name to ensure
only trusted clients are connecting), application of updates or patches to file transfer servers and/or
clients, or the possible removal of the file transfer service or client application related to this event
may also be appropriate actions.
AttackBehavior > ResourceAttack > NetworkAttack > Relay > FileTransferRelay > FTPBounce
426
Appendix B: Events
FTPBounce events are a specific type of FileTransferRelay related to known attack connectors using
file transfer protocols that are used to launder connections to other services, redirect attacks to other
hosts or services, or to redirect connections to other hosts or services. Generally, these attacks will
have a perimeter or an internal host as their point of origin. When sourced from remote hosts, they
may indicate a successful exploit of an internal or perimeter host.
These alerts are generally provided by network-based intrusion detection systems, but may also be
provided by the file transfer software or service itself, and firewalls or other network infrastructure
devices.
Appropriate response to these events may be to restrict the source from accessing any external
network, running a virus scanner or other detection utility to detect and remove the presence of any
relay connector, and if necessary, to quarantine the source node from the network to further isolate
the issue. If these events are sourced from a completely external network, blocking the remote host,
better access control of file transfer servers (e.g. restriction by IP address and/or user name to ensure
only trusted clients are connecting), application of updates or patches to file transfer servers and/or
clients, or the possible removal of the file transfer service or client application related to this event
may also be appropriate actions.
AttackBehavior > ResourceAttack > ServiceProcessAttack
Members of the ServiceProcessAttack tree are used to define events centered on malicious or
abusive usage of services or user processes. These events include abuse or misuse of resources
from malicious code placed on the client system.
AttackBehavior > ResourceAttack > ServiceProcessAttack > VirusAttack
VirusAttack alerts reflect malicious code placed on a client or server system, which may lead to
system or other resource compromise and may lead to further attack. The severity of this alert will
depend on the ActionTaken field, which reflects whether the virus or other malicious code was
successfully removed.
These alerts are usually provided by a virus scanner running on the client system. Appropriate
response to these alerts may entail a quarantine of the node from the network to prevent further
outbreak, updates of virus scanner pattern files on other network nodes to prevent further outbreak,
virus scans on other network nodes to detect further outbreak if any has taken place, and research
into the offending virus to find out methods of removal.
AttackBehavior > ResourceAttack > ServiceProcessAttack > VirusSummaryAttack
427
Security Events
VirusSummaryAttack alerts reflect malicious code placed on a client or server system, which may
lead to system or other resource compromise and may lead to further attack. The severity of this alert
will depend on the ActionTaken field which reflects whether the virus or other malicious code was
successfully removed. These alerts differ from VirusAttack in that they may be a composite of virus
events normally due to a scheduled scan on the client system as opposed to a real-time scan.
These alerts are usually provided by a virus scanner running on the client system. Appropriate
response to these alerts may entail a quarantine of the node from the network to prevent further
outbreak, updates of virus scanner pattern files on other network nodes to prevent further outbreak,
virus scans on other network nodes to detect further outbreak if any has taken place, and research
into the offending virus to find out methods of removal.
GeneralSecurity
GeneralSecurity alerts are generated when a supported product outputs data that has not yet been
normalized into a specific alert, but is known to be security issue-related.
SuspiciousBehavior
Events that are children of SuspiciousBehavior are generally related to network activity that may be
consistent of enumeration of resources, unexpected traffic, abnormal authentication events, or other
abnormal behavior that should be considered indicative of a serious security event.
SuspiciousBehavior > AuthSuspicious
Members of the AuthSuspicious tree are used to define events regarding suspicious authentication
and authorization events. These events include excessive failed authentication or authorization
attempts, suspicious access to unauthenticated users, and suspicious access to unauthorized
services or information.
SuspiciousBehavior > AuthSuspicious > FailedAuthentication
FailedAuthentication events occur when a user has made several attempts to authenticate
themselves which has continuously failed, or when a logon failure is serious enough to merit a
security event on a single failure.
SuspiciousBehavior > AuthSuspicious > GuestLogin
GuestLogin events describe user authentication events where an attempt was made successfully or
unsuccessfully granting access to a user that generally has no password assigned (such as
428
Appendix B: Events
anonymous, guest, or default) and no special privileges. Access of a user with this level of privileges
may be granted access to enough of the client system to begin exploitation.
These events are usually produced by a client or server operating system, however may also be
produced by a network-based IDS or network infrastructure device when it is possible or appropriate.
SuspiciousBehavior > AuthSuspicious > RestrictedInformationAttempt
RestrictedInformationAttempt events describe a user attempt to access local or remote information
that their level of authorization does not allow. These events may indicate user attempts to exploit
services which they are denied access to or inappropriate access attempts to information.
SuspiciousBehavior > AuthSuspicious > RestrictedServiceAttempt
RestrictedServiceAttempt events describe a user attempt to access a local or remote service that
their level of authorization does not allow. These events may indicate user attempts to exploit
services which they are denied access to or inappropriate access attempts to services.
SuspiciousBehavior > InferredSuspicious
InferredSuspicious alerts are reserved SuspiciousBehavior alerts used for describing suspicious
behavior that is a composite of different types of alerts. These events will be defined and inferred by
Contego Policy.
SuspiciousBehavior > ResourceSuspicious
Members of the ResourceSuspicious tree are used to define different types of suspicious access to
network resources, where these resources may be network bandwidth/traffic, files, client processes
or services, or other types of shared security-related 'commodities'.
SuspiciousBehavior > ResourceSuspicious > NetworkSuspicious
Members of the NetworkSuspicious tree are used to define events regarding suspicious usage of
network bandwidth/traffic. These events include unusual traffic and reconnaissance behavior
detected on network resources.
SuspiciousBehavior > ResourceSuspicious > NetworkSuspicious > Recon
Children of the Recon tree reflect suspicious network behavior with intent of gathering information
about target clients, networks, or hosts. Reconnaissance behavior may be valid behavior on a
429
Security Events
network, however, only as a controlled behavior in small quantities. Invalid reconnaissance behavior
may reflect attempts to determine security flaws on remote hosts, missing access control policies
that allow external hosts to penetrate networks, or other suspicious behavior that results in general
information gathering without actively attacking.
SuspiciousBehavior > ResourceSuspicious > NetworkSuspicious > Recon > Enumerate
Enumerate alerts reflect attempts to gather information about target networks, or specific target
hosts, by sending active data which will elicit responses that reveal information about clients,
servers, or other network infrastructure devices. The originating source of the enumeration is
generally attempting to acquire information that may reveal more than normal traffic to the target
would.
SuspiciousBehavior > ResourceSuspicious > NetworkSuspicious > Recon > Enumerate >
ApplicationEnumerate
ApplicationEnumerate alerts reflect attempts to gather information about target hosts, or services on
target hosts, by sending active application-layer data which will elicit responses that reveal
information about the application or host. This enumeration may be a LEMple command sent to the
application to attempt to fingerprint what is allowed or denied by the service, requests to the
application which may enable an attacker to surmise the version and specific application running, and
other information gathering tactics. These enumerations may result in information being provided that
can allow an attacker to craft a specific attack against the host or application that may work correctly
the first time - enabling them to modify their methodology to go on relatively undetected.
SuspiciousBehavior > ResourceSuspicious > NetworkSuspicious > Recon > Enumerate >
ApplicationEnumerate > FileTransferEnumerate
FileTransferEnumerate alerts reflect attempts to gather information about target hosts, or services on
target hosts, by sending active application-layer data to file transfer services which will elicit
responses that reveal information about the application or host. This enumeration may be a LEMple
command sent to the file transfer service to attempt to fingerprint what is allowed or denied by the
service, requests to the file transfer service that may enable an attacker to surmise the version and
specific service running, and other information gathering tactics. These enumerations may result in
information being provided that can allow an attacker to craft a specific attack against the file transfer
service or application that may work correctly the first time - enabling them to modify their
methodology to go on relatively undetected.
430
Appendix B: Events
SuspiciousBehavior > ResourceSuspicious > NetworkSuspicious > Recon > Enumerate >
ApplicationEnumerate > FileTransferEnumerate > FTPCommandEnumerate
FTPCommandEnumerate alerts reflect attempts to gather information about target hosts, or services
on target hosts, by sending active application-layer data to file transfer services which will elicit
responses that reveal information about the application. This enumeration specifically entails
commands sent to the FTP service to attempt to fingerprint what is allowed or denied by the service,
requests to the FTP service that may enable an attacker to surmise the version and specific service
running, and other information gathering tactics that use FTP commands to query. These
enumerations may result in information being provided that can allow an attacker to craft a specific
attack against the FTP service that may work correctly the first time - enabling them to modify their
methodology to go on relatively undetected.
SuspiciousBehavior > ResourceSuspicious > NetworkSuspicious > Recon > Enumerate >
ApplicationEnumerate > MailEnumerate
MailEnumerate alerts reflect attempts to gather information about target hosts, or services on target
hosts, by sending active application-layer data to mail-related services which will elicit responses
that reveal information about the application or host. This enumeration may be a LEMple command
sent to the mail service to attempt to fingerprint what is allowed or denied by the service, requests to
the mail service that may enable an attacker to surmise the version and specific service running, and
other information gathering tactics. These enumerations may result in information being provided that
can allow an attacker to craft a specific attack against the mail service or application that may work
correctly the first time - enabling them to modify their methodology to go on relatively undetected.
SuspiciousBehavior > ResourceSuspicious > NetworkSuspicious > Recon > Enumerate >
ApplicationEnumerate > MailEnumerate > SMTPCommandEnumerate
SMTPCommandEnumerate alerts reflect attempts to gather information about target hosts, or
services on target hosts, by sending active application-layer data to mail-related services which will
elicit responses that reveal information about the application. This enumeration specifically entails
commands sent to the SMTP service to attempt to fingerprint what is allowed or denied by the
service, requests to the mail service that may enable an attacker to surmise the version and specific
service running, and other information gathering tactics that use SMTP commands to query. These
enumerations may result in information being provided that can allow an attacker to craft a specific
attack against the mail service that may work correctly the first time - enabling them to modify their
methodology to go on relatively undetected.
431
Security Events
SuspiciousBehavior > ResourceSuspicious > NetworkSuspicious > Recon > Enumerate >
ApplicationEnumerate > WebEnumerate
WebEnumerate alerts reflect attempts to gather information about target hosts, or services on target
hosts, by sending active application-layer data to web-related services which will elicit responses
that reveal information about the application or host. This enumeration may be a LEMple command
sent to the web service to attempt to fingerprint what is allowed or denied by the service, requests to
the web service that may enable an attacker to surmise the version and specific service running, and
other information gathering tactics. These enumerations may result in information being provided that
can allow an attacker to craft a specific attack against the web service or application that may work
correctly the first time - enabling them to modify their methodology to go on relatively undetected.
SuspiciousBehavior > ResourceSuspicious > NetworkSuspicious > Recon > Enumerate >
BannerGrabbingEnumerate
BannerGrabbingEnumerate alerts reflect attempts to gather information about target hosts, or
services on target hosts, by sending a request which will elicit a response containing the host or
service's 'banner'. This 'banner' contains information that may provide a potential attacker with such
details as the exact application and version running behind a port. These details could be used to craft
specific attacks against hosts or services that an attacker may know will work correctly the first time
- enabling them to modify their methodology go on relatively undetected.
SuspiciousBehavior > ResourceSuspicious > NetworkSuspicious > Recon > Enumerate >
MSNetworkingEnumerate
MSNetworkingEnumerate alerts reflect attempts to gather information about target hosts, or services
on target hosts, by sending active data to Microsoft networking services (using protocols such as
NetBIOS and SMB/CIFS) that will illicit responses that reveal information about the application, host,
or target network. This enumeration may be a LEMple command sent to the networking service to
attempt to fingerprint what is allowed or denied by a service, requests to a service that may enable an
attacker to surmise the version and specific service running, requests to a service that may enable an
attacker to fingerprint the target network, and other information gathering tactics. These enumerations
may result in information being provided that can allow an attacker to craft a specific attack against
the networking service, host, or application that may work correctly the first time - enabling them to
modify their methodology to go on relatively undetected.
SuspiciousBehavior > ResourceSuspicious > NetworkSuspicious > Recon > Enumerate >
RemoteProcedureEnumerate
432
Appendix B: Events
RemoteProcedureEnumerate alerts reflect attempts to gather information about target hosts, or
services on target hosts, by sending active data to Remote Procedure services (using protocols such
as RMI, CORBA, and traditional RPC) that will elicit responses that reveal information about the
application or host. This enumeration may be a LEMple command sent to the remote procedure
service to attempt to fingerprint what is allowed or denied by the service, requests to the remote
procedure service that may enable an attacker to surmise the version and specific service running,
and other information gathering tactics. These enumerations may result in information being provided
that can allow an attacker to craft a specific attack against the remote procedure service or
application that may work correctly the first time - enabling them to modify their methodology to go on
relatively undetected.
SuspiciousBehavior > ResourceSuspicious > NetworkSuspicious > Recon > Enumerate >
RemoteProcedureEnumerate > RPCPortmapperEnumerate
RPCPortmapperEnumerate alerts reflect attempts to gather information about target hosts, or
services on target hosts, by sending active data to the Portmapper Remote Procedure service that
will illicit responses that reveal information about the application or host. This enumeration may be a
LEMple command sent to the portmapper service to attempt to fingerprint what is allowed or denied
by the service, requests to the portmapper service that may enable an attacker to surmise the version
and specific service running, and other information gathering tactics. These enumerations may result
in information being provided that can allow an attacker to craft a specific attack against the
portmapper service or client application that may work correctly the first time - enabling them to
modify their methodology to go on relatively undetected.
SuspiciousBehavior > ResourceSuspicious > NetworkSuspicious > Recon > Enumerate >
RemoteProcedureEnumerate > RPCPortScanEnumerate
RPCPortScanEnumerate alerts reflect attempts to gather information about target hosts, or services
on target hosts, by sending active data to Remote Procedure services (using protocols such as RMI,
CORBA, and traditional RPC) that will elicit responses that reveal information about the application or
host. This specific type of enumeration is done by sending queries to RPC related ports to attempt to
fingerprint the types and specific services running, and may involve other information gathering
tactics. These enumerations may result in information being provided that can allow an attacker to
craft a specific attack against the remote procedure service or application that may work correctly the
first time - enabling them to modify their methodology to go on relatively undetected.
SuspiciousBehavior > ResourceSuspicious > NetworkSuspicious > Recon > Footprint
433
Security Events
Footprint alerts reflect attempts to gather information about target networks by tracing the network
through routers, clients, servers, or other network infrastructure devices. The originating source of the
footprint is generally attempting to acquire information that may reveal more about network behavior
than normal traffic to the target would.
SuspiciousBehavior > ResourceSuspicious > NetworkSuspicious > Recon > Footprint >
DNSRequestFootprint
DNSRequestFootprint alerts are a specific type of Footprint alert that reflects a DNS record request
that may serve to reveal DNS configuration. Contained within this DNS configuration may be
information that reveals internal networks, protected devices, or IP addresses of potential targets.
SuspiciousBehavior > ResourceSuspicious > NetworkSuspicious > Recon > Footprint >
FirewalkingFootprint
FirewalkingFootprint alerts are a specific type of Footprint alert that reflects the usage of a connector
that attempts to gather information about network infrastructure device access control and filtering
lists. Firewalking works by passing TCP and UDP packets to determine what packets a given device
will forward. This activity may reflect attempts to enumerate devices beyond the perimeter of a
network, gathering information about activity that is allowed or denied past given gateways.
SuspiciousBehavior > ResourceSuspicious > NetworkSuspicious > Recon > Footprint >
TraceRouteFootprint
TraceRouteFootprint alerts are a specific type of Footprint alert that reflects an IP packet route trace
from source to destination. Generally, this route will not reveal specific information about device
types or hosts on a network, but will trace the path of IP traffic across routing devices. This traffic
may be an attempt to discover routing devices that are misconfigured (which may be vulnerable to
attacks such as IP spoofing or IP fragmentation).
SuspiciousBehavior > ResourceSuspicious > NetworkSuspicious > Recon > Scan
Scan alerts reflect attempts to gather information about target networks, or specific target hosts, by
sending scans which will elicit responses that reveal information about clients, servers, or other
network infrastructure devices. The originating source of the scan is generally attempting to acquire
information that may reveal more than normal traffic to the target would, information such as a list of
applications listening on ports, operating system information, and other information that a probe may
discover without enumeration of the specific services or performing attack attempts.
434
Appendix B: Events
SuspiciousBehavior > ResourceSuspicious > NetworkSuspicious > Recon > Scan > CoreScan
CoreScan alerts reflect attempts to gather information about target networks, or specific target hosts,
by sending scans over core network protocols (TCP, IP, ICMP, UDP) which will elicit responses that
reveal information about clients, servers, or other network infrastructure devices. The originating
source of the scan is generally attempting to acquire information that may reveal more than normal
traffic to the target would, information such as a list of applications listening on ports, operating
system information, and other information that a probe may discover without enumeration of the
specific services or performing attack attempts.
SuspiciousBehavior > ResourceSuspicious > NetworkSuspicious > Recon > Scan > CoreScan >
HostScan
HostScan alerts reflect attempts to gather information about specific target hosts by sending scans
which will elicit responses that reveal information about clients, servers, or other network
infrastructure devices. The originating source of the scan is generally attempting to acquire
information that may reveal more than normal traffic to the target would, such as a list of applications
on the host, operating system information, and other information that a probe may discover without
enumeration of the specific services or performing attack attempts. These scans generally do not
occur across entire networks and generally have the intent of discovering operating system and
application information which may be used for further attack preparation.
SuspiciousBehavior > ResourceSuspicious > NetworkSuspicious > Recon > Scan > CoreScan >
ICMPQuery
ICMPQuery alerts reflect attempts to gather information about specific target hosts, or networks, by
sending ICMP-based queries that will elicit responses that reveal information about clients, servers,
or other network infrastructure devices. The originating source of the scan is generally attempting to
acquire information that may reveal more than normal traffic to the target would, such as operating
system information and other information that a probe may discover without enumeration of the
specific services or performing attack attempts. These scans generally do not occur across entire
networks, contain many sequential ICMP packets, and generally have the intent of discovering
operating system and application information which may be used for further attack preparation.
SuspiciousBehavior > ResourceSuspicious > NetworkSuspicious > Recon > Scan > CoreScan >
PingSweep
PingSweep alerts reflect a specific type of CoreScan alert that describe an attempt to gather
information about target networks, and hosts on those networks, by sending ICMP or TCP ping
435
Security Events
packets to test whether hosts are alive. The originating source of the scan is generally attempting to
acquire information about network topology or groups of specific hosts on the network and may have
the intent of gathering information for future attack attempts.
SuspiciousBehavior > ResourceSuspicious > NetworkSuspicious > Recon > Scan > CoreScan >
PingSweep > ICMPPingSweep
ICMPPingSweep alerts reflect a specific type of CoreScan alert that describe an attempt to gather
information about target networks, and hosts on those networks, by sending ICMP ping packets to
test whether hosts are alive. The originating source of the scan is generally attempting to acquire
information about network topology or groups of specific hosts on the network and may have the
intent of gathering information for future attack attempts.
SuspiciousBehavior > ResourceSuspicious > NetworkSuspicious > Recon > Scan > CoreScan >
PingSweep > TCPPingSweep
TCPPingSweep alerts reflect a specific type of CoreScan alert that describe an attempt to gather
information about target networks, and hosts on those networks, by sending TCP ping packets to test
whether hosts are alive. The originating source of the scan is generally attempting to acquire
information about network topology or groups of specific hosts on the network and may have the
intent of gathering information for future attack attempts.
SuspiciousBehavior > ResourceSuspicious > NetworkSuspicious > Recon > Scan > CoreScan >
PortScan
PortScan alerts reflect attempts to gather information about target networks, or specific target hosts,
by sending scans over core network protocols (TCP, IP, ICMP, UDP) that will elicit responses that
reveal information about clients, servers, or other network infrastructure devices. The originating
source of the scan is generally attempting to acquire information that may reveal more than normal
traffic to the target would, such as a list of applications listening on ports, operating system
information, and other information that a probe may discover without enumeration of the specific
services or performing attack attempts. Portscans specifically operate by sending probes to every
port within a range, attempting to identify open ports that may use applications or services that are
easy to enumerate and attack.
SuspiciousBehavior > ResourceSuspicious > NetworkSuspicious > Recon > Scan > CoreScan >
PortScan > TCPPortScan
TCPPortScan alerts reflect attempts to gather information about target networks, or specific target
436
Appendix B: Events
hosts, by sending scans over TCP that will elicit responses that reveal information about clients,
servers, or other network infrastructure devices. The originating source of the scan is generally
attempting to acquire information that may reveal more than normal traffic to the target would, such as
a list of applications listening on ports, operating system information, and other information that a
probe may discover without enumeration of the specific services or performing attack attempts. TCP
portscans specifically operate by sending TCP probes to every port within a range, attempting to
identify open ports that may use applications or services that are easy to enumerate and attack.
SuspiciousBehavior > ResourceSuspicious > NetworkSuspicious > Recon > Scan > CoreScan >
PortScan > UDPPortScan
UDPPortScan alerts reflect attempts to gather information about target networks, or specific target
hosts, by sending scans over UDP that will elicit responses that reveal information about clients,
servers, or other network infrastructure devices. The originating source of the scan is generally
attempting to acquire information that may reveal more than normal traffic to the target would, such as
a list of applications listening on ports, operating system information, and other information that a
probe may discover without enumeration of the specific services or performing attack attempts. UDP
portscans specifically operate by sending UDP probes to every port within a range, attempting to
identify open ports that may use applications or services that are easy to enumerate and attack.
SuspiciousBehavior > ResourceSuspicious > NetworkSuspicious > Recon > Scan > CoreScan >
StackFingerprint
StackFingerprint alerts reflect attempts to gather information about specific target hosts by sending a
certain set of packets to probe a device's network stack, which will elicit responses that reveal
information about clients, servers, or other network infrastructure devices. The originating source of
the scan is generally attempting to acquire information that may reveal more than normal traffic to the
target would, such as operating system information (including type and version) and other information
that a probe may discover without enumeration of the specific services or performing attack attempts.
These scans generally do not occur across entire networks and generally have the intent of
discovering operating system information which may be used for further attack preparation.
SuspiciousBehavior > ResourceSuspicious > NetworkSuspicious > Recon > Scan > CoreScan >
StackFingerprint > ICMPStackFingerprint
ICMPStackFingerprint alerts reflect attempts to gather information about specific target hosts by
sending a certain set of ICMP packets to probe a device's ICMP stack, which will elicit responses
that reveal information about clients, servers, or other network infrastructure devices. The originating
437
Security Events
source of the scan is generally attempting to acquire information that may reveal more than normal
traffic to the target would, such as operating system information (including type and version) and
other information that a probe may discover without enumeration of the specific services or
performing attack attempts. These scans generally do not occur across entire networks and generally
have the intent of discovering operating system information which may be used for further attack
preparation.
SuspiciousBehavior > ResourceSuspicious > NetworkSuspicious > Recon > Scan > CoreScan >
StackFingerprint > TCPStackFingerprint
TCPStackFingerprint alerts reflect attempts to gather information about specific target hosts by
sending a certain set of TCP packets to probe a device's TCP/IP stack, which will elicit responses
that reveal information about clients, servers, or other network infrastructure devices. The originating
source of the scan is generally attempting to acquire information that may reveal more than normal
traffic to the target would, such as operating system information (including type and version) and
other information that a probe may discover without enumeration of the specific services or
performing attack attempts. These scans generally do not occur across entire networks and generally
have the intent of discovering operating system information which may be used for further attack
preparation.
SuspiciousBehavior > ResourceSuspicious > NetworkSuspicious > Recon > Scan > TrojanScanner
TrojanScanner alerts reflect attempts of Trojans on the network to gather information about target
networks, or specific target hosts, by sending scans which will elicit responses that reveal
information about the host. The originating Trojan source of the scan is generally attempting to
acquire information that will reveal whether a target host or network has open and available services
for further exploitation, whether the target host or network is alive, and how much of the target
network is visible. A Trojan may run a scan before attempting an attack operation to test potential
effectiveness or targeting information.
SuspiciousBehavior > ResourceSuspicious > NetworkSuspicious > UnusualTraffic
UnusualTraffic alerts reflect suspicious behavior on network devices where the traffic may have no
known exploit, but is unusual and could be potential enumerations, probes, fingerprints, attempts to
confuse devices, or other abnormal traffic. UnusualTraffic may have no impending response,
however, it could reflect a suspicious host that should be monitored closely.
SuspiciousBehavior > ResourceSuspicious > NetworkSuspicious > UnusualTraffic >
UnusualICMPTraffic
438
Appendix B: Events
UnusualICMPTraffic alerts reflect ICMP-based suspicious behavior on network devices where the
traffic may have no known exploit, but is unusual and could be potential enumerations, probes,
fingerprints, attempts to confuse devices, or other abnormal traffic. UnusualICMPTraffic may have
no impending response, however, it could reflect a suspicious host that should be monitored closely.
SuspiciousBehavior > ResourceSuspicious > NetworkSuspicious > UnusualTraffic >
UnusualIPTraffic
UnusualIPTraffic alerts reflect IP-based suspicious behavior on network devices where the traffic
may have no known exploit, but is unusual and could be potential enumerations, probes, fingerprints,
attempts to confuse devices, or other abnormal traffic. UnusualIPTraffic may have no impending
response, however, it could reflect a suspicious host that should be monitored closely.
SuspiciousBehavior > ResourceSuspicious > NetworkSuspicious > UnusualTraffic >
UnusualProtocol
UnusualProtocol alerts reflect suspicious behavior on network devices where the traffic is targeted at
unknown, unassigned, or uncommonly used protocols. This traffic may have no known exploit, but is
unusual and should be considered potential enumerations, probes, fingerprints, attempts to confuse
devices, or other abnormal traffic. UnusualProtocol may have no impending response, however, it
could reflect a suspicious host that should be monitored closely.
SuspiciousBehavior > ResourceSuspicious > NetworkSuspicious > UnusualTraffic >
UnusualTCPTraffic
UnusualTCPTraffic alerts reflect TCP-based suspicious behavior on network devices where the
traffic may have no known exploit, but is unusual and could be potential enumerations, probes,
fingerprints, attempts to confuse devices, or other abnormal traffic. UnusualTCPTraffic may have no
impending response, however, it could reflect a suspicious host that should be monitored closely.
SuspiciousBehavior > ResourceSuspicious > NetworkSuspicious > UnusualTraffic >
UnusualUDPTraffic
UnusualUDPTraffic alerts reflect UDP-based suspicious behavior on network devices where the
traffic may have no known exploit, but is unusual and could be potential enumerations, probes,
fingerprints, attempts to confuse devices, or other abnormal traffic. UnusualUDPTraffic may have no
impending response, however, it could reflect a suspicious host that should be monitored closely.
439
Security Events
440
Appendix C: Appendix Event Data Fields
The following table explains the meaning of each grid column or data field that can appear in various
alert grids, event grids, and information panes throughout the Console. The actual columns and fields
that are shown vary according to the alert, view, or grid you are working with. But the meaning of
these fields remains the same, regardless of where you see them.
For convenience, the fields are listed in alphabetical order.
Grid column or
field
EventName
Description
The name of the alert. For information on a particular alert, see "Event
Types" on page 1.
ConnectionName
The name of the dial-up or VPN connection.
ConnectionStatus
The current status of the dial-up or VPN connection.
DestinationMachine The IP address the network traffic is going to.
DestinationPort
The port number the network traffic is going to.
DetectionIP
The network node that is the originating source of the alert data. This is
usually a Manager or an Agent and is the same as the InsertionIP field, but
can also be a network device such as firewall or an intrusion detection
system that may be sending log files over a remote logging protocol.
DetectionTime
The time the network node generated the data. This is usually the same as
the InsertionTime field, but they can differ when the Agent or Manager is
reading historical data, or if a network device has an incorrect time setting.
EventInfo
A short summary of the alert details. Additional details appear in the
following fields, but EventInfo provides enough information to view a
“snapshot” of the alert information.
ExtraneousInfo
Extra information that is relevant to the alert, but may not be reflected in
other fields. This can include information useful for correlating or
summarizing alert information in addition to the EventInfo field.
441
Appendix C: Appendix Event Data Fields
Grid column or
field
Host
Description
The node the log message came from (that is, the LEM or Agent that collected the message for forwarding to nDepth).
HostFromData
The originating network device (if different than the node) that the message
came from. Normally, Host and HostFromData are the same, but in the
case of a remote logging device (such as a firewall) this field reports the original remote device's address.
InferenceRule
The name of the correlation that caused this alert. The InferenceRule field
will generally be blank, but in cases where the alert was related to a rule, it
displays the rule name.
InsertionIP
The Manager or Agent that first created the alert. This is the source that first
read the log data from a file or other source.
InsertionTime
The time the Manager or Agent first created the alert. This time indicates
when the data was read from a log file or other source.
IPAddress
The IP address associated with the alert. This is a composite field, drawn
from several different alert fields. It shows all the IP addresses that appear
in alert data.
Manager
The name of the Manager that received the alert. For data generated from an
Agent, this is the Manager the Agent is connected to.
Order
In the Event explorer’s event grid, the Order field indicates when each event
occurred:
means the event occurred before the central event shown in the event
map.
means the event occurred during (as part of) the central event shown in
the event map.
means the event occurred after the central event shown in the event
map.
Protocol
Displays the protocol associated with this alert (TCP or UDP).
442
Appendix C: Appendix Event Data Fields
Grid column or
field
ProviderSID
Description
A unique identifier for the original data. Generally, the ProviderSID field
includes information that can be used in researching information on the alert
in the originating network device vendor's documentation.
SourceMachine
The IP address the network traffic is coming from.
SourcePort
The port number the network traffic is coming from.
ConnectorAlias
The Alias Name entered when configuring the connector on the Manager or
Agent. For more information on configuring connectors, see "Connecting
products to the SolarWinds LEM" on page 1.
ConnectorId
The actual connector that generated the log message.
ConnectorType
Connector category for the connector that generated the log message.
Username
The user name associated with the alert. This is a composite field, drawn
from several different alert fields. It shows all the places that user names
appear in alert data.
443
Appendix D: Connector Categories
FileName
Description
Version
3comswitch.xml
3Com Switch
7374
actianceusg.xml
Actiance Unified Security Gate- 7374
way
activescout.xml
ActiveScout
7374
AIXauditlog.xml
AIX Audit
7405
AIXsyslog.xml
AIX Syslog
7426
AlliedTelesis.xml
Allied Telesis Routers and
7374
Switches
amavis.xml
AMaViS
7374
ApacheAccessLog.xml
Apache Access
7374
ApacheErrorLog.xml
Apache Error
7374
apcinfrastruxure.xml
APC InfraStruXure
7374
arraynetworksspx.xml
Array Networks SPX
7374
aruba.xml
Aruba Wireless Access Point
7374
aruba3x.xml
Aruba Wireless Access Point
7374
3x
as400.xml
Legacy TriGeo Agent AS400
Tool
444
7453
Appendix D: Connector Categories
FileName
Description
Version
astarosg.xml
Astaro Security Gateway
7374
atlas.xml
Adtran Atlas Switch
7374
aventail.xml
SonicWALL Aventail SSL VPN
7374
E-Class
avgnetworkserver.xml
AVG DataCenter 7.5
7374
avgnetworkserver.xml
AVG DataCenter 8.0
7374
avgworkstation.xml
AVG 7.5 Network
7374
AxcientUMC.xml
Axcient Unified Management
7380
Console (UMC)
BackupExecSR.xml
Symantec Backup Exec Sys-
7374
tem Recovery
barracudaadmin.xml
Barracuda Admin
7374
barracudaNG.xml
Barracuda NG Firewall (Phion
7374
Netfence)
barracudaweb.xml
Barracuda Web Filter
7374
BarracudaWebAppFW.xml
Barracuda Web Application
7374
Firewall
bind.xml
Bind
7374
biopassword.xml
BioPassword
7374
Bit9Parity.xml
Bit9 Parity v5+ Syslog
7492
bladerackswitch.xml
Blade RackSwitch
7374
bluecoatproxySG.xml
Blue Coat ProxySG
7399
445
Appendix D: Connector Categories
FileName
Description
Version
bluecoatproxysgwa.xml
Blue Coat Proxy SG web
7379
access
bordermanager.xml
Novell BorderManager
7374
bordermanagerwebproxy.xml
Novell BorderManager Web
7374
Proxy
Borderware.xml
Borderware Firewall
7374
brightstor.xml
CA's BrightStor v11.5
7374
checkpointedgex.xml
Checkpoint Edge X Firewall
7374
ciscoacsadminaudit.xml
Cisco ACS Admin Audit 4.1+
7387
ciscoacsadminaudit.xml
Cisco ACS Admin Audit
7387
ciscoacsbackup.xml
Cisco ACS Backup and
7374
Restore
ciscoacsdbr.xml
Cisco ACS Database Rep-
7374
lication
ciscoacsdbs.xml
Cisco ACS Database Sync
7374
ciscoacsexpress.xml
Cisco ACS Express
7374
ciscoacsfailed.xml
Cisco ACS Failed Attempts
7374
ciscoacspassauth.xml
Cisco ACS Passed Authentic-
7374
ations
ciscoacspassword.xml
Cisco ACS User Password
7374
Changes
ciscoacsradius.xml
Cisco ACS RADIUS Accounting
446
7374
Appendix D: Connector Categories
FileName
Description
Version
ciscoacsservmon.xml
Cisco ACS Service Monitoring
7374
ciscoacssyslog.xml
Cisco Secure ACS 4.1 Syslog
7374
ciscoacssyslog5.xml
Cisco Secure ACS 5+ Syslog
7374
ciscoacstacacc.xml
Cisco ACS TACACS+
7374
Accounting
ciscoacstacadmin.xml
Cisco ACS TACACS+ Admin-
7374
istration
ciscoacsvoip.xml
Cisco ACS VoIP
7374
ciscocatos.xml
Cisco CatOS
7374
CiscoCSCSSM.xml
Cisco Content Security and
7374
Control Security Services Module 6.1-6.2
CiscoCSCSSM63.xml
Cisco Content Security and
7374
Control Security Services Module 6.3+
ciscocss.xml
Cisco Content Services
7374
Switch
CiscoFirewalls.xml
Cisco PIX and IOS
7443
CiscoIDS.xml
Cisco IDS/IPS v4/5.x
7374
CiscoIPSsdee.xml
Cisco IPS 5+ (SDEE)
7374
CiscoNAC_CA.xml
Cisco (NAC) Network Access
7422
Control Appliance with Clean
Access Manager (CAM) or
Server (CAS) Software
447
Appendix D: Connector Categories
FileName
Description
Version
cisconetworkregistrar.xml
Cisco Network Registrar for
7374
Windows
CiscoNXOS.xml
Cisco Nexus NX-OS
7395
CiscoVPN.xml
Cisco VPN
7374
ciscowlc.xml
Cisco Wireless LAN Controller
7388
and IOS-XE Software
citrixnetscaler.xml
Citrix Secure Access Gateway
7374
Enterprise Appliance / Netscaler
CitrixSAG.xml
Citrix Secure Access Gateway
7374
CitrixXD.xml
Citrix XenDesktop
7374
CitrixXS_auth.xml
Citrix XenServer auth log
7374
CitrixXS_daemon.xml
Citrix XenServer daemon log
7374
ClamAV.xml
ClamAV
7374
codegreenci.xml
CodeGreen Content Inspection
7374
codegreenciuser.xml
CodeGreen Content Inspection
7374
user
commandavwindows.xml
Command Antivirus for Win-
7374
dows
CommandES.xml
Command for Exchange
7374
Server
consentrycontroller.xml
ConSentry Controller
7374
ContegoManagerMonitor.xml
Manager Monitor
7374
448
Appendix D: Connector Categories
FileName
Description
Version
ContegoReports.xml
SWLEM Reports
7374
corenteawb.xml
Corente AWB
7374
cyberarkvault.xml
Cyber-Ark Vault
7374
cyberguard.xml
Cyberguard
7374
CyberoamUTM.xml
Cyberoam UTM
7374
dellPowerConnect.xml
Dell PowerConnect Switches
7374
devicelockevents.xml
DeviceLock Audit
7374
devicelockevents.xml
DeviceLock Events
7374
digitalpersona.xml
DigitalPersona Pro
7374
dlinkdfl.xml
D-Link DFL firewall
7374
dragonids.xml
Dragon IDS
7374
edmzpar.xml
eDMZ Password Auto Repos-
7374
itory
eeyeblinkep.xml
eEye Blink Professional End-
7380
point Protection
EFTServer.xml
EFT Server Enterprise Win-
7374
dows Application Log
emcrecoverpoint.xml
EMC RecoverPoint
7374
enterasysswitch.xml
Enterasys C-Series and N-Ser-
7374
ies Switches
epo.xml
ePolicy Orchestrator (ePO)
449
7380
Appendix D: Connector Categories
FileName
Description
Version
epo45.xml
ePolicy Orchestrator (ePO)
7467
4.5+
esafe.xml
eSafe
7374
esoft.xml
eSoft
7374
esxcfgfirewall.xml
VMWare ESX esxcfg-firewall
7374
log
esxhostd.xml
VMWare ESX hostd log
7483
esxihostd.xml
VMWare ESXi Hostd log
7397
esxmessages.xml
VMWare ESXi messages log
7406
esxmessages.xml
VMWare ESX messages log
7406
esxsecure.xml
VMWare ESX secure log
7429
esxvmkernel.xml
VMWare ESXi vmkernel log
7392
esxvmkernel.xml
VMWare ESX vmkernel log
7392
esxvmkwarning.xml
VMWare ESX vmkwarning log
7374
extremeswitch.xml
Extreme Switch
7452
F5BigIPdaemon.xml
F5 BigIP BSD daemon mes-
7374
sages
F5BigIPhttpd.xml
F5 BigIP HTTPD specific
7374
F5BigIPLTMgeneral.xml
F5 General BIG-IP specific
7454
messages
F5BigIPmessages.xml
F5 BigIP messages
7374
FileSure.xml
FileSure
7374
450
Appendix D: Connector Categories
FileName
Description
Version
FirePass.xml
FirePass SSL VPN
7374
fireproof.xml
FireProof
7374
flexteller.xml
Flex Teller
7374
forefrontapp.xml
Forefront Security Application
7374
Log (Client Security, Exchange
and Sharepoint)
forefrontEPAV.xml
Forefront Endpoint Protection -
7374
AV
forefrontSQLDB.xml
Forefront Security SQL Data-
7374
base
forefrontsys.xml
Forefront Security System Log
7374
(Client Security)
forescoutcounteractnac.xml
ForeScout CounterACT NAC
7374
fortigate25.xml
FortiGate 2.5
7374
fortigate28.xml
FortiGate 2.8+
7448
foundry.xml
Foundry
7374
freebsdauth.xml
FreeBSD Authentication
7374
freeradius.xml
FreeRADIUS
7374
freshclam.xml
FreshClam
7374
fsecureav.xml
F-Secure Anti-Virus 7
7374
GFIsim.xml
GFI LANguard System Integ-
7374
rity Monitor 3
globalscapeeftclient.xml
Globalscape EFT client
451
7374
Appendix D: Connector Categories
FileName
Description
Version
globalscapeftp.xml
Globalscape Secure FTP
7407
(W3C Extended file format)
GnatBox.xml
GNAT Box System Software
7415
v.3.3
GroupShield.xml
Group Shield/Outbreak for
7374
Exchange Server
hp_procurve.xml
HP ProCurve Switches Firm-
7374
ware F.05.65+ Zl Series
hp_procurve_msm700_series.xml
HP MSM700 Series Controller
7436
hpbladesystemenclosure.xml
HP BladeSystem Enclosure
7374
local log
hpbladesystemenclosure.xml
HP BladeSystem Enclosure
7374
auth log
hpstorwksmsa.xml
HP StorageWorks Modular
7374
Smart Array
hpuxsyslog.xml
HP-ux Syslog
7374
HuaweiSwitches.xml
Huawei Switches
7374
iasradius.xml
IAS RADIUS Rotating File
7374
iasradius.xml
IAS RADIUS Non-Rotating
7374
File
IASsystem.xml
Windows IAS System Log
7374
IIS.xml
Microsoft IIS Web Server 7.0
7374
(W3C Extended file format)
452
Appendix D: Connector Categories
FileName
Description
Version
IIS.xml
Microsoft IIS Web Server 6.0
7374
(W3C Extended file format)
IIS.xml
Microsoft IIS Web Server 5.0
7374
(W3C Extended file format)
iisftp.xml
Microsoft IIS FTP Server 7.0
7374
(W3C Extended file format)
iisftp.xml
Microsoft IIS FTP Server 5+
7374
(W3C Extended file format)
ingatesipfw.xml
Ingate Firewall
7374
InoculateIT60.xml
InoculateIT 6.0
7374
InoculateIT70plus.xml
InoculateIT 7.0+
7374
intrushield.xml
IntruShield
7490
ipfilter.xml
IP Filter
7374
iprism.xml
St. Bernard iPrism
7374
ironportemailsecurity.xml
IronPort Email Security Appli-
7374
ance
ironportwebsecurity.xml
IronPort Web Security
7374
ISA2004FirewallLog.xml
Microsoft ISA 2004/2006 Fire-
7374
wall (ISA Server file format)
ISA2004ProxyLog.xml
Microsoft ISA 2004 Web Proxy
7374
(ISA Server file format)
ISA2004W3CFirewall.xml
Microsoft ISA 2004/2006 Firewall (W3C Server file format)
453
7374
Appendix D: Connector Categories
FileName
Description
Version
ISA2004W3CWebProxy.xml
Microsoft ISA 2004 Web Proxy
7374
(W3C Server file format)
ISA2006ProxyLog.xml
Microsoft ISA 2006 Web Proxy
7374
(ISA Server file format)
ISA2006W3CWebProxy.xml
Microsoft ISA 2006 Web Proxy
7374
(W3C Server file format)
ISAApplication.xml
Microsoft ISA Server Applic-
7374
ation Log
ISAFirewallLog.xml
Microsoft ISA 2000 Firewall
7374
(ISA Server file format)
ISAPackertFilterLog.xml
Microsoft ISA Packet Filter
7374
(ISA Server file format)
isapi_redirect.xml
Apache Tomcat isapi_redirect
7374
ISAProxyLog.xml
Microsoft ISA Web Proxy (ISA
7374
Server file format)
ISAW3CFirewallLog.xml
Microsoft ISA Firewall (W3C
7374
Extended file format)
ISAW3CPackertFilterLog.xml
Microsoft ISA Packet Filter
7374
(W3C Extended file format)
ISAW3CProxyLog.xml
Microsoft ISA Web Proxy
7374
(W3C Extended file format)
issproventia.xml
ISS Proventia IPS
7380
issrealsecure.xml
ISS RealSecure IDS
7380
jacocartcare.xml
JACO CartCare
7374
454
Appendix D: Connector Categories
FileName
Description
Version
juniperidp30.xml
Juniper IDP 3.x
7374
juniperidp40.xml
Juniper IDP 4.0+
7374
junipernsm.xml
Juniper NSM
7374
junipersbr_authaccepts.xml
Juniper SBR authentication
7374
accepts report log
junipersbr_authaccepts.xml
Juniper SBR authentication
7374
accepts report log
junipersbr_authrejects.xml
Juniper SBR authentication
7374
rejects report log
junipersbr_authrejects.xml
Juniper SBR authentication
7374
rejects report log
junipervgw.xml
Juniper Virtual Gateway
7374
junos.xml
Juniper JUNOS
7455
KasperskyAdminKitDB.xml
Kaspersky Security Center
7417
KasperskyAdminKitDB.xml
Kaspersky Administration Kit 8
7417
kasperskyav.xml
Kaspersky Anti-Virus 6
7374
lancopestealthwatch.xml
Lancope StealthWatch
7374
linkproof.xml
LinkProof
7374
linuxauditd.xml
Linux Auditd
7374
linuxdhcpd.xml
DHCPd
7374
LogAgent.xml
LogAgent for OS400 (Patrick
7410
Townsend Security Solutions)
455
Appendix D: Connector Categories
FileName
Description
Version
LOGbinderSP.xml
LOGbinder for Sharepoint:
7374
Security Log
LOGbinderSP.xml
LOGbinder for Sharepoint:
7374
LOGbinder SP log
lotus8.xml
Lotus Notes and Domino
7374
Server 8
MacOSXcrash.xml
Mac OS X (crashreporter)
7374
MacOSXinstall.xml
Mac OS X (install)
7374
MacOSXmail.xml
Mac OS X (mail)
7374
MacOSXppp.xml
Mac OS X (ppp)
7374
MacOSXsecure.xml
Mac OS X (secure)
7374
MacOSXsystem.xml
Mac OS X (system)
7374
Made2Manage.xml
Made2Manage
7374
McAfeeAccessProtection.xml
McAfee Access Protection
7374
McafeeAccessScanLogReader.xml
McAfee On Access Scan v7.0
7374
McafeeActivityLog.xml
McAfee Activity Log (4.5 DAT
7374
file update)
mcafeeemailgateway.xml
McAfee Email Gateway
7374
McAfeeMailScan.xml
McAfee Mail Scan
7374
McAfeeNetShield.xml
McAfee NetShield
7374
McAfeeTotalProtection.xml
McAfee Total Protection
7374
McAfeeUpdateLogReader.xml
McAfee Update v7.0
7374
456
Appendix D: Connector Categories
FileName
Description
Version
McAfeeVSCLogReader.xml
McAfee VSC
7374
McafeeVSHHomeReader.xml
McAfee VSH Home
7374
McAfeeVSHLogReader.xml
McAfee VSH 5.0/7.0
7374
McAfeeVSHOnDemandReader.xml
McAfee VSH 85i
7374
McAfeeVSHOnDemandReader.xml
McAfee VSH 80i
7374
McAfeeWebEmail.xml
McAfee Web Email Scan
7374
mcafeewebgateway6x.xml
McAfee Web Gateway v6.x
7374
meditech.xml
Meditech
7374
meditechemraccess.xml
Meditech EMR Access Log
7374
motorola_wlancontroller.xml
Motorola WLAN Controller
7374
moveit.xml
MOVEit Log
7444
moveit.xml
MOVEit Windows Application
7444
Log
msexchange.xml
Microsoft Exchange Event Log
7411
msexchange.xml
Microsoft Exchange Applic-
7411
ation Log
msrras.xml
Microsoft RRAS
7374
mssecessentials.xml
Microsoft Security Essentials
7374
mssqlapplicationlog.xml
MSSQL 2000 Application Log
7442
mssqlauditor.xml
SolarWinds Log and Event
7475
Manager MSSQL Auditor
457
Appendix D: Connector Categories
FileName
Description
Version
nagios.xml
Nagios
7374
nDepthLogMessage.xml
nDepth Log Storage Message
7374
neoaccelvpn.xml
Neo Accel SSL VPN
7374
NeoterisVPN.xml
Neoteris VPN/Juniper SA
7374
series
NessusdMsgLog.xml
Nessus Message
7374
NessusdReport.xml
Nessus XML Report
7374
NessusdReport.xml
Nessus Report
7374
nessusnbe.xml
Nessus Security Scanner NBE
7374
Report
netaccess.xml
Net Access
7374
netfilter.xml
iptables / netfilter
7374
netgearFV.xml
Netgear FV Series
7374
netgearsslvpn.xml
Netgear SSL VPN Con-
7374
centrator SSL312
netgearswitch.xml
Netgear Switch
7374
netilla.xml
Netilla VPN
7419
netiqdra.xml
NetIQ Directory and Resource
7374
Administrator
Netscreen.xml
Netscreen
7374
netscreen5.xml
Juniper/NetScreen 5
7491
netvanta.xml
Adtran NetVanta Router
7374
458
Appendix D: Connector Categories
FileName
Description
Version
netware65.xml
Novell Netware 6.5
7374
netware65.xml
Novell Netware 6.5 File
7374
netware4153.xml
Novell Netware 4.1 - 5.3
7374
NetwareDB.xml
Novell Netware 6.5 (Database)
7374
networkbox.xml
Network Box RM300 and
7374
ITPE1000
nitroips.xml
NitroSecurity IPS
7374
NitroIPSsnort.xml
NitroGuard IPS - Snort Format
7374
NOD32DB.xml
NOD32 Antivirus 4 Access
7374
Threat
NOD32DB.xml
NOD32 Antivirus 4 Access
7374
Scan
NOD32DB.xml
NOD32 Antivirus 4 Access
7374
Event
NOD32DB.xml
NOD32 Antivirus 4 SQL Threat
7374
NOD32DB.xml
NOD32 Antivirus 4 SQL Scan
7374
NOD32DB.xml
NOD32 Antivirus 4 SQL Event
7374
nortel200series.xml
Nortel Contivity 200 Series
7374
nortelalteon.xml
Nortel Alteon
7374
nortelbaystack.xml
Nortel Baystack
7374
nortelcontivity.xml
Nortel Contivity
7374
nortelroutingswitch.xml
Nortel Ethernet Routing Switch
7374
459
Appendix D: Connector Categories
FileName
Description
Version
nortelswitch4500.xml
Nortel Ethernet Routing Switch
7374
4500 Series
nortelwss.xml
Nortel WLAN Security Switch
7374
norton.xml
Symantec Corp Antivirus
7374
novellidentityauditDB.xml
Novell Identity Audit DB
7374
ntapplication.xml
Windows Application Log
7423
ntdns.xml
Windows DNS Server Log
7374
ntds.xml
Windows Directory Service
7428
Log
ntfrs.xml
Windows File Replication Ser-
7374
vice
ntsecurity.xml
Windows NT/2000/XP Secur-
7374
ity Log
ntsystem.xml
Windows System Log
7446
nubridgesprotect.xml
NuBridges Protect Token Man-
7374
ager Engine
nubridgesprotect.xml
NuBridges Protect Resource
7374
Service
nubridgesprotect.xml
NuBridges Protect Key Man-
7374
ager
openbsdftpd.xml
OpenBSD FTPd
7374
OpenEdgeAudit.xml
OpenEdge Audit
7374
openldap.xml
OpenLDAP
7374
460
Appendix D: Connector Categories
FileName
Description
Version
OpenSSH.xml
Open SSH
7374
OpenVMS.xml
HP OpenVMS 8+
7374
Opsec.xml
OPSEC(TM) / Check Point
7374
(TM) NG LEA Client
oracledatabase.xml
Oracle Auditor - Database
7374
oraclesyslog.xml
Oracle Auditor - Syslog
7374
oraclewindows.xml
Oracle Auditor - Windows
7441
OsirisHIMS.xml
Osiris Host Integrity Monitoring
7374
System
paloaltofirewall.xml
Palo Alto Networks PA-2000
7463
Series and PA-4000 Series
Firewall
PAM.xml
Linux PAM
7418
PandaSecurityForDesktopsDB.xml
Panda Security for Desktops
7374
4.02
PassManPro.xml
ManageEngine Password Man-
7413
ager Pro SNMP
PatchLinkVulnDB.xml
PatchLink Vulnerability
7374
pcanywhere.xml
pcAnywhere
7374
permeo.xml
Permeo VPN
7374
pointsecpc.xml
PointSec PC
7374
postfix.xml
Postfix
7374
proftpdaccess.xml
ProFTPD Access
7374
461
Appendix D: Connector Categories
FileName
Description
Version
proftpdauth.xml
ProFTPD Auth
7374
proximorinoco.xml
Proxim Orinoco WAP
7374
ptechinteract.xml
PowerTech Interact
7374
pureftpd.xml
Pure-FTPd
7374
qualysguard.xml
QualysGuard Scan Report
7374
radwareappdirector.xml
Radware AppDirector
7374
RaritanDominion.xml
Raritan Dominion Switch
7374
refleximc.xml
Reflex IMC
7374
RemotelyAnywhere.xml
RemotelyAnywhere / LogMeIn
7374
RetinaStatusLog.xml
Retina
7374
rsaauthmanager71.xml
RSA Authentication Manager
7374
7.1
safeatoffice.xml
Checkpoint Safe@Office Fire-
7374
wall
safeword.xml
SafeNet SafeWord
7374
samba.xml
Samba
7374
SanDiskCMC.xml
SanDisk CMC
7374
savantprotection.xml
Savant Protection
7374
SecureNet.xml
SecureNet IDS
7380
securespheredb.xml
SecureSphere Database Gate-
7374
way 6.0
462
Appendix D: Connector Categories
FileName
Description
Version
securespheresystem.xml
SecureSphere System and
7374
Firewall Events 6.0
securesphereweb.xml
SecureSphere Web Applic-
7374
ation Firewall 6.0
securid.xml
SecurID
7374
securidsyslog.xml
SecurID Syslog
7374
selinux.xml
SELinux
7374
sendmail.xml
Linux Sendmail
7374
sentriant.xml
Extreme Sentriant
7374
servuftp.xml
Serv-U FTP Server (Never
7374
Rotate)
servuftp.xml
Serv-U FTP Server
7374
Sidewinder.xml
Sidewinder Firewall
7374
sidewinder61.xml
Sidewinder 6.1+ Firewall
7401
SmoothWallUTM.xml
SmoothWall Unified Threat
7433
Manager
snmpdmessages.xml
smnpd daemon messages
7374
snort.xml
FortiSnort
7440
snort.xml
Snort
7440
snort.xml
SyslogSnort
7440
solarisbsm.xml
Solaris 10 BSM Auditing
7374
solarissnare.xml
Solaris 8 and 9 Snare Auditing
7374
463
Appendix D: Connector Categories
FileName
Description
Version
solarissnare.xml
Solaris 10 Snare Auditing
7374
sonicsslvpn.xml
SonicWALL SSL VPN
7391
sonicwall.xml
SonicWall
7465
sonicwalles.xml
Sonicwall Email Security
7374
sonicwallgmsdb.xml
SonicWall GMS
7374
Sophos.xml
Sophos Anti-Virus for Win2k
7374
SophosDB.xml
Sophos Enterprise 3.0 Data-
7374
base
SophosDB.xml
Sophos Enterprise 2.0 Data-
7374
base
sophoses.xml
Sophos ES appliance auth
7374
sophoses.xml
Sophos ES appliance
7374
SophosSNMP.xml
Sophos Anti-Virus SNMP
7439
sophosws.xml
Sophos WS appliance
7374
SquidAccessLog.xml
Squid Access Log
7374
SquidGuardAccessBlock.xml
SquidGuard Access Block Log
7374
stonegatefirewall.xml
StoneGate Firewall v5.3 CEF
7374
sudolog.xml
sudo syslog
7374
sudolog.xml
sudo
7374
SW_Orion.xml
SolarWinds Orion and Vir-
7380
tualization Manager
464
Appendix D: Connector Categories
FileName
Description
Version
sybari.xml
Sybari's Antigen 7.0 for
7374
Exchange Server 2000
symantecep.xml
Symantec Endpoint Protection
7445
11
SymantecGatewayIDS.xml
Symantec Gateway IDS
7374
symantecwebsec.xml
Symantec Web Security for
7374
Windows
symmetricomsyncserver.xml
Symmetricom SyncServer
7419
thycoticsecretserver.xml
Thycotic Secret Server
7374
timirror.xml
Titanium Mirror Firewall
7374
tippingpoint.xml
Tippingpoint IPS 1.4
7374
tippingpoint.xml
Tippingpoint IPS 2.1
7374
tippingpoint.xml
Tippingpoint SMS
7374
tippingpoint_audit_system.xml
TippingPoint Audit and System
7374
tippingpointxseries.xml
Tippingpoint X505
7374
toplayer.xml
TopLayer Attack Mitigator
7374
trendDeepSecurity.xml
Trend Deep Security
7374
trendimss.xml
Trend IMSS
7374
trendimssemgr.xml
Trend IMSS Policy
7374
trendimssvirus.xml
Trend IMSS Virus
7374
trendInterScan.xml
Trend InterScan
7374
465
Appendix D: Connector Categories
FileName
Description
Version
trendmicroigsa.xml
Trend Micro Interscan Gate-
7374
way Security Appliance
trendOfficeScan.xml
Trend Office Scan
7374
trendScanMail.xml
Trend ScanMail
7374
trendServerProtect.xml
Trend Server Protect
7374
tricipher.xml
TriCipher
7374
tw_enterprise.xml
Tripwire Enterprise
7374
ultravnc.xml
Ultra VNC
7374
Velociraptor.xml
Symantec Velociraptor 1.5
7374
velociraptor20.xml
Symantec Velociraptor 2.0
7374
velociraptor30.xml
Symantec Velociraptor 3.0
7374
vericeptmonitor.xml
Vericept Monitor
7374
VIPREBusiness.xml
VIPRE 5.0
7374
VIPREBusiness.xml
VIPRE Business - System
7374
Events 4.0
VIPREBusiness.xml
VIPRE Business 4.0
7374
VIPREEnterpriseDB.xml
VIPRE Enterprise 3.1
7374
visneticfirewall.xml
VisNetic Firewall
7374
vistasecurity.xml
Windows 7/2008/Vista Secur-
7449
ity Log
vormetric.xml
Vormetric
466
7374
Appendix D: Connector Categories
FileName
Description
Version
vsftpxfer.xml
vsftpd xferlog
7374
WatchguardFirewalls.xml
WatchGuard firewalls
7420
WebrootAntispywareCorpEdDB.xml
Webroot Antispyware Cor-
7374
porate Edition 3.5
websense.xml
Websense Web Filter and Web- 7434
sense Web Security
websenseDB.xml
Websense Web Filter and Web- 7435
sense Web Security Database
websenseds.xml
Websense Data Security
7435
WgFirebox.xml
WatchGuard Firebox
7429
WgSoho.xml
WatchGuard SOHO
7429
WgVclass.xml
WatchGuard Vclass
7374
WgVclassAlarm.xml
WatchGuard Vclass (Alarm)
7374
WgVclassVpn.xml
WatchGuard Vclass (VPN)
7374
WgXcore.xml
WatchGuard Xcore
7429
WgXCSauth.xml
WatchGuard Extensible Con-
7374
tent Security (XCS) auth log
WgXCSsyslog.xml
WatchGuard Extensible Con-
7374
tent Security (XCS) syslog
WgXedge.xml
WatchGuard Firebox X Edge
7429
E-Series
WindowsDHCPServer.xml
Windows DHCP Server 2003
7374
WindowsDHCPServer.xml
Windows DHCP Server 2000
7374
467
Appendix D: Connector Categories
FileName
Description
Version
WindowsDHCPSystem.xml
Windows DHCP Server
7374
2000/2003/2008 System Log
WindowsDNSTraffic.xml
Windows DNS Traffic Log
7374
windowsfirewall.xml
Windows Firewall
7374
WRGHostGateway.xml
Wescom Resources Group's
7374
Host Gateway Windows Log
wsftpserver.xml
WS_FTP Server Corporate
7374
xirruswifiarray.xml
Xirrus WiFi Array
7374
468
Appendix E: CMC Commands
CMC commands are the only means to access LEM and nDepth Appliances. Use CMC to upgrade
and maintain the appliances.
You can use the CMC commands for such tasks as:
l
upgrading the Manager software
l
deploying new connector infrastructure to the Managers and Agents
l
rebooting or shutting down the network appliance
l
configuring trusted reporting hosts
l
configuring supplemental services on the Manager appliance, and
l
controlling your nDepth appliances.
The following topics describe how to log on to CMC and describe each command found in the
appliance, manager, service and ind menus.
Logging on to CMC
To log on to CMC:
1. Connect to the Network Appliance either of two ways:
l
Connect directly to the Network Appliance with a keyboard and monitor.
If you connect in this manner, skip to Step 7.
l
Connect using SSH on port 32022.
SSH stands for Secure Shell, which is a remote administration connector. To connect
to the network appliance using SSH, you can use PuTTY, which is a free SSH tool. For
more information on this too, see the SolarWinds Knowledge Base.
The following example shows the PuTTY Configuration form with the default
Manager settings.
469
Appendix E: CMC Commands
2. In the Host Name (or IP address) box, type the IP address of your Manager (in this
example, the IP address is 10.1.1.200).
3. Under Protocol, click SSH.
4. In the Port box, type 32022.
5. So you don’t have to do this again, type Manager into the Saved Sessions box, and
then click Save.
6. Click Open.
Note: To reopen this connection for future sessions, double-click Manager in the
Saved Session box. The connection will reopen
7. Whether you connect remotely or physically, the system will prompt you for your CMC
user name and password.
470
Using the CMC 'appliance' Menu
Using the CMC 'appliance' Menu
After typing the appliance command, the cmc::acm# prompt appears. You may then use any of the
commands listed in the following table.
The commands are listed in alphabetical order. Command descriptions with an asterisk (*) mean the
command requires an automatic restart of the Manager service.
Command
Description
activate
Activates appliance features after activating LEM.
checklogs
Shows the contents of the virtual appliance’s log files from sources such as syslog and SNMP.
cleantemp
Removes temporary files created by the virtual appliance during normal operation.
You may run this command to recover used disk space, or at the suggestion of
SolarWinds Support.
clearsyslog
Removes all rotated and compressed localN files.
dateconfig
Sets/shows the virtual appliance’s date and time.
demote
Demotes the appliance to a secondary appliance in a high availability or disaster
recovery configuration. The demoted appliance will disable running LEM services
and resume replicating its configuration information from the configured primary
appliance.
diskusage
Checks and provides a summary of disk usage for your virtual appliance and several of the internal components (such as the database or log files). This information is included when you send SolarWinds Support information using the
support command.
editbanner
Edits the SSH login banner.
exit
Exits the Appliance menu and returns to the main menu.
exportsyslog
Exports the System Logs.
help
Shows the Help menu
471
Appendix E: CMC Commands
Command
Description
hostname
Changes the virtual appliance’s hostname.
limitsyslog
Interrogates and/or changes the number of rotated log files to be kept.
netconfig
Configures network parameters for the appliance, such as the IP address, subnet
mask and DNS server(s).
ntpconfig
Configures the Network Time Protocol (NTP) service on the virtual appliance for
synchronization with a time server.
password
Changes the CMC user password.
ping
Pings other IP addresses or host names from the virtual appliance to verify network connectivity.
promote
Promotes the appliance to the primary appliance in a high availability or disaster
recovery configuration. The promoted appliance will take over LEM services until
it is demoted with the demote command.
reboot
Reboots the virtual appliance.
setlogrotate
Defines the syslog rotation frequency (hourly, daily
shutdown
Shuts down the virtual appliance.
top
Displays and monitors CPU and memory usage, as well as per process information for the Manager Network Appliance.
tzconfig
Configure the virtual appliance's time zone information.
viewnetconfig
Displays the current network configuration parameters for the appliance such as
the IP address, subnet mask and DNS server(s).
Using the CMC 'manager' Menu
After typing the manager command, the cmc::cmm# prompt appears. You may then use any of the
commands listed in the following table. The commands are listed in alphabetical order. Command
descriptions with an asterisk (*) mean the command requires an automatic restart of the Manager
service.
472
Using the CMC 'manager' Menu
Command
Description
actortoolupgrade
* Upgrades the Manager’s Actor Tools from CD or floppy disk.
archiveconfig
Configures the Manager appliance database archives to a remote file share
on a daily, weekly, or monthly schedule.
backupconfig
Configures the Manager appliance software and configuration backups to a
remote file share on a daily, weekly, or monthly schedule.
cleanagentconfig
Reconfigures the Agent on this Manager to a new Manager.
configurendepth
Configures the virtual appliance to use an nDepth server
dbquery
Queries the Manager appliance database directly.
debug
Emails the Manager debugging information to any given email address. The
email message contains a collection of data that can be useful in diagnosing
problems.
exit
Return to main CMC menu.
exportcert
Exports the CA certificate for Console.
exportcertrequest
Exports a certificate request for signing by CA.
help
Displays a brief description of each command.
importcenter
* Imports a certificate used for Console communication.
logbackupconfig
Configures the Manager appliance remote log backups to a remote file share
on a daily, weekly, or monthly schedule.
resetadmin
* Resets the admin password to "password". This command does not affect
other users on the system and all settings are preserved.
restart
* Restarts the Manager service. This will take the Manager offline for 1–3
minutes.
sensortoolupgrade Upgrades the Manager’s Sensor Tools from a CD or floppy disk.
showlog
Allows you to page through the Manager’s log file.
showmanagermem Displays the Manager's configured memory utilization settings.
473
Appendix E: CMC Commands
Command
start
Description
Starts the Manager service. If the Manager is already started, then nothing
will happen.
stop
* Stops the Manager service. This makes the Manager inactive until it is
started again.
support
Sends debugging information via email to [email protected]. This
command prompts you for your name and email address. It then sends
SolarWinds a collection of data that can be useful in diagnosing problems.
viewsysinfo
Displays appliance settings and information, useful for support and
troubleshooting.
watchlog
Displays 20 lines of the current Manager log file and monitors the log for
further updates. Any new log entries appear as they are written to the log.
Using the CMC 'ndepth' menu
If you have one or more nDepth appliances, CMC has an ind menu that lets you control these
appliances. After typing the ind command, the cmc::ind# prompt appears. You may then use any of
the commands listed in the following table.
The commands are listed in alphabetical order. Command descriptions with an asterisk (*) mean the
command requires an automatic restart of the Manager service.
Command
Description
exit
Exits the nDepth menu and returns to the main menu.
help
Shows the help menu.
logmarchiveconfig
Sets Log Message archive share settings.
logmbackupconfig
Sets Log Message backup share settings.
restart
* Restarts the Log Message search/storage service.
start
Starts the Log Message search/storage service.
stop
Stops the Log Message search/storage service.
474
Using the CMC 'service' Menu
Using the CMC 'service' Menu
After typing the service command, the cmc::scm# prompt appears. You may then use any of the
commands listed in the following table.
The commands are listed in alphabetical order. Command descriptions with an asterisk (*) mean the
command requires an automatic restart of the Manager service.
Command
copysnortrules
Description
Copy the existing Snort rules from the Manager onto a floppy disk or network
file share. This allows you to retrieve the Snort rules from the Manager’s hard
drive and make any rule updates or modifications. This requires a formatted
floppy disk or a network file share.
disableflow
Disables NetFlow/sFlow collection on the SolarWinds Appliance (and in the
SolarWinds Explorer).
disablesnmp
Disables SNMP trap logging to the Manager. The SNMP trap logging service
will be permanently disabled until the enablesnmp command is issued.
enableflow
* Enables NetFlow/sFlow collection on the SolarWinds Appliance (and in the
Explorer).
enablesnmp
Enables SNMP trap logging to the Manager. By default, SNMP is disabled on
the Manager. This command enables SNMP to allow integration with some
security tools that can only log using SNMP.
exit
Returns to the main CMC menu.
getflowdbsize
Checks the size of the Flow database.
help
Displays a brief description of each command within the service menu.
loadsnortbackup Loads Snort rules from “factory default” on the Manager. This allows you to
revert to the Snort rules’ original default settings in case of an error. This
command overwrites any changes that were made to the main set of rules with
the original rules that were installed with the SolarWinds system.
475
Appendix E: CMC Commands
Command
loadsnortrules
Description
Loads Snort rules from a floppy disk or a network file share to the Manager.
This allows you to update the Snort rules on the Manager. The floppy disk
must be in the same format (i.e., the same names and directories) that the
copysnortrules command uses to issue the original rules; otherwise, the rules
will not be updated.
restartsnort
Restarts the Snort service.
restartssh
Restarts the SSH service. If the SSH service is running, this command stops
and then restarts the service.
restrictconsole
Restricts access to the Console’s graphical user interface to only certain IP
addresses or hostnames. This command prompts you to provide the allowable
IP addresses or hostnames. Once the restriction is in place, only the given IP
addresses/hostnames are able to connect to the Console. Users are still
required to log in with a password to fully access the Console.
restrictreports
Restricts access to reports to only certain IP addresses or hostnames. This
command prompts you to provide the allowable IP addresses or hostnames.
Once the restriction is in place, only the given IP addresses/hostnames are
able to create and view reports.
restrictssh
Restrict the SSH service to only certain IP addresses. This command prompts
you to provide the allowable IP addresses. Once the restriction is done, only
the given IP address/user combinations will be able to connect to the Manager
using the SSH service.
startssh
Start running the SSH service.
stopopsec
Terminate any connections from the Manager Appliance to Check Point®
OPSEC™ hosts.
stopssh
Stops running the SSH service. If you issue this command, you can only
access the Manager with a keyboard and monitor until you issue a reboot
command.
To restrict access to the SSH service (outside of the user name and password
requirements), see the restrictssh command.
476
Using the CMC 'service' Menu
Command
Description
unrestrictconsole Removes restrictions to the Console’s graphical user interface. This command
removes all restrictions and allows any valid system user to connect to the
Console. The only protection at this point is the user name and password
combination.
unrestrictreports
Removes restrictions on access to reports. This command removes all
restrictions and allows anyone with the Reports Console, or any alternative
database connection software, with the proper username and password, to
create and view reports and browse the database.
unrestrictssh
Removes restrictions to the SSH service. Any connection attempts will still
require a user name and password.
477
Appendix F: Report Tables
The following tables list all of LEM’s reports, provide descriptions of their contents, and suggest
schedules for running each report.
Table of Audit reports
The following table lists and describes each audit reports. For your convenience, the reports are listed
alphabetically by title.
File
Title
Description
name
Schedule
Authentication
This report lists all authentications tracked by the SolarWinds system,
RPT2003- Weekly
Report
including user logon, logoff, failed logon attempts, guest logons, etc.
02.rpt
Authentication
This report lists event events that are related to authentication and
RPT2003- As needed
Report -
authorization of accounts and account “'containers'” such as groups or
02-10.rpt
Authentication
domains. These events can be produced from any network node including
Audit
firewalls, routers, servers, and clients.
Authentication
This report lists event events that are related to suspicious authentication
RPT2003- As Needed
Report -
and authorization events. These events include excessive failed
02-9.rpt
Suspicious
authentication or authorization attempts, suspicious access to
Authentication
unauthenticated users, and suspicious access to unauthorized services or
information.
Authentication
This report lists the Top User Log On events grouped by user name.
Report - Top
RPT2003- As needed
02-6-2.rpt
User Log On by
User
Authentication
This report lists the Top User Log On Failure events grouped by user name. RPT2003- As needed
Report - Top
02-7-2.rpt
User Log On
Failure by User
Authentication
This report shows logon, logoff, and logon failure activity to the SolarWinds
RPT2003- As needed
Report -
Console.
02-8.rpt
SolarWinds
Authentication
478
Appendix F: Report Tables
File
Title
Description
name
Schedule
Authentication
User Logoff events reflect account logoff events from network devices
RPT2003- As needed
Report - User
(including network infrastructure devices). Each event will reflect the type of
02-5.rpt
Log Off
device from which the user was logging off. These events are usually
normal events but are tracked for consistency and auditing purposes.
Authentication
User Logon events reflect user account logon events from network devices
RPT2003- As needed
Report - User
monitored by SolarWinds (including network infrastructure devices). Each
02-6.rpt
Log On
event will reflect the type of device that the logon was intended for along with
all other relevant fields.
Authentication
This report lists all account logon events, grouped by user name.
Report - User
RPT2003- As needed
02-6-1.rpt
Log On by User
Authentication
User Logon Failure events reflect failed account logon events from network
RPT2003- As needed
Report - User
devices (including network infrastructure devices). Each event will reflect
02-7.rpt
Log On Failure
the point on the network where the user was attempting logon. In larger
quantities, these events may reflect a potential issue with a user or set of
users, but as individual events they are generally not a problem.
Authentication
This report lists all account logon failure events, grouped by user name.
Report - User
RPT2003- As needed
02-7-1.rpt
Log On Failure by
User
Change
This report includes changes to domains, groups, machine accounts, and
RPT2006- As needed
Management -
user accounts.
20.rp
Change
This report includes changes to domains, including new domains, new
RPT2006- As needed
Management -
members, and modifications to domain settings.
20-01.rpt
General
Authentication
Related Events
General
Authentication:
Domain Events
479
Table of Audit reports
File
Title
Description
name
Schedule
Change
This report lists changes to domain type. These events are uncommon and
RPT2006- As needed
Management -
usually provided by the operating system. Usually, these changes are made
20-01-
General
by a user account with administrative privileges, but occasionally a change
7.rpt
Authentication:
will happen when local system maintenance activity takes place.
Domain Events Change Domain
Attribute
Change
This report lists event events that occur when an account or account
RPT2006- As needed
Management -
container within a domain is modified. Usually, these changes are made by
20-01-
General
a user account with administrative privileges, but occasionally an event
4.rpt
Authentication:
occurs when local system maintenance activity takes place. Events of this
Domain Events -
nature mean a user, machine, or service account within the domain has
Change Domain
been modified.
Member
Change
This report lists event events that occur upon removal of a trust relationship
RPT2006- As needed
Management -
between domains, deletion of a subdomain, or deletion of account
20-01-
General
containers within a domain. Usually, these changes are made by a user
8.rpt
Authentication:
account with administrative privileges.
Domain Events Delete Domain
Change
This report lists event events that occur when an account or account
RPT2006- As needed
Management -
container has been removed from a domain. Usually, these changes are
20-01-
General
made by a user account with administrative privileges, but occasionally they
3.rpt
Authentication:
occur when local system maintenance activity takes place.
Domain Events Delete Domain
Member
Change
This report lists event events that happen when the alias for a domain
RPT2006- As needed
Management -
member has been changed. This means an account or account container
20-01-
General
within a domain has an alias created, deleted, or otherwise modified. This
5.rpt
Authentication:
event is uncommon and is used to track links between domain members
Domain Events -
and other locations in the domain where the member may appear.
Domain Member
Alias
480
Appendix F: Report Tables
File
Title
Description
name
Schedule
Change
This report lists authentication, authorization, and modification events that
RPT2006- As needed
Management -
are related only to domains, subdomains, and account containers. These
20-01-
General
events are normally related to operating systems. However, they can be
1.rpt
Authentication:
produced by any network device.
Domain Events DomainAuthAudit
Change
This report lists event events that occur upon creation of a new trust
RPT2006- As needed
Management -
relationship between domains, creation of a new subdomain, or creation of
20-01-
General
new account containers within a domain. Usually, these creations are done
6.rpt
Authentication:
by a user account with administrative privileges.
Domain Events New Domain
Change
This report lists event events that occur when an account or an account
RPT2006- As needed
Management -
container (a new user, machine, or service account) has been added to the
20-01-
General
domain. Usually, these additions are made by a user account with
2.rpt
Authentication:
administrative privileges, but occasionally they occur when local system
Domain Events -
maintenance activity takes place.
New Domain
Member
Change
This report lists changes to groups, including new groups, members
RPT2006- As needed
Management -
added/removed to/from groups, and modifications to group settings.
20-02.rpt
Change
This report lists event events that occur when a group type is modified.
RPT2006- As needed
Management -
Usually, these changes are made by a user account with administrative
20-02-
General
privileges, but occasionally a they occur when local system maintenance
6.rpt
Authentication:
activity takes place.
General
Authentication:
Group Events
Group Events Change Group
Attribute
Change
This report lists event events that occur upon deletion of a new group of any
RPT2006- As needed
Management -
type. Usually, these additions are made by a user account with
20-02-
General
administrative privileges.
5.rpt
Authentication:
Group Events Delete Group
481
Table of Audit reports
File
Title
Description
name
Schedule
Change
This report lists event events that occur when an account or group has been RPT2006- As needed
Management -
removed from a group. Usually, these changes are made by a user account
20-02-
General
with administrative privileges, but occasionally they occur when local system
3.rpt
Authentication:
maintenance activity takes place.
Group Events Delete Group
Member
Change
This report lists authentication, authorization, and modification events
RPT2006- As needed
Management -
related only to account groups. These events are normally operating
20-02-
General
system related, however could be produced by any network device.
1.rpt
Change
This report lists NewGroup events. These events occur upon creation of a
RPT2006- As needed
Management -
new group of any type. Usually, these additions are made by a user account
20-02-
General
with administrative privileges.
4.rpt
Change
This report lists NewGroupMember events. These events occur when an
RPT2006- As needed
Management -
account (or other group) has been added to a group. Usually, these
20-02-
General
additions are made by a user account with administrative privileges, but
2.rpt
Authentication:
occasionally an event will occur when local system maintenance activity
Group Events -
takes place. A new user, machine, or service account has been added to the
New Group
group.
Authentication:
Group Events Group Audit
Authentication:
Group Events New Group
Member
Change
This report includes changes to machine accounts, including
RPT2006- As needed
Management -
enabling/disabling machine accounts and modifications to machine account
20-03.rpt
General
settings.
Authentication:
Machine Account
Events
482
Appendix F: Report Tables
File
Title
Description
name
Schedule
Change
This report lists MachineDisable events. These events occur when a
RPT2006- As needed
Management -
machine account is actively disabled and/or when an account is forcibly
20-03-
General
locked out by the operating system or other authentication tool. These
3.rpt
Authentication:
events are usually operating system related and could reflect a potential
Machine Account
issue with a computer or set of computers.
Events - Machine
Disabled
Change
This report lists MachineEnable events, which reflect the action of enabling
RPT2006- As needed
Management -
a computer or machine account. These events are normally related to the
20-03-
General
operating system, and will trigger when a machine is “enabled,” normally by
1.rpt
Authentication:
a user with administrative privileges.
Machine Account
Events - Machine
Enabled
Change
This report lists MachineModifyAttribute events, which occur when a
RPT2006- As needed
Management -
computer or machine type is changed. These events are uncommon and
20-03-
General
usually provided by the operating system.
2.rpt
Change
This report includes changes to user accounts, including enabling/disabling
RPT2006- As needed
Management -
user accounts and modifications to user account settings.
20-04.rpt
Change
This report lists UserDisable events. These events occur when a user
RPT2006- As needed
Management -
account is actively disabled and/or when a user is forcibly locked out by the
20-04-
General
operating system or other authentication tool. These events are usually
3.rpt
Authentication:
related to the operating system and can reflect a potential issue with a user
User Account
or set of users.
Authentication:
Machine Account
Events - Machine
Modify Attribute
General
Authentication:
User Account
Events
Events - User
Disabled
483
Table of Audit reports
File
Title
Description
name
Schedule
Change
This report lists UserEnable events, which reflect the action of enabling a
RPT2006- As needed
Management -
user account. These events are normally related to the operating system .
20-04-
General
They occur both when an account is “'unlocked'” after lockout due to
1.rpt
Authentication:
unsuccessful logons, and when an account is “enabled” in the traditional
User Account
sense.
Events - User
Enabled
Change
This report lists UserModifyAttribute events that occur when a user type is
RPT2006- As needed
Management -
changed. These events are uncommon and usually provided by the
20-04-
General
operating system.
2.rpt
Change
This report includes accesses to network infrastructure device policy,
RPT2006- As needed
Management -
including viewing or changing device policy.
21.rpt
This report includes creations of Windows/Active Directory groups.
RPT2006- As needed
Authentication:
User Account
Events - User
Modify Attributes
Network
Infrastructure:
Policy/View
Change
Change
Management -
22-01.rpt
Windows/Active
Directory
Domains: Group
Created
Change
This report includes deletions of Windows/Active Directory groups.
Management -
RPT2006- As needed
22-02.rpt
Windows/Active
Directory
Domains: Group
Deleted
Change
This report includes Windows/Active Directory group-related events.
Management -
RPT2006- As needed
22.rpt
Windows/Active
Directory
Domains: Group
Events
484
Appendix F: Report Tables
File
Title
Description
name
Schedule
Change
This report includes changes to Windows/Active Directory group properties, RPT2006- As needed
Management -
such as the display name.
22-03.rpt
This report includes Windows/Active Directory machine-related events.
RPT2006- As needed
Windows/Active
Directory
Domains: Group
Property
Updated
Change
Management -
23.rpt
Windows/Active
Directory
Domains:
Machine Events
Change
This report includes creations of Windows/Active Directory machine
RPT2006- As needed
Management -
accounts.
23-01.rpt
Change
This report includes deletions of Windows/Active Directory machine
RPT2006- As needed
Management -
accounts.
23-02.rpt
Change
This report includes disables of Windows/Active Directory machine
RPT2006- As needed
Management -
accounts.
23-03.rpt
Windows/Active
Directory
Domains:
Machine Events Account Created
Windows/Active
Directory
Domains:
Machine Events Account Deleted
Windows/Active
Directory
Domains:
Machine Events Account Disabled
485
Table of Audit reports
File
Title
Description
name
Schedule
Change
This report includes enables of Windows/Active Directory machine
RPT2006- As needed
Management -
accounts.
23-04.rpt
Change
This report includes changes to Windows/Active Directory machine account
RPT2006- As needed
Management -
properties, such as the display name.
23-05.rpt
Change
This report includes additions of Windows/Active Directory machine
RPT2006- As needed
Management -
accounts to groups.
23-06.rpt
Change
This report includes additions of Windows/Active Directory machine
RPT2006- As needed
Management -
accounts to Organizational Units.
23-07.rpt
Change
This report includes removals of Windows/Active Directory machine
RPT2006- As needed
Management -
accounts from groups.
23-08.rpt
Windows/Active
Directory
Domains:
Machine Events Account Enabled
Windows/Active
Directory
Domains:
Machine Events Account
Properties
Update
Windows/Active
Directory
Domains:
Machine Events Added To Group
Windows/Active
Directory
Domains:
Machine Events Added To OU
Windows/Active
Directory
Domains:
Machine Events Removed From
Group
486
Appendix F: Report Tables
File
Title
Description
name
Schedule
Change
This report includes removals of Windows/Active Directory machine
RPT2006- As needed
Management -
accounts from Organizational Units.
23-09.rpt
Change
This report includes additions of Windows/Active Directory user accounts to
RPT2006- As needed
Management -
critical groups, such as Domain or Enterprise Admins.
22-04.rpt
Change
This report includes Windows/Active Directory Organizational Unit-related
RPT2006- As needed
Management -
events.
24.rpt
Change
This report includes creation of Windows/Active Directory Organizational
RPT2006- As needed
Management -
Units.
24-01.rpt
Change
This report includes deletion of Windows/Active Directory Organizational
RPT2006- As needed
Management -
Units.
24-02.rpt
Windows/Active
Directory
Domains:
Machine Events Removed From
OU
Windows/Active
Directory
Domains: New
Critical Group
Members
Windows/Active
Directory
Domains: OU
Events
Windows/Active
Directory
Domains: OU
Events - OU
Created
Windows/Active
Directory
Domains: OU
Events - OU
Deleted
487
Table of Audit reports
File
Title
Description
name
Schedule
Change
This report includes updates to Windows/Active Directory Organizational
RPT2006- As needed
Management -
Unit properties, such as the display name.
24-03.rpt
This report includes Windows/Active Directory user-related events.
RPT2006- As needed
Windows/Active
Directory
Domains: OU
Events - OU
Properties
Update
Change
Management -
25.rpt
Windows/Active
Directory
Domains: User
Events
Change
This report includes creations of Windows/Active Directory user accounts.
Management -
RPT2006- As needed
25-01.rpt
Windows/Active
Directory
Domains: User
Events - Account
Created
Change
This report includes deletions of Windows/Active Directory user accounts.
Management -
RPT2006- As needed
25-02.rpt
Windows/Active
Directory
Domains: User
Events - Account
Deleted
Change
This report includes disables of Windows/Active Directory user accounts.
Management -
RPT2006- As needed
25-03.rpt
Windows/Active
Directory
Domains: User
Events - Account
Disabled
488
Appendix F: Report Tables
File
Title
Change
Description
This report includes enables of Windows/Active Directory user accounts.
Management -
name
Schedule
RPT2006- As needed
25-04.rpt
Windows/Active
Directory
Domains: User
Events - Account
Enabled
Change
This report includes user-driven disables of Windows/Active Directory user
RPT2006- As needed
Management -
accounts, such as a user triggering an excessive failed password limit.
25-05.rpt
Change
This report includes changes to Windows/Active Directory user account
RPT2006- As needed
Management -
properties, such as the display name.
25-06.rpt
Change
This report includes additions of Windows/Active Directory user accounts to
RPT2006- As needed
Management -
groups.
25-07.rpt
Change
This report includes additions of Windows/Active Directory user accounts to
RPT2006- As needed
Management -
Organizational Units.
25-08.rpt
Windows/Active
Directory
Domains: User
Events - Account
Lockout
Windows/Active
Directory
Domains: User
Events - Account
Properties
Updated
Windows/Active
Directory
Domains: User
Events - Added
To Group
Windows/Active
Directory
Domains: User
Events - Added
To OU
489
Table of Audit reports
File
Title
Description
name
Schedule
Change
This report includes removals of Windows/Active Directory user accounts
RPT2006- As needed
Management -
from groups.
25-09.rpt
Change
This report includes removals of Windows/Active Directory user accounts
RPT2006- As needed
Management -
from Organizational Units.
25-10.rpt
This report tracks file system activity associated with audited files and
RPT2003- Weekly
system objects, such as file access successes and failures.
05.rpt
Windows/Active
Directory
Domains: User
Events Removed From
Group
Windows/Active
Directory
Domains: User
Events Removed From
OU
File Audit Events
File Audit Events - File Attribute Change is a specific File Write event generated for the
RPT2003- As needed
File Attribute
modification of file attributes (including properties such as read-only status).
05-41.rpt
Change
These events may be produced by any tool that is used to monitor the
activity of file usage, including a Host-Based IDS and some Operating
Systems.
File Audit Events - File Audit events are used to track file activity on monitored network devices, RPT2003- As needed
File Audit
usually through the Operating System or a Host-Based IDS. These events
05-11.rpt
will note success or failure of the requested operation.
File Audit Events - File Audit Failure events are used to track failed file activity on monitored
RPT2003- As needed
File Audit Failure
05-12.rpt
network devices, usually through the Operating System or a Host-Based
IDS. These events will note what requested operation failed.
File Audit Events - File Create is a specific File Write event generated for the initial creation of a
RPT2003- As needed
File Create
05-42.rpt
file. These events may be produced by any tool that is used to monitor the
activity of file usage, including a Host-Based IDS and some Operating
Systems.
490
Appendix F: Report Tables
File
Title
Description
name
Schedule
File Audit Events - File Data Read is a specific File Read event generated for the operation of
RPT2003- As needed
File Data Read
05-31.rpt
reading data from a file (not just properties or status of a file). These events
may be produced by any tool that is used to monitor the activity of file usage,
including a Host-Based IDS and some Operating Systems.
File Audit Events - File Data Write is a specific File Write event generated for the operation of
File Data Write
RPT2003- As needed
writing data to a file (not just properties or status of a file). These events may 05-43.rpt
be produced by any tool that is used to monitor the activity of file usage,
including a Host-Based IDS and some Operating Systems.
File Audit Events - File Delete is a specific File Write event generated for the deletion of an
RPT2003- As needed
File Delete
05-44.rpt
existing file. These events may be produced by any tool that is used to
monitor the activity of file usage, including a Host-Based IDS and some
Operating Systems.
File Audit Events - File Execute is a specific File Read event generated for the operation of
RPT2003- As needed
File Execute
05-32.rpt
executing files. These events may be produced by any tool that is used to
monitor the activity of file usage, including a Host-Based IDS and some
Operating Systems.
File Audit Events - File Handle Audit events are used to track file handle activity on monitored
RPT2003- As needed
File Handle Audit
05-21.rpt
network devices, usually through low level access to the Operating System,
either natively or with or a Host-Based IDS. These events will note success
or failure of the requested operation.
File Audit Events - File Handle Close is a specific File Handle Audit event generated for the
RPT2003- As needed
File Handle Close closing of file handles. These events may be generated by a tool that has
05-22.rpt
low-level file access, such as an Operating System or some Host-Based
IDS'.
File Audit Events - File Handle Copy is a specific File Handle Audit event generated for the
RPT2003- As needed
File Handle Copy
05-23.rpt
copying of file handles. These events may be generated by a tool that has
low-level file access, such as an Operating System or some Host-Based
IDS'.
File Audit Events - File Handle Open is a specific File Handle Audit event generated for the
RPT2003- As needed
File Handle Open
05-24.rpt
opening of file handles. These events may be generated by a tool that has
low-level file access, such as an Operating System or some Host-Based
IDS'.
File Audit Events - File Link is a specific File Write event generated for the creation, deletion, or
RPT2003- As needed
File Link
05-45.rpt
modification of links to other files. These events may be produced by any
tool that is used to monitor the activity of file usage, including a Host-Based
IDS and some Operating Systems.
491
Table of Audit reports
File
Title
Description
name
Schedule
File Audit Events - File Move is a specific File Write event generated for the operation of
RPT2003- As needed
File Move
05-46.rpt
moving a file that already exists. These events may be produced by any tool
that is used to monitor the activity of file usage, including a Host-Based IDS
and some Operating Systems.
File Audit Events - File Read is a specific File Audit event generated for the operation of
RPT2003- As needed
File Read
05-33.rpt
reading files (including reading properties of a file or the status of a file).
These events may be produced by any tool that is used to monitor the
activity of file usage, including a Host-Based IDS and some Operating
Systems.
File Audit Events - File Write is a specific File Audit event generated for the operation of writing
RPT2003- As needed
File Write
05-47.rpt
to a file (including writing properties of a file or changing the status of a file).
These events may be produced by any tool that is used to monitor the
activity of file usage, including a Host-Based IDS and some operating
systems.
File Audit Events - Object Audit events are used to track special object activity on monitored
RPT2003- As needed
Object Audit
05-51.rpt
network devices, usually through the Operating System or a Host-Based
IDS. Generally, Objects are special types of system resources, such as
registry items or user account databases. These objects may be actual 'files'
on the system, but are not necessarily human readable. These events will
note success or failure of the requested operation.
File Audit Events - Object Audit Failure events are used to track special object activity on
RPT2003- As needed
Object Audit
monitored network devices, usually through the Operating System or a
05-52.rpt
Failure
Host-Based IDS. Generally, Objects are special types of system resources,
such as registry items or user account databases. These objects may be
actual 'files' on the system, but are not necessarily human readable. These
events will note a failure of the requested operation.
File Audit Events - Object Delete is a specific Object Audit event generated for the deletion of
RPT2003- As needed
Object Delete
05-53.rpt
an existing object. These events may be produced by any tool that is used to
monitor the activity of file and object usage, including a Host-Based IDS and
some Operating Systems.
File Audit Events - Object Link is a specific Object Audit event generated for the creation,
RPT2003- As needed
Object Link
05-54.rpt
deletion, or modification of links to other objects. These events may be
produced by any tool that is used to monitor the activity of file and object
usage, including a Host-Based IDS and some Operating Systems.
492
Appendix F: Report Tables
File
Title
Incident Events
Description
name
Schedule
This report tracks the Incident, HostIncident, HybridIncident and
RPT2006- Daily
NetworkIncident events that have been generated to reflect enterprise-
19.rpt
wide issues.
Inferred Events
Inferred Events
This report tracks events that are triggered by correlations built in the
RPT2006- As needed
SolarWinds Rule Builder.
27.rpt
This report tracks events that are triggered by correlations, and orders
RPT2006- As needed
by Inference Rule them by the correlation rule name.
27-01.rpt
Log
Track activity associated with account events such as log on, log off and log
RPT2003- Weekly
On/Off/Failure
on failures. This is a refined version of the Authentication Report that does
03.rpt
not include SolarWinds authentication events. It is more appropriate for
management reports or audit reviews than regular use.
Network Traffic
Track activity associated with network traffic audit events such as TCP, IP
RPT2003- Daily, if
Audit
and UDP events. Specifically, this report tracks regular network traffic
06.rpt
needed
activity, such as encrypted traffic, web traffic, and other forms of UDP, TCP
and ICMP traffic. It gives you both an overview and some details of exactly
what is flowing through your network. This report can be quite large.
Network Traffic
ApplicationTrafficAudit events reflect network traffic that is mostly or all
Audit - Application application-layer data. Events that are children of ApplicationTrafficAudit
Traffic
RPT2003- As needed
06-11.rpt
are also related to application-layer resources. Events placed in the parent
ApplicationTrafficAudit event itself are known to be application-related, but
are not able to be further categorized based on the message provided by
the tool or because they are uncommon and rarely, if ever, imply network
attack potential.
Network Traffic
This report lists all Application Traffic events (such as WebTrafficAudit),
RPT2003- As needed
Audit - Application grouped by destination machine/IP.
06-11-
Traffic by
2.rpt
Destination
Machine
Network Traffic
This report lists all Application Traffic events (such as WebTrafficAudit),
RPT2033- As needed
Audit - Application grouped by provider SID.
06-11-
Traffic by
3.rpt
Provider SID
Network Traffic
This report lists all Application Traffic events (such as WebTrafficAudit),
RPT2003- As needed
Audit - Application grouped by source machine/IP.
06-11-
Traffic by Source
1.rpt
Machine
493
Table of Audit reports
File
Title
Network Traffic
Description
This report lists all Application Traffic events (such as WebTrafficAudit),
name
Schedule
RPT2003- As needed
Audit - Application grouped by the SolarWinds sensor tool alias that reported each event.
06-11-
Traffic by Tool
0.rpt
Alias
Network Traffic
Configuration Traffic Audit events reflect application-layer data related to
RPT2003- As needed
Audit -
configuration of network resources. Included in ConfigurationTrafficAudit
06-02.rpt
Configuration
are protocols such as DHCP, BootP, and SNMP. ConfigurationTrafficAudit
Traffic
events generally indicate normal traffic, however, events of this type could
also be symptoms of misconfiguration, inappropriate usage, attempts to
enumerate or access network devices or services, attempts to access
devices that are configured via these services, or other abnormal traffic.
Network Traffic
CoreTrafficAudit events reflect network traffic sent over core protocols.
RPT2003- As needed
Audit -
Events that are children of CoreTrafficAudit are all related to the TCP, IP,
06-03.rpt
Core Traffic
UDP, and ICMP protocols. Events of this type and its children do not have
any application-layer data. Events placed in the parent CoreTrafficAudit
event itself are known to be a core protocol, but are not able to be further
categorized based on the message provided by the tool.
Network Traffic
This report lists all Core Traffic events (such as TCPTrafficAudit), grouped
RPT2003- As needed
Audit - Core
by destination machine/IP.
06-03-
Traffic by
2.rpt
Destination
Machine
Network Traffic
This report lists all Core Traffic events (such as TCPTrafficAudit), grouped
RPT2003- As needed
Audit - Core
by provider SID.
06-03-
Traffic by
3.rpt
Provider SID
Network Traffic
This report lists all Core Traffic events (such as TCPTrafficAudit), grouped
RPT2003- As needed
Audit - Core
by source machine/IP.
06-03-
Traffic by Source
1.rpt
Network Traffic
This report lists all Core Traffic events (such as TCPTrafficAudit), grouped
RPT2003- As needed
Audit - Core
by the SolarWinds tool sensor alias that reported the event.
06-03-
Traffic by Tool
0.rpt
Alias
494
Appendix F: Report Tables
File
Title
Description
name
Schedule
Network Traffic
Encrypted Traffic Audit events reflect application-layer traffic that has been
RPT2003- As needed
Audit - Encrypted
encrypted and is intended for a secure host. Included in Encrypted Traffic
06-04.rpt
Traffic
Audit are client and server side application events, such as key exchanges,
that normally occur after the low-level session creation and handshaking
have completed.
Network Traffic
Link Control Traffic Audit events are generated for network events related
Audit -
to link level configuration. Link Control Traffic Audit events generally indicate 06-05.rpt
RPT2003- As needed
Link Control
normal traffic, however, events of this type could also be symptoms of
Traffic
misconfiguration at the link level, inappropriate usage, or other abnormal
traffic.
Network Traffic
Members of the Network Audit tree are used to define events centered on
RPT2003- As needed
Audit - Network
usage of network resources/bandwidth.
06-06.rpt
Network Traffic
Point To Point Traffic Audit events reflect application-layer data related to
RPT2003- As needed
Audit -
point-to-point connections between hosts. Included in Point To Point Traffic
06-07.rpt
Point to Point
Audit are encrypted and unencrypted point-to-point traffic.
Traffic
Traffic
Network Traffic
Remote Procedure Traffic Audit events reflect application-layer data
RPT2003- As needed
Audit - Remote
related to remote procedure services. Included in Remote Procedure
06-08.rpt
Procedure Traffic Traffic Audit are the traditional RPC services used to service remote logons
and file shares, and other services which require remote procedure access
to complete authentication, pass data, or otherwise communicate.
RemoteProcedureTrafficAudit events generally indicate normal traffic for
networks that have remote procedure services on their network; however,
events of this type could also be symptoms of inappropriate access,
misconfiguration of the remote procedure services, errors in the remote
procedure calls, or other abnormal traffic.
Network Traffic
Routing Traffic Audit events are generated for network events related to
RPT2003- As needed
Audit - Routing
configuration of network routes, using protocols such as IGMP, IGRP, and
06-09.rpt
Traffic
RIP. RoutingTrafficAudit events generally indicate normal traffic, however,
events of this type could also be symptoms of misconfigured routing,
unintended route configuration, or other abnormal traffic.
Network Traffic
Time Traffic Audit events reflect application-layer data related to network
RPT2003- As needed
Audit -
time configuration. Included in TimeTrafficAudit are protocols such as NTP
06-10.rpt
Time Traffic
and activities, such as detection of client-side network time updates.
495
Table of Audit reports
File
Title
Description
name
Schedule
Network Traffic
This report lists the Top Application Traffic events (such as
RPT2003- As needed
Audit -
WebTrafficAudit), grouped by source machine/IP.
06-01-
Top Application
2.rpt
Traffic by Source
Network Traffic
This report lists the Top Core Traffic events (such as TCPTrafficAudit),
RPT2003- As needed
Audit -
grouped by source machine/IP.
06-03-
Top Core Traffic
2.rpt
by Source
Network Traffic
WebTrafficAudit events reflect application-layer data related to web
RPT2003- As needed
Audit -
services. Included in WebTrafficAudit are client and server web events from
06-01.rpt
Web Traffic
web servers, web applications, content filter related events, and other web
services. WebTrafficAudit events generally indicate normal traffic, however,
events of this type could also be symptoms of inappropriate web usage,
potential abuse of web services, or other abnormal traffic.
Network Traffic
This report lists all WebTrafficAudit events grouped by destination
RPT2003- As needed
Audit - Web
machine/IP.
06-01-
Traffic by
2.rpt
Destination
Machine
Network Traffic
This report lists Web Traffic Audit events grouped by provider SID.
RPT2003- As needed
Audit -
06-01-
Web Traffic by
3.rpt
Provider SID
Network Traffic
This report lists all WebTrafficAudit events grouped by source machine/IP.
RPT2003- As needed
Audit - Web
06-01-
Traffic by Source
1.rpt
Machine
Network Traffic
This report lists Web Traffic Audit events grouped by tool alias.
RPT2003- As needed
Audit -
06-01-
Web Traffic by
0.rpt
Tool Alias
Network Traffic
This report lists the most frequently visited URLs grouped by the requesting
RPT2003- As needed
Audit -
client source machine.
06-01-
Web URL
5.rpt
Requests by
Source Machine
496
Appendix F: Report Tables
File
Title
Description
name
Schedule
Network Traffic
This report shows graphs of the most frequently visited URLs for each client
RPT2003- As needed
Audit -
source machine.
06-01-
Web URL
4.rpt
Requests by
Source Machine Graphs
Resource
The Resource Configuration report details events that relate to
RPT2003- Weekly
Configuration
configuration of user accounts, machine accounts, groups, policies and their 08.rpt
relationships. Items such as domain or group modification, policy changes,
and creation of new network resources.
Resource
Events that are part of the Auth Audit tree are related to authentication and
RPT2003- As needed
Configuration -
authorization of accounts and account ''containers'' such as groups or
08-01.rpt
Authorization
domains. These events can be produced from any network node including
Audit
firewalls, routers, servers, and clients.
Resource
Domain Auth Audit events are authentication, authorization, and
RPT2003- As needed
Configuration -
modification events related only to domains, subdomains, and account
08-02.rpt
Domain
containers. These events are normally operating system related, however
Authorization
could be produced by any network device.
Audit
Resource
Group Audit events are authentication, authorization, and modification
RPT2003- As needed
Configuration -
events related only to account groups. These events are normally operating 08-03.rpt
Group Audit
system related, however could be produced by any network device.
Resource
Machine Auth Audit events are authentication, authorization, and
RPT2003- As needed
Configuration -
modification events related only to computer or machine accounts. These
08-04.rpt
Machine
events can be produced from any network node including firewalls, routers,
Authorization
servers, and clients, but are normally operating system related.
Audit
Resource
Policy Audit events are used to track access, modification, scope change,
RPT2003- As needed
Configuration -
and creation of authentication, domain, account, and account container
08-06.rpt
Policy Audit
policies. Many of these events reflect normal system traffic. Most PolicyAudit
events are provided by the Operating System.
Resource
User Auth Audit events are authentication, authorization, and modification
RPT2003- As needed
Configuration -
events related only to user accounts. These events can be produced from
08-05.rpt
User
any network node including firewalls, routers, servers, and clients.
Authorization
Audit
497
Table of Security reports
Table of Security reports
The following table lists and describes each of the security reports. For your convenience, the reports
are listed alphabetically by title.
File
Title
Description
name
Schedule
Authentication Failed Authentication events occur when a user has made several attempts to
RPT2003- As needed
Report -
authenticate themselves which has continuously failed, or when a logon failure
02-1.rpt
Failed
is serious enough to merit a security event on a single failure.
Authentication
Authentication This report shows logins to various Guest accounts.
RPT2003- As needed
Report -
02-2.rpt
Guest Login
Authentication Restricted Information Attempt events describe a user attempt to access local
RPT2003- As needed
Report -
or remote information that their level of authorization does not allow. These
02-3.rpt
Restricted
events may indicate user attempts to exploit services which they are denied
Information
access to or inappropriate access attempts to information.
Attempt
Authentication Restricted Service Attempt events describe a user attempt to access a local or
RPT2003- As needed
Report -
remote service that their level of authorization does not allow. These events
02-4.rpt
Restricted
may indicate user attempts to exploit services which they are denied access to
Service
or inappropriate access attempts to services.
Attempt
Console
The Console report shows every event that passes through the system in the
RPT2003- As needed
given time interval. It mimics the basic management console view. It does not
10.rpt
contain the same level of field detail, but it is useful to get a quick snapshot of
activity for a period, a lunch hour, for example.This report can be very large, so
you will only want to run for small time intervals, such as hours.
Console -
An overview of all events during the specified time range. Shows graphs of the
RPT2003- As needed
Overview
most common generic event field data from the console report.
10-00.rpt
Event
Event Summary Sub Report - Attack Behavior Statistics
RPT2003- As needed
Summary -
01-02.rpt
Attack
Behavior
Statistics
498
Appendix F: Report Tables
File
Title
Event
Description
name
Event Summary Sub Report - Authorization Audit Statistics
Summary -
Schedule
RPT2003- As needed
01-03.rpt
Authorization
Audit Statistics
Event
The event summary report gathers statistical data from all major event
RPT2003- Daily
Summary -
categories, summarizes it with a one-hour resolution, and presents a quick,
01.rpt
Graphs
graphical overview of activity on your network.
Event
Event Summary Sub Report - Machine Audit Statistics
Summary -
RPT2003- As needed
01-05.rpt
Machine Audit
Statistics
Event
Event Summary Sub Report - Policy Audit Statistics
Summary -
RPT2003- As needed
01-06.rpt
Policy Audit
Statistics
Event
Event Summary Sub Report - Resource Audit Statistics
Summary -
RPT2003- As needed
01-07.rpt
Resource
Audit Statistics
Event
Event Summary Sub Report - Suspicious Behavior Statistics
Summary -
RPT2003- As needed
01-08.rpt
Suspicious
Behavior
Statistics
Event
Event Summary Sub Report - Top Level Statistics
Summary -
RPT2003- As needed
01-01.rpt
Top Level
Statistics
Machine Audit Track activity associated with machine process and service audit events. This
report shows machine-level events such as software installs, patches, system
RPT2003- Weekly
09.rpt
shutdowns, and reboots. It can be used to assist in software license compliance
auditing by providing records of installs.
Machine Audit This report tracks activity associated with file system audit events including
RPT2003- As needed
-
mount file system and unmount file system events. These events are generally
09-010.rpt
File System
normal system activity, especially during system boot.
Audit
499
Table of Security reports
File
Title
Description
name
Schedule
Machine Audit Mount File System events are a specific type of File System Audit that reflect the RPT2003- As needed
- File System
action of creating an active translation between hardware to a usable files
Audit - Mount
ystem. These events are generally normal during system boot.
09-012.rpt
File System
Machine Audit Unmount File System events are a specific type of File System Audit that reflect
RPT2003- As needed
- File System
the action of removing a translation between hardware and a usable files
09-013.rpt
Audit -
ystem. These events are generally normal during system shutdown.
Unmount File
System
Machine Audit This report tracks activity related to processes, including processes that have
RPT2003- As needed
- Process
09-030.rpt
started, stopped, or reported useful process-related information.
Audit
Machine Audit This report lists Process Audit events that are generated to track launch, exit,
RPT2003- As needed
- Process
status, and other events related to system processes. Usually, these events
09-031.rpt
Audit -
reflect normal system activity. Process-related activity that may indicate a failure
Process Audit
will be noted separately from normal activity in the event detail.
Machine Audit Process Info is a specific type of Process Audit event that reflects information
RPT2003- As needed
- Process
related to a process. Most of these events can safely be ignored, as they are
09-032.rpt
Audit -
generally normal activity that does not reflect a failure or abnormal state.
Process Info
Machine Audit Process Start is a specific type of Process Audit event that indicates a new
RPT2003- As needed
- Process
process has been launched. Usually, Process Start reflects normal system
09-033.rpt
Audit -
activity.
Process Start
Machine Audit Process Stop is a specific type of Process Audit event that indicates a process
RPT2003- As needed
- Process
has exited. Usually, Process Stop reflects normal application exit, however in
09-034.rpt
Audit -
the event of an unexpected error the abnormal state will be noted.
Process Stop
Machine Audit Process Warning is a specific type of Process Audit event that indicates a
RPT2003- As needed
- Process
process has returned a 'Warning' message that is not a fatal error and may not
09-035.rpt
Audit -
have triggered an exit of the process.
Process
Warning
Machine Audit This report tracks activity related to services, including services that have
RPT2003- As needed
- Service Audit started, stopped, or reported useful service-related information or warnings.
09-040.rpt
500
Appendix F: Report Tables
File
Title
Description
name
Schedule
Machine Audit This report tracks ServiceInfo events, which reflect information related to a
RPT2003- As needed
- Service Audit particular service. Most of these events can safely be ignored, as they are
09-041.rpt
- Service Info
generally normal activity that does not reflect a failure or abnormal state.
Machine Audit This report tracks ServiceStart events, which indicate that a new system service RPT2003- As needed
- Service Audit is starting.
09-042.rpt
- Service Start
Machine Audit This report tracks ServiceStop events, which indicate that a system service is
RPT2003- As needed
- Service Audit stopping. This activity is generally normal, however, in the event of an
09-043.rpt
- Service Stop
unexpected stop the abnormal state will be noted.
Machine Audit This report lists ServiceWarning events. These events indicate a service has
RPT2003- As needed
- Service Audit returned a “'Warning” message that is not a fatal error and may not have
09-044.rpt
- Service
triggered an exit of the service.
Warning
Machine Audit This report tracks activity associated with system status and modifications,
RPT2003- As needed
- System Audit including software changes, system reboots, and system shutdowns.
09-020.rpt
Machine Audit Machine Audit events are used to track hardware or software status and
RPT2003- As needed
- System Audit modifications. These events are generally acceptable, but do indicate
09-021.rpt
- Machine
modifications to the client system that may be noteworthy.
Audit
Machine Audit SoftwareInstall events reflect modifications to the system at a software level,
RPT2003- As needed
- System Audit generally at the operating system level (or equivalent, in the case of a network
09-025.rpt
- Software
infrastructure device). These events are generated when a user updates a
Install
system or launches system-native methods to install third party applications.
Machine Audit SoftwareUpdate is a specific type of SoftwareInstall that reflects a more current
RPT2003- As needed
- System Audit version of software being installed to replace an older version.
09-026.rpt
- Software
Update
Machine Audit System Reboot events occur on monitored network devices (servers, routers,
RPT2003- As needed
- System Audit etc.) and indicate that a system has restarted.
09-022.rpt
- System
Reboot
Machine Audit System shutdown events occur on monitored network devices (servers,
RPT2003- As needed
- System Audit routers, etc.) and indicate that a system has been shutdown.
09-023.rpt
- System
Shutdown
501
Table of Security reports
File
Title
Description
name
Schedule
Machine Audit SystemStatus events reflect general system state events. These events are
RPT2003- As needed
- System Audit generally normal and informational, however, they could potentially reflect a
09-024.rpt
- System
failure or issue which should be addressed.
Status
Machine Audit This report tracks activity associated with USB-Defender, including insertion
RPT2003- As needed
-
and removal events related to USB Mass Storage devices.
09-050.rpt
Malicious
This report tracks event activity associated with malicious code such as virus,
RPT2003- Weekly
Code
Trojans, and worms, both on the network and on local machines, as detected
04.rpt
USBDefender
by anti-virus software.
Malicious
Members of the Service Process Attack tree are used to define events centered RPT2003- As needed
Code -
on malicious or abusive usage of services or user processes. These events
Service
include abuse or misuse of resources from malicious code placed on the client
Process
system.
04-01.rpt
Attack
Malicious
Trojan Command Access events reflect malicious or abusive usage of network
RPT2003- As needed
Code - Trojan
resources where the intention, or the result, is gaining access to resources
04-05.rpt
Command
through malicious code commonly known as Trojan Horses. This event detects
Access
the communication related to Trojans sending commands over the network
(infecting other clients, participating in a denial of service activity, being
controlled remotely by the originator, etc.). Trojans are generally executables
that generally require no user intervention to spread and contain malicious code
that is placed on the client system and used to exploit the client (and return
access to the originator of the attack) or exploit other clients (used in attacks
such as distributed denial of service attacks).
Malicious
Trojan Infection Access events reflect malicious or abusive usage of network
RPT2003- As needed
Code - Trojan
resources where the intention, or the result, is gaining access to resources
04-04.rpt
Infection
through malicious code commonly known as a Trojan Horse. This event detects
Access
the infection traffic related to a Trojan entering the network (generally with
intent to infect a client). Trojans are generally executables that generally require
no user intervention to spread and contain malicious code that is placed on the
client system and used to exploit the client (and return access to the originator of
the attack) or exploit other clients (used in attacks such as distributed denial of
service attacks).
502
Appendix F: Report Tables
File
Title
Description
name
Schedule
Malicious
Trojan Traffic Access events reflect malicious or abusive usage of network
RPT2003- As needed
Code - Trojan
resources where the intention, or the result, is gaining access to resources
04-02.rpt
Traffic Access through malicious code commonly known as a Trojan Horse. This event detects
the communication related to Trojans over the network (generally, 'trojaned'
clients calling home to the originator). Trojans are generally executables that
generally require no user intervention to spread and contain malicious code that
is placed on the client system and used to exploit the client (and return access to
the originator of the attack) or exploit other clients (used in attacks such as
distributed denial of service attacks).
Malicious
Trojan Traffic Denial events are a specific type of Denial event where the
Code Report - transport of the malicious or abusive usage originates with malicious code on a
Trojan Traffic
client system known as a Trojan. The intent, or the result, of this activity is
Denial
inappropriate or abusive access to network resources through a denial of
RPT2003- As needed
04-03.rpt
service attack. Trojan Traffic Denial events may be attempts to exploit
weaknesses in software to gain access to a host system, attempts to exploit
weaknesses in network infrastructure equipment to enumerate or reconfigure
devices, attempts to spread the Trojan to other hosts, or other denial of service
activities.
Malicious
Virus Attack events reflect malicious code placed on a client or server system,
Code Report - which may lead to system or other resource compromise and may lead to
Virus Attack
RPT2003- As needed
04-06.rpt
further attack. The severity of this event will depend on the ActionTaken field,
which reflects whether the virus or other malicious code was successfully
removed.
Malicious
Virus Summary Attack events reflect malicious code placed on a client or server
Code Report - system, which may lead to system or other resource compromise and may lead
Virus
to further attack. The severity of this event will depend on the Action Taken field
Summary
which reflects whether the virus or other malicious code was successfully
Attack
removed. These events differ from Virus Attack in that they may be a composite
RPT2003- As needed
04-07.rpt
of virus events normally due to a scheduled scan on the client system as
opposed to a real-time scan
Malicious
Virus Traffic Access events reflect malicious or abusive usage of network
Code Report - resources where the intention, or the result, is gaining access to resources
Virus Traffic
through malicious code commonly known as viruses. This event detects the
Access
communication related to viruses over the network (generally, the spread of a
virus infection or an incoming virus infection). Viruses are generally executables
that require user intervention to spread, contain malicious code that is placed on
the client system, and are used to exploit the client and possibly spread itself to
other clients.
503
RPT2003- As needed
04-08.rpt
Table of Security reports
File
Title
Network
Description
name
This report tracks activity associated with top-level NetworkAttack events.
Events: Attack
Schedule
RPT2003- As needed
11-00.rpt
Behavior
Network
This report shows malicious asset access via the network. For example, attacks RPT2003- Weekly
Events: Attack on FTP or Windows Network servers, malicious network database access,
Behavior -
11.rpt
abuses of services, or attempted unauthorized entry.
Access
Network
Children of the Access tree define events centered on malicious or abusive
Events: Attack usage of network bandwidth/traffic where the intention, or the result, is
Behavior -
RPT2003- As needed
11-01.rpt
inappropriate or abusive access to network resources.
Access Access
Network
Application Access events reflect malicious or abusive usage of network
Events: Attack resources where the intention, or the result, is gaining access to resources
Behavior -
where the related data is mostly or all application-layer. Generally,
Access -
ApplicationAccess events will reflect attempted exploitation of weaknesses in
Application
server or client software, or information that is restricted/prohibited by device
Access
access control or policy.
Network
Configuration Access events reflect malicious or abusive usage of network
Events: Attack resources where the intention, or the result, is gaining access to resources via
Behavior -
resource configuration traffic (using protocols such as DHCP, BootP, and
Access -
SNMP). Generally, these events will reflect attempted exploitation of
Configuration
weaknesses in the configuration server or client software or attempts to gain
Access
system-level access to configuration servers themselves. In the case of SNMP
RPT2003- As needed
11-02.rpt
RPT2003- As needed
11-03.rpt
and similar configuration protocols, it could reflect an attempt to enumerate a
device or devices on the same network for further attack.
Network
Core Access events reflect malicious or abusive usage of network resources
Events: Attack where the intention, or the result, is gaining access to resources where the
Behavior -
related data is mostly or all core protocols (TCP, UDP, IP, ICMP). Generally,
Access - Core
CoreAccess events will reflect attempted exploitation of weaknesses in network
Access
protocols or devices with intent to gain access to servers, clients, or network
RPT2003- As needed
11-04.rpt
infrastructure devices.
Network
Database Access events reflect malicious or abusive usage of network
Events: Attack resources where the intention, or the result, is gaining access to resources via
Behavior -
application-layer database traffic. Generally, these events will reflect attempted
Access -
exploitation of weaknesses in database server or client software.
Database
Access
504
RPT2003- As needed
11-05.rpt
Appendix F: Report Tables
File
Title
Network
Description
name
File System Access events reflect malicious or abusive usage of network
Events: Attack resources where the intention, or the result, is gaining access to resources via
Behavior -
remote filesystem traffic (using protocols such as SMB and NFS). Generally,
Access - File
these events will reflect attempted exploitation of weaknesses in the remote
System
filesystem server or client software or attempts to gain system-level access to
Access
remote filesystem servers themselves.
Network
File Transfer Access events reflect malicious or abusive usage of network
Events: Attack resources where the intention, or the result, is gaining access to resources via
Behavior -
application-layer file transfer traffic. Generally, these events will reflect
Access - File
attempted exploitation of weaknesses in file transfer server or client software.
Schedule
RPT2003- As needed
11-06.rpt
RPT2003- As needed
11-07.rpt
Transfer
Network
Link Control Access events reflect malicious or abusive usage of network
Events: Attack resources where the intention, or the result, is gaining access to resources
Behavior -
where the related data is low-level link control (using protocols such as ARP).
Access - Link
Generally, Link Control Access events will reflect attempted exploitation of
Control
weaknesses in switching devices by usage of malformed incoming or outgoing
Access
data, with intent to enumerate or gain access to or through switching devices,
RPT2003- As needed
11-08.rpt
clients that are also on the switching device, and entire networks attached to the
switching device. In some cases, a managed switch with restrictions on port
analyzing activity may be forced into an unmanaged switch with no restrictions allowing a malicious client to sniff traffic and enumerate or attack.
Network
Mail Access events reflect malicious or abusive usage of network resources
Events: Attack where the intention, or the result, is gaining access to resources via applicationBehavior -
layer mail transfer, retrieval, or service traffic. Generally, these events will reflect
Access - Mail
attempted exploitation of weaknesses in mail-related server or client software.
RPT2003- As needed
11-09.rpt
Access
Network
Naming Access events reflect malicious or abusive usage of network resources
Events: Attack where the intention, or the result, is gaining access to resources via applicationBehavior -
layer naming service traffic (using protocols such as DNS and WINS).
Access -
Generally, these events will reflect attempted exploitation of weaknesses in the
Naming
naming server or client software.
RPT2003- As needed
11-10.rpt
Access
Network
News Access events reflect malicious or abusive usage of network resources
Events: Attack where the intention, or the result, is gaining access to resources via applicationBehavior -
layer news traffic (over protocols such as NNTP). Generally, these events will
Access -
reflect attempted exploitation of weaknesses in the news server or client
News Access
software.
505
RPT2003- As needed
11-11.rpt
Table of Security reports
File
Title
Network
Description
name
Point To Point Access events reflect malicious or abusive usage of network
Events: Attack resources where the intention, or the result, is gaining access to resources via
Behavior -
point to point traffic (using protocols such as PPTP). Generally, these events will
Access - Point
reflect attempted exploitation of weaknesses in point to point server or client
to Point
software, attempts to enumerate networks, or attempts to further attack
Access
devices on trusted networks.
Network
Printer Access events reflect malicious or abusive usage of network resources
Events: Attack where the intention, or the result, is gaining access to resources via applicationBehavior -
layer remote printer traffic. Generally, these events will reflect attempted
Access -
exploitation of weaknesses in the remote printer server or client software.
Schedule
RPT2003- As needed
11-12.rpt
RPT2003- As needed
11-13.rpt
Printer Access
Network
Remote Console Access events reflect malicious or abusive usage of network
Events: Attack resources where the intention, or the result, is gaining access to resources via
Behavior -
application-layer remote console service traffic (services such as telnet, SSH,
Access -
and terminal services). Generally, these events will reflect attempted
Remote
exploitation of weaknesses in the remote console server or client software.
RPT2003- As needed
11-14.rpt
Console
Access
Network
Remote Procedure Access events reflect malicious or abusive usage of
Events: Attack network resources where the intention, or the result, is gaining access to
Behavior -
resources via remote procedure call traffic (using protocols such as the
Access -
traditional RPC services, RMI, and CORBA). Generally, these events will reflect
Remote
attempted exploitation of weaknesses in the remote procedure server or client
Procedure
software or attempts to gain system-level access to remote procedure servers
Access
themselves.
Network
Routing Access events reflect malicious or abusive usage of network resources
Events: Attack where the intention, or the result, is gaining access to resources where the
Behavior -
related data is routing-related protocols (RIP, IGMP, etc.). Generally, Routing
Access -
Access events will reflect attempted exploitation of weaknesses in routing
Routing
protocols or devices with intent to enumerate or gain access to or through
Access
routers, servers, clients, or other network infrastructure devices. These routing
RPT2003- As needed
11-15.rpt
RPT2003- As needed
11-16.rpt
protocols are used to automate the routing process between multiple devices
that share or span networks.
Network
Time Access events reflect malicious or abusive usage of network resources
Events: Attack where the intention, or the result, is gaining access to resources via applicationBehavior -
layer remote time service traffic (using protocols such as NTP). Generally,
Access - Time
these events will reflect attempted exploitation of weaknesses in the remote
Access
time server or client software.
506
RPT2003- As needed
11-17.rpt
Appendix F: Report Tables
File
Title
Network
Description
name
Virus Traffic Access events reflect malicious or abusive usage of network
Events: Attack resources where the intention, or the result, is gaining access to resources
Behavior -
Schedule
RPT2003- As needed
11-19.rpt
through malicious code commonly known as viruses. Generally, these events
Access - Virus will reflect attempted exploitation of weaknesses in the web server or client
Traffic Access software.
Network
Web Access events reflect malicious or abusive usage of network resources
Events: Attack where the intention, or the result, is gaining access to resources via applicationBehavior -
layer WWW traffic. Generally, these events will reflect attempted exploitation of
Access - Web
weaknesses in the web server or client software.
RPT2003- As needed
11-18.rpt
Access
Network
Track activity associated with network denial or relay attack behaviors. This
Events: Attack report shows malicious asset relay attempts and denials of service via the
RPT2003- Weekly
12.rpt
Behavior -
network. For example, FTP bouncing, Distributed Denial of Service events, and
Denial / Relay
many protocol abuses.
Network
Application Denial events are a specific type of Denial event where the transport RPT2003- As needed
Events: Attack of the malicious or abusive usage is application-layer protocols. The intent, or
Behavior -
the result, of this activity is inappropriate or abusive access to network
Denial / Relay
resources through a denial of service attack. Application Denial events may be
- Application
attempts to exploit weaknesses in software to gain access to a host system,
Denial
attempts to exploit weaknesses in network infrastructure equipment to
12-01.rpt
enumerate or reconfigure devices, or other denial of service activities.
Network
Configuration Denial events are a specific type of Denial event where the
Events: Attack transport of the malicious or abusive usage is protocols related to configuration
Behavior -
of resources (DHCP, BootP, SNMP, etc.). The intent, or the result, of this
Denial / Relay
activity is inappropriate or abusive access to network resources through a
-
denial of service attack. ConfigurationDenial events may be attempts to exploit
Configuration
weaknesses in configuration-related software to gain access to a host system,
Denial
attempts to exploit weaknesses in network infrastructure equipment to
RPT2003- As needed
12-02.rpt
enumerate or reconfigure devices, or other denial of service activities.
Network
Core Denial events are a specific type of Denial event where the transport of
Events: Attack the malicious or abusive usage is core protocols (TCP, IP, ICMP, UDP). The
Behavior -
intent, or the result, of this activity is inappropriate or abusive access to network
Denial / Relay
resources through a denial of service attack. Core Denial events may be
- Core Denial
attempts to exploit weaknesses in software to gain access to a host system,
attempts to exploit weaknesses in network infrastructure equipment to
enumerate or reconfigure devices, or other denial of service activities.
507
RPT2003- As needed
12-03.rpt
Table of Security reports
File
Title
Network
Description
name
Children of the Denial tree define events centered on malicious or abusive
Events: Attack usage of network bandwidth/traffic where the intention, or the result, is
Behavior -
inappropriate or abusive access to network resources through a denial of
Denial / Relay
service attack.
Schedule
RPT2003- As needed
12-04.rpt
- Denial
Network
File System Denial events are a specific type of Denial event where the
Events: Attack transport of the malicious or abusive usage is remote filesystem-related
Behavior -
protocols (NFS, SMB, etc.). The intent, or the result, of this activity is
Denial / Relay
inappropriate or abusive access to network resources through a denial of
- File System
service attack. File System Denial events may be attempts to exploit
Denial
weaknesses in remote filesystem services or software to gain access to a host
RPT2003- As needed
12-05.rpt
system, attempts to exploit weaknesses in network infrastructure equipment to
enumerate or reconfigure devices, or other denial of service activities.
Network
File Transfer Denial events are a specific type of Denial event where the
Events: Attack transport of the malicious or abusive usage is application-layer file transferBehavior -
related protocols (FTP, TFTP, etc.). The intent, or the result, of this activity is
Denial / Relay
inappropriate or abusive access to network resources through a denial of
RPT2003- As needed
12-06.rpt
- File Transfer service attack. FileTransferDenial events may be attempts to exploit
Denial
weaknesses in file transfer-related software to gain access to a host system,
attempts to exploit weaknesses in the software to enumerate or reconfigure, or
other denial of service activities.
Network
Link Control Denial events are a specific type of Denial event where the
Events: Attack transport of the malicious or abusive usage is link level protocols (such as ARP).
Behavior -
The intent, or the result, of this activity is inappropriate or abusive access to
Denial / Relay
network resources through a denial of service attack. LinkControlDenial events
- Link Control
may be attempts to exploit weaknesses in link-level control software to gain
Denial
access to a host system, attempts to exploit weaknesses in network
RPT2003- As needed
12-07.rpt
infrastructure equipment to enumerate or reconfigure devices, or other denial
of service activities.
Network
MailDenial events are a specific type of Denial event where the transport of the
Events: Attack malicious or abusive usage is application-layer mail-related protocols (SMTP,
Behavior -
IMAP, POP3, etc.) or services (majordomo, spam filters, etc.). The intent, or the
Denial / Relay
result, of this activity is inappropriate or abusive access to network resources
- Mail Denial
through a denial of service attack. MailDenial events may be attempts to exploit
weaknesses in mail-related software to gain access to a host system, attempts
to exploit weaknesses in the software to enumerate or reconfigure, or other
denial of service activities.
508
RPT2003- As needed
12-08.rpt
Appendix F: Report Tables
File
Title
Network
Description
name
Children of the Relay tree define events centered on malicious or abusive
Events: Attack usage of network bandwidth/traffic where the intention, or the result, is relaying
Behavior -
inappropriate or abusive access to other network resources (either internal or
Denial / Relay
external). Generally, these attacks will have the perimeter or an internal host as
- Relay
their point of origin. When sourced from remote hosts, they may indicate a
Schedule
RPT2003- As needed
12-09.rpt
successful exploit of an internal or perimeter host.
Network
Remote Procedure Denial events are a specific type of Denial event where the
Events: Attack transport of the malicious or abusive usage is remote procedure-related
Behavior -
protocols (traditional RPC, RMI, CORBA, etc.) or service (portmapper, etc.).
Denial / Relay
The intent, or the result, of this activity is inappropriate or abusive access to
- Remote
network resources through a denial of service attack. RemoteProcedureDenial
Procedure
events may be attempts to exploit weaknesses in remote procedure services or
Denial
software to gain access to a host system, attempts to exploit weaknesses in the
RPT2003- As needed
12-10.rpt
software to enumerate or reconfigure, or other denial of service activities.
Network
Routing Denial events are a specific type of Denial event where the transport of
Events: Attack the malicious or abusive usage is routing-related protocols (RIP, IGMP, etc.).
Behavior -
The intent, or the result, of this activity is inappropriate or abusive access to
Denial / Relay
network resources through a denial of service attack. Routing Denial events
- Routing
may be attempts to exploit weaknesses in routers or routing software to gain
Denial
access to a host system, attempts to exploit weaknesses in the routing software
RPT2003- As needed
12-11.rpt
or service to enumerate or reconfigure, or other denial of service activities.
Network
Web Denial events are a specific type of Denial event where the transport of the RPT2003- As needed
Events: Attack malicious or abusive usage is application-layer web-related protocols (HTTP,
Behavior -
HTTPS, etc.) or services (CGI, ASP, etc.). The intent, or the result, of this
Denial / Relay
activity is inappropriate or abusive access to network resources through a
- Web Denial
denial of service attack. Web Denial events may be attempts to exploit
12-12.rpt
weaknesses in web-related software to gain access to a host system, attempts
to exploit weaknesses in the software to enumerate or reconfigure, or other
denial of service activities.
Network
Track activity associated with suspicious network behaviors such as
RPT2003- Weekly
Events:
reconnaissance or unusual traffic. Specifically, this report shows potentially
07.rpt
Suspicious
dangerous activity, such as excessive authentication failures, port scans, stack
Behavior
fingerprinting, and network enumerations.
509
Table of Security reports
File
Title
Description
name
Schedule
Network
Application Enumerate events reflect attempts to gather information about
RPT2003- As needed
Events:
target hosts, or services on target hosts, by sending active application-layer
07-01.rpt
Suspicious
data which will elicit responses that reveal information about the application or
Behavior -
host. This enumeration may be a LEMple command sent to the application to
Application
attempt to fingerprint what is allowed or denied by the service, requests to the
Enumerate
application which may enable an attacker to surmise the version and specific
application running, and other information gathering tactics. These
enumerations may result in information being provided that can allow an
attacker to craft a specific attack against the host or application that may work
correctly the first time - enabling them to modify their methodology to go on
relatively undetected.
Network
Banner Grabbing Enumerate events reflect attempts to gather information
RPT2003- As needed
Events:
about target hosts, or services on target hosts, by sending a request which will
07-02.rpt
Suspicious
elicit a response containing the host or service's 'banner'. This 'banner' contains
Behavior -
information that may provide a potential attacker with such details as the exact
Banner
application and version running behind a port. These details could be used to
Grabbing
craft specific attacks against hosts or services that an attacker may know will
Enumerate
work correctly the first time - enabling them to modify their methodology go on
relatively undetected.
Network
Core Scan events reflect attempts to gather information about target networks,
Events:
or specific target hosts, by sending scans over core network protocols (TCP, IP, 07-03.rpt
RPT2003- As needed
Suspicious
ICMP, UDP) which will elicit responses that reveal information about clients,
Behavior -
servers, or other network infrastructure devices. The originating source of the
Core Scan
scan is generally attempting to acquire information that may reveal more than
normal traffic to the target would, information such as a list of applications
listening on ports, operating system information, and other information that a
probe may discover without enumeration of the specific services or performing
attack attempts.
Network
Enumerate events reflect attempts to gather information about target
RPT2003- As needed
Events:
networks, or specific target hosts, by sending active data which will elicit
07-04.rpt
Suspicious
responses that reveal information about clients, servers, or other network
Behavior -
infrastructure devices. The originating source of the enumeration is generally
Enumerate
attempting to acquire information that may reveal more than normal traffic to
the target would.
Network
Footprint events reflect attempts to gather information about target networks
RPT2003- As needed
Events:
by tracing the network through routers, clients, servers, or other network
07-05.rpt
Suspicious
infrastructure devices. The originating source of the footprint is generally
Behavior -
attempting to acquire information that may reveal more about network behavior
Footprint
than normal traffic to the target would.
510
Appendix F: Report Tables
File
Title
Description
name
Schedule
Network
General Security events are generated when a supported product outputs data RPT2003- As needed
Events:
that has not yet been normalized into a specific event, but is known to be
Suspicious
security issue-related.
07-17.rpt
Behavior General
Security
Network
Host Scan events reflect attempts to gather information about specific target
RPT2003- As needed
Events:
hosts by sending scans which will elicit responses that reveal information about
07-06.rpt
Suspicious
clients, servers, or other network infrastructure devices. The originating source
Behavior -
of the scan is generally attempting to acquire information that may reveal more
Host Scan
than normal traffic to the target would, such as a list of applications on the host,
operating system information, and other information that a probe may discover
without enumeration of the specific services or performing attack attempts.
These scans generally do not occur across entire networks and generally have
the intent of discovering operating system and application information which
may be used for further attack preparation.
Network
ICMP Query events reflect attempts to gather information about specific target
RPT2003- As needed
Events:
hosts, or networks, by sending ICMP-based queries that will elicit responses
07-07.rpt
Suspicious
that reveal information about clients, servers, or other network infrastructure
Behavior -
devices. The originating source of the scan is generally attempting to acquire
ICMP Query
information that may reveal more than normal traffic to the target would, such
as operating system information and other information that a probe may
discover without enumeration of the specific services or performing attack
attempts. These scans generally do not occur across entire networks, contain
many sequential ICMP packets, and generally have the intent of discovering
operating system and application information which may be used for further
attack preparation.
511
Table of Security reports
File
Title
Description
name
Schedule
Network
MS Networking Enumerate events reflect attempts to gather information about
RPT2003- As needed
Events:
target hosts, or services on target hosts, by sending active data to Microsoft
07-08.rpt
Suspicious
networking services (using protocols such as NetBIOS and SMB/CIFS) that will
Behavior - MS illicit responses that reveal information about the application, host, or target
Network
network. This enumeration may be a LEMple command sent to the networking
Enumerate
service to attempt to fingerprint what is allowed or denied by a service, requests
to a service that may enable an attacker to surmise the version and specific
service running, requests to a service that may enable an attacker to fingerprint
the target network, and other information gathering tactics. These
enumerations may result in information being provided that can allow an
attacker to craft a specific attack against the networking service, host, or
application that may work correctly the first time - enabling them to modify their
methodology to go on relatively undetected.
Network
Members of the NetworkSuspicious tree are used to define events regarding
RPT2003- As needed
Events:
suspicious usage of network bandwidth/traffic. These events include unusual
07-09.rpt
Suspicious
traffic and reconnaissance behavior detected on network resources.
Behavior Network
Suspicious
Network
Port Scan events reflect attempts to gather information about target networks,
Events:
or specific target hosts, by sending scans over core network protocols (TCP, IP, 07-10.rpt
RPT2003- As needed
Suspicious
ICMP, UDP) that will elicit responses that reveal information about clients,
Behavior -
servers, or other network infrastructure devices. The originating source of the
Port Scan
scan is generally attempting to acquire information that may reveal more than
normal traffic to the target would, such as a list of applications listening on ports,
operating system information, and other information that a probe may discover
without enumeration of the specific services or performing attack attempts. Port
Scans specifically operate by sending probes to every port within a range,
attempting to identify open ports that may use applications or services that are
easy to enumerate and attack.
Network
Children of the Recon tree reflect suspicious network behavior with intent of
RPT2003- As needed
Events:
gathering information about target clients, networks, or hosts. Reconnaissance
07-11.rpt
Suspicious
behavior may be valid behavior on a network, however, only as a controlled
Behavior -
behavior in small quantities. Invalid reconnaissance behavior may reflect
Recon
attempts to determine security flaws on remote hosts, missing access control
policies that allow external hosts to penetrate networks, or other suspicious
behavior that results in general information gathering without actively attacking.
512
Appendix F: Report Tables
File
Title
Description
name
Schedule
Network
Remote Procedure Enumerate events reflect attempts to gather information
RPT2003- As needed
Events:
about target hosts, or services on target hosts, by sending active data to
07-12.rpt
Suspicious
Remote Procedure services (using protocols such as RMI, CORBA, and
Behavior -
traditional RPC) that will elicit responses that reveal information about the
Remote
application or host. This enumeration may be a LEMple command sent to the
Procedure
remote procedure service to attempt to fingerprint what is allowed or denied by
Enumerate
the service, requests to the remote procedure service that may enable an
attacker to surmise the version and specific service running, and other
information gathering tactics. These enumerations may result in information
being provided that can allow an attacker to craft a specific attack against the
remote procedure service or application that may work correctly the first time enabling them to modify their methodology to go on relatively undetected.
Network
Scan events reflect attempts to gather information about target networks, or
RPT2003- As needed
Events:
specific target hosts, by sending scans which will elicit responses that reveal
07-13.rpt
Suspicious
information about clients, servers, or other network infrastructure devices. The
Behavior -
originating source of the scan is generally attempting to acquire information that
Scan
may reveal more than normal traffic to the target would, information such as a
list of applications listening on ports, operating system information, and other
information that a probe may discover without enumeration of the specific
services or performing attack attempts.
Network
Stack Fingerprint events reflect attempts to gather information about specific
RPT2003- As needed
Events:
target hosts by sending a certain set of packets to probe a device's network
07-14.rpt
Suspicious
stack, which will elicit responses that reveal information about clients, servers,
Behavior -
or other network infrastructure devices. The originating source of the scan is
Stack
generally attempting to acquire information that may reveal more than normal
Fingerprint
traffic to the target would, such as operating system information (including type
and version) and other information that a probe may discover without
enumeration of the specific services or performing attack attempts. These
scans generally do not occur across entire networks and generally have the
intent of discovering operating system information which may be used for
further attack preparation.
Network
Trojan Scanner events reflect attempts of Trojans on the network to gather
RPT2003- As needed
Events:
information about target networks, or specific target hosts, by sending scans
07-15.rpt
Suspicious
which will elicit responses that reveal information about the host. The originating
Behavior -
Trojan source of the scan is generally attempting to acquire information that will
Trojan
reveal whether a target host or network has open and available services for
Scanner
further exploitation, whether the target host or network is alive, and how much
of the target network is visible. A Trojan may run a scan before attempting an
attack operation to test potential effectiveness or targeting information.
513
Table of Support Reports
File
Title
Description
name
Schedule
Network
Unusual Traffic events reflect suspicious behavior on network devices where
RPT2003- As needed
Events:
the traffic may have no known exploit, but is unusual and could be potential
07-16.rpt
Suspicious
enumerations, probes, fingerprints, attempts to confuse devices, or other
Behavior -
abnormal traffic. Unusual Traffic may have no impending response, however, it
Unusual
could reflect a suspicious host that should be monitored closely.
Traffic
Priority Event
This report is no longer in use. The Priority Event report tracks those events that RPT2003- As needed
(reference)
the user has identified as a priority event. These events appear in the Priority
16.rpt
filter of the Console.
Priority Event
This report is no longer in use.This report mirrors the standard Priority Event
RPT2003- As needed
By User
report but groups the events received by Console User account. The same
17.rpt
(reference)
event may be seen by many users, so this report tends to be much larger than
the standard Priority Event report.
Rule
The Rule Subscriptions report tracks those events that the user has subscribed
RPT2006- Daily
Subscriptions
to monitor.
28-01.rpt
SolarWinds
The SolarWinds Action Report lists all commands or actions initiated by
RPT2003- As needed
Actions
SolarWinds Network Security.
18.rpt
by User
Table of Support Reports
Support Reports are diagnostic tools used by SolarWinds Customer Support. You will normally only
run these reports at SolarWinds’s request. For your convenience, the reports are listed alphabetically
by title.
File
Title
Description
name
Schedule
Agent
This report is a diagnostic tool used by Customer Support, and generally run
RPT2009- As
Connection
only at their request. This report tracks internal agent online and offline events.
33-1.rpt
Agent
This report is a diagnostic tool used by Customer Support, and generally run
RPT2009- As
Connection
only at their request. This report tracks internal agent online and offline events
33-2.rpt
Status by
grouped by agent.
requested
Status
Agent
514
requested
Appendix F: Report Tables
File
Title
Description
name
Schedule
Agent
This report is a diagnostic tool used by Customer Support, and generally run
RPT2009- As
Connection
only at their request. This report shows high level summary information for
33.rpt
Summary
when agents go online and offline.
Audit -
Audit - Internal Audit Report
requested
RPT2006- As
Internal Audit
31-01.rpt
requested
Report
Audit -
Internal Audit Report grouped by User
RPT2006- As
Internal Audit
31-02.rpt
requested
Report by
User
Agent
This report is a diagnostic tool used by Customer Support, and generally run
RPT2007- As
Maintenance
only at their request. This report displays internal event data for possible
32.rpt
Report
misconfigured agents.
Database
This report is a diagnostic tool used by Customer Support, and generally run
RPT2006- As
Maintenance
only at their request.
26.rpt
This report lists available rules for the Rule Subscriptions.
RPT2006- As needed
requested
requested
Report
List of Rules
for Rule
29-02.rpt
Subscriptions
List of
This report lists the rules that users have subscribed to.
Subscription
RPT2006- As needed
29-03.rpt
Rules by User
List of Users
This report lists each user entered. Currently, the users are only used for Rule
RPT2006- As needed
Subscriptions.
29-01.rpt
Tool
This report is a diagnostic tool used by Customer Support, and generally run
RPT2003- As needed
Maintenance
only at their request. List of New Tool Data events based on Tool Alias.
14.rpt
Tool
This report is a diagnostic tool used by Customer Support, and generally run
RPT2003- As needed
Maintenance
only at their request. List of New Tool Data events based on Agent InsertionIP.
15.rpt
Tool
This report is a diagnostic tool used by Customer Support, and generally run
RPT2003- As needed
Maintenance
only at their request. List of New Tool Data events based on ProviderSID.
13.rpt
by Alias
by Insertion
Point
by Provider
515
Report schedule definitions
File
Title
Description
name
Schedule
Tool
This report is a diagnostic tool used by Customer Support, and generally run
RPT2003- As
Maintenance
only at their request. The report displays a summary of all SolarWinds error
14.rpt
Detail Report
messages received from various tools.
Tool
This report is a diagnostic tool used by Customer Support, and generally run
RPT2003- As
Maintenance
only at their request. The report displays a summary of unique SolarWinds error
13.rpt
Report
messages received from various tools.
requested
requested
Report schedule definitions
The following table describes each recommended report schedule.
Schedule
Description
Daily
Run and review this report once each day.
Weekly
Run and review this report once each week.
As
SolarWinds suggests that you run these reports only when needed for specific auditing
needed
purposes, or when you need the details surrounding a Priority event or a suspicious
event.
As
These reports are diagnostic tools and should only be run at the request of SolarWinds's
requested technical support personnel.
516
Appendix G: Connector Configuration Tables
The tables in this section describe the various categories of network security products that can be
connected to LEM, and explain the fields for configuring sensors, actors, and notification systems.
Connector Categories
The following table describes the various categories of network security products that can be
connected to LEM. The Description column describes how the connectors (sensors and actors)
typically work with each type of product or device. The Use with columns indicate if each product
type requires Manager connectors, Agent connectors, or both.
Use with
Category
Anti-Virus
Description
This category lets you configure sensors for use with
Managers Agents
●
common anti-virus products. These products protect
against, isolate, and remove viruses, worms, and Trojan
programs from computer systems.
To configure an anti-virus connector, the anti-virus
software must already be installed on the Agent
computer.
Some anti-virus connectors can also be run on the
Manager by remotely logging from an Anti-Virus server.
Due to software conflicts, it is recommended that you run
only one brand of anti-virus software per computer.
Application
This category lets you configure sensors for use with
Switch
application switches. Application-Layer switches
transmit and monitor data at the application layer.
517
●
●
Appendix G: Connector Configuration Tables
Use with
Category
Database
Description
This category lets you configure sensors for use with
Managers Agents
●
●
database auditing products. These products monitor
databases for potential database intrusions, changes,
and database system events.
File Transfer and This category lets you configure sensors for use with file
Sharing
●
transfer and file sharing products. These products are
used to share files over the local network and/or Internet.
Monitoring these products provides information about
what files are being transferred, by whom, and system
events.
Firewalls
This category lets you configure sensors and actors for
use with applications and devices that are used to protect
and isolate networks from other networks and the
Internet.
Firewall sensors connect to, read, and retrieve firewall
logs. Most firewalls also have an active response
connector. These connectors configure actors that
interface with routers and firewalls to perform block
commands. Actors can perform active responses either
via telnet or serial/console cable. Normally, you will
configure these connectors on the Manager.
To configure a firewall connector, the firewall product
must already be installed on the Agent computer, or it
must be remotely logging to an Agent or a Manager.
Normally, you will configure these connectors on the
Manager.
You must also configure each firewall’s data gathering
and active response capabilities separately. For example,
configuring a firewall’s data gathering capabilities does
not configure the firewall’s active response settings.
518
●
●
Connector Categories
Use with
Category
Description
Identity and
This category lets you configure sensors for use with
Access
identity access, identity management, and other single-
Management
sign on connectors. These products provide
Managers Agents
●
authentication and single-sign on capabilities, account
management, and other user access features. Monitoring
these products provides information about authentication
and management of accounts.
IDS and IPS
This category lets you configure sensors and actors for
●
use with network-based and host-based intrusion
detection systems. These products provide information
about potential threats on the network or host, and can be
used to raise alarms about possible intrusions,
misconfigurations, or network issues.
Generally, network-based IDS and IPS connectors are
configured to log remotely, while host-based IDS and IPS
systems log locally on an agent system. Some networkbased IPS systems provide the capability to perform an
active response via their actor connector, allowing you to
block an IP address at the IPS device.
Manager
This category lets you configure sensors for use with the
Manager and other Appliances. These connectors
monitor for conditions on the Manager that may be
informational or display potential problems with the
appliances.
519
●
●
Appendix G: Connector Configuration Tables
Use with
Category
Description
Network
This category lets you configure sensors for use with
Management
network management connectors. These connectors
Managers Agents
●
●
●
●
monitor for different types of network activity from users
on the network, such as workstation-level process and
application monitoring. Generally, these systems are
configured to log remotely from a central monitoring
server.
Network Services This category lets you configure sensors for use with
different network services. These connectors monitor
service-level activity for different network services,
including DNS and DHCP. Most network services are
configured to log locally on an agent's system, however,
some are configured to log remotely.
Operating
This category lets you configure sensors for use with
Systems
utilities in the Microsoft Windows operating system that
monitor system events.
This category includes a Windows Active Response
connector. This connector configures an actor that
enables Windows active response capabilities on Agents
using Windows operating systems. This allows LEM to
perform operating system-level responses, such as
rebooting computers, shutting down computers, disabling
networking, and disabling accounts.
To configure an operating system connector, the
operating system software must already be installed on
the Agent computer.
If you perform the remote Agent installation, the Windows
NT/2000/XP Event Application Logs and System Logs
connectors are configured by default.
520
●
Connector Categories
Use with
Category
Description
Proxy Servers
This category lets you configure sensors for use with
and Content
different content monitoring connectors. These
Filters
connectors monitor user network activity for such
Managers Agents
●
●
●
●
activities as web surfing, IM/chat, and file downloads,
and events related to administering the monitoring
systems themselves. Generally, these connectors are
configured to log remotely from the monitoring system.
Routers/Switches This category lets you configure sensors, and in some
cases actors, for use with different routers and switches.
These connectors monitor activity from routers and
switches such as connected/disconnected devices,
misconfigurations or system problems/events, detailed
access-list information, and other related messages.
Some routers/switches have the capability to configure
an actor connector to block an IP address at the device.
Generally, these connectors are configured to log
remotely from the router/switch.
System Scan
This category lets you configure sensors for use with
Reporters
different asset scanning connectors, such as vulnerability
●
scanners. These connectors provide information about
potential vulnerabilities, exposures, and
misconfigurations with different devices on the network.
Generally, these connectors create events in the 'Asset'
categories in the event tree.
System
This category lets you configure the Manager with an
Connectors
external notification system, so LEM can transmit event
messages to LEM users via email or pager. For details,
see Setting up a Notification System
521
●
Appendix G: Connector Configuration Tables
Use with
Category
Description
VPN and Remote This category lets you configure sensors and actors for
Access
Managers Agents
●
●
use with Virtual Private Network (VPN) server products
that provide secure remote access to networks.
Normally, you will configure these connectors on the
Manager.
Web Server
This category lets you configure sensors for use with
Web server products. To configure a web server
connector, the web server software must already be
installed on the Agent or Manager computer.
522
●
Configuring Sensors
Configuring Sensors
The following table describes each field you’ll find on the Connector Configuration form when
configuring sensors for data gathering connectors. The actual fields that appear depend on the
connector you are configuring. Not every field appears with every connector. For convenience, the
table is sorted alphabetically by field name.
Field
Alias
Description
Type a name that easily identifies the application or appliance event log file
that is being monitored.
For active response connectors, we recommend you end the alias with
“AR”. For example, an alias for the Cisco PIX Active Response connector
might be “Cisco PIX AR”. This allows you to differentiate the active
response connector from the data gathering connector.
523
Appendix G: Connector Configuration Tables
Field
Description
Log File /
When you create a new alias for a connector, LEM automatically places a
Log Directory
default log file path in the Log File box. This path tells the connector where
the operating system stores the product’s event log file.
For most connectors, you can change the log file path, as needed. However,
some products write events to the Windows Application Log or the Windows
System Log. In these cases, you are actually configuring the sensor that
monitors events that are written to that log file. For these connectors, the
Log File setting is disabled, and the system automatically populates the
Log File field with the name of the Windows event log the sensor is
monitoring.
In most cases, you should be able to use the default log file path that is
shown for the connector. These paths are based on the default vendor
settings and the product documentation for each product. If a different log
path is needed, type or paste the correct path in the Log File box, or use the
Browse button to explore to correct folder or file.
If you are uncertain about which file path to use, either refer to your original
product documentation, or contact SolarWinds Technical Support.
Note: If the product creates separate log files based on the current date or
some other fixed interval, you can either select the log directory or any log
file in that directory. If you select a log file, LEM reads through the
directory’s log files in order, from the file you selected to the most current
file. The LEM then reads new files as they are added.
nDepth Host
If you are using a separate nDepth appliance (other than LEM), type the IP
address or host name for the nDepth appliance. Generally, the default setting is correct. Only change it if you are advised to do so.
nDepth Port
If you are using a separate nDepth appliance (other than the SolarWinds
LEM), type the port number to which the connector is to send nDepth data.
Generally, the default setting is correct. Only change it if you are advised to
do so.
524
Configuring Sensors
Field
Description
New File Name
Select the interval in which the connector posts and names each new log
Interval
file. The interval tells the SolarWinds LEM when to begin reading the next
log file. The default setting is Daily: yymmdd.
Output
Select the appropriate data output option:
Event - This is the default option. It sends the connector’s log file data as
events to the SolarWinds LEM for processing by your correlation rules,
associated active responses, SolarWinds Consoles, and databases.
nDepth - This option sends the connector’s log file data to a separate
nDepth appliance for archiving. The data does not go to the SolarWinds
LEM, so any potential event activity does not appear in the Event Panel.
However, you can still use the Console's nDepth explorer to search the data
on this appliance.
Event, nDepth - SolarWinds recommends that you choose this option if you
want to use nDepth to search log messages in addition to events. This
option sends the connector’s log file data to the SolarWinds LEM for event
processing and to SolarWinds nDepth for data archiving. This means the
LEM reports potential event activity in the Event Panel, and nDepth
archives the connector’s output data for later reference. Furthermore, you
can use the Console's nDepth explorer to search either type of data.
Server IP Address/
Type the IP address of the router or firewall. Use the following IP address
[Product] IP
format: 192.123.123.123.
Address/ [Product]
Server
525
Appendix G: Connector Configuration Tables
Field
Sleep Time
Description
Type or select the time (in seconds) the connector sensor is to wait between
event monitoring sessions. The default (and minimum) value for all
connectors is one (1) second. If you experience adverse effects due to too
many rapid readings of log entries, increase the Sleep Time for the
appropriate connectors.
Windows NT-based connectors automatically notify Windows Event Log
sensors of new events that enter the log file. Should automatic notification
stop for any reason, the Sleep Time dictates the interval the sensor is to
use for monitoring new events.
Tool Version
This is SolarWinds’s release version for this tool. This is read-only
information for reference purposes.
Wrapper Name
This is an identification key that the SolarWinds LEM uses to uniquely
identify the properties that apply to this particular connector. This is readonly information for SolarWinds reference purposes.
If the connector settings you need are not shown here, you are probably configuring an active
response connector. See "connector configuration tables," below. When you have finished
configuring the connector settings, don’t forget to start the connector.
526
Configuring Actors
Configuring Actors
The following table describes each field you will find on the Connector Configuration form when
configuring actors for active response connectors. Because each connector is product-based, the
fields that appear depend on the connector you are currently configuring. Not every field appears with
every connector. For convenience, the table is sorted alphabetically by field name.
Field
Recommended field settings
Advanced
These settings are no longer applicable.
Auth Port
For CheckPoint OPSEC firewalls, select the port used to connect to the
CheckPoint server via the LEA/OPSEC interface.
Base URL
Type the URL to connect to the SonicWALL firewall and perform the login. Include
“http://” at the beginning of the URL.
Note: SolarWinds does not support HTTPS. Only use this connector for older
SonicWALL firmware version.
Block
For CheckPoint OPSEC firewalls, type the timeout in seconds for the blocks to
Timeout
expire from the firewall. A value of zero (0) means “never expire.”
Client DN
For CheckPoint OPSEC firewalls, type the client DN string. The “CN” and “O”
must be uppercase.
Configuration Select either telnet or SerialPort.
Mode
Enable
Type the connector’s password for entering Enable mode.
Password
Enable
For the Windows Active Response connector, select this check box to enable
Windows
active response settings.
Active
Response
From Zone
Type the external zone used for configuring restrictions on firewall connections.
527
Appendix G: Connector Configuration Tables
Field
Recommended field settings
Incoming
Type the Interface for which the block is to be made effective; that is, the Interface
Interface
for which incoming traffic will be filtered to prevent traffic from the blocked IP
address.
Password /
Type the connector’s login password. For some products, the password name
Login
must be the same one that was used when the firewall was installed.
Password
Port Name /
Select a serial port for performing active response via console cable, if applicable.
Serial Port
The port name represents the physical communication port on the computer. The
Name
port name is only relevant if the Configuration Mode (below) is set to SerialPort.
/dev/ttyS0 = serial port 1, and
/dev/ttyS1 = serial port 2.
If the Configuration Mode is set to telnet, then this field is disabled and the Port
Name box reads: There are no ports available.
Remote
Type the firewall port used for connecting to and configuring the firewall.
Connection
Port
Server DN
For CheckPoint OPSEC firewalls, type the server DN string. The “cn” and “o” must
be lowercase.
Server Port
For CheckPoint OPSEC firewalls, select the port used to connect to the
CheckPoint server via the SAM/OPSEC interface.
Server /
Type the IP address of the router or firewall. This address allows LEM to perform
Server
active responses to events on that particular router or firewall. Use the following IP
Address /
address format: 192.123.123.123.
IP Address /
[Product] IP
Address
528
Setting up a Notification System
Field
SSLCA
Recommended field settings
For CheckPoint OPSEC firewalls, click the Browse button to locate the SSL
certificate file to upload to the server. If the connector is already configured, then
use the existing certificate on the server. You can use the same path for both the
LEA (log reading) and SAM (active response) certificates.
Take Admin
Only one person can configure the firewall at one time. Selecting this check box
Control
allows LEM’s active response to take administrative control over the firewall when
a user is logged into the WatchGuard Management Console. That is, LEM
disconnects the user and takes control over the firewall.
To Zone
Type the internal zone used for configuring restrictions on firewall connections.
connector
Type a name that easily identifies the product that LEM is to act on. For active
Configuration response connectors, we recommend you end the alias with “AR”. For example,
Instance
an alias for the Cisco PIX Active Response connector might be “Cisco PIX AR”.
(Alias)
This allows you to differentiate the active response connector from the data
gathering connector.
User Name /
Type the user name needed to log onto and configure the firewall. For some
Login User
products, the user name must be the same one that was used when the firewall
Name
was installed.
If the connector settings you need are not shown here, you are probably configuring a sensor (data
gathering) connector.When you have finished configuring the connector settings, don’t forget to start
the connector.
Setting up a Notification System
The Connector Configuration form has a category called System connectors that you can use to
set up an external notification system. This allows the Manager to transmit messages to SolarWinds
users via e-mail or pager, to record pertinent event data or text to a specified file, or to synchronize
your existing Directory Service Groups with your existing network directory services.
The following table explains how to configure each option in the System connectors category.
529
Appendix G: Connector Configuration Tables
Field
Recommended field settings
Append Text to File Active Response
Description
Use this connector to have the Agent “write” the specified event data or text to the
specified file.
How to
Select Newline to write the event data to the file so that each event is on a
append
distinct line (that is, one event per line), by inserting a “return” or “newline”
character.
Select No Newline to stream the event data to the file by appending the new data
immediately following any existing data in the file.
Maximum file
Type the allowable maximum file size for the text file, in Megabytes.
size (MB)
Directory Service Query
Description
Use this connector to have the Manager communicate with existing directory
services on the network to retrieve and update group information. This allows you
to synchronize your existing Directory Service Groups for use with rules and
filters.
User Name
Type a user name that is valid on the configured domain and server for
authenticating to the domain and retrieving group information.
Directory
Type the IP address or host name of your directory services server (commonly,
Service Server this is a domain controller).
Domain Name Type the fully-qualified domain name of your directory services domain.
Password
Type the password for the above user name that is valid on the configured domain
and server for authenticating to the domain and retrieving group information.
Directory
Type the port used to communicate with the directory service server.
Service
Server’s Port
Email Active Response
530
Setting up a Notification System
Field
Description
Recommended field settings
Use this connector to have a Manager automatically notify users of event events
when configured to do so by event policy.
Return
Type the name that you want to appear in the From field of active response e-mail
Display Name messages.
Port
Type the port used to communicate with the internal email server.
Return
Type the email address that you want to appear in the From field of active
Address
response email messages.
Mail Host
Type the IP address or host name of an internal SMTP server that the Manager
can use to send email messages through without authentication.
Authentication Type the user name needed to access the internal email server, if required.
Server
Username
Authentication Type the password needed to access the internal email server, if required.
Server
Password
Test E-mail
Type the e-mail address you want to use to test the Mail Host assignment. When
Address
you click the Test Email button, a test message should appear at this email
address.
Test Email
This button tests your email notification settings to ensure that you entered the
button
correct e-mail host.
Click the Test Email button. Then check the email address’s in-box. If you
entered the correct address, the in-box should receive the test message.
531
Appendix H: Filter Configuration Tables
Filter Condition Table
The following table is for use with Filter Creation. It lists the possible filter combinations that you can
create in the Conditions box for each type of field.
l
The Left field column lists each type of field you can drag into the Conditions box’s
left field.
l
The Right field column lists the corresponding field types that you can drag into the
Conditions box’s right field.
l
The Operators columns list the types of comparisons you can make between left and
right fields.
Operators
not
Left field
exists
event
•
event group
•
in
in
text event field
=
≠
>
>=
<
<=
Right field
•
•
text event field
•
•
text event group field
•
•
text constant
•
•
directory service group
•
•
subscription group
•
•
connector profile
•
•
user-defined group
time event field
•
532
•
•
•
time event field
Appendix H: Filter Configuration Tables
Operators
not
Left field
exists
in
•
in
=
≠
>=
<
<=
text event group field
Right field
•
•
•
•
time event group field
•
•
•
•
time constant
time of day
•
number event field
•
•
•
•
•
•
number event field
•
•
•
•
•
•
number event field group
•
•
•
•
•
•
number constant
•
•
text event field
•
•
text event group field
•
•
text constant
•
•
directory service group
•
•
subscription group
•
•
connector profile
•
•
user-defined group
time event group field
•
•
•
•
•
time event field
•
•
•
•
time event group field
•
•
•
•
time constant
time of day
•
number event group field
text constant
>
•
•
•
•
•
•
number event field
•
•
•
•
•
•
number event group field
•
•
•
•
•
•
number constant
•
•
directory service group
•
•
connector profile
533
Comparing Values with Operators
Operators
not
Left field
exists
number constant
time constant
in
in
=
≠
>
>=
<
<=
Right field
•
•
user-defined group
•
•
directory service group
•
•
connector profile
•
•
user-defined group
•
•
directory service group
•
•
connector profile
•
•
user-defined group
Comparing Values with Operators
When configuring a rule or a filter, whenever you drag an item from the list pane and position it next to
event variable, an operator icon appears between them. The operator states how the event variable
must compare with the other item to be subject to rule's or filter’s conditions.
For example, an operator might state whether or not an event should be contained within or outside of
an Time of Day Set; or it may state whether or not an event applies to a particular Connector Profile.
The operators that appear between two elements vary, depending on your selections. The form only
allows comparisons that are logical for the elements you have selected. For more information on
which operators are available for a particular field, see the following reference tables:
l
For configuring filter conditions, see the "Filter condition table" on page 1.
l
For configuring rule correlations, see see the "Rule correlation table" on page 1.
Each of these tables provides a matrix of valid operators for comparing an event variable to other
elements.
534
Appendix H: Filter Configuration Tables
Selecting a new operator
l
Click an operator to cycle through the various operators that are acceptable for the
current condition.
l
Ctrl+click an operator to show a list of operators you can choose from. Then click to
select the operator you want to use.
535
Operator tips
Operator tips
The following tips apply to operators:
l
When comparing two numeric values, the full range of mathematical operator options is
available.
l
An IP address is treated as a string (or text) value. Therefore, operators are limited to
“equal” and “not equal.”
l
DateTime fields have a default value of “> Time Now”, which means, greater than the
current date and time.
Table of operators
The following table describes each operator and how it should be interpreted when used as a filter
condition. (missing or bad snippet)
Operator Meaning
Exists
Description
Use these operators to specify if a particular event or Event Group exists.
Read conditions with these operators as follows: “This [event/Event Group]
Not
must [exist/not exist].”
exist
Note: "Not exist" is only used in rules.
is in
Use these operators when comparing event fields with groups (such as Event
Groups, User-Defined Groups, etc.). They determine the filter’s behavior,
based on whether or not the field is contained a specific Group.
is not in
Read conditions with these operators as follows:
n
This [event field] must be in this [Group].
n
This [event field] must not be in this [Group].
536
Appendix H: Filter Configuration Tables
Operator Meaning
Equals
Does
Description
Read conditions with these operators as follows:
n
This [event variable] must equal this [list item*].
n
This [event variable] must not equal this [list item*].
not
Text comparisons (for IP addresses, host names, etc.) are limited to “equal” or
equal
“not equal” operators.
Greater
Read conditions with these operators as follows:
than
Greater
n
This [event variable] must be greater than this [list item*].
n
This [event variable] must be greater than or equal to this [list item*].
n
This [event variable] must be less than this [list item*].
n
This [event variable] must be less than or equal to this [list item*].
than OR
equal to
Less
than
Less
than OR
equal to
AND
Conditions and groups of conditions are subject to AND and OR
comparisons.
n
The AND symbol means two or more conditions (or groups) must occur
together for the filter to apply. This is the default comparison for new
groups.
OR
n
The OR symbol means any one of several conditions (or groups) may occur
for the filter to apply. When comparing groups of distinct events, you must
use the OR symbol.
If you click an AND operator, it changes to an OR, and vice versa.
*A list item can be another event variable, such as an event field. For example, you may want to
compare that an event's source is equal to a destination. In this case, you would compare two event
fields, such as SourceMachine = DestinationMachine.
537
Examples of AND and OR conditions
Examples of AND and OR conditions
Filter groups and conditions, and rule groups and correlations, are all subject to AND and OR
conditions. By default, new groups, conditions, and correlations appear with an AND condition. AND
and OR conditions can surround nested groups, and they can be used between groups on the same
level to create complex filter conditions or rule correlations.
Example
If x AND y AND z occur, report the
Description
If all of the conditions apply, report the event.
event.
If x OR y OR z occurs, report the event.
If any of the conditions apply, report the event.
If (x AND y) OR z occurs, report the
If conditions x and y occur, or if condition z occurs,
event.
report the event.
If (a AND b) OR (x AND y) OR (z),
In this case, you would create three groups, two nested
occurs, report the event.
within the third:
n
The nested groups are configured as (a AND b) and
(x AND y), joined with an OR.
n
The outer group is configured as (z), surrounding the
nested groups with an OR.
“Condition1” AND
In this example, the filter reports the event when it meets
“Condition2 AND Condition3” OR
the following conditions:
“Condition4 AND Condition5.”
Condition1 and Condition2 and Condition3, or
Condition1 and Condition4 and Condition5.
Configuring event filter notifications
In Filter Creation, the Notifications box lets you to define how the Console is to notify a user when
the filter receives an event. Each notification option instructs the Console to announce the event in a
particular way. You can have the filter display a pop-up message, display the event in bold text, play a
warning sound, have the filter name blink, or configure a combination of these methods.
538
Appendix H: Filter Configuration Tables
Selecting the notification method
1. In the list pane, click the Notifications list.
2. Drag one or more notification option from the Notifications list to the Notifications
box.
3. Configure each option, as described in the Notifications table, below.
Notifications table
The following table lists the various notification methods that can be employed to notify a user that a
filter’s event threshold has been met.
l
The Notification column lists each options that is available in the list pane’s
Notifications list. They are alphabetized for easy reference.
l
The Description column briefly states how each option behaves.
l
The Fields column explains the data fields that can be configured for each option.
539
Notifications table
Notification
Description
Fields
Display
This option causes the Notify on x events received
Popup
filter to display the
Message
Popup Notification
form when receiving
an event.
This form states the
Type the number of events the filter must
receive before displaying the Popup
Notification form.
Repeat on x events received
name of the filter that
If you want the pop-up form to appear again
is receiving the
after receiving repeated events, select the
events, and that the
Repeat on check box.
filter’s event threshold Then in the events received box, type how
has been met.
many more events the filter should receive
before issuing the pop-up form another time.
From the form, the
message recipient can
choose to view the
filter, to turn off the
pop-up form for that
filter, or to turn off the
pop-up form for all
filters.
Display
This option displays
New
new events in the filter
Events As
with bold text.
Unread
They remain bold until
you acknowledge
them by clicking them
or by opening them in
the Event Explorer.
l
540
Not applicable
Appendix H: Filter Configuration Tables
Notification
Description
Fields
Enable
This option causes the Color
Blinking
filter name to blink in
Filter
the Filters pane.
Click the Color button to open the Blink
Color form. Choose a color from one of the
Name
three color palettes. Then click OK. The filter
name will blink in this color.
Time (ms)
Move the slider to select the amount of time
between blinks, in milliseconds.
Notify on x events received
Type the number of events the filter must
receive before the filter tab begins blinking.
Repeat on x events received
The filter tab stops blinking once you
acknowledge it by selecting it. If you want the
tab to begin blinking again after receiving
repeated events, select the Repeat on check
box. Then in the events received box, type
how many more events the filter should
receive before it starts blinking again.
541
Notifications table
Notification
Description
Fields
Play
This option causes the Sound/Browse
Sound
filter to play a sound
upon receiving an
To select a sound, click the Browse button.
Then use the Open form to locate and select
event.
the sound file that you want to use. Sound files
must be of the .wav file type.
When you are done, the name of the file should
appear in the Sound box. To test the sound,
click the “play” button.
Notify on x events received
Type the number of events the filter must
receive before displaying the sound.
Repeat on x events received
If you want the sound to play again after
receiving repeated events, select the Repeat
on check box.
Then in the events received box, type how
many more events the filter should receive
before the filter plays the sound another time.
542
Appendix I: Rule Configuration Tables
Rule Correlation Table
The following table is for use with Rule Creation. It lists the possible rule configurations you can
create in the rule window’s Correlations box for each type of field.
l
The Left field column lists each type of field you can drag into the Correlations box’s
left field.
l
The Right field column lists the corresponding field types that you can drag into the
Correlations box’s right field.
l
The Operators columns list the types of comparisons you can make between left and
right fields.
Operators
not
Left field
exists
not
exists
event
•
•
event group
•
•
in
in
text event field
=
≠
>
>=
<
<=
Right field
•
•
text event field
•
•
text event group field
•
•
text state variable field
•
•
text constant
•
•
directory service group
•
•
connector profile
•
•
user-defined group
time event field
543
•
•
•
•
time event field
•
•
•
•
time event group field
•
•
•
•
time state variable field
Appendix I: Rule Configuration Tables
Operators
not
Left field
exists
not
exists
in
in
=
≠
>
•
•
text event group field
•
<=
•
Right field
time constant
time of day
•
•
•
•
•
•
number event field
•
•
•
•
•
•
number event group field
•
•
•
•
•
•
number state variable field
•
•
•
•
•
•
number constant
•
•
text event field
•
•
text event group field
•
•
text state variable field
•
•
text constant
•
•
directory service group
•
•
connector profile
•
•
user-defined group
time event group field
•
text state variable
•
<
•
number event field
number event group field
>=
•
•
•
•
time event field
•
•
•
•
time event group field
•
•
•
•
time state variable field
•
•
•
•
time constant
•
time of day
•
•
•
•
•
•
number event field
•
•
•
•
•
•
number event group field
•
•
•
•
•
•
number state variable field
•
•
•
•
•
•
number constant
•
•
text event field
•
•
text event group field
•
•
text state variable field
544
Appendix I: Rule Configuration Tables
Operators
not
Left field
exists
not
exists
in
in
=
≠
<=
Right field
•
text constant
•
•
directory service group
•
•
•
connector profile
•
•
user-defined group
•
•
•
•
time event field
•
•
•
•
time event group field
•
•
•
•
time state variable field
•
•
•
•
time constant
•
time of day
number state variable
time constant
<
•
•
number constant
>=
•
time state variable
text constant
>
•
•
•
•
•
•
number event field
•
•
•
•
•
•
number event group field
•
•
•
•
•
•
number state variable field
•
•
•
•
•
•
number constant
•
•
directory service group
•
•
connector profile
•
•
user-defined group
•
•
directory service group
•
•
connector profile
•
•
user-defined group
•
•
directory service group
•
•
connector profile
•
•
user-defined group
Comparing Values with Operators
When configuring a rule or a filter, whenever you drag an item from the list pane and position it next to
event variable, an operator icon appears between them. The operator states how the event variable
545
Appendix I: Rule Configuration Tables
must compare with the other item to be subject to rule's or filter’s conditions.
When configuring a rule or a filter, whenever you drag an item from the list pane and position it next to
event variable, an operator icon appears between them. The operator states how the event variable
must compare with the other item to be subject to rule's or filter’s conditions.
For example, an operator might state whether or not an event should be contained within or outside of
an Time of Day Set; or it may state whether or not an event applies to a particular connector Profile.
Selecting a New Operator
l
Click an operator to cycle through the various operators that are acceptable for the
current condition.
l
Ctrl+click an operator to show a list of operators you can choose from. Then click to
select the operator you want to use.
Operator Tips
The following tips apply to operators:
l
When comparing two numeric values, the full range of mathematical operator options is
available.
l
An IP address is treated as a string (or text) value. Therefore, operators are limited to
“equal” and “not equal.”
l
DateTime fields have a default value of “> Time Now”, which means, greater than the
current date and time.
Filter groups and conditions, and rule groups and correlations, are all subject to AND and OR
conditions. By default, new groups, conditions, and correlations appear with an AND condition. AND
and OR conditions can surround nested groups, and they can be used between groups on the same
level to create complex filter conditions or rule correlations.
546
Appendix I: Rule Configuration Tables
Example
If x AND y AND z occur, report the
Description
If all of the conditions apply, report the event.
event.
If x OR y OR z occurs, report the event.
If any of the conditions apply, report the event.
If (x AND y) OR z occurs, report the
If conditions x and y occur, or if condition z occurs,
event.
report the event.
If (a AND b) OR (x AND y) OR (z),
In this case, you would create three groups, two nested
occurs, report the event.
within the third:
n
The nested groups are configured as (a AND b) and
(x AND y), joined with an OR.
n
The outer group is configured as (z), surrounding the
nested groups with an OR.
“Condition1” AND
In this example, the filter reports the event when it meets
“Condition2 AND Condition3” OR
the following conditions:
“Condition4 AND Condition5.”
Condition1 and Condition2 and Condition3, or
Condition1 and Condition4 and Condition5.
Accountable
The following table lists the various actions a Manager can take to respond to event events. These
actions are configured in Respond form when you are initiating an active response, and in the rules
window’s Actions box when you are configuring a rule's automatic response.
The table’s Action column lists the actions that are available. They are alphabetized for easy
reference. The Description column briefly states how the action behaves. The Fields column lists
the primary data fields that apply with each action. Some data fields will vary, depending on the
options you select.
547
Appendix I: Rule Configuration Tables
Action
Description
Fields
Add Domain User
This action adds a domain
To Group
user to a specified user group
that resides on a particular
Agent.
Domain Controller Agent
Select the event field or constant that defines
the Agent on which the group to be modified
resides.
To modify a group at the domain level, specify
a domain controller as the Agent.
Group Name
Select the event field or constant that defines
the group that is to be modified.
Username
Select the event field or constant that defines
the user who is to be added to the group.
Add Local User To
This action adds a local user
Group
to a specified user group that
resides on a particular Agent.
Agent
Select the event field or constant that defines
the Agent on which the group to be modified
resides.
To modify a group at the domain level, specify
a domain controller as the Agent.
Group Name
Select the event field or constant that defines
the group that is to be modified.
Username
Select the event field or constant that defines
the user who is to be added to the group.
548
Appendix I: Rule Configuration Tables
Action
Description
Fields
Add User-Defined
This action adds a new data
Group Element
element to a particular userdefined group.
User-Defined Group Element
From the User-Defined Groups list, select
the User-Defined Group that is to receive the
new data Element.
Value
Select the event field or constant that defines
the data element that is to be added to the
specified User-Defined Group. The fields will
vary according to which User-Defined Group
you select.
Append Text To File This action appends text to a
file. This allows you to data
from an event and put it in a
text file.
Agent
Select the event field or constant that defines
the Agent on which the file to be appended is
located.
File Path
Select the event field or constant that defines
the path to the Agent file that is to be
appended with text.
Text
Select the event field or constant that defines
the text to be appended to file.
Block IP
This action blocks an IP
IP Address
address.
Select the event field or constant that
identifies the device’s IP address.
549
Appendix I: Rule Configuration Tables
Action
Description
Fields
Create User
This action creates a new
Agent
Account
user account on an Agent.
Select the event field or constant that defines
the Agent on which the new user account is to
be added.
To create a user account at the domain level,
specify a domain controller as the Agent.
Account Name
Select the event field or constant that names
the account that is to be created.
Account Password
Select the event field or constant that defines
the password that is to be assigned to the
new account.
Create User Group
This action creates a
Agent
specified user group on an
Agent.
Select the event field or constant that defines
the Agent on which the new user group is to
A user group is a new group
of Windows users on a
reside.
To create a user group at the domain level,
Windows PC, server, or
network who are external to
specify a domain controller as the Agent.
Group Name
the LEM system.
Select the event field or constant that defines
which user group is to be created.
550
Appendix I: Rule Configuration Tables
Action
Description
Delete User
This action deletes a user
Account
account from an Agent.
Fields
Agent
Select the event field or constant that defines
the Agent on which the user account is to be
deleted.
To delete a user account at the domain level,
specify a domain controller as the Agent.
Account Name
Select the event field or constant that names
the account that is to be deleted.
Delete User Group
This action deletes a user
Agent
group from a particular Agent.
Select the event field or constant that defines
the Agent on which the user group to be
deleted resides.
To delete a user group at the domain level,
specify a domain controller as the Agent.
Group Name
Select the event field or constant that defines
the user group that is to be deleted.
Detach USB
This action detaches a USB
Device
mass storage device that is
connected to an Agent.
Agent
Select the event field or constant that defines
the Agent from which the USB device is to be
detached.
Device
Select the event field or constant that defines
the device ID of the USB device that is to be
detached.
551
Appendix I: Rule Configuration Tables
Action
Description
Fields
Disable Domain
This action disables a
Domain Controller Agent
User Account
Domain User Account on a
Domain Controller Agent.
Select the event field or constant that defines
the Domain Controller Agent on which the
domain user is to be disabled.
Destination Account
Select the event field or constant that defines
the account that is to be disabled.
Disable Local User
This action disables a local
Account
user account on an Agent.
Agent
Select the event field or constant that defines
the Agent on which the local user is to be
disabled.
Destination Account
Select the event field or constant that defines
the account that is to be disabled.
Disable Networking This action disables an
Agent
Agent’s network access.
Select the event field or constant that defines
The result is that the
the Agent that is to be disabled from the
specified Agent will be unable network.
to connect to the network.
Message
Type the message that is to appear on the
Agent.
552
Appendix I: Rule Configuration Tables
Action
Description
Fields
Disable Windows
This action disables a
Domain Controller Agent
Machine Account
Windows machine account
that resides on a Domain
Select the event field or constant that defines
the Domain Controller Agent on which the
Controller Agent.
account is to be disabled.
Destination Account
Select the event field or constant that
specifies which Windows account is to be
disabled.
Enable Domain
This action enables a Domain Domain Controller Agent
User Account
User Account on a Domain
Controller Agent.
Select the event field or constant that defines
the Domain Controller Agent on which the
domain user is to be enabled.
Destination Account
Select the event field or constant that defines
the account that is to be enabled.
Enable Local
This action enables a local
User Account
user account on an Agent.
Agent
Select the event field or constant that defines
the Agent on which the local user is to be
enabled.
Destination Account
Select the event field or constant that defines
the account that is to be enabled.
553
Appendix I: Rule Configuration Tables
Action
Description
Fields
Enable Windows
This action enables a
Domain Controller Agent
Machine Account
Windows machine account
that resides on a Domain
Select the event field or constant that defines
the Domain Controller Agent on which the
Controller Agent.
account is to be enabled.
Destination Account
Select the event field or constant that
specifies which Windows account is to be
enabled.
Incident Event
This action escalates
Event
potential issues by creating
an Incident Event.
Select which Incident Event the rule is to
create.
Event Fields
From the list pane, select the events and
constants that define the appropriate data
elements for each event fields The fields vary,
depending on which Incident Event event is
selected.
Infer Event
This action escalates
Event
potentially irregular audit
traffic into security events by
Select which Event the rule is to infer.
creating (or “inferring”) a new
Event Fields
event with a higher severity.
From the list pane, select the events and
constants that define the appropriate data
elements for each event field. The fields vary,
depending on the which event is selected.
554
Appendix I: Rule Configuration Tables
Action
Kill Process by ID
Description
Fields
This action terminates the
specified process on an
Agent by using its process ID
value.
Agent
Select the event field or constant that defines
the Agent on which the process is to be
terminated.
Process ID
Select the event field or constant that
identifies the ID number of the process that is
to be terminated.
Kill Process by
This action terminates the
Name
specified process on an
Agent
Select the event field or constant that defines
Agent by referring to the
the Agent on which the process is to be
process name.
terminated.
Process Name
Select the event field or constant that
identifies the name of the process that is to be
terminated.
Account Name
Select the event field or constant that
identifies the name of the account that is
running the process to be terminated.
Log Off User
This action logs the user off
of an Agent.
Agent
Select the event field or constant that defines
the Agent from which the user is to be logged
off.
Account Name
Select the event field or constant that
identifies the specific account name that is to
be logged off.
555
Appendix I: Rule Configuration Tables
Action
Description
Fields
Modify State
This action modifies a state
Variable
variable.
State Variable
From the State Variables list, drag the state
variable that the rule is to modify.
State Variable Fields
From the appropriate component list, type or
drag the data element that is to be modified in
the state variable. The fields vary, depending
on the which state variable is selected.
Remove Domain
This action removes a domain Domain Controller Agent
User From Group
user from a specified user
group that resides on a particular Agent.
Select the event field or constant that defines
the domain controller Agent on which the
group to be modified resides.
Group Name
Select the event field or constant that defines
the group that is to be modified.
User Name
Select the event field or constant that defines
the user who is to be removed from the group.
Remove Local User This action removes a local
From Group
user from a specified user
group that resides on a particular Agent.
Agent
Select the event field or constant that defines
the Agent on which the group to be modified
resides.
Group Name
Select the event field or constant that defines
the group that is to be modified.
User Name
Select the event field or constant that defines
the user who is to be removed from the group.
556
Appendix I: Rule Configuration Tables
Action
Description
Fields
Remove User-
This action removes a data
Defined Group
element from a particular
Element
user-defined group.
User-Defined Group
From the User-Defined Groups list, select
the user-defined group from which the
specified data element is to be removed.
Value
Select the event field or constant that defines
the data element that is to be removed from
the specified user-defined group. The fields
will vary according to which user-defined
group you select.
Reset User
This action resets a user
Account Password
account password on a
Agent
Select the event field or constant that
particular Agent.
identifies the Agent on which the user
password is to be reset.
To reset an account at the domain level,
specify a domain controller as the Agent.
Account Name
Select the event field or constant that
identifies the user account that is to be reset.
New Password
Select the event field or constant that defines
the user’s new password.
557
Appendix I: Rule Configuration Tables
Action
Restart Machine
Description
Fields
This action reboots an Agent. Agent
Select the event field or constant that
identifies the Agent that is to be rebooted.
Delay (sec)
Type the time (in seconds) after the event
occurs that the Manager is to wait before
rebooting the Agent.
Restart Windows
This action restarts the
Agent
Service
specified Windows service
on an Agent.
Select the event field or constant that
identifies the Agent on which the Windows
service will be restarted.
Service Name
Select the event field or constant that
identifies the name of the service that is to be
restarted.
558
Appendix I: Rule Configuration Tables
Action
Description
Fields
Send Email
This action sends a
Email Template
Message
preconfigured email message
to a predetermined email
Select the template that the email message is
to use. For more information on email
distribution list.
templates, see "Configuring Email
Templates" on page 1.
Recipients
Click the check boxes to select which users
are to receive the email message.
Email Fields
Either drag a field from the components list, or
select a constant from the components list to
select the appropriate data elements that are
to appear in each email template field. The
fields vary, depending on which email
template is selected.
Send Popup
This action displays a pop-up Agent
Message
message to an Agent.
Select the event field or constant that
identifies the Agent that is to receive the popup message.
Account Name
Select the event field or constant that
identifies the user account to receive the
message.
Message
Select the event field or constant that defines
the message that is to appear on the Agent’s
monitor.
559
Appendix I: Rule Configuration Tables
Action
Shutdown Machine
Description
Fields
This action shuts down an
Agent.
Agent
Select the event field or constant that
identifies the Agent that is to be shut down.
Delay (sec)
Type the time (in seconds) after the event
occurs that the Manager is to wait before
shutting down the Agent.
Start Windows
This action starts the
Agent
Service
specified Windows service
on an Agent.
Select the event field or constant that
identifies the Agent on which the Windows
service is to be started.
Service Name
Select the event field or constant that defines
the Windows service that is to be started.
Stop Windows
This action stops the
Agent
Service
specified Windows service
on an Agent.
Select the event field or constant that
identifies the Agent on which the Windows
service is to be stopped.
Service Name
Select the event field or constant that defines
the Windows service that is to be stopped.
560


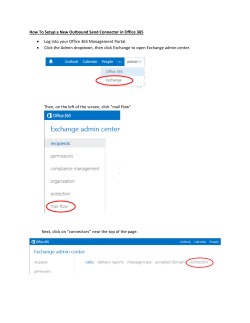


© Copyright 2026