
Document 74796
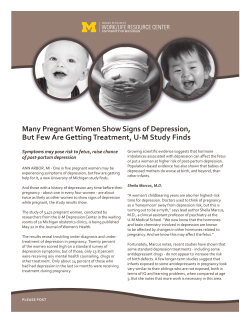
The Spanish Journal of Psychology
2008, Vol. 11, No. 2, 641-649
Copyright 2008 by The Spanish Journal of Psychology
ISSN 1138-7416
Psychometric Properties of the Reynolds Child Depression
Scale in Community and Clinical Samples
Anna Figueras Masip1, Juan Antonio Amador Campos2, and Joan Guàrdia Olmos2
1Departament
d’Innovació, Universitats i Empresa, Generalitat de Catalunya (Spain)
2Universitat de Barcelona (Spain)
The factor structure of the Reynolds Child Depression Scale (RCDS; Reynolds, 1989),
analyzed by confirmatory factor analysis and the scale’s psychometric characteristics in
a sample of 315 participants (140 boys and 175 girls) and a clinical sample of 62
participants (37 boys and 25 girls) between 10 and 12 years old, are presented. Two
models are tested with confirmatory factor analysis: a one-factor model and a five-factor
model. Both models show a good fit, but the one-factor model was chosen because it is
the most parsimonious. The reliability coefficient ranged from .87 (at test) to .89 (at retest)
in the community sample, and was .90 in the clinical sample (at test). Test-retest reliability
was .66 in the community sample. Concurrent validity with other self-reports that measure
depressive symptomatology was high, both in the community sample (.76) and the clinical
sample (.71). There were no significant sex differences but there were differences due to
age (school grade).
Keywords: depressive symptoms, childhood, assessment, self-report, RCDS, confirmatory
factor analysis
Se analiza la estructura factorial de la Reynolds Children Depression Scale (RCDS;
Reynolds, 1989) mediante análisis factorial confirmatorio y se presentan sus características
psicométricas en una muestra comunitaria de 315 participantes (140 chicos y 175 chicas)
y en una muestra clínica de 62 participantes (37 chicos y 25 chicas) con edades
comprendidas entre los 10 y los 12 años. En el análisis factorial confirmatorio se prueban
dos modelos, uno unifactorial y otro de cinco factores. El modelo unifactorial se ajusta
mejor y es más parsimonioso. La fiabilidad de la RCDS es elevada para ambas muestras:
consistencia interna entre 0,87 (test) y 0,89 (retest) en muestra comunitaria, y de 0,90
en la muestra clínica (test); la correlación test-retest era de 0,66 en la muestra comunitaria.
La validez concurrente con otros instrumentos que miden sintomatología depresiva era
elevada, tanto en muestra comunitaria (0,76) como en muestra clínica (0,71). No se
aprecian diferencias según sexo, pero sí según el curso escolar.
Palabras clave: síntomas depresivos, niñez, evaluación, autoinforme, RCDS, análisis
factorial confirmatorio
This work was partly supported by grant SEJ2005-09144-C02-01/PSIC from the Ministerio de Educación y Ciencia and by grant
2005SGR 00365 from the Generalitat de Catalunya,.
Correspondence concerning this article should be addressed to Juan Antonio Amador Campos, Departament de Personalitat, Avaluació
i Tractament Psicològic, Facultat de Psicologia, Universitat de Barcelona, Passeig de la Vall d’Hebron, 171, 08035 Barcelona (Spain).
E-mail: [email protected] Translation: Virginia Navascués Howard
How to cite the authors of this article: Figueras Massip, A., Amador Campos, J.A. and Guàrdia Olmos, J.
641
642
FIGUERAS, AMADOR, AND GUÀRDIA
Depression in children and adolescents is an insidious
disorder, often poorly identified or else considered a normal
mood variation. The causes are diverse and, among others,
include the type of symptomatology, the frequently covert
nature of the symptoms, the consideration of the end of
childhood and the beginning of adolescence as a period of
changes and emotional alterations, the scarce communication
between some adolescents and their parents or reference
adults, and the lack of self-referral to professionals.
The symptoms considered typical of the depressive
disorder in childhood and adolescence have changed over
time. Del Barrio (1990) carried out a review of the works
on childhood depression between 1945 and 1987 and
elaborated a list with almost 40 symptoms. Of this extensive
list, Del Barrio underlines that the main symptoms of
childhood depression are: low self-esteem, changes in sleep
pattern, loss or increase of appetite and weight, social
isolation, hyperactivity, dysphoria, and suicidal ideation.
These symptoms, mainly of an internal nature, are similar
to those described in depression in adults. However, in
childhood and adolescent depression, there are specific
symptoms, such as behavior problems, irritability, temper
tantrums or disobedience. As of 6 years of age, depressive
symptoms in children become more similar to those of adults
but, as a differential characteristic, depressive
symptomatology is associated with behavior problems (Shaffi
& Shaffi, 1992).
In the last few years, considerable effort has been made
to design and improve the assessment instruments of
affective disorders in children and adolescents. A broad array
of instruments has been created that go from self-report
measurements to structured interviews, and include
observation methods and parents’, teachers’, or peers’ heteroreports (Jané, Araneda, Valero, & Domènech, 2000; Kazdin,
1981; Kazdin & Petti, 1982).
Pencil-and-paper self-reports provide information about
the frequency and intensity of depressive symptoms. Although
they are not diagnostic instruments, they are necessary in
the assessment process and are very important when
appraising treatment efficacy and at follow-up (Klein,
Dougherty, & Olino, 2005; Mash & Hunsley, 2005;
Orvaschel, 2004). The following self-reports assess childhood
depression and have been adapted to our context: the
Children’s Depression Inventory (CDI; Kovacs, 1992; Spanish
adaptation by del Barrio & Carrasco, 2004) and the Children’s
Depression Scale (CDS; Tischer & Lang, 1978; Spanish
adaptation of TEA, 1983). In addition to these instruments,
two of the most frequently used scales to assess depressive
symptomatology in childhood and adolescence in the English
language are the Reynolds Adolescent Depression Scale
(RADS; Reynolds, 1987, 2002) and the Reynolds Child
Depression Scale (RCDS; Reynolds, 1989). The scale items
are short and direct, which facilitates reading and responding.
Del Barrio, Colondrón, De Pablo, and Roa (1996) studied
and adapted the RCDS and the RADS to Spanish.
The RCDS (Reynolds, 1989) is a short and easily
administered self-report measure, designed to assess depressive
symptomatology in children between the ages of 8 and 12
years. The RCDS does not provide a formal diagnosis of
depression, according to the diagnostic criteria established by
categorical systems such as the Diagnostic and Statistical
Manual of Mental Disorders (DSM-IV-TR; American
Psychiatric Association, 2000) or the International
Classification of Diseases (ICD-10; World Health
Organization, 1992), but it was designed to assess depressive
symptomatology and to be used as a screening instrument to
identify depressive symptoms at school or in clinical settings.
Mean RCDS scores in English-speaking community
samples ranged between 49.00 (Baker & Reynolds, 1988)
and 66.54 (Reynolds, Anderson, & Bartell, 1985). For the
Spanish-speaking community samples, mean total scores
ranged between 47.20 (Del Barrio et al., 1996) and 49.72
(López, 1985). In English-speaking clinical samples, mean
total scores ranged between 53.03 (Rawson & Tabb, 1993)
and 67.32 (Stark, Reynolds, & Kaslow, 1987).
The cut-off point (percentile 90) established by Reynolds
(1989), with an American population, is situated at a raw
score of 74 (73% sensitivity and 97% specificity) for boys
and girls. In studies carried out in our context (Del Barrio
et al., 1996), the cut-off point decreased to 65 (percentile
95) for both sexes.
The reliability of the RCDS, analyzed by internal
consistency, ranges between .85 and .90 for the standardization
sample. Test-retest reliability is .82 at two weeks, and .85 at
four weeks (Reynolds, 1989). Other studies report internal
consistency between .79 and .90 (Bartell & Reynolds, 1986;
López, 1985; Reynolds, 1989; Reynolds et al., 1985; Stark
et al., 1987), and test-retest reliability between .82 and .85
(Del Barrio et al., 1996; Reynolds & Graves, 1989).
Concurrent validity of the RCDS has been analyzed
through its correlations with other measurements of
depression, anxiety, or self-esteem. The RCDS presents
correlations ranging between .68 and .79 with the CDI
(Bartell & Reynolds, 1986; Kovacs, 1992; López, 1985;
Reynolds, 1989; Reynolds et al., 1985); in Spanish
populations, Del Barrio et al. (1996) found a correlation
between the CDI and the RCDS of .73. The correlations
between the RCDS and the Revised Children’s Manifest
Anxiety Scale (RCMAS) range between .60 and .76. The
correlations with a measurement of self-esteem (Self-esteem
Inventory, SEI; Coopersmith, 1981) are negative and range
between -.50 and -.71 (Bartell & Reynolds, 1986; Reynolds,
1989; Reynolds et al., 1985).
Studies of the factor structure of the RCDS are scarce.
Reynolds (1989) found five factors in a community sample
of 1,620 participants: dependence and concern,
demoralization, externalizing symptoms and somatic
complaints, depressed mood and pessimism, and anhedonia.
No studies on the factor structure in Spanish population
were found.
PSYCHOMETRIC PROPERTIES OF THE REYNOLDS CHILD DEPRESSION SCALE
The goal of this work is to present the factor structure
of the RCDS by means of confirmatory factor analysis and
the psychometric properties of the bilingual Spanish-Catalan
version of the RCDS in the Catalonian children’s population
643
follows: high 20.4%, medium-high 15.1%, medium 26.0%,
medium-low 32.2%, and low 5.4%. And the socioeconomic
status of the clinical sample was: high 0%, medium-high
12.1%, medium 9.1%, medium-low 66.7%, and low 12.1%.
Instruments
Method
Participants
The community sample comprised 315 participants,
aged between 10 and 12 years, from public and partially
state-funded schools of the province of Barcelona, registered
in 5th and 6th grade of Primary Education. Of the sample,
44.44% are boys (140) and 55.55% are girls (175). We
contacted one school from each of the ten districts of the
city of Barcelona and several schools from the province.
Five schools agreed to participate in the study.
The clinical sample comprised 62 participants (25 girls,
40.32%; 37 boys, 59.67%), ages between 10 and 12 years.
The participants were in 4th, 5th, and 6th grade of Primary
Education. The clinical sample was recruited from two
Children’s and Youths’ Mental Health Centers (in Spanish,
“Centro de Salud Mental Infantil y Juvenil,” hereafter
abbreviated to CYMHC) of the province of Barcelona. The
clinical team of the CYMHC performed the diagnosis
according to the criteria of the DSM-IV-TR (APA, 2000).
Of this clinical sample, 19 participants were diagnosed
with depression, 21 with anxiety disorders, 9 with behavior
and learning problems, and 13 had no definite diagnosis
at the time of coding the RCDS data. In addition, for the
study of the sensitivity and specificity of the RCDS, we
selected a nonsymptomatic group from the community
sample of 45 participants who scored lower than the cutoff point at the test and retest phases. This group was
paired in age and sex with the group diagnosed with
depression.
The socioeconomic status of the community sample,
calculated with the Hollingshead (1975) index, was as
The RCDS includes 30 items, 29 of which use a 4-point
Likert-type response format, ranging from 1 (almost never)
to 4 (all the time). The last item of the scale presents faces
with various expressions and is rated on a 5-point scale.
The total score of the RCDS can range between 30 and 121
points. The RCDS can be administered individually or
collectively; it can also be administered orally to children
with reading difficulties. Table 1 displays the denomination
proposed by Reynolds (1989) for each item.
The CDI consists of 28 items that assess depressive
symptomatology. Each one of the items has three response
options that score 0 (absence of symptomatology), 1 (mild
symptomatology) or 2 (severe symptomatology). The total
score ranges from 0 to 54 points.
The following translation and adaptation procedures were
used for the RCDS and the CDI: (a) direct translation of
the questionnaire from English to Spanish and from English
to Catalan by two expert translators, with knowledge of
psychology and psychopathology; (b) comparison of the
translations to assess differences in interpretation; (c) back
translation by other expert translators; (d) comparison of
the direct and back-translation versions by bilingual persons
to verify the conceptual and semantic equivalence of the
sentences; (e) drafting the definitive version presented in
this work (Brislin, 1986; Brislin, Loner, & Thorndike, 1973;
Candell & Hulin, 1987).
The RCDS and the CDI were administered in a bilingual
Spanish-Catalan version (see Annex 1). We chose this format
because of our experience with previous works in which
we verified that the bilingual version facilitated understanding
the sentences (Abad & Amador, 1991; Abad & Forns, 1991a,
1991b).
Table 1
Denomination of the RCDS Items according to Reynolds (1989)
Item
Symptomatology
1
2
3
4
5
6
7
8
9
10
Dysphoria
School anxiety
Loneliness
Devalued by parents
Self-worth
Social withdrawal
Sadness
Crying
Worthlessness
Anhedonia-peers
Item
11
12
13
14
15
16
17
18
19
20
Symptomatology
Somatic complaint
Low self-worth
Discouragement
Self-injury
Self-esteem
Irritability
Pessimism
Fatigue
Self-reproach
Self-deprecation
Item
21
22
23
24
25
26
27
28
29
30
Symptomatology
Concentration difficulty
Self-pity
Reduced speech
Sleep disturbance
Anhedonia-general
Worry
Somatic complaint
Loss of interest
Helplessness
Dysphoric mood
644
FIGUERAS, AMADOR, AND GUÀRDIA
Procedure
clinical sample, in addition to the concurrent validity
between the RCDS and the CDI.
The assessment procedure followed Reynolds’ (1986)
multistage model. This procedure comprises three stages to
identify children with depressive symptomatology. The first
two phases consist of the administration of self-assessment
instruments of depressive symptomatology at two different
points in time with an interval of 2 or 3 weeks (test and
retest phases), the minimum period established in Criterion
A of the DSM-IV-TR (APA, 2000) for a major depressive
episode. In the third stage, the participants who exceeded
the cut-off point at test and retest were assessed more
extensively, gathering information from various informers
(parents and teachers) with diverse methods (interviews and
rating scales).
The assessment procedure for both groups was approved
by the Deontological Commission of the Association of
Psychologists of Catalonia (COPC) and by the boards of
directors of the schools that collaborated in the study, as well
as by the teams of psychologists of the participating clinical
centers. For the community sample, we obtained the parents’
informed consent with a letter sent from the school director’s
office. The parents of the participants of the clinical sample
gave their consent on the day of the initial interview and the
children agreed to participate in the study.
Data was collected from the community sample
anonymously and collectively, in groups of 20 students. This
was carried out during the students’ tutoring class by two
psychologists in the presence of the classroom tutor. The
participants indicated their sex and date of birth in the
protocols and the questionnaires for the test and retest phases
were paired for each classroom using these data.
The data of the clinical sample were collected by a
clinical psychologist during the initial interview at the
CYMHC. The CYMHC clinical team performed the
diagnosis according to the DSM-IV-TR criteria (APA, 2000),
disregarding the results of the RCDS.
The data presented herein are a part of a more extensive
research that has assessed depressive symptomatology in
childhood and adolescence. In this work, we only present
the results obtained in the RCDS at the test and retest
phases for the community sample and the test data for the
Table 2
Items that Load on each of the Five Factors of the RCDS,
according to Reynold’s (1989) Multifactor Model
Five-Factor Model
Factor
11
2
3
4
5
Items
3-7-8-15-16-19-21-22-28
4-6-9-12-13-14-20-29
2-11-18-24-26-27
1-5-17-30
10-23-25
Data Analysis
In order to confirm the factor structure proposed by
Reynolds (1989), we analyzed two factor models with
confirmatory factor analysis (CFA) using the EQS program,
version 6.1 (Bentler & Wu, 2002). Given the nature of the
items— Likert-type scale and biased distribution—we used
the elliptic robust least square method (ERLS; Bentler &
Dijkstra, 1985) of parameter estimation. In both cases, the
variance of the factors was fixed at 1 in order to provide
the measuring scale; in the case of the five-factor structure,
the analysis was carried out assuming that the factors were
correlated. The first model assessed the possibility of a onedimensional structure, whereas the second proposal
established the five factors proposed by Reynolds (1989).
Table 2 displays the items of each factor.
To analyze the effect of the Grade × Sex interactions on
the RCDS scores at the test and retest phase in the
community sample, a repeated measures MANOVA was
performed. Reliability was examined with Cronbach’s alpha
and test-retest reliability. For the clinical sample, the
differences as a function of grade and sex were assessed by
means of Kruskal-Wallis’ H and Mann-Witney’s U.
Results
Community Sample
Table 3 displays the means and standard deviations of the
RCDS at test and retest phases. The means obtained in the
RCDS ranged between 46.47 and 49.03 (at test) and from 42.88
to 48.41 (at retest). Girls scored higher than boys in all grades,
both at test and retest. Total retest scores were lower than test
scores in all grades, for boys and girls, except for the scores
of the 6th-grade girls, which were slightly higher at retest.
A mixed-factor analysis of variance, with one withingroup variable and two between-group variables, was
conducted to identify the possible interactions between the
two administration phases, participants’ sex, and grade. The
condition of equality of the variance-covariance matrixes was
met: Box’s M: F(9.148447, 9) = 1.484, p =.147. Table 4
shows the results of this analysis, with the value of the degrees
of freedom corrected according to the missing/unrecorded
values in each analysis.
As can be observed, there were no interactions between
the administration phase of the instrument, grade, and sex,
although there were significant differences between the
administration phases, with the test scores being significantly
higher than the retest scores, despite the fact that the effect
size was not very high (η2 = 0.022). The between-subject
effects showed that there were no significant differences for
645
PSYCHOMETRIC PROPERTIES OF THE REYNOLDS CHILD DEPRESSION SCALE
Table 3
Means and Standard Deviations (in Brackets) of the RCDS in the Community Sample, at Test and Retest, as a Function of
Grade (5th or 6th of Primary Education) and Sex
TEST
Boys
M
RETEST
Girls
SD
n
M
Total
SD
n
M
Boys
SD
n
M
Girls
SD
n
M
Total
Grade
n
SD
n
M
SD
5th Grade
6th Grade
57 46.47 (11.03) 67 49.03 (11.24) 124 47.85 (11.17) 32 42.88 (8.97) 38 44.34 (8.07) 70 43.67 (8.46)
83 48.01 (9.88) 108 48.32 (10.13) 191 48.19 (10.00) 56 45.84 (10.90) 74 48.41 (11.79) 130 47.29 (11.44)
Table 4
Analysis of the Simple Effects and Interactions between Grade, Sex, and Administration Phase of the RCDS
F
df
p
Observed power
η2
Within-subject contrasts
Retest
Retest × Sex
Retest × Grade
Retest × Sex × Grade
4.332
0.043
0.001
3.395
1.
1.
1.
1.
197
197
197
197
.039
.836
.975
.067
.544
.055
.050
.450
.022
Between-subject effects
Grade
Sex
Grade × Sex
6.805
2.504
0.195
1. 197
1. 197
1. 197
.010
.115
.659
.738
.350
.072
.033
sex or for the Grade × Sex interaction, although there were
significant differences for grade, with the 6th-graders scoring
higher than the 5th-graders.
A main effect of course was observed in the differences
between the scores of the 5th- and 6th-graders. The mean
total score of the 6th-grade participants was higher than that
of the 5th-graders, although the effect size was moderate (η2
= 0.033) and did not indicate an intense effect.
Confirmatory Factor Analysis
We obtained the CFA estimations for two possible
measurement solutions (five-factor model vs. one-factor
model). The results of the ERLS estimations for the factor
loadings yielded the fit indexes presented in Table 5.
The analysis of the fit allowed us to improve the fit of
the one-factor model slightly, compared to the five-factor
Table 5
Goodness-of-fit Indexes of the Two Measurement Models Proposed in the Community Sample
Indexes
χ2
BBNFI
BBNNFI
CFI
IFI
RMR
SRMR
RMSEA
Five-Factor Model
One-Factor Model
642.522
df = 405
p < .001
.688
.843
.854
.856
.099
.116
.100
CI: .084 – .113
573.758
df = 395
p < .001
.721
.879
.890
.892
.097
.117
.088
CI: .071 – .102
Note. BBNFI = Bentler-Bonett normed fit index, BBNNFI = Bentler-Bonett nonnormed fit index, CFI = comparative fit index, IFI =
Bollen fit index, RMR = root mean square residual, SRMR = standardized root mean square residual, RMSEA = Root mean square
error of approximation, CI = 90% confidence interval.
646
FIGUERAS, AMADOR, AND GUÀRDIA
model. Although neither solution offered an adequate result
in the fit test (the values of χ2 were highly significant), the
more global fit indexes were somewhat better in the onefactor model, especially the Bentler-Bonnet indexes and the
values of the residual variance, in which the interval obtained
in the one-factor model was better than that of the fivefactor model. The comparison of these two solutions was
statistically significant. That is, the value of the TuckerLewis statistic (TLI) presented a value different from 0
(p < .001), so that, although the fits were not entirely
satisfactory for either of the two models, the evidence led
us to choose the one-factor model (see Table 6).
sample using the one-factor solution. Table 7 displays the
means and standard deviations of the RCDS according to
sex and grade. The boys’ means ranged between 47.64 and
58.25, and the girls’ between 51.60 and 59.67.
The differences as a function of grade and sex were
assessed by means of nonparametric statistics (KruskalWallis’ H and Mann-Witney’s U). No statistically significant
differences were found either for grade (H = 5.094, p =
.078) or for sex (U = 354, p = .119).
Reliability (Cronbach’s alpha coefficient) of the RCDS
was .90 (95% CI between .87 and .93). The correlations
between the scores of the RCDS and the CDI were .715 (p
< .001, 95% CI between .66 and .76).
Reliability and Validity
Diagnostic Precision
The one-dimensional solution was slightly more satisfactory
for this sample; therefore, we provide the values of reliability
and validity for this one-factor solution. Internal consistency
(Cronbach’s alpha) of the total scale was very good, both at
test (α = .87, 95% confidence interval [CI] between .82 and
.92), and at retest (α = .89, 95% CI between .84 and .94). testretest reliability was .66 (95% CI between .62 and .71).
Concurrent validity of the RCDS with the CDI was
assessed. The correlations between both instruments were
high and equivalent both at test phase (r = .767, p < .001,
95% CI between .71 and .81) and at retest (r = .771, p <
.001, 95% CI between .71 and .81).
Clinical Sample
Taking into account the results of the CFA of the
community sample, we structured the results of the clinical
In order to examine the diagnostic precision of the
instruments, we used sensitivity and specificity indexes.
Sensitivity is the capacity of a test to identify positive cases;
that is, the proportion of true positives. Specificity is the capacity
to discriminate negative cases; the proportion of true negatives.
Sensitivity and specificity vary according to the cut-off
points. In tests that assess psychopathological symptoms,
such as Achenbach’s (1991a, 1991b, 1991c) scales, the cutoff point is established at the T score of 70, or centile 98,
which corresponds to the mean plus two standard deviations.
This interpretation method assumes that all scores equal to
or higher than two standard deviations above the mean
indicate the presence of clinically significant symptomatology.
In this work, we studied the diagnostic precision of the
RCDS, understood as the ability to correctly classify the
participants into clinically significant groups by means of the
Table 6
Tucker-Lewis Indexes for the Analysis of the Two Solutions in the Community Sample
Hierarchical comparison of the models
Models compared
TLI
∆ χ2
∆ df
p
1-factor model – 5-factor model
.228
68.764
10
< .001
Note. TLI = Tucker-Lewis index.
Table 7
Means and Standard Deviations (in Brackets) of the RCDS Scores in the Clinical Sample as a Function of Grade (4th, 5th,
or 6th Grade of Primary Education)
Boys
Grade
4th Grade
5th Grade
6th Grade
TOTAL
Girls
Total
n
M
SD
n
M
SD
N
M
SD
11
12
14
37
47.64
58.25
45.93
50.43
(13.48)
(11.49)
(8.93)
(12.26)
5
6
14
25
51.60
59.67
57.14
56.64
(12.36)
(20.19)
(16.07)
(16.06)
16
18
28
62
48.87
58.72
51.54
52.94
(12.86)
(14.35)
(13.98)
(14.13)
647
PSYCHOMETRIC PROPERTIES OF THE REYNOLDS CHILD DEPRESSION SCALE
receiver operating characteristics (ROC) curve. To perform
this analysis, we used the group of 19 participants, diagnosed
as depressed by the clinical teams of the CYMHCs, and the
group of 45 nonsymptomatic participants. Figure 1 displays
the area under the curve and Table 8 shows the values of
sensitivity and specificity for the different cut-off points that
may be useful, depending on whether one wishes to increase
the sensitivity or the specificity when using the test. The area
under the curve was .93 (95% CI between .87 and .99). The
cut-off point that best combines the values of sensitivity and
specificity was 61; sensitivity of 0.79 (95% CI between .54
and .95) and specificity of 0.87 (95% CI between .73 and .95).
Figure 1. ROC curve. Area under the curve = 0.93 (95% confidence
interval from 0.87 to 0.99).
Conclusions
In this work, we present the psychometric characteristics
of the bilingual Spanish-Catalan version of the RCDS in
two samples, a community sample and a clinical sample.
The factor structure models studied in the community
sample did not yield an adequate degree of fit, although the
one-factor solution presented a better fit than the multifactor
(five-factor) solution. This improvement is not only present
in the global fit (which was not high in any of the cases);
however, in the one-factor solution, all the factor loadings
were statistically significant, which did not occur in the fivefactor solution. Therefore, our results indicate that the RCDS
is initially a one-dimensional test.
The reliability of the bilingual version of the RCDS,
measured by means of the internal consistency and the testretest correlation, is satisfactory; the concurrent validity with
the CDI is high, both for the community sample and the
clinical sample. These results are congruent with those of
other studies (Bartell & Reynolds, 1986; Del Barrio et al.,
1996; Reynolds, 1989; Reynolds & Graves, 1989).
The distribution of the scores of the community sample
confirms the tendency toward a decrease in the retest phase,
the so-called “attenuation effect” (Egger & Angold, 2004).
Various investigations have shown that repeated
administrations of self-reports are associated with a
significant decrease in the scores at the second administration
compared to the first (Finch, Saylor, Edwards, & McIntosh,
1987; Kaslow, Rehm, & Siegel, 1984; Meyer, Dyck, &
Petrinack, 1989). Moreover, the decrease of the scores at
the retest phase in the community sample shows that the
RCDS is sensitive to the temporal fluctuation that is common
in depressive symptomatology, even with short intervals
between administrations (Reynolds, 1989).
Table 8
Sensitivity and Specificity for Various Cut-off Points of the RCDS
Total RCDS Score (cut-off point)
Sensitivity
59
61
62
63
67
68
69
73
74
75
77
79
81
86
1.00
0.79
0.68
0.68
0.58
0.58
0.53
0.47
0.47
0.37
0.26
0.21
0.11
0.11
Note. CI = Confidence interval.
95% CI
0.82
0.544
0.43
0.43
0.34
0.34
0.29
0.24
0.24
0.16
0.09
0.06
0.01
0.01
-
1.00
0.94
0. 87
0.87
0.80
0.80
0.76
0.71
0.71
0.62
0.51
0.46
0.33
0.33
Specificity
0.87
0.87
0.875
0.90
0.91
0.93
0.93
0.93
0.96
0.96
0.98
0.98
0.98
1.00
95% CI
0.73
66.3
0.73
0.76
0.79
0.82
0.82
0.82
0.85
0.85
0.88
0.88
0.88
0.92
-
0.95
92.1
0.95
0.96
0.97
0.99
0.99
0.99
1.00
1.00
1.00
1.00
1.00
1.00
648
FIGUERAS, AMADOR, AND GUÀRDIA
The means and standard deviations obtained at the test
and retest phases in the community and clinical samples are
similar to those of other studies (Hepperlin, Stewart, & Rey,
1990; Reynolds, 1989; Reynolds et al., 1985). No significant
differences associated with sex were obtained, but significant
differences were observed in grade, with scores increasing
with age. These data confirm the tendency of no significant
sex differences in the presence of depressive symptomatology
before adolescence (Angold & Rutter, 1992; NolenHoeksema & Girgus, 1994).
Regarding the diagnostic utility of the RCDS, the cutoff point that best combines the indexes of sensitivity and
specificity was 61, lower than those presented by Reynolds
(1989) and Del Barrio et al. (1996). The differences may
be due to the estimation method of the cut-off point and
the selection of the contrast groups. In the case of Del
Barrio’s Spanish sample, the cut-off point of 65 was
estimated from the mean plus two standard deviations. If
we apply this formula to the data of this work, the cut-off
point would range between 68 (6th-graders) and 71 (5thgraders), slightly higher than the one presented by Del
Barrio et al (1996). The difference with the cut-off point
presented by Reynolds could be related to the different
method of forming the contrast groups. Reynolds used a
group of 82 participants who were assigned either to the
depressed group (10 participants) or to the nondepressed
group (72 participants) on the basis of their scores in the
Children’s Depression Rating Scale Revised (Poznanski,
Freeman, & Mokros, 1985). In our work, the group of
depressed participants had been diagnosed by the CYMHC
clinical services, according to the criteria of the DSM-IVTR (APA, 2000), disregarding the RCDS scores, whereas
the nonsymptomatic group comprised the participants who
did not exceed the cut-off point established by Reynolds,
both at test and retest.
Summing up, the bilingual Spanish-Catalan version of
the RCDS presents adequate psychometric properties, so it
can be considered a useful instrument to assess depressive
symptomatology within our context. However, it should be
taken into account that the data presented in this work were
collected in the city of Barcelona and in its province, so
that they should be used with the requisite caution with
populations other than the ones assessed.
References
Abad, J., & Amador, J. A. (1991). Teacher Report Form 4/18.
Bilingual Spanish-Catalan edition. Unpublished manuscript.
Facultat de Psicologia.Universitat de Barcelona.
Abad, J., & Forns, M. (1991a). Child Behavior Checklist 4/18.
Bilingual Spanish-Catalan edition. Unpublished manuscript.
Facultat de Psicologia Universitat de Barcelona.
Abad, J., & Forns, M. (1991b). Youth Self Report 11/18. Bilingual
Spanish-Catalan edition. Universitat de Barcelona.
Achenbach, T. M. (1991a). Manual for the Child Behavior
Checklist/4-18 and 1991 CBCL Profile. Burlington, VT:
University of Vermont.
Achenbach, T. M. (1991b). Manual for the Teacher’s Report Form
and 1991 TRF Profile. Burlington, VT: University of Vermont.
Achenbach, T. M. (1991c). Manual for the Youth Self Report and
1991 YSR Profile. Burlington, VT: University of Vermont.
American Psychiatric Association (APA). (2000). Diagnostic and
statistical manual of mental disorders (4th ed., text revision).
Washington, DC: Author.
Angold, A., & Rutter, M. (1992). Effects of age and pubertal status
on depression in a large clinical sample. Development and
Psychopathology, 4, 5-28.
Baker, J. A., & Reynolds, W. M. (1988, August). An examination of
the benefits of training teachers to recognize depressed students
in their classrooms. Paper presented at the 96th Annual Convention
of the American Psychological Association. Atlanta, GA.
Bartell, N. P., & Reynolds, W. M. (1986). Depression and selfesteem in academically gifted and nongifted children: A
comparison study. Journal of School Psychology, 24, 55-61.
Bentler, P., & Dijkstra, T. (1985). Efficient estimation via
linearization in structural models. In P. R. Krishnaiah (Ed.),
Multivariate analysis, VI (pp. 9-42). Amsterdam: North-Holland.
Bentler, P.M., & Wu, E.J.C. (2002). EQS 6 for Windows User’s
Guide. Encino, CA: Multivariate Software.
Brislin, R. W. (1986). The wording and translation of research
instruments. In W. J. Lonner & J. W. Berry (Eds.), Field
methods in cross-cultural psychology. (pp. 137-164). Newbury
Park, CA: Sage.
Brislin, R. W., Loner, W. J., & Thorndike, R. M. (1973). Crosscultural research methods. New York: Wiley.
Candell, G. L., & Hulin, C. L. (1987). Cross-language and crosscultural comparisons in scale translations. Journal of CrossCultural Psychology, 17, 417-440.
Coopersmith, S. (1981). Self-Esteem Inventory-Form B. Palo Alto,
CA: Consulting Psychologists Press.
Del Barrio, V. (1990). Situación actual de la evaluación de la
depresión infantil. Evaluación Psicológica / Psychological
Assessment, 6, 171-209.
Del Barrio, V., Colondrón, M. F., De Pablo, C., & Roa, M. L. (1996).
Primera adaptación de las escalas de depresión de Reynolds
RCDS y RADS a población española. RIDEP, 2, 75-100.
Egger, H. L. & Angold, A. (2004). The Preschool Age Psychiatric
Assessment (PAPA): A structured parent interview for
diagnosing psychiatric disorders in preschool children. In R.
Del Carmen-Wiggins & A. Carter (Eds.), Handbook of infant,
toddler, and preschool mental health assessment (pp. 223-243).
New York: Oxford University Press.
Finch, A. J., Saylor, C. F., Edwards, G. L., & McIntosh, J. A.
(1987). Children’s Depression Inventory: Reliability over
repeated administrations. Journal of Consulting and Clinical
Psychology, 16, 339-341.
Hepperlin, C. M., Stewart, G. W., & Rey, J. M. (1990). Extraction
of depression scores in adolescents from a general-purpose
behaviour checklist. Journal of Affective Disorders, 18, 105-112.
PSYCHOMETRIC PROPERTIES OF THE REYNOLDS CHILD DEPRESSION SCALE
Hollingshead, A. B. (1975). Four-factor index of social status.
Unpublished manual. New Haven, CT: Yale University.
Jané, M. C., Araneda, N., Valero, S. & Domènech-LLaberia, E.
(2000). Evaluación de la sintomatología depresiva del
preescolar: correspondencia entre los informes de padres y de
maestros. Psicothema, 12, 212-215.
Kaslow, N. P., Rehm, L. P., & Siegel, A. W. (1984). Social-cognitive
and cognitive correlates of depression in children. Journal of
Abnormal Child Psychology, 12, 605-620.
Kazdin, A. E. (1981). Assessment techniques for childhood
depression. Journal of the American Academy of Child
Psychiatry, 20, 358-375.
Kazdin, A. E., & Petti, T. A. (1982). Self-report and interview
measures of childhood and adolescent depression. Journal of
Child Psychology and Psychiatry, 23, 437-457.
Klein, D. N., Dougherty, L. R. & Olino, T. M. (2005). Toward
guidelines for evidence-based assessment of depression in
children and adolescents. Journal of Clinical Child and
Adolescent Psychiatry, 34, 412-432.
Kovacs, M. (1992). Manual of the Children’s Depression Inventory.
Toronto: Multi-Health Systems. [Spanish translation and
adaptation: Del Barrio, V., & Carrasco, M. A. CDI. Inventario
de depresión infantil. Madrid: TEA Ediciones, 2004].
López, N. (1985). Assessing depressive symptoms using the Child
Depression Scale and the Children’s Depression Inventory: A
cross cultural comparison of children in Puerto Rico and the
United States. Unpublished doctoral dissertation. University
of Wisconsin-Madison.
Mash, E. J. & Hunsley, J. (2005). Evidence-based assessment of
child and adolescent disorders: Issues and challenges. Journal
of Clinical Child and Adolescent Psychology, 34, 362-379.
Meyer N. E., Dyck, D. G., & Petrinack, R. J. (1989). Cognitive
appraisal and attributional correlates of depressive symptoms
in children. Journal of Abnormal Child Psychology, 17, 325336.
Nolen-Hoeksema, S., & Girgus, J. S. (1994). The emergence of
gender differences in depression during adolescence.
Psychological Bulletin, 115, 424-443.
Orvaschel, H. (2004). Depressive disorders. In M. Hersen (Ed.),
Psychological assessment in clinical practice: A pragmatic
guide (pp. 297-319). New York: Brunner-Routledge.
Poznanski, E. O., Freeman, L. N., & Mokros, H. B. (1985).
Children’s Depression Rating Scale - Revised. Psychological
Bulletin, 21, 979-989
649
Rawson, H. E., & Tabb, L. (1993). Effects of therapeutic
intervention on childhood depression. Child and Adolescent
Social Work Journal, 10, 39-52.
Reynolds, W. M. (1986). A model for screening and identification
of depressed children and adolescents in school settings.
Professional School Psychology, 1, 117-129.
Reynolds, W. M. (1987). Reynolds Adolescent Depression Scale.
Professional manual. Odessa, FL: Psychological Assessment
Resources.
Reynolds, W. M. (1989). Reynolds Child Depression Scale.
Professional manual. Odessa, FL: Psychological Assessment
Resources.
Reynolds, W. M. (2002). Reynolds Adolescent Depression Scale –
2nd Edition. Professional manual. Odessa, FL: Psychological
Assessment Resources.
Reynolds, W. M., Anderson, G., & Bartell, N. (1985). Measuring
depression in children: A multimethod assessment investigation.
Journal of Abnormal Child Psychology, 13, 513-526.
Reynolds, W. M., & Graves, A. (1989). Reliability of children’s
reports of depressive symptomatology. Journal of Abnormal
Child Psychology, 17, 647-655.
Shafii, M., & Shafii, S. L. (1992). Dynamic Psychoterapy of
Depression. In M. Shafii & S. L. Shafii (Eds.), Clinical guide
to depression in children and adolescents (pp. 157-176)
Washington, DC: American Psychiatric Press. [Spanish
translation: Psicoterapia dinámica de la depresión. In M. Shafii
& S. L. Shafii (Eds.), La depresión en niños y adolescentes.
(pp.142-151) Barcelona: Martínez Roca, 1995].
Stark, K. D., Reynolds, W. M., & Kaslow, N. J. (1987). A
comparison of the relative efficacy of self-control therapy and
behavioral problem-solving therapy for depression in children.
Journal of Abnormal Child Psychology, 15, 91-113.
Tisher, M., & Lang, M. (1978). Children’s Depression Scale:
Research Edition. Melbourne: The Australian Council for
Educational Research. [Spanish translation: Cuestionario de
Depresión para Niños. Madrid: TEA, 1983]
World Health Organization (WHO). (1992). The ICD-10
Classification of mental and behavioural disorders. Clinical
descriptions and diagnostic guidelines (10th revision) (CIE10). Geneva: Author.
Received December 29, 2006
Revision received December 30, 2007
Accepted January 22, 2008


© Copyright 2026