
Extraction of natural dye from marigold flower
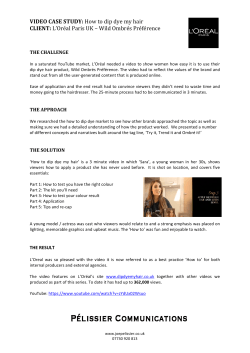
Available online at www.scholarsresearchlibrary.com
Scholars Research Library
Der Pharmacia Lettre, 2015, 7 (1):185-195
(http://scholarsresearchlibrary.com/archive.html)
ISSN 0975-5071
USA CODEN: DPLEB4
Extraction of natural dye from marigold flower (Tageteserectal.) and dyeing of
fabric and yarns: A focus on colorimetric analysis and fastness properties
Chandan Kumar Jha, Ratan Kumar, Venkat Kumar S. and Devi Rajeswari V.*
School of Biosciences and Technology, VIT University, Vellore, Tamilnadu, India
_____________________________________________________________________________________________
ABSTRACT
India has a very rich diversity and plantkingdom is certainly a treasure house of diverse natural products. One such
product from nature is the dye. In this study, natural colorants mainly flavonoids and carotenoids present in the
Marigold flower (TageteserectaL.) were extracted using Soxhlet extraction method and other conventional
techniques under different operating conditions. Spectrophotometric method based on the Aluminium complex
formation was used for the determination of total flavonoids concentration in the extracts of different solvents used.
The dye potential of the colorants obtained from the marigold was evaluated by coloring pure cotton fabrics and the
yarns of pure cotton and wool. Various metal salts were used as mordants to set extracted dye on the fabrics and
yarns. Study about fastness tests of dyed clothes was undertaken. The color shade differences, L*, a*, b*, ∆E values
and K/S values were estimated using CCM software (GretagMacbath 7000 A º spectrophotometer). The maximum
strength of the dye was found in the Ethanol-Water mixture (70:30 v/v) as a solvent. The surface color of the dyed
fabrics and yarns was not affected by washing. The different color shades were obtained for various mordants used.
Most of the mordants showed higher K/S value due to their ability to form coordination complexes. Good light
fastness, wash fastness and rubbing fastness were observed in case of fabrics mordanted with ferrous sulphate. The
relative colour strength of the dye was found to be more in case of cotton clothes mordanted with ferrous sulphate.
These findings reveal that Tageteserecta L. can serve as a potential source of natural colorant which can be used in
textile industry for dyeing purpose.A GC-MS analysis was done to identify the compounds present in the dye extract.
Keywords: Natural colorants, dye potential, Tageteserecta.
_____________________________________________________________________________________________
INTRODUCTION
With the public enhanced cognizance to eco-safety and health concerns, eco-friendly and non-toxic bio-resource
products are regaining popularity in different spheres of our lives. Natural dyes , obtained from different sources
such as plants, animals, and minerals, are renewable and sustainable bio-resource products with minimum
environmental impact and known since antiquity for their use, not only in coloration of textiles but also as food
ingredients and cosmetics [1-3]. With the discovery of synthetic ,dye ‘Mauve’ by W.H. Perkin 1856 and subsequent
upsurge in research, production and application of synthetic dyes, use of natural colorants declined sharply,
however, the application of number ofsynthetic dyes has detrimental effects on environment and associated allergic,
toxic, carcinogenic, harmful responses [4]. Amidst growing environmental and health concerns eco-friendly nontoxic natural dyes re-emerged as a potential viable ‘’ Green chemistry’ option as an alternative/co-partner to some
extent to synthetic dyes [5]. Recent resurgence in research and development on natural dye production and
application is observed due to increasing popularity of more natural lifestyle based on naturally sustainable goods.
Natural flora/fauna is full of exquisite colors, fascinating and attracting human being towards a vast portfolio of
possibilities. A large number of plant and animal/insect sources have been identified for extraction of color and their
diversified use in textile dyeing and other disciplines [6- 8].
185
Scholar Research Library
Devi Rajeswari V. et al
Der Pharmacia Lettre, 2015, 7 (1):185-195
______________________________________________________________________________
Nature has gifted us with more than 500 dye-yielding plants[9]. One such dye –yielding plant species is
Tageteserecta L., commonly known as Mexican Marigold because of its origin. This research was performed with
the explicit objective of extracting natural dye from the petals of Mexican marigold flower using different solvents
such as Methanol, Ethanol, Hexane and Water, and to investigate its dyeing effects on different fabrics and yarn
samples. The effects of various mordants on the stability of the dye as well as on the color shade were also analyzed.
The color shade differences, L*, a*, b*, ∆E values and K/S values were estimated via CCM software analysis tool
using GretagMacbath 7000 A º spectrophotometer. Light fastness, Wash fastness and Rubbing fastness were also
evaluated for fabrics and yarn samples.
MATERIALS AND METHODS
Flower
A dark yellow variety of marigold flowers were purchased from Vellore flower market, Tamil nadu, India.
Substrates and Chemicals
Substrates such as cotton fabrics, yarns of wool and cotton were used for dyeing process.
Chemicals such asPotashAlum, Copper sulphate, Stannous chloride, Ferrous sulphate, Potassium dichromate, Cream
of tartar, Sodium carbonate, Ethanol, Methanol, Formic acid and Sodium hydroxide
Equipments
Weighing balance, Water bath, Soxhlet apparatus, Hot air oven, UV-Vis Spectrophotometer, Gretag Macbath 7000
A º spectrophotometer
Conventional methods
Aqueous extraction method: In this method, dye from flowers were extracted by preparing an aqueous solution of
the dried flowers (3.3 g in 100 mL distilled water) and the extraction process was carried out at a temperature range
of 50ºC -95ºC for 2 hours. Colouring materials from the flowers were extracted for dyeing of the fabric and yarn
samples. After the extraction procedure is complete, the flowers were taken out from the liquor and they were taken
for extraction of dye for the second time [10].
Aqueous-Ethanol extraction method: Finely crushed dry flowers (powdered form) were taken in three different 250
ml conical flasks containing 60%, 70% and 100% Ethanol respectively. The flasks were incubated over a water bath
for 4 hours at 68ºC. After the extraction process is complete, the dye solutions were left overnight in a hot air oven
to obtain the dye extracts [11].
Soxhlet extraction method
This method was carried out in order to avoid the filtration of the solvent and residue and also to obtain better
efficiency of separation. The organic solvents such as Ethanol, Methanol and Hexane were used for this extraction
method. In this method, the weighed quantity of feed (F) or raw material and measured volume of solvent (S) were
taken in certain F/S ratio. The raw material (finely crushed dry flower) was kept in thimble of Soxhlet extractor and
the solvent was poured in the round bottom flask and a condenser with high flow rate of water is fitted over it. The
extraction was carried for 4-5 hours and the volume of the solutions thus obtained was measured. For the
evaporation of solvent, a rotary evaporator was used and the remaining dye extract is weighed [11].
Dyeing process
Scouring of cotton fabrics as well as the yarns of cotton and wool were done by washing it in a solution containing
0.5g/L Sodium carbonate and 2g/L non-ionic detergent (Triton-X) at 50°C for 25 minutes, keeping the material (M)
to liquor (L) ratio of 1:40.The scoured fabrics and yarns were thoroughly washed with tap water and dried at room
temperature. The scoured materials were soaked in clean water for 30 minutes prior to dyeing or mordanting[12].
Mordanting was carried out by accurately weighing cotton fabrics and yarns of cotton and wool and the same were
treated with different metal salts as mordants. The mordants used were Ferrous sulfate, Copper Sulfate, Potassium
dichromate, Potash alum and Stannous chloride.The mordant (2 %, 4% owf separately) was dissolved in distilled
water to make a material to liquor ratio of 1:40. The samples were dipped into the mordant solution and incubatedfor
1/2 hour at temperature range of 80 -85 ºC. After mordanting, the fabric and yarn samples were taken out, squeezed
and dried at room temperature. The mordanted samples were immediately used for dyeing.
The conventional dyeing technique was used for the dyeing of mordanted as well as for the non-mordanted fabrics
and yarn samples. The cotton samples were dyed directly with the dye extract by keeping the M: L ratio as 1:40;
186
Scholar Research Library
Devi Rajeswari V. et al
Der Pharmacia Lettre, 2015, 7 (1):185-195
______________________________________________________________________________
however in case of wool yarn, the pH ofthe dye extract was adjusted to 5 by adding Formic acid. The M: L ratio was
kept as 1: 40 even in the case of wool dyeing. The dyeing process was carried out for 2 hours in a water bath at
85º.After the completion of dyeing; the samples were washed off with cold water and dried at the room temperature.
The dyed samples were then dipped in a brine solution for dye fixing.
Color measurement
The color strength of the colored samples was analyzed using CCM software (GretagMacbath 7000 A º
spectrophotometer). L*, a*, b* values were obtained. The maximum value for L* is 100 which represents a perfect
reflecting diffuser. The minimum value for L* is 0 which represents black. Positive ‘a’ is red; negative ‘a’ is green.
Positive ‘b’ is yellow and negative ‘b’ is blue. The color axis are based on the fact that colors cannot be both red and
green, or both blue and yellow, because these colors oppose each other. The average color values for the samples
were recorded and the total color difference ∆E* was calculated, which was single value that takes into account the
differences between L*, a*, b* of the sample and the standard.
∆E = (∆L2 + ∆a*2 +∆b*2)1/2
Three replicates were taken for all individual parameters and statistical analysis was conducted.This method also
involves Kulbelka- Munk K/S equation, which indicates that the production of reflected light involves absorption
and scattering. K/S value denotes the fabric color strength. Based on the % reflectance (R), K/S can be calculated by
the following formula:
K/S = (1-R) 2/ 2R
where K is the absorption coefficient and S is the Scattering coefficient [12, 14].
Fastness tests
The dyed material was tested for wash fastness, light fastness, and rubbing fastness. The color is usually rated by
loss of depth of color in original sample [7]. The required condition for the tests is specified in different standard
including International Organization for standardization (ISO) and the American Association of Textile Chemists
and Colorists (ATCC). ISO 105 B02:1994 Amd: 2000, AATCC TM 61-2010, ISO 105 X12:2001 were used for
light fastness, wash fastness and rubbing fastness respectively.
Scores for wash fastness and rubbing fastness: 5-excellent; 4-Good, 3- Fair, 2-Poor, 1- Very Poor
Scores for light fastness: 1- Very Poor; 2-Poor; 3- Moderate; 4- Fairly good; 5-Good; 6- Very good; 7- Excellent; 8Outstanding.
Total Flavonoid determination
Aluminium chloride colorimetric method was used for flavonoids determination. A known volume of extract (0.5 ml
of 1:10g/ml in methanol) was placed in a test tube. Distilled water was added to make it 5ml, and 0.3ml of NaNO2
(1:20) was added to it. After 5 min, 3ml of AlCl3 (1:10) was added. 2ml (1mol/L) of NaOH was added after 6 min of
incubation at room temperature. The total volume was made up to 10ml with distilled water. The solution was mixed
well and the absorbance was measured against a blank at 423nm using UV-Vis spectrophotometer (Schimadzu)
[15].Quercetin was used as the standard for a calibration curve (Fig. 1). The Flavonoid content was calculated using
the following linear equation based on the calibration curve.
A = 0.0409C + 0.0575; R² = 0.9966
where ‘A’ is the absorbance and ‘C’ is the flavonoid content in µg g-1 (Quercetinequivalent).
GC-MS analysis
C-MS analysis of the dye extracts (Ethanol extract, Methanol extract and aqueous extract) obtained from the flowers
of Tageteserecta L. was performed using a Perker- Elmer Clarus 680 system coupled with Clarus 600 (EI) Mass
spectrometer (MS). The Acquisition parameters of the GC-MS system were as follows:
Oven: Initial temp 60°C for 2 min, ramp 10°C/min to 300°C, hold 6 min, InjAauto=250°C,
Volume=0 µL,
Split=10:1, Carrier Oven: Initial temp 60°C for 2 min, ramp 10°C/min to 300°C, hold 6 min, InjAauto=250°C,
Volume=0 µL, Split=10:1, Carrier Gas=He, Solvent Delay=2.00 min, Transfer Temp=240°C, Source Temp=240°C,
Scan: 50 to 600Da, Column 30.0m x 250µm.The results were analyzed using Library version NIST-2008 (software:
Turbo Mass ver.5.4.2).
187
Scholar Research Library
Devi Rajeswari V. et al
Der Pharmacia Lettre, 2015, 7 (1):185-195
______________________________________________________________________________
RESULTS AND DISCUSSION
A = 0.0409C + 0.0575
R² = 0.9966
Absorbance at 423nm
2.5
2
1.5
1
0.5
0
0
10
20
30
40
50
60
Concentration (µg/ml)
.
Concentration(µg/ml)
Fig.1. Standard curve of Quercetin
50
45
40
35
30
25
20
15
10
5
0
50
60
70
80
95
50
60
70
80
95
Temperture (º C)
.
Fig.2. Dye concentration at different temperatures (Aqueous extraction)
4
Concentration(µg/ml)
3.5
3
EtOH 100%
2.5
2
EtOH 70%
1.5
EtOH 60%
MeOH 100%
1
0.5
0
EtOH 100%
EtOH 70%
EtOH 60%
MeOH 100%
Fig.3.Dye concentration in different solvents
A dark yellownatural dye extract was obtained from Tageteserecta by using conventional methods and Soxhlet
extraction method. In case of conventional methods, the extraction process was carried at different temperatures and
188
Scholar Research Library
Devi Rajeswari V. et al
Der Pharmacia Lettre, 2015, 7 (1):185-195
______________________________________________________________________________
with different solvents with an explicit objective of determining the optimum extraction conditions. The strength of
the dye extracts increases with increasing temperature. Dye extracted from the marigold usually contains flavonoids
and carotenoids. The major flavonoids present in the marigold flower are Quercetagin-7-methyl ether, Quercetagin5-methyl ether, Quercetagin-5, 7-dimethyl ether and Quercetagin-3-O-glucoside [16]. Figure (2) shows the
concentration of dye extracts obtained at different temperatures in aqueous extraction method. The maximum
concentration of dye extract was obtained at 95ºC. Whereas figure (3) shows the concentration of dye extracts
obtained using different solvents. The maximum concentration was obtained when 70% Ethanol was used as an
organic solvent.
Colouring effect of extracted dye and mordants
Dark yellowextract was obtained from the flowers of Tageteserecta. Mordants play a very important role in
imparting color to the fabric. The mordants used in combination in different ratios gave various shades to the fabrics
and yarn samples. Better color strength results are dependent on the mordant used. The different shades were
obtained from a single dye, using different mordants like Potassium dichromate, stannous chloride, Potash alum,
Copper sulfate, and ferrous sulfate. The mordanted cotton and wool yarns were immediately used for dyeing
because some mordants are light sensitive. Figure 4 shows the samples dyed with the extracted dye without using
any mordant, whereas figures 5, 6, 7, 8 and 9 show the dyed samples pre-mordanted with Potassium dichromate,
Stannous chloride, Potash alum, Copper sulfate and Ferrous sulphate respectively. The intensity of the color
produced on cloth and yarns by dyeing without mordanting was found slightly less than that obtained for mordants
and dye used successively. The application of natural dyes in textile industry for various purposes, viz. Dyeing of
yarns, which are then woven into cloth, carpet or any other usable form; dyeing of cloths woven earlier and block
printing, where the textile materials are printed with the help of printing blocks .Natural dyes are now as days in
demand not only in textile industry but also in cosmetics, food, leather and pharmaceuticals. The rich diversity of
our country has provided us plenty of raw materials, yet sustainable linkage must be developed between cultivation,
collection, and their use.
Fig.4: Coloring effect of dye (no mordant)
Fig.6: Stannous chloride as a mordant
Fig.5:Potassium dichromate as a mordant
Fig.7: Potash alum as a mordant
189
Scholar Research Library
Devi Rajeswari V. et al
Der Pharmacia Lettre, 2015, 7 (1):185-195
______________________________________________________________________________
Fig.8: Copper sulfate as a mordant
Fig.9: Ferrous sulfate as a mordant
Tab.1: Color measurement values for standard cotton sample
Sample
Illuminating sources
D65-10
A-10
F02-10 (CWF)
Standard for cotton samples
L*
76
77.46
77.01
a*
-3.21
3.88
-2.49
b*
31.59
30.39
36.5
% STR-WSUM
100
100
100
Tab.2: Color measurement values for standard wool yarn sample
Sample
Standard for wool yarn
Illuminating sources
D65-10
A-10
F02-10 (CWF)
L*
79.39
80.72
80.26
a*
-1.65
4.25
-1.24
b*
24.97
24.58
28.11
%STR-WSUM
100
100
100
Tab.3: Color measurement values for dyed cotton sample pre-mordanted with different metal Salts
Mordants
Illuminating sources
D65-10
A-10
F02-10 (CWF)
L*
75.98
77.4
76.97
a*
-3.45
3.63
-2.66
b*
31.32
30.06
36.21
∆L*
-0.02
-0.06
-0.05
∆a*
-0.25
-0.25
-0.17
∆b*
-0.26
-0.33
-0.29
%STR-WSUM
99.51
99.93
99.66
∆E*
0.36
0.42
0.34
Stannous Chloride
D65-10
A-10
F02-10 (CWF)
73.25
76.17
75.59
0.95
8.64
-0.39
62.14
62.17
69
-2.75
-1.29
-1.42
4.16
4.76
2.1
30.58
31.78
32.5
333.09
274.1
322.93
30.96
32.16
32.6
Copper Sulfate
D65-10
A-10
F02-10 (CWF)
79.39
80.72
80.26
-1.65
4.25
-1.24
24.97
24.58
28.11
-16.88
-15.98
-16.01
4.36
3.48
2.61
14.65
16.14
15.1
450.82
450.02
454.21
22.75
22.98
22.16
Potash Alum
D65-10
A-10
F02-10 (CWF)
76.41
78.14
77.64
-3.43
4.53
-2.64
38.64
37.32
44.22
0.41
0.68
0.62
-0.22
0.64
-0.61
7.05
6.93
7.72
122.07
113.29
121.89
7.07
6.99
7.75
Ferrous sulfate
D65-10
A-10
F02-10 (CWF)
16.76
17.21
17.94
5.33
9.79
4.66
8.56
8.13
12.39
-59.24
-60.25
-59.07
8.54
5.91
7.15
-23.03
-22.26
-24.11
513.63
512.94
516.39
64.13
64.5
64.2
Potassium
dichromate
Colorometric parameters and color strength
The color yields of samples dyed without any mordant and the samples dyed with different mordants were evaluated
using CCM software (GretagMacbath 7000 A º spectrophotometer). The color strength (K/S value) was studied
using Kubelka-Munk equation: K/S = (1-R) 2/ 2R where R is the decimal fraction of the reflectance of the dyed
fabrics and yarns. The fabrics and the yarn samples pre-mordanted with Potassium dichromate, Stannous chloride,
Potash alum, Copper sulfate and Ferrous sulphate were dyed using the aqueous extract of Tageteserecta. The
different mordants not only caused the differences in hue color and significant changes in K/S values but also L*
values and brightness index values. Most of the metal salts exhibited the higher K/S values due to their ability to
form coordination complexes with the dye molecules. The strong coordination tendency between the fibres and the
dye results in high uptake of dye. Figures 10, 11 show the K/S values of the dyed cotton and the wool yarn
respectively. The highest K/S value was found in dyed cotton pre-mordanted with Ferrous sulfate. Tables 1, 2 show
the color measurement values for the standard samples of cotton and wool yarn respectively. For the measurement
of L*, a*, b* and %STR-WSUM values, three illuminating sources such as D65-10, A-10 and F02-10 (CWF) were
used. The values of % STR-WSUM gives the information about the color shade differences. Ferrous sulphate results
190
Scholar Research Library
Devi Rajeswari V. et al
Der Pharmacia Lettre, 2015, 7 (1):185-195
______________________________________________________________________________
in the highest increase in colour depth (∆L* =-59.24), followed by Copper sulphate (∆L* = -16.88), Stannous
chloride (∆L* = -2.75) and Potash alum (∆L* = 0.41). Tables 3, 4 show the Color measurement values for dyed
cotton and the wool yarn respectively with different mordants.
Tab.4: Color measurement values for dyed wool sample pre-mordanted with different metal salts
Mordants
Illuminating sources
D65-10
A-10
F02-10 (CWF)
L*
16.76
17.21
17.94
a*
5.33
9.79
4.66
b*
8.56
8.13
12.3
∆L*
-59.24
-60.25
-59.07
∆a*
8.54
5.91
7.15
∆b*
-23.0
-22.2
-24.1
%STR-WSUM
513.63
512.94
516.39
∆E*
64.13
64.5
64.2
Stannous Chloride
D65-10
A-10
F02-10 (CWF)
79.14
80.53
80.05
-1.51
4.5
-1.17
25.82
25.46
29.12
-0.25
-0.19
-0.21
0.13
0.25
0.07
0.85
0.88
1.01
105.38
104.11
105.19
0.89
0.93
1.04
Copper Sulfate
D65-10
A-10
F02-10 (CWF)
69.26
70.92
70.27
1.94
7.62
1.05
29.02
29.83
32.51
10.35
9.8
10
3.58
3.38
2.29
4.05
5.24
4.4
232.62
247.76
235.11
11.68
11.61
11.16
Ferrous sulfate
20
K/S Value
15
Pot.Dichromate
Stannous Chloride
Potash Alum
Copper Sulfate
Ferrous Sulphate
10
5
0
.
Fig. 10: Graph representing the K/S Value of cotton fabrics dyed along with different mordants
10
K/S Value
8
Stannous Chloride
6
Copper Sulfate
4
Ferrous Sulfate
2
0
.
Fig.11: Graph representing the K/S Value of wool yarn dyed along with different mordants
Fastness properties of dyed samples
Color fastness test of dyed fabrics
Natural dyes have poor to moderate wash fastness as compared to synthetic dyes having moderate to excellent color
fastness properties. Light fastness of many natural dyes, particularly which are extracted from flower parts are found
to be poor to medium [7]. Poor light fastness of some natural dyes is attributable to photo oxidation of the
chromophore. Such photo oxidation can be minimized by forming complex of the dye with transition metal. To
improve the wash and light fastness of these dyed cotton fabrics, the dyed cotton fabrics should be further treated
with selected cationic dye-fixing agents and also with an UV- absorber compound respectively. Natural dyes can be
used on most types of material or fiber but the level of success in terms fastness and clarity of color varies
considerably. It is found that natural dyeing of certain plant based textiles can be less successful than their animal
equivalent. So, an extensive work has been carried out to improve the light fastness of different natural dyed textiles
[7, 17-19]. To obtain varying color, to increase the dye uptake and to improve the color fastness behaviourof any
natural dye for future line of work, it can be suggested that different types and selective mordants or their
combination can be appliedon textile fabrics or some natural vegetable fixing agents can be used. Many
investigations revealed that the use of combination of mordants in varying ratios give different shade anddifferent
color fastness results [20]. Tables 6, 7show the effect of washing, rubbing and exposure to sunlight on the color
191
Scholar Research Library
Devi Rajeswari V. et al
Der Pharmacia Lettre, 2015, 7 (1):185-195
______________________________________________________________________________
fastness of marigold dyed samples. As expected, the mordanted specimen exhibited better color fastness compared
to samples on which no mordant was applied.
Color fastness to washing
In case of dyed cotton samples, all the mordants except Alum showed good to excellent fastness (4-5) to washing.
Alum offered fair to good (3-4) fastness. But in case of dyed wool yarn, Stannous chloride offered poor to fair (2-3)
fastness, Potash alum offered fair to good fastness (3-4) and all the other mordants offered good to excellent (4-5)
fastness.
Color fastness to light
Cotton samples dyed along with mordants such as Potassium dichromate and Stannous chloride exhibited moderate
to fairly good fastness (3-4) against light whereas mordants such as Potash alum, Copper sulfate and Ferrous sulfate
offered fairly good to good (4-5) fastness. Wool yarn dyed along with the mordants such as Potassium dichromate
and Stannous chloride exhibited poor to moderate (2-3) fastness whereas mordants such as Copper sulfate and
Ferrous sulfate exhibited fairly good to good (4-5) fastness.
Tab.5: Color fastness values for dyed cotton
S.No
Name of Mordant
Mordant Concentration
No Mordant
Light Fastness
ISO 105 B02:1994 Amd :2000
1-2
Wash Fastness
AATCC TM 61-2010
2
Rubbing Fastness
ISO 105 X12:2001
2
1.
Potassium Dichromate
2%
4%
2-3
2-3
3-4
3-4
4
4
2.
Stannous Chloride
2%
4%
2-3
4-3
2-3
2-3
4
4
3.
Potash Alum
2%
4%
3
3
3-4
3-4
4
4
4.
Copper Sulfate
2%
4%
4
4
4
4-5
4-5
4-5
5.
Ferrous Sulfate
2%
4%
4-5
4-5
4
4
4
4
Light Fastness
ISO 105 B02:1994 Amd :2000
2
Wash Fastness
AATCC TM 61-2010
2-3
Rubbing Fastness
ISO 105 X12:2001
3
Tab.6: Color fastness values for dyed wool yarn
S.No
Name of Mordant
Mordant Concentration
No Mordant
1.
Potassium Dichromate
2%
4%
2
3
2-3
4
3
4
2.
Stannous Chloride
2%
4%
3
3-4
4
4
4
4
3.
Potash Alum
2%
4%
4
4
3-4
3-4
4-5
4-5
4.
Copper Sulfate
2%
4%
4
4
4
4
4
4
5.
Ferrous Sulfate
2%
4%
4
4-5
4-5
4-5
4
4
Color fastness to rubbing
Color fastness was found be good to excellent (4-5) for all the cotton samples as well as for the wool yarn sample
dyed along with all the mordants.
GC-MS analysis
GC-MS of dye extracts obtained from the flowers of Tageteserecta L. using solvents such as Ethanol, Methanol and
water led to the identification of various compounds. The chromatogram of ethanol extract, methanol extract and
aqueous extract are shown in the figures 9, 10 and 11. The various compounds detected by GC-MS in different
192
Scholar Research Library
Devi Rajeswari V. et al
Der Pharmacia Lettre, 2015, 7 (1):185-195
______________________________________________________________________________
extracts are shown along with their respective retention time and area percentage in tables 8, 9 and 10. The presence
of various components with different retention (RT) times was confirmed by GC-MS spectra. The mass
spectroscopy analyzes the components eluted at different times to identify the structure and the nature of the
compounds. The fragmentation of large compound into small ones gives rise to appearance of peaks at different m/z
ratios. These mass spectra act as a fingerprint of the very compound that can be identified from the library. The
results of the GC-MS analysis showed the presence of various alkaloids, glycosides, flavonoidderivatives, phenols,
reducing sugars, steroids and terpenoids and can be further analyzed for more specifications.
Fig.12: GC-MS chromatogram of Tageteserecta aqueous extract
Fig.13: GC-MS chromatogram of Tageteserecta ethanolic extract
Tab.8: Compounds identified in aqueous extract of Tageteserecta
S.no
Name of the compound
Mol.Wt.
1.
2.
3.
4.
5.
6.
7.
8.
9.
10.
10,12-Dimethyl-1,4,7-trioxa-10,12-diazacyclotetradecan-11-one
2-oxo-2-(4-phenylphenyl)ethyl 2-hydroxy-3-methylbenzoate
6-Tert-butyl-8-methyl-1H,2H,3H-cyclopenta[c]chromen-4-one
2,2-Dimethyl-5-[2-(2-trimethylsilylethoxymethoxy)-propyl]-[1,3] dioxol
2-n-Hexylthio-5-methyl-imidazoline
I-Propyl tricosanoate
Alpha.-d-glucopyranoside, O-.alpha.-D-glucopyranosyl
Beta-D-lyxofuranoside, thio-decyl
Benzoic acid, 4-hydroxy-3,5-dimethoxy
Benzenemethanol, 3,4,5-trimethoxy
246
346
256
318
200
396
504
306
198
198
Molecular
formula
C11H22O4N2
C22H18O4
C17H20O2
C15H30O5Si
C10H20N2S
C26H52O2
C18H32O16
C15H30O4S
C9H10O5
C10H14O4
RT(min)
Area %
10.232
10.732
11.617
12.397
12.923
13.563
14.063
15.158
18.230
18.410
9.197
8.219
3.468
6.262
3.575
4.172
30.370
4.557
3.167
3.697
193
Scholar Research Library
Devi Rajeswari V. et al
Der Pharmacia Lettre, 2015, 7 (1):185-195
______________________________________________________________________________
Fig.14: GC-MS chromatogram of Tageteserecta ethanolic extract
Tab.9: Compounds identified in ethanolic extract of Tageteserecta
S.no.
Name of the compound
Mol.Wt.
1.
2.
3.
4.
5.
6.
7.
Acetic acid, 2-(5-nitro-2-benzimidazolyl) thio-, benzyl ester
n-benzoyl-dl-phenylalanine
Beta.-d-mannofuranoside, 1-O-5-phenylpent-1-yl
Alpha.-d-mannofuranose, 2,3-5,6-di-O-phenylboranediyl
1,2-benzenedicarboxylic acid, mono(2-ethylhexyl) ester
Silane, trichlorooctadecyl
Trimethyl[4-(1,1,3,3,-tetramethylbutyl)phenoxy] silane
343
269
326
352
278
386
278
Molecular
formula
C16H13O4N3S
C16H15O3N
C17H26O6
C18H18O6B2
C16H22O4
C18H37Cl3Si
C17H30OSi
RT(min)
Area %
11.657
13.563
18.685
19.430
23.162
25.673
27.098
79.011
2.845
4.625
2.361
8.113
0.878
1.189
Tab.10: Compounds identified in methanolic extract of Tageteserecta
S.no
1.
2.
3.
4.
5.
6.
7.
8.
Name of the compound
2-Dimethyl(prop-2-enyl)silyloxydodecane
5-Dimethyl(trimethylsilyl)silyloxytridecane
2H-Pyran, tetrahydro-2-[(1-methyl-4-phenyl-2-butynyl)oxy]Succinic acid, 2-methoxyethyl undecyl ester
Diethylene glycol, O,O-di(pivaloyl)
2-Ethoxycarbonylsyringic acid
1-decanol, 9-[(trimethylsilyl)oxy]-, trifluoroacetate
Exo-2-[(2-trimethylsilyl) vinyl]bicyclo[2.2.1]hept-5-en-2-ol
Mol.Wt.
284
330
244
330
274
270
342
208
Molecular formula
C17H36OSi
C18H42OSi2
C16H20O2
C18H34O5
C14H26O5
C12H14O7
C15H29O3F3Si
C12H20OSi
RT(min)
10.362
10.812
12.362
13.913
15.058
16.124
18.180
18.590
Area %
4.257
6.489
6.798
20.809
4.833
4.107
5.523
5.146
CONCLUSION
The present study showed that natural dye can be successfully extracted from the flowers of Tageteserecta. The
whole process of extraction is eco-friendly. The maximum dye extraction was observed at 95ºC using aqueous
extraction method. The obtained results have shown that the dyeing potential of the marigold flower could be huge
which can be used as a source of textile dyeing. The various color shades can be obtained using safe and ecofriendly mordants. Detailed scientific research with natural dyes has revealed that their properties are comparable to
that of synthetic dyes. If natural dyes have to be commercialized, the traditional methods must be substituted by
modern, more scientific approach in order to overcome to overcome some of the disadvantages of natural dye.
REFERENCES
[1] A.C. Dwek,Int. J. Cosmet, 2002, 24, 287.
[2] D. Frick, Rec. Prog. Color,2003, 33, 15.
[3] S.J.F. Kadolph,Delta Kappa Gamma Bull. 2008, 75, 74.
[4] T. Bechtold, A. Turcanu,E. Gangberger, S. Geissler,J. Clean. Prod,2003, 11, 499.
[5] Mrijalini, K. Nazarpoor, L. Karimi, J. Clean. Prod.2011, 19, 1045.
[6] T.L. Dawson, Color. Technol.2009, 125, 61.
[7] A.K. Samanta, P.Agarwal,Indian J. Fibre.Text. Res,2009, 34, 384.
194
Scholar Research Library
Devi Rajeswari V. et al
Der Pharmacia Lettre, 2015, 7 (1):185-195
______________________________________________________________________________
[8] M. Shahid, S. Ul-Islem, F. Mohammad,J.Clean. Prod,2013, 53, 310.
[9] D. Mahanta, S.C. Tiwari, Curr. Sci, 2005, 88, 1474.
[10] N. Grover, V. Patni, 2011, 2(4), 403.
[11] M.D. Luque de Castro, F. Priego-Capote, J. Chromatogr. A, 2010, 1217, 2383.
[12] M. Toussirot, W. Nowik, E. Hnawia , N. Lebouvier , A.-E. Hay, A. de la Sayette, M.-G. Dijoux- Franca, D.
Cardon , M. Nour,Dyes Pigments, 2014, 102, 278.
[13] W. Haddar, M.B. Ticha, A. Guesmi, F. Khoffi, B. Durand, J. Clean. Prod,2014, 68, 114.
[14] K.Leon ,D. Mery, F. Pedreschi , J. Leon , Color measurement in L*a*b* units from RGB digital images,2006,
39, 1084.
[15] X.P. Zhuang, Y.Y. Lu, G.S. Yang,Chinese Herbal Medicine, 1992, 23, 122.
[16] X. Li-wei, C. Juan, Q. Huan-yang, S. Yan-ping, Chinese Herbal Medicines, 2012, 4(2), 103.
[17] S. Naz, I.A. Bhatti,S. Adeel, Indian J.FibreTextile Res, 2011, 36, 132.
[18] C.C. Cook, Rev.Prog.Colour, 1982, 12, 78.
[19] M.A. Salam, R.K. Sheik, F. Farouique, J.Textile Apparel, Technol. Management,2006, 5(3), 1.
[20] M. Kumaresan, P.N. Palanisamy, P.E. Kumar, Eur. J. Sci. Res, 2011, 52(3), 306.
195
Scholar Research Library


© Copyright 2026