
2011 The Scottish Health Survey Volume 1: Adults
The Scottish Health Survey
Volume 1: Adults
A National Statistics Publication for Scotland
2011
The Scottish Health Survey
Volume 1: Adults
2011
The Scottish Government, Edinburgh 2012
Editors:
Lisa Rutherford,1 Clare Sharp1 and Catherine Bromley2
Principal authors:
Paul Bradshaw,1 Catherine Bromley,2 Joan Corbett,1 Julie Day,3 Mira Doig,4 Shanna Dowling,1
Wissam Gharib,4 Linsay Gray,5 Tessa Hill,1 Alastair Leyland,5 Sally McManus,6 Jennifer Mindell,4
Kevin Pickering,6 Susan Reid,1 Marilyn Roth,4 Lisa Rutherford,1 Rachel Whalley.6
ScotCen Social Research, Edinburgh.
University of Edinburgh.
3
Department of Clinical Biochemistry, Royal Victoria Infirmary, Newcastle.
4
Department of Epidemiology and Public Health, UCL Medical School.
5
MRC/CSO Social and Public Health Sciences Unit, Glasgow.
6
NatCen Social Research, London.
1
2
© Crown copyright 2012
You may re-use this information (excluding logos and images) free of charge in any format or
medium, under the terms of the Open Government Licence. To view this licence, visit http://
www.nationalarchives.gov.uk/doc/open-government-licence/
or e-mail: [email protected].
Where we have identified any third party copyright information you will need to
obtain permission from the copyright holders concerned.
This document is also available from our website at www.scotland.gov.uk.
ISBN: 978-1-78045-841-0
Further copies are available from
Scottish Health Survey Team
The Scottish Government
Basement Rear
St Andrew’s House
Regent Road
Edinburgh
EH1 3DG
Telephone: 0131 244 2368
Fax: 0131 244 2371
Email: [email protected]
Produced for the Scottish Government by APS Group Scotland
DPPAS13020 (09/12)
Published by the Scottish Government, September 2012
CONTENTS
Editors’ Acknowledgements
1
Foreword from the Chief Medical Officer
2
Introduction
3
Notes to Tables
9
Chapter 1: General Health and Mental Wellbeing
10
1.1 Introduction
12
1.2 Self-assessed general health
13
1.2.1 Introduction
13
1.2.2 Trends in self-assessed general health since 2008, by
age and sex
13
1.3 Long-term conditions
14
1.3.1 Introduction
14
1.3.2 Trends in prevalence of long-term conditions since 2008,
by age and sex
14
1.3.3 Long-term conditions by Scottish Index of Multiple
Deprivation (SIMD)
15
1.4 Wellbeing
1.4.1 Introduction
16
16
1.4.2 Trends in WEMWBS mean score since 2008, by age and sex 18
1.4.3 WEMWBS mean score, 2009 and 2011 combined, by job
quality and work-life balance
1.5 Factors associated with below average wellbeing, 2009 and 2011
combined
18
21
1.5.1 Introduction
21
1.5.2 Results
22
1.6 Depression and anxiety
23
1.6.1 Introduction
23
1.6.2 Symptoms of depression
24
1.6.3 Symptoms of anxiety
24
1.7 Suicide attempts and deliberate self-harm
25
1.7.1 Introduction
25
1.7.2 Suicide attempts
26
1.7.3 Deliberate self-harm
26
Chapter 2: Dental Health
48
2.1 Introduction
49
2.2 Methods and definitions of measurement
50
2.3 Dental health
51
2.3.1 Trends in prevalence of natural teeth since 1995,
by age and sex
51
2.3.2 Number of natural teeth & % with no natural teeth,
2008-2011, by Scottish Index of Multiple Deprivation (SIMD) 52
2.3.3 Actions taken to improve dental health
Chapter 3: Alcohol Consumption
3.1 Introduction
3.1.1 Definitions used in this chapter
3.2 Methods
53
63
65
67
68
3.2.1 Data collection in the 2008-2011 surveys
68
3.2.2 Unit calculations and conversion factors
69
3.3 Weekly alcohol consumption levels
70
3.3.1 Trends in weekly alcohol consumption since 2003
70
3.3.2 Weekly alcohol consumption by age and sex, 2011
71
3.3.3 Weekly alcohol consumption, 2008-2011 combined, by
equivalised household income and Scottish Index of
Multiple Deprivation (SIMD)
72
3.4 Estimated daily consumption
74
3.4.1 Trends in alcohol consumption on the heaviest drinking
day since 2003
74
3.4.2 Alcohol consumption on the heaviest drinking day by
age and sex, 2011
76
3.5 Adherence to weekly and daily drinking advice
76
3.5.1 Trends in adherence to weekly and daily drinking
advice since 2003
76
3.5.2 Adherence to weekly and daily drinking advice by
age and sex, 2011
76
3.6 Number of days alcohol was consumed in past week
78
3.6.1 Trends in number of days alcohol was consumed in
past week since 1998
78
3.6.2 Number of days alcohol was consumed in past week, by
age and sex, 2011
80
3.6.3 Number of days alcohol was consumed in past week,
2008-2011 combined, by equivalised household income
and Scottish Index of Multiple Deprivation (SIMD)
80
Chapter 4: Smoking
101
4.1 Introduction
103
4.2 Methods
104
4.2.1 Smoking questions in the 2011 Scottish Health Survey
104
4.2.2 Cotinine
105
4.2.3 Definitions
106
4.3 Trends in smoking prevalence since 1995
106
4.4 Smoking prevalence in 2011
106
4.4.1 Smoking prevalence, by age and sex
106
4.4.2 Smoking prevalence, by socio-demographic group
107
4.4.3 Cotinine-adjusted cigarette smoking status, by age and sex
111
4.5 Exposure to second-hand smoke
111
4.5.1 Trends in exposure to second-hand smoke since 1998
by age and sex
111
4.5.2 Trends in exposure to second-hand smoke: non-smokers’
cotinine levels since 2003
113
4.5.3 Non-smokers’ cotinine levels by Scottish Index of Multiple
Deprivation (SIMD)
113
Chapter 5: Diet
134
5.1 Introduction
135
5.2 Methodology
137
5.2.1 Measures of eating habits
137
5.2.2 Urinary sodium and potassium
138
5.2.3 Vitamin and/or mineral supplement consumption
139
5.3 Fruit and vegetable consumption
5.3.1 Trends in adult consumption of fruit and vegetables
since 2003
139
139
5.3.2 Portions of fruit and vegetables consumed by adults in 2011 140
5.4 Urinary sodium, potassium and creatinine
141
5.4.1 Trends in urinary sodium, potassium and creatinine
since 2003
141
5.4.2 Urinary sodium, potassium and creatinine by age and sex,
2008-2011 combined
142
5.5 Consumption of vitamin and mineral supplements
5.5.1 Trends in vitamin and mineral supplement consumption
since 2003
143
143
5.5.2 Vitamin and mineral supplement consumption by age and
sex, 2008-2011 combined
143
5.5.3 Vitamin and mineral supplement consumption by Scottish
Index of Multiple Deprivation (SIMD), 2008-2011 combined
144
Chapter 6: Physical Activity
162
6.1 Introduction
163
6.2 Methods
165
6.2.1 The adult physical activity questionnaire
165
6.2.2 Adult physical activity definitions
166
6.3 Summary physical activity levels
6.3.1 Trends in summary physical activity levels since 2008
167
167
6.3.2 Summary adult physical activity levels, 2011, by age and sex 168
6.3.3 Participation in different types of activity in the past 4 weeks 169
6.4 Physical activity levels by socio-demographic factors
172
6.4.1 Adult summary activity levels, 2011 (age-standardised), by
NS-SEC of household reference person and sex
172
6.4.2 Adult summary activity levels, 2011 (age-standardised), by
equivalised household income and sex
173
6.4.3 Adult summary activity levels, 2011 (age-standardised), by
Scottish Index of Multiple Deprivation and sex
174
Chapter 7: Obesity
185
7.1 Introduction
187
7.2 Methods and definitions of measurement
188
7.2.1 Height
188
7.2.2 Weight
188
7.2.3 Body mass index (BMI)
188
7.2.4 Waist measurements
189
7.2.5 WHO combined classification of disease risk
190
7.3 Response to anthropometric measurements, by age and sex
191
7.4 Trends in the prevalence of overweight and obesity since 1995
191
7.4.1 Obesity and morbid obesity
191
7.4.2 Overweight and obesity
192
7.4.3 Mean BMI
192
7.5 Adult BMI, by age and sex, 2011
193
7.6 Waist circumference
195
7.6.1 Trends in waist circumference (WC) since 1995
195
7.6.2 Waist circumference by age and sex, 2010/2011 combined
195
7.7 Disease risk based on BMI and waist circumference
196
7.7.1 Disease risk by age and sex, 2008-2011 combined
196
7.7.2 Disease risk by socio-demographic factors, 2008-2011
combined
199
7.8 Factors associated with high (or greater) disease risk
201
Chapter 8: Cardiovascular disease, diabetes and hypertension
223
8.1 Introduction
225
8.2 Methods and definitions
226
8.2.1 Methods
226
8.2.2 Summary measures of cardiovascular disease and diabetes 228
8.2.3 Classification of blood pressure levels
228
8.2.4 Blood analytes
230
8.3 Prevalence of cardiovascular conditions and diabetes
233
8.3.1 Any CVD, and CVD or diabetes, IHD, stroke and IHD and
stroke by age and sex, 2011
233
8.3.2 Trends in any CVD, and CVD or diabetes since 1995
233
8.3.3 Trends in IHD, stroke, and IHD or stroke since 1995
233
8.4 Doctor-diagnosed and undiagnosed diabetes
234
8.4.1 Trends in doctor-diagnosed diabetes since 1995
234
8.4.2 Trends in undiagnosed diabetes since 2003
234
8.5 Hypertension
8.5.1 Trends in blood pressure levels since 1998
237
237
9.5.2 Blood pressure levels by age and sex, 2010/2011 combined 238
8.6 Blood analytes
239
8.6.1 Total cholesterol
239
8.6.2 HDL cholesterol and total: HDL cholesterol ratio
240
8.6.3 Fibrinogen
241
8.6.4 C-reactive protein
241
Appendix A: Glossary
265
EDITORS’ ACKNOWLEDGEMENTS
Our first thank you is to the 7,544 adults, and 1,987 children, who gave up their time
voluntarily to take part in the 2011 survey and welcomed our interviewers and nurses
into their homes.
We would also like to thank those colleagues who contributed to the survey and this
report. In particular we would like to thank:
All the interviewers and nurses who worked on the project. We owe a
huge debt of gratitude for the dedication and professionalism they
applied to their work.
The authors of the chapters: Paul Bradsaw, Joan Corbett, Julie Day,
Mira Doig, Shanna Dowling, Wissam Gharib, Linsay Gray, Tessa Hill,
Alastair Leyland, Sally McManus, Jennifer Mindell, Kevin Pickering,
Susan Reid, Marilyn Roth and Rachel Whalley.
Joan Corbett and Jackie Palmer, whose hard work and expertise has
been crucial in preparing the survey data, and for conducting much of
the analysis in this report.
Other research colleagues, in particular: Simon Anderson, Lesley Birse
and Andy MacGregor (ScotCen Social Research); Rachel Craig, Susan
Nunn and Kelly Ward (NatCen Social Research); Melissa Shapero
(ScotCen/ University of St Andrews), Caitlin McLean
(ScotCen/University of Edinburgh).
Emma Fenn and the rest of the NatCen Social Research Operations
team.
Jean Vallance and her deputy area manager and interviewer team
leaders.
Sue Nash and her nurse supervisors.
The principal programmers: Iain Templeton and Sven Sjodin.
The Survey Doctors: Dr Sangeeta Dhami and Professor Aziz Sheikh.
We would also like to express our thanks Dr Linda Wilson of the Freeman Hospital,
Newcastle, and the laboratory staff at the Royal Victoria Infirmary, Newcastle, and to
Dr Colin Feyerabend and his staff at ABS Laboratories in Welwyn Garden City,
Hertfordshire, for their continuing helpfulness and efficiency in processing and
analysing the blood, saliva and urine samples.
Ethical approval for the study was granted by the Research Committee for Wales
(08/MRE09/62). We are grateful to the committee, and its co-ordinator Dr Corrine
Scott, for their careful scrutiny and on-going support.
Finally, special thanks are due to Julie Ramsay, Carrie Graham and Rosalia MunozArroyo and their colleagues in the Scottish Government Health Directorates, for their
support at all stages of the project.
Lisa Rutherford, Clare Sharp and Catherine Bromley
1
FOREWORD FROM THE CHIEF MEDICAL OFFICER
This report presents the findings of the seventh Scottish Health Survey and is the
fourth report published since the survey moved to a continuous design in 2008. It
has been commissioned by the Scottish Government and produced by a
collaboration between ScotCen Social Research, the MRC/CSO Social and Public
Health Sciences Unit at the University of Glasgow and the Department of
Epidemiology and Public Health at University College London.
The survey provides us with an immensely valuable collection of data gathered from
interviews of more than 9,000 adults and children each year. It provides essential
data on cardiovascular disease and the related risk factors, including smoking,
alcohol, diet, physical activity and obesity. Information on general health, mental
health and dental health are also included.
When the survey moved to an annual basis in 2008, it was designed to produce a
large enough sample to allow NHS Board analysis every four years. The publication
of the 2011 data gives us the first opportunity since 2003 to publish results for all
fourteen NHS Boards in Scotland. This report is accompanied by a set of web tables
and an interactive mapping tool breaking down the key results by NHS Board and
creates a valuable local data resource.
In addition to allowing geographical breakdowns, combining the data for recent years
allows more detailed analysis of sub-groups than was previously possible. For
example, a more in-depth look at how different age groups behave or examination of
the different health behaviours of equality groups.
Because of the additional capacity for analysis the 2011 data provides, this year’s
report has been expanded to include separate volumes for adults and children. The
focus on children’s health underlines the Scottish Government’s commitment to
improving outcomes for children and young people and recognises the strong links
between early experiences and outcomes in adulthood.
I am pleased to welcome this valuable report and to thank ScotCen Social Research,
the MRC/CSO SPHSU and UCL for their hard work in conducting the survey and
preparing this report. Most importantly, I would also like to thank the 9,531 people
who gave their time to participate in the survey. The information they have provided
is invaluable in developing and monitoring public health policy in Scotland.
Sir Harry Burns
Chief Medical Officer for Scotland
Scottish Government Health Directorates
2
INTRODUCTION
Lisa Rutherford and Catherine Bromley
OVERVIEW OF THE ADULTS’ VOLUME
Policy context
This report provides an overview of some of the key information collected about
adult health in the recent surveys in the Scottish Health Survey (SHeS) series.
Health features strongly within the Scottish Government’s National Performance
Framework (NPF).1,2 One of the Government’s five strategic objectives for a
healthier Scotland focuses on Scotland’s considerable need for health
improvement particularly in disadvantaged communities. Of the 16 national
outcomes allied to the Government’s strategic objectives, those of greatest
relevance to health are:
We live longer, healthier lives.
We have tackled the significant inequalities in Scottish society.
Several of the 50 national indicators that track progress towards these
outcomes relate to health and the addition, in the revised NPF published in
December 2011,2 of new health related indicators highlight the ongoing
commitment to improving health: Progress towards the following national
indicators is monitored via SHeS:
Improve mental wellbeing
Increase physical activity
Improve self-assessed general health
As a study of public health, SHeS plays an important role in assessing health
outcomes and the extent of health inequalities in Scotland and how these have
changed over time. Each of the chapters in this report addresses an aspect of
health that relates either directly or indirectly to the Government’s objective of
improving health in Scotland. Chapters begin with a brief introduction to the
relevant policy initiatives in that area. These should be considered alongside the
higher level policies noted above and related policy initiatives covered in other
chapters.
The Scottish Health Survey
The 2008-2011 Scottish Health Surveys were commissioned by the Scottish
Government Health Directorates. It is the continuation of a series of surveys
aimed at monitoring health in Scotland. During 2005 and 2006 a comprehensive
review of the survey was carried out by the then Scottish Executive.3 One of the
key recommendations to emerge from the review was that the survey should be
carried out on a more frequent basis. This recommendation was adopted and
the survey began running continuously in 2008 with a contract awarded for the
3
2008-2011 surveys. A further contract has now been awarded for the 2012 2015 surveys, by the end of which there will health survey data spanning two
decades, and eight continuous years of data from 2008 onwards. This report is
based on data collected in the fourth year of its new format, 2011.
Prior to 2008, the previous three surveys took place in 1995,4 1998,5 and 20036
and were conducted by the Joint Health Surveys Unit (JHSU) of the National
Centre for Social Research (NatCen) and the Department of Epidemiology and
Public Health at University College London (UCL). In 2003, the JHSU
collaborated with the MRC/CSO Social and Public Health Sciences Unit based
in Glasgow (MRC/CSO SPHSU). The 2008-2011 surveys were conducted by a
collaboration between ScotCen Social Research, the MRC/CSO SPHSU and
UCL.
Topics
Each survey in the series consists of main questions and measurements (for
example, anthropometric and, if applicable, blood pressure measurements and
analysis of blood and saliva samples), plus modules of questions on specific
health conditions. The principal focus of the 2008-2011 surveys was
cardiovascular disease (CVD) and related risk factors. The main components of
CVD are coronary heart disease (CHD) and stroke. As noted in Chapter 8, CHD
is Scotland’s second biggest cause of death and is the focus of a significant
number of health policies, many of which have a specific emphasis on reducing
the significant health inequalities associated with CVD in Scotland. The SHeS
series means that there are now trend data going back for over a decade, and
providing the time series is an important function of the survey.
Many of the key behavioural risk factors for CVD are in themselves of particular
interest to health policy makers and the NHS. For example, smoking, poor diet,
lack of physical activity, obesity and alcohol misuse are all the subject of
specific strategies targeted at improving the nation’s health. SHeS includes
detailed measures of all these factors and these are reported on separately in
Chapters 3-7.
Sample design
The sample covering the four year period 2008-2011 was designed to provide
data, at both national and Health Board level, about the population living in
private households in Scotland. Each single year of the survey has been
designed to provide estimates at the national level. The survey used a multistage stratified probability sampling design, with data zones (or groups of data
zones) selected at the first stage and addresses (delivery points) at the second.
Prior to 2008 the samples were designed to ensure that the sample size was
sufficiently large within seven regions based on aggregations of Health Boards
for the purpose of regional analysis. When the survey moved to an annual basis
in 2008, it was designed to produce a large enough sample to allow NHS Board
analysis every four years. The publication of the 2011 data provides the first
opportunity since 2003, to publish results for all fourteen NHS Boards in
Scotland.
4
Two samples were selected for the survey: a general population (main) sample
in which all adults and up to two children were eligible to be interviewed in each
household; and a child boost sample in which up to two children were eligible to
be interviewed but adults were not.
The sample of addresses was selected from the small user Postcode Address
File (PAF). This is a list of nearly all the residential addresses in Scotland and is
maintained by The Royal Mail. The population surveyed was therefore people
living in private households in Scotland. People living in institutions, who are
likely to be older and, on average, in poorer health than those in private
households, were not covered. This should be considered when interpreting the
survey estimates. The very small proportion of households living at addresses
not on PAF (less than 1%) was not covered.
Data collection
Interviewing was conducted using Computer Assisted Personal Interviewing
(CAPI). Children aged 13-15 were interviewed in the presence of a parent or
guardian. Parents answered on behalf of younger children, who were
nevertheless required to be present.
In addition, those aged 13 and over were asked to complete a short paper
questionnaire on more sensitive topics. There were four such booklets: one for
adults aged 18 and over, one for young adults aged 16-17 (with the option of
using it for those aged 18-19 at the interviewer’s discretion), and one for
teenagers aged 13-15. Parents of children aged 4-12 years, included in the
sample, were also asked to fill in a self completion booklet about the child’s
strengths and difficulties designed to detect behavioural, emotional and
relationship difficulties in children.
Interviewers were also responsible for measuring the height and weight of
participants aged 2 and over. For adults, these measurements are reported in
Chapter 7, while child measurements are presented in Volume 2 Chapter 5.
Finally, in a sub-sample of households, interviewers sought permission from
adults (aged 16 and over) for a follow-up visit by a specially trained survey
nurse. At the nurse interview, participants were asked about their use of
prescribed medication and recent experiences of food poisoning and stress,
anxiety and depression. The nurse then took the blood pressure and waist and
hip measurements for all aged 16 and over, and measured the arm length
(demi-span) for those aged 65 and over. Lung function was measured via a
spirometer. With written agreement, a small sample of blood was taken by
venepuncture. The blood sample was analysed for: total and HDL-cholesterol,
c-reactive protein, fibrinogen, glycated haemoglobin and vitamin D. 7 Nurses
also sought agreement for the storage of a small sample of blood for possible
future analysis. Samples of saliva and urine were also collected. Further details
of these samples and measurements are available in the Glossary.
5
Survey response and sample sizes
The following table sets out the numbers of participating households and adults
in the four most recent survey years. It also presents response rates for each
year. Further details of all the 2011 figures are presented in Volume 3 of this
report, information about the 2008, 2009 and 2010 surveys can be found in the
technical reports accompanying the annual reports.8,9,10
Numbers participating:
Participating households (main &
health board boost sample)
Adult interviews
Adults eligible for nurse sample
Adults who saw a nurse
Adults who gave a blood sample
Response rates:
% of all eligible households (main &
health board boost sample)
% of all eligible adults
2008
2009
2010
2011
4,139
4,872
4,776
5,010
6,465
1,878
1,123
903
7,531
2,205
1,115
885
7,245
2,199
1,063
843
7,544
2,224
972
725
61%
64%
63%
66%
54%
56%
55%
56%
Data
Since addresses and individuals did not all have equal chances of selection, the
data have to be weighted for analysis. SHeS comprises of a general population
(main sample) and a boost sample of children screened from additional
addresses. Therefore slightly different weighting strategies were required for the
adult sample (aged 16 or older) and the child main and boost samples (aged 015). Different weights were also created for the various combined datasets
(described below). These are described in full in Volume 3.
The 2011 SHeS data will be deposited at the Data Archive at the University of
Essex, from where earlier years’ datasets and combined years datasets can
also be obtained.
This report
This report is based on data collected in all the survey years to date (1995,
1998, 2003, and 2008 to 2011). It takes advantage of the continuous sample
design since 2008 to include analysis based on a number of pooled datasets:
The 2008, 2009, 2010 and 2011 surveys combined – this enables more
detailed analysis of sub-groups to be conducted, for example by age
group or socio-economic groups.
The 2008/2009 and 2010/2011 surveys combined – these enable shortterm trends to be examined, while still providing greater precision for the
estimates than is the case with the single years’ figures.
The 2009 and 2011 surveys combined – some topics, such as accidents,
were only included in the 2009 and 2011 survey years. The combined
sample allows more detailed reporting of sub-group differences.
6
The 2011 SHeS report consists of three volumes, published as a set as ‘The
Scottish Health Survey 2011.’ Volume 1 presents results for adults and covers
the topics listed below; Volume 2 presents results for children and Volume 3
provides methodological information and survey documentation. These three
volumes are available on the Scottish Government’s SHeS website along with a
short summary report of the key findings from Volumes 1 and 2. A set of web
tables and an interactive mapping tool breaking down the key results by NHS
Board are also available on the survey website.
(www.scotland.gov.uk/scottishhealthsurvey).
Volume 1 contents: Adults
1.
2.
3.
4.
5.
6.
7.
8.
General health and mental wellbeing
Dental health
Alcohol consumption
Smoking
Diet
Physical activity
Obesity
Cardiovascular disease, diabetes and hypertension
While preparing the SHeS chapter on lung function some anomalous results
were apparent and, as a consequence, the decision was taken to withdraw the
chapter from this report to allow a full investigation of these anomalies to be
carried out. A separate topic report on lung function will be published in winter
2012.
As in all previous SHeS reports, data for men and women are presented
separately. Many of the measures are also reported for the whole adult
population. Survey variables are tabulated by age groups and, usually, Scottish
Index of Multiple Deprivation (SIMD), National Statistics Socio-Economic
Classification (NS-SEC), and equivalised household income. Trend data are
presented, where possible, from the seven surveys in the SHeS series (1995,
1998, 2003, 2008, 2009, 2010 and 2011). In some cases trend data are
restricted to those aged 16-64 (the age range common to all seven surveys), for
some measures trends are available for the 16-74 age range (common to the
1998 survey onwards). Trends based on the surveys from 2003 onwards can be
presented for all adults aged 16+.
7
References and notes
1
Scottish Budget Spending Review 2007, Edinburgh: Scottish Government, 2007. [online] Available
from: <www.scotland.gov.uk/Publications/2007/11/13092240/0> See also:
www.scotlandperforms.com
2
National Performance Framework: Changes to the National Indicator Set, Edinburgh: Scottish
Government, 2012. [online] Available from:
<www.scotland.gov.uk/About/scotPerforms/NIchanges>
See also: www.scotlandperforms.com
3
Further information on the Scottish Health Survey review and recommendations adopted as a
result of the review can be found on the Scottish Government Scottish Health Survey website
<www.scotland.gov.uk/Topics/Statistics/Browse/Health/scottish-health-survey>
4
Dong, W. and Erens, B. (1997). The 1995 Scottish Health Survey. Edinburgh: The Stationery
Office.
5
Shaw, A., McMunn. A. and Field, J. (2000). The 1998 Scottish Health Survey. Edinburgh: The
Stationery Office.
6
Bromley, C., Sproston, K. and Shelton, N. [eds] (2005). The Scottish Health Survey 2003.
Edinburgh: The Scottish Executive.
7
The vitamin D samples were commissioned by the Food Standards Agency in Scotland and the
Scottish Government Directorate for Chief Medical Officer, Public Health and Sport.
8
Bromley, C., Bradshaw, P. and Given, L. [eds.] The 2008 Scottish Health Survey. Edinburgh:
Scottish Government. <www.scotland.gov.uk/Publications/2009/09/28102003/0>
9
Bromley, C., Given, L. and Ormston, R. [eds.] The 2009 Scottish Health Survey. Edinburgh:
Scottish Government. www.scotland.gov.uk/Publications/2010/09/27093010/0
10
Bromley, C., and Given, L. [eds.] The 2010 Scottish Health Survey. Edinburgh: Scottish
Government. <www.scotland.gov.uk/Publications/2011/09/27124046/0>
8
NOTES TO TABLES
1
The following conventions have been used in tables:
n/a
no data collected
no observations (zero value)
0
non-zero values of less than 0.5% and thus rounded to zero
[]
normally used to warn of small sample bases, if the unweighted base is
less than 50. (If a group’s unweighted base is less than 30, data are
normally not shown for that group.)
2
Because of rounding, row or column percentages may not add exactly to
100%.
3
A percentage may be quoted in the text for a single category that aggregates
two or more of the percentages shown in a table. The percentage for the
single category may, because of rounding, differ by one percentage point from
the sum of the percentages in the table.
4
Values for means, medians, percentiles and standard errors are shown to an
appropriate number of decimal places. Standard Errors may sometimes be
abbreviated to SE for space reasons.
5
‘Missing values’ occur for several reasons, including refusal or inability to
answer a particular question; refusal to co-operate in an entire section of the
survey (such as a self-completion questionnaire); and cases where the
question is not applicable to the participant. In general, missing values have
been omitted from all tables and analyses.
6
The population sub-group to whom each table refers is stated at the upper left
corner of the table.
7
Both weighted and unweighted sample bases are shown at the foot of each
table. The weighted numbers reflect the relative size of each group in the
population, not numbers of interviews conducted, which are shown by the
unweighted bases.
8
The term ‘significant’ refers to statistical significance (at the 95% level) and is
not intended to imply substantive importance.
9
General Health and
Mental Wellbeing
Chapter 1
1 GENERAL HEALTH AND MENTAL WELLBEING
Sally McManus
SUMMARY
In 2011, 76% of adults described their health in general as ‘good’ or ‘very
good’ and 7% described it as ‘bad’ or ‘very bad’. These figures were very
similar in 2008, 2009 and 2010.
Perceptions of health varied significantly with age: 92% of people aged 16-24
had ‘good’ or ‘very good’ health compared with 51% of those aged 75 and
over.
44% of adults reported a long-standing physical or mental condition or
disability in 2011. This was a significant increase on the 41% in 2008 and the
40% in 2009 reporting such a condition.
Women were more likely than men to report having a limiting long-term
condition (30% and 26% respectively).
Prevalence of limiting long-term conditions increased sharply with age. 11% of
both men and women aged 16-24 reported a limiting long-term condition,
compared with 55% of men and 60% of women aged 75 and over.
Area deprivation was significantly associated with long-term conditions
prevalence. The proportion of people reporting a long-term condition increased
steadily in line with deprivation, from 35% of those living in the 20% least
deprived areas in Scotland to 51% of those living in the 20% most deprived
areas.
In 2011, the mean score on the Warwick-Edinburgh Mental Wellbeing Scale
(WEMWBS) was 49.9, and was higher among men (50.2) than women (49.7).
The mean WEMWBS score was not significantly different to that seen in 2008,
2009 or 2010.
WEMWBS mean scores had a complex pattern of association with age.
People aged 25-34 and 65-74 had the highest levels of positive wellbeing and
those aged 45-54 and 75 and over had the lowest.
People in work characterised by low autonomy, high demands, and with low
levels of social support in the workplace all had lower levels of wellbeing than
those with more positive experiences of their working lives. Similarly, people
with stressful jobs and with lower than average satisfaction with their work-life
balance had lower levels of wellbeing.
Multi-variate analysis was carried out to identify factors that were
independently associated with having a below average level of wellbeing.
Women had higher odds than men for having a low level of wellbeing. Among
both men and women, being younger, with poor self-assessed health,
experience of discrimination, few people to turn to in a crisis, and with no
involvement in the local community all had higher odds of low wellbeing.
Among men only, a low level of physical activity was also a significant
predictor of low wellbeing. Women with no educational qualifications, those
who were single and those with a limiting longstanding illness had increased
odds of having below average wellbeing.
The proportion of adults with one symptom of depression increased from 5%
in 2008/2009 to 12% in 2010/2011, while the proportion with two or more
symptoms remained stable at 8% and 7%, respectively. The increase occurred
11
in both men and women. Depressive symptoms were more common in women
than men.
The prevalence of anxiety symptoms was very similar in 2008/2009 and
2010/2011 with no change in the proportion of adults that had two or more
symptoms (9%).
5% of adults in 2010/2011 reported that they had ever attempted suicide. This
was similar to the 2008/2009 figure.
Women were more likely than men to report attempted suicide; however levels
of self-harm were similar for both sexes. Older people were less likely than
younger and middle-aged people to report a suicide attempt or self-harm.
1.1
INTRODUCTION
This chapter covers two interrelated topics. The first is self-assessed general
health and long-term conditions in adults. These are critical measures of the
population’s overall health status and are key markers of health inequalities.1
The second topic focuses on adult mental health and wellbeing. In Scotland,
there is a focus on the promotion of good mental health as well as the
prevention and treatment of mental illness. The measures reported in this
chapter reflect this broad definition and cover wellbeing as well as depression,
anxiety, self-harm and suicide attempts.
The Scottish Government’s revised National Performance Framework includes
National Indicators on improving self-assessed health2 and mental wellbeing3
and the Scottish Health Survey (SHeS) is used to monitor progress on these. 4,5
The introductions to the equivalent chapters in the three most recent SHeS
Reports 6,7,8 included a comprehensive overview of the recent policy context for
these topics covering a number of strategies and initiatives that have been
introduced by the Scottish Government and NHS Scotland to improve health
and mental wellbeing. These included:
The 2008 report of the Ministerial Taskforce on Health Inequalities
Equally Well which included “enhancing mental health, wellbeing and
resilience” as one of its key priorities.9
The policy and action plan for mental health improvement in Scotland
Towards a Mentally Flourishing Scotland (TAMFS),10 launched in May
2009
The Choose Life strategy, which includes a target to reduce the rate of
suicide by 20% between 2002 and 2013,11 and its update in October
2010.12
The NHS Scotland HEAT13 target - linked to the suicide reduction target to educate and train 50% of its frontline staff in suicide prevention
awareness techniques by the end of 2010 (52% of staff were trained by
2010).14
NHS Health Scotland’s set of national, sustainable mental health
indicators,15 published in 2007, which are intended to allow national
monitoring of adult mental health. SHeS is the data source for 28 of the
54 indicators.16
12
Recommendations that subjective wellbeing should be measured
alongside socio-economic indicators as a marker of a country’s overall
performance, and its growing use in UK surveys. 17,18
The Scottish Government published its new mental health strategy on 13
August 2012.19 The strategy supports the Quality Strategy and its focus on safe,
effective and person-centred care. It focuses on aspects of service delivery
(such as their speed of delivery and integration with other services) as well as
broader aspects relating to people’s own capacity to respond appropriately to
poor mental health and the wider community’s role in helping to prevent people
becoming unwell.
This chapter starts by presenting the latest figures on self-assessed health. It
then looks at the prevalence of long-term conditions by age, sex and the
Scottish Index of Multiple Deprivation (SIMD). The trend data for wellbeing is
updated, and more detailed analysis is presented in relation to work stress,
social capital and discrimination. These were identified as important contextual
determinants of wellbeing in the national mental health indicator set for adults, 15
and they have been included in the survey both as indicators in their own right,
and to enable analysis of their associations with wellbeing. The final section of
the chapter provides the latest figures for the prevalence of depression, anxiety,
suicide attempts and self-harm.
1.2
SELF-ASSESSED GENERAL HEALTH
1.2.1
Introduction
This section presents data on self-assessed general health among
adults. All participants were asked to rate their health in general as ‘very
good’, ‘good’, ‘fair’, ‘bad’ or ‘very bad’. This question is used to monitor
the National Indicator “improve self-assessed health” and is also part of
the Scottish Government’s adult mental health indicators set:
“percentage of adults who perceive their health in general to be good or
very good”. 2,15
Self-assessed health is a useful measure of how individuals regard their
own overall health status. It is strongly related to the presence of
chronic and acute disease, as well as being a good predictor of hospital
admission and mortality.20,21
1.2.2
Trends in self-assessed general health since 2008, by age and sex
In 2011, 76% of adults described their health in general as either ‘good’
or ‘very good’ and 7% described it as ‘bad’ or ‘very bad’. The proportion
of adults with ‘good’ or ‘very good’ health has been very similar each
year since 2008, while the proportion with ‘bad’ or ‘very bad’ health has
remained unchanged since 2008.
Although men were more likely than women to assess their health as
‘good’ or ‘very good’ in 2011 (77% and 74%, respectively), this
difference was not significant.
13
Self-assessed general health varied greatly with age. The proportion of
people describing their health as ‘good’ or ‘very good’ declined steadily
with age from nine in ten (92%) of those aged 16-24 to five in ten (51%)
of those aged 75 and over. As Figure 1A shows, this pattern was
evident for both men and women.
Figure 1A, Table 1.1
Figure 1A
Proportion of adults with 'very good' or 'good' health, by age and sex, 2011
Men
Women
100
90
80
Percent
70
60
50
40
30
20
10
0
16-24
25-34
35-44
45-54
55-64
65-74
75+
Age group
1.3
LONG-TERM CONDITIONS
1.3.1
Introduction
All participants were asked if they had any long-term physical or mental
conditions or disabilities that had affected - or were likely to affect them for at least twelve months. Those who reported having such a
condition were asked to say whether it limited their daily activities in any
way. This enabled conditions to be further classified as either ‘limiting’
or ‘non-limiting’. As the question did not specify that conditions had to
be doctor-diagnosed, responses were subject to some distortion due to
variation in individuals’ perceptions.
1.3.2
Trends in prevalence of long-term conditions since 2008, by age
and sex
In 2011, 44% of adults reported a long-standing physical or mental
condition or disability. This is a significant increase on the proportions
reporting such a condition in 2008 (41%) and 2009 (40%).
Women were more likely than men to report having a limiting long-term
condition (30% and 26% respectively).
The prevalence of long-term conditions increased sharply with age, but
the gradient was much steeper for limiting conditions than non-limiting
14
ones. For example, 11% of both men and women aged 16-24 reported
a limiting long-term condition, compared with 55% of men and 60% of
women aged 75 and over. The equivalent figures for non-limiting
conditions ranged between 12% and 22% for men, and 10% and 21%
for women, and while prevalence was lower among the younger age
groups, the pattern was not wholly linear.
Table 1.2
1.3.3
Long-term conditions (age-standardised) by Scottish Index of
Multiple Deprivation (SIMD)
Two measures of SIMD are being used throughout this report. The first,
which uses quintiles, enables comparisons to be drawn between the
most and least deprived 20% of areas and the intermediate quintiles.
The second contrasts the most deprived 15% of areas with the rest of
Scotland (described in the tables as the ‘85% least deprived areas’). To
ensure that the comparisons presented by SIMD are not confounded by
the different age profiles of the sub-groups, the data have been agestandardised (age-standardisation is described in the Glossary). On the
whole, the differences between observed and age-standardised
percentages are small. Therefore, the percentages and means
presented are the standardised ones only.
The proportion of adults with a long-term condition increased steadily in
line with area level deprivation, from 35% of those living in the least
deprived quintile to 51% in the most deprived quintile. As Figures 1B
and 1C illustrate, the gradient was almost entirely accounted for by
variation in the prevalence of limiting long-term conditions, rather than
non-limiting ones. The association with deprivation was slightly more
pronounced for women than for men. 36% of women in the least
deprived quintile had a long-term condition compared with 54% of those
living in the most deprived quintile. The equivalent figures from men
were 33% and 49% respectively.
Those living in the 15% most deprived areas were more likely than
those living in the rest of Scotland to have a long-term condition (52%
and 40%, respectively). Again, the difference between the areas was
particularly pronounced with limiting long-term conditions (39% of those
living in the 15% most deprived areas in Scotland had a limiting
condition compared with 25% of those living elsewhere).
Figure 1B, Figure 1C, Table 1.3
15
Figure 1B
Prevalence of long-term conditions in men aged 16+ (age-standardised),
by Scottish Index of Multiple Deprivation quintile, 2008-2011 combined
Non-limiting conditions
Limiting conditions
60
50
Percent
40
30
20
10
0
1st (least
deprived)
2nd
3rd
4th
SIMD quintile
Figure 1C
Prevalence of long-term conditions in women aged 16+ (age-standardised),
by Scottish Index of Multiple Deprivation quintile, 2008-2011 combined
5th (most
deprived)
Non-limiting conditions
Limiting conditions
60
50
Percent
40
30
20
10
0
1st (least
deprived)
1.4
2nd
3rd
SIMD quintile
4th
5th (most
deprived)
WELLBEING
1.4.1
Introduction
Wellbeing was measured using the WEMWBS questionnaire.
WEMWBS is used to monitor the National Indicator “improve mental
wellbeing”.3 It has 14 items designed to assess: positive affect
(optimism, cheerfulness, relaxation) and satisfying interpersonal
relationships and positive functioning (energy, clear thinking, selfacceptance, personal development, mastery and autonomy). 22 The
scale uses positively worded statements with a five-item scale ranging
from ‘1 - None of the time’ to ‘5 - All of the time’. The lowest score
possible is therefore 14 and the highest score possible is 70; the tables
present mean scores.
16
WEMWBS is not designed to identify individuals with exceptionally high
or low levels of positive mental health so cut off points have not been
developed.23 The scale was designed for use in English speaking
populations, however in a very small number of cases, the questions
were translated to enable the participation of people who did not speak
English.24
Job quality and work-life balance
In 2009 and 2011 the survey included a series of questions on working
life from the adult mental health indicators set.15 As work is considered
to be an important contextual factor associated with mental health,
adults in paid employment or on a government training scheme were
asked questions about their experience of stress at work, their work/life
balance, and working conditions.25 The responses to these questions,
presented by age and sex, are being published as supplementary web
tables. The following analysis explores the association between mean
WEMWBS scores and stress at work.
There are different theories about what determines job quality. Some
researchers have emphasised the negative consequences of stress
resulting from an imbalance between the efforts an employee makes
and the rewards they receive in terms of recognition or payment.26
Others have focused more on the relationship between the degree of
control (or autonomy) that employees feel over their work, the demands
being placed on them, and the extent of any social support they receive
from the organisation or fellow workers.27 Good quality work is
associated with higher levels of subjective wellbeing. It should be noted
that cross-sectional analysis may overstate the association between
poor quality work and low levels of wellbeing because low mood might
lead people to perceive their work situation more negatively. As these
questions were only asked of a sub-sample of people in the study the
data from 2009 and 2011 have been combined to provide a larger
number of cases.
Social capital
The 2009 and 2011 surveys also included questions about other
important contextual factors for mental wellbeing: social capital and
people’s experience of discrimination and harassment. The rationale for
including such measures is set out in detail in the adult mental health
indicators report.15 Social capital is a well-established concept within
mental health literature and encompasses aspects of social
connectedness via friend and kinship networks, trust in others, the
ability to draw on support from others, as well as a sense of
connectedness to places through involvement in the local community
and the ability to influence local decisions.
17
Discrimination
Poor health and low wellbeing are among the many negative
consequences for people who experience discrimination and
harassment. Participants were given a list of different grounds on which
people can experience discrimination and harassment (including age,
gender, disability, ethnicity, religion, sexual orientation) and asked
whether they had direct experience of this within the previous 12
months.28 The results are presented in full in supplementary web tables.
The analysis of risk factors for low mental wellbeing presented in
Section 1.5 includes the social capital, discrimination and harassment
measures. As with the stress at work analysis, this analysis is based on
data from the combined 2009 and 2011 surveys.
1.4.2
Trends in WEMWBS mean score since 2008, by age and sex
In 2011, the WEMWBS mean score for adults aged 16 and over was
49.9. This was not significantly different from the mean WEMWBS
scores in 2008, 2009 or 2010.
Wellbeing, as assessed by WEMWBS, was higher among men (50.2)
than women (49.7). This pattern is consistent with that found in previous
years of the survey.
WEMWBS scores have a complex pattern of association with age. In
2011, people aged 25-34 (50.6) and 65-74 (51.0) had the highest levels
of positive wellbeing and those aged 45-54 (49.0) and 75 and over
(49.2) had the lowest. This pattern is broadly similar to that found in
previous years of the survey and fits with the widely cited ‘U-curve’ in
subjective wellbeing, where levels of self-reported subjective wellbeing
dip during the middle years and among the oldest in society.29
Table 1.4
1.4.3
WEMWBS mean score, 2009 and 2011 combined, by job quality
and work-life balance
Table 1.5 presents mean WEMWBS scores according to the responses
people gave to various questions about their paid work for 2009 and
2011 combined. The items shown in the table are part of the national
mental health indicator set;15 the summary rows presented are the
specific indicator measures.
Job demands
Job demands (also referred to as work effort or work intensity) were
captured with a question about whether employed adults felt they had
‘unrealistic time pressures at work’. People who reported that this was
always or often the case had a significantly lower WEMWBS mean
score than those who experienced this seldom or never (48.6 compared
with 51.2). This pattern was evident among both men (48.7 compared
with 51.5) and women (48.4 compared with 51.0).
Table 1.5
18
Autonomy
Autonomy, or control, in the workplace was captured with a question
about how much choice employed respondents felt they had in deciding
how they do their work. People in work characterised by low levels of
autonomy (who reported that they seldom or never have control at
work) had a significantly lower wellbeing than those who experienced
this always or often (48.3 compared with 51.3). This pattern was evident
among both men (48.0 compared with 51.2) and women (48.6
compared with 51.3).
Figure 1D, Table 1.5
Figure 1D
WEMWBS mean score by control at work and sex, 2009 and 2011 combined
Men
Women
Mean WEMWBS score
60
50
40
30
20
10
0
Always/Often
Sometimes
Seldom/Never
Control at work
Social support in the workplace
Levels of social support in the workplace have widely been identified as
a factor predicting work-related stress. Respondents were asked about
social support from two sources: line managers and colleagues. People
who agreed that their line manager encourages them at work had a
higher WEMWBS mean score than those who disagreed (50.9
compared with 47.3). This association was particularly pronounced
among men (51.0 compared with 46.8).
Figure 1E, Table 1.5
Figure 1E
WEMWBS mean score by line manager encouragement
and sex, 2009 and 2011 combined
Men
Women
Mean WEMWBS score
60
50
40
30
20
10
0
Strongly agree/Tend to agree
Neutral
Strongly disagree/Tend to
disagree
Line manager encourages me at work
19
A similar pattern of association was found between perceived level of
help and support from colleagues and wellbeing. The WEMWBS mean
score was 50.9 among people who agreed that colleagues provided
support and 45.6 among those that disagreed. It is worth noting
however that very few respondents reported that colleagues did not
provide support, and so while the association was significant these
figures should be treated with some caution.
Table 1.5
Self-perceived work-related stress
How stressful people perceived their job to be was strongly associated
with their level of wellbeing. The WEMWBS mean score was 51.5
among those describing their job as not at all or mildly stressful, and
47.4 among those whose job was described as very or extremely
stressful. This pattern was apparent among both men and women. A
small minority of respondents found their job to be very or extremely
stressful.
Table 1.5
Satisfaction with work-life balance
The final measure presented in Table 1.5 is satisfaction with work-life
balance. Answers were given using a scale from 0 to 10. The median
score given was 7, so the data have been grouped according to
whether scores were below average (0-6), average (7) or above
average (8-10). Satisfaction with work-life balance was also strongly
associated with wellbeing. The WEMWBS mean score was 52.4 among
those who had above average satisfaction levels with their work-life
balance, and 48.4 among those who had below average satisfaction. A
small minority reported dissatisfaction with the balance between work
and other aspects of their life.
Figure 1F, Table 1.5
Figure 1F
WEMWBS mean score by satisfaction with work-life balance
and sex, 2009 and 2011 combined
Men
Women
Mean WEMWBS score
60
50
40
30
20
10
0
Below average (0 - 6)
Average (7)
Satisfaction with work-life balance
20
Above average (8-10)
1.5
FACTORS ASSOCIATED WITH BELOW AVERAGE WELLBEING, 2009 AND
2011 COMBINED
1.5.1
Introduction
Multivariate logistic regression was used to estimate the independent
effect of a range of socio-demographic and behavioural factors
associated with having low wellbeing, after each factor had been
adjusted for simultaneously. In these analyses low wellbeing is defined
as a having a below average mean WEMWBS score. The value of
multivariable analyses like these is being able to disentangle
confounding factors, for example being able to test whether or not the
lower levels of wellbeing observed among people who are not married
or cohabiting is due to the age profile of this group.
A large number of socio-demographic and behavioural factors were
tested for significance. These were:
socio-demographic characteristics (age group, equivalised
household income, household NS-SEC, highest educational
qualification, economic activity and marital/partnership status);
health status (self-reported general health and limiting
longstanding illness);
health behaviours (smoking, alcohol consumption, fruit and
vegetable consumption and physical activity level);
discrimination (discrimination and harassment);
social capital and support (trust in people generally, trust in
people in the neighbourhood, involvement in local community,
influence over local decisions, how often contact people and how
many friends can contact in a crisis); and
neighbourhood deprivation (SIMD quintile).
Regression models were run on combined 2009 and 2011 data for all
adults (data not shown) and then run separately for men and women.
The odds ratios of having below average wellbeing are presented in
Table 1.6. In these analyses, the odds of a reference group (shown in
the table with a value of 1) are compared with that of the other
categories for each of the individual factors. In this example, an odds
ratio of greater than one indicate that the group in question had higher
odds of low wellbeing and an odds ratio of less than one mean they had
lower odds of having low wellbeing compared to the reference group.
Odds ratios whose confidence intervals contain the value 1 are not
significantly different to the reference category. By simultaneously
controlling for a number of factors, the independent effect each factor
has on the variable of interest can be established. For more information
about logistic regression models and how to interpret their results see
the glossary at the end of this volume.
21
1.5.2
Results
Socio-demographic factors
Overall, sex was a significant predictor of wellbeing; women had higher
odds than men of having a below average WEMWBS score (odds ratio
of 1.30, data not shown). The following results are based on separate
models for men and women.
Age group and marital status were associated with wellbeing for both
men and women. People aged 16-44 had double the odds of having low
wellbeing than those aged 65 and over (odds ratios for men and women
aged 65 and over were 0.53 and 0.48 respectively). With regards
marital status, single women had significantly higher odds of having a
below average WEMWBS score than women who were married or in a
civil partnership (odds ratio of 1.62). While the overall association
between marital status and low wellbeing was significant for men, the
nature of the relationship was not clear.
Education level was a significant predictor of wellbeing among women,
but not men. Women with no qualifications had twice the odds of low
wellbeing compared with women with a degree (odds ratio of 2.00).
While education level was not significant for men overall, men educated
to standard grade (or equivalent qualification) level did have
significantly higher odds of low wellbeing compared with men with a
degree or higher qualification (odds ratio of 1.82).
Once other factors were controlled for neither household income or
socio-economic classification (NS-SEC) were significantly associated
with low wellbeing.
Health status
Men who assessed their general health as bad or very bad had odds six
times greater than men who assessed their health as good or very good
(odds ratio of 6.03). The comparable odds for women were five (odds
ratio of 5.18). For both men and women, those who defined their
longstanding condition as limiting had higher odds of low wellbeing than
people with a non-limiting illness (odds ratio of 0.34 for men and 0.49
for women).
Health behaviours
Physical activity level was the only health behaviour found to
significantly predict below average wellbeing after other factors were
controlled for. Among men, the odds of those with low physical activity
levels were 1.61 times higher than those meeting the physical activity
recommendations. For women, there was no independent significant
association between physical activity levels and below average
wellbeing for women.
22
Discrimination and harassment
While both experience of discrimination or unfair treatment and of
harassment were significant univariate predictors of wellbeing,
harassment was no longer significant once discrimination and other
factors were controlled for. This suggests that the fact that
discrimination is perceived to be motivated by personal characteristics
may be more detrimental to wellbeing than the act of the harassment
itself. Men who reported experiencing discrimination in the previous
year had increased odds of low wellbeing (2.02) compared with men
who did not report experiencing discrimination. Experience of
discrimination was also significantly associated with low wellbeing for
women (odds ratio of 1.68).
Social capital and support
The two aspects of social capital that significantly predicted wellbeing
were the number of people that participants said they could turn to in a
crisis, and the extent to which they said they felt involved in their local
community. The odds of having below average wellbeing were highest
among men and women reporting that they had three or fewer people
that they could turn to in a crisis.
Similarly, those who said that they were ‘not at all’ involved in the local
community had the highest odds of having a below average wellbeing
score (odds ratios of 2.08 among men and 1.86 among women).
Table 1.6
1.6
DEPRESSION AND ANXIETY
1.6.1
Introduction
Details of anxiety and depression symptoms are collected in the nurse
interview via a standardised instrument, the Revised Clinical Interview
Schedule (CIS-R). The CIS-R is a well-established tool for measuring
the prevalence of mental disorders.30 The CIS-R comprises 14 sections,
each covering a type of neurotic symptom and asks about presence of
symptoms in the week preceding the interview. Prevalence of two of
these neurotic symptoms - depression and anxiety - were introduced to
the survey in 2008. Questions about suicide attempts and self-harm
were also asked, and are reported below. Given the potentially sensitive
nature of these topics, these questions were included in the nurse
interview part of the survey.31 Because only a sub-sample of adults was
invited to participate in the nurse interview the results that follow are
based on combined data from 2008 and 2009, and from 2010 and
2011. This allows for greater accuracy when figures are presented for
different age or socio-demographic groups.
The following two mental health indicators are based on the data
reported here:13
23
Percentage of adults who have a symptom score of 2 or more
on the depression section of the CIS-R.
Percentage of adults who have a symptom score of 2 or more
on the anxiety section of the CIS-R.
1.6.2
Symptoms of depression
The proportion of people with two or more symptoms (indicating
depression of moderate to high severity) in 2010/2011 (7%) was
broadly similar to levels in 2008/2009 (8%). There has, however, been
an increase in the proportion with one symptom, from 5% in 2008/2009
to 12% in 2010/2011. This pattern was evident for both men and
women (between the two periods, the proportion with one symptom
increased from 4% to 11% in men, and from 6% to 13% in women.
For every age group (except 16-24 year olds) there was a small decline
in the proportion with two or more symptoms of depression between
2008/2009 and 2010/2011. The overall increase in the proportion with
one symptom of depression was true of all age groups.
Looking at the age patterns separately for men and women shows a
slightly different picture. The increase in depression symptoms was
particularly evident in men aged 16-34 and 45-54, and women aged 3544 and 65-74, though the relatively small sample sizes for these subgroups mean that strong inferences cannot be drawn from these
patterns. However, it is plausible that the overall increase in the
prevalence of depressive symptoms in this period could be attributed to
the worsening economic conditions in 2010/2011 compared with
2008/2009.
Focusing on the 2010/2011 figures, depressive symptoms were more
common in women (13% had one symptom, 8% had two or more) than
men (11% and 5%, respectively). The presence of depressive
symptoms was not associated with age.
Table 1.7
1.6.3
Symptoms of anxiety
There was no significant change in the prevalence of anxiety symptoms
between 2008/2009 and 2010/2011. The proportion of people with two
or more symptoms (indicating anxiety of moderate to high severity)
remained at 9% in 2010/2011. The proportion with just one symptom
was also very similar (9% in 2008/2009 and 7% in 2010/2011).
As Figure 1G illustrates, anxiety was associated with gender, with
women more likely than men to have symptoms (in 2010/2011, 9% of
women and 5% of men had one symptom, and 10% and 8% had two or
more, respectively).
There was a significant association between anxiety and age. For men
aged 16-54, prevalence of two or more symptoms ranged from 8-9%, it
was 7% for those aged 55-74 and just 1% at age 75 and over. Women
24
aged 25-54 were twice as likely as women of other ages to have two or
more symptoms of anxiety (14%-15% compared with 5%-7%). The
presence of any symptoms of anxiety (i.e. one or more symptoms) was
lowest among men aged 65 and over and highest among women aged
25-54 (with a particular peak in the 25-34 age group) (data not shown).
Figure 1G, Table 1.7
Figure 1G
Proportion of adults with 2+ anxiety symptoms, by age and sex, 2010 and 2011 combined
Men
Women
30
Percent
20
10
0
16-24
25-34
35-44
45-54
55-64
65-74
75+
All
Age group
1.7
SUICIDE ATTEMPTS AND DELIBERATE SELF-HARM
1.7.1
Introduction
In addition to being asked about symptoms of depression and anxiety,
those who took part in the nurse visit were also asked whether they had
ever attempted to take their own life. The question was worded as
follows:
Have you ever made an attempt to take your own life, by taking
an overdose of tablets or in some other way?
Those who said yes were asked if this was in the last week, in the last
year or at some other time. Note that this question is likely to
underestimate the prevalence of very recent attempts, as people might
be less likely to agree to take part in a survey immediately after a
traumatic life event such as this and due to underreporting in response
to a question administered face to face. Furthermore, suicide attempts
will only be captured in a survey among people who have not
succeeded.
Participants in the nurse visit were also asked whether they had ever
deliberately harmed themselves but not with the intention of killing
themselves.
25
1.7.2
Suicide attempts
The NHS Scotland HEAT target is to reduce the suicide rate between
2002 and 2013 by 20 percent.32 In 2011, 639 males and 250 females
died from suicide and the age standardised suicide rate for 2009-11
was 14.5 deaths per 100,000 population.33 Between 2000-02 and 200911, there was an overall downward trend of 17% in suicide rates.
In SHeS 2010/2011, 5% of adults reported having attempted suicide at
some point in their life. This was very similar to the 2008/2009 figure of
4%. While death records indicate that men are markedly more likely
than women to complete a suicide,34 survey data indicate that women
are more likely to report having made an attempt. The data here
confirmed this pattern: in 2010/2011, 6% of women reported ever
having made an attempt, compared with 4% of men.
Despite presenting figures based on two years of data combined,
commenting on differences among age sub-groups in 2010/2011 and
over time is difficult due to the small sample sizes and the greater
likelihood of sample fluctuation. However, there did appear to be an
association between age and reporting a suicide attempt with older
people generally less likely to report an attempt than younger people,
despite this variable relating to lifetime experience. This is likely to
reflect several factors, such as a healthy survivor effect and issues
relating to repression and diminished recall. Men aged 25-44 (5%) and
women aged 35-54 (7-11%) were most likely to report a suicide
attempt. However it is important to note that there were wide confidence
intervals around these estimates.
Table 1.7
1.7.3
Deliberate self-harm
Overall, 2% of people in 2010/2011 reported that they had ever
deliberately harmed themselves without suicidal intent. 3% reported
self-harm in 2008/2009. Levels of self-harm were similar for men and
women. These figures are lower than that reported elsewhere, which
will in part be due to the method of questioning. For example, the Adult
Psychiatric Morbidity Survey conducted in England in 2007 recorded a
prevalence of self-harm of 4.9% when asked in a self-completion
questionnaire, and 3.4% when asked in a face to face interview. 35 The
2008-2011 SHeS self-harm questions (along with the suicide,
depression and anxiety questions) were asked face to face by nurses.
Self-harming was associated with age, with prevalence higher among
younger age groups. It was reported by 6% of those aged 16-24 and
5% of those aged 35-44 compared with no more than 2% for all other
age groups (no one aged 75 and over reported ever having selfharmed). The lower reporting among older age groups may be subject
to similar factors as discussed above in relation to suicide attempts.
Table 1.7
26
References and notes
1
Inequalities in Health. Report of the Measuring Inequalities in Health Working Group. Measuring
Inequalities in Health Working Group, 2003. [online] Available from:
<www.scotland.gov.uk/Resource/Doc/47171/0013513.pdf>
2
See: <www.scotland.gov.uk/About/Performance/scotPerforms/indicator/generalhealth>
3
See: <www.scotland.gov.uk/About/scotPerforms/indicator/wellbeing>
4
Scottish Budget Spending Review 2007, Edinburgh: Scottish Government, 2007. [online]
Available from: <www.scotland.gov.uk/Publications/2007/11/13092240/0>
5
National Performance Framework: Changes to the National Indicator Set, Edinburgh: Scottish
Government, 2012. [online] Available from:
<www.scotland.gov.uk/About/scotPerforms/NIchanges> See also:
<www.scotlandperforms.com>
6
Given, L. (2009). Chapter 1: General Health and Mental Wellbeing. In Bromley, C., Bradshaw,
P. and Given, L. [eds.] The 2008 Scottish Health Survey – Volume 1: Main Report. Edinburgh,
Scottish Government. <www.scotland.gov.uk/Publications/2009/09/28102003/0>
7
Given, L. (2010). Chapter 1: General Health and Mental Wellbeing. In Bromley, C., Given, L.
and Ormston, R. [eds.] The 2009 Scottish Health Survey – Volume 1: Main Report. Edinburgh,
Scottish Government. <www.scotland.gov.uk/Publications/2010/09/23154223/6>
8
McManus, S. (2011). Chapter 1: General Health and Mental Wellbeing. In Bromley, C. and
Given, L. [eds.] The 2010 Scottish Health Survey – Volume 1: Main Report. Edinburgh, Scottish
Government. <www.scotland.gov.uk/Publications/2011/09/27084018/6>
9
Equally Well – Report of the Ministerial Taskforce on Health Inequalities, Edinburgh: Scottish
Government, 2008.
10
Towards a Mentally Flourishing Scotland: Scottish Government, 2009. Available from:
www.scotland.gov.uk/Publications/2007/10/26112853/0
11
See: <www.chooselife.net/home/Home.asp>
12
National Suicide Prevention Working Group.(2010). Refreshing the national strategy and action
plan to prevent suicide in Scotland. Edinburgh: Scottish Government.
<www.scotland.gov.uk/Publications/2010/10/26112102/0>
13
The 2007 Better Health, Better Care action plan for improving health and health care in
Scotland set out how NHS Scotland’s HEAT performance management system (based around
a series of targets against which the performance of its individual Boards are measured) would
feed into the Government’s overarching objectives. The HEAT targets derive their name from
the four strands in the performance framework: the Health of the population; Efficiency and
productivity, resources and workforce; Access to services and waiting times; and Treatment and
quality of services.
14
HEAT Targets due for delivery in 2010/11 – Summary of performance. (2012). NHS Scotland
Performance and Business Management.
<www.scotland.gov.uk/Resource/0039/00391013.pdf>
15
Parkinson, J. (2007). Establishing a core set of national, sustainable mental health indicators for
adults in Scotland: Final report. Glasgow: NHS Health Scotland.
16
A parallel set of national mental health indicators for children and young people has also been
developed and is discussed in Volume 2 of this Report.
27
17
Stiglitz, J., Sen, A. and Fitoussi, J-P. (2009). Report by the Commission on the Measurement of
Economic Performance and Social Progress.
<www.stiglitz-sen-fitoussi.fr/documents/rapport_anglais.pdf>
18
Waldron, S. Measuring Subjective Wellbeing in the UK. London: Office for National Statistics,
2010.
19
Mental Health Strategy for Scotland: 2012-2015, Edinburgh: Scottish Government, 2012.
20
Idler, E.L. and Benyamini, Y. (1997). Self-rated health and mortality: a review of twenty-seven
community studies. Journal of Health and Social Behaviour. 38 (1), 21-37.
21
Hanlon, P., Lawder, R., Elders, A., Clark, D., Walsh, D., Whyte, B. and Sutton, M. (2007). An
analysis of the link between behavioural, biological and social risk factors and subsequent
hospital admission in Scotland. Journal of Public Health. 29, 405-412.
22
The briefing paper on the development of WEMWBS is available online from:
<www.wellscotland.info/indicators.html>
23
Stewart-Brown, S. and Janmohamed, K. (2008). Warwick-Edinburgh Mental Well-being Scale
(WEMWBS). User Guide Version 1. Warwick and Edinburgh: University of Warwick and NHS
Health Scotland.
24
The translation was carried out solely to ensure that speakers of other languages were not
excluded from the Scottish Health Survey. There were insufficient numbers of non-English
speaking people in the sample to enable comparisons of their health with the rest of the
population. As the primary intention was to prevent the exclusion of people due to language
barriers, the translated WEMWBS questions were not subject to the full extent of validation that
would need to take place if the questionnaire was being used to assess wellbeing in a whole
population of non-English speakers. It is therefore possible that the translated WEMWBS scale
(and other questions in the survey) is not directly comparable to the English version. However,
the number of interviews that used translated materials was judged to be too small to affect the
national estimates presented here so all cases have been included in the analysis.
25
A subset of the stress at work questions was selected for use in the chapter. The question
wording for these items was:
I have unrealistic time pressures at work
I have a choice in deciding how I do my work
Answer options: Always, Often, Sometimes, Seldom, Never
My line manager encourages me at work
I get the help and support I need from colleagues at work
Answer options: Strongly agree, tend to agree, neutral, tend to disagree, strongly disagree,
does not apply.
How satisfied are you with the balance between the time you spend on your paid work and the
time you spend on other aspects of your life? Please take your answer from this card.
Answer options: 0- Extremely dissatisfied, 1, 2, 3, 4, 5, 6, 7, 8, 9, 10- Extremely satisfied
In general, how do you find your job?
Answer options: Not at all stressful, mildly stressful, moderately stressful, very stressful,
extremely stressful.
26
Siegrist, J, Starke, D, Chandola, T, Godin, I, Marmot, M, Niedhammer, I, Peter, R. (2004) The
measurement of effort-reward imbalance at work: European comparisons. Soc Sci Med.
58(8):1483-99.
27
Karasek, R, Brisson, C, Kawakami, N, Houtman, I, Bongers, P, Amick, B. (1998) The Job
Content Questionnaire (JCQ): An instrument for internationally comparative assessments of
psychosocial job characteristics. Journal of Occupational Health Psychology, 3(4), 322-355.
28
28
The question wording was:
Have you personally been unfairly treated or discriminated against in the last 12 months, that
is since (date 12 months ago), for any of the reasons on this card?
Have you personally experienced harassment or abuse in the last 12 months, that is since (date
12 months ago), for any of the reasons on this card?
Answer options: your accent, your ethnicity, your age, your language, your colour, your
nationality, your mental ill-health, any other health problems or disability, your sex, your
religious beliefs or faith, your sexual orientation, where you live, other reason, I have not
experienced this.
29
Blanchflower, DG and Oswald, AJ. (2007) Is well-being U-shaped over the life cycle? Working
Paper. Coventry: University of Warwick, Department of Economics.
30
Lewis, G. & Pelosi, A. J. (1990) Manual of the Revised Clinical Interview Schedule CIS–R.
London: Institute of Psychiatry; Lewis G, Pelosi AJ, Araya R, Dunn G. (1992) Measuring
psychiatric disorder in the community; a standardised assessment for use by lay interviewers.
Psychological Medicine, 22, 465-486.
31
The nurse interview is conducted with one adult at a time, whereas the main interview can be
conducted concurrently with up to four household members present. It was therefore easier to
ensure that these questions could be answered in confidence. Nurses were also thought to be
better placed to handle very sensitive topics such as these than interviewers conducting a
general health survey who would have required additional specialist briefing. A leaflet with
various help lines was handed to all participants in the nurse visit. From 2012, these questions
are included in the biological module of the survey, conducted by specially trained interviewers,
and will be completed by participants using a self-completion computer aided questionnaire.
32
The HEAT targets derive their name from the four strands in the performance framework: the
Health of the population; Efficiency and productivity, resources and workforce; Access to
services and waiting times; and Treatment and quality of services.
33
In 2011, the National Records of Scotland (NRS) changed its coding practice to take account of
changes made by the World Health Organisation (WHO) to coding rules for certain causes of
death. As a result there is a difference in how death data were coded for 2011 compared to
previous years, with some deaths previously coded under 'mental and behavioural disorders'
now being classed as 'self-poisoning of undetermined intent' and consequently as suicides. The
figures presented are based on the new coding rules. Further details available from:
http://www.scotpho.org.uk/health-wellbeing-and-disease/suicide/data/national-trends
34
For estimates of deaths by suicide in Scotland in 2011 see: http://www.scotpho.org.uk/healthwellbeing-and-disease/suicide/data/national-trends
35
McManus S, Meltzer H, Brugha T, Bebbington P, Jenkins R (eds) (2009). Adult Psychiatric
Morbidity in England 2007: results of a household survey. The NHS Information Centre.
29
Table list
Table 1.1
Table 1.2
Table 1.3
Table 1.4
Table 1.5
Table 1.6
Table 1.7
Adult self-assessed general health, 2008, 2009, 2010, 2011, by age and sex
Prevalence of long-term conditions in adults, 2008, 2009, 2010, 2011, by age
and sex
Prevalence of long-term conditions in adults, 2008-2011 combined (agestandardised), by Scottish Index of Multiple Deprivation and sex
WEMWBS mean scores, 2008, 2009, 2010, 2011, by age and sex
WEMWBS mean score, 2009/2011 combined, by stress at work, work-life
balance, job/workplace conditions and sex
Estimated odds ratios for below average WEMWBS mean scores, 2009/2011
combined, by associated risk factors and sex
CIS-R anxiety and depression symptom scores, attempted suicide and
deliberate self-harm, 2008/2009 combined, 2010/2011 combined, by age and
sex
30
Table 1.1
Adult self-assessed general health, 2008, 2009, 2010, 2011, by age and
sex
Aged 16 and over
2008, 2009, 2010, 2011
Self-assessed general Age
health
16-24
25-34
35-44
45-54
55-64
65-74
75+
%
%
%
%
%
%
%
%
Very good
2008
2009
2010
2011
54
49
49
51
48
49
42
47
39
43
37
41
35
33
35
34
30
29
26
27
24
24
24
25
17
18
18
17
37
37
35
37
Good
2008
2009
2010
2011
34
42
41
42
40
38
46
40
44
39
42
45
43
41
41
40
36
40
41
40
37
42
37
39
38
33
40
34
39
40
41
41
Fair
2008
2009
2010
2011
12
9
8
7
9
11
9
11
12
12
15
10
14
17
19
18
21
20
21
20
28
22
27
24
27
32
28
33
16
16
17
16
Bad
2008
2009
2010
2011
1
0
2
-
2
1
2
2
5
5
4
3
7
7
4
6
9
9
9
9
9
9
9
8
14
13
9
12
6
6
5
5
Very bad
2008
2009
2010
2011
0
1
0
1
0
1
1
2
1
2
2
2
2
4
2
3
4
2
2
3
3
4
5
5
3
2
1
2
2
88
91
90
93
88
87
88
87
82
83
79
86
78
75
75
75
66
69
67
67
61
66
61
65
55
50
58
51
76
77
76
77
1
0
2
0
3
2
2
2
5
5
6
3
8
8
6
8
13
11
12
13
12
11
13
11
Men
Very good/good
2008
2009
2010
2011
Bad/very bad
2008
2009
2010
2011
Total
31
17
7
17
7
14
7
15
7
Continued…
Table 1.1
- Continued
Aged 16 and over
2008, 2009, 2010, 2011
Self-assessed general Age
health
16-24
25-34
35-44
45-54
55-64
65-74
75+
%
%
%
%
%
%
%
%
Very good
2008
2009
2010
2011
41
43
39
48
45
47
43
49
42
42
42
39
36
37
35
35
29
31
32
30
26
25
29
24
18
15
20
18
35
36
35
36
Good
2008
2009
2010
2011
45
47
47
42
40
40
41
38
41
41
39
40
39
39
38
40
40
42
34
38
37
39
39
37
34
39
35
33
40
41
39
39
Fair
2008
2009
2010
2011
12
9
11
7
12
10
12
9
14
12
13
15
18
14
18
17
20
20
23
19
26
25
22
27
36
34
33
35
19
17
18
18
Bad
2008
2009
2010
2011
2
1
3
2
3
2
3
3
3
5
6
5
5
8
8
6
8
6
8
9
8
9
8
10
10
10
10
11
5
6
6
6
Very bad
2008
2009
2010
2011
0
-
0
1
0
1
0
1
1
1
2
1
1
2
4
1
4
3
3
2
2
2
3
2
3
3
2
1
2
2
86
90
86
90
85
87
84
86
82
82
81
79
75
76
73
75
69
73
66
69
64
64
68
62
51
54
54
50
75
77
74
74
2
1
3
2
3
3
3
4
3
6
6
6
7
9
10
8
11
7
11
12
11
11
10
12
Women
Very good/good
2008
2009
2010
2011
Bad/very bad
2008
200
2010
2011
Total
32
13
7
12
7
12
8
15
8
Continued…
Table 1.1
- Continued
Aged 16 and over
2008, 2009, 2010, 2011
Self-assessed general Age
health
16-24
25-34
35-44
45-54
55-64
65-74
75+
%
%
%
%
%
%
%
%
87
90
88
92
86
87
86
87
82
83
80
83
76
76
74
75
67
71
66
68
62
65
64
63
53
53
56
51
75
77
75
76
1
1
3
1
3
2
3
3
4
6
6
5
8
9
8
8
12
9
12
13
11
11
11
11
15
14
13
15
7
7
7
7
464
538
515
536
444
511
494
514
908
1050
1009
1051
481
568
560
583
487
571
556
580
968
1138
1116
1163
563
634
588
613
616
695
645
671
1179
1328
1233
1285
555
650
631
655
591
700
682
710
1146
1349
1313
1365
480
563
542
565
504
590
571
595
983
1153
1114
1159
327
387
374
390
384
450
432
449
711
836
806
839
218
259
253
266
350
410
396
413
568
669
649
679
3087
3598
3464
3608
3376
3926
3775
3932
6463
7524
7239
7541
246
272
274
308
333
383
373
364
579
655
647
672
317
406
421
399
451
580
565
562
768
986
986
961
460
550
477
516
648
780
682
711
1108
1330
1159
1227
535
602
566
599
632
733
763
803
1167
1335
1329
1402
525
575
555
602
632
735
701
739
1157
1310
1256
1341
453
517
489
511
516
550
574
597
969
1067
1063
1108
304
363
330
344
410
480
470
486
714
843
800
830
2840
3285
3112
3279
3622
4241
4128
4262
6462
7526
7240
7541
Total
All adults
Very good/good
2008
2009
2010
2011
Bad/very bad
2008
2009
2010
2011
Bases (weighted):
Men 2008
Men 2009
Men 2010
Men 2011
Women 2008
Women 2009
Women 2010
Women 2011
All adults 2008
All adults 2009
All adults 2010
All adults 2011
Bases (unweighted):
Men 2008
Men 2009
Men 2010
Men 2011
Women 2008
Women 2009
Women 2010
Women 2011
All adults 2008
All adults 2009
All adults 2010
All adults 2011
33
Table 1.2
Prevalence of long-term conditions, 2008, 2009, 2010, 2011, by age and
sex
Aged 16 and over
Long-term conditions and
limiting long-term
conditions
2008, 2009, 2010, 2011
Age
Total
16-24
25-34
35-44
45-54
55-64
65-74
75+
%
%
%
%
%
%
%
%
No long-term conditions
2008
2009
2010
2011
84
83
76
77
79
80
77
74
67
73
64
70
61
62
62
53
46
48
42
41
38
39
35
37
33
30
31
27
62
63
59
57
Limiting long-term
conditions
2008
2009
2010
2011
7
9
11
11
10
10
11
13
20
16
23
15
22
22
22
25
34
32
35
38
43
40
45
43
50
58
48
55
23
23
25
26
Non-limiting long-term
conditions
2008
2009
2010
2011
10
8
13
12
12
10
12
13
14
11
13
15
17
16
16
22
20
20
23
21
19
21
21
20
17
12
21
17
15
14
16
17
Total with conditions
2008
2009
2010
2011
16
17
24
23
21
20
23
26
33
27
36
30
39
38
38
47
54
52
58
59
62
61
65
63
67
70
69
73
38
37
41
43
No long-term conditions
2008
2009
2010
2011
82
79
76
79
71
73
74
73
70
67
63
61
58
61
54
51
45
45
42
44
34
38
36
37
29
31
28
22
58
58
55
54
Limiting long-term
conditions
2008
2009
2010
2011
8
12
12
11
17
16
16
18
19
19
25
23
25
24
30
30
39
34
40
37
44
40
42
43
54
55
55
60
28
27
30
30
Non-limiting long-term
conditions
2008
2009
2010
2011
10
9
12
10
11
11
10
10
11
14
12
15
17
14
16
19
16
21
18
20
22
21
21
21
Men
Women
34
17
15
14
15
17
15
18
16
Continued…
Table 1.2
- Continued
Aged 16 and over
Long-term conditions and
limiting long-term
conditions
Total with conditions
2008
2009
2010
2011
2008, 2009, 2010, 2011
Age
Total
16-24
25-34
35-44
45-54
55-64
65-74
75+
%
%
%
%
%
%
%
%
18
21
24
21
29
27
26
27
30
33
37
39
42
39
46
49
55
55
58
56
66
62
64
63
71
69
72
78
42
42
45
46
17
19
24
22
25
23
25
27
32
30
36
35
41
39
42
48
54
54
58
57
64
61
64
63
69
69
71
76
41
40
43
44
464
538
515
536
445
511
493
514
909
1050
1009
1051
481
568
560
583
487
571
557
580
968
1138
1117
1163
563
633
589
613
616
695
645
671
1179
1328
1234
1285
555
649
631
657
591
700
682
710
1146
1349
1313
1366
480
563
542
565
504
590
571
595
983
1153
1114
1159
327
387
374
390
384
450
432
449
711
836
805
839
218
259
253
266
350
410
397
413
568
669
650
679
3087
3597
3465
3610
3377
3926
3777
3932
6464
7523
7242
7542
246
272
274
308
334
383
372
364
580
655
646
672
317
406
421
399
451
580
566
562
768
986
987
961
460
549
478
516
648
780
682
711
1108
1329
1160
1227
535
601
566
600
632
733
763
803
1167
1334
1329
1403
525
575
555
602
632
735
701
739
1157
1310
1256
1341
453
517
488
511
516
550
574
597
969
1067
1062
1108
304
363
330
344
410
480
471
486
714
843
801
830
2840
3283
3112
3280
3623
4241
4129
4262
6463
7524
7241
7542
All adults
Total with conditions
2008
2009
2010
2011
Bases (weighted):
Men 2008
Men 2009
Men 2010
Men 2011
Women 2008
Women 2009
Women 2010
Women 2011
All adults 2008
All adults 2009
All adults 2010
All adults 2011
Bases (unweighted):
Men 2008
Men 2009
Men 2010
Men 2011
Women 2008
Women 2009
Women 2010
Women 2011
All adults 2008
All adults 2009
All adults 2010
All adults 2011
35
Table 1.3
Prevalence of long-term conditions, 2008-2011 combined (agestandardised), by Scottish Index of Multiple Deprivation and sex
Aged 16 and over
2008-2011 combined
Long-term
Scottish Index of Multiple Deprivation quintile
conditions and
th
rd
nd
5th
1st
4
3
2
limiting long-term
(least
(most
conditions
deprived)
deprived)
Men
No long-term
conditions
Limiting long-term
conditions
Non-limiting longterm conditions
Total with conditions
Women
No long-term
conditions
Limiting long-term
conditions
Non-limiting longterm conditions
Total with conditions
All adults
No long-term
conditions
Limiting long-term
conditions
Non-limiting longterm conditions
Total with conditions
Bases (weighted):
Men
Women
All adults
Bases
(unweighted):
Men
Women
All adults
SIMD 85/15
85% least 15% most
deprived deprived
%
%
%
%
%
%
%
67
61
61
58
51
61
50
17
20
25
27
35
23
36
16
18
14
15
14
16
14
33
39
39
42
49
39
50
64
61
57
52
46
58
45
20
24
28
33
40
27
41
16
14
16
15
14
15
13
36
39
43
48
54
42
55
65
61
59
55
49
60
48
18
22
26
30
38
25
39
16
16
15
15
14
16
14
35
39
41
45
51
40
52
2732
2943
5675
3009
3100
6109
2705
2946
5651
2693
3003
5695
2626
3014
5640
11783
12775
24558
1982
2231
4213
2234
2844
5078
2887
3602
6489
2679
3423
6102
2359
3125
5484
2356
3262
5618
10697
13758
24455
1818
2498
4316
36
Table 1.4
WEMWBS mean scores, 2008, 2009, 2010, 2011, by age and sex
Aged 16 and over
WEMWBS scoresa
2008, 2009, 2010, 2011
Age
Total
16-24
25-34
35-44
45-54
55-64
65-74
75+
Mean
2008
2009
2010
2011
51.1
50.2
51.7
50.3
50.4
50.1
50.8
51.1
50.6
49.5
49.1
50.1
49.6
48.8
49.5
49.1
50.0
50.3
49.5
49.7
50.7
51.4
51.6
51.3
48.7
49.1
50.1
49.7
50.2
49.9
50.2
50.2
SE of the mean
2008
2009
2010
2011
0.57
0.58
0.51
0.54
0.47
0.38
0.49
0.49
0.48
0.37
0.44
0.42
0.42
0.39
0.43
0.39
0.48
0.38
0.44
0.44
0.50
0.38
0.43
0.43
0.63
0.53
0.53
0.58
0.20
0.16
0.19
0.19
Standard deviation
2008
2009
2010
2011
7.54
7.65
7.26
8.06
7.52
7.09
7.81
8.19
8.80
8.23
8.47
7.91
8.47
8.44
8.42
8.50
9.48
8.27
9.27
8.67
9.49
7.99
8.51
8.76
8.51
8.18
8.30
8.29
8.55
8.02
8.37
8.35
Mean
2008
2009
2010
2011
49.8
50.3
49.5
50.0
49.4
49.5
50.0
50.1
49.5
49.6
49.4
49.7
49.5
48.9
48.6
48.9
49.7
50.4
49.9
49.9
51.2
50.5
51.3
50.7
49.0
48.3
49.0
48.8
49.7
49.7
49.6
49.7
SE of the mean
2008
2009
2010
2011
0.48
0.51
0.47
0.49
0.43
0.38
0.41
0.40
0.36
0.32
0.37
0.31
0.43
0.36
0.37
0.37
0.42
0.35
0.38
0.36
0.43
0.41
0.43
0.35
0.49
0.48
0.44
0.46
0.16
0.16
0.17
0.17
Standard deviation
2008
2009
2010
2011
7.66
8.23
7.82
7.64
8.23
8.23
8.57
8.53
8.24
8.39
8.74
7.76
9.32
9.10
9.06
9.07
8.81
8.49
8.94
8.83
8.57
8.27
8.92
7.73
7.98
8.39
7.96
8.59
8.48
8.51
8.67
8.37
Mean
2008
2009
2010
2011
50.5
50.2
50.6
50.1
49.9
49.8
50.4
50.6
50.0
49.5
49.2
49.9
49.6
48.8
49.0
49.0
49.8
50.3
49.7
49.8
51.0
50.9
51.5
51.0
48.9
48.6
49.4
49.2
50.0
49.7
49.9
49.9
SE of the mean
2008
2009
2010
2011
0.37
0.39
0.36
0.40
0.34
0.28
0.34
0.34
0.32
0.25
0.30
0.25
0.31
0.29
0.30
0.29
0.33
0.27
0.32
0.30
0.35
0.29
0.33
0.29
0.40
0.37
0.35
0.38
0.14
0.12
0.14
0.14
Standard deviation
2008
2009
2010
2011
7.62
7.94
7.62
7.85
7.90
7.68
8.21
8.37
8.52
8.31
8.61
7.83
8.91
8.79
8.77
8.80
9.14
8.38
9.10
8.75
8.99
8.15
8.73
8.22
8.19
8.52
8.31
8.28
8.10
8.54
8.48
8.36
Continued…
Men
Women
All adults
37
Table 1.4
- Continued
Aged 16 and over
WEMWBS scoresa
2008, 2009, 2010, 2011
Age
16-24
Total
25-34
35-44
45-54
55-64
65-74
Bases (weighted):
Men 2008
420
435
519
510
436
285
Men 2009
480
537
584
599
519
346
Men 2010
464
524
540
580
514
345
Men 2011
477
521
550
592
501
336
Women 2008
404
447
566
546
456
344
Women 2009
478
527
654
663
551
398
Women 2010
461
519
607
647
530
394
Women 2011
471
542
618
648
540
389
All adults 2008
823
882
1085
1056
892
629
All adults 2009
958
1065
1238
1262
1070
744
All adults 2010
926
1043
1147
1228
1045
739
All adults 2011
948
1063
1168
1240
1041
725
Bases (unweighted):
Men 2008
222
285
425
487
475
398
Men 2009
244
384
507
559
532
464
Men 2010
253
394
437
519
526
451
Men 2011
277
357
468
542
536
441
Women 2008
304
415
600
585
572
463
Women 2009
360
540
736
698
687
488
Women 2010
350
530
644
722
653
524
Women 2011
334
527
654
740
676
524
All adults 2008
526
700
1025
1072
1047
861
All adults 2009
604
924
1243
1257
1219
952
All adults 2010
603
924
1081
1241
1179
975
All adults 2011
611
884
1122
1282
1212
965
a Mean WEMWBS score is part of the national mental health indicator set for adults
38
75+
181
216
204
213
264
314
318
333
444
530
522
546
2785
3282
3171
3191
3026
3586
3478
3540
5812
6868
6649
6731
247
304
262
279
309
377
382
390
556
681
644
669
2539
2994
2842
2900
3248
3886
3805
3845
5787
6880
6647
6745
Table 1.5
WEMWBS mean score, 2009 and 2011 combined, by stress at work, worklife balance, job/workplace conditions and sex
Aged 16 and over and in work
2009 and 2011 combined
WEMWBS
Mean Score
WEMWBS
SE
WEMWBS
Standard
Deviation
Weighted
Bases
Unweighted
Bases
I have unrealistic time
pressures at work
Always/Often
Sometimes
Seldom/Never
48.7
50.2
51.5
0.52
0.41
0.38
8.09
6.48
7.53
366
436
534
294
358
491
I have a choice in
deciding how I do
my work
Always/Often
Sometimes
Seldom/Never
51.2
49.1
48.0
0.30
0.54
0.81
7.13
7.11
8.54
874
269
192
765
224
154
51.0
0.33
7.10
720
602
49.8
46.8
0.51
0.75
7.17
8.28
251
195
221
154
51.0
0.27
7.06
1029
884
49.6
45.0
0.67
0.94
7.64
8.32
172
122
153
91
51.9
0.33
7.01
692
607
49.1
47.3
0.37
0.86
6.77
9.06
460
183
386
150
48.6
50.8
52.4
0.39
0.45
0.41
7.77
6.31
7.09
617
279
440
524
230
389
Continued…
Men
My line manager
encourages me at
work
Tend to agree/
Strongly agree
Neutral
Tend to disagree/
Strongly disagree
I get the help and
support I need from
colleagues at work
Tend to agree/
Strongly agree
Neutral
Tend to disagree/
Strongly disagree
In general, how do
you find your job
Not at all stressful/
Mildy stressful
Moderately stressful
Very stressful/
Extremely stressful
How satisfied with
balance between
time on paid work
and time on other
aspects of life
Below average (0-6)
Average (7)
Above average (8-10)
39
Table 1.5
- Continued
Aged 16 and over and in work
2009 and 2011 combined
WEMWBS
Mean Score
WEMWBS
SE
WEMWBS
Standard
Deviation
Weighted
Bases
Unweighted
Bases
I have unrealistic time
pressures at work
Always/Often
Sometimes
Seldom/Never
48.4
50.6
51.0
0.43
0.38
0.40
7.44
7.30
7.90
326
417
504
331
428
538
I have a choice in
deciding how I do
my work
Always/Often
Sometimes
Seldom/Never
51.3
48.1
48.6
0.30
0.43
0.59
7.55
6.96
8.07
771
273
202
801
284
212
50.9
0.29
7.35
811
833
48.9
47.8
0.55
0.65
7.62
8.32
197
167
208
171
50.8
0.25
7.43
985
1032
48.7
46.4
0.61
0.98
7.70
8.82
167
84
168
82
51.1
0.33
7.46
622
653
50.0
47.4
0.37
0.61
7.46
8.03
434
192
449
196
48.3
50.4
52.4
0.33
0.56
0.36
7.49
7.56
7.31
560
228
459
568
233
495
Continued…
Women
My line manager
encourages me at
work
Tend to agree/
Strongly agree
Neutral
Tend to disagree/
Strongly disagree
I get the help and
support I need from
colleagues at work
Tend to agree/
Strongly agree
Neutral
Tend to disagree/
Strongly disagree
In general, how do
you find your job
Not at all stressful/
Mildy stressful
Moderately stressful
Very stressful/
Extremely stressful
How satisfied with
balance between
time on paid work
and time on other
aspects of life
Below average (0-6)
Average (7)
Above average (8-10)
40
Table 1.5
- Continued
Aged 16 and over and in work
2009 and 2011 combined
WEMWBS
Mean Score
WEMWBS
SE
WEMWBS
Standard
Deviation
Weighted
Bases
Unweighted
Bases
I have unrealistic time
pressures at work
Always/Often
Sometimes
Seldom/Never
48.6
50.4
51.2
0.35
0.28
0.29
7.79
6.89
7.71
691
853
1038
625
786
1029
I have a choice in
deciding how I do
my work
Always/Often
Sometimes
Seldom/Never
51.3
48.6
48.3
0.22
0.36
0.49
7.33
7.05
8.29
1646
542
394
1566
508
366
50.9
0.23
7.23
1531
1435
49.4
47.3
0.38
0.51
7.38
8.30
448
362
429
325
50.9
0.20
7.25
2014
1916
49.1
45.6
0.45
0.67
7.67
8.54
339
205
321
173
51.5
0.24
7.23
1314
1260
49.6
47.4
0.26
0.52
7.12
8.54
894
375
835
346
48.4
50.6
52.4
0.26
0.34
0.29
7.64
6.89
7.20
1177
506
899
1092
463
884
All Adults
My line manager
encourages me at
work
Tend to agree/
Strongly agree
Neutral
Tend to disagree/
Strongly disagree
I get the help and
support I need from
colleagues at work
Tend to agree/
Strongly agree
Neutral
Tend to disagree/
Strongly disagree
In general, how do
you find your job
Not at all stressful/
Mildy stressful
Moderately stressful
Very stressful/
Extremely stressful
How satisfied with
balance between
time on paid work
and time on other
aspects of life
Below average (0-6)
Average (7)
Above average (8-10)
41
Table 1.6
Estimated odds ratios for below average WEMWBS mean scores,
2009/2011 combined, by associated risk factors and sex
Aged 16 and over
Independent variables
2009/2011 combined
a
Men
Women
Base Odds ratio
(weighted)
95% CI
b
1977
Age
16-44
45-64
65+
Marital Status
Married/civil partner
Living as married
Single
Separated/ Divorced/
Widowed
Highest educational
qualification
Degree or higher
HNC/D or equivalent
Higher grade or equivalent
Standard grade or
equivalent
Other school level
No qualifications
NS-SEC of household
reference person
Managerial/professional
Intermediate
Small employer/own
accounts workers
Lower
supervisory/technical
Semi-routine
Missing
Self-assessed general
health
Good/very good
Fair
Bad/Very bad
Long term conditions
Limiting longstanding
illness
Non-limiting longstanding
illness
None
Base Odds ratio
(weighted)
95% CI
b
2577
761
735
481
(p=0.006 )
1
0.95
0.53
1120
201
403
253
(p=0.018)
1.00
1.39
1.44
1.57
0.61, 1.49
0.30, 0.91
1036
952
569
(p<0.001)
1
0.84
0.48
0.61, 1.49
0.31, 0.91
0.77, 2.51
0.94, 2.20
0.99, 2.49
1330
251
431
545
(p=0.009 )
1.00
1.00
1.62
1.27
0.61, 1.66
1.12, 2.36
0.94, 1.74
(p=0.068 )
(p<0.001)
523
224
331
374
1
0.96
0.88
1.82
0.54, 1.71
0.52, 1.47
1.09, 3.05
699
249
344
507
1
1.48
1.07
1.37
0.88, 2.50
0.65, 1.74
0.91, 2.06
117
408
0.95
1.22
0.46, 1.96
0.72, 2.08
219
539
1.59
2.00
0.93, 2.72
1.26, 3.18
(p=0.005)
(p=0.296)
808
148
180
1
1.18
0.92
0.64, 2.16
0.47, 1.81
956
257
218
1
1.22
1.08
0.79, 1.89
0.64, 1.82
278
0.87
0.54, 1.41
289
1.31
0.88, 1.95
521
42
1.01
0.28
0.63, 1.60
0.11, 0.75
775
62
1.27
0.74
0.91, 1.77
0.33, 1.67
(p<0.001)
1464
357
156
(p<0.001)
1
2.73 1.77, 4.21
6.03 3.49, 10.40
1935
418
204
1
2.13
5.18
787
(p=0.005 )
1
0.49
559
(p=0.231)
1
310
0.34
0.18, 0.64
398
1108
0.69
0.45, 1.06
1372
42
1.53, 2.96
3.37, 7.97
0.31, 0.75
0.58 0.41, 0.80
Continued…
Table 1.6 - Continued
Aged 16 and over
2009/2011 combined
Independent variablesa
Men
Base Odds ratio
(weighted)
c
Physical activity levels
High
Medium
Low
Discriminated against or
unfairly treated in last 12
months
No
Yes
Number of people can
turn to in a crisis
0-3
4-5
6
7-10
11 or more
95% CIb
1977
805
554
618
Women
Base Odds ratio
(weighted)
2577
(p=0.023 )
1
1.10
1.61
0.71, 1.70
1.05, 2.47
806
893
858
(p<0.001)
1757
220
1
2.02
1
0.64
0.63
0.49
0.66
(p=0.075)
1
0.99
1.33
0.72, 1.38
0.94, 1.87
(p=0.004)
1.33, 3.07
2276
281
(p=0.013 )
464
411
359
408
335
95% CIb
1
1.68
1.18, 2.39
(p<0.001)
0.41, 0.98
0.38, 1.04
0.30, 0.81
0.40, 1.10
470
555
458
618
456
1
0.56
0.42
0.46
0.25
0.40, 0.78
0.29, 0.62
0.32, 0.66
0.16, 0.40
Involvement in local
(p<0.001)
(p<0.001)
community
A great deal/fair amount
534
1
797
1
Not very much
952
0.98 0.63, 1.53
1187
1.35 0.97, 1.89
Not at all
491
2.08 1.31, 3.28
573
1.86 1.31, 2.66
a Binary variable: 0= average or above average WEMWBS score and 1=at least 1 SD below average
WEMWBS score.
b Confidence intervals.
c High= 30 minutes or more on at least 5 days a week (this group represents those who meet the
current physical activity recommendations); Medium= 30 minutes or more on 1 to 4 days a week;
Low= fewer than 30 minutes of moderate or vigorous activity a week.
43
Table 1.7
CIS-R anxiety and depression symptom scores, attempted suicide and
deliberate self-harm, 2008/2009 combined, 2010/2011 combined, by age
and sex
Aged 16 and over with a nurse visit
Mental health problem
2008/2009 combined, 2010/2011 combined
Age
Total
16-24
25-34
35-44
45-54
55-64
65-74
75+
%
%
%
%
%
%
%
%
Depression symptom
score
2008/2009
0
1
a
2 or more symptoms
97
3
-
92
2
5
88
4
8
86
5
10
87
4
9
87
5
7
87
5
8
89
4
7
2010/2011
0
1
2 or more symptomsa
87
7
7
82
14
4
86
10
4
78
15
7
83
11
5
86
9
4
91
6
3
84
11
5
Anxiety symptom score
2008/2009
0
1
2 or more symptomsb
93
6
1
87
8
6
83
8
9
87
4
10
87
7
6
88
6
6
88
2
9
87
6
7
2010/2011
0
1
b
2 or more symptoms
86
5
9
85
7
8
88
5
8
83
8
9
89
4
7
93
1
7
96
3
1
87
5
8
Attempted suicide
2008/2009
No
Yes
99
1
99
1
94
6
97
3
95
5
98
2
98
2
97
3
2010/2011
No
Yes
96
4
95
5
95
5
96
4
97
3
99
1
100
-
96
4
Deliberate self-harm
2008/2009
No
Yes
99
1
99
1
95
5
99
1
99
1
99
1
100
-
98
2
2010/2011
No
Yes
95
5
100
-
96
4
99
1
99
1
100
-
Men
44
100
98
2
Continued…
Table 1.7
- Continued
Aged 16 and over with a nurse visit
Mental health problem
2008/2009 combined, 2010/2011 combined
Age
Total
16-24
25-34
35-44
45-54
55-64
65-74
75+
%
%
%
%
%
%
%
%
Depression symptom
score
2008/2009
0
1
a
2 or more symptoms
85
6
8
80
8
12
85
4
11
82
6
12
78
9
12
91
4
5
85
6
9
84
6
10
2010/2011
0
1
2 or more symptomsa
83
11
6
78
13
9
73
14
13
79
11
10
81
14
5
80
15
6
85
10
5
79
13
8
Anxiety symptom score
2008/2009
0
1
2 or more symptomsb
76
16
8
80
11
9
74
14
12
77
10
12
79
6
15
85
10
5
81
9
10
78
11
11
2010/2011
0
1
2 or more symptomsb
89
6
5
70
15
14
78
8
14
77
9
15
84
9
7
88
6
6
86
7
7
81
9
10
Attempted suicide
2008/2009
No
Yes
93
7
91
9
92
8
96
4
94
6
98
2
97
3
94
6
2010/2011
No
Yes
95
5
94
6
89
11
93
7
94
6
99
1
99
1
94
6
Deliberate self-harm
2008/2009
No
Yes
93
7
93
7
94
6
97
3
99
1
100
0
100
-
96
4
2010/2011
No
Yes
94
6
96
4
94
6
99
1
98
2
99
1
Women
45
100
97
3
Continued…
Table 1.7
- Continued
Aged 16 and over with a nurse visit
Mental health problem
2008/2009 combined, 2010/2011 combined
Age
Total
16-24
25-34
35-44
45-54
55-64
65-74
75+
%
%
%
%
%
%
%
%
Depression symptom
scorec
2008/2009
0
1
2 or more symptomsa
91
5
4
86
5
9
86
4
10
84
5
11
83
7
10
89
5
6
86
5
9
86
5
8
2010/2011
0
1
a
2 or more symptoms
85
9
6
80
13
7
79
12
9
78
13
8
82
13
5
83
12
5
87
9
4
82
12
7
85
11
4
83
10
7
78
11
11
82
7
11
83
7
10
86
8
6
84
7
10
83
9
9
2010/2011
0
1
2 or more symptomsb
87
6
7
77
11
11
83
6
11
80
8
12
86
7
7
90
3
6
90
6
5
84
7
9
Attempted suicide
2008/2009
No
Yes
96
4
95
5
93
7
96
4
94
6
98
2
97
3
96
4
2010/2011
No
Yes
96
4
95
5
92
8
94
6
95
5
99
1
100
0
95
5
Deliberate self-harm
2008/2009
No
Yes
96
4
96
4
95
5
98
2
99
1
99
1
100
-
97
3
2010/2011
No
Yes
94
6
98
2
95
5
99
1
99
1
100
0
All adults
Anxiety symptom score
2008/2009
0
1
2 or more symptomsb
d
46
100
98
2
Continued…
Table 1.7
- Continued
Aged 16 and over with a nurse visit
Mental health problem
2008/2009 combined, 2010/2011 combined
Age
16-24
Total
25-34
35-44
45-54
55-64
65-74
75+
Bases (weighted):
Men 2008/2009
160
168
191
193
165
113
76
1066
Men 2010/2011
144
158
163
177
153
106
72
972
Women 2008/2009
150
167
206
205
175
131
121
1154
Women 2010/2011
138
158
178
192
161
120
111
1059
All adults 2008/2009
310
334
397
398
340
244
197
2220
All adults 2010/2011
282
316
341
369
314
226
183
2031
Bases (unweighted):
Men 2008/2009
64
103
164
173
198
171
101
974
Men 2010/2011
69
97
140
171
166
139
93
875
Women 2008/2009
101
146
233
210
245
186
125
1246
Women 2010/2011
87
151
188
249
195
156
129
1155
All adults 2008/2009
165
249
397
383
443
357
226
2220
All adults 2010/2011
156
248
328
420
361
295
222
2030
a Two or more symptoms indicate depression of moderate to high severity.
b Two or more symptoms indicate anxiety of moderate to high severity.
c Percentage of adults with a score of 2+ on depression section of CIS-R is part of the national mental
health indicator set for adults.
d Percentage of adults with a score of 2+ on anxiety section of CIS-R is part of the national mental
health indicator set for adults.
47
Dental Health
Chapter 2
2 DENTAL HEALTH
Lisa Rutherford
SUMMARY
In 2011, 90% of all adults aged 16 and over had some natural teeth (91% of
men and 89% of women).
Between 1995 and 2003 the percentage of men aged 16-64 with all false teeth
fell from 9% to 5% (the corresponding figures for women were 13% and 7%).
Since 2008, the proportion reporting no natural teeth has remained stable (34% of men and 4-5% of women).
There was a strong association between area deprivation and prevalence of
natural teeth. Those living in the most deprived SIMD quintile were the least
likely to have some natural teeth (83% compared with 94% of those in the
least deprived quintile).
Similarly, men and women living in the 15% most deprived areas of Scotland
were more likely than those living elsewhere to have no natural teeth (18%
compared with 10%).
Almost all (96%) adults with teeth said they brush them daily with fluoride
toothpaste.
Four in ten adults reported using a mouth-wash daily, though women were
more likely than men to do this (45% compared with 36%).
A quarter (26%) of adults with teeth said they used dental floss daily, with
women twice as likely as men to report doing so (33% versus 17%).
One in five (22%) of people said they restrict their sugar intake to improve their
dental health. 16-24 year olds and those aged 75 and over were least likely to
say that they took this action daily.
2.1
INTRODUCTION
To address Scotland’s poor oral health record and increase access to dental
health services, the then Scottish Executive published An Action Plan for
Improving Oral Health and Modernising NHS Dental Services in Scotland 1 in
2005. This laid out a series of national dental health and dental service targets,
including the aim that by 2010 90% of all adults in Scotland, and 65% of adults
aged between 55 and 74 years, would possess some natural teeth. The dental
health chapter in the 2008 Scottish Health Survey (SHeS) report2 noted that the
separate target for adults in the 55-74 age group had already been met.
The introductions to the three previous dental health chapters in the 2008,
2009, and 2010 (SHeS) reports2,3,4 outlined the recent policy context in this
area, much of which focuses on improving children’s oral health, especially
among those in the most deprived areas. The key initiatives highlighted were:
The opening of a new dental school in Aberdeen in 2008, and steps to
attract more dentists to work in Scotland.
Two NHS HEAT targets5 relating to child dental health (one on NHS
dentist registration rates for 3-5 year olds by 2010/11, and one on
fluoride varnish applications for 3-4 year olds by March 2014).
49
The Childsmile national oral health improvement programme for children
in Scotland.
The introduction of free dental checks for adults.
The HEAT target for 80% of 3-5 year old children to be registered with an NHS
dentist by 2010/11 was surpassed (88% were registered).6 The annual report
from NHS Scotland’s Chief Executive also highlighted a number of recent
developments in the field of dental health.7 For example, the expansion of rural
dental services through the opening of new premises in Stornoway (Isle of
Lewis) which provides services to patients as well as training for student
dentists and uses IT links to larger practices to support this. There are now 17
dental outreach centres where senior student dentists can gain experience of
working in a primary care setting. These deliver treatment to patients in rural
areas and other places with a high demand for such services, many of whom
are not registered with a dentist.
The origins of poor adult oral health often lie in childhood, hence the focus on
children’s teeth outlined above. A target for 60% of primary 1 children to be free
of dental decay by 2010 was achieved nationally, and locally in 12 health board
areas. However, stark differences by area deprivation persist: 45% of primary 1
children in the 10% most deprived areas had no decay compared with 82% in
the 10% least deprived areas.
This chapter provides the 2011 figures for the reported prevalence of natural
teeth in adults. Reflecting the concerns noted above about inequalities in oral
health, the prevalence of natural teeth is also shown by the Scottish Index of
Multiple Deprivation (SIMD). The chapter then reports details of steps adults
say they take to improve their oral health. There was not space to cover all
aspects of dental health within this chapter so supplementary web tables are
being published at the same time as this report.
2.2
METHODS AND DEFINITIONS OF MEASUREMENT
In 1995, 1998 and 2003 SHeS included similar questions about the number of
natural teeth people have, but there has been a notable change to the wording
that affects the data presented here. The three surveys conducted prior to 2008
asked participants whether they had their own teeth. From 2008 onwards
people were asked how many natural teeth they had. Consequently, it is only
possible to compare the people in 1995-2003 who said they had all false teeth
with the proportion from 2008 onwards who said they had no natural teeth. In
addition, the definition of false teeth used in 1995 was not the same as in 1998
and 2003. In 1998 and 2003 participants were asked to count caps and crowns
as natural teeth but there was no such instruction in 1995. Although the
question format from 2008 onwards is very different, it attempts to measure the
same underlying concept (having no teeth) and might therefore be functionally
equivalent. However, as there is no way of quantifying this, the comparison over
time between 1995-2003 and 2008 onwards needs to be treated with caution.
The dental health chapters in the 2008 2 and 20093 SHeS reports outlined the
full range of adult dental health questions included in the survey. Questions
50
focusing on dental health are asked every year while questions about dental
services, and actions to improve oral health, were only asked in 2009 and 2011.
DENTAL HEALTH
2.3.1
Trends in prevalence of natural teeth since 1995, by age and sex
Figures for the prevalence of natural teeth are presented in Figure 2A
and Table 2.1 for 1995 onwards. Changes to the sample composition in
the first three surveys mean that the discussion of 1995-2011 figures
presented here is based only on those aged 16 to 64. Figures from
2003 onwards, based on adults aged 16 and over, are also presented in
Table 2.1.
As noted in the previous section, some of the data reported here are
based on previous survey years when the questions about natural teeth
were slightly different. Table 2.1 and Figure 2A present the proportion of
adults aged 16-64 with all false teeth in 1995, 1998 and 2003, and the
proportion with no natural teeth from 2008 onwards. The results for the
last four years have been very similar, with just 3%-4% of men and 4%5% of women aged 16-64 reporting that they had no natural teeth.
Figure 2A, Table 2.1
Figure 2A
1995-2003: proportion with all false teeth (aged 16-64)
2008-2011: proportion with no natural teeth (aged 16-64)
Men
Women
14
12
10
Percent
2.3
8
6
4
2
0
1995
1998
2003
2008 2009 2010 2011
Survey year
The 2005 Action Plan target was that by 2010 90% of all adults in
Scotland, and 65% of adults aged 55-74, would possess some natural
teeth.1 The 20104 SHeS report noted that the proportion of all adults
possessing some natural teeth was just short of the target in 2010
(89%). As shown in Table 2.1, the target was met in 2011 with 90% of
all adults reporting some natural teeth. The figure for men remained
unchanged from 2010 (91%), and the proportion for women increased
by one percentage point (from 88% to 89%).
51
The target for 65% of adults aged 55-74 to possess some natural teeth
by 2010 was comfortably met by 2008 (78%). The increase to 81% in
2011 (82% of men and 80% of women), was largely driven by an
increase in prevalence among women of this age (from 75% in 2008 to
80% in 2011) (data not shown).
Table 2.1
2.3.2
Number of natural teeth and % with no natural teeth, 2008-11, (agestandardised) by Scottish Index of Multiple Deprivation (SIMD)
Two measures of SIMD are being used throughout this report. The first
– which uses quintiles – enables comparisons to be drawn between the
most and least deprived 20% of areas and the three intermediate
quintiles. The second contrasts the most deprived 15% of areas with
the 85% least deprived. The Scottish Health Survey was designed to
provide robust data for the SIMD 15% areas after four years of data had
been collected and combined (2008-2011). The figures discussed
below are based on these combined data. To ensure that the
comparisons presented by SIMD are not confounded by the different
age profiles of the sub-groups, the data have been age-standardised
(age-standardisation is described in the Glossary). On the whole, the
differences between observed and age-standardised percentages are
small. Therefore, the percentages and means presented are the
standardised ones only.
As Figure 2B illustrates, there was a significant association between
area deprivation (measured in quintiles) and the number of teeth people
had. The proportion of adults with some natural teeth declined from
94% in the least deprived quintile to 83% in the most deprived, while
there was a threefold increase (from 6% to 17%) in the proportion with
no teeth at all between the least and most deprived.
The decrease in prevalence of any natural teeth by increasing
deprivation followed a linear pattern for both sexes, although was
slightly more pronounced for women. 94% of women and 95% of men
in the least deprived quintile had some natural teeth compared with
80% and 86%, respectively, in the most deprived quintile.
This pattern was also evident when prevalence among those living in
the 15% most deprived areas of Scotland was compared with those
living elsewhere. 15% of men and 20% of women in the 15% most
deprived areas had no natural teeth compared with 8% and 12%,
respectively, living in the rest of Scotland.
Figure 2B, Table 2.2
52
Figure 2B
Number of natural teeth (age-standardised), by SIMD quintile,
2008-2011 combined
No teeth
10-19
<10
20 or more
100
90
80
Percent
70
60
50
40
30
20
10
0
5th (least
deprived)
4th
3rd
2nd
1st (most
deprived)
SIMD quintile
2.3.3
Actions taken to improve dental health
This section reports various actions people said they took daily to
improve their dental health and is based on data collected in 2011. The
figures presented in Table 2.3 are based on all adults with some natural
teeth. Note that this includes some people who have a combination of
natural teeth and dentures.
Not surprisingly, brushing teeth with fluoride toothpaste was the most
common action mentioned, with almost all (96%) adults with some
natural teeth doing this daily. The next most common action reported
was using a mouth rinse, but this lagged some way behind fluoride
toothpaste use with four in ten adults with teeth doing this. Even fewer
(26%), said they used dental floss daily, while 22% said they restricted
their intake of sugary foods and drinks. Only 2% said they did not take
any of the daily actions listed.
Men and women were equally likely to brush their teeth with fluoride
toothpaste daily (95% and 97%, respectively), and similar proportions
also reported restricting their intake of sugary foods (20% and 24%,
respectively). In contrast, women were twice as likely as men to report
using dental floss every day (33% compared with 17%) and were also
more likely to use mouth rinse (45% compared with 36%).
There were some notable differences across the age groups for some
of the actions. For example, use of mouth rinse was highest among
those aged 25-34 (49%) and declined with age thereafter to 26% for
those aged 75 and over. Adults in the youngest and oldest age groups
were the least likely to report restricting their sugar intake (12%).
Actions to care for dentures increased sharply with age, as would be
expected given their low use among younger people.
Table 2.3
53
References and Notes
1
Action plan for improving oral health and modernising NHS dental services in Scotland.
Edinburgh: Scottish Executive, 2005. [online] Available
from:<www.scotland.gov.uk/Resource/Doc/37428/0012526.pdf
2
Miller, M. (2009). Chapter 2: Dental Health. In Bromley, C., Bradshaw, P. and Given, L. [eds.]
The 2008 Scottish Health Survey – Volume 1: Main Report. Edinburgh, Scottish Government.
www.scotland.gov.uk/Publications/2009/09/28102003/0
3
Dobbie, F. (2010). Chapter 2: Dental Health. In Bromley, C., Bradshaw, P. and Given, L. [eds.]
The 2009 Scottish Health Survey – Volume 1: Main Report. Edinburgh, Scottish Government.
www.scotland.gov.uk/Publications/2010/09/23154223/0
4
Given, L. (2011). Chapter 2: Dental Health. In Bromley, C. and Given, L. [eds.] The 2010
Scottish Health Survey – Volume 1: Main Report. Edinburgh, Scottish Government.
www.scotland.gov.uk/Publications/2011/09/27084018/17
5
The 2007 Better Health, Better Care action plan for improving health and health care in
Scotland set out how NHS Scotland’s HEAT performance management system (based around
a series of targets against which the performance of its individual Boards are measured) would
feed into the Government’s overarching objectives. The HEAT targets derive their name from
the four strands in the performance framework: the Health of the population; Efficiency and
productivity, resources and workforce; Access to services and waiting times; and Treatment and
quality of services.
6
NHSScotland HEAT Targets due for delivery in 2010/11 – Summary of performance. (2012).
NHSScotland Performance and Business management. Available from:
www.scotland.gov.uk/About/scotPerforms/partnerstories/NHSScotlandperformance/HT201011
7
NHSScotland Chief Executive’s Annual Report 2010/11. (2011). Edinburgh: Scottish
Government. Available from: <www.scotland.gov.uk/Publications/2011/11/10140644/15>
54
Table list
Table 2.1
Table 2.2
Table 2.3
Number of natural teeth, and % with no natural teeth, 1995, 1998, 2003, 2008,
2009, 2010, 2011, by age and sex
Number of natural teeth, and % with no natural teeth, 2008-2011 combined
(age standardised), by Scottish Index of Multiple Deprivation and sex
Daily actions taken by people with some natural teeth to improve dental
health, 2011, by age and sex
55
Table 2.1
Number of natural teeth, and % with no natural teeth, 1995, 1998, 2003,
2008, 2009, 2010, 2011, by age and sex
Aged 16 and over
1995, 1998, 2003, 2008, 2009, 2010, 2011
False teeth/number Age
of natural teeth
Total
16+
16-24
25-34
35-44
45-54
55-64
65-74
75+
Total
16-64
%
%
%
%
%
%
%
%
%
1995
All own teeth
All false teeth
92
0
83
2
70
5
54
13
36
34
n/a
n/a
n/a
n/a
69
9
n/a
n/a
1998
All own teeth
All false teeth
95
0
86
1
76
5
60
12
41
29
25
46
n/a
n/a
73
8
n/a
n/a
2003
All own teeth
All false teeth
98
0
90
1
79
2
65
8
50
18
30
34
17
53
76
5
67
12
2008
No natural teeth
Fewer than 10
Between 10 and 19
20 or more
0
0
1
98
0
1
3
96
1
2
10
86
4
5
14
77
13
11
24
52
29
15
21
36
43
15
25
17
4
4
11
82
9
6
13
72
100
100
99
96
87
71
57
96
91
0
0
1
99
2
0
5
93
2
2
8
88
6
5
15
74
12
10
23
55
24
20
20
36
45
12
22
21
4
3
11
82
9
6
12
72
All with teeth
100
98
98
94
88
76
55
96
90
2010
No natural teeth
Fewer than 10
Between 10 and 19
20 or more
0
100
1
0
2
97
2
2
10
86
4
4
17
75
13
8
25
53
25
15
22
38
44
16
20
21
4
3
11
82
9
5
13
73
All with teeth
100
99
98
96
86
75
57
96
91
1
99
0
1
4
95
1
2
8
90
5
4
16
75
10
10
24
56
29
12
23
37
40
17
21
22
3
3
11
83
9
5
13
73
100
100
100
95
90
72
60
Men
All with teeth
2009
No natural teeth
Fewer than 10
Between 10 and 19
20 or more
2011
No natural teeth
Fewer than 10
Between 10 and 19
20 or more
All with teeth
56
97
91
Continued…
Table 2.1
- Continued
Aged 16 and over
1995, 1998, 2003, 2008, 2009, 2010, 2011
False teeth/number Age
of natural teeth
Total
16+
16-24
25-34
35-44
45-54
55-64
65-74
75+
Total
16-64
%
%
%
%
%
%
%
%
%
1995
All own teeth
All false teeth
96
0
85
2
71
5
45
20
26
45
n/a
n/a
n/a
n/a
66
13
n/a
n/a
1998
All own teeth
All false teeth
98
0
91
1
77
4
49
17
29
39
15
61
n/a
n/a
70
11
n/a
n/a
2003
All own teeth
All false teeth
98
0
90
0
80
3
67
9
38
26
20
51
14
61
75
7
62
18
2008
No natural teeth
Fewer than 10
Between 10 and 19
20 or more
0
0
1
99
1
1
2
96
2
1
8
89
6
4
12
79
17
9
21
53
36
12
23
29
57
12
15
17
5
3
9
83
14
5
11
70
100
99
98
94
83
64
43
95
86
0
2
98
1
0
3
96
2
2
8
88
6
3
16
76
16
7
20
56
38
11
21
30
56
8
17
19
5
3
10
82
14
4
12
70
100
99
98
95
83
62
44
95
86
0
1
99
0
1
99
1
1
6
92
4
4
12
80
19
8
20
54
32
13
19
36
54
11
18
17
5
3
8
84
13
5
11
72
100
100
99
96
82
68
46
95
88
2011
No natural teeth
Fewer than 10
Between 10 and 19
20 or more
0
1
98
1
1
2
96
1
1
4
93
4
4
13
80
13
9
20
58
28
10
25
36
46
18
15
21
4
3
8
85
11
6
11
72
All with teeth
99
99
98
97
87
71
54
Women
All with teeth
2009
No natural teeth
Fewer than 10
Between 10 and 19
20 or more
All with teeth
2010
No natural teeth
Fewer than 10
Between 10 and 19
20 or more
All with teeth
57
96
89
Continued…
Table 2.1
- Continued
Aged 16 and over
1995, 1998, 2003, 2008, 2009, 2010, 2011
False teeth/number Age
of natural teeth
Total
16+
16-24
25-34
35-44
45-54
55-64
65-74
75+
Total
16-64
%
%
%
%
%
%
%
%
%
1995
All own teeth
All false teeth
94
0
84
2
70
5
49
17
31
40
n/a
n/a
n/a
n/a
68
11
n/a
n/a
1998
All own teeth
All false teeth
97
0
88
1
77
4
55
15
35
34
19
54
n/a
n/a
72
9
n/a
n/a
2003
All own teeth
All false teeth
98
0
90
1
79
3
66
8
44
22
25
43
15
58
75
6
64
15
2008
No natural teeth
Fewer than 10
Between 10 and 19
20 or more
0
1
99
1
1
3
96
2
2
9
88
5
4
13
78
15
10
23
52
33
13
22
32
51
13
19
17
4
4
11
82
12
5
12
71
100
99
98
95
85
67
49
96
88
2009
No natural teeth
Fewer than 10
Between 10 and 19
20 or more
0
0
1
98
1
0
4
95
2
2
8
88
6
4
15
75
14
8
22
56
32
15
21
33
51
10
19
20
5
3
10
82
12
5
12
71
All with teeth
99
99
98
94
86
69
49
95
88
2010
No natural teeth
Fewer than 10
Between 10 and 19
20 or more
0
1
99
0
0
2
98
2
2
8
89
4
4
14
77
16
8
23
53
29
14
20
37
50
13
19
19
4
3
10
83
11
5
12
72
100
100
99
95
84
71
51
96
89
0
1
99
1
1
3
95
1
1
6
92
4
4
15
78
12
10
22
57
28
11
24
36
43
18
17
21
3
3
10
84
10
5
12
73
100
99
99
97
89
71
56
All adults
All with teeth
All with teeth
2011
No natural teeth
Fewer than 10
Between 10 and 19
20 or more
All with teeth
58
97
90
Continued…
Table 2.1
- Continued
Aged 16 and over
1995, 1998, 2003, 2008, 2009, 2010, 2011
False teeth/number Age
of natural teeth
Bases (weighted):
Men 1995
Men 1998
Men 2003
Men 2008
Men 2009
Men 2010
Men 2011
Women 1995
Women 1998
Women 2003
Women 2008
Women 2009
Women 2010
Women 2011
All adults 1995
All adults 1998
All adults 2003
All adults 2008
All adults 2009
All adults 2010
All adults 2011
Bases (unweighted):
Men 1995
Men 1998
Men 2003
Men 2008
Men 2009
Men 2010
Men 2011
Women 1995
Women 1998
Women 2003
Women 2008
Women 2009
Women 2010
Women 2011
All adults 1995
All adults 1998
All adults 2003
All adults 2008
All adults 2009
All adults 2010
All adults 2011
Total
16+
16-24
25-34
35-44
45-54
55-64
65-74
75+
Total
16-64
723
708
576
461
536
510
532
695
677
566
441
510
494
513
1418
1384
1142
902
1046
1004
1045
979
953
601
479
565
559
581
990
940
655
487
569
555
580
1969
1894
1256
966
1134
1114
1161
851
903
759
563
631
583
613
870
913
808
616
693
641
671
1721
1816
1567
1179
1324
1224
1284
749
779
666
554
648
631
653
777
798
689
586
699
678
708
1527
1577
1355
1140
1347
1309
1361
600
607
567
480
561
541
564
665
661
601
502
590
570
591
1265
1268
1168
981
1151
1111
1155
n/a
469
405
327
386
374
389
n/a
584
491
382
450
431
448
n/a
1053
896
709
836
805
837
n/a
n/a
259
218
259
252
266
n/a
n/a
467
348
407
393
413
n/a
n/a
726
566
666
646
679
3902
3950
3169
2537
2940
2824
2944
3998
3989
3318
2632
3060
2938
3063
7900
7939
6487
5169
6001
5762
6007
n/a
n/a
3833
3083
3585
3450
3598
n/a
n/a
4276
3362
3917
3762
3924
n/a
n/a
8109
6445
7502
7212
7522
475
399
334
244
271
272
306
547
528
403
331
382
373
363
1022
927
737
575
653
645
669
840
763
449
316
404
420
398
1160
972
597
451
579
564
562
2000
1735
1046
767
983
984
960
811
826
730
460
548
475
516
992
1008
882
648
778
678
710
1803
1834
1612
1108
1326
1153
1226
709
693
611
534
601
566
596
825
896
793
627
732
759
802
1534
1589
1404
1161
1333
1325
1398
689
683
632
524
574
554
600
884
808
776
630
735
699
735
1573
1491
1408
1154
1309
1253
1335
n/a
572
508
453
516
488
510
n/a
889
579
513
550
573
594
n/a
1461
1087
966
1066
1061
1104
n/a
n/a
325
304
362
329
344
n/a
n/a
492
408
478
468
486
n/a
n/a
817
712
840
797
830
3524
3364
2756
2078
2398
2287
2416
4408
4212
3451
2687
3206
3073
3172
7932
7576
6207
4765
5604
5360
5588
n/a
n/a
3589
2835
3276
3104
3270
n/a
n/a
4522
3608
4234
4114
4252
n/a
n/a
8111
6443
7510
7218
7522
59
Table 2.2
Number of natural teeth, and % with no natural teeth, 2008-2011
combined (age-standardised), by Scottish Index of Multiple Deprivation
and sex
Aged 16 and over
False teeth/number of
natural teeth
2008-2011 combined
Scottish Index of Multiple Deprivation quintile
5th
(least
deprived)
SIMD 85/15
nd
1st
(most
deprived)
%
%
%
%
%
8
4
12
76
9
6
13
72
11
6
14
69
14
8
16
62
8
5
12
75
15
8
17
60
95
92
91
89
86
92
85
No natural teeth
Fewer than 10
Between 10 and 19
20 or more
6
3
9
81
10
4
10
75
14
4
11
71
15
6
12
66
20
6
14
60
12
5
11
73
20
6
14
59
All with teeth
94
90
86
85
80
88
80
No natural teeth
Fewer than 10
Between 10 and 19
20 or more
6
4
9
81
9
4
11
76
12
5
12
72
13
6
13
68
17
7
15
61
10
5
11
74
18
7
15
60
All with teeth
94
91
88
87
83
90
82
2726
2936
5661
2998
3090
6088
2700
2938
5638
2684
2995
5678
2618
3002
5620
11749
12735
24484
1977
2225
4201
2230
2838
5068
2877
3591
6468
2675
3413
6088
2352
3117
5469
2352
3250
5602
10671
13718
24389
1815
2491
4306
th
rd
4
3
%
%
No natural teeth
Fewer than 10
Between 10 and 19
20 or more
5
4
9
82
All with teeth
Men
Women
All adults
Bases (weighted):
Men
Women
All adults
Bases (unweighted):
Men
Women
All adults
60
2
85%
15%
least
most
deprived deprived
Table 2.3
Daily actions taken by people with some natural teeth to improve dental
health, 2011, by age and sex
a
Aged 16 and over with some natural teeth
2011
Daily actions taken
Total
Men
Brush teeth with fluoride
toothpaste
Use dental floss
Use mouth rinse
Restrict intake of sugary foods
and drinks
Clean dentures (including
soaking with a sterilising
tablet)
Leave dentures out at night
None of these
Mean number of actions
SE of the mean
Women
Brush teeth with fluoride
toothpaste
Use dental floss
Use mouth rinse
Restrict intake of sugary foods
and drinks
Clean dentures (including
soaking with a sterilising
tablet)
Leave dentures out at night
None of these
Mean number of actions
SE of the mean
All Adults
Brush teeth with fluoride
toothpaste
Use dental floss
Use mouth rinse
Restrict intake of sugary foods
and drinks
Clean dentures (including
soaking with a sterilising
tablet)
Leave dentures out at night
None of these
Mean number of actions
SE of the mean
Age
16-24
25-34
35-44
45-54
55-64
65-74
75+
%
%
%
%
%
%
%
%
94
98
97
93
94
90
91
95
13
32
10
24
45
25
18
47
25
18
29
25
15
34
18
23
26
14
6
23
13
17
36
20
-
-
3
8
19
22
30
8
4
1
1
2
4
5
10
3
12
5
25
3
5
3
1.5
0.08
1.9
0.08
1.9
0.08
1.8
0.08
1.9
0.09
1.9
0.10
1.9
0.15
1.8
0.04
95
99
98
99
97
97
95
97
24
48
15
33
54
26
34
39
30
39
49
28
37
43
24
38
36
22
20
28
11
33
45
24
1
-
4
8
21
26
40
10
1
1
1
-
2
0
7
0
11
-
20
-
23
1
7
0
1.8
0.08
2.1
0.06
2.1
0.06
2.3
0.06
2.3
0.07
2.4
0.10
2.2
0.12
2.2
0.03
95
98
97
96
95
94
93
96
19
40
12
29
49
25
26
43
28
29
40
27
26
39
21
31
31
18
14
26
12
26
40
22
0
-
3
8
20
24
36
9
0
3
1
0
2
1
5
2
10
1
16
2
24
2
6
2
1.7
0.06
2.0
0.06
2.0
0.05
2.0
0.06
2.1
0.06
2.1
0.07
61
2.0
2.0
0.10
0.03
Continued…
Table 2.3
- Continued
Aged 16 and over with some natural teeth
2011
Daily actions taken
Total
Age
16-24
25-34
35-44
45-54
55-64
65-74
Bases (weighted):
Men
171
195
192
201
169
Women
166
190
209
226
162
All adults
338
385
401
427
332
Bases (unweighted):
Men
99
122
171
186
187
Women
120
169
218
256
212
All adults
219
291
389
442
399
a This category includes some people who have both dentures and natural teeth.
62
75+
85
95
180
56
72
129
1071
1120
2191
108
120
228
70
78
148
943
1173
2116
Alcohol Consumption
Chapter 3
3 ALCOHOL CONSUMPTION
Clare Sharp
SUMMARY
Weekly mean alcohol consumption in 2011 was 15.0 units for men and 7.4
units for women.
Between 2003 and 2011 mean weekly alcohol consumption among adults
aged 16 and over declined from 14.1 units to 11.1 units. For men, the mean
units consumed per week fell from 19.8 units to 15.0 units in this period. The
figures for women were 9.0 units in 2003 and 7.4 units in 2011.
A quarter of men (25%) and just under a fifth of women (18%) were
categorized as hazardous or harmful drinkers (men drinking more than 21
units per week and women drinking more than 14) in 2011.
As with mean weekly alcohol consumption, the proportion of adults drinking in
excess of recommended weekly limits also declined between 2003 and 2011
from 28% to 21% (from 33% to 25% for men and from 23% to 18% of women).
Harmful/hazardous drinking was most common among those in living in higher
income households and those living in less deprived areas. These
associations with income and deprivation were stronger for women than for
men. Women in the highest household income group were twice as likely as
those living in the lowest income households to be harmful/hazardous drinkers
(27% compared with 14%)
Hazardous/harmful drinkers in low income households consumed more units
of alcohol per week than those in higher income households. For example,
male hazardous/harmful drinkers in the lowest income group consumed 61.6
units per week compared with the 38.6 to 44.3 consumed by those in the other
income groups. Similarly, hazardous/harmful drinkers in areas of greater
deprivation consumed more units per week than those living elsewhere.
In terms of daily alcohol consumption in 2011, on their heaviest drinking day in
the last week men drank an average of 5.5 units and women 3.2 units (the
figure for all adults was 4.3 units).
On their heaviest drinking day, 41% of men and 34% of women (37% of all
adults) drank more than the recommended daily amount (no more than 4 units
for men and 3 units for women). One in five adults drank more than twice the
recommended daily amount (25% of men and 17% of women).
Between 2003 and 2011 the proportion of men exceeding the recommended
daily limits fell from 45% to 41%. For women there was a decline from 37% in
2003 to 33% in 2011.
The proportion of people drinking more than twice the daily recommended
units on their heaviest drinking day declined slightly between 2003 and 2011
(from 29% to 25% for men and from 19% to 17% for women).
There was a drop in the proportion of adults drinking outwith the
recommended government guidelines (weekly and/or daily), from 47% in 2003
to 42% in 2011. The decline was steeper for men than for women (from 53%
to 46% compared with 42% to 38% for women) and was greatest among men
aged under 45 and women aged 25-34.
On average in 2011, men drank alcohol on 2.8 days in the last week and
women drank on 2.5 days. One in ten adults (13% of men and 10% of women)
drank on more than five days in the last week.
64
The mean number of days on which adults drank in the previous week
declined from 3.0 to 2.7 between 2003 and 2011 (among men, it fell from 3.3
to 2.8 days; for women it fell from 2.7 to 2.5 days). Over this same period there
was also a decline in the proportion of adults who drank on more than five
days in the last week from 17% to 12%.
There was a strong association between the number of days on which alcohol
was consumed in the last week and both household income and area
deprivation level. As household income fell and area deprivation increased
both the mean number of days drank in the previous week and the proportion
drinking on more than five days in the last week decreased.
3.1
INTRODUCTION
Misuse of alcohol contributes to a wide range of health problems, including high
blood pressure, chronic liver disease and cirrhosis, pancreatitis, some cancers,
mental ill-health, and accidents, as well as social problems such as antisocial
behaviour and violent crime. A report published in 2009 attributed 5% of deaths
in Scotland to alcohol,1 while the annual costs of excessive alcohol
consumption are estimated to be £3.6 billion.2 Alcohol-related morbidity and
mortality is not evenly distributed throughout the population and the burden is
greatest among those living in the most deprived areas.3 Its status as an issue
of significant concern was underlined by its inclusion in the Scottish
Government’s 2007-11 National Performance Framework (NPF) via the
following national indicator:4
Reduce alcohol related hospital admissions by 2011
Provisional estimates for 2010/11 show a 6% reduction in admissions, from 737
to 695 per 100,000 population, between 2006/7 and 2010/11, so this target was
met.5 The revised NPF, published in December 2011 retains this indicator about
alcohol related hospital admissions, but has removed the timeframe so it is now
an ongoing indicator.6
Alcohol is also the subject of the following NHS Scotland HEAT targets:7
Achieve agreed number of screenings using the settingappropriate screening tool and appropriate alcohol brief
intervention, in line with SIGN 74 guidelines during 2011/12
By March 2013, 90 per cent of clients will wait no longer than 3
weeks from referral received to appropriate drug or alcohol
treatment that supports their recovery.
Data for the first of these targets were published in June 2012 and showed that
97,830 alcohol brief interventions were delivered during 2011/12, exceeding the
target of 61,081.8 Data for the referrals target are published quarterly and the
most recent figures (for January-March 2012) show that 87.7% of clients waited
no longer than three weeks.9
The introductions to the alcohol chapters in the 2008,10 200911 and 201012
Scottish Health Survey (SHeS) reports provided a detailed account of the costs
65
and burdens harmful and excessive drinking places on Scottish society, as well
as a number of key recent legislative and policy developments. These included:
The Licensing (Scotland) Act 2005, which came into full force in
September 2009.
The 2009 publication Changing Scotland's Relationship with Alcohol: A
Framework for Action.13
The notable new powers contained within the Alcohol etc. (Scotland) Act
2010 passed by the Scottish Parliament in November 2010, which came
into force in October 2011.14 The Act included new powers to: ban
quantity discounts (such as ‘3 for 2’) in off-sales (complementing the
restrictions on irresponsible promotions in the Licensing Act for onsales), limit price promotions and restrict the display of alcohol
promotions in off-sales establishments, and introduce a mandatory
Challenge 25 age verification scheme for all licensed premises. 15
The February 2012 progress report on the Framework for Action6 provides a
comprehensive overview of all the policies being pursued, and associated funds
being invested, to support the 41 actions set out in the Framework. For
example, it highlights the £155 million that has been committed to tackle alcohol
misuse since 2008; the establishment of 30 Alcohol and Drug Partnerships that
bring together representatives from local authorities, health boards, voluntary
agencies and the police to develop strategies and commission services at the
local level; the launch of new health behaviour change campaigns (including
one targeted specifically at women); and the provision of refreshed advice for
parents and carers to support them to talk to young people about alcohol
consumption. These examples illustrate the wide range of actions being taken,
and the extent of joint-working required to make progress on the Framework’s
actions.
In addition to the kinds of steps outlined above, significant new legislation has
also been implemented. The Alcohol (Minimum Pricing) (Scotland) Bill was
introduced to parliament in October 2011, was passed into law in May 2012,
and is due to be implemented from April 2013.16 Following two amendments to
the Bill, the Act contains a ‘sunset clause’ imposing a six year time limit on the
policy, unless Ministers make further provisions to continue its operation, and a
requirement to evaluate the effect of the bill after five years.17 Based on
modelling evidence provided by the University of Sheffield18 - some of which
draws on SHeS alcohol consumption data - Scottish Ministers have
recommended a minimum unit price of 50p for the first two years (which will be
reviewed biennially thereafter). The Act’s provisions around evaluation, and the
fact that SHeS data were used in the modelling that informed the unit pricing
level, mean that the alcohol consumption estimates provided by the survey will
continue to perform an important monitoring role once the policy is
implemented.
The estimates of alcohol consumption discussed later in this chapter are based
on self-reported data. However, it is important to note that surveys often obtain
lower estimates of consumption than implied by alcohol sales data. The most
recently available estimates of alcohol sales in Scotland show that 11.2 litres of
pure alcohol per person aged 16 and over were sold in 2011 (the equivalent
66
figure for England and Wales was 9.3 litres).19 This volume is sufficient for every
adult aged 16 and over in Scotland to exceed the weekly recommended
maximum consumption for men of 21 units. Although survey estimates are
typically lower than sales estimates, surveys can provide information about the
social patterning of individuals' alcohol consumption which sales data cannot.
For example, the evaluation of the implementation of minimum pricing will use
evidence from the survey to help assess the impact on consumption patterns
across different social groups.
This chapter updates the key trend figures on weekly and daily alcohol
consumption presented in the three previous SHeS reports.10,11,12 It also
provides, for the first time, trend data on the proportion of people who do not
adhere to either the recommended weekly or daily drinking guidelines. The
trend for the numbers of days in the previous week people reported drinking
alcohol is also presented for the first time. Weekly drinking patterns, and the
numbers of days on which alcohol was consumed, are also shown by
household income and the Scottish Index of Multiple Deprivation (SIMD).
3.1.1
Definitions used in this chapter
The recommended sensible drinking guideline in the UK is that women
should not regularly drink more than 2-3 units of alcohol per day and
men should not regularly exceed 3-4 units per day. In addition, the
Scottish Government recommends that everyone aim to have at least 2
alcohol free days per week.
Over the course of a week, it is also recommended that women and
men should not exceed 14 units and 21 units respectively. The term
‘harmful drinking’ is used to describe those who are drinking at a level
which is already causing physical, social or psychological harm. People
whose drinking is not currently causing clear evidence of harm, but
which may cause harm in the future have been described as
‘hazardous’ drinkers.20 In terms of units, men who consume over 21 and
up to 50 units per week and women who consume over 14 and up to 35
units are usually classed as ‘hazardous’ drinkers, while those who
consume above 50/35 units a week are considered to be drinking at
‘harmful’ levels.21
There is no standard definition of ‘binge’ drinking in the UK. To enable
comparisons between other major surveys of alcohol consumption in
Britain, SHeS uses the definition used by the Health Survey for England
and the General Lifestyle Survey. These define binge drinking as more
than 6 units on one occasion for women and more than 8 units for men.
An additional measure of people’s adherence to the advice not to
exceed the daily and weekly drinking levels set out above is reported in
this chapter. The two key groups of interest are:
People who adhere to the guidelines i.e.
o
women who drink no more than 14 units per week, and no
more than 3 units on their heaviest drinking day
o
men who drink no more than 21 units per week, and no
more than 4 units on their heaviest drinking day.
67
People who do not adhere to the guidelines i.e.
o
women who drink more than 14 units per week, and/or
more than 3 units on their heaviest drinking day
o
men who drink more than 21 units per week, and/or more
than 4 units on their heaviest drinking day.
3.2
METHODS
3.2.1
Data collection in the 2008-2011 surveys
The way in which SHeS estimates alcohol consumption was changed
significantly in 2008. The revisions are detailed extensively in the
alcohol consumption chapter of the 2008 report10 so are not repeated
here. The following instead outlines the methods now used to collect
and analyse the alcohol consumption data.
Three aspects of alcohol consumption are measured: usual weekly
consumption, daily consumption on the heaviest drinking day in the
previous week, and indicators of potential problem drinking (including
physical dependence).
To estimate weekly consumption, participants aged 16 and over were
asked preliminary questions on whether they drank alcohol at all;
followed by questions on how often during the past 12 months they had
drunk each of six different types of alcoholic drink:
normal beer, lager, cider and shandy
strong beer, lager and cider
sherry and martini
spirits and liqueurs
wine
alcoholic soft drinks (“alcopops”).
The average number of days a week the participant had drunk each
type of drink was estimated from these questions. A follow-up question
asked how much of each drink type they had usually drunk on each
occasion. These data were converted into units of alcohol and
multiplied by the amount they said they usually drank on any one day
(see below for discussion of this process).22
It is well known that surveys tend to underestimate adults’ levels of
alcohol consumption for a number of reasons, including problems of
recall, social desirability, and the difficulties involved in assigning an
average estimate to an activity that varies from day to day. It is also
worth noting that medium to high alcohol consumption can often impair
a person’s ability to recall the volume consumed on that particular
occasion. Also, as the questions ask about 'usual' behaviour, responses
are unlikely to reflect occasions of heavier drinking. Nevertheless,
survey estimates provide useful comparisons of the consumption of
68
different population groups and enable change over time to be
monitored.
Daily consumption was measured by asking about drinking in the week
preceding the interview, and looked at actual consumption on the
heaviest drinking day in that week. Participants aged 16 and over were
asked whether they had drunk alcohol in the past seven days. If they
had, they were asked on how many days and, if on more than one,
whether they had drunk the same amount on each day or more on one
day than others. If they had drunk more on one day than others, they
were asked how much they drank on that day. If they had drunk the
same on several days, they were asked how much they drank on the
most recent of those days. If they had drunk on only one day, they were
asked how much they had drunk on that day. In each case, the
questions asked for details of the amounts consumed of each of the six
types of drink listed above, rather than asking participants to give a
direct estimate of units consumed. This part of the process was
therefore similar to the one used to estimate weekly drinking.
The CAGE questionnaire was asked of participants aged 16 and over,
and highlights up to six indicators of problem drinking, including three
indicators of physical dependency on alcohol. Due to the sensitive
nature of the questions, this questionnaire was administered in selfcompletion format
3.2.2
Unit calculations and conversion factors
In the UK, a standard unit of alcohol is 10 millilitres or around 8 grams
of ethanol. As described above, the majority of advice given in relation
to safe alcohol consumption refers to units. The need for accurate
estimates of units consumed is therefore paramount. However, there
are numerous difficulties associated with calculating units at a
population level, not least of which are the variability of alcohol
strengths and the fact that these have changed over time.
As described above, information was collected about the volumes of
alcohol participants had drunk in a typical week and also on their
heaviest drinking day in the week preceding the survey. The volumes
reported were not validated but in response to growing concerns about
the reliability of consumption estimates from studies such as this, and
the increasing consumption of wine – especially amongst women –
extra efforts were made to measure wine glass sizes. This was done in
two ways. Firstly, participants who reported drinking any wine were
asked directly what size of glass they had been drinking from.
Secondly, showcards depicting glasses with 125ml, 175ml and 250mls
of liquid were used to help people make more accurate judgements.
The following table outlines how the volumes of alcohol reported in the
survey were converted into units (the 2008 report provides full
information about how this process has changed over time).10
69
Type of drink
Volume reported
Normal strength beer,
lager, stout, cider,
shandy (less than 6%
ABV)
Half pint
Can or bottle
Strong beer, lager, stout,
cider, shandy (6% ABV
or more)
Wine
Sherry, vermouth and
other fortified wines
Spirits
Alcopops
3.3
Small can
(size unknown)
Large can/bottle
(size unknown)
Half pint
Can or bottle
Small can
(size unknown)
Large can/bottle
(size unknown)
250ml glass
175ml glass
125ml glass
750ml bottle
Glass
Glass (single
measure)
Small can or bottle
Large (700ml) bottle
Unit
conversion
factor
1.0
Amount in pints
multiplied by
2.5
1.5
2.0
2.0
Amount in pints
multiplied by 4
2.0
3.0
3.0
2.0
1.5
1.5 x 6
1.0
1.0
1.5
3.5
WEEKLY ALCOHOL CONSUMPTION LEVELS
3.3.1
Trends in weekly alcohol consumption since 2003
Trends in weekly consumption levels are presented using the following
categories: non-drinkers, moderate, and hazardous or harmful drinkers.
Men who drank some alcohol, but no more than 21 units in a typical
week, and women who drank but did not exceed 14 units, were
classified as moderate drinkers. Consumption in excess of these
thresholds was classified as hazardous or harmful. The trend figures for
these three categories, and the mean units consumed, for men, women
and all adults are presented in Table 3.1.
There was an overall downward trend in usual weekly alcohol
consumption in adults aged 16 and over between 2003 and 2011. The
mean weekly units consumed by all adults declined steadily, from 14.1
in 2003 to 11.1 in 2011. This decline was more sustained among men
than women. Men consumed 19.8 mean units in 2003, and 18.0 in
2008, and consumption then fell by 0.5-1.0 units each year thereafter to
15.0 units in 2011. In contrast, women’s consumption declined most
between 2003 and 2009 (from 9.0 to 7.8 mean units), and while the
decline has continued (to 7.4 units in 2011), it has been much less
steep in recent years. As has been discussed in previous SHeS
chapters on alcohol consumption,12 commenting on change over time
among age sub-groups is difficult due to the small sample sizes and the
70
greater likelihood of sample fluctuation. However, the general pattern
emerging across the years is that the decline in unit consumption has
tended to be more apparent among those aged under 65, which is
unsurprising as alcohol consumption was higher in this age group to
start with.
The proportion of adults classified as hazardous or harmful drinkers has
also declined, from 28% in 2003 to 21% in 2011. As with mean unit
consumption, the decline was a little steeper for men (from 33% to
25%) than for women (from 23% to 18%). As Figure 3A illustrates, the
greatest decline occurred between 2003 and 2009, with only smaller
drops occurring thereafter. There has been no change for women since
2009 suggesting that there may be some levelling off in the proportions
engaging in harmful or hazardous drinking. Again, the general patterns
suggest that the decline in harmful or hazardous drinking was greatest
among men under 65 and women under 55.
Figure 3A, Table 3.1
Figure 3A
Proportion of adults exceeding guidelines on weekly alcohol consumption
(over 21 units for men, over 14 units for women), 2003, 2008, 2009, 2010 and 2011
Men
Women
All adults
50
Percent
40
30
20
10
0
2003
2008
2009
2010
2011
Survey year
3.3.2
Weekly alcohol consumption by age and sex, 2011
As illustrated in the discussion above, in 2011 weekly mean alcohol
consumption was higher among men (15.0 units) than women (7.4
units). For both sexes, mean consumption varied by age, with men
aged 75 and over (9.9 units), and women aged 65 and above (3.4-5.9
units) consuming less units than younger people.
Men were also more likely than women to be categorized as hazardous
or harmful drinkers (25% compared with 18%). Those aged 75 and over
were the least likely to be classified as hazardous or harmful drinkers
(14% of men and 8% of women), whereas the figures for those aged
16-74 ranged, with no obvious pattern, between 22% and 29% for men
and 16% and 23% for women. The low level of hazardous or harmful
drinking among men aged 25-34 (22%) in 2011 may well be a blip as
71
the equivalent figure in previous years was consistently higher than this
(28%-29% between 2008 and 2010).
Women were more likely than men to be non-drinkers (17% and 11%,
respectively). Among men, those aged 25-64 were the least likely to be
non-drinkers (8%-11%), compared with 15%-18% of the remaining age
groups. The pattern for women was clearer, 12%-16% of those aged
16-64 were non-drinkers, this increased to 26% of those aged 65-74,
and to 36% of those aged 75 and over.
Table 3.1
3.3.3
Weekly alcohol consumption, 2008-2011 combined, by equivalised
household income and Scottish Index of Multiple Deprivation
(SIMD)
Weekly alcohol consumption levels by equivalised household income
and the Scottish Index of Multiple Deprivation are presented in Tables
3.2 and 3.3 respectively (descriptions of each of these measures are
available in the Glossary at the end of this volume). Four years of data
(2008-2011) have been combined to enable more robust estimates of
drinking patterns in each of the sub-groups to be made. Due to space
constraints, an equivalent table by socio-economic classification has
been omitted.
To ensure that the comparisons presented in this section are not
confounded by the different age profiles of the sub-groups, the data
have been age-standardised (age-standardisation is also described in
the Glossary). On the whole, the differences between observed and
age-standardised percentages are small. Therefore, the percentages
and means presented are the standardised ones only
Equivalised household income
The proportions of men and women in each household income quintile
classified as hazardous or harmful drinkers (and moderate and nondrinkers) are shown in Table 3.2. The mean weekly units consumed by
moderate and hazardous or harmful drinkers, by income quintile are
also presented in this table.
The proportion of men classed as hazardous/harmful drinkers generally
declined in line with income – from 35% for those in the highest income
quintile, to 28% for those in the 2nd and 3rd quintiles, and further still to
22%-24% for those in the two lowest income quintiles. The pattern was
similar for women, but the decline was a little steeper, from 27% in the
highest quintile to 14% in the lowest. Moderate drinking levels were
fairly similar across the quintiles so the decline of hazardous/harmful
drinking in line with household income was largely accounted for by a
linear increase, as income decreased, in the proportion of non-drinkers.
5% of men and 8% of women in the highest income households were
non-drinkers, compared with 21% of men and 24% of women in the
lowest.
However, while non-drinking was most common in low income
households, and hazardous/harmful drinking less common, Figure 3B
72
illustrates that hazardous/harmful drinkers in the lowest income
households consumed more units than hazardous/harmful drinkers in
the other income groups. Men in the lowest income households who
were hazardous/harmful drinkers consumed 61.6 units per week,
compared with the 38.6-44.3 units consumed by men in the other
income quintiles. The corresponding figures for women were 37.2 units
and 26.0-26.4, respectively.
Figure 3B, Table 3.2
Figure 3B
Mean weekly alcohol units consumed among hazardous/harmful drinkers,
(age-standardised), by equivalised household income, and sex,
2008-11 combined
Men
Women
70
Mean weekly units
60
50
40
30
20
10
0
1st (highest)
2nd
3rd
4th
Equivalised household income
5th (lowest)
Scottish Index of Multiple Deprivation (SIMD)
Two measures of SIMD are being used throughout this report. The first,
which uses quintiles, enables comparisons to be drawn between the
most and least deprived 20% of areas and the intermediate quintiles.
The second contrasts the most deprived 15% of areas with the rest of
Scotland (described in the tables as the “85% least deprived areas”).
The general patterns seen for household income were also seen for
SIMD, but with some notable differences. For men, the prevalence of
hazardous/harmful drinking did not vary greatly by SIMD quintile
(ranging between 26% and 29%). For women however, as deprivation
level increased the proportion of hazardous/harmful drinkers steadily
decreased (from 24% in the least deprived quintile to 15%-16% in the
most deprived two quintiles). As seen with income, levels of moderate
drinking were broadly similar across the SIMD quintiles, whereas nondrinking increased in line with deprivation, from 7% to 16% in men, and
from 10% to 24% in women.
Although the prevalence of hazardous/harmful drinking varied little by
SIMD for men, mean weekly consumption among male
73
hazardous/harmful drinkers increased steadily in line with deprivation,
from 36.7 units in the least deprived quintile to 52.8 units in the most
deprived quintile. There was a particularly pronounced increase
between the most deprived and the second most deprived quintiles
(difference of 9.2 units). There was a corresponding, but less
pronounced, increase in mean weekly consumption as deprivation
increases among female hazardous/harmful drinkers from 24.9 units in
the least deprived quintile to 30.6 units in the most deprived.
These patterns were confirmed when the weekly consumption of those
living in the 15% most deprived areas in Scotland was compared with
those living elsewhere. Men and women in the 15% most deprived
areas were more likely to be non-drinkers than those in the rest of
Scotland (17% for men and 24% for women compared with 10% and
14% respectively for those living in the 85% least deprived areas).
Levels of moderate drinking were similar in both areas, and while the
prevalence of hazardous/harmful drinking in both areas was also similar
for men, women in the 15% most deprived areas were less likely than
those living elsewhere to be hazardous/harmful drinkers (14% and 19%,
respectively).
Mean unit consumption among harmful/hazardous drinkers was higher
in the 15% most deprived areas than in the rest of Scotland and this
was true for both men (54.9 compared with 41.1 units) and women
(30.6 compared with 26.9 units).
Table 3.3
3.4
ESTIMATED DAILY CONSUMPTION
3.4.1
Trends in alcohol consumption on the heaviest drinking day since
2003
Data on alcohol consumption on the heaviest drinking day in the last
week for adults aged 16 is presented in Table 3.4 for 2003 onwards.
The mean number of units consumed by adults on their heaviest
drinking day in the past week has declined gradually from 4.9 units in
2003 to 4.3 units in 2011. The latest figures suggest that decline is
perhaps more apparent among men than women. To illustrate, in 2003,
men consumed 6.5 mean units on their heaviest drinking day, between
2008 and 2010 it was a little lower (5.9-6.2 units), and then fell to 5.5 in
2011. In contrast, for women mean units fell between 2003 and 2009 for
women (from 3.6 to 3.2 units) and has remained stable since then (3.1
in 2010 and 3.2 in 2011). The half a unit decrease in men’s daily
consumption between 2010 and 2011 is the largest in the series to
date, so evidence from future years will be needed before we can
establish more conclusively whether this has been a sustained decline
rather than a single year’s sampling variation. It is worth noting that the
decline was most notable in men aged 25-34 (whose consumption fell
by 1.6 units between 2010 and 2011), so it is possible that it does not
represent a meaningful trend. As was the case with weekly drinking, the
74
general pattern of decline since 2003 tended to be due to reductions in
the consumption of men aged under 65, and women aged 16-34.
The proportion of adults exceeding their recommended daily limits
(more than 4 units for men, more than 3 for women), has declined by
one percentage point in each survey year, from 41% in 2003 to 37% in
2011. As highlighted in the alcohol consumption chapter in the 2010
SHeS report,12 between 2003 and 2010 there was little change in the
proportion of men exceeding their recommended daily limits (43%45%). At 41%, the 2011 figure was clearly lower than the 2003 high of
45%, indicating an overall downward trend for men between 2003 and
2011. However, it is worth noting that the decline from 2010 to 2011
was largely confined to men aged 25-34. A steady decline in the
proportion of women exceeding their recommended daily limits (from
37% in 2003 to 33% in 2010) was reported in the 2010 chapter 12 and
there was little change in 2011 (34%). Men aged 16-54, and women
aged 16-34 have generally seen the largest declines over time in the
proportions exceeding the daily limits.
Between 2003 and 2011, there was also an overall decrease in the
prevalence of drinking more than twice the recommended daily limits
(more than 8 units for men and more than 6 units for women) from 24%
to 20%. As with the other measures discussed here, this decline was
more pronounced and consistent among men (from 29% in 2003 to
25% in 2011), while recent figures for women have fluctuated between
16% and 17% (compared with 19% in 2003).
Figure 3C, Figure 3D, Table 3.4
Figure 3C
Proportion of men exceeding 4 units, women exceeding 3 units and
all adults exceeding 3/4 units, on the heaviest drinking day in the
previous week, 2003, 2008, 2009 , 2010 and 2011
More than 4 units (men)
More than 3 units (women)
More than 3/4 units (all)
50
Percent
40
30
20
10
0
2003
2008
Survey year
75
2009
2010
2011
Figure 3D
Proportion of men exceeding 8 units, women exceeding 6 units and
all adults exceeding 6/8 units, on the heaviest drinking day in the
previous week, 2003, 2008, 2009, 2010 and 2011
More than 8 units (men)
More than 6 units (women)
More than 6/8 units (all)
50
Percent
40
30
20
10
0
2003
2008
2009
2010
2011
Survey year
3.4.2
Alcohol consumption on the heaviest drinking day by age and sex,
2011
In 2011, men consumed more units on their heaviest drinking day in the
last week than women (5.5 and 3.2 respectively). They were also more
likely than women to exceed their recommended daily limits (41%
compared with 34%) and to consume twice their recommended daily
limits (25% compared with 17%).
Daily drinking showed variations with age. Mean units consumed
decreased as age increased (from 5.9 in those aged 16-24 down to 2.9
in those aged 75 and above). This pattern was observed for both men
and women. The proportion exceeding their daily limits was similar for
those aged 16 to 54, and dropped quite sharply for each successive
age group thereafter. For example, the proportion of men aged 16-54
that drank more than 8 units on their heaviest drinking day ranged from
28% to 32%, this then dropped to 20% at age 55-64, 12% at age 65-74,
and to just 3% for men aged 75 and over.
Table 3.4
3.5
ADHERENCE TO WEEKLY AND DAILY DRINKING ADVICE
3.5.1
Trends in adherence to weekly and daily drinking advice since
2003
As noted in Section 3.1.1, the recommended daily drinking guidelines
are that men should not regularly exceed 3-4 units and women should
not regularly drink more than 2-3 units. In addition, the recommended
weekly drinking guidelines are that men and women should not exceed
21 units and 14 units respectively.
The proportion of adults who drank within these recommended
government guidelines remained fairly stable between 2003 and 2011
(ranging from 42% - 44%). Similarly, there was little change when the
76
trends for men and women were looked at separately (although there
was a slight increase for men from 39% in 2010 to 42% in 2011 but the
figures have fluctuated each year). However when examining variations
by age there was an overall increase in adherence to the guidelines
among men aged 16-54 and 75 and above, and women aged 25 to 34.
Among men aged 65-74 and women aged 65 and above the proportion
adhering to the guidelines decreased between 2003 and 2011.
Between 2003 and 2011 there was a decline in the proportion of people
drinking outwith the guidelines (47% and 42% respectively), although
there was no significant change between 2009 and 2011. The drop was
steepest among men (from 53% in 2003 to 46% in 2011) and was
largely explained by a decline among younger men (aged 16-44). The
decline among women (from 42% to 38%) was mainly driven by a
decrease among those aged 25-34 (from 55% to 42%).
Over this same period (2003-2011) the proportion of ex-drinkers
increased from 5% to 8% (for men it increased from 4% to 6%, the
equivalent figures for women were 5% and 9%). The increase was
greatest in the older age groups, with little change among those aged
under 45.
While there was little change in the overall proportion of adults reporting
that they had never drunk alcohol between 2003 and 2011, there was a
notable increase in the proportion of 16-24 year olds reporting this (from
8% to 13% in men and from 9 to 12% in women). Most of this change
occurred between 2009 and 2010.
Table 3.5
3.5.2
Adherence to weekly and daily drinking advice by age and sex,
2011
In 2011, 43% of adults drank within the recommended guidelines (42%
of men and 44% of women). As would be expected, the patterning by
age was similar to that described above for weekly and daily drinking:
37%-43% of those aged 16-54 drank within the guidelines, this
increased to 46%-47% of those aged 55-74, and further still to 57% of
those aged 75 and over. This was true for men and women, with the
increase occurring slightly later among men (aged 75 and over
compared with aged 55-64 for women).
The proportion drinking outwith the guidelines (42%) was similar to the
proportion that adhered to them (43%). Men were more likely than
women to drink outwith the weekly and daily guidelines (46% compared
with 38%). As Figure 3E illustrates, the age-related pattern for drinking
outwith the guidelines was the reverse of that seen for drinking within
them, with prevalence declining from the age of 65-74 among men and
55-64 among women.
Figure 3E, Table 3.5
77
Figure 3E
Proportion who drank outwith the guidelines on weekly and daily alcohol
consumption by age and sex, 2011
Men
Women
60
50
Percent
40
30
20
10
0
16-24
25-34
35-44
45-54
55-64
65-74
75+
All
Age group
3.6
NUMBER OF DAYS ALCOHOL WAS CONSUMED IN PAST WEEK
3.6.1
Trends in number of days alcohol was consumed in past week
since 1998
The trend for the number of days in the previous week that people said
they had consumed alcohol is presented in Table 3.6. The figures
presented are based only on those who said they had drunk alcohol in
the past week. While the changes made to the alcohol estimates from
2003 onwards (detailed in the 2008 SHeS chapter on alcohol
consumption)10 mean that consumption volumes cannot be compared,
the question about the number of drinking days was unaffected, so the
trend figures in the table extend back to 1998 when the question was
first asked. Adults aged 75 and over were not included in the 1998
survey therefore the discussion on trends since 1998 is based on adults
aged 16 to 74 (totals for this age group are also presented in Table 3.6).
Figures for all adults (aged 16 and over) from 2003 onwards are also
presented.
These figures provide useful contextual information about people’s
drinking patterns, and help to illustrate whether changes over time in
overall consumption levels are the result of people drinking on fewer
occasions over the week, or whether they are drinking less on the same
number of occasions. In addition, people are advised to have at least
two alcohol-free days per week so the trend in the proportion who drank
on more than five days in the previous week helps show the extent to
which this advice has been adhered to.
Between 1998 and 2008 there was little change in the mean number of
days on which adults aged 16-74 consumed alcohol (ranging from 2.8
to 3.0 days) though it has been a little lower since then (2.6 days). The
figures for men aged 16-74 followed a similar pattern to this (3.1-3.2
days between 1998 and 2008 and 2.8 days since 2009). For women,
78
with the exception of 2003 (2.7 days), the figure remained unchanged
from 1998 (2.4 days in 1998 and 2011).
As shown in Figure 3F, among adults aged 16-74 the prevalence of
drinking on more than five days a week declined between 1998 and
2011 (from 14% to 10%) but has been largely static since 2009. As
seen with the trend in mean days, the decline since 1998 was greater
for men (from 17% to 12% in 2011), than for women for whom the
figures have decreased from 10% in 1998 to 8% in 2011.
The decline is slightly greater when the figures for all adults aged 16
and over are considered. Between 2003 and 2009 the mean number of
days on which alcohol was consumed in the previous week declined
from 3.0 to 2.7 and has remained at this level since then. Again, the
decline was more evident for men (from 3.3 days in 2003 to 2.8 days in
2011) than for women (from 2.7 days in 2003 to 2.5 days each year
since 2008). The downward trend was evident for men of all ages but
for women was more consistent among those aged 25-54.
For all adults aged 16 and over, the trend (since 2003) in drinking on
more than five days a week has also been downward. In 2003, 17%
drank on more than five days a week. The equivalent figure in 2011 was
12%. This too was largely confined to men (down from 20% in 2003 to
13% in 2011) with the equivalent figures for women showing a much
smaller decline (13% to 10%). The change over time was evident for
almost all age groups, with the exception of the youngest age group
and women aged 75 and over.
Figure 3F, Table 3.6
Figure 3F
Proportion of men, women and all adults (aged 16-74) who drank on more than
five days in the previous week, 1998, 2003, 2008, 2009, 2010, and 2011
(base=people who drank in last week )
Men
Women
All adults
25
Percent
20
15
10
5
0
1998
2003
2008 2009 2010 2011
Survey year
79
3.6.2
Number of days alcohol was consumed in past week, by age and
sex, 2011
In 2011, the mean number of days on which adults who drank
consumed alcohol was 2.7 (2.8 days for men and 2.5 for women). Just
over one in ten (12%) drank on more than five days in the previous
week (13% of men and 10% of women). Both the mean number of
days, and the proportion drinking on more than five days, increased in
line with age with similar patterns for men and women (see Figure 3G).
Just 4%-6% of people aged 16-44 who had drunk alcohol in the
previous week did so on more than five days, this increased with each
successive age group to 37% of those aged 75 and over. These figures,
in combination with the daily alcohol consumption figures presented in
Table 3.4, suggest that the way in which people consume their alcohol
differs notably across the lifecycle, with older people drinking less
alcohol overall, spread across more days of the week, and younger age
groups drinking higher volumes of alcohol on fewer occasions.
Figure 3G, Table 3.6
Figure 3G
Proportion who drank on more than five days in the past week, 2011, by age
and sex (base=people who drank in past week )
Men
Women
45
40
35
Percent
30
25
20
15
10
5
0
16-24
25-34
35-44
45-54
55-64
65-74
75+
All
Age group
3.6.3
Number of days alcohol was consumed in past week, 2008-2011
combined, (age-standardised), by equivalised household income
and Scottish Index of Multiple Deprivation (SIMD)
Equivalised household income
Both the mean number of days on which drinkers drank in the previous
week, and the proportions drinking on more than five days are
presented by household income in Table 3.7. As the figures are based
only on people who drank, the table is based on the combined 20082011 data.
The prevalence of drinking on more than five days a week varied
significantly by household income for men but with no clear pattern.
Those in the highest income households were most likely to drink on
80
more than five days (18%) while prevalence was lowest among those in
the 2nd and 4th income quintiles (13% and 14% respectively). In
contrast, the pattern for women was much clearer with a decline from
15% of those in the highest income households to 8%-9% in the three
lowest income quintiles.
For both men and women the mean number of days on which drinkers
consumed alcohol in the previous week declined fairly consistently in
line with household income. Among men it declined from 3.2 days for
those the highest income households to 2.7-2.8 days for those in the
bottom two quintiles; for women it declined steadily from 3.0 to 2.1 days
between those in the highest and lowest quintiles.
Table 3.7
Scottish Index of Multiple Deprivation (SIMD)
The patterns by SIMD (Table 3.8) are similar to those for household
income discussed above. There was a clear association between area
level deprivation and drinking on more than five days a week for both
sexes although the pattern was more pronounced for women. Women
living in the least deprived quintile were almost three times as likely as
those in the most deprived to drink on more than five days in the
previous week (13% and 5%, respectively). For men, it was those living
in the 4th and 3rd quintiles that were most likely to drink this frequently
(16% and 17% respectively).
The mean number of days on which female drinkers had drunk in the
previous week declined as area level deprivation increased (2.8 days
for those living in the least deprived quintile compared with 2.0 days for
those in the most deprived). The pattern for men was similar to that for
prevalence of drinking on more than five days: with a mean of 2.7
drinking days for those in the two most deprived quintiles compared
with 3.0-3.1 days for those living elsewhere.
Comparing the 15% most deprived areas with the rest of Scotland
shows similar patterns, with bigger differences evident for women than
for men. For example, 5% of women in the 15% most deprived areas
drank on five or more days compared with 10% of women in the rest of
Scotland. The equivalent figures for men were 14% and 15%. Similarly,
the difference in the mean days figure for women in both groups was
0.6 days compared a difference of 0.3 days for men.
Table 3.8
81
References and notes
1
Grant, I., Springbett, A., and Graham, L. Alcohol attributable mortality and morbidity: alcohol
population attributable fractions for Scotland, 2009. ISD Scotland/Scottish Public Health
Observatory. <www.scotpho.org.uk/alcoholPAFreport/>
2
Changing Scotland’s Relationship with Alcohol : A Framework for Action - Progress Report.
February 2012. Edinburgh: Scottish Government. Available from:
<www.scotland.gov.uk/Topics/Health/health/Alcohol/resources/Resources>
3
Beeston C., Robinson M., Craig, N and Graham, L. Monitoring and Evaluating Scotland’s Alcohol
Strategy. Setting the Scene: Theory of change and baseline picture. Edinburgh: NHS Health
Scotland; 2011. <www.healthscotland.com/documents/5072.aspx>
4
Scottish Budget Spending Review 2007. Edinburgh: Scottish Government, 2007. [online] Available
from: <www.scotland.gov.uk/Publications/2007/11/13092240/0>
See also: <www.scotlandperforms.com>
5
See: <www.scotland.gov.uk/About/Performance/scotPerforms/indicator/alcohol>
6
National Performance Framework: Changes to the National Indicator Set, Edinburgh: Scottish
Government, 2012. [online] Available from:
<www.scotland.gov.uk/About/scotPerforms/NIchanges> See also: <www.scotlandperforms.com>
7
The 2007 Better Health, Better Care action plan for improving health and health care in Scotland
set out how NHS Scotland’s HEAT performance management system (based around a series of
targets against which the performance of its individual Boards are measured) would feed into the
Government’s overarching objectives. The HEAT targets derive their name from the four strands
in the performance framework: the Health of the population; Efficiency and productivity, resources
and workforce; Access to services and waiting times; and Treatment and quality of services.
8
ISD Scotland. (2012). Alcohol Brief Interventions 2011/12. Edinburgh: National Services Scotland.
Available from:
<www.isdscotland.org/Health-Topics/Drugs-and-Alcohol-Misuse/Publications/>
9
ISD Scotland. (2012). National Drug and Alcohol Treatment Waiting Times Report: January –
March 2012. Edinburgh: National Services Scotland. Available from:
<www.isdscotland.org/Health-Topics/Drugs-and-Alcohol-Misuse/Publications/>
10
Reid, S. (2009). Chapter 3: Alcohol consumption. In Bromley, C., Bradshaw, P. and Given, L.
[eds.] The 2008 Scottish Health Survey – Volume 1: Main Report. Edinburgh, Scottish
Government. <www.scotland.gov.uk/Publications/2009/09/28102003/0>
11
Sharp, C. (2010). Chapter 3: Alcohol consumption. In Bromley, C., Given, L. and Ormston. R.
[eds.] The 2009 Scottish Health Survey – Volume 1: Main Report. Edinburgh, Scottish
Government. <www.scotland.gov.uk/Publications/2010/09/23154223/0>
12
Sharp, C. (2011). Chapter 3: Alcohol consumption. In Bromley, C. and Given, L. [eds.] The 2010
Scottish Health Survey – Volume 1: Main Report. Edinburgh, Scottish Government.
<www.scotland.gov.uk/Publications/2011/09/27084018/21>
13
Changing Scotland’s Relationship with Alcohol: A Framework for Action. Edinburgh: Scottish
Government, 2009.
14
See: <www.scottish.parliament.uk/s3/bills/34-AlcoholEtc/index.htm>
15
See: <www.scottish.parliament.uk/s3/bills/34-AlcoholEtc/AlcoholBillsummary.pdf>
82
16
Alcohol (Minimum Pricing) (Scotland) Act 2012. See:
<www.scottish.parliament.uk/help/43354.aspx>
17
SPICe Briefing 12/34. 17 May 2012. Alcohol (Minimum Pricing) (Scotland) Bill: Stage 3. Scottish
Parliament Information Centre. Available from: <www.scottish.parliament.uk/help/43354.aspx>
18
Meier, P., Meng, Y., Hill-McManus, D. and Brennan, A. (2012). Model-Based Appraisal Of Alcohol
Minimum Pricing And Off-Licensed Trade Discount Bans In Scotland Using The Sheffield Alcohol
Policy Model (V 2):- Second Update Based On Newly Available Data. University of Sheffield.
Available from: <www.shef.ac.uk/polopoly_fs/1.156503!/file/scotlandjan.pdf>
19
Robinson, M., Beeston, C., Mackison, D.(2012). Monitoring and Evaluating Scotland’s Alcohol
Strategy (MESAS) – An update of alcohol sales and price band analyses. Edinburgh: NHS Health
Scotland, 2012. Available from: www.healthscotland.com/documents/6019.aspx
20
Drummond, C., Deluca, P., Oyefeso, A., Rome, A., Scrafton, S., Rice, P. (2009). Scottish Alcohol
Needs Assessment. London: Institute of Psychiatry, King’s College.
21
See for example the North West Public Health Observatory’s Local Alcohol Profiles for England,
which use these definitions - <www.nwph.net/alcohol/lape/>
22
For participants aged 16 and 17, details on alcohol consumption were collected as part of a
special smoking and drinking self-completion questionnaire. Some 18 and 19 year olds also
completed the self-completion if the interviewer felt it was appropriate. For all other adult
participants, the information was collected as part of the face-to-face interview. The method of
estimating consumption follows that originally developed for use in the General Household Survey
and is also used in the Health Survey for England. For six types of alcoholic drink (normal strength
beer/lager/cider/shandy, strong beer/lager/cider, spirits/liqueurs, fortified wines, wine, and
alcoholic soft drinks), participants were asked about how often they had drunk each one in the
past twelve months, and how much they had usually drunk on any one day. The amount given to
the latter question was converted into units of alcohol, with a unit equal to half a pint of normal
strength beer/lager/cider/alcoholic soft drink, a single measure of spirits, one glass of wine, or one
small glass of fortified wine. A half pint of strong beer/lager/cider was equal to 1.5 units. The
number of units was then multiplied by the frequency to give an estimate of weekly consumption of
each type of drink. The frequency multipliers were:
Drinking frequency
Multiplying factor
Almost every day
7.0
5 or 6 times a week
5.5
3 or 4 times a week
3.5
Once or twice a week
1.5
Once or twice a month
0.375
One every couple months
0.115
Once or twice a year
0.029
The separate consumption figures for each type of drink were rounded to two decimal places and
then added together to give an overall weekly consumption figure. The results were then banded,
using the same bands as the ones used in the 1995 Scottish Health Survey and in all years of the
Health Survey for England. The bandings for men are as follows:
1 Under 1 unit (less than or equal to 0.50 units)
2 1-10 units (over 0.50 units, but less than or equal to 10.00 units)
3 Over 10-21 units (over 10.00 units, but less than or equal to 21.00 units)
4 Over 21-35 units (over 21.00 units, but less than or equal to 35.00 units)
5 Over 35-50 units (over 35.00 units, but less than or equal to 50.00 units)
6 Over 50 (over 50.00 units)
The bands for women were similar, but with breaks at 7, 14, 21 and 35 units, instead of 10, 21, 35
and 50.
83
Table list
Table 3.1
Table 3.2
Table 3.3
Table 3.4
Table 3.5
Table 3.6
Table 3.7
Table 3.8
Estimated usual weekly alcohol consumption level, 2003, 2008, 2009, 2010,
2011, by age and sex
Estimated usual weekly alcohol consumption level and mean units by drinking
category, 2008-2011 combined, (age-standardised), by equivalised household
income quintile and sex
Estimated usual weekly alcohol consumption level and mean units by drinking
category, 2008-2011 combined, (age-standardised), by Scottish Index of
Multiple Deprivation and sex
Units consumed on heaviest drinking day in past week, 2003, 2008, 2009,
2010, 2011, by age and sex
Adherence to weekly and daily drinking advice, 2003, 2008, 2009, 2010,
2011, by age and sex
Number of days on which drank alcohol in the past week, 2003, 2008, 2009,
2010, 2011, by age and sex
Number of days on which drank alcohol in the past week, 2008-11 combined,
(age-standardised), by equivalised household income quintile and sex
Number of days on which drank alcohol in the past week, 2008-11 combined,
(age-standardised), by Scottish Index of Multiple Deprivation and sex
84
Table 3.1
Estimated usual weekly alcohol consumption level, 2003, 2008, 2009, 2010,
2011, by age and sex
Aged 16 and over
Alcohol units per
weeka
2003, 2008, 2009, 2010, 2011
Age
Total
16-24
25-34
35-44
45-54
55-64
65-74
75+
%
%
%
%
%
%
%
%
Non-drinker
2003
2008
2009
2010
2011
10
8
9
14
15
7
9
8
10
10
7
10
10
10
8
5
8
7
11
9
7
9
9
12
11
10
15
14
13
15
20
20
20
21
18
8
10
10
12
11
Moderate
2003
2008
2009
2010
2011
58
51
59
59
58
57
63
65
61
68
58
59
66
63
68
57
60
61
63
62
58
60
62
58
63
64
59
62
60
60
59
66
67
61
68
58
59
63
61
64
Hazardous/Harmful
2003
2008
2009
2010
2011
32
41
33
27
27
36
28
28
29
22
35
31
24
27
24
38
32
31
26
29
35
31
29
30
26
26
25
24
27
25
21
14
14
19
14
33
30
27
27
25
Mean units per week
2003
2008
2009
2010
2011
17.4
23.5
22.4
15.4
16.7
19.9
17.8
16.3
16.7
12.9
22.9
19.4
17.4
17.8
14.9
23.0
19.0
20.1
15.9
17.1
20.9
18.0
16.6
17.0
16.3
15.3
13.8
15.3
14.8
14.6
12.2
8.3
8.5
10.9
9.9
19.8
18.0
17.5
16.0
15.0
SE of the mean
2003
2008
2009
2010
2011
1.21
1.96
4.06
1.45
1.70
1.26
1.43
1.07
1.37
0.78
1.76
1.37
1.32
1.69
1.05
1.64
1.09
1.57
0.87
0.88
1.20
1.07
0.82
1.03
1.11
0.85
0.86
0.99
1.07
0.86
1.09
0.69
0.68
1.09
0.86
0.62
0.53
0.75
0.50
0.42
546
405
514
459
497
596
475
568
558
578
755
559
634
581
610
665
549
652
626
651
567
478
563
540
562
404
326
387
373
389
258
218
259
251
264
3791
3011
3576
3388
3551
315
220
261
244
287
446
312
406
417
395
726
456
550
474
513
610
530
604
562
593
631
523
575
553
599
507
451
517
486
510
323
3558
304
2796
363
3276
328
3064
342
3239
Continued…
Men
Bases (weighted):
Men 2003
Men 2008
Men 2009
Men 2010
Men 2011
Bases (unweighted):
Men 2003
Men 2008
Men 2009
Men 2010
Men 2011
85
Table 3.1
- Continued
Aged 16 and over
Alcohol units per
weeka
2003, 2008, 2009, 2010, 2011
Age
Total
16-24
25-34
35-44
45-54
55-64
65-74
75+
%
%
%
%
%
%
%
%
Non-drinker
2003
2008
2009
2010
2011
10
7
11
12
14
9
11
9
14
12
9
10
13
12
12
8
10
12
12
15
14
11
15
17
16
21
20
24
22
26
32
28
33
38
36
13
13
16
17
17
Moderate
2003
2008
2009
2010
2011
60
56
61
62
63
63
68
67
67
71
64
68
68
69
67
62
66
66
66
64
65
70
68
67
67
66
68
66
66
59
64
69
63
53
57
64
67
66
65
65
Hazardous/Harmful
2003
2008
2009
2010
2011
31
37
28
25
23
28
20
24
19
17
27
22
19
20
21
30
23
22
22
22
21
19
18
16
17
12
12
10
12
16
5
4
3
10
8
23
20
19
18
18
Mean units per week
2003
2008
2009
2010
2011
11.5
16.2
11.9
10.8
9.6
11.8
8.2
8.9
8.0
7.5
10.3
9.9
8.3
8.2
8.4
11.2
9.2
9.0
8.9
8.6
7.8
7.2
7.4
6.9
7.1
5.1
5.4
4.6
5.3
5.9
2.7
2.7
2.5
3.5
3.4
9.0
8.6
7.8
7.6
7.4
SE of the mean
2003
2008
2009
2010
2011
1.04
1.86
1.23
1.04
0.99
1.10
0.54
0.51
0.63
0.46
0.54
0.69
0.44
0.47
0.47
0.56
0.60
0.48
0.47
0.44
0.43
0.44
0.50
0.42
0.43
0.42
0.51
0.34
0.41
0.43
0.27
0.36
0.40
0.39
0.33
0.31
0.34
0.24
0.24
0.23
512
402
500
447
471
655
487
571
555
577
805
614
693
641
670
685
585
700
678
707
599
502
590
569
591
491
382
450
429
448
467
348
408
391
411
4215
3319
3912
3711
3874
372
305
376
341
338
598
450
580
564
559
879
646
779
677
709
788
627
733
759
801
774
630
735
698
734
579
513
550
571
595
492
4482
408
3579
479
4232
466
4076
484
4220
Continued…
Women
Bases (weighted):
Women 2003
Women 2008
Women 2009
Women 2010
Women 2011
Bases (unweighted):
Women 2003
Women 2008
Women 2009
Women 2010
Women 2011
86
Table 3.1
- Continued
Aged 16 and over
Alcohol units per
weeka
2003, 2008, 2009, 2010, 2011
Age
Total
16-24
25-34
35-44
45-54
55-64
65-74
75+
%
%
%
%
%
%
%
%
Non-drinker
2003
2008
2009
2010
2011
10
7
10
13
14
8
10
8
12
11
8
10
11
11
10
7
9
10
11
12
11
10
12
15
14
16
18
19
18
21
27
25
28
31
29
11
12
13
15
14
Moderate
2003
2008
2009
2010
2011
59
54
60
61
60
60
66
66
64
69
61
64
67
66
68
60
63
64
65
63
62
65
65
62
65
65
64
64
63
59
62
68
65
56
61
61
63
64
63
64
Hazardous/Harmful
2003
2008
2009
2010
2011
31
39
30
26
25
32
24
26
24
20
31
26
22
23
22
34
28
26
24
25
27
25
23
23
21
19
18
16
19
20
11
8
7
13
10
28
25
23
22
21
Mean units per week
2003
2008
2009
2010
2011
14.6
19.9
17.3
13.1
13.2
15.6
13.0
12.6
12.4
10.2
16.4
14.4
12.6
12.7
11.5
17.0
13.9
14.3
12.3
12.7
14.2
12.5
11.9
11.8
11.6
9.7
9.3
9.5
9.7
9.9
6.1
4.8
4.9
6.4
5.9
14.1
13.1
12.4
11.6
11.1
SE of the mean
2003
2008
2009
2010
2011
0.81
1.39
2.24
0.93
1.01
0.86
0.78
0.63
0.80
0.49
0.94
0.81
0.70
0.87
0.61
0.93
0.65
0.81
0.48
0.53
0.72
0.63
0.53
0.60
0.64
0.51
0.52
0.56
0.59
0.53
0.51
0.37
0.42
0.55
0.45
0.36
0.34
0.40
0.29
0.27
All adults
Bases (weighted):
All adults 2003
1058
1252
1560
1350
1166
895
725
8006
All adults 2008
807
962
1174
1134
979
708
566
6330
All adults 2009
1014
1138
1327
1352
1153
836
668
7488
All adults 2010
906
1113
1222
1304
1109
802
642
7098
All adults 2011
968
1155
1280
1358
1152
836
675
7425
Bases (unweighted):
All adults 2003
687
1044
1605
1398
1405
1086
815
8040
All adults 2008
525
762
1102
1157
1153
964
712
6375
All adults 2009
637
986
1329
1337
1310
1067
842
7508
All adults 2010
585
981
1151
1321
1251
1057
794
7140
All adults 2011
625
954
1222
1394
1333
1105
826
7459
a Non-drinker: no units per week; Moderate: >0 units and up to 21 units for men / 14 units for women;
hazardous/harmful: more than 21 units for men / 14 units for women.
87
Table 3.2
Estimated usual weekly alcohol consumption level and mean units by
drinking category, 2008-2011 combined, (age-standardised), by
equivalised household income quintile and sex
Aged 16 and over
2008-2011 combined
a
Drinking category / Alcohol
units per week
Equivalised annual household income quintile
1st
(highest)
nd
2
3
4
th
5th
(lowest)
rd
%
%
%
%
%
Non drinker
Moderate
Hazardous/Harmful
5
61
35
7
65
28
10
61
28
15
63
22
21
56
24
Mean units
Moderate
Hazardous/Harmful
9.0
39.1
8.3
38.6
7.4
42.9
7.5
44.3
6.8
61.6
SE of the mean
Moderate
Hazardous/Harmful
0.20
2.22
0.20
0.85
0.19
1.82
0.25
1.80
0.26
3.23
Non drinker
Moderate
Hazardous/Harmful
8
65
27
10
69
21
14
68
18
18
66
16
24
62
14
Mean units
Moderate
Hazardous/Harmful
5.1
26.0
4.5
26.1
4.1
26.4
3.8
26.4
3.2
37.2
SE of the mean
Moderate
Hazardous/Harmful
0.12
0.75
0.11
0.66
0.10
0.88
0.11
0.92
0.11
1.98
2069
310
1304
454
2490
440
1650
399
1746
364
971
411
2259
549
1399
311
Men
Women
Bases (weighted):
Men
2929
2625
2311
Men: non-drinker
132
177
232
Men: moderate
1772
1704
1421
Men: hazardous/harmful
1024
744
658
Women
2677
2644
2479
Women: non-drinker
215
258
336
Women: moderate
1732
1837
1697
Women: hazardous/harmful
730
549
445
Bases (unweighted):
Men
2516
2328
2149
Men: non-drinker
109
151
238
Men: moderate
1554
1523
1356
Men: hazardous/harmful
853
654
555
Women
2713
2827
2745
Women: non-drinker
172
266
407
Women: moderate
1796
1982
1870
Women: hazardous/harmful
745
579
468
a Non-drinker: no units per week; Moderate: >0 units and up to 21 units for men / 14
hazardous/harmful: more than 21 units for men / 14 units for women.
88
2063
1655
316
352
1343
920
404
383
2859
2520
583
642
1885
1577
391
301
units for women;
Table 3.3
Estimated usual weekly alcohol consumption level and mean units by
drinking category, 2008-2011 combined, (age-standardised), by Scottish
Index of Multiple Deprivation and sex
Aged 16 and over
2008-2011 combined
a
Drinking category /
Alcohol units per week
Scottish Index of Multiple Deprivation
5th
(least
deprived)
SIMD 85/15
nd
1st
(most
deprived)
85% least
deprived
15%
most
deprived
%
%
%
%
%
9
63
28
10
64
27
14
61
26
16
58
26
10
63
27
17
57
26
8.7
36.7
8.0
40.7
7.7
43.1
7.5
43.6
7.6
52.8
7.9
41.1
7.7
54.9
0.20
0.85
0.18
1.09
0.19
2.74
0.21
1.55
0.21
2.17
0.09
0.74
0.24
2.69
Non drinker
Moderate
Hazardous/Harmful
10
66
24
12
68
20
15
66
19
19
66
16
24
61
15
14
66
19
24
61
14
Mean units
Moderate
Hazardous/Harmful
4.7
24.9
4.2
26.7
4.2
28.0
3.8
27.8
3.7
30.6
4.2
26.9
3.7
30.6
SE of the mean
Moderate
Hazardous/Harmful
0.10
0.53
0.09
0.92
0.10
1.01
0.10
0.89
0.10
1.25
0.05
0.42
0.11
1.36
11594
1154
7259
3181
12606
1820
8333
2453
1936
330
1107
499
2206
535
1355
316
10591
1120
6708
2763
13634
2080
9082
2472
units for
1784
310
1015
459
2474
596
1526
352
th
rd
4
3
%
%
Non drinker
Moderate
Hazardous/Harmful
7
64
29
Mean units
Moderate
Hazardous/Harmful
SE of the mean
Moderate
Hazardous/Harmful
Men
Women
2
Bases (weighted):
Men
2686
2955
2664
2656
2567
Men: non-drinker
190
256
255
363
417
Men: moderate
1706
1873
1701
1609
1483
Men: hazardous/harmful
790
826
708
684
667
Women
2905
3058
2918
2963
2968
Women: non-drinker
295
379
432
550
706
Women: moderate
1923
2064
1934
1952
1820
Women: hazardous/harmful
687
615
552
461
443
Bases (weighted):
Men
2214
2856
2652
2337
2316
Men: non-drinker
157
259
293
333
388
Men: moderate
1415
1845
1701
1431
1331
Men: hazardous/harmful
642
752
658
573
597
Women
2819
3574
3398
3095
3222
Women: non-drinker
286
447
558
608
777
Women: moderate
1881
2456
2262
2032
1977
Women: hazardous/harmful
652
671
578
455
468
a Non-drinker: no units per week; Moderate: >0 units and up to 21 units for men / 14
women; hazardous/harmful: more than 21 units for men / 14 units for women.
89
Table 3.4
Units consumed on heaviest drinking day in past week, 2003, 2008, 2009,
2010, 2011, by age and sex
Aged 16 and over
Alcohol units per day
2003, 2008, 2009, 2010, 2011
Age
Total
16-24
25-34
35-44
45-54
55-64
65-74
75+
%
%
%
%
%
%
%
%
Consumed over 4 units
2003
2008
2009
2010
2011
51
49
48
43
42
54
53
53
54
45
51
48
48
47
47
49
50
49
49
45
43
42
44
41
42
29
29
35
30
34
16
14
12
15
14
45
44
44
43
41
Consumed over 8 units
2003
2008
2009
2010
2011
39
37
35
33
32
40
37
36
38
31
33
30
30
30
30
30
31
28
29
28
24
21
23
22
20
11
11
12
12
12
5
2
2
3
3
29
27
26
26
25
Mean units
2003
2008
2009
2010
2011
8.1
8.6
7.4
7.6
7.1
8.2
7.8
7.6
8.1
6.5
7.6
7.1
6.4
6.4
6.1
6.6
6.7
6.1
6.4
6.1
5.5
5.0
5.5
5.1
4.9
3.5
3.4
3.7
3.5
3.6
2.2
1.8
1.8
2.0
1.9
6.5
6.2
5.9
6.0
5.5
0.69
0.77
0.66
1.02
0.78
0.44
0.53
0.50
0.56
0.50
0.41
0.49
0.34
0.39
0.35
0.31
0.37
0.30
0.36
0.31
0.26
0.28
0.37
0.28
0.25
0.20
0.21
0.20
0.22
0.19
0.19
0.15
0.13
0.16
0.15
0.18
0.19
0.17
0.21
0.15
Consumed over 3 units
2003
2008
2009
2010
2011
46
54
41
40
40
50
47
44
39
39
45
45
44
41
44
46
41
44
44
44
32
34
31
30
31
19
15
17
18
20
6
6
5
5
6
37
36
34
33
34
Consumed over 6 units
2003
2008
2009
2010
2011
35
41
27
28
29
31
27
28
23
23
23
22
23
21
23
21
17
17
20
21
11
11
10
9
9
3
2
3
3
5
0
1
1
1
0
19
18
17
16
17
Mean units
2003
2008
2009
2010
2011
5.7
7.1
4.5
4.7
4.5
5.1
4.6
4.4
3.8
4.0
4.1
3.8
3.8
3.7
3.9
3.9
3.4
3.7
3.8
3.6
2.6
2.7
2.5
2.5
2.6
1.6
1.4
1.5
1.6
1.8
Men
SE of the mean
2003
2008
2009
2010
2011
Women
90
0.7
3.6
0.7
3.5
0.7
3.2
0.8
3.1
0.8
3.2
Continued…
Table 3.4
- Continued
Aged 16 and over
2003, 2008, 2009, 2010, 2011
Alcohol units per day Age
Total
16-24
25-34
35-44
45-54
55-64
65-74
75+
%
%
%
%
%
%
%
%
0.45
0.84
0.42
0.45
0.43
0.27
0.30
0.26
0.25
0.27
0.18
0.18
0.17
0.18
0.18
0.17
0.18
0.23
0.16
0.15
0.14
0.13
0.12
0.13
0.16
0.10
0.10
0.10
0.10
0.11
0.06
0.07
0.08
0.10
0.07
0.10
0.14
0.09
0.09
0.09
Consumed over 3/4
units
2003
2008
2009
2010
2011
49
52
44
42
41
52
50
48
46
42
48
46
46
44
46
48
46
46
46
45
37
38
38
35
36
23
22
26
23
27
10
9
8
9
9
41
40
39
38
37
Consumed over 6/8
units
2003
2008
2009
2010
2011
37
39
31
31
31
35
32
32
30
27
28
26
26
25
26
26
24
23
25
24
17
16
16
15
15
7
6
7
7
9
2
1
1
2
1
24
22
21
21
20
Mean units
2003
2008
2009
2010
2011
7.0
7.8
6.0
6.2
5.9
6.6
6.2
6.0
5.9
5.3
5.8
5.4
5.0
4.9
4.9
5.2
5.0
4.9
5.0
4.8
4.0
3.8
4.0
3.8
3.7
2.5
2.3
2.5
2.5
2.6
1.3
1.1
1.1
1.3
1.3
4.9
4.8
4.5
4.5
4.3
0.43
0.56
0.42
0.57
0.48
0.28
0.32
0.30
0.33
0.30
0.23
0.28
0.19
0.22
0.21
0.19
0.22
0.21
0.21
0.18
0.17
0.17
0.20
0.17
0.16
0.12
0.13
0.12
0.13
0.12
SE of the mean
2003
2008
2009
2010
2011
All adults
SE of the mean
2003
2008
2009
2010
2011
91
0.09
0.12
0.08
0.13
0.08
0.10
0.09
0.12
0.08
0.10
Continued…
Table 3.4
- Continued
Aged 16 and over
2003, 2008, 2009, 2010, 2011
Alcohol units per day Age
Bases (weighted):
Men 2003
Men 2008
Men 2009
Men 2010
Men 2011
Women 2003
Women 2008
Women 2009
Women 2010
Women 2011
All adults 2003
All adults 2008
All adults 2009
All adults 2010
All adults 2011
Bases (unweighted):
Men 2003
Men 2008
Men 2009
Men 2010
Men 2011
Women 2003
Women 2008
Women 2009
Women 2010
Women 2011
All adults 2003
All adults 2008
All adults 2009
All adults 2010
All adults 2011
Total
16-24
25-34
35-44
45-54
55-64
65-74
75+
563
403
481
446
489
543
400
459
439
448
1106
803
940
885
937
601
476
561
559
581
657
486
568
556
579
1258
962
1128
1115
1160
758
562
629
584
611
806
616
692
643
671
1564
1178
1320
1227
1282
666
552
648
629
652
689
586
699
678
708
1355
1138
1347
1307
1360
568
478
558
542
564
601
502
589
569
593
1168
980
1147
1111
1157
405
326
386
374
386
491
382
450
432
448
896
708
836
806
835
259
217
259
253
265
467
348
408
392
413
726
565
667
646
678
3819
3015
3521
3386
3549
4254
3320
3865
3710
3860
8073
6335
7385
7096
7409
325
221
247
237
283
388
303
353
340
325
713
524
600
577
608
449
313
402
419
398
599
450
577
565
561
1048
763
979
984
959
729
458
546
475
514
880
648
777
680
710
1609
1106
1323
1155
1224
612
532
601
563
595
793
627
732
759
802
1405
1159
1333
1322
1397
632
524
570
554
601
776
630
734
698
737
1408
1154
1304
1252
1338
508
450
516
488
508
579
513
550
574
596
1087
963
1066
1062
1104
325
303
362
330
343
492
408
479
467
486
817
711
841
797
829
3580
2801
3244
3066
3242
4507
3579
4202
4083
4217
8087
6380
7446
7149
7459
92
Table 3.5
Adherence to weekly and daily drinking advice, 2003, 2008, 2009, 2010,
2011, by age and sex
Aged 16 and over
Adherence to weekly and
daily drinking advice
2003, 2008, 2009, 2010, 2011
Age
Total
16-24
25-34
35-44
45-54
55-64
65-74
75+
%
%
%
%
%
%
%
%
8
8
7
14
13
4
4
3
8
4
4
3
5
3
3
1
3
1
4
3
4
2
2
3
4
3
4
3
3
4
10
7
7
6
5
4
4
4
6
5
2
1
2
1
2
3
5
5
2
5
3
7
5
7
4
4
6
6
7
6
3
6
7
9
8
7
11
11
10
11
10
14
12
15
13
4
6
6
7
6
Drinks within government
guidelinesa
2003
2008
2009
2010
2011
33
33
38
35
36
34
33
36
33
40
34
36
39
37
41
37
37
38
37
40
42
41
41
40
42
52
46
45
47
46
53
59
60
54
62
39
39
41
39
42
Drinks outwith government
guidelinesb
2003
2008
2009
2010
2011
57
58
52
50
49
59
57
56
57
51
59
54
52
52
51
58
55
55
52
51
51
50
50
48
46
39
39
41
40
40
27
21
20
25
20
53
51
49
49
46
9
5
9
10
12
5
5
5
7
7
4
6
5
5
7
3
4
6
5
6
8
4
7
7
6
13
10
12
11
11
25
20
21
24
19
9
7
8
9
9
1
2
3
3
3
3
6
4
6
5
4
4
8
6
5
4
6
6
7
9
7
7
8
10
10
8
10
12
11
14
Men
Never drunk alcohol
2003
2008
2009
2010
2011
Ex drinker
2003
2008
2009
2010
2011
Women
Never drunk alcohol
2003
2008
2009
2010
2011
Ex drinker
2003
2008
2009
2010
2011
93
6
5
7
6
12
7
14
8
17
9
Continued…
Table 3.5
- Continued
Aged 16 and over
Adherence to weekly and
daily drinking advice
2003, 2008, 2009, 2010, 2011
Age
Total
16-24
25-34
35-44
45-54
55-64
65-74
75+
Drinks within government
guidelinesa
2003
2008
2009
2010
2011
%
%
%
%
%
%
%
%
41
32
43
39
39
37
39
43
42
46
40
41
41
43
39
40
45
41
40
38
49
52
49
48
49
55
59
55
56
48
60
64
60
51
53
45
47
47
45
44
Drinks outwith government
b
guidelines
2003
2008
2009
2010
2011
49
61
46
47
46
55
49
48
44
42
51
49
46
45
49
52
45
47
49
48
37
38
37
35
35
24
21
21
22
26
9
8
6
12
11
42
40
38
38
38
8
6
8
12
13
5
5
4
8
6
4
5
5
4
5
2
3
4
4
5
6
3
5
5
5
9
7
8
7
8
20
15
16
17
14
7
6
6
7
7
2
2
2
2
3
3
5
4
4
5
4
5
6
7
5
4
6
6
7
7
5
6
7
10
9
7
11
11
11
13
8
10
12
14
15
5
6
7
7
8
Drinks within government
guidelinesa
2003
2008
2009
2010
2011
37
33
41
37
37
35
36
40
38
43
37
39
40
40
40
38
41
40
38
39
45
46
45
44
46
53
53
51
52
47
57
62
60
52
57
42
43
44
42
43
Drinks outwith government
b
guidelines
2003
2008
2009
2010
2011
53
60
49
49
47
57
53
52
50
47
55
51
49
49
50
55
50
51
50
49
44
44
43
41
40
31
29
30
30
32
All adults
Never drunk alcohol
2003
2008
2009
2010
2011
Ex drinker
2003
2008
2009
2010
2011
94
15
47
13
45
12
43
17
43
15
42
Continued…
Table 3.5
- Continued
Aged 16 and over
Adherence to weekly and
daily drinking advice
2003, 2008, 2009, 2010, 2011
Age
16-24
Total
25-34
35-44
45-54
55-64
65-74
75+
Bases (weighted):
Men 2003
532
596
754
663
563
404
257
3769
Men 2008
379
473
559
548
478
325
217
2981
Men 2009
480
561
629
648
558
386
257
3519
Men 2010
430
558
581
623
539
373
251
3355
Men 2011
470
578
609
651
562
386
264
3520
Women 2003
502
655
803
685
599
491
467
4203
Women 2008
380
486
614
584
502
382
348
3296
Women 2009
457
568
691
699
589
450
408
3862
Women 2010
412
554
641
678
569
429
391
3675
Women 2011
425
577
670
707
590
448
411
3827
All adults 2003
1035
1252
1557
1348
1162
895
724
7972
All adults 2008
759
959
1174
1133
979
707
565
6277
All adults 2009
937
1128
1320
1347
1147
836
666
7381
All adults 2010
842
1112
1222
1302
1108
802
642
7030
All adults 2011
895
1155
1279
1358
1151
834
675
7347
Bases (unweighted):
Men 2003
306
446
725
609
628
507
322
3543
Men 2008
209
310
455
529
523
449
303
2778
Men 2009
246
402
546
601
570
516
361
3242
Men 2010
227
417
473
559
552
486
328
3042
Men 2011
273
395
512
593
599
508
342
3222
Women 2003
362
598
877
787
774
579
492
4469
Women 2008
288
449
646
626
630
513
408
3560
Women 2009
351
577
776
732
734
550
479
4199
Women 2010
322
563
677
759
697
571
466
4055
Women 2011
311
559
709
801
733
595
484
4192
All adults 2003
668
1044
1602
1396
1402
1086
814
8012
All adults 2008
497
759
1101
1155
1153
962
711
6338
All adults 2009
597
979
1322
1333
1304
1066
840
7441
All adults 2010
549
980
1150
1318
1249
1057
794
7097
All adults 2011
584
954
1221
1394
1332
1103
826
7414
a Drank no more than 4 units (men) or 3 units (women) on heaviest drinking day, and drank no more
than 21 units (men) or 14 units (women) in usual week.
b Drank more than 4 units (men) or 3 units (women) on heaviest drinking day, and/or drank more than
21 units (men) or 14 units (women) in usual week.
95
Table 3.6
Number of days on which drank alcohol in the past week, 1998, 2003, 2008, 2009,
2010, 2011, by age and sex
Aged 16 and over and drank alcohol in past week
1998, 2003, 2008, 2009, 2010, 2011
% who drank on >5
Age
days / mean number of
days drank alcohol in
16-24
last week
25-34
35-44
45-54
55-64
65-74
75+
%
%
%
%
%
%
%
%
%
5
6
5
2
4
4
10
14
7
6
5
6
15
16
16
12
11
7
22
22
18
12
12
13
28
27
25
19
19
19
34
32
30
25
32
25
n/a
51
33
33
42
40
17
19
16
12
13
12
n/a
20
17
14
15
13
2.4
2.5
2.4
2.2
2.2
2.2
2.8
2.9
2.5
2.3
2.4
2.3
3.0
3.0
3.0
2.7
2.6
2.5
3.4
3.5
3.3
2.9
2.8
2.9
3.6
3.7
3.6
3.4
3.2
3.2
3.8
3.8
3.8
3.5
3.8
3.6
n/a
4.7
3.8
3.7
4.2
4.1
3.1
3.2
3.1
2.8
2.8
2.8
n/a
3.3
3.1
2.9
2.9
2.8
0.09
0.12
0.14
0.11
0.15
0.12
0.08
0.11
0.12
0.09
0.12
0.11
0.09
0.09
0.12
0.10
0.11
0.10
0.10
0.11
0.10
0.10
0.09
0.10
0.12
0.10
0.12
0.11
0.12
0.11
0.13
0.13
0.14
0.12
0.14
0.12
n/a
0.18
0.20
0.19
0.20
0.20
0.04
0.05
0.06
0.04
0.05
0.05
n/a
0.05
0.05
0.04
0.05
0.05
5
3
5
3
1
3
6
6
6
3
6
3
11
11
5
4
6
6
11
15
13
10
8
8
15
18
14
16
13
12
22
24
20
14
20
20
n/a
30
22
22
37
33
10
12
10
8
8
8
n/a
13
10
9
10
10
2.0
2.1
2.3
1.7
1.7
1.8
2.1
2.4
2.1
2.1
2.1
2.0
2.6
2.7
2.3
2.3
2.3
2.3
2.6
3.0
2.8
2.6
2.6
2.6
2.8
3.1
2.7
3.0
2.7
2.8
2.9
3.1
3.0
2.8
2.9
3.1
n/a
3.5
3.0
3.2
3.7
3.6
2.4
2.7
2.5
2.4
2.4
2.4
n/a
2.7
2.5
2.5
2.5
2.5
0.09
0.11
0.17
0.10
0.09
0.11
0.07
0.09
0.10
0.08
0.09
0.09
0.08
0.09
0.08
0.07
0.08
0.07
0.09
0.09
0.10
0.09
0.09
0.08
0.11
0.11
0.12
0.11
0.11
0.11
0.14
0.15
0.16
0.13
0.14
0.13
n/a
0.23
0.22
0.21
0.21
0.20
Men
Drank on >5 days
1998
2003
2008
2009
2010
2011
Mean number of days
1998
2003
2008
2009
2010
2011
SE of the mean
1998
2003
2008
2009
2010
2011
Total
16+
Total
16-74
Women
Drank on >5 days
1998
2003
2008
2009
2010
2011
Mean number of days
1998
2003
2008
2009
2010
2011
SE of the mean
1998
2003
2008
2009
2010
2011
96
0.04
n/a
0.05
0.05
0.05
0.05
0.04
0.04
0.04
0.04
0.04
0.05
Continued…
Table 3.6
- Continued
Aged 16 and over and drank alcohol in past week
1998, 2003, 2008, 2009, 2010, 2011
% who drank on >5
Age
days / mean number of
days drank alcohol in
16-24
last week
25-34
35-44
45-54
55-64
65-74
75+
%
%
%
%
%
%
%
%
%
5
5
5
2
3
4
8
10
6
4
5
4
13
13
10
8
9
6
17
18
15
11
10
10
23
23
20
18
16
16
29
28
25
20
27
23
n/a
40
28
28
40
37
14
16
13
10
11
10
n/a
17
14
11
13
12
2.2
2.3
2.4
2.0
2.0
2.0
2.5
2.6
2.3
2.2
2.2
2.1
2.8
2.9
2.7
2.5
2.5
2.4
3.0
3.2
3.0
2.8
2.7
2.8
3.2
3.4
3.2
3.2
3.0
3.0
3.4
3.5
3.5
3.2
3.4
3.4
n/a
4.1
3.4
3.4
4.0
3.8
2.8
3.0
2.8
2.6
2.6
2.6
n/a
3.0
2.8
2.7
2.7
2.7
SE of the mean
1998
2003
2008
2009
2010
2011
0.07
0.10
0.11
0.08
0.10
0.08
0.05
0.08
0.08
0.07
0.08
0.08
0.06
0.07
0.08
0.06
0.08
0.07
0.07
0.08
0.08
0.07
0.07
0.07
0.08
0.09
0.09
0.09
0.09
0.09
0.10
0.11
0.12
0.10
0.12
0.10
n/a
0.17
0.16
0.16
0.16
0.15
0.03
0.04
0.04
0.03
0.04
0.04
n/a
0.04
0.04
0.03
0.04
0.04
Bases (weighted):
Men 1998
Men 2003
Men 2008
Men 2009
Men 2010
Men 2011
Women 1998
Women 2003
Women 2008
Women 2009
Women 2010
Women 2011
All adults 1998
All adults 2003
All adults 2008
All adults 2009
All adults 2010
All adults 2011
508
363
298
311
285
333
409
333
276
288
258
289
917
697
574
598
543
621
745
457
352
417
398
363
601
418
298
340
306
323
1345
875
650
757
704
686
742
564
398
443
398
438
609
513
388
431
387
411
1350
1077
786
873
785
849
625
528
419
485
448
474
515
480
379
449
451
434
1140
1008
798
934
899
908
438
432
348
421
389
389
354
340
304
347
331
335
792
772
652
768
721
724
322
276
223
267
243
255
236
237
189
217
208
215
557
512
412
484
451
470
n/a
143
123
153
145
155
n/a
152
120
128
130
145
n/a
295
242
281
275
299
3379
n/a
2619
2762
2038
2160
2344
2497
2162
2307
2251
2406
2722
n/a
2320
2472
1834
1953
2071
2199
1940
2070
2007
2152
6101
n/a
4940
5234
3871
4113
4415
4696
4102
4377
4258
4557
Continued…
All adults
Drank on >5 days
1998
2003
2008
2009
2010
2011
Mean number of days
1998
2003
2008
2009
2010
2011
Total
16+
97
Total
16-74
Table 3.6
- Continued
Aged 16 and over and drank alcohol in past week
% who drank on >5
Age
days / mean number of
days drank alcohol in
16-24
last week
Bases (unweighted):
Men 1998
Men 2003
Men 2008
Men 2009
Men 2010
Men 2011
Women 1998
Women 2003
Women 2008
Women 2009
Women 2010
Women 2011
All adults 1998
All adults 2003
All adults 2008
All adults 2009
All adults 2010
All adults 2011
278
212
159
146
152
194
310
236
204
203
188
191
588
448
363
349
340
385
1998, 2003, 2008, 2009, 2010, 2011
Total
16+
25-34
35-44
45-54
55-64
65-74
75+
584
339
233
293
291
253
624
372
274
344
300
297
1208
711
507
637
591
550
667
545
323
389
323
359
673
572
410
491
404
423
1340
1117
733
880
727
782
547
485
399
440
398
434
560
549
401
465
490
490
1107
1034
800
905
888
924
488
479
379
435
391
403
424
439
377
427
399
407
912
918
756
862
790
810
396
350
301
352
321
330
359
280
250
264
272
281
755
630
551
616
593
611
n/a
180
173
211
181
201
n/a
161
137
152
147
167
n/a
341
310
363
328
368
98
Total
16-74
2960
2410
1794
2055
1876
1973
2950
2448
1916
2194
2053
2089
5910
4858
3710
4249
3929
4062
n/a
2590
1967
2266
2057
2174
n/a
2609
2053
2346
2200
2256
n/a
5199
4020
4612
4257
4430
Table 3.7
Number of days on which drank alcohol in the past week, 2008-11
combined, (age-standardised), by equivalised household income quintile
and sex
Aged 16 and over and drank alcohol in past week
Number of days drank alcohol
2008-2011 combined
Equivalised annual household income quintile
1st
(highest)
Men
Drank on >5 days
Mean number of days
SE of the mean
Women
Drank on >5 days
Mean number of days
SE of the mean
Bases (weighted):
Men
Women
Bases (unweighted):
Men
Women
nd
2
3
4
th
5th
(lowest)
rd
%
%
%
%
%
18
3.2
0.06
14
3.0
0.06
16
2.9
0.06
13
2.7
0.07
16
2.8
0.08
15
3.0
0.06
11
2.6
0.06
9
2.4
0.05
8
2.3
0.05
8
2.1
0.06
2342
1897
1950
1705
1614
1399
1306
1288
976
937
2026
1985
1735
1825
1463
1510
1289
1382
920
997
99
Table 3.8
Number of days on which drank alcohol in the past week, 2008-11
combined, (age-standardised), by Scottish Index of Multiple Deprivation
and sex
Aged 16 and over and drank alcohol in past week
Number of days drank
alcohol
Men
Drank on >5 days
Mean number of days
SE of the mean
Women
Drank on >5 days
Mean number of days
SE of the mean
Bases (weighted):
Men
Women
Bases (unweighted):
Men
Women
2008-2011 combined
Scottish Index of Multiple Deprivation
5th
(least
deprived)
SIMD 85/15
nd
1st
(most
deprived)
85% least
deprived
15%
most
deprived
%
%
%
%
%
16
3.0
0.05
17
3.0
0.06
13
2.7
0.05
13
2.7
0.06
15
3.0
0.03
14
2.7
0.07
13
2.8
0.05
12
2.7
0.04
10
2.5
0.05
7
2.2
0.05
5
2.0
0.04
10
2.6
0.02
5
2.0
0.05
2097
2018
2157
1832
1839
1676
1719
1505
1557
1302
8219
7397
1161
949
1725
1948
2057
2126
1809
1864
1473
1510
1401
1407
7396
7789
1069
1066
th
rd
4
3
%
%
14
3.1
0.05
100
2
Smoking
Chapter 4
4 SMOKING
Shanna Dowling
SUMMARY
In 2011, 23% of all adults aged 16 and over were current smokers. The
smoking rates for men and women were similar (24% and 22% respectively).
Smoking prevalence was highest among those aged 25-34 (30%) and lowest
among over 75s (8%).
Rates of smoking among men and women aged 16-64 declined between 1995
and 2011, from 35% to 26%.
There was also a significant decline in smoking rates among all adults aged 16
and over since 2003 from 28% to 23% in 2011. The two percentage point drop
in the prevalence between 2010 and 2011 was statistically significant.
In 2011, the mean number of cigarettes smoked per day by smokers aged 16
and over was 13.8. Female smokers smoked fewer cigarettes per day on
average than male smokers (13.3 and 14.3 cigarettes respectively).
There has been a decline over time in the mean number of cigarettes smoked
per day. In 2011, 16-64 year olds smoked on average 3 fewer cigarettes per
day than they did in 1995 (from 16.7 cigarettes per day to 13.7). The figures
for all adults aged 16 and over also show a decline from 2003 (from 15.3
cigarettes per day to 13.8 cigarettes).
There was a clear association between smoking prevalence and socioeconomic classification. People living in semi-routine and routine households
were more than twice as likely as those living in managerial and professional
households to report that they smoked (36% compared with 15%). Smokers
in semi-routine and routine households also had the highest mean number of
cigarettes smoked per day (15.1 cigarettes).
For both men and women, smoking rates steadily increased as household
income decreased. People in the lowest household income quintile were
almost three times as likely as those in the highest income group to report that
they smoked cigarettes (40% compared with 14%). However, there was no
significant variation in the number of cigarettes smoked per day.
Four in ten adults living in the 20% most deprived areas in Scotland reported
smoking cigarettes compared with just one in ten of those living in the 20%
least deprived areas. The mean number of cigarettes smoked per day by
smokers also increased in line with deprivation from 12.3 cigarettes in the
least deprived quintile to 15.2 cigarettes in the most deprived group.
An estimate of the percentage of people who mis-report themselves as nonsmokers can be made by comparing self-reported smoking estimates with
cotinine levels. In 2008-2011, the under-estimation of current smoking was 3
percentage points. Mis-reporting was greatest among men aged 16-24 and 65
and over (6 percentage point difference).
The sharp decrease in non-smokers’ exposure to second-hand smoke in
public places seen in the decade between 1998 and 2008 was maintained in
2011 when 8% of non-smokers (aged 16 and over) reported being exposed to
smoke in public places. Non-smokers’ (aged 16-74) exposure to second-hand
smoke in either their own or someone else’s home fell from 31% in 1998 to
16% in 2011 for men and from 35% to 14% for women.
102
Exposure to other people’s smoke was also measured objectively using
geometric mean cotinine levels. Since 2003 there has been a significant
decline in geometric mean cotinine levels of non-smokers (from 0.40ng/ml to
0.11ng/ml) in 2010/2011. There was no change in levels between 2008/2009
and 2010/11.
The geometric mean cotinine levels of male and female non-smokers were
similar and levels did not vary significantly by age.
Deprivation was strongly associated with non-smokers’ cotinine levels. The
geometric mean cotinine level for non-smokers living in the 20% most
deprived areas in Scotland was three times that of those living in the least
deprived group (0.20ng/ml compared with 0.07ng/ml).
4.1
INTRODUCTION
The Scottish Government’s revised National Performance Framework (NPF),
published in December 2011,1 includes a new national indicator to reduce
premature mortality (deaths from all causes in those aged under 75). 2 The fact
that smoking, and its strong link to deprivation, is cited as one of the risk factors
that needs to be addressed to reduce premature mortality underlines its status
as one of Scotland’s most significant public health concerns. It has been
estimated that around 13,000 deaths a year are attributable to smoking –
around a quarter of all deaths in Scotland.3 Smoking prevalence is itself the
subject of a national indicator – reduce the percentage of adults who smoke 4 –
which is measured by the Scottish Household Survey.
The introductions to the smoking chapters in the 2008, 2009 and 2010 Scottish
Health Survey (SHeS) Reports5,6,7 provided a comprehensive overview of the
recent policy context and outlined a number of actions being taken by the
Government and NHS to help support smokers to quit, and to discourage
people from starting to smoke. These included:
The introduction of a ban on smoking in public places in 2006.
The raising of the legal age for buying tobacco from 16 to 18 in 2007.
The strategic framework set out in the 2004 publication A Breath of Fresh
Air for Scotland and the 2008 action plan Scotland’s Future is SmokeFree.
The Tobacco and Primary Medical Services (Scotland) Act 2010, which
introduced new measures specifically designed to reduce the
attractiveness and availability of tobacco to those aged under 18.
Plans to ban the display of tobacco products in shops. The
implementation was originally planned to start in large stores in April
2012, and in April 2015 for smaller stores.8 Ongoing legal disputes have
delayed its initial implementation, however the Scottish Government
remains committed to the 2015 target.9
The development of a new tobacco control strategy for Scotland, due to
be published in 2012.
In April 2012, the Department for Health in England launched a 12-week UKwide consultation outlining proposals to introduce plain packaging for cigarette
products.10,11 The consultation document was developed with the support of the
Scottish Government and the other devolved administrations in Wales and
103
Northern Ireland. A systematic review of plain packaging conducted in response
to the publication of the Department for Health in England’s Tobacco Control
Plan for England concluded “that plain packaging would reduce the
attractiveness and appeal of tobacco products, it would increase the
noticeability and effectiveness of health warnings and messages, and it would
reduce the use of design techniques that may mislead consumers about the
harmfulness of tobacco products”.12
The above policy actions to reduce the attractiveness of smoking are
complimented by a programme of support to assist existing smokers who want
to quit. For example, one of Scotland’s HEAT targets13 for the NHS focuses
specifically on smoking cessation, and includes a deprived-focused element:14
NHS Scotland to deliver universal smoking cessation services
to achieve at least 80,000 successful quits (at one month post
quit) including 48,000 in the 40% most-deprived within-Board
SIMD areas over the three years ending March 2014.
According to the most recent figures, between April and December 2011,
14,637 successful quit attempts were recorded in the SIMD target areas
described above.14 This target replaced a similar target for boards to deliver
83,975 successful quit attempts in the 2008/9-2010/11 period; 89,075 were
recorded.15
This chapter presents figures for prevalence of smoking among adults aged 16
and over and for non-smokers’ exposure to second-hand smoke. Two sources
of data are used: self-reported information and direct assessment of smoking
status and second-hand smoke exposure via saliva samples. Trends from 1995
onwards will be presented. Self-reported smoking prevalence is presented by
age, sex, National Statistics Socio-economic classification, household income
and Scottish Index of Multiple Deprivation (SIMD). Saliva-recorded secondhand smoke exposure is also presented by SIMD.
4.2
METHODS
4.2.1
Smoking questions in the 2011 Scottish Health Survey
The survey has included questions on smoking since 1995. Some small
changes were introduced to the questionnaire in 2008, as outlined in
the 20085 Report. This information is not repeated here. Instead, the
main measures and definitions used in this chapter are outlined.
Information about cigarette smoking was collected from adults aged 16
and 17 by means of a self-completion questionnaire which offered them
the privacy to answer without disclosing their smoking behaviour in front
of other household members. For adults aged 20 and over it was
collected as part of the main interview. Those aged 18 and 19, at the
interviewers’ discretion, could answer the questions either in the selfcompletion booklet or the main interview.
104
For young adults, the smoking questions in the self-completion
questionnaire focus upon:
current smoking status
frequency and pattern of current smoking
the number of cigarettes smoked by current smokers
ex-smokers’ previous smoking history
exposure to second-hand smoke.
The self-completion and main interview questions are mostly similar.
However the main interview also asked about past smoking behaviour,
desire to give-up smoking and medical advice to stop smoking.
The question about non-smokers’ exposure to second-hand smoke
covers a range of domestic and public places, including some locations
covered by the 2006 smoking ban (such as pubs). In previous reports,
people who were not exposed to smoke in any of the places asked
about were described as never being exposed to second-hand smoke.
This is not wholly accurate as they might have been exposed to smoke
in a location that was not asked about. The tables and text below have
been amended to reflect this.
4.2.2
Cotinine
Since its inception, SHeS has been collecting saliva samples to assess
people’s cotinine levels. Cotinine, a derivative of nicotine, is an
objective measure of smoking. Levels above a certain threshold
indicate that someone has smoked recently while levels below the
threshold are a measure of exposure to second-hand smoke. All those
aged 16 years and over who were visited by the nurse were asked to
provide a saliva sample in order to measure cotinine levels. The 2009
smoking chapter6 described why the cotinine threshold used to identify
smokers changed from 15ng/ml (used in the 1995-2003 reports) to
12ng/ml (used from 2008 onwards).16 To ensure comparability, all trend
data presented in this chapter use the 12ng/ml level.
The measurement of cotinine levels in the SHeS series provides an
objective cross-check on self-reported smoking behaviour, which is
known to under-estimate prevalence. Inaccuracies in reporting arise in
part from difficulties participants may experience in providing
quantitative summaries of variable behaviour patterns, but in some
cases arise from a desire to conceal the truth from other people, such
as other household members who may be present during the interview.
This study is the only data source in Scotland which can provide a
validated measure of self-reported smoking in this way.
This chapter updates the survey’s measures of cotinine last presented
in 2009.6 To increase the sample size available for analysis the data
from the 2010 and 2011 surveys have been combined, and in some
tables combined data for all four years (2008-2011) are presented.
105
4.2.3
Definitions
The tables reported in this chapter use the following classifications of
smoking status:
Current smoking status: current smokers, ex-regular smokers,
ex-occasional smokers and never smoked at all.
Mean number of cigarettes smoked by current smokers: this is
measured as per smoker per day.
4.3
TRENDS IN SMOKING PREVALENCE SINCE 1995
Self-reported smoking status rates for adults aged 16-64 from 1995 to 2011 are
presented in Table 4.1 along with rates for all adults aged 16 and over since
2003. Between 1995 and 2008 smoking prevalence among adults aged 16-64
declined from 35% to 29%. The rates did not change much in 2009 and 2010
(28%) but significantly decreased in 2011 (26%) This pattern of an overall
decline among 16-64 year olds with a levelling out in more recent years was
evident among both men and women and across all age groups. The decline in
smoking rates since 1995 coincided with a gradual increase in the proportion of
16-64 year olds reporting that they had never smoked or had never smoked
regularly (49% in 1995 and 57% in 2011). There was little change in the
proportion of people describing themselves as ex-regular smokers between
1995 and 2011 (17%-19%).
There was also a decline in the mean number of cigarettes smoked per day by
smokers (from 16.7 cigarettes per day to 13.7) between 1995 and 2011. This
reduction was more apparent among men (18.1 cigarettes per day in 1995 to
14.2 in 2011) than women (15.4 and 13.2 respectively).
The trend in smoking prevalence for all adults (aged 16 and over) since 2003
was similar to that discussed above for those aged 16-64. The proportion of all
adults aged 16 and over who smoked was 28% in 2003, ranged from 25%-26%
between 2008 and 2010 and was 23% in 2011. The decline between 2010 and
2011 was statistically significant. Over this same period the proportion of adults
who had never smoked or had never smoked regularly increased from 50% to
55%. Among smokers, there was a significant decline in the mean number of
cigarettes smoked per day between 2003 and 2011 (from 15.3 cigarettes to
13.8).
Table 4.1
4.4
SMOKING PREVALENCE IN 2011
4.4.1
Smoking prevalence, by age and sex
23% of all adults aged 16 and over reported smoking cigarettes in 2011
(24% of men and 22% of women). A similar proportion (22%) reported
that they used to smoke regularly while over half (55%) had either never
smoked at all or used to smoke but not regularly. This suggests that
significant progress is being made on the National indicator to reduce
the percentage of adults who smoke.1,17 Progress towards the indicator
106
is being monitored via the Scottish Household Survey which had a
smoking estimate of 23.3% in 2011. While there was no significant
difference between the smoking rate for men and women, women were
more likely to report having never smoked or never smoked regularly
(57% compared with 52%).
As noted in previous SHeS reports,5,7 and shown in Table 4.1 there
were some notable variations in cigarette smoking status by age.
Smoking prevalence was highest among those aged 25-34 (30%) and
lowest among those aged 65-74 (15%) and 75 and over (8%). Rates for
the remaining age groups were very similar (ranging from 25% to 26%).
The overall pattern of declining prevalence in the older age groups was
true for both men and women but with slightly different patterning. The
pattern for men was similar to that seen for all adults – a peak in
smoking rates among those aged 25-34 (34%), followed by a steady
decline to 8% among those aged 75 and over. In contrast, the rates
among women under the age of 65 were very similar (ranging between
25%-27%) with the drop occurring in the oldest two age groups (15%
aged 65-74 and 8% aged 75 and over).
The proportion of people describing themselves as an ex-regular
smoker increased with age (from 4% for 16-24 year olds to 39% for
those aged 65-74 and over). This increase was coupled with a decline
by age in the proportions reporting that they had never smoked or had
never smoked regularly (from 70% for 16-24 year olds to 46% for those
aged 65-74 before rising slightly to 53% for those aged 75 and over).
Both these patterns were more pronounced for men than for women.
In 2011 the mean number of cigarettes smoked per day was
significantly higher for men than for women (14.3 compared with 13.3).
The number of cigarettes smoked per day was lowest among 16-24
year olds (10.6 cigarettes) and increased gradually to a peak of 16.7
cigarettes for those aged 45-64 before declining in the oldest age
groups (12.6-15.3 cigarettes). The consumption patterns for male and
female smokers were very similar with men aged 55-64 (18.7) and
women aged 45-54 (16.3) smoking the most cigarettes per day.
Table 4.1
4.4.2
Smoking prevalence, 2011, (age-standardised), by sociodemographic group
Tables 4.2 to 4.4 present self-reported smoking behaviour by socioeconomic classification (NS-SEC of the household reference person),
equivalised household income and the Scottish Index of Multiple
Deprivation (SIMD) for 2011 (descriptions of each of these measures
are available in the Glossary at the end of this volume). To ensure that
the comparisons presented in this section are not confounded by the
different age profiles of the sub-groups, the data have been agestandardised (for a description of age-standardisation please refer to
the Glossary). On the whole, the differences between observed and
age-standardised percentages are small. Therefore, the percentages
and means presented are the standardised ones only.
107
Socio-economic Classification (NS-SEC)
As was the case when these data were last analysed in 2008,5 in 2011
there was a significant association between NS-SEC and smoking
levels for both men and women.
The smoking rate of those in semi-routine and routine households was
more than double that of those in managerial and professional
households (36% compared with 15%). Rates for the intervening
groups varied from 17%-27%. This pattern by socio-economic group
was similar for men and women. People living in lower-supervisory and
technical and semi-routine and routine households were less likely than
others to report that they had either never smoked or had never smoked
regularly (49% and 42% respectively compared with 58%-64% for the
other groups). The proportion of people describing themselves as an
ex-regular cigarette smoker did vary a little by NS-SEC but with no
obvious pattern.
Among smokers, the mean number of cigarettes smoked per day also
varied by NS-SEC and followed a similar pattern to that of smoking
prevalence. Those in semi-routine and routine households smoked
more cigarettes per day than those in managerial and professional and
intermediate households (15.1 cigarettes compared with 12.4
cigarettes). Male smokers from small employers and own account
worker households and female smokers from semi-routine and routine
households had the highest daily consumption of cigarettes (16.0 and
14.6 cigarettes respectively).
Figure 4A, Table 4.2
Figure 4A
Current cigarette smoking (age-standardised), by NS-SEC of household reference
person, and mean cigarettes per current smoker per day, by sex, 2011
18
50
Percent
14
12
30
10
8
20
6
4
10
Mean no. cigarettes
16
40
2
0
0
Managerial and
professional
Intermediate
Small employers Lower suervisory Semi-routine and
and own account and technical
routine
workers
NS-SEC of household reference person
Men
Women
Men - mean no. cigarettes
Women - mean no. cigarettes
Equivalised household income
The significant association between self-reported smoking behaviour
and equivalised household income is shown in Table 4.3 and Figure 4B.
108
For both men and women the smoking rate steadily increased in line
with decreasing household income. People in the lowest household
income quintile were almost three times as likely as those in the highest
quintile to report that they currently smoked cigarettes (40% compared
with 14%). The increase in prevalence by income coincided with a
decrease in the proportions reporting that they had either never smoked
or had never smoked regularly (65% in the highest income quintile
compared with 41% in the lowest income group). The proportion of exregular smokers varied a little across income groups but with no
obvious pattern. While smoking rates varied according to household
income, for male and female smokers there was no significant variation
in the mean number of cigarettes smoked per day across income
groups.
Figure 4B, Table 4.3
Figure 4B
Current cigarette smoking (age-standardised), by equivalised income quintile, and
mean cigarettes per current smoker per day, by sex, 2011
50
18
Percent
14
12
30
10
8
20
6
4
10
Mean no. cigarettes
16
40
2
0
0
Highest
2nd
3rd
4th
Lowest
Income quintile
Men
Women
Men - mean no. cigarettes
Women - mean no. cigarettes
Scottish Index of Multiple Deprivation (SIMD)
Two measures of SIMD are being used throughout this report. The first,
which uses quintiles, enables comparisons to be drawn between the
most and least deprived 20% of areas and the intermediate quintiles.
The second contrasts the most deprived 15% of areas with the rest of
Scotland (described in the tables as the “85% least deprived areas”).
As noted in the 20085 SHeS report and shown in Table 4.4 and Figure
4C, current smoking levels varied significantly according to area level
deprivation. Four in ten adults (40%) living in the most deprived quintile
were current smokers compared with just one in ten (11%) in the least
deprived quintile. The pattern was slightly more pronounced for men
with those living in the most deprived quintile four times as likely as
those living the least deprived quintile to smoke (43% and 11%
respectively). The equivalent figures for women were 38% and 11%.
Perhaps unsurprisingly, the increase in smoking prevalence as
deprivation increased corresponded with a decrease in the proportion of
men and women reporting that they had never smoked or had never
109
smoked regularly. Two-thirds (67%) of those living in the least deprived
quintile reported this compared with 39% of those in the most deprived
quintile. Overall, there was little variation by deprivation in the
proportion of adults who were ex-regular cigarette smokers although
men in the most deprived quintile were less likely to report this than
men in other areas (19% compared with 24%-25%).
The mean number of cigarettes smoked per smoker per day also
increased in line with deprivation (12.3 cigarettes in the least deprived
quintile compared with 15.2 for those in the most deprived). This was
true for both male and female smokers but with slightly different
patterning for both. For women, consumption was highest among those
in the most deprived quintile but was fairly constant across the other
groups (14.9 compared with 12.0-13.1). For men however, the largest
difference occurred between the least deprived quintile and those living
elsewhere (12.5 compared with 14.0-15.4).
In line with the findings across the quintiles, smoking prevalence among
those living in the 15% most deprived areas was more than double that
for the rest of Scotland (42% compared with 20%). This difference was
particularly pronounced for men (45% compared with 21%). While there
was no difference in proportion of people describing themselves as exregular smokers, those living in the 15% most deprived areas of
Scotland were much less likely than those living elsewhere to report
that they had never smoked or had never smoked regularly (38%
compared with 58%).
Among smokers, those living in the 15% most deprived areas smoked
the most cigarettes per day. This was particularly apparent for female
smokers who smoked on average 3 cigarettes more per day than those
living in the remaining 85% of areas in Scotland (15.5 cigarettes
compared with 12.5 cigarettes).
Figure 4C, Table 4.4
Figure 4C
Current cigarette smoking (age-standardised), by Scottish Index of Multiple
Deprivation quintile, and mean cigarettes per current smoker per day, by sex, 2011
50
18
Percent
14
12
30
10
8
20
6
4
10
2
0
0
Least deprived
4th
3rd
2nd
Most deprived
SIMD quintile
Men
Women
Men - mean no. cigarettes
110
Women - mean no. cigarettes
Mean no. cigarettes
16
40
4.4.3
Cotinine-adjusted cigarette smoking status, by age and sex
The prevalence of smoking among adults before and after adjustment
for saliva cotinine level is shown in Table 4.5. Note that the figures
presented in this table are based on the sub-sample of participants who
were eligible for a nurse visit and who provided a valid saliva sample.
As the sample size is smaller than for the main survey interview, the
figures presented here are based on combined data from the 2008 to
2011 surveys, so the self-reported estimates differ slightly to those in
Table 4.1.
As discussed in Section 4.2.2, self-reported non-smokers with a
cotinine level of 12ng/ml or above are very likely to be recent and/or
regular smokers who have not disclosed their true smoking status in the
main interview. The adjusted prevalence was calculated by classifying
people as smokers if their cotinine level was 12ng/ml or above.
However, the overall smoking prevalence for all adults eligible for the
nurse visit, and for those who provided a valid cotinine sample differed
as people who reported that they smoked were less likely than nonsmokers to have participated in the nurse visit and/or provide a saliva
sample. To analyse the adjusted smoking prevalence, the sub-sample
of those with a valid saliva cotinine measurement was weighted back to
the smoking profile of all adults who were eligible to take part in the
nurse visit by age and sex, to correct for this bias in response.
In the 2008-2011 period, 24% of adults (24% of men and 23% of
women) aged 16 and over reported being a current cigarette smoker.
The adjusted rates, validated by participant cotinine levels, were 27%
for all adults, 28% for men and 26% for women. This gap of three
percentage points between self-reported smoking status and the
adjusted smoking prevalence is consistent with findings from the 2003
and 2009 reports.6,18 As shown in Table 4.5, the gap between the selfreported and validated estimates were greatest for men aged 16-24 and
65 and over (6 percentage point difference) and women aged 35-44 (4
percentage point difference).
Table 4.5
4.5
EXPOSURE TO SECOND-HAND SMOKE
4.5.1
Trends in exposure to second-hand smoke since 1998 by age and
sex
Since 1998, non-smokers have been asked whether they were regularly
exposed to second-hand smoke in a variety of public and private
settings. Previous SHeS reports5,6,7 have noted that exposure had fallen
markedly since the introduction, in 2006, of the ban on smoking in
public places. Non-smokers’ self-reported exposure to smoke in a
variety of contexts since 1998 is presented in Table 4.6. As the 1998
survey did not include adults aged 75 and over the below discussion of
trends is based on adults aged 16-74. Figures for all adults aged 16 and
over since 2003 are also presented in the table.
111
The proportion of non-smokers aged 16-74 who reported being
exposed to second-hand smoke in any public place declined
substantially from 50% in 1998 to 7% in 2008 and has remained fairly
constant since then (7%-8% in the period 2009 to 2011). Over this
same period there was also a significant drop in non-smokers exposure
to smoke in the home (either own home or someone else’s home) from
33% in 1998 to 20% in 2008. The 2009 and 2010 figures (19% and 18%
respectively) were similar to the 2008 figure while there was a further
small drop to 15% in 2011. The decline observed among those aged
16-74 between 2008 and 2011 was statistically significant.
These decreases in self-reported exposure to smoke were coupled with
a corresponding increase in the proportion of non-smokers aged 16-74
reporting that they were not exposed to other people’s smoke. In 1998
and 2003 the proportions reporting that they were not exposed to
second-hand smoke in any of the places asked about were 36% and
40% respectively. This increased to 74% in 2008, 75% in 2009 and
2010 and 77% in 2011. These trends were similar for men and women.
Looking at figures for all adults aged 16 and over since 2003, the
biggest drops in exposure to smoke both within and outwith the home
also occurred between 2003 and 2008. There was an additional
significant decline in the proportion of non-smokers reporting that they
were exposed to second-hand smoke in their own or someone else’s
home between 2010 and 2011 (from 17% to 14%).
While the decline in exposure to second-hand smoke (in both public
and private contexts) occurred across non-smokers of all ages, there
were still some notable age differences in reported exposure levels. In
2011 for example, the youngest non-smokers (those aged16-24) were
twice as likely as 25-74 years olds and around three times as likely as
those aged 75 and over to report that they were exposed to smoke in
their own or someone else’s home (30%, 12-15% and 8% respectively).
The same was true for exposure in any public place with 26% of those
aged 16-24 reporting this compared with 2-8% for the remaining age
groups.
Figure 4D, Table 4.6
112
Figure 4D
% of non-smokers who are never exposed to second-hand smoke at
own/other's home, at work, or in public places, by age and sex, 2011
Men
Women
100
90
80
Percent
70
60
50
40
30
20
10
0
16-24
25-34
35-44
45-54
55-64
65-74
75+
All
Age group
4.5.2
Trends in exposure to second-hand smoke: non-smokers’ cotinine
levels since 2003
The geometric mean19 cotinine levels of non-smokers in 2003,
2008/2009 and 2010/2011 are presented in Table 4.7. To be included in
this analysis, self-reported non-smokers had to have a cotinine level
below 12ng/ml (higher levels would suggest that these were smokers
who misreported their behaviour in the interview). As the distribution of
the data for non-smokers was very skewed, geometric means have
been used rather than arithmetic means as these take into account
extreme values (the Glossary at the end of this volume contains more
details of these terms).
Non-smokers’ geometric mean cotinine levels reduced significantly from
0.40ng/ml in 2003 to 0.11ng/ml in 2008/09 and remained at this level in
2010/2011. As Table 4.7 demonstrates, levels for male and female nonsmokers were the same in 2010/2011 with both experiencing a decline
since 2003. In 2003 the youngest age group (16-44 year olds) had
significantly higher cotinine levels than older non-smokers (0.48ng/ml
compared with 0.33-0.35ng/ml). The 2009 report6 noted that by
2008/2009 this difference across age groups had largely disappeared
and by 2010/2011 there was no longer a significant difference in the
mean cotinine levels by age (0.11ng/ml for all age groups). While there
were some small differences by age, when the levels for male and
female non-smokers when examined separately, these were not
significant.
Table 4.7
4.5.3
Non-smokers’ cotinine levels by Scottish Index of Multiple
Deprivation (SIMD)
The geometric mean cotinine levels of non-smokers by SIMD for the
2008 to 2011 period combined is shown in Table 4.8. Area level
deprivation was strongly associated with the saliva cotinine levels of
non-smokers. The geometric mean cotinine level for non-smokers living
113
in the most deprived quintile was around three times higher than it was
for those living in the least deprived quintile (0.20ng/ml compared with
0.07ng/ml). Levels for those in the intervening quintile groups ranged
from 0.10ng/ml to 0.13ng/ml. This pattern was true for both male and
female non-smokers but was slightly more pronounced for males
(0.22ng/ml in the most deprived quintile compared with 0.07ng/ml in the
least deprived quintile).
These differences were also apparent when the geometric mean
cotinine level of non-smokers in the most deprived 15% of areas was
compared with that for the rest of Scotland. The geometric mean
cotinine levels for both male and female non-smokers living in the 15%
most deprived of areas in Scotland were significantly higher than for
those living elsewhere (0.25ng/ml and 0.20ng/ml for male and female
non-smokers in the most deprived 15% of areas compared with
0.10ng/ml for those living in the rest of Scotland).
Table 4.8
114
References and notes
1
National Performance Framework: Changes to the National Indicator Set, Edinburgh: Scottish
Government, 2012. [online] Available from: www.scotland.gov.uk/About/scotPerforms/NIchanges
See also: www.scotlandperforms.com
2
See: www.scotland.gov.uk/About/Performance/scotPerforms/indicator/mortality
3
See: http://www.scotpho.org.uk/behaviour/tobacco-use/key-points
4
See: www.scotland.gov.uk/About/Performance/scotPerforms/indicator/smoking
5
Gray, L. and Leyland, A. (2009). Chapter 4: Smoking. In Bromley, C., Bradshaw, P. and Given, L.
[eds.] The 2008 Scottish Health Survey – Volume 1: Main Report. Edinburgh, Scottish
Government. www.scotland.gov.uk/Publications/2009/09/28102003/0
6
Miller, M. (2010). Chapter 4: Smoking. In Bromley, C., Given, L. and Ormston, R. [eds.] The 2009
Scottish Health Survey – Volume 1: Main Report. Edinburgh, Scottish Government.
www.scotland.gov.uk/Publications/2010/09/23154223/0
7
Marryat, L. (2011). Chapter 4: Smoking. In Bromley, C. and Given, L. [eds.] The 2010 Scottish
Health Survey – Volume 1: Main Report. Edinburgh, Scottish Government.
www.scotland.gov.uk/Publications/2011/09/27084018/0
8
See: www.scotland.gov.uk/News/Releases/2011/03/09095505
9
See: www.scotland.gov.uk/News/Releases/2012/01/Smoking15012012
10
The consultation uses the term “standardised” packaging to reflect the fact that the proposals
would not in fact introduce completely plain packaging, but would instead introduce standardised
formats for brand names and coloured graphic health warnings. However, plain packaging is the
term that has more commonly been used in the research literature and campaign materials to
date.
11
See: http://consultations.dh.gov.uk/tobacco/standardised-packaging-of-tobaccoproducts/consult_view
12
Page v in: Moodie, C., Stead, M., Bauld, L., McNeill, A., Angus, K. Hinds, K. Kwan, I. Thomas, J.,
Hastings, G. and O’Mara-Eves, A. (2012). Plain Tobacco Packaging: A Systematic Review. Public
Health Research Consortium. Available from: http://phrc.lshtm.ac.uk/project_2011-2016_006.html
13
The 2007 Better Health, Better Care action plan for improving health and health care in Scotland
set out how NHS Scotland’s HEAT performance management system (based around a series of
targets against which the performance of its individual Boards are measured) would feed into the
Government’s overarching objectives. The HEAT targets derive their name from the four strands
in the performance framework: the Health of the population; Efficiency and productivity, resources
and workforce; Access to services and waiting times; and Treatment and quality of services.
14
See:
www.scotland.gov.uk/About/Performance/scotPerforms/partnerstories/NHSScotlandperformance/s
mokingcessation
15
NHSScotland HEAT Targets due for delivery in 2010/11 – Summary of performance. (2012). NHS
Scotland Performance and Business management. Available from:
www.scotland.gov.uk/About/scotPerforms/partnerstories/NHSScotlandperformance/HT201011
16
Analyses of data from the Health Survey for England 1996-2004 demonstrated that the optimal
thresholds (in terms of maximising both sensitivity - identifying smokers - and specificity - correctly
identifying non-smokers) to distinguish smokers from non-smokers varied, depending on smoking
prevalence, with a gradient from 8ng/ml to 18ng/ml with increasing social disadvantage. The
115
optimal threshold also varied by presence (18ng/ml) or absence (5ng/ml) of smoking in the home.
Overall, the best threshold for general use was 12ng/ml.
17
Scotland’s People - Annual report: Result from the 2011 Scottish Household Survey. (2012)
Edinburgh: Scottish Government.
Available from:www.scotland.gov.uk/Topics/Statistics/16002/Publications
18
MacGregor, A. and Wardle, H. Chapter 2: Smoking. In Bromley, C., Shelton, N. and Sproston, K.
(Eds.) (2003). The Scottish Health Survey 2003 – Volume 2: Adults. Edinburgh: Scottish
Executive.
19
Geometric means can only be calculated for positive numbers. The cases in the dataset with
values of zero were therefore converted to 0.05 prior to the calculation. 0.05ng/ml is the lowest
value for cotinine detectable by the tests used in the survey.
116
Table list
Table 4.1
Table 4.2
Table 4.3
Table 4.4
Table 4.5
Table 4.6
Table 4.7
Table 4.8
Cigarette smoking status, 1995, 1998, 2003, 2008, 2009, 2010, 2011, by age
and sex
Self-reported cigarette smoking status, 2011, (age-standardised), by NS-SEC
of household reference person and sex
Self-reported cigarette smoking status, 2011, (age-standardised), by
equivalised household income and sex
Self-reported cigarette smoking status, 2011, (age-standardised), by Scottish
Index of Multiple Deprivation and sex
Smoking prevalence estimates without and with saliva cotinine adjustment,
2008-2011 combined, by age and sex
Non-smokers’ exposure to second-hand smoke, 1998, 2003, 2008, 2009,
2010, 2011, by age and sex
Saliva cotinine levels among self-reported cotinine validated non-smokers,
2003, 2008/2009 combined, 2010/2011 combined, by age and sex
Saliva cotinine levels among self-reported cotinine validated non-smokers,
2008-2011 combined, (age-standardised), by Scottish Index of Multiple
Deprivation and sex
117
Table 4.1
Cigarette smoking status, 1995, 1998, 2003, 2008, 2009, 2010, 2011, by age
and sex
Aged 16 and over
Cigarette smoking status
1995, 1998, 2003, 2008, 2009, 2010, 2011
Total
16+
Age
16-24
25-34
35-44
45-54
55-64
65-74
75+
Total
16-64
%
%
%
%
%
%
%
%
%
35
37
32
28
24
25
26
37
39
39
36
34
34
34
29
36
34
31
31
32
28
34
34
29
26
27
30
25
34
32
24
25
23
23
22
n/a
20
18
17
16
15
15
n/a
n/a
15
10
13
12
8
34
36
32
29
28
29
27
n/a
n/a
29
27
25
26
24
6
4
3
4
4
6
2
12
13
9
15
14
12
12
17
18
17
18
17
17
18
24
23
27
24
20
19
25
33
38
37
33
37
33
29
n/a
52
47
46
45
50
47
n/a
n/a
55
53
49
54
50
18
18
19
19
19
18
18
n/a
n/a
24
24
24
24
23
59
59
65
68
72
68
72
51
48
51
49
52
54
54
54
46
49
50
52
51
54
42
43
44
50
52
51
50
33
30
39
42
40
44
49
n/a
29
35
36
39
35
39
n/a
n/a
30
37
38
33
41
49
46
49
51
53
53
55
n/a
n/a
47
49
51
50
52
Mean per current smoker
per day
1995
1998
2003
2008
2009
2010
2011
14.2
12.2
10.9
9.3
10.6
9.0
11.5
16.8
16.8
14.0
12.6
13.3
12.5
11.5
19.0
18.6
17.3
17.7
16.0
16.5
13.5
21.0
20.7
18.7
20.6
18.6
16.7
17.3
20.9
20.7
20.1
17.6
16.7
17.0
18.7
n/a
16.5
17.5
17.9
16.9
16.4
16.7
n/a
n/a
13.7
14.1
16.0
16.5
12.2
18.1
17.6
15.9
15.6
15.2
14.6
14.2
n/a
n/a
15.9
15.7
15.4
14.8
14.3
SE of the mean
1995
1998
2003
2008
2009
2010
2011
0.58
0.43
0.74
1.14
1.07
0.95
0.86
0.63
0.49
0.64
0.72
0.90
1.02
0.65
0.61
0.60
0.62
0.89
0.74
0.74
0.80
0.75
0.78
0.84
1.11
1.01
0.76
0.67
0.74
0.97
1.08
0.93
0.85
0.84
0.86
n/a
1.61
0.93
1.28
0.92
1.29
1.11
n/a
n/a
1.51
1.20
1.29
1.98
1.17
0.31
n/a
0.29
n/a
0.35
0.33
0.49
0.46
0.44
0.41
0.46
0.43
0.38
0.35
Continued…
Men
Current cigarette smokera
1995
1998
2003
2008
2009
2010
2011
Ex-regular cigarette smoker
1995
1998
2003
2008
2009
2010
2011
Never regular cigarette
smoker/never smoked at
all
1995
1998
2003
2008
2009
2010
2011
118
Table 4.1
- Continued
Aged 16 and over
Cigarette smoking status
1995, 1998, 2003, 2008, 2009, 2010, 2011
Total
16+
Age
16-24
25-34
35-44
45-54
55-64
65-74
75+
Total
16-64
%
%
%
%
%
%
%
%
%
33
34
29
30
29
29
26
39
36
35
29
26
28
25
34
33
33
29
28
27
25
37
34
29
28
30
28
25
34
31
26
23
24
26
27
n/a
25
22
17
19
18
15
n/a
n/a
12
11
10
10
8
36
33
31
28
27
28
26
n/a
n/a
28
25
25
25
22
7
8
6
7
5
7
6
14
12
14
18
17
15
14
16
14
15
18
16
20
17
21
20
20
23
21
21
18
22
25
31
29
23
27
26
n/a
30
28
35
31
29
33
n/a
n/a
29
34
30
34
32
16
16
17
19
17
19
17
n/a
n/a
20
22
20
21
20
61
58
66
63
65
64
68
47
52
51
54
57
56
61
50
53
52
54
56
53
58
42
46
51
49
49
51
57
44
43
43
49
53
48
47
n/a
45
50
48
50
53
53
n/a
n/a
59
55
60
56
60
49
51
52
53
56
54
58
n/a
n/a
53
53
55
54
57
Mean per current smoker
per day
1995
1998
2003
2008
2009
2010
2011
12.3
11.5
10.5
10.8
10.2
10.6
9.8
15.2
14.1
12.3
10.8
11.7
11.9
10.5
16.4
16.2
16.5
15.1
13.6
12.4
13.3
17.0
17.3
16.9
15.5
16.1
15.4
16.3
15.4
16.4
17.2
15.3
14.6
15.8
15.2
n/a
12.8
14.6
15.1
14.5
13.5
14.3
n/a
n/a
14.3
11.6
10.9
9.1
12.8
15.4
15.2
14.8
13.6
13.5
13.3
13.2
n/a
n/a
14.7
13.7
13.4
13.1
13.3
SE of the mean
1995
1998
2003
2008
2009
2010
2011
0.51
0.44
0.79
0.53
0.77
0.65
0.59
0.40
0.44
0.50
0.60
0.77
0.57
0.60
0.48
0.46
0.55
0.79
0.52
0.55
0.57
0.47
0.57
0.64
0.65
0.54
0.61
0.82
0.51
0.71
0.64
0.71
0.67
0.62
0.70
n/a
0.59
0.73
0.95
0.88
0.87
0.80
n/a
n/a
1.24
1.09
1.02
1.10
1.16
0.21
n/a
0.24
n/a
0.29
0.27
0.33
0.31
0.30
0.27
0.29
0.27
0.33
0.30
Continued…
Women
Current cigarette smokera
1995
1998
2003
2008
2009
2010
2011
Ex-regular cigarette
smoker
1995
1998
2003
2008
2009
2010
2011
Never regular cigarette
smoker/never smoked at
all
1995
1998
2003
2008
2009
2010
2011
119
Table 4.1
- Continued
Aged 16 and over
Cigarette smoking status
1995, 1998, 2003, 2008, 2009, 2010, 2011
Total
16+
Age
16-24
25-34
35-44
45-54
55-64
65-74
75+
Total
16-64
%
%
%
%
%
%
%
%
%
34
35
30
29
26
27
26
38
37
37
32
30
31
30
32
34
34
30
30
29
26
36
34
29
27
29
29
25
34
32
25
24
23
24
25
n/a
23
20
17
18
16
15
n/a
n/a
13
10
11
11
8
35
35
31
29
28
28
26
n/a
n/a
28
26
25
25
23
6
6
4
5
5
7
4
13
13
12
16
16
14
13
16
16
16
18
17
19
18
23
21
23
23
21
20
21
27
31
34
31
30
30
27
n/a
40
37
40
37
39
39
n/a
n/a
38
41
37
42
39
17
17
18
19
18
18
17
n/a
n/a
22
23
22
23
22
60
58
65
66
69
66
70
49
50
51
51
55
55
58
52
50
51
52
54
52
56
42
45
48
50
51
51
54
39
37
41
45
47
46
48
n/a
38
43
43
45
45
46
n/a
n/a
49
48
52
47
53
49
48
51
52
54
54
57
n/a
n/a
50
51
53
52
55
Mean per current smoker
per day
1995
1998
2003
2008
2009
2010
2011
13.3
11.9
10.7
10.1
10.3
9.9
10.6
16.0
15.5
13.1
11.8
12.6
12.2
11.1
17.6
17.5
16.9
16.4
14.8
14.5
13.4
18.8
19.0
17.7
17.8
17.2
16.0
16.7
18.0
18.4
18.5
16.4
15.6
16.3
16.7
n/a
14.2
15.8
16.3
15.5
14.7
15.3
n/a
n/a
14.1
12.6
13.1
12.1
12.6
16.7
16.4
15.3
14.6
14.3
13.9
13.7
n/a
n/a
15.3
14.7
14.4
13.9
13.8
SE of the mean
1995
1998
2003
2008
2009
2010
2011
0.39
0.31
0.62
0.67
0.65
0.60
0.54
0.37
0.33
0.42
0.51
0.68
0.63
0.46
0.38
0.39
0.43
0.59
0.45
0.49
0.54
0.44
0.49
0.53
0.66
0.55
0.49
0.54
0.46
0.60
0.65
0.60
0.56
0.53
0.58
n/a
0.72
0.60
0.80
0.65
0.78
0.68
n/a
n/a
0.96
0.88
0.87
1.14
0.82
0.19
n/a
0.19
n/a
0.26
0.24
0.31
0.28
0.29
0.26
0.28
0.26
0.28
0.26
Continued…
All adults
Current cigarette smokera
1995
1998
2003
2008
2009
2010
2011
Ex-regular cigarette smoker
1995
1998
2003
2008
2009
2010
2011
Never regular cigarette
smoker/never smoked at
all
1995
1998
2003
2008
2009
2010
2011
120
Table 4.1
- Continued
Aged 16 and over
1995, 1998, 2003, 2008, 2009, 2010, 2011
Total
16+
Cigarette smoking status Age
16-24
25-34
35-44
45-54 55-64
65-74
75+
Bases (weighted):
Men 1995
722
979
851
749
600
n/a
n/a
Men 1998
695
953
903
779
607
469
n/a
Men 2003
561
601
759
666
569
405
259
Men 2008
444
479
563
554
480
327
218
Men 2009
509
565
631
648
563
386
259
Men 2010
478
559
584
631
542
374
253
Men 2011
515
581
613
653
564
389
266
Women 1995
692
990
870
777
665
n/a
n/a
Women 1998
655
940
913
798
661
583
n/a
Women 2003
553
657
808
689
601
492
467
Women 2008
426
487
616
586
502
382
348
Women 2009
496
569
693
699
590
450
408
Women 2010
476
557
643
679
571
432
393
Women 2011
492
580
671
710
593
448
413
All adults 1995
1413 1969 1721 1527 1265
n/a
n/a
All adults 1998
1349 1893 1816 1577 1268 1052
n/a
All adults 2003
1114 1258 1567 1355 1169
897
726
All adults 2008
870
966 1179 1140
982
709
566
All adults 2009
1005 1134 1324 1347 1153
836
667
All adults 2010
954 1116 1227 1310 1113
806
647
All adults 2011
1007 1161 1284 1363 1156
837
679
Bases (unweighted):
Men 1995
474
840
811
709
689
n/a
n/a
Men 1998
391
763
826
693
683
572
n/a
Men 2003
326
449
730
611
633
508
325
Men 2008
237
316
460
534
525
453
304
Men 2009
259
404
548
601
575
516
362
Men 2010
256
420
476
566
555
489
330
Men 2011
299
398
516
596
600
510
344
Women 1995
545 1160
992
825
884
n/a
n/a
Women 1998
511
971 1008
896
808
889
n/a
Women 2003
392
599
882
793
776
580
492
Women 2008
321
451
648
628
631
513
408
Women 2009
374
579
778
732
735
550
479
Women 2010
361
566
680
760
700
574
468
Women 2011
350
562
710
803
737
595
486
All adults 1995
1019 2000 1803 1534 1573
n/a
n/a
All adults 1998
902 1734 1834 1589 1491 1461
n/a
All adults 2003
718 1048 1612 1404 1409 1088
817
All adults 2008
558
767 1108 1162 1156
966
712
All adults 2009
633
983 1326 1333 1310 1066
841
All adults 2010
617
986 1156 1326 1255 1063
798
All adults 2011
649
960 1226 1399 1337 1105
830
a Current cigarette smoker excludes those who reported only smoking cigars or pipes.
121
Total
16-64
3901
3937
3156
2520
2916
2795
2926
3994
3966
3307
2618
3047
2925
3045
7895
7903
6463
5138
5962
5720
5971
n/a
n/a
3819
3066
3560
3422
3581
n/a
n/a
4267
3348
3905
3750
3906
n/a
n/a
8086
6413
7465
7173
7487
3523
3356
2749
2072
2387
2273
2409
4406
4194
3442
2679
3198
3067
3162
7929
7550
6191
4751
5585
5340
5571
n/a
n/a
3582
2829
3265
3092
3263
n/a
n/a
4514
3600
4227
4109
4243
n/a
n/a
8096
6429
7492
7201
7506
Table 4.2
Self-reported cigarette smoking status, 2011, (age-standardised), by NSSEC of household reference person and sex
Aged 16 and over
Cigarette smoking status
2011
NS-SEC of household reference person
Managerial Intermediate
Small
Lower
&
employers & supervisory
own & technical
professional
account
workers
Men
Current cigarette smokera
Ex-regular cigarette smoker
Never regular cigarette
smoker/never smoked at all
Mean per current smoker per day
Standard error of the mean
Women
Current cigarette smokera
Ex-regular cigarette smoker
Never regular cigarette
smoker/never smoked at all
Mean per current smoker per day
Standard error of the mean
All adults
Current cigarette smokera
Ex-regular cigarette smoker
Never regular cigarette
smoker/never smoked at all
Mean per current smoker per day
Standard error of the mean
Bases (weighted):
Men
Women
All adults
Bases (unweighted):
Men
Women
All adults
a Current cigarette smoker excludes those
Semiroutine &
routine
%
%
%
%
%
16
23
61
20
17
63
17
24
58
28
28
45
37
23
39
13.0
0.73
14.4
1.10
16.0
1.76
14.0
0.91
15.7
0.48
13
20
67
22
23
54
17
18
65
26
20
55
35
21
45
11.7
0.59
11.1
0.83
13.6
1.19
12.3
0.84
14.6
0.46
15
21
64
21
21
58
17
21
62
27
24
49
36
22
42
12.4
0.49
12.4
0.72
14.8
1.22
13.2
0.65
15.1
0.35
1388
1461
2849
280
394
674
365
343
708
472
412
884
966
1175
2141
1207
243
362
440
1508
425
393
463
2715
668
755
903
who reported only smoking cigars or pipes.
925
1323
2248
122
Table 4.3
Self-reported cigarette smoking status, 2011, (age-standardised), by
equivalised household income and sex
Aged 16 and over
2011
Cigarette smoking status
Men
a
Current cigarette smoker
Ex-regular cigarette smoker
Never regular cigarette
smoker/never smoked at all
Mean per current smoker per day
Standard error of the mean
Women
Current cigarette smokera
Ex-regular cigarette smoker
Never regular cigarette
smoker/never smoked at all
Mean per current smoker per day
Standard error of the mean
All adults
Current cigarette smokera
Ex-regular cigarette smoker
Never regular cigarette
smoker/never smoked at all
Mean per current smoker per day
Standard error of the mean
Equivalised annual household income quintile
1
(highest)
st
2nd
3rd
4th
5
(lowest)
%
%
%
%
%
14
24
63
20
27
52
25
25
50
30
25
46
41
18
40
14.6
1.22
14.6
1.12
14.1
0.72
13.6
0.72
16.1
0.69
14
19
68
15
21
64
21
23
56
32
19
49
39
20
41
13.4
1.90
12.2
1.02
13.1
0.82
14.0
0.62
13.8
0.59
14
21
65
18
24
58
23
24
53
31
22
48
40
19
41
14.0
1.14
13.6
0.87
13.6
0.57
13.8
0.49
14.8
0.50
Bases (weighted):
Men
810
685
569
489
Women
751
709
625
612
All adults
1561
1393
1194
1101
Bases (unweighted):
Men
705
604
541
486
Women
779
761
696
700
All adults
1484
1365
1237
1186
a Current cigarette smoker excludes those who reported only smoking cigars or pipes.
123
th
450
528
978
433
605
1038
Table 4.4
Self-reported cigarette smoking status, 2011, (age-standardised), by Scottish
Index of Multiple Deprivation and sex
Aged 16 and over
2011
Cigarette smoking status
Scottish Index of Multiple Deprivation quintile
SIMD 85/15
5
(least
deprived)
th
4th
3rd
2nd
1
(most
deprived)
st
85%
least
deprived
15%
most
deprived
%
%
%
%
%
%
%
Current cigarette smoker
Ex-regular cigarette smoker
Never regular cigarette
smoker/never smoked at all
11
24
65
19
24
57
23
25
52
26
24
50
43
19
38
21
24
55
45
18
37
Mean per current smoker per
day
Standard error of the mean
12.5
14.1
14.0
14.6
15.4
14.3
15.3
1.13
0.97
0.76
0.79
0.58
0.41
0.63
Current cigarette smokera
Ex-regular cigarette smoker
Never regular cigarette
smoker/never smoked at all
11
20
69
17
19
65
21
21
59
27
19
54
38
21
41
20
20
61
39
21
40
Mean per current smoker per
day
Standard error of the mean
12.0
12.2
12.5
13.1
14.9
12.5
15.5
0.91
1.10
0.59
0.43
0.54
0.32
0.63
Current cigarette smokera
Ex-regular cigarette smoker
Never regular cigarette
smoker/never smoked at all
11
22
67
18
22
61
22
23
56
27
21
52
40
20
39
20
22
58
42
20
38
Mean per current smoker per
day
Standard error of the mean
12.3
13.2
13.2
13.8
15.2
13.4
15.4
0.82
0.83
0.51
0.46
0.42
0.28
0.47
3035
3326
6361
547
581
1128
2768
3612
6380
495
631
1126
Men
a
Women
All Adults
Bases (weighted):
Men
685
778
766
625
730
Women
721
818
862
733
773
All adults
1406
1595
1628
1357
1503
Bases (unweighted):
Men
566
753
750
550
644
Women
731
945
981
767
819
All adults
1297
1698
1731
1317
1463
a Current cigarette smoker excludes those who reported only smoking cigars or pipes.
124
Table 4.5
Smoking prevalence estimates without and with saliva cotinine adjustment,
2008-2011 combined, by age and sex
Aged 16 and over with valid saliva cotinine measurement
Smoking status
Men
Unadjusted self report: smoke
cigarettes
Adjusted estimate, adding self
reported non-smokers with
saliva cotinine of 12ng/ml or over
Differencea
Women
Unadjusted self report: smoke
cigarettes
Adjusted estimate, adding self
reported non-smokers with
saliva cotinine of 12ng/ml or over
Differencea
All adults
Unadjusted self report: smoke
cigarettes
Adjusted estimate, adding self
reported non-smokers with
saliva cotinine of 12ng/ml or over
Differencea
2008-2011 combined
Age
Total
16-24
25-34
35-44
45-54
55-64
65-74
75+
%
%
%
%
%
%
%
%
27
33
27
28
23
14
9
24
33
35
29
30
27
20
15
28
6
2
2
2
4
6
6
4
28
24
27
28
23
17
9
23
31
27
31
30
25
19
10
26
3
3
4
2
2
2
1
3
28
28
27
28
23
16
9
24
32
31
30
30
26
20
12
27
4
3
3
2
3
4
3
3
Bases (weighted):
Men
249
265
388
389
339
228
136
1994
Women
247
279
389
431
357
240
190
2133
All adults
496
544
777
820
696
469
325
4127
Bases (unweighted):
Men
121
176
284
312
325
276
164
1658
Women
167
256
369
413
388
291
204
2088
All adults
288
432
653
725
713
567
368
3746
a Because of rounding, the actual differences shown may be different from the apparent difference between
the two percentages.
125
Table 4.6
Non-smokers’ exposure to second-hand smoke, 1998, 2003, 2008, 2009, 2010,
2011, by age and sexa
Non-smokers aged 16 and over
Exposure to
second-hand smoke
1998, 2003, 2008, 2009, 2010, 2011
Age
Total
16+
16-24
25-34
35-44
45-54
55-64
65-74
75+
Total
16-74
%
%
%
%
%
%
%
%
%
In own home
1998
2003
2008
2009
2010
2011
33
28
25
20
19
15
16
13
5
7
6
7
15
11
6
6
4
3
16
12
11
6
6
6
16
15
10
9
11
10
13
10
6
10
6
8
n/a
6
6
3
3
5
18
15
10
9
9
8
n/a
14
10
9
8
8
In other people’s home
1998
2003
2008
2009
2010
2011
38
28
28
18
23
22
26
19
11
17
14
13
21
18
12
10
9
7
16
12
7
8
7
7
13
11
7
5
7
6
11
8
4
4
5
4
n/a
4
2
2
2
1
21
16
12
10
11
10
n/a
15
11
9
10
9
On public transport
1998
2003
2008
2009
2010
2011
19
12
3
1
2
1
5
7
1
0
-
6
4
1
-
4
5
0
1
0
0
3
3
0
-
4
4
0
-
n/a
1
0
7
6
1
1
0
0
n/a
6
1
0
0
0
In pubs
1998
2003
2008
2009
2010
2011
61
55
2
3
2
3
57
55
1
2
1
1
48
40
1
1
1
1
41
43
0
1
1
1
29
32
1
0
-
19
24
0
0
n/a
11
-
44
42
1
1
1
1
n/a
39
1
1
1
1
In other public places
1998
2003
2008
2009
2010
2011
38
39
18
13
24
25
24
23
6
7
7
9
25
23
5
3
3
5
21
21
3
3
3
3
18
27
5
4
3
3
22
22
2
4
2
3
n/a
16
2
1
1
1
25
26
6
5
7
8
n/a
25
6
5
6
7
At work
1998
2003
2008
2009
2010
2011
26
19
7
9
8
5
30
21
9
8
8
8
29
20
7
6
8
7
24
20
6
8
5
6
17
10
4
2
5
4
1
3
1
1
1
n/a
1
0
0
23
n/a
16
15
6
5
6
5
6
5
5
5
Continued…
Men
126
Table 4.6
- Continued
Non-smokers aged 16 and over
Exposure to
second-hand smoke
1998, 2003, 2008, 2009, 2010, 2011
Age
Total
16+
16-24
25-34
35-44
45-54
55-64
65-74
75+
Total
16-74
In own or other’s home
1998
2003
2008
2009
2010
2011
%
%
%
%
%
%
%
%
%
52
44
40
33
34
33
34
28
14
21
18
17
29
23
17
17
12
9
25
20
16
13
12
12
24
21
14
13
16
14
22
15
9
13
10
12
n/a
10
8
5
5
5
31
24
19
18
17
16
n/a
24
18
17
16
15
In any public placeb
1998
2003
2008
2009
2010
2011
79
72
20
16
25
27
63
62
8
8
8
10
55
45
6
4
4
6
50
50
3
4
3
4
40
45
5
4
3
3
35
36
2
4
3
3
n/a
24
2
1
1
1
55
52
7
7
7
8
n/a
49
7
6
7
8
Not exposed to smoke
in these placesc
1998
2003
2008
2009
2010
2011
13
16
46
55
48
51
22
28
73
71
71
70
32
40
75
77
79
81
36
37
79
79
82
81
46
44
80
81
80
81
54
56
88
82
88
85
n/a
68
89
93
94
93
33
37
73
74
75
75
n/a
39
75
76
76
77
In own home
1998
2003
2008
2009
2010
2011
34
25
20
18
19
10
14
9
10
7
3
5
14
11
7
7
5
5
18
12
9
7
8
5
21
14
9
8
8
6
13
10
5
5
8
8
n/a
8
6
6
5
7
18
13
10
8
8
6
n/a
13
9
8
8
6
In other people’s home
1998
2003
2008
2009
2010
2011
33
41
29
29
34
21
30
23
15
15
18
9
25
20
10
11
9
10
23
18
13
14
12
8
20
14
11
7
8
7
14
10
4
6
7
5
n/a
7
4
3
3
4
25
21
13
13
14
10
n/a
19
12
12
12
9
On public transport
1998
2003
2008
2009
2010
2011
21
15
2
2
2
2
8
6
1
0
0
1
7
5
0
1
0
0
6
5
0
0
0
5
4
0
0
0
0
4
3
0
0
0
n/a
2
0
0
0
8
n/a
6
5
0
0
1
1
0
0
0
0
Continued…
Women
127
Table 4.6
- Continued
Non-smokers aged 16 and over
Exposure to
second-hand smoke
1998, 2003, 2008, 2009, 2010, 2011
Age
Total
16+
16-24
25-34
35-44
45-54
55-64
65-74
75+
Total
16-74
In pubs
1998
2003
2008
2009
2010
2011
%
%
%
%
%
%
%
%
%
66
60
3
5
2
3
41
46
1
0
0
31
29
0
-
23
34
0
14
14
0
5
11
-
n/a
2
-
30
32
0
1
0
1
n/a
28
0
1
0
0
In other public places
1998
2003
2008
2009
2010
2011
49
48
20
18
19
22
27
26
6
7
9
7
27
23
4
4
6
6
26
26
4
3
5
5
24
22
3
3
3
4
19
25
1
3
3
4
n/a
16
2
1
1
1
28
28
6
6
7
7
n/a
26
5
5
6
7
At work
1998
2003
2008
2009
2010
2011
24
19
4
5
4
6
17
10
3
4
3
2
17
9
3
3
2
2
15
9
4
4
3
3
6
6
1
2
3
1
1
1
0
-
n/a
-
14
9
2
3
2
3
n/a
8
2
3
2
2
In own or other’s home
1998
2003
2008
2009
2010
2011
54
52
40
38
42
26
37
28
23
20
20
13
32
27
16
16
13
15
33
25
21
18
18
12
35
23
17
14
14
12
24
18
9
11
13
11
n/a
14
9
9
8
10
35
29
21
19
19
14
n/a
27
19
18
18
14
81
77
23
20
20
25
52
54
6
8
10
7
44
40
4
5
6
6
40
45
4
3
5
5
34
30
3
3
3
4
24
29
1
3
3
4
n/a
18
2
2
1
2
46
46
6
7
8
8
n/a
42
6
6
7
7
10
13
49
50
50
53
34
35
73
73
70
81
41
48
79
78
81
78
41
44
75
76
77
82
46
55
80
82
81
85
62
58
90
87
84
86
n/a
72
89
90
91
89
39
n/a
43
47
75
77
75
77
75
77
78
79
Continued…
In any public place
1998
2003
2008
2009
2010
2011
b
Not exposed to smoke
c
in these places
1998
2003
2008
2009
2010
2011
128
Table 4.6
- Continued
Non-smokers aged 16 and over
Exposure to
second-hand smoke
1998, 2003, 2008, 2009, 2010, 2011
Age
Total
16+
16-24
25-34
35-44
45-54
55-64
65-74
75+
Total
16-74
%
%
%
%
%
%
%
%
%
In own or other’s home
1998
2003
2008
2009
2010
2011
53
49
40
35
38
30
35
28
19
20
19
15
30
25
16
17
13
12
29
23
19
16
15
12
30
22
16
14
15
13
23
17
9
12
12
12
n/a
13
8
7
7
8
33
27
20
19
18
15
n/a
25
18
17
17
14
In any public placeb
1998
2003
2008
2009
2010
2011
80
75
21
18
23
26
57
58
7
8
9
8
49
43
5
4
5
6
45
48
4
4
4
4
37
38
4
4
3
4
29
32
2
3
3
3
n/a
20
2
1
1
2
50
48
7
7
7
8
n/a
45
6
6
7
8
Not exposed to smoke
in these placesc
1998
2003
2008
2009
2010
2011
12
14
47
52
49
52
28
32
73
72
71
76
37
44
77
78
80
80
39
40
77
77
79
81
46
50
80
81
80
83
58
57
89
85
86
85
n/a
71
89
91
92
91
36
40
74
75
75
77
n/a
43
76
76
77
78
430
377
309
389
357
383
435
395
293
349
337
363
865
772
602
738
694
746
579
366
295
376
367
382
606
424
347
423
399
433
1185
790
643
798
766
815
579
496
369
436
399
439
616
543
436
497
470
506
1196
1039
805
933
869
945
517
471
383
471
442
490
528
490
421
489
490
532
1046
962
805
960
932
1021
414
433
340
434
418
439
454
442
384
449
423
433
867
875
724
883
841
872
377
332
254
324
319
331
438
383
315
366
355
382
814
715
569
689
675
713
n/a
219
186
226
222
243
n/a
410
311
367
353
381
n/a
630
498
593
575
624
All adults
Bases (weighted):
Men 1998
Men 2003
Men 2008
Men 2009
Men 2010
Men 2011
Women 1998
Women 2003
Women 2008
Women 2009
Women 2010
Women 2011
All adults 1998
All adults 2003
All adults 2008
All adults 2009
All adults 2010
All adults 2011
129
2897
n/a
2476
2695
1950
2137
2429
2655
2302
2524
2464
2707
3077
n/a
2677
3088
2197
2508
2574
2941
2474
2826
2648
3029
5973
n/a
5153
5783
4147
4645
5003
5596
4776
5350
5111
5736
Continued…
Table 4.6
- Continued
Non-smokers aged 16 and over
Exposure to
second-hand smoke
1998, 2003, 2008, 2009, 2010, 2011
Age
16-24
Total
16+
25-34
35-44
45-54
55-64
65-74
75+
Bases (unweighted):
Men 1998
235
454
525
443
448
447
n/a
Men 2003
217
268
475
435
486
418
277
Men 2008
162
190
309
370
381
359
260
Men 2009
188
274
380
435
443
426
320
Men 2010
182
269
317
392
419
412
290
Men 2011
203
262
368
441
461
431
316
Women 1998
296
593
657
569
542
663
n/a
Women 2003
269
374
604
565
577
461
434
Women 2008
211
312
464
450
490
426
371
Women 2009
256
424
564
512
557
451
435
Women 2010
245
391
495
545
517
474
422
Women 2011
245
412
529
605
546
507
448
All adults 1998
531
1047
1182
1012
990
1110
n/a
All adults 2003
486
642
1079
1000
1063
879
711
All adults 2008
373
502
773
820
871
785
631
All adults 2009
444
698
944
947
1000
877
755
All adults 2010
427
660
812
937
936
886
712
All adults 2011
448
674
897
1046
1007
938
764
a Percentages add to more than 100% as the categories are not mutually exclusive.
b Any public place defined as on public transport, in pubs, or other public places.
c In own home, other people’s homes, on public transport, in pubs, work, or other public places.
130
Total
16-74
2552
2299
1771
2146
1991
2166
3321
2850
2353
2764
2667
2844
5872
5149
4130
4910
4658
5010
n/a
2576
2031
2466
2281
2482
n/a
3284
2724
3199
3089
3292
n/a
5860
4761
5665
5370
5774
Table 4.7
Saliva cotinine levels among self-reported cotinine validated non-smokers,
2003, 2008/2009 combined, 2010/2011 combined, by age and sex
Self-reported non smokers aged 16 and over with
a
valid saliva cotinine measurement
Saliva cotinine level (ng/ml)
2003, 2008/2009 combined, 2010/2011 combined
Age
Total
16-44
45-64
65+
2003
b
Geometric mean saliva cotinine
Confidence Intervals
0.53
(0.46-0.60)
0.38
(0.33-0.42)
0.35
(0.30-0.41)
0.44
(0.40-0.47)
2008/2009
Geometric mean saliva cotinineb
Confidence Intervals
0.12
(0.10-0.15)
0.11
(0.09-0.13)
0.11
(0.09-0.13)
0.11
(0.10-0.13)
2010/2011
Geometric mean saliva cotinineb
Confidence Intervals
0.12
(0.09-0.14)
0.12
(0.10-0.14)
0.09
(0.08-0.11)
0.11
(0.10-0.13)
2003
Geometric mean saliva cotinineb
Confidence Intervals
0.44
(0.38-0.49)
0.33
(0.30-0.37)
0.32
(0.27-0.37)
0.37
(0.34-0.40)
2008/2009
Geometric mean saliva cotinineb
Confidence Intervals
0.12
(0.10-0.14)
0.09
(0.08-0.11)
0.09
(0.08-0.11)
0.10
(0.09-0.11)
2010/2011
Geometric mean saliva cotinineb
Confidence Intervals
0.11
(0.09-0.13)
0.10
(0.09-0.11)
0.12
(0.10-0.14)
0.11
(0.10-0.12)
2003
Geometric mean saliva cotinineb
Confidence Intervals
0.48
(0.44-0.53)
0.35
(0.32-0.39)
0.33
(0.30-0.37)
0.40
(0.38-0.43)
2008/2009
Geometric mean saliva cotinineb
Confidence Intervals
0.12
(0.10-0.14)
0.10
(0.09-0.11)
0.10
(0.09-0.11)
0.11
(0.10-0.12)
2010/2011
b
Geometric mean saliva cotinine
Confidence Intervals
0.11
(0.10-0.13)
0.11
(0.09-0.12)
0.11
(0.09-0.12)
0.11
(0.10-0.12)
Continued…
Men
Women
All adults
131
Table 4.7
- Continued
Self-reported non smokers aged 16 and over with
a
valid saliva cotinine measurement
Saliva cotinine level (ng/ml)
2003, 2008/2009 combined, 2010/2011 combined
Age
Total
16-44
45-64
65+
Bases (weighted):
Men 2003
716
508
288
1513
Men 2008/2009
335
240
142
717
Men 2010/2011
293
223
126
642
Women 2003
710
499
374
1583
Women 2008/2009
305
258
182
745
Women 2010/2011
295
237
168
700
All adults 2003
1426
1007
662
3096
All adults 2008/2009
640
498
324
1462
All adults 2010/2011
587
461
294
1342
Bases (unweighted):
Men 2003
515
552
405
1472
Men 2008/2009
214
248
206
668
Men 2010/2011
192
238
168
598
Women 2003
631
682
433
1746
Women 2008/2009
280
314
231
825
Women 2010/2011
265
304
212
781
All adults 2003
1146
1234
838
3218
All adults 2008/2009
494
562
437
1493
All adults 2010/2011
457
542
380
1379
a To be included within this category, participants had to be both self-reported non-smokers and have a
saliva cotinine level lower than 12ng/ml.
b Geometric means have been presented for non-smokers as their cotinine data have a very skewed
and exponential distribution. A geometric mean is an average calculated by multiplying the values of
the cases in the sample and taking the nth root, where n is the number of cases. As 95% confidence
intervals for geometric means are more complicated to calculate than for arithmetic means, these have
been presented around the estimates rather than standard errors.
132
Table 4.8
Saliva cotinine levels among self-reported cotinine validated nonsmokers, 2008-2011 combined, (age-standardised), by Scottish Index of
Multiple Deprivation and sex
Self-reported non smokers aged 16 and over with valid saliva cotinine
measurementa
Saliva cotinine level
(ng/ml)
Men
Geometric mean saliva
cotinineb
Confidence Intervals
Women
Geometric mean saliva
cotinineb
Confidence Intervals
All adults
Geometric mean saliva
cotinineb
Confidence Intervals
2008-2011 combined
Scottish Index of Multiple Deprivation quintile
th
5
(least
deprived)
th
rd
st
nd
1
(most
deprived)
SIMD 85/15
85% least 15% most
deprived deprived
4
3
2
0.07
0.10
0.11
0.14
0.22
0.10
0.25
(0.070.08)
(0.090.12)
(0.090.13)
(0.120.18)
(0.150.31)
(0.100.11)
(0.160.39)
0.08
0.09
0.11
0.12
0.19
0.10
0.20
(0.070.08)
(0.080.10)
(0.090.12)
(0.100.14)
(0.150.24)
(0.090.10)
(0.150.26)
0.07
0.10
0.11
0.13
0.20
0.10
0.22
(0.070.08)
(0.090.11)
(0.100.12)
(0.110.15)
(0.160.25)
(0.090.11)
(0.170.29)
Bases (weighted):
Men
327
343
270
236
181
1228
130
Women
374
335
286
247
204
1291
154
All adults
701
679
556
483
385
2520
284
Bases (unweighted):
Men
311
328
256
212
159
1160
106
Women
422
395
314
263
212
1448
158
All adults
733
723
570
475
371
2608
264
a To be included within this category, participants had to be both self-reported non-smokers and have
a saliva cotinine level lower than 12ng/ml.
b Geometric means have been presented for non-smokers as their cotinine data have a very skewed
and exponential distribution. See Table 4.7 footnote b for a description of geometric means.
133
Diet
Chapter 5
5 DIET
Rachel Whalley
SUMMARY
In 2011, the mean number of portions of fruit and vegetables consumed per
day by adults was 3.2. Mean daily consumption was significantly higher for
women (3.3) than for men (3.1).
One in five (22%) adults met the recommended daily intake of five or more
portions of fruit and vegetables (20% of men and 23% of women). The
proportion of adults meeting the recommendation has not changed
significantly over time.
Adults aged 16-24 consumed the fewest portions per day (2.6 portions) and
were also the age group least likely to consume five or more portions a day
(15%). 17% of 16-24 year olds did not consume any fruit and vegetables in the
24 hours prior to interview.
Men had higher mean urinary sodium (119.4mmol/l) and potassium levels
(65.3 mmol/l) than women in 2008-2011 (mean levels for women were 95.0
mmol/l and 58.1 mmol/l respectively.
Urinary sodium levels decreased by age for both men and women. The mean
level for those aged 16-44 was 122.0 mmol/l compared with a mean of 87.2
mmol/l for those aged 65 and over. Urinary potassium levels were also highest
in the youngest age group (64.5 mmol/l).
Between 2003 and 2008-2011 there was a significant decline in both the mean
sodium level for adults (from 116.1 mmol/l to 106.9 mmol/) and the mean
creatinine level (from 12.2 mmol/l to 10.5 mmol/l. Urinary potassium levels
remained unchanged over this same period.
Over a quarter (27%) of women and a fifth (20%) of men took some type of
vitamin or mineral supplement in 2008-2011. Consumption was lowest among
those aged 16-24 (13%) and highest among those aged 65-74 (36%).
The proportion of adults taking a dietary vitamin or mineral supplement was
slightly lower in 2008-2011 than in 2003 (24% and 26% respectively).
There was a significant association between supplement consumption and
SIMD in 2008-2011. Consumption tended to decline as deprivation level
increased with 28% of those living in the least deprived quintile taking a
vitamin or mineral supplement compared with 17% of those living in the most
deprived quintile.
5.1
INTRODUCTION
This chapter covers three areas related to dietary habits: self-reported fruit and
vegetable consumption, direct measurement of sodium and potassium levels
via urine samples vitamin supplement use. The dietary supplement and urine
sample results have not been reported since the 2003 Scottish Health Survey
(SHeS) report.1,2
Scotland’s unhealthy diet is widely cited as a factor in its poor health record. In
particular, low consumption of fruit and vegetables is a risk factor for
cardiovascular disease, cancer, hypertension, type 2 diabetes and obesity,
while excess salt consumption has been linked to hypertension.
135
The World Health Organisation (WHO) recommends adults eat at least five
varied portions – where a portion is defined as 80g – of fruit and vegetables a
day. Detailed information about fruit and vegetable consumption (designed to
measure adherence to the ‘5 a day’ recommendation) was first collected in the
2003 survey, and has been included every year since 2008.
Significant efforts have been taken in recent years to encourage the public to
consume less salt, and industry to use less salt in food production (the majority
of dietary sodium intake is derived from processed foods rather than its direct
addition to food at the table). Sodium is a vital constituent of the body and thus
an essential nutrient.1 However, the relationship between salt intake and health,
in particular cardiovascular disease, is well-established. Scientific evidence
suggests that a high salt intake contributes to the development of high blood
pressure and the Scientific Advisory Committee on Nutrition (SACN) concluded
that reducing the average salt intake of the population is likely to decrease the
burden of high blood pressure and improve public health.1,2,3 The Scottish Diet
Action Plan,4 the Scottish Dietary Targets,5 and the 2008 action plan to combat
obesity - Healthy Eating, Active Living6 - all share a common commitment to
reduce population-level salt intake to no more than 6g per day (2.4g or
100mmo/l of sodium). 7 The two most recent estimates for adults aged 19-64 in
Scotland, based on follow-up studies of SHeS participants, showed that levels
of salt intake were similar in 2006 (9.0g) and 2009 (8.8g), and were in excess of
the recommended 6g.8,9 SHeS has collected urine samples to assess levels of
salt intake (urinary sodium), potassium and creatinine since 2003.
While most people should be able to obtain all the nutrients required to maintain
good health from a balanced diet, NHS Scotland recommends that additional
vitamin and mineral supplements are necessary for adults in certain
circumstances.10 These are: folic acid for women trying to conceive and in the
first 12 weeks of pregnancy; vitamin D for all pregnant and breastfeeding
women, people aged 65 and over, people with darker skins, and those who may
not be exposed to much sunlight (e.g. housebound people). In addition, people
with restricted diets and certain medical conditions may be advised by a
clinician to take additional supplements. Following concern about possible
vitamin D deficiency in the population, the UK’s four Chief Medical Officers
reissued their guidance about vitamin D supplementation to remind health
professionals about the recommendations outlined above.11 Information about
overall dietary supplement use was collected in the nurse visits in the 2003 and
2008-2011 surveys.
The equivalent dietary chapters in the 2008, 2009 and 2010 SHeS
reports,12,13,14 provided overviews of the broader dietary policy context from the
mid 1990s onwards, some of which has been mentioned above. They outlined a
number of actions taken by the Government and NHS Scotland to improve diets
in Scotland, including initiatives designed to encourage more fruit and vegetable
consumption, in line with the recommendation to eat at least five portions of fruit
and vegetables a day, and as already mentioned, to reduce salt consumption.
These included:
136
The Scottish Diet Action Plan,4 which outlined the Scottish Dietary
Targets.5
The White Paper Towards a Healthier Scotland.15
The Scottish Executive’s Improving Health in Scotland – the Challenge
paper.16
The Hungry for Success initiative.17
A framework for implementing the Diet Action Plan: Eating for health
meeting the challenge.18
The Scottish Government’s Better Health, Better Care Action Plan.19
Healthy Eating, Active Living: An action plan to improve diet, increase
physical activity and tackle obesity (2008-2011).6
The Scottish Government’s Obesity Route Map,20 and associated
Obesity Route Map Action Plan.21
Between 2008 and 2011 only a sub-sample of participants were invited to have
an additional nurse interview. For this reason the analysis of urinary sodium and
potassium, and of vitamin / mineral supplement use, presented here is based
on either two or four years of nurse data combined. From 2012 the survey is no
longer including a nurse visit and instead a sub-sample of adults will be asked
to complete a new biological module, conducted by specially trained
interviewers. Spot urine samples are part of this new module so the trends over
time will be maintained. Questions about vitamin supplement have also been
retained (as part of the main interview).
This chapter updates the trends in fruit and vegetable consumption among
adults since 2003. Urinary sodium and potassium levels in 2003 are compared
with the more recent figures for 2008-2011 combined. Consumption of vitamin
or mineral supplements in 2003 is also compared with the 2008-2011 period,
and the most recent figures are also presented by the Scottish Index of Multiple
Deprivation (SIMD).
5.2
METHODOLOGY
5.2.1
Measures of eating habits
Two different modules of questions were used to assess eating habits.
One of these assessed fruit and vegetable consumption, and was
designed with the aim of providing sufficient detail to monitor the ‘5-aday’ policy effectively. This module was asked of all adults and children
aged 2 and over every year between 2008 and 2011. The second
module was asked of all children every year, and a sub-sample of
adults in 2008 and 2010. It used a modified version of the Dietary
Instrument of Nutrition Education (DINE) questionnaire developed by
the Imperial Cancer Research Fund’s General Practice Research
Group to assess participants’ usual intake of a wide range of nutrients,
including protein, starch, fat and fibre.22 This chapter only reports the
findings from the fruit and vegetable module for adults.
To determine the total number of portions that had been consumed in
the 24 hours preceding the interview, the fruit and vegetable module
137
asked about the following food types: vegetables (fresh, frozen or
canned); salads; pulses; vegetables in composites (e.g. vegetable
chilli); fruit (fresh, frozen or canned); dried fruit; and fruit in composites
(e.g. apple pie). A portion was defined as the conventional 80g of a fruit
or vegetable. As 80g is difficult to visualise, a ‘portion’ was described
using more everyday terms, such as tablespoons, cereal bowls and
slices. Examples were given in the questionnaire to aid the recall
process, for instance, tablespoons of vegetables, cereal bowls full of
salad, pieces of medium sized fruit (e.g. apples) or handfuls of small
fruits (e.g. raspberries). In spite of this, there may be some variation
between participants’ interpretation of ‘a portion’. These everyday
measures were converted back to 80g portions prior to analysis. The
following table shows the definitions of the portion sizes used for each
food item included in the survey:
Food item
Portion size
Vegetables (fresh, frozen or canned)
3 tablespoons
Pulses (dried)
3 tablespoons
Salad
1 cereal bowlful
Vegetables in composites, such as vegetable chilli 3 tablespoons
Very large fruit, such as melon
1 average slice
Large fruit, such as grapefruit
Half a fruit
Medium fruit, such as apples
1 fruit
Small fruit, such as plum
2 fruits
Very small fruit, such as blackberries
2 average handfuls
Dried fruit
1 tablespoon
Fruit in composites, such as stewed fruit in apple pie 3 tablespoons
Frozen fruit/canned fruit
3 tablespoons
Fruit juice
1 small glass (150 ml)
Since the ‘5-a-day’ policy stresses both volume and variety, the number
of portions of fruit juice, pulses and dried fruit was capped so that no
more than one portion could contribute to the total number of portions
consumed. Interviewers recorded full or half portions, but nothing
smaller.
5.2.2
Urinary sodium and potassium
Dietary salt intake is assessed by measuring sodium excretion in urine.
The studies on which the estimates in Section 5.1 were based on
involved analyses of urine samples collected over a 24-hour period.8,9
24 hour urine collection is accepted as being the most reliable method
for assessing salt intake in the population. 1 A less burdensome
measure, based on a spot sample collected at one point in time, has
been included in the SHeS nurse interview since 2003. While the
absolute level of sodium measured will differ between the spot and 24hour samples, previous validation studies showed that spot urine
samples could assess trends over time, and differentiate between
population sub-groups, in the same way as 24-hour samples.23,24 As
spot samples are less burdensome to collect than 24 hour samples the
number of people asked to provide them is usually higher than in the
138
24-hour collection studies allowing for more detailed sub-group
analyses to be conducted.
A spot urine sample was collected in all nurse interviews conducted
between 2008 and 2011, and in a sub-sample of nurse interviews in the
2003 survey, to determine dietary sodium (Na). As discussed in the
introduction there is a target to reduce population-level salt intake to no
more than 6g per day (2.4g or 100mmo/l of sodium). 25
To aid the analysis of dietary sodium, spot urine samples were also
assessed for potassium and creatinine. Potassium is important for
digestion, metabolism and muscle tissue regulation and abnormally
high levels of potassium are indicative of hyperkalaemia. Similarly
abnormally low levels can be problematic. The usual range for adults
with a regular diet is 25–125 (mmol/L). Creatinine (Cre), a product of
creatine, was included because while large day-to-day variations occur
in excretion of Na, K and water, Cre excretion is relatively constant from
day-to-day (coefficient of variation 11%).26 Therefore the ratio of Na and
K excretion to creatinine excretion is normally used in the literature to
correct for variability in urine dilution (random urine specimen). The
association between Na/Cre ratios and blood pressure has been
reported in several studies. Na/Cre and K/Cre ratios vary from day-today, however these ratios are less sensitive to incompleteness of urine
specimens than the individual Na, K or Cre excretion. See Volume 3
(Technical Report) for further details of the measurement protocols for
the urine samples.
5.2.3
Vitamin and/or mineral supplement consumption
In 2003 and 2008-2011, the nurse visit included the following question
design to measure self-administered supplement use:
At present, are you taking any vitamins, fish oils, iron supplements,
calcium, other minerals or anything else to supplement your diet or
improve your health, other than those prescribed by your doctor?
Participants were presented with a list of possible supplement types on
a card and asked to say which they used. The options were: vitamins,
fish oils, iron supplements, calcium, other minerals, other supplements.
The tables in this chapter report the total proportion who said they were
taking supplements as well as the proportions taking each of the
specific supplement-types asked about.
5.3
FRUIT AND VEGETABLE CONSUMPTION
5.3.1
Trends in adult consumption of fruit and vegetables since 2003
Information on the quantity of fruit and vegetables men and women
aged 16 and over had consumed in the 24 hours prior to the interview is
presented for 2003 onwards in Table 5.1. The table includes the mean
and median number of portions consumed, as well as the proportions
who met the daily recommended consumption of five or more portions.
139
In 2011, the mean number of portions of fruit and vegetables consumed
by adults aged 16 and over was 3.2 – the same as in 2010. The
separate figures for men and women were also identical in 2010 and
2011 (3.1 mean portions for men and 3.3 for women). This suggests
that the small, but significant, increase from 3.1 portions in 2003 to 3.3
portions in 2008 did not constitute a meaningful sustained trend. It also
highlights the problems of comparing single figures in a time series,
rather than assessing underlying trends.
In line with the trend for mean consumption, the proportion of adults
consuming the recommended five or more portions of fruit or
vegetables a day did not change significantly over time. In both 2010
and 2011, 22% met the recommendation. This was preceded by 23% in
2009, 22% in 2008 and 21% of adults meeting the recommendation in
2003, which suggests an overall picture of trendless fluctuation. When
examined separately, the recent consumption figures for men and
women confirm this unchanging picture. The proportion of men meeting
the recommended daily intake has remained noticeably static across
recent years (22% in 2009 and 20% in all others, including 2011). The
2010 and 2011 results for women were the same (23%), which confirms
that what appeared to be an upward trend in consumption between
2003 and 2009 (from 22% to 25%) has not been sustained.
Table 5.1
5.3.2
Portions of fruit and vegetables consumed by age and sex, 2011
More detailed figures for the quantity of fruit and vegetables consumed
in the 24 hours prior to the interview for adults aged 16 and over in
2011 by age and sex are also presented in Table 5.1. In addition,
figures 5A and 5B show the summary measures of five or more
portions, no portions and the mean number, by age for men and women
separately.
As noted above, adults consumed on average 3.2 portions of fruit and
vegetables per day in 2011. While small, the difference between the
mean number of portions consumed by men (3.1) and women (3.3) was
statistically significant. Consumption varied with age, with the youngest
adults (aged 16-24) consuming the lowest number of portions (2.6), and
the figures for adults aged 25 and over ranging between 3.3 and 3.4
portions per day. As shown in Figures 5A and 5B, this pattern by age
was evident for both men and women.
The proportion of adults who met the recommended daily intake of five
or more portions of fruit and vegetables per day also varied significantly
by gender. While 22% of all adults met the recommendation, women
were more likely to do so than men (23% compared with 20%). The
overall association between age and meeting the recommendation was
not significant, but at 11%, the proportion of men aged 16-24 who ate
five or more portions a day was significantly lower than for all other age
groups (21%-23%).
Figure 5A, Figure 5B, Table 5.1
140
Figure 5A
Proportion of men (16+) eating five or more portions, no portions,
and mean portions consumed, per day, by age, 2011
3.5
25
Percent
2.5
15
2
1.5
10
1
5
Mean daily portions
3
20
0.5
0
0
16-24
25-34
35-44
45-54
55-64
65-74
75+
Age group
% 5 a day
% no portions
Mean portions
Figure 5B
Proportion of w omen (16+) eating five or more portions, no portions,
and mean portions consumed, per day, by age, 2011
25
3.5
Percent
2.5
15
2
1.5
10
1
5
0.5
0
0
16-24
25-34
35-44
45-54
55-64
65-74
75+
Age group
% 5 a day
5.4
% no portions
Mean portions
URINARY SODIUM, POTASSIUM AND CREATININE
5.4.1
Trends in urinary sodium, potassium and creatinine since 2003
Table 5.2 shows the levels of sodium (Na), potassium (K), creatinine
(Cre) and the Na/Cre ratio and K/Cre ratio from spot urine samples in
2003 and 2008-2011 combined. Mean and median levels, as well as
levels for the 5th, 10th, 90th and 95th percentile are presented by age and
sex.
141
Mean daily portions
3
20
Between 2003 and 2008-2011 there was a statistically significant
decline in the mean urinary sodium level for adults aged 16 and over
from 116.1mmol/l to 106.9mmol/l. This decline brings the level closer to
the population-level target of no more than 2.4g or 100mmol/l of sodium
(6g of salt) per day. This reduction was reflected in the fact that levels of
urinary sodium at the upper end of the distribution (the 95 th percentile)
were lower in 2008-2011 than in 2003 (213 mmol/l compared with 222
mmol/l). For a combination of reasons including differing
methodologies, time periods and sample sizes, these results are not
comparable with the results of the Scottish Salt Studies referenced in
the introduction.8,9 It is also important to note that it is not uncommon for
sodium concentrations in spot urine samples to be lower than the levels
found in the 24 hour urine samples.
Creatinine levels followed a similar trend to urinary sodium, with a
decrease in the mean level from 12.2 mmol/l to 10.5 mmol/l. In contrast,
mean urinary potassium levels were broadly similar in 2003 (62.5
mmol/l) and 2008-2011 (61.6 mmol/l) with mean levels that fell within
the range. The usual range for adults with a regular diet is 25–125
(mmol/l)
In line with these findings, the ratios of sodium to creatinine (Na/Cre)
and potassium to creatinine (K/Cre) both increased over time. In 2003
Na/Cre was 12.2; in 2008-2011 it was 12.9. Similarly, the ratio for K/Cre
in 2003 was 5.9 and increased to 6.8 in 2008-2011.
Table 5.2
5.4.2
Urinary sodium, potassium and creatinine by age and sex, 20082011 combined
More detailed figures on urinary sodium and potassium levels by age
and sex in 2008-2011 combined are presented in Table 5.2. The mean
urinary sodium level in 2008-2011 was 106.9mmol/l. This is in excess of
the population-level target of no more than 6g of salt per day (2.4g or
100mmol/l of sodium) for the adult population. In line with findings in
2003, men had significantly higher mean levels of sodium than women
(119.4mmol/l compared with 95.0mmol/l). That the mean level was
higher for men than for women is not unexpected. Once caloric intake
adjustments are made, the target of 6g/day (2.4g or 100mmol/l of
sodium) for adults represents 7g/day (2.7g or 115mmol sodium) for men
and 5g/day (2.0g or 85mmol/l sodium) for women. Mean levels for men
and women in 2008-2011 were both higher than these adjusted figures.
Sodium levels varied significantly with age for both men and women
with levels decreasing as age increased (from 122.0mmol/l in adults
aged 16-44 to 87.2 mmol/l in those aged 65 and over). This varying
pattern by age was noted in 2003.
Differences in urinary potassium levels were in keeping with those seen
for sodium, with higher mean levels among men (65.3 mmol/l) than
women (58.1 mmol/l). The usual range for adults with a regular diet is
considered to be 25–125 (mmol/l). Levels varied by age and were
higher among younger adults aged 16-44 (64.5mmol/l) compared with
142
those aged 65 and over (54.4mmol/l). The pattern by age differed for
men and women, with levels declining successively across the three
age groups among women but only declining between the two oldest
age groups among men.
The ratios of sodium to creatinine (Na/Cre) and potassium to creatinine
(K/Cre) both followed the same patterns as those for mean urinary
sodium and potassium levels, with lower ratio levels for men than for
women, and ratio levels increasing with age for both men and women.
These patterns were consistent with the 2003 results.
Table 5.2
5.5
CONSUMPTION OF VITAMIN AND MINERAL SUPPLEMENTS
5.5.1
Trends in vitamin and mineral supplement consumption since
2003
The proportion of men and women consuming vitamin and mineral
supplements in 2003 and 2008-2011 combined is presented in Table
5.3. In addition to showing the proportion consuming any supplement,
information on consumption of specific types of supplement such as fish
oils, calcium and iron is also shown.
The proportion of adults who reported taking any dietary supplements
was slightly lower in 2008-2011 than in 2003 and (24% and 26%,
respectively). However, this overall figure masks the fact that among
some sub-groups, most notably women aged 45-64, there was a much
higher than average decrease in supplement use (of eight to ten
percentage points).
Table 5.3
5.5.2
Vitamin and mineral supplement consumption by age and sex,
2008-2011 combined
Although the questionnaire cannot be used to establish which types of
vitamin or mineral people take, the results showed that only a minority
of those aged 65 and over took vitamins or minerals regularly, indicating
low adherence to the recommendation for vitamin D.
More detailed figures on vitamin and mineral supplement consumption
by age and sex for 2008-2011 combined are presented in Table 5.3.
In 2008-2011, a greater proportion of women (27%) than men (20%)
took any type of supplement. This pattern was true for all but the
youngest age group, so was not, therefore, caused by a higher
prevalence of supplement use among women of child bearing age (for
whom supplements are recommended before and during pregnancy).
The pattern was also apparent for consumption of specific types of
supplement, and was most pronounced for vitamins or minerals (14% of
women compared with 10% of men) and other supplements (8% and
5% respectively).
Supplement consumption in 2008-2011 was lowest among those aged
16-24 (13%) and increased with age to a peak of 36% of those aged
65-74, before declining somewhat among those aged 75 and over
143
(33%). This pattern was largely similar for both men and women,
although men’s supplement use flattened out among the three oldest
age groups, while women’s use continued to increase until age 75 at
which point it declined.
Table 5.3
5.5.3
Vitamin and mineral supplement consumption (age-standardised)
by Scottish Index of Multiple Deprivation (SIMD), 2008-2011
combined
Table 5.4 presents vitamin and mineral supplement use by the SIMD.
Two measures of SIMD are being used throughout this report. The first,
which uses quintiles, enables comparisons to be drawn between the
most and least deprived 20% of areas and the intermediate quintiles.
The second contrasts the most deprived 15% of areas with the rest of
Scotland (described in the tables as the “85% least deprived areas”). A
description of SIMD is available in the Glossary at the end of this
Volume). To ensure that the comparisons presented in this section are
not confounded by the different age profiles of the SIMD sub-groups,
the data have been age-standardised (age-standardisation is also
described in more detail in the Glossary). Only the age-standardised
data are presented in the tables in this section.
There was a significant association between supplement consumption
and SIMD in 2008-2011. Supplement consumption was similar among
among those living in the 4th and 5th least deprived areas (27%-28%),
dropped to 23% in the next two quintiles, before falling to a low of 17%
among those living in the most deprived quintile. The gradient of the
decline in consumption was a little steeper for women than men. A third
of women (33%) living in the least deprived areas took supplements
compared with a fifth (20%) of those in the most deprived areas. The
equivalent figures for men were 22% and 14%, respectively.
Comparing consumption among those living in the 15% most deprived
areas of Scotland with those living elsewhere confirms the significant
association between consumption and deprivation. 17% of adults in the
15% most deprived areas consumed a supplement compared with 25%
in the rest of Scotland and this difference was evident for both men and
women.
Table 5.4
144
References and notes
1
Scientific Advisory Committee on Nutrition (2003). Salt and Health. The Stationery Office.
http://www.sacn.gov.uk/pdfs/sacn_salt_final.pdf.
2
National Institute for Health and Clinical Excellence (2010). Guidance on the prevention of
cardiovascular disease at the population level.
http://guidance.nic.org.uk/PH25/Guidance/pdf/English
3
Bibbins-Domingo, K., Chertow, G., Coxson, P.G., Moran, A., Lightwood, J.M., Pletcher, M.J., and
Goldman, L. (2010) Projected Effect of Dietary Salt Reductions on Future Cardiovacular Disease.
The New England Journal of Medicine. 362: 590-599.
4
Eating for Health: a Diet Action Plan for Scotland. Edinburgh: The Scottish Office, 1996.
www.scotland.gov.uk/library/documents/diet-00.htm
5
The Scottish Dietary Targets were originally set out in: Eating for Health: a Diet Action Plan for
Scotland. Edinburgh: The Scottish Office, 1996. www.scotland.gov.uk/library/documents/diet00.htm; and were most recently reaffirmed in: Healthy Eating, Active Living: An action plan to
improve diet, increase physical activity and tackle obesity (2008-2011). Edinburgh: Scottish
Government, 2008.
6
Healthy Eating, Active Living: An action plan to improve diet, increase physical activity and tackle
obesity (2008-2011). Edinburgh: Scottish Government, 2008.
7
Scottish Centre for Social Research. (2011). A survey of 24 hour urinary sodium excretion in a
representative sample of the Scottish population as a measure of salt intake. Available from:
www.foodbase.org.uk/results.php?f_category_id=&f_report_id=681
8
Joint Health Surveys Unit (NatCen and UCL). A survey of 24 hour and spot urinary sodium and
potassium excretion in a representative sample of the Scottish population. Food Standards
Agency Scotland, 2007:
http://www.food.gov.uk/multimedia/pdfs/scotlandsodiumreport.pdf
9
Scottish Centre for Social Research. A survey of 24 hour urinary sodium excretion in a
representative sample of the Scottish population as a measure of salt intake.
http://www.natcen.ac.uk/study/scottish-salt-intake
10
The advice provided by the NHS Inform website can be found at: www.nhsinform.co.uk/CommonHealth-Questions/D/Do-I-need-vitamin-supplements
11
See: www.scotland.gov.uk/News/Releases/2012/02/vitamind03022012
12
Gray, L. and Leyland, A. (2009). Chapter 5: Fruit and vegetable consumption. In Bromley, C.,
Bradshaw, P. and Given, L. [eds.] The 2008 Scottish Health Survey – Volume 1: Main Report.
Edinburgh, Scottish Government. www.scotland.gov.uk/Publications/2009/09/28102003/0
13
Gray, L. and Leyland, A. (2010). Chapter 5: Diet. In Bromley, C., Given, L. and Ormston, R. [eds.]
The 2009 Scottish Health Survey – Volume 1: Main Report. Edinburgh, Scottish Government.
http://www.scotland.gov.uk/Publications/2010/09/23154223/0
14
Gray, L. and Leyland, A. (2011). Chapter 5: Fruit and vegetable consumption. In Bromley, C. and
Given, L. [eds.] The 2010 Scottish Health Survey – Volume 1: Main Report. Edinburgh, Scottish
Government. www.scotland.gov.uk/Publications/2011/09/27084018/0
15
Towards a Healthier Scotland. Edinburgh: The Scottish Executive, 1999.
www.scotland.gov.uk/library/documents-w7/tahs-00.htm
16
Improving Health in Scotland – the Challenge. Edinburgh: The Scottish Executive, 2003.
www.scotland.gov.uk/Publications/2003/03/16747/19929
145
17
Hungry for Success – A whole school approach to school meals in Scotland, Edinburgh: The
Stationery Office, 2003.
18
Eating for Health – Meeting the Challenge. Edinburgh: The Scottish Executive, 2004.
www.scotland.gov.uk/Publications/2004/07/19624/39995
19
Better Health, Better Care Action Plan. Edinburgh: Scottish Government, 2007.
20
Preventing Overweight and Obesity in Scotland: A Route Map Towards Healthy Weight.
Edinburgh: the Scottish Government, 2010.
21
Obesity Route Map: Action Plan – Version 1.0. Edinburgh: Scottish Government, 2011.
www.scotland.gov.uk/Resource/Doc/346007/0115166.pdf
22
Roe, L., Strong, C., Whiteside, C., Neil, A. and Mant, D. (1994). Dietary intervention in primary
care: Validity of the DINE method for assessment. Family Practice. 11: 375-81.
23
Joint Health Surveys Unit (NatCen and UCL) (2004). A spot urine sample for the assessment of
dietary sodium and potassium in HSE: results of a comparison between spot urine and 24- hour
urine collections.
24
Joint Health Surveys Unit (NatCen and UCL). (2007). A survey of 24 hour and spot urinary sodium
and potassium excretion in a representative sample of the Scottish population.
25
Scottish Centre for Social Research. (2011). A survey of 24 hour urinary sodium excretion in a
representative sample of the Scottish population as a measure of salt intake. Available from:
www.foodbase.org.uk/results.php?f_category_id=&f_report_id=681
26
Bingham SA, Williams R, Cole TJ, et al. Reference values for analytes of 4-h urine collections
known to be complete. Ann Clin Biochem 1988; 25:610
146
Table list
Table 5.1
Table 5.2
Table 5.3
Table 5.4
Adult fruit and vegetable consumption, 2003, 2008, 2009, 2010, 2011, by age
and sex
Urinary sodium (Na), potassium (K) and creatinine (Cre), Na/Cre ratio, K/Cre
ratio, 2003, 2008-2011 combined, by age and sex
Consumption of vitamin or mineral supplements, 2003, 2008-2011 combined,
by age and sex
Consumption of vitamin or mineral supplements, 2008-2011 combined, (agestandardised), by Scottish Index of Multiple Deprivation (SIMD) and sex
147
Table 5.1
Adult fruit and vegetable consumption, 2003, 2008, 2009, 2010, 2011, by age
and sex
Aged 16 and over
Portions per day
Men
2003
None
5 portions or more
Mean
Standard error of the mean
Median
2008
None
5 portions or more
Mean
Standard error of the mean
Median
2009
None
5 portions or more
Mean
Standard error of the mean
Median
2010
None
5 portions or more
Mean
Standard error of the mean
Median
2011
None
Less than 1 portion
1 portion or more but less than 2
2 portions or more but less than 3
3 portions or more but less than 4
4 portions or more but less than 5
5 portions or more
Mean
Standard error of the mean
Median
2003, 2008, 2009, 2010, 2011
Age
Total
16-24
25-34
35-44
45-54
55-64
65-74
75+
%
%
%
%
%
%
%
%
15
17
13
18
13
19
8
22
8
24
6
18
8
16
11
20
2.5
0.15
2.0
2.9
0.14
2.3
2.9
0.11
2.3
3.2
0.13
2.7
3.4
0.11
3.0
3.1
0.09
2.7
2.9
0.13
2.7
3
0.06
2.7
15
14
10
20
13
19
9
20
10
24
7
25
6
18
10
20
2.5
0.17
2.0
3.0
0.16
2.3
3.1
0.24
2.3
3.2
0.11
3.0
3.4
0.14
3.0
3.4
0.13
3.0
3.1
0.13
2.8
3.1
0.07
2.7
18
16
15
21
10
21
11
22
7
26
6
25
4
23
11
22
2.6
0.17
2.0
3.1
0.15
3.0
3.1
0.11
2.7
3.1
0.11
2.8
3.5
0.11
3.2
3.4
0.12
3.0
3.4
0.12
3.1
3.1
0.05
2.8
22
16
11
21
11
19
12
20
9
21
7
25
7
22
12
20
2.6
0.17
2.0
3.1
0.13
2.7
2.9
0.11
2.7
3.1
0.12
2.7
3.3
0.13
3.0
3.3
0.12
3.0
3.2
0.15
2.7
3.1
0.06
2.7
16
4
25
18
14
11
11
14
2
18
18
15
12
22
8
4
21
19
13
13
22
10
3
20
19
15
11
22
9
4
17
18
17
13
23
6
3
18
20
16
16
21
3
4
15
21
21
14
22
10
3
19
19
16
12
20
2.4
0.16
2.0
3.3
0.16
2.7
3.2
0.12
2.7
3.1
0.11
2.7
3.3
0.11
3.0
3.3
0.10
3.0
148
3.4
3.1
0.12
0.05
3.0
2.7
Continued…
Table 5.1
- Continued
Aged 16 and over
Portions per day
Women
2003
None
5 portions or more
Mean
Standard error of the mean
Median
2008
None
5 portions or more
Mean
Standard error of the mean
Median
2009
None
5 portions or more
Mean
Standard error of the mean
Median
2010
None
5 portions or more
Mean
Standard error of the mean
Median
2011
None
Less than 1 portion
1 portion or more but less than 2
2 portions or more but less than 3
3 portions or more but less than 4
4 portions or more but less than 5
5 portions or more
Mean
Standard error of the mean
Median
2003, 2008, 2009, 2010, 2011
Age
Total
16-24
25-34
35-44
45-54
55-64
65-74
75+
%
%
%
%
%
%
%
%
16
18
11
24
10
21
6
27
4
27
5
18
5
18
8
22
2.7
0.16
2.0
3.2
0.12
2.7
3.1
0.09
2.8
3.5
0.10
3.2
3.6
0.10
3.3
3.0
0.08
2.7
3.0
0.11
2.7
3.2
0.05
3.0
9
15
9
26
8
22
7
29
7
29
4
26
4
17
7
24
2.9
0.17
2.2
3.3
0.13
3.0
3.3
0.10
3.0
3.7
0.13
3.3
3.8
0.12
3.3
3.6
0.12
3.3
3.1
0.12
2.8
3.4
0.06
3
10
19
7
25
8
23
10
23
4
30
6
27
4
26
7
25
3.0
0.18
2.3
3.4
0.13
2.8
3.4
0.10
3.0
3.3
0.10
3.0
3.9
0.10
3.3
3.5
0.10
3.3
3.5
0.10
3.3
3.4
0.05
3.0
16
17
10
24
9
22
8
26
7
24
5
26
5
17
9
23
2.7
0.14
2.0
3.4
0.14
3.0
3.3
0.10
3.0
3.4
0.10
3.0
3.4
0.11
3.0
3.5
0.11
3.0
3.3
0.09
3.0
3.3
0.05
3.0
18
6
24
13
12
8
19
8
3
19
17
16
13
24
7
4
15
18
18
16
22
7
4
17
17
18
12
25
6
3
15
20
19
12
25
4
4
18
16
19
16
22
6
4
16
18
20
13
22
8
4
18
17
17
13
23
2.7
0.20
2.0
3.4
0.12
3.0
3.4
0.09
3.0
3.5
0.09
3.0
3.5
0.09
3.0
3.4
0.10
3.2
149
3.3
3.3
0.09
0.05
3.0
3.0
Continued…
Table 5.1
- Continued
Aged 16 and over
Portions per day
All adults
2003
None
5 portions or more
Mean
Standard error of the mean
Median
2008
None
5 portions or more
Mean
Standard error of the mean
Median
2009
None
5 portions or more
Mean
Standard error of the mean
Median
2010
None
5 portions or more
Mean
Standard error of the mean
Median
2011
None
Less than 1 portion
1 portion or more but less than 2
2 portions or more but less than 3
3 portions or more but less than 4
4 portions or more but less than 5
5 portions or more
Mean
Standard error of the mean
Median
2003, 2008, 2009, 2010, 2011
Age
Total
16-24
25-34
35-44
45-54
55-64
65-74
75+
%
%
%
%
%
%
%
%
15
17
12
21
11
20
7
25
6
26
5
18
6
17
9
21
2.6
0.12
2.0
3.1
0.10
2.7
3.0
0.08
2.7
3.4
0.09
3.0
3.5
0.09
3.0
3.1
0.07
2.7
3.0
0.09
2.7
3.1
0.05
2.7
12
14
10
23
10
21
8
25
8
27
6
25
5
17
9
22
2.7
0.13
2.0
3.2
0.11
2.7
3.2
0.13
2.7
3.5
0.09
3.0
3.6
0.10
3.2
3.5
0.10
3.2
3.1
0.09
2.8
3.3
0.05
3.0
14
17
11
23
9
22
10
22
5
28
6
26
4
25
9
23
2.8
0.12
2.0
3.3
0.11
3.0
3.2
0.08
3.0
3.2
0.08
3.0
3.7
0.09
3.3
3.5
0.09
3.2
3.5
0.09
3.3
3.3
0.04
3.0
19
17
11
23
10
21
10
23
8
23
6
25
6
19
10
22
2.6
0.12
2.0
3.2
0.11
3.0
3.1
0.08
2.8
3.3
0.08
3.0
3.3
0.09
3.0
3.4
0.09
3.0
3.2
0.09
3.0
3.2
0.04
3.0
17
5
24
16
13
10
15
11
3
18
17
16
12
23
7
4
18
19
15
14
22
9
3
18
18
17
12
23
7
3
16
19
18
12
24
5
4
18
18
18
16
22
5
4
16
19
21
14
22
9
4
18
18
17
13
22
2.6
0.14
2.0
3.4
0.11
3.0
3.3
0.08
3.0
3.3
0.07
3.0
3.4
0.08
3.0
3.4
0.08
3.0
150
3.3
3.2
0.08
0.04
3.0
3.0
Continued…
Table 5.1
- Continued
Aged 16 and over
Portions per day
Bases (weighted):
Men 2003
Men 2008
Men 2009
Men 2010
Men 2011
Women 2003
Women 2008
Women 2009
Women 2010
Women 2011
All adults 2003
All adults 2008
All adults 2009
All adults 2010
All adults 2011
Bases (unweighted):
Men 2003
Men 2008
Men 2009
Men 2010
Men 2011
Women 2003
Women 2008
Women 2009
Women 2010
Women 2011
All adults 2003
All adults 2008
All adults 2009
All adults 2010
All adults 2011
2003, 2008, 2009, 2010, 2011
Age
Total
16-24
25-34
35-44
45-54
55-64
65-74
75+
580
464
536
515
535
566
444
511
494
514
1142
908
1047
1009
1050
610
481
568
559
583
658
487
571
557
580
1258
968
1138
1116
1163
761
563
634
589
613
813
616
695
644
671
1568
1179
1328
1233
1285
670
555
649
631
655
691
591
700
681
710
1355
1146
1349
1312
1365
569
480
563
542
564
602
504
590
571
594
1169
983
1153
1114
1157
406
327
387
374
390
493
383
450
432
449
897
710
836
806
839
260
218
259
253
266
468
350
410
396
413
726
568
668
649
679
3857
3087
3594
3465
3606
4291
3375
3926
3775
3931
8115
6462
7520
7239
7537
336
246
271
274
307
404
333
383
373
364
737
579
654
647
671
455
317
406
420
399
600
451
580
566
562
1048
768
986
986
961
733
460
550
478
516
887
648
780
681
711
1613
1108
1330
1159
1227
616
535
602
566
598
795
632
733
762
803
1404
1167
1335
1328
1401
633
525
575
555
600
778
632
735
701
738
1409
1157
1310
1256
1338
510
453
517
489
511
581
515
550
574
596
1088
968
1067
1063
1107
327
304
362
330
344
493
410
480
470
486
817
714
842
800
830
3610
2840
3283
3112
3275
4538
3621
4241
4127
4260
8116
6461
7524
7239
7535
151
Table 5.2
Urinary sodium (Na), potassium (K) and creatinine (Cre), Na/Cre ratio, K/Cre
ratio, 2003, 2008-2011 combined, by age and sex
Aged 16 and over with a valid urine sample
Urinary sodium, potassium,
creatinine (mmol/l)
2003, 2008-2011 combined
Age
Total
16-44
45-64
65+
2003
Sodium (mmol/l)
Mean
Standard error of the mean
5th percentile
10th percentile
Median
90th percentile
95th percentile
144.6
5.87
33
60
143
227
241
120.0
4.34
37
50
118
200
218
105.4
4.05
33
44
106
160
186
129.3
3.69
34
51
125
215
230
Potassium (mmol/l)
Mean
Standard error of the mean
5th percentile
10th percentile
Median
90th percentile
95th percentile
70.2
2.63
17
28
69
114
128
68.2
2.76
20
24
61
125
134
56.2
2.65
18
22
54
92
103
67.1
1.70
18
26
63
115
129
Creatinine (mmol/l)
Mean
Standard error of the mean
5th percentile
10th percentile
Median
90th percentile
95th percentile
15.3
0.60
5.2
6.5
14.7
24.8
28.6
14.4
0.69
3.3
5.1
14.0
23.2
27.5
11.4
0.62
3.2
4.4
10.5
19.8
23.4
14.3
0.37
3.8
5.6
13.9
23.5
27.5
Na/Cre ratio
Mean
Standard error of the mean
5th percentile
10th percentile
Median
90th percentile
95th percentile
10.8
0.49
3.7
4.9
10.0
17.7
20.1
10.1
0.56
3.5
4.1
9.0
16.2
21.8
13.1
1.95
3.3
4.9
9.3
20.2
30.8
10.9
0.42
3.5
4.7
9.5
17.7
21.8
K/Cre ratio
Mean
Standard error of the mean
5th percentile
10th percentile
Median
90th percentile
95th percentile
5.1
0.19
1.8
2.3
4.7
8.1
9.6
5.2
0.21
2.4
2.8
4.7
8.1
10.0
5.6
0.28
2.8
3.1
5.0
7.9
9.6
5.2
0.13
2.0
2.6
4.7
8.1
9.6
Continued…
Men
152
Table 5.2
- Continued
Aged 16 and over with a valid urine sample
Urinary sodium, potassium,
creatinine (mmol/l)
2003, 2008-2011 combined
Age
Total
16-44
45-64
65+
2008-2011
Sodium (mmol/l)
Mean
Standard error of the mean
5th percentile
10th percentile
Median
90th percentile
95th percentile
132.1
2.82
36
49
134
210
230
112.4
2.15
30
45
107
186
208
98.9
2.06
36
44
96
161
175
119.4
1.61
34
46
115
196
216
Potassium (mmol/l)
Mean
Standard error of the mean
5th percentile
10th percentile
Median
90th percentile
95th percentile
66.3
1.73
15
22
61
115
134
68.0
1.44
18
26
66
114
125
57.8
1.39
19
25
54
97
113
65.3
1.00
17
23
61
112
129
Creatinine (mmol/l)
Mean
Standard error of the mean
5th percentile
10th percentile
Median
90th percentile
95th percentile
13.7
0.33
3.4
4.5
13.6
22.4
26.2
11.6
0.25
2.6
3.6
11.2
19.2
22.3
9.7
0.26
2.6
3.6
9.3
16.5
19.0
12.3
0.19
2.8
3.9
11.7
20.5
24.3
Na/Cre ratio
Mean
Standard error of the mean
5th percentile
10th percentile
Median
90th percentile
95th percentile
11.5
0.30
3.5
4.5
10.6
18.8
22.9
11.7
0.28
3.8
4.9
10.4
19.6
23.7
12.7
0.42
3.9
4.9
10.9
21.8
27.9
11.8
0.19
3.6
4.7
10.6
20.0
23.9
K/Cre ratio
Mean
Standard error of the mean
5th percentile
10th percentile
Median
90th percentile
95th percentile
5.3
0.12
2.1
2.4
4.9
9.0
10.6
6.5
0.11
3.0
3.5
6.1
10.1
11.5
6.5
0.12
3.4
3.9
6.0
9.6
11.2
5.9
0.07
2.4
2.9
5.5
9.6
11.0
Continued…
153
Table 5.2
- Continued
Aged 16 and over with a valid urine sample
Urinary sodium, potassium,
creatinine (mmol/l)
2003, 2008-2011 combined
Age
Total
16-44
45-64
65+
2003
Sodium (mmol/l)
Mean
Standard error of the mean
5th percentile
10th percentile
Median
90th percentile
95th percentile
118.7
4.54
28
38
113
206
236
93.3
3.66
25
32
83
176
195
90.9
4.07
24
36
88
149
182
104.3
2.88
26
36
97
189
214
Potassium (mmol/l)
Mean
Standard error of the mean
5th percentile
10th percentile
Median
90th percentile
95th percentile
65.7
2.99
13
17
63
117
142
53.9
2.05
16
19
48
95
117
50.2
2.48
14
18
43
94
107
58.3
1.57
14
19
52
108
132
Creatinine (mmol/l)
Mean
Standard error of the mean
5th percentile
10th percentile
Median
90th percentile
95th percentile
12.2
0.56
2.4
3.6
11.7
20.8
24.2
8.8
0.37
2.0
2.4
7.9
16.6
18.7
8.6
0.45
2.1
2.7
7.4
15.7
19.4
10.3
0.30
2.2
2.8
9.3
19.1
22.1
Na/Cre ratio
Mean
Standard error of the mean
5th percentile
10th percentile
Median
90th percentile
95th percentile
11.9
0.54
3.7
4.2
10.9
19.8
23.9
13.4
0.64
4.1
5.3
11.6
22.2
26.4
15.8
1.34
3.2
4.6
11.9
26.9
40.4
13.3
0.46
3.6
4.8
11.3
22.2
27.3
K/Cre ratio
Mean
Standard error of the mean
5th percentile
10th percentile
Median
90th percentile
95th percentile
5.9
0.18
2.0
2.8
5.5
9.5
10.5
7.2
0.27
2.9
3.4
6.4
12.2
13.3
6.7
0.27
3.1
3.4
6.1
10.1
12.7
6.5
0.14
2.6
3.1
6.0
10.5
12.5
Continued…
Women
154
Table 5.2
- Continued
Aged 16 and over with a valid urine sample
Urinary sodium, potassium,
creatinine (mmol/l)
2003, 2008-2011 combined
Age
Total
16-44
45-64
65+
2008-2011
Sodium (mmol/l)
Mean
Standard error of the mean
5th percentile
10th percentile
Median
90th percentile
95th percentile
111.7
2.46
25
34
100
204
226
83.7
1.83
19
27
76
151
179
77.9
2.00
23
29
71
135
161
95.0
1.40
23
30
85
183
206
Potassium (mmol/l)
Mean
Standard error of the mean
5th percentile
10th percentile
Median
90th percentile
95th percentile
62.7
1.49
13
18
56
117
135
55.9
1.27
13
17
49
103
123
51.8
1.27
15
20
46
93
111
58.1
0.86
13
18
51
109
128
Creatinine (mmol/l)
Mean
Standard error of the mean
5th percentile
10th percentile
Median
90th percentile
95th percentile
10.3
0.24
2.2
3.1
9.6
18.3
21.0
7.8
0.20
1.4
2.0
6.7
15.6
17.0
7.5
0.23
1.6
2.2
6.6
13.9
16.9
8.9
0.14
1.7
2.3
7.8
16.6
19.4
Na/Cre ratio
Mean
Standard error of the mean
5th percentile
10th percentile
Median
90th percentile
95th percentile
13.3
0.32
3.7
5.0
11.8
24.3
28.6
14.2
0.35
3.4
5.0
12.2
25.5
31.7
14.6
0.62
2.7
4.3
11.7
25.2
37.4
13.9
0.23
3.4
4.9
11.8
24.7
30.6
K/Cre ratio
Mean
Standard error of the mean
5th percentile
10th percentile
Median
90th percentile
95th percentile
6.8
0.13
2.4
3.1
6.2
11.2
13.0
8.4
0.14
3.7
4.3
7.5
13.7
15.9
8.2
0.19
3.8
4.2
7.3
13.3
16.6
7.6
0.09
3.0
3.7
6.9
12.4
15.2
Continued…
155
Table 5.2
- Continued
Aged 16 and over with a valid urine sample
Urinary sodium, potassium,
creatinine (mmol/l)
2003, 2008-2011 combined
Age
Total
16-44
45-64
65+
2003
Sodium (mmol/l)
Mean
Standard error of the mean
5th percentile
10th percentile
Median
90th percentile
95th percentile
131.3
4.35
30
45
125
220
238
106.8
2.72
27
39
101
184
208
96.6
3.21
26
38
94
157
186
116.1
2.76
29
40
110
202
222
Potassium (mmol/l)
Mean
Standard error of the mean
5th percentile
10th percentile
Median
90th percentile
95th percentile
67.9
1.86
14
22
65
116
137
61.1
1.71
17
21
56
115
132
52.5
1.80
15
20
47
94
107
62.5
1.13
16
21
58
110
131
Creatinine (mmol/l)
Mean
Standard error of the mean
5th percentile
10th percentile
Median
90th percentile
95th percentile
13.7
0.44
2.8
4.7
13.1
23.3
26.4
11.6
0.40
2.3
3.1
10.4
21.1
23.6
9.7
0.35
2.2
3.2
8.7
18.3
21.4
12.2
0.25
2.4
3.6
11.4
22.0
25.0
Na/Cre ratio
Mean
Standard error of the mean
5th percentile
10th percentile
Median
90th percentile
95th percentile
11.4
0.38
3.7
4.4
10.6
19.0
23.3
11.7
0.42
3.6
4.7
10.2
20.2
24.0
14.7
1.28
3.2
4.7
11.2
24.1
33.3
12.2
0.32
3.5
4.7
10.4
20.2
25.4
K/Cre ratio
Mean
Standard error of the mean
5th percentile
10th percentile
Median
90th percentile
95th percentile
5.5
0.14
1.9
2.5
5.2
9.0
10.1
6.2
0.18
2.6
3.0
5.3
10.7
12.5
6.3
0.20
3.0
3.4
5.5
9.6
12.6
5.9
0.11
2.3
2.9
5.3
9.6
11.3
Continued
All adults
156
Table 5.2
- Continued
Aged 16 and over with a valid urine sample
Urinary sodium, potassium,
creatinine (mmol/l)
2003, 2008-2011 combined
Age
Total
16-44
45-64
65+
2008-2011
Sodium (mmol/l)
Mean
Standard error of the mean
5th percentile
10th percentile
Median
90th percentile
95th percentile
122.0
1.94
29
41
117
206
227
97.7
1.50
23
32
92
172
194
87.2
1.52
24
34
83
148
169
106.9
1.15
26
36
99
190
213
Potassium (mmol/l)
Mean
Standard error of the mean
5th percentile
10th percentile
Median
90th percentile
95th percentile
64.5
1.20
14
20
60
116
134
61.8
1.03
15
20
59
109
125
54.4
0.98
16
22
50
94
112
61.6
0.70
15
20
56
111
129
Creatinine (mmol/l)
Mean
Standard error of the mean
5th percentile
10th percentile
Median
90th percentile
95th percentile
12.0
0.22
2.5
3.6
11.5
20.7
24.4
9.7
0.17
1.8
2.5
9.0
17.4
20.0
8.5
0.18
1.8
2.5
7.6
15.2
18.3
10.5
0.13
2.0
2.9
9.8
19.0
22.1
Na/Cre ratio
Mean
Standard error of the mean
5th percentile
10th percentile
Median
90th percentile
95th percentile
12.4
0.22
3.6
4.7
11.1
21.9
26.8
13.0
0.24
3.5
5.0
11.1
22.4
28.2
13.7
0.40
3.3
4.6
11.4
24.0
30.0
12.9
0.16
3.5
4.8
11.2
22.5
27.8
K/Cre ratio
Mean
Standard error of the mean
5th percentile
10th percentile
Median
90th percentile
95th percentile
6.0
0.09
2.2
2.7
5.5
10.1
11.8
7.4
0.09
3.2
3.8
6.8
11.9
14.1
7.5
0.13
3.6
4.0
6.6
11.8
14.7
6.8
0.06
2.6
3.2
6.2
11.1
13.0
Continued…
157
Table 5.2
- Continued
Aged 16 and over with a valid urine sample
Urinary sodium, potassium,
creatinine (mmol/l)
Bases (weighted):
Men 2003
Men 2008-2011
Women 2003
Women 2008-2011
All adults 2003
All adults 2008-2011
Bases (unweighted):
Men 2003
Men 2008-2011
Women 2003
Women 2008-2011
All adults 2003
All adults 2008-2011
2003, 2008-2011 combined
Age
Total
16-44
45-64
65+
256
903
269
894
525
1797
188
643
183
670
371
1313
91
338
142
428
233
766
535
1884
594
1992
1129
3876
193
588
256
816
449
1404
197
660
235
822
432
1482
118
466
149
531
267
997
508
1714
640
2169
1148
3883
158
Table 5.3
Consumption of vitamin or mineral supplements, 2003, 2008-2011 combined,
by age and sex
Aged 16 and over with a nurse visit
Consumption of vitamin or
mineral supplements
2003, 2008-2011 combined
Age
Total
16-24
25-34
35-44
45-54
55-64
65-74
75+
%
%
%
%
%
%
%
%
2003
Vitamins / minerals
Fish oils
Iron supplements
Calcium
Other minerals
Other supplements
10
6
1
2
1
15
8
1
0
2
3
11
8
1
0
1
4
10
12
1
4
4
11
16
1
1
3
8
7
20
0
1
3
10
12
22
1
1
3
6
11
12
1
0
3
5
Total taking any supplementa
No supplements taken
15
85
20
80
18
82
19
81
27
73
29
71
30
70
21
79
2008-2011
Vitamins / minerals
Fish oils
Iron supplements
Calcium
Other minerals
Other supplements
10
5
0
1
3
1
10
5
0
0
1
5
10
4
1
1
4
5
11
10
2
1
3
3
12
16
1
1
5
7
8
23
1
0
5
7
7
22
0
4
7
10
11
1
1
3
5
Total taking any supplementa
No supplements taken
14
86
16
84
15
85
18
82
27
73
31
69
30
70
20
80
12
4
4
0
1
5
16
4
4
1
4
5
15
8
2
1
5
8
19
19
2
3
11
18
17
26
2
5
10
21
11
21
1
3
4
12
9
23
0
3
3
9
14
14
2
2
6
11
17
83
22
78
25
75
37
63
44
56
35
65
32
68
30
70
7
3
1
0
1
5
15
4
5
0
4
5
15
6
2
1
5
5
17
12
2
3
7
9
15
18
2
2
7
13
15
24
0
3
8
13
11
22
2
1
6
6
14
12
2
2
5
8
12
88
23
77
23
77
29
71
34
66
41
59
Men
Women
2003
Vitamins / minerals
Fish oils
Iron supplements
Calcium
Other minerals
Other supplements
Total taking any supplement
No supplements taken
a
2008-2011
Vitamins / minerals
Fish oils
Iron supplements
Calcium
Other minerals
Other supplements
Total taking any supplement
No supplements taken
a
159
34
27
66
73
Continued…
Table 5.3
- Continued
Aged 16 and over
Consumption of vitamin or
mineral supplements
2003, 2008-2011 combined
Age
Total
16-24
25-34
35-44
45-54
55-64
65-74
75+
%
%
%
%
%
%
%
%
2003
Vitamins / minerals
Fish oils
Iron supplements
Calcium
Other minerals
Other supplements
11
5
2
0
2
3
16
6
3
0
3
4
13
8
1
1
3
7
15
15
1
1
8
11
14
21
1
3
7
15
9
20
0
2
4
11
10
22
1
2
3
8
13
13
1
1
4
8
Total taking any supplementa
No supplements taken
16
84
21
79
21
79
28
72
35
65
32
68
31
69
26
74
9
4
1
0
2
3
12
5
3
0
3
5
13
5
1
1
4
5
14
11
2
2
5
6
13
17
1
1
6
10
11
23
1
2
7
10
9
22
1
0
5
7
12
11
1
1
4
7
13
87
20
80
19
81
24
76
30
70
36
64
33
67
24
76
175
149
315
233
490
382
2572
2045
2872
2228
5444
4273
All adults
2008-2011
Vitamins / minerals
Fish oils
Iron supplements
Calcium
Other minerals
Other supplements
Total taking any supplementa
No supplements taken
Bases (weighted):
Men 2003
375
408
511
448
382
273
Men 2008-2011
304
328
355
370
319
220
Women 2003
373
441
547
463
404
330
Women 2008-2011
292
327
387
399
336
255
All adults 2003
748
849
1058
910
786
602
All adults 2008-2011
596
655
742
769
655
475
Bases (unweighted):
Men 2003
178
278
463
421
452
366
Men 2008-2011
133
201
305
345
365
312
Women 2003
221
378
605
556
564
404
Women 2008-2011
190
299
426
460
440
347
All adults 2003
399
656
1068
977
1016
770
All adults 2008-2011
323
500
731
805
805
659
a May be less than the sum of those taking individual supplements as some participants were
than one type.
160
243
2401
196
1857
315
3043
254
2416
558
5444
450
4273
taking more
Table 5.4
Consumption of vitamin or mineral supplements, 2008-2011 combined, (agestandardised), by Scottish Index of Multiple Deprivation and sex
Aged 16 and over
Consumption of vitamin or
mineral supplements
2008-2011 combined
Scottish Index of Multiple Deprivation quintile
th
5
(least
deprived)
th
rd
SIMD 85/15
st
nd
1
(most
deprived)
3
%
%
%
%
%
%
%
Vitamins / minerals
Fish oils
Iron supplements
Calcium
Other minerals
Other supplements
13
14
1
0
3
5
12
10
1
0
3
6
10
10
1
1
5
6
8
10
1
0
6
4
6
8
1
1
1
3
10
11
1
0
4
5
7
7
1
2
1
2
Total taking any supplementa
No supplements taken
22
78
23
77
19
81
21
79
14
86
21
79
14
86
Vitamins / minerals
Fish oils
Iron supplements
Calcium
Other minerals
Other supplements
18
16
1
2
6
10
16
13
4
1
6
9
11
12
2
1
5
9
13
11
3
1
6
8
11
7
1
2
4
4
14
13
2
1
6
9
11
6
1
2
3
3
Total taking any supplementa
No supplements taken
33
67
32
68
27
73
26
74
20
80
29
71
20
80
Vitamins / minerals
Fish oils
Iron supplements
Calcium
Other minerals
Other supplements
15
15
1
1
5
8
14
12
2
1
4
7
10
11
1
1
5
8
11
11
2
1
6
6
9
7
1
2
3
3
12
12
2
1
5
7
9
7
1
2
2
3
Total taking any supplementa
No supplements taken
28
72
27
73
23
77
23
77
17
83
25
75
17
83
Men
Women
All adults
2
85%
15%
least
most
deprived deprived
4
Bases (weighted):
Men 2008-2011
416
473
390
392
374
1753
291
Women 2008-2011
465
453
445
414
451
1881
348
All adults 2008-2011
881
926
835
805
825
3634
639
Bases (unweighted):
Men 2008-2011
383
444
371
337
322
1617
240
Women 2008-2011
514
527
493
439
443
2077
339
All adults 2008-2011
897
971
864
776
765
3694
579
a May be less than the sum of those taking individual supplements as some participants were taking more
than one type.
161
Physical Activity
Chapter 6
6 PHYSICAL ACTIVITY
Tessa Hill
SUMMARY
In 2011, 39% of adults aged 16 and over met the physical activity
recommendations with men more likely than women to meet them (45%
compared with 33%). Between 2008 and 2011, there was no significant
change in the proportion meeting the recommendations.
The proportions of men and women meeting the recommended activity levels
varied significantly with age in 2011. Among men, the proportion meeting the
recommendations fell from 63% of those aged 16-24 to 11% of those aged 75
and over. Among women, those aged 25-34 were most likely to meet the
recommendation (45%), the proportion meeting it then declined by age to 6%
for those aged 75 and over.
84% of men and 79% of women participated in at least 10 minutes of physical
activity during the 4 weeks prior to being interviewed. Men were active on a
mean of 16.2 days over that period compared with 13.2 days for women.
In 2011, sports and exercise was the most popular type of physical activity for
men (54%) and second most common for women (45%) after heavy
housework (61%).
41% of men and 31% of women reported having walked at a brisk pace for at
least 10 minutes in the 4 weeks prior to interview.
Activity levels were related to household income, with those in higher income
households more likely than those with less income to meet the recommended
activity levels. For example, 38% of women in the highest income quintile met
the recommendations compared with 27% in the lowest income quintile.
Deprivation was strongly related to activity levels with adults living in the two
most deprived SIMD quintiles least likely to meet the recommendations (34%35%) compared with 42% in the highest two deprivation quintiles).
6.1
INTRODUCTION
The health benefits of a physically active lifestyle are well documented and
there is abundant evidence that regular activity is related to a reduced incidence
of chronic conditions of particular concern in Scotland, such as cardiovascular
disease, obesity, and type 2 diabetes.1 Physical activity is also associated with
better health and cognitive function among older people, and can reduce the
risk of falls in those with mobility problems. 2 In 2008, the World Health
Organisation (WHO) estimated that 3.2 million deaths per year could be
attributed to low physical activity levels.3
The introductions to the physical activity chapters in the three most recent
Scottish Health Survey (SHeS) reports provided a comprehensive overview of
the recent policy context.4,5,6 They outlined a number of actions being taken by
the Government and NHS Scotland to promote physical activity as part of a
healthy lifestyle, and initiatives designed to help adults increase their activity
levels. These included:
163
The 2003 Physical Activity Taskforce publication Let's Make Scotland
More Active: A strategy for physical activity,7 and its five year review,
conducted in 2008.8
The Scottish Government’s 2008 action plan Healthy Eating, Active
Living: An action plan to improve diet, increase physical activity and
tackle obesity (2008-2011).9
The Scottish Government’s Route Map for tackling obesity and
associated Obesity Route Map Action Plan, published in 2011.10 The
Scottish Health Survey’s measures of the proportion of adults who meet
the physical activity recommendations, and the time spent in front of a
screen, are being used to monitor progress towards the Plan’s
intermediate-term goal to increase energy expenditure.11
The opportunities presented by the 2012 Olympics and 2014
Commonwealth Games to help accelerate progress towards making
Scotland more active.
Allied to the above initiatives, the following adult physical activity target (set out
in Let’s Make Scotland More Active) is monitored by SHeS:
50% of adults should be meeting the current recommended
levels of physical activity by the year 2022
In addition to this target, the revised National Performance Framework (NPF)12
published by the Scottish Government in December 2011 includes the following
new national indicator for adults, also measured via SHeS: 13
Increase physical activity
As with the 2022 target, the new indicator is measured in relation to the
proportion of adults meeting the recommended level of activity - adults are
recommended to accumulate at least 30 minutes of moderate activity on most
days of the week (i.e. on at least five), which can be accumulated in shorter
bouts of as little as 10 minutes. The 2010 report outlined the more detailed
recommendations for children’s physical activity published jointly in July 2011
by the UK’s four Chief Medical Officers.14 The new UK guidelines for adults are
tailored to specific age groups across the lifecourse:15
Children and young people aged 5-18
o Should engage in moderate to vigorous activity for at least 60
minutes and up to several hours every day.
o Vigorous activities, including those that strengthen muscles and
bones, should be carried out on at least 3 days a week.
o Extended periods of sedentary activities should be limited.
Adults aged 19-64
o Should be active daily.
o Should engage in at least moderate activity for a minimum of 150
minutes a week (accumulated in bouts of at least 10 minutes) – for
example by being active for 30 minutes on five days a week.
o Alternatively, 75 minutes of vigorous activity spread across the
week will confer similar benefits to 150 minutes of moderate
activity (or a combination of moderate and vigorous activity).
164
o Activities that strengthen muscles should be carried out on at least
two days a week.
o Extended periods of sedentary activities should be limited.
Adults aged 65 and over
o In addition to the guidance set out above for adults aged 19-64,
older adults are advised that any amount of physical activity is
better than none, and more activity provides greater health
benefits.
o Older adults at risk of falls should incorporate activities to improve
balance and coordination on at least two days a week.
To help monitor these new recommendations the SHeS team worked with the
Scottish Physical Activity Research Collaboration to design new questions
about adult sporting activities to assess their muscle strengthening potential
and, for those aged 65 and over, their balance improving potential. In addition,
more questions about sedentary activity are being asked (from 2003 a question
has been asked about hours spent in front of a screen, from 2012 other
sedentary activities such as reading will also be included). Next year’s report
will present the results of these new measurements, and will assess adherence
to the 150 minutes of moderate activity per week recommendation as well as
the new alternative recommendation of 75 minutes of vigorous activity per
week.
This chapter updates the trends presented in the three previous reports. It uses
summary measures based on all types of activities reported by participants. It
also presents figures on the prevalence of participation in different types of
activities, including sports and exercise (the detailed breakdown of different
sporting activities presented last year will be re-visited in future reports).
Summary activity levels by socio-demographic group are also presented.
6.2
METHODS
6.2.1
The adult physical activity questionnaire
The adult physical activity module, included in the survey from 1998
onwards is based on the Allied Dunbar National Fitness Survey, a major
study of physical activity among the adult population in England
conducted in 1990.16 The module examined:
The time spent being active
The intensity of the activities undertaken, and
The frequency with which activities are performed.
Changes to the adult physical activity module
Some changes to the way that adult physical activity is measured were
introduced to the survey in 2008. These are outlined in full in the 2008
SHeS chapter and are not repeated here. 4 The main change was that
prior to 2008 activities were recorded if they lasted for at least 15
minutes; from 2008 onwards activities of 10-14 minutes duration were
also included. The 2008 chapter concluded that the impact of this
165
change on the trend in the proportion of men and women meeting the
physical activity recommendations was small overall.5 From this report
onwards, all trends for adult physical activity include activities
accumulated in bouts of 10 minutes or more, and the 2008 data are
now the baseline for time series analysis.
6.2.2
Adult physical activity definitions
Types of activity covered
Four main types of physical activity were asked about:
Home-based activities (housework, gardening, building work and
DIY)
Walking
Sports and exercise, and
Activity at work.
For the first three categories, participants were asked to report any
activities lasting at least 10 minutes and to say on how many days in
the past four weeks they had taken part in such activities. For walking,
they were also asked on how many days they had taken more than one
walk of at least 10 minutes. Where they had taken more than one walk,
the total time spent walking for that day was calculated as twice the
average reported walk time.
Those in full or part-time employment were also asked about activity at
work. They were asked to rate how physically active they were in their
job (options were: very physically active, fairly physically active, not very
physically active and not at all physically active). Occupational activity
was counted as 20 days in the last 4 weeks for full-time workers and 12
days for part-time workers.
Intensity level
Each of the activities mentioned were classified according to their
intensity level. The four categories of ‘intensity’ of physical activity were:
Vigorous
Moderate
Light, and
Inactive.
The Scottish Government’s physical activity target for adults focuses on
engaging in at least moderate levels of physical activity for at least 30
minutes on most days of the week. Most of the discussion of adult
physical activity in this chapter therefore focuses on moderate and
vigorous intensity activities.
Home-based activities were classified as either ‘moderate’ or ‘light’
depending on their nature. Participants were given examples of types of
housework, gardening, building work and DIY which were described as
166
either ‘heavy’ or ‘light’. All cases of ‘heavy’ home-based activity were
classified as being of ‘moderate’ physical intensity. Light gardening,
building work and DIY were all classified as ‘light’ physical intensity.
Due to its very low intensity, light housework was not included in the
calculations of physical activity in this report.17
For walking, participants were asked to assess their usual walking pace
as ‘slow’, ‘steady average’, ‘fairly brisk’ or ‘fast – at least 4mph’. Walks
of 10 minutes or more at a brisk or fast pace were classified as being of
‘moderate’ intensity. Walks at slow or steady average pace were
classified as ‘light’.
The intensity levels of different sports and exercises were determined
according to a combination of the nature of the activity and the
participant’s assessment of the amount of effort it involved. For
example, all instances of playing squash or running/jogging were
counted as ‘vigorous’ intensity. However, other activities, like swimming
or cycling, were counted as ‘vigorous’ only if the participant reported
that the effort involved was enough to make them ‘out of breath or
sweaty’; if not, they were classified as ‘moderate’ intensity. Similarly,
other activities, like dancing, counted as ‘moderate’ if they made the
participant out of breath or sweaty, but ‘light’ if not.18
Activities at work were classified using a combination of (a) the
participant’s assessment of how active they are in their job (described
above), and (b) the Standard Occupational Classification (SOC) code
assigned to their job type. For example, if participants’ jobs were among
a short list of particularly strenuous occupations (including, for example,
miners and construction workers) and they described themselves as
‘very physically active’ at work, then their jobs were classified as
involving ‘vigorous’ activity. Those who described their jobs as ‘very
physically active’ but whose jobs were not among the list of strenuous
occupations were classified as ‘moderately active’ at work, as were
those who considered themselves ‘fairly physically active’ but whose
occupations were classed as either strenuous (see above) or involving
heavy or moderate work (for example, plasterers or refuse collectors). 19
6.3
SUMMARY PHYSICAL ACTIVITY LEVELS
6.3.1
Trends in summary physical activity levels since 2008
Table 6.1 presents adults’ summary physical activity levels by age and
sex for each year between 2008 and 2011. In 2011, 39% of adults met
the physical activity recommendations. This is the same as the
proportion that met them in 2008 and 2010 (the 2009 figure was not
significantly different, at 37%). Similarly, the proportions of men and
women meeting the targets have been largely static since 2008: 45% of
men and 33% of women met the targets in 2011; both figures were
within the range reported in recent years (43%-45% and 32%-33%
respectively).
167
The proportion of men and women with low activity levels (30% and
35% respectively) showed little variation from previous years.
There was no variation over time in the proportions meeting the
recommendations by age group for either men or women.
Table 6.1
Summary adult physical activity levels, 2011, by age and sex
Around half of all adults aged 16-44 (48%-53%) met the physical
activity recommendations in 2011. This reduced from the age of 35-44
onwards to a low of 8% of those aged 75 and over meeting the
recommendation.
As in previous years, across all age groups men were more likely than
women to meet the recommendations. The difference between the
sexes was widest in the youngest age group (age 16-24) with 63% of
men in this age group meeting the target compared with 41% of
women. The gender gap narrowed with increasing age up until the age
of 45-54 largely as a result of a decline in the proportion of men meeting
the targets (from 61% among those aged 25-34 to 48% among those
aged 45-54). The comparative figures for women fluctuated (38%-45%).
The proportion meeting the recommendations declined at a similar rate
for men and women from the age of 55-64 onwards with 11% of men
and 6% of women aged 75 and over meeting the recommendation.
The proportion of adults in the low activity group ranged between 17%20% for those aged 16-44 and then rose steadily to 74% of those aged
75 and over. As Figures 6A and 6B illustrate, the pattern by age was
similar for both sexes.
Figure 6A, Figure 6B, Table 6.1
Figure 6A
Men's summary physical activity levels by age group, 2011
Low activity
Some activity
Meets recommendations
100
90
80
70
Percent
6.3.2
60
50
40
30
20
10
0
16-24
25-34
35-44
45-54
Age group
168
55-64
65-74
75+
Figure 6B
Women's summary physical activity levels by age group, 2011
Low activity
Some activity
Meets recommendations
100
90
80
Percent
70
60
50
40
30
20
10
0
16-24
25-34
35-44
45-54
55-64
65-74
75+
Age group
6.3.3
Participation in different types of activity in the past 4 weeks
Table 6.2 presents three different measures of participation for each of
the four activity types covered in the interview (heavy housework; heavy
manual work, gardening and DIY; brisk walking; sports and exercise) by
age and sex. It summarises:
the total proportion of adults participating in the activity type for at
least 10 minutes at a time in the 4 weeks prior to the survey;
the mean number of days in the previous 4 weeks on which they
participated in this type of activity, and
the mean number of hours per week they spent participating in
this type of activity.
It also presents a summary measure based on those participating in
any of the four types of physical activities.
These data were reported comprehensively in 2009 5 so the following
discussion just presents an overview of the main findings. There were
no major differences between the 2009 and 2011 results.
Table 6.2
Any activity
In 2011, 81% of adults (84% of men and 79% of women) participated in
at least 10 minutes of physical activity during the 4 weeks prior to the
survey. The mean number of days of activity during that 4 week period
was 14.6 (16.2 for men and 13.2 for women). Adults were active for an
average of 7.2 hours per week with men spending more time being
active than women (8.7 compared with 5.8 hours).
For both men and women, levels of participation for both sexes were
highest among those aged 16-54 and then declined in the older age
groups. There was little difference in the figures between the sexes
169
across all age categories. The proportions participating in at least ten
minutes of physical activity ranged between 87%-94% for men and
86%-91% for women aged 16-54 then declined with each successive
age category thereafter. However, the drop in the levels was greatest
between two the oldest age categories (65-74 and 75 and over), from
72% to 48% of men, and from 66% to 40% of women, respectively,
participating in any form of activity.
The pattern by age for women’s mean days of activity in the last 4
weeks was similar to that described above. The highest figures were
among those aged 16-54 (14.8-16.5 days) but declined to a low of 4.0
days for those aged 75 and over. For men, there was a linear decline
with age from an average of 21.2 days of activity in the last 4 weeks for
those aged 16-24 to 6.7 days for those aged 75 and over.
The mean number of hours of participation per week in any activity in
the 4 last weeks was highest between the ages of 16-54 for both sexes
(9.5-11.7 hours for men and 6.4-7.2 hours for women). This declined
with age to 2.9 hours for men and 1.3 hours for women aged 75 and
over.
Table 6.2
Figure 6C
Percentage of adults participating in any physical activity in the last 4 weeks
(for at least 10 minutes), and mean hours per week, by age and sex, 2011
100
14
90
Percent
70
10
60
8
50
40
6
30
4
20
Hours
12
80
2
10
0
0
16-24
25-34
35-44
Men - percent participating
Men - mean no. hours
45-54
55-64
65-74
75+
Women - percent participating
Women - mean no. hours
Heavy housework
As reported in previous years, heavy housework was the most common
form of physical activity for women, with the exception of those aged
16-24 who were more likely to participate in sport and exercise. Overall,
61% of women had participated in heavy housework in the last 4 weeks
compared with 48% of men. The mean number of days of heavy
housework in the last 4 weeks was also higher for women (3.7 days)
than for men (2.4 days) as was the mean hours per week (1.7 and 0.8
hours, respectively).
170
All participation measures showed a bell-shaped pattern when
compared across the age groups. For both men and women these
measures peaked between the ages of 25-54 and declined with age
thereafter. For heavy housework this pattern was more pronounced for
women, with a peak of 75% aged 35-44 having done heavy housework
compared with a peak of 57% for men aged 25-34. However, the agerelated decline was sharper for women, as in the oldest age group both
sexes reported similar amounts of heavy housework (28% participated,
with averages of 1.2 – 1.5 days and 0.4 hours).
Table 6.2
Heavy manual work, gardening or DIY
Participation in heavy manual work, gardening or DIY was by far the
least common activity for both sexes; but, as in 2009, men were three
times more likely than women to have participated in this type of activity
(27% versus 9%). This difference was also apparent in the other
measures. On average, in the last 4 weeks men participated on 1.4
days for 1.2 hours per week. The comparative figures for women were
0.4 days and 0.3 hours.
The pattern by age varied slightly for men and women. For men, each
participation measure peaked among those aged 45-54 (37%
participated, averages of 1.8 days and 1.9 hours). There was a decline
with age but participation levels remained higher than those reported by
the youngest age group (15% of men aged 75 and over participated,
with averages of 1.2 days and 0.9 hours compared with 10% of men
aged 16-24 with averages of 0.3 days and 0.2 hours).
For women, the peak in participation was in the 55-64 age group (15%
participated, averages of 0.8 days and 0.5 hours). The youngest and
the oldest age groups reported similar participation levels (4% of both
age groups participated, averages of 0.1-0.2 days and 0.1 hours).
Table 6.2
Walking
Walking was the third most common activity for both sexes, though it
was a minority pursuit with 41% of men and 31% of women having
walked at a brisk pace for at least 10 minutes in the last 4 weeks. Men
reported walking on more days in that period than women (7.6 versus
5.9 days) and spending more hours walking per week (2.5 versus 1.9
hours).
For men, all participation measures were highest among those aged 1634 (58%-59% participated, averages of 11.0-11.6 days and 3.1-3.8
hours). These levels declined with age with the sharpest decline being
seen in the oldest age group (to 11% of those aged 75 and over
participating, with averages of 2.3 days and 0.5 hours).
For women, the highest figures for all measures were seen in the 16-24
age group (45% participated, average of 8.5 days and 2.7 hours).
These figures dropped to a plateau between the ages of 25-44 (37%40% participated, averages of 6.6-7.3 days and 2.1-2.2 hours) before
171
declining again in the older age groups (8% of those aged 75 and over
participated, averages of 1.4 days and 0.4 hours).
Table 6.2
Sport and exercise
Sport and exercise was the most popular type of physical activity for
men, and the second most popular for women, with 54% of men and
45% of women having taken part in this type of activity at least once
during the last 4 weeks. Men had participated on more days in the last 4
weeks than women (7.3 versus 5.1 days), and for twice as many hours
per week on average (2.4 versus 1.2 hours).
For both sexes, all measures of participation were highest in the
youngest age group as 78% of men aged 16-24 participated, with
averages of 11.6 days and 4.0 hours. The corresponding figures for
women aged 16-24 were 65%, 7.0 days and 1.9 hours. All measures
declined successively with age, with the exception of men aged 55-64
and 65-74 who had similar levels of participation on all three indicators
(37-38% participated, averages of 4.3-4.5 days and 1.4-1.8 hours).
Table 6.2
6.4
PHYSICAL ACTIVITY LEVELS BY SOCIO-DEMOGRAPHIC FACTORS
Tables 6.3 to 6.5 present the proportions of adults who met the physical activity
recommendations of at least 30 minutes of activity on 5 or more days per week
by socio-economic classification (NS-SEC of the household reference person),
equivalised household income and the Scottish Index of Multiple Deprivation
(descriptions of each of these measures are available in the Glossary at the end
of this volume). To ensure that the comparisons presented in this section are
not confounded by the different age profiles of the sub-groups, the data have
been age-standardised (age-standardisation is also described in the Glossary).
On the whole, the differences between observed and age-standardised
percentages are small. Therefore, the percentages and means presented are
the standardised ones only.
6.4.1
Adult summary activity levels, 2011 (age-standardised), by NS-SEC
of household reference person and sex
The proportion of men and women meeting the recommendations
varied significantly by NS-SEC but with different patterns for each sex.
Men in lower supervisory and technical households were the most likely
to meet the recommendations (51%) while those living in intermediate
households were least likely to do so (39%).
Four in ten women living in small employer and own account worker
households met the recommendations (40%). A third (36%) of those in
managerial and professional households did so and the equivalent
figures for the remaining household groups ranged between 30%-31%.
Table 6.3
172
Adult summary activity levels, 2011 (age-standardised), by
equivalised household income and sex
As reported in 2008, there was a clear relationship between income and
activity levels.4
As Figure 6D illustrates, around half of men in the three highest income
quintiles met the recommendations (49%-50%), in contrast, 35%-44%
of men in the lowest two income quintiles did so.
The pattern for women was different with a steady decline in the
proportion meeting the recommendations from the highest to the lowest
income quintiles (from 38% to 27%) (Figure 6E).
It is also clear from Figures 6D and 6E that the decline in the
proportions meeting the recommendations by income coincided with a
large increases in low activity levels (the proportions in the ‘some
activity’ group did not increase as sharply).
Figure 6D, Figure 6E, Table 6.4
Figure 6D
Men's summary physical activity levels (age-standardised)
by equivalised household income, 2011
100
Low activity
Some activity
Meets recommendations
90
80
70
Percent
6.4.2
60
50
40
30
20
10
0
1st (highest)
2nd
3rd
4th
Equivalised household income quintile
173
5th (lowest)
Figure 6E
Women's summary physical activity levels (age-standardised)
by equivalised household income, 2011
100
Low activity
Some activity
Meets recommendations
90
80
Percent
70
60
50
40
30
20
10
0
1st (highest)
2nd
3rd
4th
5th (lowest)
Equivalised household income quintile
6.4.3
Adult summary activity levels, 2011 (age-standardised), by
Scottish Index of Multiple Deprivation and sex
Two measures of SIMD are being used throughout this report. The first,
which uses quintiles, enables comparisons to be drawn between the
most and least deprived 20% of areas and the intermediate quintiles.
The second contrasts the most deprived 15% of areas with the rest of
Scotland (described in the tables as the “85% least deprived areas”).
As in 2008, there was a significant association between area
deprivation and activity levels, although the pattern was clearer in
2011.4 For both men and women, those living in the two most deprived
SIMD quintiles were the least likely to meet the recommendations
(39%-42% of men and 29% of women). This was significantly lower
than the proportions in the other three quintiles meeting the
recommendations (47%-49% of men and 35%-36% of women). As was
seen with income, the proportions in the ‘some activity’ category did not
vary as much as the ‘low activity’ group which saw a 12-13 percentage
point increase between those in the least and most deprived quintiles
(from 25% to 38% in men, and from 30% to 42% in women).
Those in the 15% most deprived areas of Scotland were significantly
less likely than those in the rest of the country to meet the
recommendations (33% compared with 40%).
Table 6.5
174
References and notes
1
Telford, R.D. (2007). Low physical activity and obesity: causes of chronic disease or simply
predictors? Medicine and Science in Sports and Exercise. 39 (8), 1233-40.
2
Global Recommendations on Physical Activity for Health. Geneva: World Health Organisation,
2010. < http://www.who.int/dietphysicalactivity/factsheet_recommendations/en/index.html>
3
See: <www.who.int/dietphysicalactivity/factsheet_inactivity/en/index.html>
4
Marryat, L. (2009). Chapter 6: Physical Activity. In Bromley, C., Bradshaw, P. and Given, L. [eds.]
The 2008 Scottish Health Survey – Volume 1: Main Report. Edinburgh, Scottish Government.
<www.scotland.gov.uk/Publications/2009/09/28102003/0>
5
Ormston, R. (2010). Chapter 6: Physical Activity. In Bromley, C., Given, L. and Ormston, R. [eds.]
The 2009 Scottish Health Survey – Volume 1: Main Report. Edinburgh, Scottish Government.
<www.scotland.gov.uk/Publications/2009/09/28102003/0>
6
Marryat, L. (2011). Chapter 6: Physical Activity. In Bromley, C. and Given, L. [eds.] The 2010
Scottish Health Survey – Volume 1: Main Report. Edinburgh, Scottish Government.
<www.scotland.gov.uk/Publications/2011/09/27084018/0>
7
Physical Activity Task Force. (2003). Let’s Make Scotland More Active: A Strategy for Physical
Activity. Crown Copyright. Edinburgh.
8
Five-year review of ‘Let’s Make Scotland More Active’ – A strategy for physical activity. Glasgow:
NHS Health Scotland, 2009. <www.healthscotland.com/documents/3223.aspx>
9
Healthy Eating, Active Living: An action plan to improve diet, increase physical activity and tackle
obesity (2008-2011). Edinburgh: Scottish Government, 2008.
10
Obesity Route Map: Action Plan – Version 1.0. Edinburgh: Scottish Government, 2011.
<www.scotland.gov.uk/Resource/Doc/346007/0115166.pdf>
11
Health Analytical Services Scottish Government and Information and Statistics Division, NHS
National Services Scotland. Indicators to Monitor Progress of the Obesity Route Map. Edinburgh:
Scottish Government, 2011 <www.scotland.gov.uk/Resource/Doc/346011/0115167.pdf>
12
National Performance Framework: Changes to the National Indicator Set, Edinburgh: Scottish
Government, 2012. [online] Available from:
<www.scotland.gov.uk/About/scotPerforms/NIchanges>
See also: <www.scotlandperforms.com>
13
See: <www.scotland.gov.uk/About/scotPerforms/indicator/physicalactivity>
14
Start Active, Stay Active – A report on physical activity for health from the four home countries’
Chief Medical Officers. (web only). UK Department of Health, July 2011.
<www.dh.gov.uk/en/Publicationsandstatistics/Publications/PublicationsPolicyAndGuidance/DH_12
8209>
15
Note that young people aged 16-18 are treated as adults in SHeS and complete the adult version
of the physical activity questionnaire. The different methods used to measure physical activity in
adults and children mean that it is not appropriate to combine the data from young people aged
16-18 and those aged 5-15 to provide estimates for the 5-18 age group.
16
Allied Dunbar National Fitness Survey. London: Health Education Authority and Sports Council,
1992.
175
17
Home activities:
Examples of ‘heavy’ gardening or DIY work classified as moderate intensity:
Digging, clearing rough ground, building in stone/bricklaying, mowing large areas with a hand
mower, felling trees, chopping wood, mixing/laying concrete, moving heavy loads, refitting a
kitchen or bathroom or any similar heavy manual work.
Examples of ‘heavy’ housework classified as moderate intensity:
Walking with heavy shopping for more than 5 minutes, moving heavy furniture, spring cleaning,
scrubbing floors with a scrubbing brush, cleaning windows, or other similar heavy housework.
Examples of ‘light’ gardening or DIY work classified as light intensity:
Hoeing, weeding, pruning, mowing with a power mower, planting flowers/seeds, decorating, minor
household repairs, car washing and polishing, car repairs and maintenance.
18
Sports and Exercise activities – Intensity:
Vigorous:
a) All occurrences of running/jogging, squash, boxing, kick boxing, skipping, trampolining.
b) Sports coded as vigorous intensity if they had made the participant breathe heavily or sweaty,
but otherwise coded as moderate intensity including: cycling, aerobics, keep fit, gymnastics, dance
for fitness, weight training, football, rugby, swimming, tennis, badminton.
Moderate:
a) See ‘vigorous’ category b).
b) All occasions of a large number of activities including: basketball, canoeing, fencing, field
athletics, hockey, ice skating, lacrosse, netball, roller skating, rowing, skiing, volleyball.
c) Sports coded as moderate intensity if they had made the participant breathe heavily or sweaty,
but otherwise coded as light intensity, including: exercise (press-ups, sit-ups etc), dancing.
Light:
a) See ‘moderate’ category c).
b) All occasions of a large number of activities including: abseiling, baseball, bowls, cricket,
croquet, darts, fishing, golf, riding, rounders, sailing, shooting, snooker, snorkelling, softball, table
tennis, yoga.
19
Work activities:
Vigorous:
Considers self very physically active in job and is in one of a small number of occupations defined
as involving heavy work including:
fishermen/women, furnace operators, rollerman, smiths and forge workers, faceworking coalminers, other miners, construction workers and forestry workers.
Moderate:
Considers self very physically active in job and is not in occupation groups listed above OR
considers self fairly physically active in job and is one of a small number of occupations involving
heavy or moderate work including:
any listed above OR fire service officers, metal plate workers, shipwrights, riveters, steel erectors,
benders, fitters, galvanisers, tin platers, dip platers, plasterers, roofers, glaziers, general building
workers, road surfacers, stevedores, dockers, goods porters, refuse collectors.
Light:
Considers self fairly physically active in job and is not in one of the occupation groups listed
above.
176
Table list
Table 6.1
Table 6.2
Table 6.3
Table 6.4
Table 6.5
Adult summary activity levels, 2008, 2009, 2010, 2011, by age and sex
Adults participation in different activity types for at least 10 minutes in the last
4 weeks, 2011, by age and sex
Adult summary activity levels, 2011, (age-standardised), by NS-SEC of
household reference person and sex
Adult summary activity levels, 2011, (age-standardised), by equivalised
household income quintile and sex
Adult summary activity levels, 2011, (age-standardised), by Scottish Index of
Multiple Deprivation (SIMD) and sex
177
Table 6.1
Adult summary activity levels, 2008, 2009, 2010, 2011, by age and sex
Aged 16 and over
Summary activity
levelsa
2008, 2009, 2010, 2011
Age
Total
16-24
25-34
35-44
45-54
55-64
65-74
75+
%
%
%
%
%
%
%
%
Meets recommendations
2008
2009
2010
2011
58
61
66
63
63
54
61
61
53
50
51
54
43
43
48
48
37
37
34
32
21
21
22
23
13
11
10
11
45
43
45
45
Some activity
2008
2009
2010
2011
29
19
22
22
25
26
24
26
29
30
29
28
30
31
25
26
23
28
29
26
27
31
29
27
21
22
20
19
27
27
26
25
Low activity
2008
2009
2010
2011
13
20
12
15
12
20
15
13
18
20
20
19
27
26
27
27
40
36
36
42
51
48
50
50
66
66
70
70
28
30
29
30
Meets recommendations
2008
2009
2010
2011
42
38
37
41
42
41
42
45
43
39
45
42
37
38
40
38
29
30
30
27
20
17
17
18
4
6
7
6
33
32
33
33
Some activity
2008
2009
2010
2011
33
37
39
34
37
39
36
35
37
39
35
36
36
36
36
33
35
34
33
37
33
34
31
30
17
19
17
17
34
35
33
32
Low activity
2008
2009
2010
2011
25
25
25
25
21
20
22
21
20
22
19
22
27
26
24
28
35
36
36
36
46
49
52
52
78
33
75
34
76
33
77
35
Continued…
Men
Women
178
Table 6.1
- Continued
Aged 16 and over
Summary activity
levelsa
2008, 2009, 2010, 2011
Age
Total
16-24
25-34
35-44
45-54
55-64
65-74
75+
%
%
%
%
%
%
%
%
Meets recommendations
2008
2009
2010
2011
50
50
52
52
53
47
51
53
47
45
48
48
40
40
44
43
33
33
32
30
21
19
19
20
8
8
8
8
39
37
39
39
Some activity
2008
2009
2010
2011
31
28
30
28
31
33
30
30
34
35
32
32
33
34
31
29
29
31
31
31
31
33
30
29
19
21
18
18
30
31
30
29
Low activity
2008
2009
2010
2011
19
22
18
20
16
20
19
17
19
21
20
20
27
26
26
28
37
36
36
39
49
49
51
51
74
71
73
74
31
32
31
32
All Adults
Bases (weighted):
Men 2008
464
481
561
555
480
327
218
3085
Men 2009
538
568
634
647
561
387
257
3591
Men 2010
515
559
589
631
542
374
254
3466
Men 2011
534
583
613
656
564
390
266
3605
Women 2008
445
487
615
590
503
383
346
3369
Women 2009
511
570
693
700
590
450
408
3923
Women 2010
494
556
645
680
571
431
396
3772
Women 2011
513
580
671
708
594
449
409
3924
All adults 2008
909
968
1176
1145
983
710
565
6455
All adults 2009
1050
1138
1327
1347
1151
836
665
7514
All adults 2010
1009
1115
1234
1311
1113
805
650
7238
All adults 2011
1047
1163
1284
1364
1157
839
675
7529
Bases (unweighted):
Men 2008
245
317
459
534
525
453
304
2837
Men 2009
272
406
550
600
574
517
359
3278
Men 2010
274
420
478
566
555
488
331
3112
Men 2011
306
399
516
599
600
511
343
3274
Women 2008
334
451
647
631
631
515
406
3615
Women 2009
383
579
779
733
735
550
479
4238
Women 2010
373
564
682
761
699
573
470
4122
Women 2011
363
562
710
801
738
596
483
4253
All adults 2008
579
768
1106
1165
1156
968
710
6452
All adults 2009
655
985
1329
1333
1309
1067
838
7516
All adults 2010
647
984
1160
1327
1254
1061
801
7234
All adults 2011
669
961
1226
1400
1338
1107
826
7527
a Meets recommendations= 30 minutes or more on at least 5 days a week; Some activity= 30 minutes
or more on 1 to 4 days a week; Low activity= fewer than 30 minutes of moderate or vigorous activity
a week (these categories were described in previous reports as “high”, “medium” and “low”, the
labels have changed but the definitions for the categories remain the same).
179
Table 6.2
Adults’ participation in different activity types for at least 10 minutes in the
last 4 weeks, 2011, by age and sex
Aged 16 and over
Participation for at least 10
minutes a time
Men
Heavy housework
Any participation in last 4 weeks
Mean number of days in last 4
weeksa
Standard error of the mean
Mean number of hours per weeka
Standard error of the mean
Heavy Manual / Gardening /
DIY
Any participation in last 4 weeks
Mean number of days in last 4
weeksa
Standard error of the mean
Mean number of hours per weeka
Standard error of the mean
Walking (brisk/fast pace)
Any participation in last 4 weeks
Mean number of days in last 4
weeksa
Standard error of the mean
a
Mean number of hours per week
Standard error of the mean
Sports and Exercise
Any participation in last 4 weeks
Mean number of days in last 4
a
weeks
Standard error of the mean
Mean number of hours per weeka
Standard error of the mean
Any physical activities
Any participation in last 4 weeks
Mean number of days in last 4
weeksa
Standard error of the mean
a
Mean number of hours per week
Standard error of the mean
2011
Age
Total
16-24
25-34
35-44
45-54
55-64
65-74
75+
%
%
%
%
%
%
%
%
41
1.9
57
3.3
55
2.6
52
2.9
46
2.2
44
2.0
28
1.5
48
2.4
0.30
0.5
0.07
0.45
1.1
0.22
0.21
1.1
0.13
0.24
0.9
0.08
0.19
1.0
0.16
0.18
0.6
0.08
0.22
0.4
0.07
0.13
0.8
0.06
10
0.3
26
1.4
36
1.5
37
1.8
31
1.7
27
1.6
15
1.2
27
1.4
0.06
0.2
0.07
0.20
1.2
0.22
0.15
1.3
0.18
0.17
1.9
0.22
0.19
1.5
0.26
0.21
1.3
0.23
0.24
0.9
0.21
0.08
1.2
0.09
59
11.6
58
11.0
45
7.5
41
7.3
31
5.5
24
4.6
11
2.3
41
7.6
0.92
3.1
0.34
0.71
3.8
0.67
0.53
2.5
0.36
0.48
2.5
0.35
0.47
2.2
0.30
0.44
1.9
0.26
0.41
0.5
0.12
0.26
2.5
0.16
78
11.6
73
11.0
62
8.3
49
5.7
37
4.3
38
4.5
22
2.6
54
7.3
0.72
4.0
0.44
0.63
3.6
0.38
0.51
2.3
0.18
0.41
2.1
0.17
0.37
1.4
0.15
0.37
1.8
0.18
0.42
1.0
0.16
0.23
2.4
0.12
94
21.2
94
20.5
92
18.5
87
16.5
75
12.6
72
11.0
48
6.7
84
16.2
0.75
9.5
0.69
0.56
11.7
0.94
0.53
9.6
0.50
0.50
9.6
0.48
0.54
7.2
0.48
0.51
5.9
0.46
0.60
2.9
0.34
0.26
8.7
0.26
51
2.5
71
4.8
75
4.7
72
4.4
64
4.0
52
2.8
28
1.2
61
3.7
0.26
0.9
0.10
0.29
2.1
0.21
0.24
2.1
0.14
0.23
2.3
0.23
0.25
1.8
0.13
0.25
1.5
0.19
Women
Heavy housework
Any participation in last 4 weeks
Mean number of days in last 4
weeksa
Standard error of the mean
Mean number of hours per weeka
Standard error of the mean
180
0.14
0.10
0.4
1.7
0.07
0.08
Continued…
Table 6.2
- Continued
Aged 16 and over
Participation for at least 10
minutes a time
Women
Heavy Manual / Gardening /
DIY
Any participation in last 4 weeks
Mean number of days in last 4
weeksa
Standard error of the mean
a
Mean number of hours per week
Standard error of the mean
Walking (brisk/fast pace)
Any participation in last 4 weeks
Mean number of days in last 4
weeksa
Standard error of the mean
Mean number of hours per weeka
Standard error of the mean
Sports and Exercise
Any participation in last 4 weeks
Mean number of days in last 4
weeksa
Standard error of the mean
Mean number of hours per weeka
Standard error of the mean
Any physical activities
Any participation in last 4 weeks
Mean number of days in last 4
weeksa
Standard error of the mean
a
Mean number of hours per week
Standard error of the mean
2011
Age
Total
16-24
25-34
35-44
45-54
55-64
65-74
75+
%
%
%
%
%
%
%
%
4
0.1
6
0.2
12
0.4
13
0.5
15
0.8
10
0.5
4
0.2
9
0.4
0.03
0.1
0.02
0.06
0.2
0.07
0.07
0.2
0.04
0.08
0.5
0.09
0.11
0.5
0.07
0.12
0.3
0.07
0.09
0.1
0.03
0.03
0.3
0.03
45
8.5
37
6.6
40
7.3
33
6.3
27
5.2
18
3.8
8
1.4
31
5.9
0.68
2.7
0.47
0.48
2.1
0.27
0.45
2.2
0.20
0.38
2.0
0.20
0.38
2.0
0.30
0.38
1.2
0.17
0.26
0.4
0.11
0.19
1.9
0.11
65
7.0
62
7.4
53
6.0
45
5.1
37
4.0
25
2.8
18
1.7
45
5.1
0.52
1.9
0.21
0.47
1.7
0.13
0.36
1.3
0.10
0.33
1.2
0.10
0.32
1.0
0.10
0.31
0.8
0.13
0.23
0.4
0.06
0.17
1.2
0.05
86
15.6
91
16.5
89
15.9
87
14.8
80
12.4
66
8.6
40
4.0
79
13.2
0.69
6.4
0.50
0.54
6.9
0.37
0.46
6.8
0.32
0.40
7.2
0.33
0.44
5.9
0.34
0.47
3.8
0.31
0.34
1.3
0.17
0.21
5.8
0.15
90
18.4
92
18.5
91
17.1
87
15.6
77
12.5
69
9.7
43
5.1
81
14.6
0.55
8.0
0.43
0.41
9.3
0.53
0.36
8.1
0.31
0.32
8.3
0.29
0.37
6.5
0.31
0.36
4.8
0.28
0.31
1.9
0.17
0.18
7.2
0.16
583
580
1163
613
671
1284
656
708
1364
564
593
1156
390
449
839
266
412
678
3607
3927
7534
399
562
961
516
710
1226
599
801
1400
600
737
1337
511
596
1107
344
485
829
3276
4255
7531
All adults
Any physical activity
Any participation in last 4 weeks
Mean number of days in last 4
weeksa
Standard error of the mean
Mean number of hours per weeka
Standard error of the mean
Bases (weighted):
Men
535
Women
514
All adults
1050
Bases (unweighted):
Men
307
Women
364
All adults
671
a Means are based on all participants.
181
Table 6.3
Adult summary activity levels, 2011, (age-standardised), by NS-SEC of
household reference person and sex
Aged 16 and over
Summary activity levelsa
2011
NS-SEC of household reference person
Managerial Intermediate
Small
Lower
&
employers & supervisory
own account & technical
professional
workers
Men
Meets recommendations
Some activity
Low activity
Women
Meets recommendations
Some activity
Low activity
All adults
Meets recommendations
Some activity
Low activity
Semiroutine &
routine
%
%
%
%
%
45
30
25
39
28
33
49
21
30
51
21
28
45
21
35
36
35
29
31
34
34
40
32
27
31
31
38
30
29
41
40
33
27
35
32
34
45
26
29
42
26
32
37
25
38
Bases (weighted):
Men
1397
282
366
472
979
Women
1465
395
346
412
1183
All adults
2862
677
712
884
2162
Bases (unweighted):
Men
1211
243
364
439
931
Women
1511
426
394
463
1328
All adults
2722
669
758
902
2259
a Meets recommendations= 30 minutes or more on at least 5 days a week; Some activity= 30 minutes
or more on 1 to 4 days a week; Low activity= fewer than 30 minutes of moderate or vigorous activity
a week (these categories were described in previous reports as “high”, “medium” and “low”, the
labels have changed but the definitions for the categories remain the same).
182
Table 6.4
Adult summary activity levels, 2011, (age-standardised), by equivalised
household income quintile and sex
Aged 16 and over
Summary activity levelsa
2011
Equivalised annual household income quintile
1st
(highest)
Men
Meets recommendations
Some activity
Low activity
Women
Meets recommendations
Some activity
Low activity
All adults
Meets recommendations
Some activity
Low activity
nd
2
3
4
th
5th
(lowest)
rd
%
%
%
%
%
50
29
22
49
29
21
49
20
30
44
19
37
35
24
41
38
36
26
36
34
30
34
33
32
29
32
39
27
28
45
44
32
24
43
32
26
41
27
31
36
26
38
31
26
43
Bases (weighted):
Men
810
685
569
493
454
Women
749
711
628
615
537
All adults
1559
1395
1197
1109
991
Bases (unweighted):
Men
706
604
541
489
437
Women
778
763
698
702
611
All adults
1484
1367
1239
1191
1048
a Meets recommendations= 30 minutes or more on at least 5 days a week; Some activity= 30 minutes
or more on 1 to 4 days a week; Low activity= fewer than 30 minutes of moderate or vigorous activity
a week (these categories were described in previous reports as “high”, “medium” and “low”, the
labels have changed but the definitions for the categories remain the same).
183
Table 6.5
Adult summary activity levels, 2011, (age-standardised), by Scottish
Index of Multiple Deprivation and sex
Aged 16 and over
2011
Summary activity Scottish Index of Multiple Deprivation
levelsa
th
rd
nd
5th
1st
4
3
2
(least
(most
deprived)
deprived)
Men
Meets
recommendations
Some activity
Low activity
Women
Meets
recommendations
Some activity
Low activity
All adults
Meets
recommendations
Some activity
Low activity
SIMD 85/15
85% least 15% most
deprived deprived
%
%
%
%
%
%
%
49
49
47
42
39
47
38
27
25
26
25
23
30
26
32
23
38
25
28
23
39
36
35
35
29
29
34
28
34
30
35
31
31
34
34
37
30
42
33
33
29
43
42
42
41
35
34
40
33
30
27
31
28
27
32
30
35
26
40
29
31
26
41
Bases (weighted):
Men
690
781
769
631
734
3055
551
Women
728
818
865
734
778
3336
587
All adults
1418
1600
1635
1365
1513
6392
1138
Bases
(unweighted):
Men
567
758
751
553
645
2778
496
Women
735
945
984
768
821
3619
634
All adults
1302
1703
1735
1321
1466
6397
1130
a Meets recommendations= 30 minutes or more on at least 5 days a week; Some activity= 30
minutes or more on 1 to 4 days a week; Low activity= fewer than 30 minutes of moderate or
vigorous activity a week (these categories were described in previous reports as “high”, “medium”
and “low”, the labels have changed but the definitions for the categories remain the same).
184
Obesity
Chapter 7
7 OBESITY
Linsay Gray and Alastair H Leyland
SUMMARY
In 2011, over a quarter (27.7%) of adults aged 16 and over were obese
(27.7% of men and 27.6% of women). Just under two-thirds (64.3%) were
overweight or obese. Men were significantly more likely than women to be
overweight or obese (69.2% compared with 59.6%).
The mean Body Mass Index (BMI) in 2011 was 27.6 kg/m2 for men and 27.5
kg/m2 for women.
Between 1995 and 2011, the proportion of adults aged 16-64 who were
overweight or obese (BMI of 25 kg/m2 and over) increased from 52.4% to
62.2%. Over this same period the prevalence of obesity (BMI of 30 kg/m2 and
over) among this age group also increased from 17.2% to 26.5%. The greatest
increases were seen between 1995 and 2008 with figures remaining broadly
stable since then.
There was also an increase in mean BMI among adults aged 16-64 between
1995 and 2001 (from 25.8 kg/m2 to 27.3 kg/m2). Again, the greatest increase
occurred between 1995 and 2008 and has been largely stable since then.
Obesity prevalence increased significantly with age in 2011, from 13.4% in
those aged 16-24 to a peak of 35.4% in those aged 65-74. 16-24 year olds
were least likely to be overweight including obese (36.0%) while those aged
65-74 were most likely to be (77.5%).
In the 2010/2011 period, the mean waist circumference was 96.3cm for men
and 89.0cm for women. Women were significantly more likely than men to
have a raised waist circumference (49.1% compared with 31.7%).
Based on a combination of their BMI and waist circumference measurements,
women were more likely than men to be classified as being at high (or greater)
risk of conditions like type 2 diabetes, hypertension and CVD (45.4%
compared with 34.4% of men).
Among men, the proportion at high (or greater) risk of such conditions
increased with age up until age 55-64 at which point it levelled out. For women
the proportion at high risk also increased with age but up until age 65-74
before dipping for those aged 75 and over.
15.7% of men were overweight according to their BMI but when the combined
measure of BMI and waist circumference was used they were classified as
being at no increased risk of obesity related diseases. The comparable figure
for women was just 4.1%.
There was a significant association between disease risk and both socioeconomic classification and household income with clearer patterns observed
for women than for men. Women living in semi-routine and routine households
were the most likely to be classified as at a high (or greater) risk of obesity
related disease whereas those in professional and managerial households
were least likely to be (52.1% compared with 41.0%).
Men living in the least deprived SIMD quintile were least likely to have health
risks (49.1% had no increased risk, compared with 44.7%-46.6% of those
living elsewhere. For women, the proportion at no increased risk decreased in
line with deprivation (from 45.3% in the least deprived quintile to 29.8% in the
most deprived).
186
Age, economic status and physical activity levels were all independently
significantly associated with being at high risk of disease for both men and
women. For men, education level, marital status and self-assessed health
status were also significant factors. For women, SIMD, parental NS-SEC,
smoking status and presence of a long-standing illness were independently
associated with being at high risk of disease.
7.1
INTRODUCTION
Obesity has a major impact on quality of life and health, increasing risk of type 2
diabetes, hypertension, cardiovascular disease, osteoarthritis and cancer.1
Scotland has one of the worst obesity records amongst developed countries.
The estimated cost to the NHS in Scotland of obesity and related illnesses in
2007/8 was in excess of £175 million.2 With these economic and health costs,
tackling obesity is a key priority for the public health sector in Scotland.
The introductions to the obesity chapters in the 2008,3 20094 and 20105 Scottish
Health Survey (SHeS) Reports provided a detailed overview of the recent policy
context in Scotland. These included:
The Scottish Government’s Healthy Eating, Active Living: An action plan
to improve diet, increase physical activity and tackle obesity.6
The Keep Well initiative.7
The Scottish Government’s Route Map for tackling obesity and the
associated Obesity Route Map Action Plan, published in 2011.8 SHeS is
the measurement tool for seven of the Route Map’s indicators, including
the following long-term goal: the majority of Scotland’s adult population in
normal weight throughout life.9
The Scottish Intercollegiate Guidelines Network (SIGN) national clinical
guideline on obesity management. 10
In addition, a number of policy actions targeted specifically at improving diets
(described in Chapter 5) and physical activity levels (described in Chapter 6)
are also relevant in the context of tackling obesity. Furthermore, as outlined in
the chapter on child obesity in Volume 2, much of the effort to tackle unhealthy
weight in the population is targeted at children, reflecting evidence that many
children who are overweight or obese continue to be so in adulthood. For
example, there are National Performance Framework National Indicators
around healthy birthweight11 and child healthy weight.12
This chapter focuses on body mass index (BMI) and waist circumference,
derived from the direct measurements of height and weight taken in the main
interview, and the waist measurements taken as part of the nurse visit. Time
trends in BMI and waist circumference over the 1995-2011 period are examined
by age and sex. Previous reports have also included data on waist/hip ratio.
However, due to space constraints, concerns about the usefulness of this ratio
as an indicator of obesity, and the fact that hip circumference is not being
measured from 2012 onwards, this chapter only reports waist circumference
results.
187
Between 2008 and 2011 only a sub-sample of participants was invited to have
an additional nurse visit. For this reason the analysis of waist circumference
presented here is based on either two or four years of nurse data combined.
From 2012 the survey is no longer including a nurse visit and instead a subsample of adults will be asked to complete a new biological module, conducted
by specially trained interviewers. Waist circumference is part of this new
module. A validation study has been conducted to assess the impact on the
time series data of the change in methodology for measuring waist
circumference.13 Future SHeS reports will discuss the implications in full.
The obesity chapter in the 2009 SHeS report included, for the first time, some
analysis of disease risk using a measure recommended by the World Health
Organisation, and endorsed in Scotland by SIGN, that takes into account both
BMI and waist circumference.4 This chapter takes advantage of the larger
sample provided by the 2008-2011 combined data to explore this further and
presents disease risk by socio-economic classification, household income and
the Scottish Index of Multiple Deprivation (SIMD).
7.2
METHODS AND DEFINITIONS OF MEASUREMENT
Full details of the protocols for carrying out the measurements are contained in
Volume 3 of this report and are briefly summarised here.
7.2.1
Height
Height was measured using a portable stadiometer with a sliding head
plate, a base plate and three connecting rods marked with a metric
measuring scale. Participants were asked to remove shoes. One
measurement was taken, with the participant stretching to the maximum
height and the head positioned in the Frankfort plane.14 The reading
was recorded to the nearest millimetre.
7.2.2
Weight
Weight was measured using Soehnle and Tanita electronic scales with
a digital display. Participants were asked to remove shoes and any
bulky clothing. A single measurement was recorded to the nearest
100g. Participants aged under 2 years, or who were pregnant, or
chairbound, or unsteady on their feet were not weighed. Participants
who weighed more than 130 kg were asked for their estimated weights
because the scales are inaccurate above this level. These estimated
weights were included in the analysis.
In the analysis of height and weight, data from those who were
considered by the interviewer to have unreliable measurements, for
example those who had excessive clothing on, were excluded from the
analysis.
7.2.3
Body Mass Index (BMI)
The Body Mass Index (BMI), defined as weight (kg)/height (m2), is a
widely accepted measure that allows for differences in weight due to
188
height. It has been used in each SHeS report to date. However, BMI
has some limitations.15,16 It does not distinguish between mass due to
body fat and mass due to muscular physique. It also does not take
account of the distribution of fat.
BMI was calculated for all those participants for whom a valid height
and weight measurement was recorded.
BMI classification
Adult participants were classified into the following BMI groups:17
BMI (kg/m2)
Less than 18.5
18.5 to less than 25
25 to less than 30
30 to less than 40
40+
Description
Underweight
Normal
Overweight
Obese, excluding morbidly obese
Morbidly obese
Other cut off points are also used in analyses of obesity, for example
the World Health Organisation (WHO) cites evidence that chronic
disease is an increasing risk in populations when BMI exceeds 21,18
while mortality rates do not necessarily correlate neatly with the
categories presented here.19 However, meaningful comparisons of
prevalence estimates between countries require agreed thresholds and
these categories correspond with the WHO’s recommended definitions
for underweight, normal, overweight and obese (though they use three
sub-classifications of obesity rather than the two presented here).20 The
tables by age and sex report both mean BMI and prevalence of the five
categories outlined above. Although obesity has the greatest ill-health
and mortality consequences, overweight is also a major public health
concern, not least because overweight people are at high risk of
becoming obese, while underweight also has negative health
consequences. The trend tables present three measures: the proportion
who is either overweight or obese (BMI of 25 kg/m2 or more), the
proportion who are obese (BMI of 30 kg/m2 or more), and the proportion
morbidly obese (BMI of 40 kg/m2 or more). The latter group are at
particularly high risk of morbidity and mortality. 21
7.2.4
Waist measurements
Waist and hip measurements were conducted as part of the nurse
interview. As noted in the introduction, only waist measurements are
reported here.22 Waist was defined as the midpoint between the lower
rib and the upper margin of the iliac crest. It was measured using a tape
with an insertion buckle at one end. Each measurement was taken
twice, using the same tape, and was recorded to the nearest even
millimetre. Those participants whose two waist measurements differed
by more than 3 cm had a third measurement taken.
For waist measurements, all those who reported that they had a
colostomy or ileostomy, or were chairbound or pregnant, were excluded
189
from the measurement. All those with measurements considered
unreliable by the nurse, for example due to excessive clothing or
movement, were excluded from the analysis.
Raised waist circumference
It has been postulated that waist circumference (WC) may be a better
measure than BMI to identify those with a health risk from being
overweight. The definition of raised WC used is in accordance with the
definition of abdominal obesity used by the National Institutes of Health
(USA) ATP (Adult Treatment Panel) III.23 A raised WC has been taken
to be more than 102 cm in men and more than 88 cm in women. These
levels identify people at risk of metabolic syndrome, a disorder
characterised by increased risk of developing diabetes and
cardiovascular disease. Abdominal obesity is reported as more highly
correlated with metabolic risk factors (high levels of triglycerides, low
HDL-cholesterol) than elevated BMI.23
7.2.5
WHO combined classification of disease risk
As noted in the introduction, the SIGN guideline on obesity10 cites the
WHO’s recommendation that an individual’s risk of conditions such as
type 2 diabetes and CVD is better estimated using a combination of
both BMI and waist circumference (WC). The table below sets out the
classification categories SIGN suggest. SIGN also note that increased
WC can be a marker for disease even among people of normal weight.
The analysis presented in this chapter classified people with normal
weight and very high WC as at increased risk of disease. This chapter
uses the BMI data collected in the main interview in combination with
the waist measures collected by the nurse to estimate the proportion of
the Scottish population who fall into each of the risk categories. This
combined classification designates those with a raised WC as ‘very
high’ WC, while those towards the upper end of the ‘not raised’ WC
range are designated ‘high’ WC. As the table below indicates, the
health risk is similar for adults with very high WC and class I obesity
and for adults with high WC and class II obesity.
Type 2 diabetes, hypertension and CVD risk relative to normal weight and waist
circumference
Classification
BMI
Class ‘High’ WC
‘Very high’ WC
(kg/m2)
Men WC 94-102cm
Men WC >102cm
Women WC 80-88cm
Women WC >88cm
Normal weight
18.5 - <25
Overweight
25 - <30
Increased
High
Obese
Mild
30 - <35
I
High
Very high
Moderate
35 - <40
II
Very high
Very high
Extreme
40+
III
Extremely high
Extremely high
Source: based on Table 3, p11, in SIGN 115.
10
190
7.3
RESPONSE TO ANTHROPOMETRIC MEASUREMENTS, BY AGE AND SEX
Response to height, weight, BMI, and waist and hip among adults (for 20082011 combined) is shown in Table 7.1. In previous reports the figures for single
years have been presented, however since many of the data in this chapter are
based on the 2008-2011 samples combined, the response figures are based on
combined data also. A valid height measurement was obtained for 87% of men
and 86% of women in this period. Response generally declined with age with
the lowest levels among those aged 75 and over (74% of men and 70% of
women aged 75 and over compared with 90% of those aged 16-24).
Valid weight measurements were provided by 86% of men and 84% of women.
As with height, the proportions of men and women providing valid weight
measurements were lowest for the oldest age group (75% of men and 72% of
women). Proportions with known values for both height and weight, and thus
derived BMI were similar to those for weight alone (85% of men and 83% of
women), and followed similar patterns by age. Valid waist and hip
measurements were obtained for almost all men (99%) and women (98%) who
had a nurse visit; again response was slightly lower for those aged 75 and over
(97% of men and 94% of women).
Table 7.1
7.4
TRENDS IN THE PREVALENCE OF OVERWEIGHT AND OBESITY SINCE
1995
This section presents figures for the prevalence of overweight including obese
(BMI 25 kg/m2 or more), obesity (BMI 30 kg/m2 or more), morbid obesity (BMI 40
kg/m2 or more) and mean BMI by age for each survey year to date. Figures are
presented for all adults and for men and women separately. Changes to the
sample composition in the earlier survey years mean trends since 1995 are
based on all adults aged 16-64, while trends for all adults aged 16 and over are
presented for 2003 onwards. Adults’ BMI in 2011 is discussed in more detail in
Section 7.5.
7.4.1
Obesity and morbid obesity
As shown in Table 7.2 and Figure 7A, prevalence of obesity (BMI 30
kg/m2 or more) among adults aged 16-64 in Scotland has risen
significantly over the last sixteen years. Between 1995 and 2011 there
was around a ten percentage point increase in the proportion of adults
aged 16-64 that were obese (from 17.2% to 26.5%). As the more
detailed discussion below illustrates, most of this increase occurred
between 1995 and 2008, with the more recent figures showing some
evidence of stability.
The increase in obesity over time followed a similar pattern for both
men and women. For men aged 16-64, prevalence increased from
15.9% in 1995 to 22.0% in 2003 and then again to 24.9% in 2008.
Between 2008 and 2011 it was fairly stable, ranging from 24.9% to
26.7%. The greatest increase for women also occurred between 1995
and 2003 (17.3% to 23.8%), with the figures since 2008 again,
remaining fairly stable (ranging from 26.4% to 28.1%). While obesity
191
prevalence in 2011 was significantly higher than in 1995-2003 it was not
significantly different to levels in the 2008-2010 period.
The trend in obesity for all adults aged 16 and over since 2003 was
similar to that discussed above for 16-64 year olds. A notable exception
is that the increase in obesity for all adults was largely accounted for by
rising levels among men with no significant increase among women. In
2003, 22.4% of men aged 16 and over were obese compared with
26.0%-27.7% from 2008 onwards. In contrast, the most recent figure for
women (27.6%) was only a little higher than in 2003 (26.0%).
As noted in previous SHeS reports, morbid obesity prevalence (BMI of
40 kg/m2 or more) is very low: just 2.9% of adults in 2011. However, this
has also increased over time, from 1.2% of 16-64 year olds in 1995 to
2.7% in 2003, with levels fluctuating between 2.5% and 3.0% since
2008. The pattern for all adults aged 16 and over since 2003 was
similar with prevalence fluctuating between 2.2% and 2.9%.
Figure 7A, Table 7.2
7.4.2
Overweight and obesity
There has also been an increase over time in the proportion of 16-64
year olds that were overweight including obese (BMI 25 kg/m2 or more)
(from 52.4% in 1995, to 62.2% in 2011). As with the patterns in obesity
discussed above, there was a large increase between 1995 and 2003,
with the more recent figures being broadly stable (ranging from 62.2%
to 63.3% in the 2008-2011 period). Prevalence of overweight including
obesity has fluctuated more over this period for women than for men –
after rising from 47.2% in 1995 to 57.3% in 2003, prevalence was then
a little higher between 2008 and 2010 (58.4%-60.3%), but fell again in
2011 to 57.1%. This may well be trendless fluctuation, or the drop in
2011 could be the start of a decline in overweight including obesity
prevalence among women aged 16-64; the 2012 and 2013 figures will
help to answer this. In contrast, in recent years the proportion of
overweight or obese men aged 16-64 has remained stable.
The pattern for all adults aged 16 and over since 2003 was similar to
that for 16-64 year olds. For men, there was a small increase in
overweight including obese prevalence between 2003 and 2008 (from
65.4% to 68.5%) followed by relative stability. In contrast, the proportion
of women who were overweight or obese fluctuated, with no obvious
pattern, between 59.6% and 62.4% and the 2003 and 2011 figures
were very similar.
Figure 7A, Table 7.2
7.4.3
Mean BMI
Mean BMI for adults aged 16-64 increased from 25.8 kg/m2 in 1995 to
27.2 kg/m2 in 2008, and has remained at a similar level since then (for
example, it was 27.3 kg/m2 in 2011). Trends in mean BMI for men and
women followed a very similar pattern in this period.
192
The mean BMI trend for those aged 16 and over was similar to the
trend for 16-64 year olds and again, the pattern was similar for both
sexes. In 2003, the mean BMI for men was 27.0 kg/m2, this increased
slightly to 27.4 kg/m2 in 2008, and has remained at a similar level to this
in recent years. The equivalent figures for women ranged from 27.2
kg/m2 to 27.6 kg/m2, though, as with men, the highest figures have been
in the more recent years.
The 2010 SHeS Report discussed the difficulties of interpreting patterns
in a time series that has uneven intervals between measures. 5
However, the latest figures appear to support the suggestion that mean
BMI, and the prevalence of overweight and obesity, have begun to
stabilise following the larger increases evident between the earlier years
of the survey. The continued annual monitoring of these measures in
the 2012-2015 period will be hugely valuable.
Figure 7A, Table 7.2
Figure 7A
Prevalence of overweight and obese in adults
1995-2011 (16-64), 2003-2011 (16+)
Obese (BMI 30 or more) 16-64
Overweight (BMI 25 or more) 16-64
Obese (BMI 30 or more) 16+
Overweight (BMI 25 or more) 16+
70
60
Percent
50
40
30
20
10
0
1995
1998
2003
2008 2009 2010 2011
Survey year
7.5
ADULT BMI, BY AGE AND SEX, 2011
Table 7.3 presents the 2011 prevalence figures for the five BMI groups outlined
in Section 7.2.3 (from underweight to morbidly obese) as well as the summary
measures of overweight including obese (BMI of 25 kg/m2 and over) and obese
(BMI of 30 kg/m2 and over) discussed in the previous section. In 2011, 27.7% of
adults aged 16 and over were obese (27.7% of men and 27.6% of women). As
Figures 7B and 7C illustrate, obesity levels varied significantly by age. There
was a linear increase in prevalence from 13.4% (14.1% of men and 12.7% of
women) at age 16-24 to 35.4% (35.7% of men and 35.2% women) at age 6574, followed by a drop to 29.4% for the oldest age group (28.4% of men and
30.0% of women).
Prevalence of overweight, including obese was 64.3% among all adults in 2011
and was significantly higher in men (69.2%) than women (59.6%). The
differences by age followed a similar pattern to obesity with a particularly
pronounced difference between the proportion of men aged 16-24 and 25-34
193
that were overweight or obese (35.2% compared with 62.0%). 1.7% of men and
2.0% of women were underweight with prevalence most common among the
youngest age group (8.1% of men and 7.2% of women).
The mean BMI for adults in 2011 was 27.5 kg/m2 and was very similar for men
(27.6 kg/m2) and women (27.5 kg/m2). Mean BMI increased significantly with
age from 24.3 kg/m2 for men, and 24.7 kg/m2 for women aged 16-24, to a peak
at age 65-74 (28.8 kg/m2 for men and 28.9 kg/m2 for women) before dropping
slightly among the oldest age group (to 27.9 kg/m2 for men and 27.5 kg/m2 for
women aged 75 and over).
Figure 7B, Figure 7C, Table 7.3
Figure 7B
Prevalence of overweight and obese, by age (Men), 2011
Obese (BMI 30 or more)
Overweight (BMI 25 to <30)
100
Percent
80
60
40
20
0
16-24
25-34
35-44
45-54
55-64
65-74
75+
Age group
Figure 7C
Prevalence of overweight and obese, by age (Women), 2011
Obese (BMI 30 or more)
Overweight (BMI 25 to <30)
100
Percent
80
60
40
20
0
16-24
25-34
35-44
45-54
Age group
194
55-64
65-74
75+
7.6
WAIST CIRCUMFERENCE
7.6.1
Trends in waist circumference (WC) since 1995
Table 7.4 shows both the trend for mean waist circumference (WC) and
for prevalence of raised WC from 1995 for adults aged 16-64, as well as
figures for all adults aged 16 and over since 2003. Combined
2008/2009 and 2010/2010 data was used to allow for more detailed
sub-group analysis to be carried out. Since 1995 there has been a
steady increase in the mean WC of men aged 16-64 from 90.2 to 95.3
cm in 2008/2009 and 95.1 cm in 2010/2011. Over this same period
there was an even greater increase in the mean WC for women, rising
from 78.5 cm in 1995 to 87.2 cm in 2008/09 and 87.9 cm in 2010/2011.
The figures for all adults aged 16 and over since 2003 confirm this
upward trend. Between 2003 and 2010/2011 there was a significant
increase in mean WC for men and women aged 16 and over (from 95.3
cm to 96.3 cm for men and from 86.3 cm to 89.0 cm for women).
However, while the overall trend has been one of increase, between
2008/2009 and 2010/2011 there was no significant change in mean WC
for either men or women.
Since 1995, there has also been a steady increase in the proportion of
men and women with a raised WC (greater than 102 cm for men and
greater than 88 cm for women). The greatest increases occurred
between 1995 and 2008/2009 with at least a doubling in the proportion
of men and women aged 16-64 with a raised WC in this period (from
14.3% to 29.2% in men, and from 19.1% to 42.0% in women). The
equivalent figures in 2010/2011 were 28.1% for men, and 45.5% for
women.
The figures for all adults (aged 16 and over) since 2003 also show an
increase in waist measurements over time, but whereas the prevalence
of raised WC in men increased between 2003 and 2008/2009 and then
stabilised in 2010/2011 (27.9%, 33.0% and 31.7%, respectively), for
women it continued to increase (38.9%, 45.3% and 49.1%,
respectively).
Table 7.4
7.6.2
Waist circumference by age and sex, 2010 and 2011 combined
Mean waist circumference (WC) and prevalence of raised WC for adults
aged 16 and over for 2010/2011 are shown in Table 7.4. Mean WC was
96.3 cm in men and 89.0 cm in women. There were significant
differences in mean WC by age, with a linear increase up until age 5564 for both sexes. For men, it ranged from 83.9 cm in those aged 16-24
to above 100 cm in those aged 55-64 and over (101.2 cm -103.2 cm).
Among women, WC increased from 80.6 cm in the youngest age group
to 93.2 cm for those aged 55-64, and then dipped slightly for the oldest
group (91.9 cm).
Women were more likely than men to have a raised WC (49.1%
compared with 31.7%) and, as Figure 7D illustrates, this was true
195
across all age groups. As with mean WC, the prevalence of raised WC
also increased significantly with age. 9.2% of men aged 16-24 had a
raised WC and, with the exception of a blip in men aged 65-74, this
increased steadily to 54.6% of those aged 75 and over. For women,
prevalence increased from 26.5% of women in the youngest age group
to 66.4% of those aged 65-74 before dropping to 56.0% for women
aged 75 and over.
Figure 7D, Table 7.4
Men
Figure 7D
Prevalence of raised waist circumference (>102 cm men / > 88 cm women),
by age and sex, 2010-2011 combined
Women
80
70
Percent
60
50
40
30
20
10
0
16-24
25-34
35-44
45-54
55-64
65-74
75+
Age group
7.7
DISEASE RISK BASED ON BMI AND WAIST CIRCUMFERENCE
7.7.1
Disease risk by age and sex, 2008-2011 combined
As described in Section 7.2.5, the WHO suggests that BMI and waist
measures used in combination can provide a better estimate of adults’
risk of disease. The SIGN guidelines10 on obesity management set out
five risk categories: no increased risk, increased risk, high risk, very
high risk and extremely high risk. Waist circumference (WC) determines
the risk level (increased, high or very high) for people with a BMI
between 25 and less than 35 kg/m2, with a higher risk assigned to
people with a higher WC. The risk level (very high and extremely high)
for people with BMI levels of 35 kg/m2 and above depends on BMI,
regardless of WC. The inset table below and Table 7.4 show the
proportions of adults in Scotland in the 2008-2011 period who were
estimated to be in each of these risk categories, based on the BMI and
waist measurements collected in the survey.
196
Risk level
No increased risk
Increased risk
High risk
Very high risk
Extremely high risk
Men
%
46.2
18.1
12.1
20.9
1.4
Women
%
38.3
14.5
18.7
23.3
3.4
In addition to the aggregated health risk status figures for adults shown
in the inset table above, a breakdown of risk status within each BMI
group based on WC is also presented in Table 7.5.
The SIGN guidelines do not explicitly assign a risk status to people with
a normal BMI and high or very high WC. However, in line with the
advice in SIGN that this group of people can be at increased risk of
some diseases, the small proportions of men (0.1%) and women (2.0%)
with a normal BMI and very high WC were placed in the increased risk
group.24
Risk status varied by both sex and age. Men, for example, were more
likely than women to fall into the no increased risk group (46.2%
compared with 38.3%). 16-24 year olds were most likely to be at no
increased risk of disease (72.9% and 59.7% for men and women
respectively). The proportions of men in this risk group decreased with
age until age 55-64 at which point it flattened out (27.0%-28.5%). For
women, the decrease continued until the age of 65-74 (23.9%), before
increasing again to 30.2%.
Based on their BMI and WC, 18.1% of men and 14.6% of women were
classified as being at increased risk of disease. Men aged 45 and over
and women aged 25 - 44 were most likely to have increased risk status
while those in the youngest age group (16-24 year olds) stood out as
being much less likely than other age groups to be classified as such
(7.1% and 6.9% for men and women aged 16-24 respectively).
Women were more likely than men to fall into the high risk group
(18.7% compared with 12.1%). For both sexes, the proportion at high
risk increased steadily with age with 4.2% of men and 10.7% of women
aged 16-24 were at high risk compared with 25.0% and 26.5%
respectively for those aged 75 and over.
Around a fifth (20.9%) of men and a quarter (23.3%) of women were
classified as being at a very high risk of disease with men aged 55-64
(32.5%) and women age 55-74 (32.2-32.3%) most likely to be classified
as such. Few were classified as being at extremely high risk (1.4% of
men and 3.4% of women) and while this did not vary greatly by age
among men, women aged 45-54 and 65-74 were more likely to be at
extremely high risk (5.1% and 5.0% respectively) than women of other
ages.
The combined prevalence of those at high (or greater) risk (defined as
high, very high or extremely high risk) is also shown by age and sex in
197
Table 7.5. As the figures for the separate risk categories discussed
above indicated, women were more likely than men to be at high (or
greater) risk of disease (45.4% compared with 34.4%), and this was
true at all ages. Based on the preceding discussions of the BMI and
waist measurement results, this difference in disease risk is largely due
to the prevalence of increased WC being higher in women than men.
Table 7.5
According to their BMI, a significantly higher proportion of men (42.6%)
than women (33.7%) were overweight (BMI 25 to <30). There were
however, some striking differences in the risk status of men and women
in this group. Despite having a BMI that classified them as being
overweight, when examined in combination with WC, a significant
proportion of overweight men (15.7%) were at no increased risk of
disease. The equivalent figure for overweight women was just 4.1%.
Conversely, half of overweight women were classified as being at high
risk; almost double the proportion of overweight men that fell into this
category. This delineation of health risk illustrates the public health
importance of overweight status, particularly among women, as well as
obesity.
Everyone who was obese was classified as increased risk or above.
The proportion of obese men and women at increased risk was very
small (just 0.4% for men and 0.1% for women).
Figure 7E, Figure 7F, Table 7.5
Figure 7E
Overweight (based on BMI) by health risk category (based on waist
measurement and BMI) (Men), 2008-2011 combined
High (or greater)
Increased
No risk
60
Percent
40
20
0
16-24
25-34
35-44
45-54
Age group
198
55-64
65-74
75+
Figure 7F
Overweight (based on BMI) by health risk category (based on waist
measurement and BMI) (Women), 2008-2011 combined
High (or greater)
Increased
No risk
60
Percent
40
20
0
16-24
25-34
35-44
45-54
55-64
65-74
75+
Age group
7.7.2
Disease risk by socio-demographic factors, 2008-2011 combined
Tables 7.6 to 7.8 present results for risk status by socio-economic
classification (NS-SEC of the household reference person), equivalised
household income and the Scottish Index of Multiple Deprivation
(descriptions of each of these measures are available in the Glossary at
the end of this volume) for the combined 2008-2011 samples. In
addition to presenting the figures for all of the health risk categories
separately (from no increased risk to extremely high risk) the tables also
present summary rows both for those classified as at high (or greater)
risk, and those at very / extremely high risk.
To ensure that the comparisons presented in this section are not
confounded by the different age profiles of the sub-groups, the data
have been age-standardised (for a description of age-standardisation
please refer to the Glossary). On the whole, the differences between
observed and age-standardised percentages are small. Therefore, the
percentages and means presented are the standardised ones only.
Socio-economic classification (NS-SEC)
There was a significant association between health risk category and
NS-SEC, but with no clear pattern. Men in lower supervisory and
technical households were the most likely to be at no increased risk
(51.8%), and, along with those in professional and managerial
households, were the least likely to be at a high (or greater) risk
(32.6%). The pattern was a little different for women. Those in
professional and managerial households were the most likely to be in
the no increased risk group (43.7%), while those in intermediate, and in
semi-routine and routine households, were the least likely to (32.6%).
Women in semi-routine and routine households were also the most
199
likely to be in the high (or greater) risk group (52.1%), with those in
professional and managerial households the least likely (41.0%) to be.
Table 7.6
Equivalised household income
Health risk category varied by equivalised household income, but again
with different patterns for men and women. Men living in households in
the 4th income quintile were the most likely to be in the high (or greater)
risk group (42.7%), and in the very / extremely high risk group (27.7%),
and were least likely to be at no increased health risk (36.3%).
However, there was no clear pattern here as those in the 3 rd income
quintile had the lowest risk profile. The pattern for women was clearer:
the proportion who were at no increased risk declined between the 1st
and 4th income quintiles (from 44.1% to 34.2%), and was a little higher
again for women in the 5th (lowest) quintile (36.5%). Conversely, the
proportion of women in the high (or greater) risk group increased
between the 1st and 4th quintiles (from 40.6% to 52.7%), and then
declined (to 48.8%). The pattern for the very / extremely high risk group
was similar to that for the high (or greater) risk group.
Table 7.7
Scottish Index of Multiple Deprivation (SIMD)
Two measures of SIMD are being used throughout this report. The first
– which uses quintiles – enables comparisons to be drawn between the
most and least deprived 20% of areas and the three intermediate
quintiles. The second contrasts the most deprived 15% of areas with
the 85% least deprived. Note that while SHeS was designed to provide
robust data for the SIMD 15% areas after four years of data had been
collected and combined (2008-2011), this was for the main interview
sample and therefore does not apply to the nurse sub-sample which the
figures in Table 7.8 and discussion below are based on.
Table 7.8 shows estimates of being in the various health risk categories
by SIMD. There was some variation in risk levels across deprivation
quintiles, and as with income, the pattern was slightly clearer for women
than for men.
Men in the least deprived quintile were least likely to be at risk of
obesity related disease - 49.1% had no increased risk, compared to
44.7%-46.6% of those in the remaining four quintiles. The patterns for
the high (or greater) risk group and the very / extremely high risk group,
were similar, but rather inconsistent. For example, men in the least
deprived quintile and in the 3rd quintile were equally likely to be in the
high (or greater) risk group (31.0%-31.6%), while men in the most
deprived quintile were the most likely to be in the high (or greater) risk
group (38.8%). As Figure 7G shows, there was a more obvious gradient
in the association between risk profile and area deprivation among
women. The proportion at no increased risk generally declined as
deprivation increased (from 45.3% in the least deprived quintile to
29.8% in the most deprived). Conversely, the proportion in the high (or
greater) risk group generally increased in line with deprivation, while the
200
proportion of women in the very / extremely high risk group doubled
between the least and most deprived quintiles (from 17.7% to 35.6%).
As the quintile patterns suggest, the difference between the health risk
profiles of people living in the 15% most deprived areas in Scotland and
the rest of the country was more pronounced for women than for men.
For example, the proportion of men in the 15% most deprived areas
that were at no increased risk was similar to that for the rest of Scotland
(47.5% and 46.1%, respectively). In contrast, there was a 10
percentage point difference between these groups for women (29.9%
and 40.0%, respectively). Similar magnitudes of difference were seen
across the other risk groups.
Figure 7G, Table 7.8
Figure 7G
Prevalence of high (or greater) disease risk and above in adults aged 16+ (agestandardised),
by Scottish Index of Multiple Deprivation quintile and sex, 2008-2011 combined
60
Men
Women
50
Percent
40
30
20
10
0
1st (least
deprived)
7.8
2nd
3rd
SIMD quintile
4th
5th (most
deprived)
FACTORS ASSOCIATED WITH HIGH (OR GREATER) DISEASE RISK
Multivariate logistic regression was used to examine the independent effect of a
range of socio-demographic and behavioural factors associated with adults’
disease risk. The classification, endorsed by SIGN in their guideline on
obesity,10 has been use in this analysis. It uses combination of both BMI and
WC to letter estimate an individuals risk of conditions like type 2 diabetes
hypertension and CVD risk. A fuller discussion of the classification of disease
risk used in this analysis can be found in Sections 7.2.5 and 7.7.1.
The regression explored factors independently associated with high (or greater)
risk of disease. High (or greater) is defined as those classified as at high, very
high or extremely high risk according to the SIGN classification. 10 In the
discussion that follows this group is referred to as ‘high’ risk.
The factors investigated included a number of the behavioural characteristics
explored in other chapters in this report, such as cigarette smoking, physical
activity and alcohol consumption, as well as the key socio-demographic factors
of age, SIMD, equivalised household income and both parental and household
201
NS-SEC. Regressions models were run on combined 2008-2011 data for men
and women separately.
The odds ratios of being at high risk of disease are presented in Table 7.9. In
these analyses, the odds of a reference group (shown in the table with a value
of 1) are compared with that of the other categories for each of the individual
factors. In this example, an odds ratio of greater than 1 indicates that the group
in question has increased odds of having high risk of disease compared with the
reference category, and an odds ratio of less than 1 mean they have decreased
odds. By simultaneously controlling for a number of factors, the independent
effect each factor has on the variable of interest can be established. For more
information about logistic regression models and how to interpret their results
see the glossary at the end of this volume.
The factors found to be associated with high disease risk for both men and
women were: age, economic status and physical activity. Additionally,
educational attainment, marital/partnership status and self-assessed health
were significant factors for men while SIMD, parental NS-SEC, smoking status
and longstanding illness were also significant for women.
When compared with women aged 16-24, women aged 45 and over had
increased odds of being at high risk of disease (odds ratios of 1.78 to 3.06). The
odds of being at high risk of disease were highest for those aged 55-64 (3.06
times higher than for the youngest age group). Overall, age was associated
significantly with high disease risk for men, but the nature of the relationship
was not clear.
For both men and women, economic status was independently associated with
being at high risk of disease but the nature of the relationship differed slightly.
Men in education had lower odds of being at high risk than those in the
reference group - men in paid employment, self-employed, on government
training or doing something else (odds ratio of 0.10). For women, those who
were retired or looking after home/family had decreased odds when compared
to the reference group (odds ratio of 0.66).
Physical activity levels were also associated with disease risk for both men and
women. Three levels of physical activity were examined: high (meeting the
recommended level of 30 minutes or more at least 5 days a week); medium (30
minutes or more on 1 to 4 days a week); and low (fewer than 30 minutes of
activity a week). Compared with those in the high physical activity group, those
with medium and low activity levels had significantly increased odds of being
classified as at high risk of disease with those who were least active (low)
having the greatest odds (the odds ratios for men were 1.89 for the medium
activity level group and 2.41 for the low activity group, equivalent figures for
women were 1.72 and 2.56 respectively).
Educational attainment was associated with being at high risk of disease for
men: with those with no qualifications or who did not supply information of their
education having significantly higher odds of being at increased health risk than
those with degree or higher qualifications (odds ratio of 1.64). Marital status was
also a significant factor for men, with single, separated/divorced and widowed
202
men all having lower odds of being at high risk when compared with men that
were married or living as married (odds ratios of 0.63, 0.52 and 0.54
respectively).
When compared with men who had never smoked cigarettes, those who
smoked had decreased odds of being at high disease risk (odds ratio of 0.66).
Overall, self-assessed health was also significantly associated with high
disease risk among men but with no clear pattern (p=0.027). Neither smoking
status nor self-assessed health were significant factors for women.
For women, SIMD was also associated with being at high risk of disease. Those
living in the 2nd, 4th and 5th (most deprived) quintiles had significantly increased
odds of being at high risk when compared with those living in the least deprived
quintile (odds ratios of 1.43, 1.74 and 1.93 respectively).
Parental socio-economic classification (NS-SEC) was also independently
associated with high risk of disease for women. Women with semi-routine or
routine backgrounds had significantly increased odds of being at high disease
risk when compared with those whose parents worked in managerial and
professional occupations (odds ratio of 1.34).
Overall, cigarette smoking status and presence of a longstanding illness were
significantly associated with being at high risk of disease for women but the
nature of these relationships was unclear (p=0.016 and p=0.036, respectively).
Table 7.9
203
References and notes
1
Grant, I., Fischbacher, C., and Whyte, B. (2007). Obesity in Scotland – An epidemiology briefing.
Edinburgh: NHS National Services Scotland/Scottish Public Health Observatory. [online] Available
from: www.scotpho.org.uk/home/Publications/scotphoreports/pub_obesityinscotland.asp
2
Scottish Government. Preventing Overweight and Obesity in Scotland: A Route Map Towards
Healthy Weight. Edinburgh: the Scottish Government, 2010.
3
Gray, L. and Leyland, A. (2009). Chapter 7: Obesity. In Bromley, C., Bradshaw, P. and Given, L.
[eds.] The 2008 Scottish Health Survey – Volume 1: Main Report. Edinburgh, Scottish
Government. www.scotland.gov.uk/Publications/2009/09/28102003/0
4
Gray, L. and Leyland, A. (2010). Chapter 7: Adult obesity. In Bromley, C., Given, L. and Ormston,
R. [eds.] The 2009 Scottish Health Survey – Volume 1: Main Report. Edinburgh, Scottish
Government. www.scotland.gov.uk/Publications/2010/09/23154223/0
5
Gray, L. and Leyland, A. (2011). Chapter 7: Adult and child obesity. In Bromley, C. and Given, L.
[eds.] The 2010 Scottish Health Survey – Volume 1: Main Report. Edinburgh, Scottish
Government. www.scotland.gov.uk/Publications/2011/09/27084018/51
6
Healthy Eating, Active Living: An action plan to improve diet, increase physical activity and tackle
obesity (2008-2011), Edinburgh: Scottish Government, 2008.
7
See: www.keepwellscotland.com and www.healthscotland.com/Prevention-2010.aspx
8
Obesity Route Map: Action Plan – Version 1.0. Edinburgh: Scottish Government, 2011.
www.scotland.gov.uk/Resource/Doc/346007/0115166.pdf
9
Health Analytical Services Scottish Government and Information and Statistics Division, NHS
National Services Scotland. Indicators to Monitor Progress of the Obesity Route Map. Edinburgh:
Scottish Government, 2011 www.scotland.gov.uk/Resource/Doc/346011/0115167.pdf
10
Scottish Intercollegiate Guidelines Network. Management of obesity. A national clinical guideline.
SIGN guideline no. 115. Edinburgh: SIGN, 2010.
11
See: www.scotland.gov.uk/About/Performance/scotPerforms/indicator/birthweight
12
See: www.scotland.gov.uk/About/scotPerforms/indicator/healthyweight
13
Rutherford, L. and Purdon, S. Scottish Health Survey Waist and Blood Pressure Validation Study,
Edinburgh: Scottish Government, Publication forthcoming.
14
The Frankfort Plane is an imaginary line passing through the external ear canal and across the top
of the lower bone of the eye socket, immediately under the eye. Participants’ heads are positioned
with the Frankfort Plane in a horizontal position when height is measured using a stadiometer as a
means of ensuring that, as far as possible, the measurements taken are standardised.
15
For a full review of obesity measures see: National Institute of Health and Clinical Excellence
(2006). CG43 Obesity: full guideline, section 2: Identification and Classification. [online] Available
from: www.nice.org.uk/guidance/index.jsp?action=download&o=38295
16
Romero-Corral, A. et al (2008). Accuracy of body mass index in diagnosing obesity in the adult
general population. International Journal of Obesity. 32, 959–966.
17
These cut-offs differ to those used in the previous surveys. In 1995 and 1998 the normal weight
range was defined as 20-25 kg/m2, in 2003 it was changed to 18.5-25 kg/m2. From 2008 onwards
the ranges will be defined as set out below. This brings the definition in line with WHO
recommendations. The impact of the change of definition is very marginal as very few people have
2
a BMI measurement that is exactly 18.5, 25, 30 or 40 kg/m .
204
Underweight
Normal weight
Overweight
Obese
Morbidly obese
2003
18.5 or under
Over 18.5 – 25
Over 25 – 30
Over 30 – 40
Over 40
2008 onwards
Less than 18.5
18.5 to less than 25
25 to less than 30
30 to less than 40
40+
18
World Health Organisation (2009). WHO Obesity Factsheet. [online] Available from:
www.who.int/mediacentre/factsheets/fs311/en/index.html
19
Prospective Studies Collaboration (2009). Body-mass index and cause-specific mortality in
900,000 adults: collaborative analyses of 57 prospective studies. The Lancet. 373, 1083-96.
20
World Health Organisation. (2000). The problems of overweight and obesity. In: WHO. Obesity:
preventing and managing the global epidemic. Report of a WHO consultation. WHO Technical
Report Series 894. Geneva: WHO. [online] Available from:
http://whqlibdoc.who.int/trs/WHO_TRS_894_(part1).pdf
21
NHS Consensus Development Conference. (2006). Gastrointestinal surgery for severe obesity.
Nutrition. 12, 397-402.
22
For details about the methodology of the hip circumference measurements, see the methods
section of the 2009 Obesity chapter (reference 4 above), or the measurement protocols set out in
Volume 3 of this report (Technical Report).
23
National Institutes of Health. Third report of the National Cholesterol Education Program Expert
Panel on Detection, Evaluation and Treatment of High Blood Cholesterol in Adults (Adult
Treatment Panel III). Bethesda, Md: National Institutes of Health 2001. NIH Publication 01-3670.
24
People with a BMI in the normal range and a low WC, or with a normal BMI and high WC were
assigned to the “no increased risk” group, as per the SIGN recommendations.
205
Table list
Table 7.1
Table 7.2
Table 7.3
Table 7.4
Table 7.5
Table 7.6
Table 7.7
Table 7.8
Table 7.9
Adult response to anthropometric measurements (height, weight and BMI),
2008-2011 combined, by age and sex
Mean BMI, prevalence of overweight and obesity, 1995, 1998, 2003, 2008,
2009, 2010, 2011, by age and sex
Adult body mass index (BMI), 2011, by age and sex
Mean and raised waist circumference (WC), 1995, 1998, 2003, 2008/2009
combined, 2010/2011 combined, by age and sex
Health risk category associated with overweight and obesity based on Body
Mass Index (BMI) and waist circumference, 2008-2011 combined, by age and
sex
Health risk category, 2008-2011 combined (age-standardised), by NS-SEC of
household reference person and sex
Health risk category, 2008-2011 combined (age-standardised), by equivalised
household income quintile and sex
Health risk category, 2008-2011 combined (age-standardised), by Scottish
Index of Multiple Deprivation and sex
Estimated odds ratios for high (or greater) disease risk, 2008-2011 combined,
by associated risk factors and sex
206
Table 7.1
Adult response to anthropometric measurements (height, weight and
BMI), 2008-2011 combined, by age and sex
Aged 16 and over
Proportion providing
valid measurement
Men
Height
Weight
BMI
Waist and hip
Women
Height
Weight
BMI
Waist and hip
Bases (weighted):
Men
Height, weight, BMI (interviewed)
Waist and hip
Women
Height, weight, BMI (interviewed, not
pregnant)
Waist and hip
Bases (unweighted):
Men
Height, weight, BMI (interviewed)
Waist and hip
Women
Height, weight, BMI (interviewed, not
pregnant)
Waist and hip
2008-2011 combined
Age
Total
16-24 25-34 35-44 45-54 55-64 65-74
75+
%
%
%
%
%
%
%
%
90
90
89
99
90
88
88
100
88
87
87
100
88
86
86
99
86
85
84
99
86
86
85
99
74
75
72
97
87
86
85
99
90
86
86
98
89
87
87
99
89
86
85
99
87
84
84
98
85
83
83
96
83
82
81
99
70
72
68
94
86
84
83
98
2047
304
2201
327
2386
355
2493
370
2148
319
1481
220
1002 13759
149 2044
1960
2202
2606
2679
2260
1714
1565 14987
286
307
382
399
336
255
1098
133
1539
200
2005
305
2303
345
2253
365
1970
312
1342 12510
196 1856
1453
2158
2818
2926
2803
2234
1845 16237
185
282
420
460
440
347
207
233
254
2196
2388
Table 7.2
Mean BMI, prevalence of overweight and obesity, 1995, 1998, 2003, 2008,
2009, 2010, 2011, by age and sex
Aged 16 and over with both valid height and weight
measurements
BMI (kg/m2)
1995, 1998, 2003, 2008, 2009, 2010, 2011
Total
16+
Age
16-24
25-34
35-44
45-54
55-64
65-74
75+
Total
16-64
%
%
%
%
%
%
%
%
%
25 and overa
1995
1998
2003
2008
2009
2010
2011
22.6
28.4
30.4
34.9
34.6
29.9
35.2
49.6
58.5
60.1
61.3
57.1
60.5
62.0
65.2
66.9
69.2
74.5
75.5
76.5
76.4
70.9
75.4
76.9
77.3
78.1
79.1
78.1
73.8
75.9
80.1
81.8
83.5
80.8
79.8
n/a
72.7
76.3
81.9
79.3
76.0
82.2
n/a
n/a
66.0
75.1
71.2
75.9
74.8
55.6
61.0
64.0
66.3
66.2
66.1
67.1
n/a
n/a
65.4
68.5
67.9
67.8
69.2
30 and overb
1995
1998
2003
2008
2009
2010
2011
4.5
7.3
7.5
8.0
11.2
9.2
14.1
14.4
15.4
16.2
17.1
16.7
19.4
21.1
18.9
19.9
24.4
30.3
31.6
31.7
29.1
21.9
28.8
27.5
30.3
34.8
34.1
32.2
21.0
23.0
33.3
38.1
37.6
37.3
35.2
n/a
26.6
27.3
36.4
30.0
34.5
35.7
n/a
n/a
18.0
23.5
23.9
25.8
28.4
15.9
18.8
22.0
24.9
26.7
26.6
26.7
n/a
n/a
22.4
26.0
26.9
27.4
27.7
40 and overc
1995
1998
2003
2008
2009
2010
2011
0.4
0.8
1.0
0.9
1.4
0.7
0.7
0.5
0.5
0.6
0.8
2.5
0.5
0.7
2.1
1.8
0.8
3.1
0.7
0.8
1.9
3.1
1.5
1.1
2.8
2.7
0.3
0.9
2.0
3.3
1.3
0.9
1.9
n/a
0.3
1.0
1.8
1.6
0.9
1.5
n/a
n/a
0.5
0.5
0.5
0.4
0.5
0.9
1.8
1.4
1.0
1.7
1.8
n/a
n/a
1.6
1.4
1.0
1.6
1.7
Mean
1995
1998
2003
2008
2009
2010
2011
23.0
23.6
23.7
23.9
24.3
23.7
24.3
25.8
26.2
26.3
26.4
26.4
26.3
26.8
26.8
27.0
27.5
28.1
28.1
28.5
28.1
27.3
27.9
28.2
28.2
28.8
28.8
28.7
27.3
27.5
28.6
29.0
29.1
28.9
28.7
n/a
27.5
27.9
28.9
28.4
28.4
28.8
n/a
n/a
26.6
27.7
27.2
27.8
27.9
26.0
26.4
26.9
27.2
27.4
27.3
27.4
n/a
n/a
27.0
27.4
27.5
27.5
27.6
SE of the mean
1995
1998
2003
2008
2009
2010
2011
0.13
0.16
0.28
0.35
0.35
0.37
0.40
0.13
0.14
0.24
0.25
0.28
0.26
0.29
0.14
0.14
0.23
0.29
0.23
0.28
0.21
0.15
0.16
0.24
0.23
0.21
0.25
0.24
0.15
0.18
0.24
0.26
0.22
0.24
0.24
n/a
0.18
0.22
0.25
0.22
0.25
0.23
n/a
n/a
0.31
0.27
0.26
0.27
0.31
0.07
n/a
0.07
n/a
0.12
0.12
0.13
0.12
0.13
0.12
0.15
0.13
0.14
0.12
Continued…
Men
208
Table 7.2
- Continued
Aged 16 and over with both valid height and weight
measurements
BMI (kg/m2)
1995, 1998, 2003, 2008, 2009, 2010, 2011
Total
16+
Age
16-24
25-34
35-44
45-54
55-64
65-74
75+
Total
16-64
%
%
%
%
%
%
%
%
%
25 and over
1995
1998
2003
2008
2009
2010
2011
30.0
30.6
38.9
41.5
37.0
38.0
36.9
37.6
43.3
49.7
50.0
50.5
49.6
49.5
47.5
53.7
57.8
61.2
61.1
66.1
60.3
55.7
63.0
64.8
65.5
64.0
67.7
65.0
68.2
71.6
73.0
76.0
73.8
75.0
68.8
n/a
68.5
74.3
73.1
72.9
71.9
73.2
n/a
n/a
63.7
67.0
69.1
68.7
65.0
47.2
52.2
57.3
59.6
58.4
60.3
57.1
n/a
n/a
59.7
61.8
61.0
62.4
59.6
30 and overb
1995
1998
2003
2008
2009
2010
2011
9.0
7.7
13.4
18.3
15.4
17.7
12.7
13.7
19.0
20.5
19.1
24.2
20.9
21.7
17.0
20.4
25.5
27.1
29.4
30.6
30.6
20.8
26.0
26.4
29.0
28.5
30.0
31.3
27.3
31.5
31.9
36.9
31.4
39.2
31.6
n/a
30.5
40.5
35.1
35.4
31.7
35.2
n/a
n/a
26.7
27.1
28.0
32.8
30.0
17.3
20.9
23.8
26.5
26.4
28.1
26.3
n/a
n/a
26.0
27.5
27.6
28.9
27.6
40 and overc
1995
1998
2003
2008
2009
2010
2011
0.3
0.2
1.3
2.9
2.0
2.6
2.4
0.9
2.2
2.3
2.3
2.2
2.5
2.7
0.9
2.2
4.5
3.6
3.4
5.5
4.8
2.2
2.5
4.5
3.8
4.9
4.3
5.9
2.5
2.7
5.0
4.7
4.4
3.3
4.7
n/a
2.0
3.8
2.5
2.8
1.7
4.9
n/a
n/a
0.3
3.2
3.8
0.5
2.3
1.3
2.0
3.6
3.5
3.5
3.7
4.2
n/a
n/a
3.4
3.4
3.5
3.2
4.1
Mean
1995
1998
2003
2008
2009
2010
2011
23.6
23.7
24.6
25.3
24.7
25.0
24.7
24.9
25.7
26.1
26.0
26.4
26.4
26.5
25.8
26.4
27.3
27.6
27.8
28.1
27.9
26.6
27.4
27.7
28.0
27.7
28.1
28.5
27.6
28.3
28.6
29.0
28.5
29.0
28.3
n/a
27.9
29.0
28.4
28.6
28.2
28.9
n/a
n/a
27.0
27.6
27.7
27.8
27.5
25.7
26.3
26.9
27.3
27.2
27.4
27.3
n/a
n/a
27.2
27.4
27.4
27.6
27.5
SE of the mean
1995
1998
2003
2008
2009
2010
2011
0.17
0.17
0.33
0.42
0.35
0.33
0.32
0.16
0.18
0.27
0.30
0.29
0.30
0.28
0.17
0.18
0.27
0.27
0.24
0.27
0.29
0.19
0.20
0.27
0.29
0.26
0.23
0.27
0.21
0.22
0.23
0.28
0.26
0.25
0.25
n/a
0.23
0.26
0.29
0.27
0.26
0.29
n/a
n/a
0.29
0.35
0.32
0.31
0.32
0.08
n/a
0.09
n/a
0.14
0.14
0.15
0.13
0.14
0.12
0.14
0.12
0.14
0.12
Continued…
Women
a
209
Table 7.2
- Continued
Aged 16 and over with both valid height and weight
measurements
BMI (kg/m2)
1995, 1998, 2003, 2008, 2009, 2010, 2011
Total
16+
Age
16-24
25-34
35-44
45-54
55-64
65-74
75+
Total
16-64
%
%
%
%
%
%
%
%
%
25 and over
1995
1998
2003
2008
2009
2010
2011
26.6
29.4
34.5
38.0
35.7
33.8
36.0
45.1
51.2
54.8
55.8
53.9
55.4
56.0
57.3
60.3
63.4
67.5
68.1
71.3
68.3
63.9
69.3
70.8
71.2
71.1
73.3
71.3
71.2
73.7
76.5
78.9
78.5
77.9
74.3
n/a
70.4
75.2
77.2
75.9
73.9
77.5
n/a
n/a
64.6
70.3
70.0
71.7
68.8
52.4
56.7
60.6
62.9
62.4
63.3
62.2
n/a
n/a
62.4
65.1
64.4
65.1
64.3
30 and overb
1995
1998
2003
2008
2009
2010
2011
6.6
7.5
10.4
12.8
13.1
13.3
13.4
14.7
17.2
18.4
18.1
20.3
20.1
21.4
18.2
20.1
24.9
28.6
30.5
31.1
29.9
22.4
27.5
27.0
29.6
31.6
32.0
31.7
25.2
27.4
32.6
37.5
34.4
38.3
33.4
n/a
28.8
34.4
35.7
32.8
33.0
35.4
n/a
n/a
23.4
25.7
26.3
29.9
29.4
17.2
19.8
23.0
25.7
26.5
27.4
26.5
n/a
n/a
24.2
26.8
27.2
28.2
27.7
40 and overc
1995
1998
2003
2008
2009
2010
2011
0.2
0.3
1.1
1.4
1.5
1.7
1.8
1.2
1.4
1.4
1.4
1.4
1.6
2.6
1.0
1.4
3.3
2.7
2.1
4.3
2.7
2.0
2.2
3.8
2.7
3.0
3.5
4.4
1.7
1.8
3.5
4.0
2.9
2.1
3.3
n/a
1.2
2.5
2.2
2.2
1.3
3.3
n/a
n/a
0.4
1.9
2.4
0.5
1.5
1.2
1.4
2.7
2.5
2.2
2.7
3.0
n/a
n/a
2.5
2.4
2.2
2.4
2.9
Mean
1995
1998
2003
2008
2009
2010
2011
23.3
23.7
24.1
24.6
24.5
24.3
24.5
25.3
25.9
26.2
26.2
26.4
26.4
26.6
26.3
26.7
27.4
27.8
27.9
28.3
28.0
27.0
27.7
28.0
28.1
28.2
28.5
28.6
27.5
27.9
28.6
29.0
28.8
29.0
28.5
n/a
27.7
28.5
28.6
28.5
28.3
28.9
n/a
n/a
26.9
27.7
27.5
27.8
27.7
25.8
26.4
26.9
27.2
27.3
27.4
27.3
n/a
n/a
27.1
27.4
27.4
27.5
27.5
SE of the mean
1995
1998
2003
2008
2009
2010
2011
0.10
0.12
0.21
0.26
0.26
0.27
0.27
0.10
0.11
0.20
0.20
0.21
0.21
0.21
0.11
0.11
0.19
0.21
0.16
0.21
0.19
0.12
0.13
0.18
0.20
0.18
0.18
0.19
0.13
0.15
0.19
0.20
0.17
0.18
0.18
n/a
0.16
0.18
0.20
0.18
0.19
0.19
n/a
n/a
0.22
0.25
0.22
0.21
0.24
0.05
n/a
0.06
n/a
0.10
0.09
0.11
0.10
0.10
0.09
0.11
0.10
0.11
0.10
Continued…
All adults
a
210
Table 7.2
- Continued
Aged 16 and over with both valid height and weight
measurements
BMI (kg/m2)
1995, 1998, 2003, 2008, 2009, 2010, 2011
Total
16+
Age
16-24
25-34
35-44
45-54
Bases (weighted):
Men 1995
700
920
790
698
Men 1998
660
894
834
735
Men 2003
495
505
647
563
Men 2008
430
432
481
483
Men 2009
499
489
552
578
Men 2010
453
507
529
548
Men 2011
450
501
538
546
Women 1995
637
866
796
726
Women 1998
603
830
837
710
Women 2003
473
533
687
574
Women 2008
378
407
536
509
Women 2009
419
454
595
583
Women 2010
419
446
527
573
Women 2011
415
461
542
585
All adults 1995
1384
1896
1706
1520
All adults 1998
1263
1724
1670
1446
All adults 2003
967
1038
1334
1137
All adults 2008
809
840
1017
992
All adults 2009
918
943
1147
1161
All adults 2010
872
953
1057
1121
All adults 2011
866
963
1079
1131
Bases (unweighted):
Men 1995
459
793
753
655
Men 1998
373
707
764
647
Men 2003
286
380
629
523
Men 2008
225
281
396
468
Men 2009
251
356
480
533
Men 2010
245
381
429
497
Men 2011
266
355
453
506
Women 1995
492
1021
916
768
Women 1998
470
867
921
804
Women 2003
336
486
752
666
Women 2008
281
374
554
550
Women 2009
315
467
667
612
Women 2010
317
456
558
643
Women 2011
298
448
581
668
All adults 1995
989
1921
1784
1525
All adults 1998
843
1574
1685
1451
All adults 2003
622
866
1381
1189
All adults 2008
506
655
950
1018
All adults 2009
566
823
1147
1145
All adults 2010
562
837
987
1140
All adults 2011
564
803
1034
1174
a 25 and over = overweight / obese / morbidly obese.
b 30 and over = obese / morbidly obese.
c 40 and over = morbidly obese.
211
55-64
65-74
75+
Total
16-64
564
550
492
412
479
451
477
606
592
510
426
502
468
475
1252
1142
1002
837
981
919
952
n/a
408
335
285
333
321
315
n/a
502
385
322
370
354
348
n/a
909
720
608
703
676
663
n/a
n/a
180
166
197
183
175
n/a
n/a
297
249
285
257
274
n/a
n/a
477
414
482
440
449
3672
3673
2702
2238
2598
2487
2513
3632
3572
2776
2257
2553
2435
2478
7757
7245
5478
4495
5151
4922
4991
n/a
n/a
3217
2689
3129
2992
3003
n/a
n/a
3458
2828
3208
3046
3100
n/a
n/a
6675
5517
6335
6038
6103
643
619
550
452
487
468
512
808
721
668
534
617
579
601
1557
1340
1218
986
1104
1047
1113
n/a
499
421
401
440
416
421
n/a
760
459
440
443
468
473
n/a
1259
880
841
883
884
894
n/a
n/a
227
231
270
238
232
n/a
n/a
317
286
328
306
320
n/a
n/a
544
517
598
544
552
3303
3110
2368
1822
2107
2020
2092
4005
3783
2908
2293
2678
2553
2596
7776
6893
5276
4115
4785
4573
4688
n/a
n/a
3016
2454
2817
2674
2745
n/a
n/a
3684
3019
3449
3327
3389
n/a
n/a
6700
5473
6266
6001
6134
Table 7.3
Adult body mass index (BMI), 2011, by age and sex
Aged 16 and over with both valid height and weight measurements
2011
BMI (kg/m2)
Total
Age
16-24
25-34
35-44
45-54
55-64
65-74
75+
%
%
%
%
%
%
%
%
Less than 18.5
18.5 to less than 25
25 to less than 30
30 to less than 40
40+
8.1
56.7
21.1
12.7
1.4
0.9
37.1
40.8
18.6
2.5
0.1
23.5
47.2
28.5
0.7
0.5
21.4
45.9
29.5
2.7
1.0
19.1
44.6
33.3
1.9
0.2
17.6
46.5
34.2
1.5
0.8
24.4
46.4
28.1
0.4
1.7
29.1
41.5
26.0
1.7
All 25 and overa
All 30 and overb
35.2
14.1
62.0
21.1
76.4
29.1
78.1
32.2
79.8
35.2
82.2
35.7
74.8
28.4
69.2
27.7
Mean
Standard error of the mean
24.3
0.40
26.8
0.29
28.1
0.21
28.7
0.24
28.7
0.24
28.8
0.23
27.9
0.31
27.6
0.12
Less than 18.5
18.5 to less than 25
25 to less than 30
30 to less than 40
40+
7.2
55.9
24.2
10.3
2.4
1.9
48.6
27.8
19.0
2.7
0.6
39.1
29.7
25.8
4.8
0.9
34.1
33.7
25.4
5.9
0.9
30.3
37.2
26.8
4.7
0.8
26.0
38.0
30.3
4.9
2.5
32.4
35.0
27.8
2.3
2.0
38.4
32.0
23.5
4.1
All 25 and overa
All 30 and overb
36.9
12.7
49.5
21.7
60.3
30.6
65.0
31.3
68.8
31.6
73.2
35.2
65.0
30.0
59.6
27.6
Mean
Standard error of the mean
24.7
0.32
26.5
0.28
27.9
0.29
28.5
0.27
28.3
0.25
28.9
0.29
27.5
0.32
27.5
0.12
All 25 and overa
All 30 and overb
36.0
13.4
56.0
21.4
68.3
29.9
71.3
31.7
74.3
33.4
77.5
35.4
68.8
29.4
64.3
27.7
Mean
Standard error of the mean
24.5
0.27
26.6
0.21
28.0
0.19
28.6
0.19
28.5
0.18
28.9
0.19
27.7
0.24
27.5
0.10
538
542
1079
546
585
1131
477
475
952
315
348
663
175
274
449
3003
3100
6103
453
581
1034
506
668
1174
512
601
1113
421
473
894
232
320
552
2745
3389
6134
Men
Women
All Adults
Bases (weighted):
Men
450
501
Women
415
461
All adults
866
963
Bases (unweighted):
Men
266
355
Women
298
448
All adults
564
803
a 25 and over = overweight (including obese).
b 30 and over = obese.
212
Table 7.4
Mean and raised waist circumference (WC), 1995, 1998, 2003, 2008/2009
combined, 2010/2011 combined, by age and sex
Aged 16 and over with valid waist
measurements
WC
1995, 1998, 2003, 2008/2009 combined, 2010/2011 combined
Total
16+
Age
16-24
25-34
35-44
45-54
55-64
65-74
75+
Total
16-64
Mean WC
1995
1998
2003
2008/2009
2010/2011
80.7
82.6
83.6
84.8
83.9
88.9
89.7
92.7
91.0
91.3
92.1
92.8
95.9
98.2
96.8
94.1
96.3
98.3
99.5
99.8
96.1
97.3
100.2
101.7
102.3
n/a
97.6
100.2
102.9
101.2
n/a
n/a
98.1
100.5
103.2
90.2
91.8
94.2
95.3
95.1
n/a
n/a
95.3
96.5
96.3
SE of the mean
1995
1998
2003
2008/2009
2010/2011
0.36
0.42
0.85
1.92
1.60
0.36
0.39
0.78
0.90
1.22
0.36
0.38
0.66
1.03
1.21
0.40
0.44
0.74
1.04
1.10
0.44
0.49
0.68
0.88
1.05
n/a
0.58
0.72
0.92
0.98
n/a
n/a
0.78
1.10
0.98
0.19
0.21
0.43
0.67
0.67
n/a
n/a
0.38
0.58
0.59
2.3
5.5
3.7
8.8
9.2
10.7
11.6
17.0
11.0
16.7
13.8
15.7
27.3
39.2
26.0
20.9
28.6
34.5
36.6
36.7
26.6
29.7
41.3
47.3
50.3
n/a
35.6
44.0
54.5
42.6
n/a
n/a
35.3
45.3
54.6
14.3
18.0
25.2
29.2
28.1
n/a
n/a
27.9
33.0
31.7
Mean WC
1995
1998
2003
2008/2009
2010/2011
72.2
73.9
79.3
80.1
80.6
76.3
78.9
82.9
84.8
84.7
78.9
80.9
85.2
86.1
88.7
81.2
83.6
86.7
90.2
90.5
84.4
86.9
90.3
93.6
93.2
n/a
87.6
92.0
93.1
93.1
n/a
n/a
89.3
90.7
91.9
78.5
80.9
84.9
87.2
87.9
n/a
n/a
86.3
88.3
89.0
SE of the mean
1995
1998
2003
2008/2009
2010/2011
0.42
0.43
1.07
1.54
1.53
0.38
0.43
0.83
1.19
1.19
0.42
0.45
0.61
0.74
1.20
0.48
0.48
0.78
1.19
0.91
0.52
0.55
0.66
0.96
1.02
n/a
0.57
0.74
1.15
1.13
n/a
n/a
0.81
1.08
1.08
0.21
0.22
0.40
0.56
0.55
n/a
n/a
0.35
0.48
0.47
% with WC > 88cma
1995
1998
2003
2008/2009
2010/2011
7.0
7.8
20.4
27.6
26.5
13.6
18.8
28.1
28.7
34.7
20.0
23.8
33.4
38.9
44.5
24.6
32.0
38.4
48.7
51.8
31.7
41.1
49.9
63.1
65.4
n/a
46.7
56.5
59.0
66.4
n/a
n/a
52.5
54.9
56.0
19.1
n/a
24.7
n/a
34.3
38.9
42.0
45.3
45.5
49.1
Continued…
Men
% with WC > 102cma
1995
1998
2003
2008/2009
2010/2011
Women
213
Table 7.4
- Continued
Aged 16 and over with valid waist
measurements
WC
1995, 1998, 2003, 2008/2009 combined, 2010/2011 combined
Total
16+
Age
16-24
25-34
35-44
45-54
55-64
65-74
Bases (weighted):
Men 1995
622
865
752
660
528
n/a
Men 1998
555
746
745
668
526
398
Men 2003
370
405
506
442
377
269
Men 2008/2009
160
168
191
191
165
113
Men 2010/2011
142
157
162
175
150
104
Women 1995
574
768
766
673
548
n/a
Women 1998
512
712
735
666
526
460
Women 2003
347
401
512
430
388
311
Women 2008/2009
152
155
208
205
168
132
Women 2010/2011
128
147
170
186
153
119
Bases
(unweighted):
Men 1995
399
736
706
619
601
n/a
Men 1998
308
598
682
588
586
488
Men 2003
175
274
459
413
444
361
Men 2008/2009
64
103
164
171
197
172
Men 2010/2011
68
96
139
170
163
137
Women 1995
440
903
870
713
735
n/a
Women 1998
389
747
806
747
655
695
Women 2003
204
343
567
521
544
381
Women 2008/2009
101
138
236
210
234
188
Women 2010/2011
81
140
180
242
187
155
a A raised WC is more than 102 cm for men and more than 88 cm for women.
214
75+
Total
16-64
n/a
n/a
165
74
71
n/a
n/a
290
114
106
3426
3240
2099
875
787
3329
3150
2077
888
785
n/a
n/a
2532
1061
962
n/a
n/a
2679
1134
1010
n/a
n/a
230
99
92
n/a
n/a
290
117
122
3061
2761
1765
699
636
3661
3340
2179
919
830
n/a
n/a
2356
970
865
n/a
n/a
2850
1224
1107
Table 7.5
Health risk category associated with overweight and obesity based on
Body Mass Index (BMI) and waist circumference, 2008-2011 combined, by
age and sex
Aged 16 and over with valid height, weight and waist measurementsa
b
Waist circumference Health risk
and BMI
categoryd
c
classification
Men
2008-2011 combined
Age
Total
16-24 25-34 35-44 45-54 55-64 65-74
75+
%
%
%
%
%
%
%
%
Underweight
Low WC
High WC
Very high WC
All underweight
Not applicable
Not applicable
Not applicable
7.3
7.3
0.6
0.6
-
0.4
0.4
0.3
0.3
0.2
0.2
-
1.3
1.3
Normal
Low WC
High WC
Very high WC
All normal
Not applicable
Not applicable
Increased
55.3
55.3
41.0
1.5
42.5
22.2
4.4
26.6
21.0
2.6
23.6
14.8
3.2
0.2
18.3
14.4
3.5
0.9
18.8
14.6
6.5
21.1
27.7
2.8
0.1
30.6
No increased
risk
Increased
High
17.7
24.2
19.4
14.6
9.3
10.6
5.9
15.7
7.1
0.8
25.6
16.9
4.5
45.6
17.7
6.2
43.2
19.7
8.2
42.5
21.3
16.4
47.0
21.8
17.4
49.8
22.3
23.0
51.2
17.6
9.3
42.6
Increased
High
Very high
3.4
4.7
8.1
0.6
1.4
6.3
8.3
0.4
2.8
22.4
25.7
1.2
5.8
18.3
25.3
0.9
25.5
26.5
2.2
22.3
24.4
2.0
22.3
24.3
0.4
2.8
16.8
20.0
Obesity II
Low WC
High WC
Very high WC
All obese II
Very high
Very high
Very high
Very high
2.3
2.3
1.7
1.7
2.8
2.8
6.3
6.3
6.9
6.9
6.1
6.1
3.0
3.0
4.2
4.2
Obesity III
Low WC
High WC
Very high WC
All obese III
Extremely high
Extremely high
Extremely high
Extremely high
1.5
1.5
1.3
1.3
1.7
1.7
2.0
2.0
1.1
1.1
0.6
0.6
0.5
0.5
1.4
1.4
Not applicable
No increased
Increased
High
Very high
Extremely high
7.3
72.9
7.1
4.2
7.0
1.6
0.6
66.7
17.5
5.9
8.0
1.3
46.0
18.1
9.0
25.3
1.7
0.4
38.2
20.9
14.1
24.6
2.0
0.3
27.4
21.5
17.3
32.5
1.1
0.2
28.5
22.7
19.5
28.4
0.6
27.0
22.3
25.0
25.2
0.5
1.3
46.2
18.1
12.1
20.9
1.4
12.8
8.5
15.2
9.3
35.9
26.9
40.6
26.6
50.9
33.6
48.6
29.0
50.7 34.4
25.7 22.3
Continued…
Overweight
Low WC
High WC
Very high WC
All overweight
Obesity I
Low WC
High WC
Very high WC
All obese I
d
Men – Overall risk
High/very high/extremely high risk
Very/extremely high risk
215
Table 7.5
- Continued
Aged 16 and over with valid height, weigh and waist measurements
b
Waist circumference Health risk
and BMI
categoryd
c
classification
Women
a
2008-2011 combined
Age
Total
16-24 25-34 35-44 45-54 55-64 65-74
75+
%
%
%
%
%
%
%
%
Underweight
Low WC
High WC
Very high WC
All underweight
Not applicable
Not applicable
Not applicable
6.0
6.0
2.4
2.4
0.6
0.6
1.3
1.3
0.4
0.4
0.9
0.9
0.6
0.6
1.7
1.7
Normal
Low WC
High WC
Very high WC
All normal
Not applicable
Not applicable
Increased
48.3
7.6
1.4
57.3
29.8
11.5
2.5
43.8
25.3
11.6
1.1
38.0
21.5
8.1
2.1
31.7
12.4
10.3
3.1
25.8
10.6
10.8
2.5
24.0
12.6
16.0
1.4
30.0
23.7
10.5
2.0
36.2
Overweight
Low WC
High WC
Very high WC
All overweight
No increased
Increased
High
3.8
5.5
9.3
18.6
8.8
14.6
10.2
33.5
3.8
15.7
16.1
35.6
4.5
14.1
17.5
36.1
2.5
10.2
24.2
36.9
2.4
12.2
22.4
37.0
1.6
13.2
24.4
39.1
4.1
12.4
17.2
33.7
Obesity I
Low WC
High WC
Very high WC
All obese I
Increased
High
Very high
1.4
6.8
8.2
1.2
8.5
9.8
0.7
2.1
12.9
15.7
1.7
15.6
17.3
0.8
22.5
23.3
0.9
26.2
27.2
2.2
20.0
22.2
0.1
1.5
15.5
17.1
Obesity II
Low WC
High WC
Very high WC
All obese II
Very high
Very high
Very high
Very high
0.3
8.2
8.5
7.3
7.3
7.1
7.1
8.6
8.6
9.9
9.9
6.0
6.0
6.3
6.3
0.0
7.8
7.8
Obesity III
Low WC
High WC
Very high WC
All obese III
Extremely high
Extremely high
Extremely high
Extremely high
1.4
1.4
3.2
3.2
3.0
3.0
5.1
5.1
3.8
3.8
5.0
5.0
1.8
1.8
3.4
3.4
Not applicable
No increased
Increased
High
Very high
Extremely high
6.0
59.7
6.9
10.7
15.4
1.4
2.4
50.1
17.1
11.4
15.9
3.2
0.6
40.6
17.6
18.2
20.0
3.0
1.3
34.1
16.2
19.2
24.2
5.1
0.4
25.2
13.3
25.0
32.3
3.8
0.9
23.9
14.7
23.3
32.2
5.0
0.6
30.2
14.5
26.5
26.3
1.8
1.7
38.3
14.6
18.7
23.3
3.4
27.5
16.8
30.4
19.1
41.2
23.0
48.5
29.3
61.2
36.1
60.6
37.2
54.6 45.4
28.1 26.7
Continued…
Women – Overall
d
risk
High/very high/extremely high risk
Very/extremely high risk
216
Table 7.5
- Continued
Aged 16 and over with valid height, weight and waist measurements
b
Waist circumference Health risk
and BMI
categoryd
c
classification
a
2008-2011 combined
Age
Total
16-24 25-34 35-44 45-54 55-64 65-74
75+
Bases (weighted):
Men
286
309
337
338
289
194
124 1877
Women
268
291
357
357
290
228
165 1957
Bases (unweighted):
Men
125
188
288
316
333
278
164 1692
Women
172
265
393
413
383
313
185 2124
a Percentages and bases in this table are based on those who have a valid measurement for waist
circumference, in addition to valid measurements of height and weight.
b Waist circumference categories according to WHO/SIGN guidelines (115): low: <94cm for men and
<80cm for women; high: ≥94cm and <102cm for men, ≥80cm and <88cm for women; very high:
≥102cm for men and ≥88cm for women.
2
c BMI categories according to WHO guidelines: Underweight: Less than 18.5kg/m , Normal: 18.5 to
2
2
less than 25kg/m , Overweight: 25 to less than 30kg/m , Obesity I: 30 to less than 35kg/m 2, Obesity
II: 35 to less than 40kg/m 2, Obesity III: 40kg/m 2 or more.
d Health risk category according to SIGN guidelines (115).
217
Table 7.6
Health risk category, 2008-2011 combined (age-standardised), by NS-SEC of
household reference person and sex
Aged 16 and over with valid height, weight and waist measurements
Health risk categorya
2008-2011 combined
NS-SEC of household reference person
Managerial Intermediate
Small
&
employers &
own account
professional
workers
Lower Semi-routine
supervisory
& routine
& technical
%
%
%
%
%
Not applicable
No increased
Increased
High
Very high
Extremely high
2.3
44.6
20.5
11.0
20.9
0.8
41.3
17.8
16.7
23.1
1.1
0.3
42.3
22.1
13.9
19.1
2.3
1.6
51.8
13.9
10.2
18.9
3.6
1.4
44.5
17.6
12.4
22.4
1.7
High/very high/extremely high risk
Very/extremely high risk
32.6
21.7
40.9
24.2
35.3
21.4
32.6
22.4
36.5
24.1
Not applicable
No increased
Increased
High
Very high
Extremely high
1.8
43.7
13.5
18.1
20.7
2.3
1.6
32.6
19.0
16.1
24.6
6.2
2.9
41.8
13.0
19.5
19.1
3.7
2.0
34.9
16.3
15.2
28.0
3.6
1.8
32.6
13.5
21.2
26.4
4.5
High/very high/extremely high risk
Very/extremely high risk
41.0
22.9
46.8
30.8
42.4
22.8
46.9
31.6
52.1
30.9
Men
Women
Bases (weighted):
Men
798
143
170
229
494
Women
803
191
153
196
569
Bases (unweighted):
Men
710
119
159
216
458
Women
870
209
172
218
607
a Health risk category according to SIGN guidelines (115). See Table 7.5 for full details of the categories.
218
Table 7.7
Health risk category, 2008-2011 combined (age-standardised), by
equivalised household income quintile and sex
Aged 16 and over with valid height, weight and waist measurements
Health risk categorya
2008-2011 combined
Equivalised annual household income quintile
1st
(highest)
nd
2
3
4
th
5th
(lowest)
rd
%
%
%
%
%
Not applicable
No increased
Increased
High
Very high
Extremely high
1.3
46.3
20.7
10.0
21.3
0.5
2.6
42.5
19.0
13.3
21.1
1.5
53.8
16.9
8.9
18.8
1.6
0.1
36.3
21.0
15.0
25.3
2.4
2.3
48.2
12.7
12.5
22.4
1.9
High/very high/extremely high risk
Very/extremely high risk
31.7
21.8
35.9
22.6
29.3
20.4
42.7
27.7
36.7
24.3
Not applicable
No increased
Increased
High
Very high
Extremely high
1.0
44.1
14.4
18.2
20.8
1.6
1.6
39.9
14.9
17.9
21.5
4.2
3.1
37.9
15.3
18.1
23.5
2.1
1.2
34.2
11.9
17.2
31.2
4.4
2.0
36.5
12.8
20.2
24.1
4.5
High/very high/extremely high risk
Very/extremely high risk
40.6
22.3
43.6
25.7
43.7
25.6
52.7
35.6
48.8
28.6
Men
Women
Bases (weighted):
Men
471
376
360
266
Women
404
350
343
339
Bases (unweighted):
Men
405
341
321
269
Women
433
397
378
373
a Health risk category according to SIGN guidelines (115). See Table 7.5 for full details of the
categories.
219
227
301
214
320
Table 7.8
Health risk category, 2008-2011 combined (age-standardised), by Scottish
Index of Multiple Deprivation and sex
Aged 16 and over with valid height, weight and waist measurements
Health risk categorya
2008-2011 combined
Scottish Index of Multiple Deprivation quintile
th
5
(least
deprived)
th
rd
st
nd
1
(most
deprived)
85%
15%
least
most
deprived deprived
4
3
%
%
%
%
%
%
%
Not applicable
No increased
Increased
High
Very high
Extremely high
0.6
49.1
19.3
13.2
17.6
0.3
0.2
44.9
19.7
12.5
22.1
0.6
2.2
46.0
20.2
12.0
19.0
0.6
2.7
44.7
17.9
10.7
20.6
3.4
1.5
46.6
13.1
11.5
24.9
2.5
1.3
46.1
19.0
12.1
20.4
1.2
1.7
47.5
13.3
11.9
23.5
2.2
High/very high/extremely high risk
Very/extremely high risk
31.0
17.9
35.3
22.7
31.6
19.6
34.7
24.0
38.8
27.3
33.7
21.6
37.5
25.7
Not applicable
No increased
Increased
High
Very high
Extremely high
2.9
45.3
15.2
18.9
16.6
1.1
0.4
39.6
14.6
21.4
21.7
2.4
1.1
41.8
15.6
16.4
22.0
3.1
2.1
34.9
13.1
17.9
25.6
6.5
2.1
29.8
13.9
18.8
30.7
4.9
1.8
40.0
14.5
18.6
21.8
3.3
1.4
29.9
14.4
19.9
29.9
4.5
High/very high/extremely high risk
Very/extremely high risk
36.6
17.7
45.4
24.0
41.4
25.0
50.0
32.0
54.3
35.6
43.7
25.1
54.4
34.4
346
397
1607
1648
271
312
Men
Women
2
SIMD 85/15
Bases (weighted):
Men
385
446
359
339
Women
407
408
390
353
Bases (unweighted):
Men
347
417
341
291
Women
451
474
434
376
a Health risk category according to SIGN guidelines (115). See Table 7.5 for full
220
296
1470
222
389
1821
303
details of the categories.
Table 7.9
Estimated odds ratios for high (or greater)a disease risk, 2008-2011
combined, by associated risk factors and sex
Aged 16 and over with valid height, weight and waist measurements
Independent variables
Men
Base
(weighted)
1877
Age
16-24
25-34
35-44
45-54
55-64
65-74
75+
Scottish Index of Multiple
Deprivation quintile
1st (least deprived)
2nd
3rd
4th
5th (most deprived)
Highest education
qualification
Degree or higher
HNC/D or equiv
Higher grade or equiv
Standard grade or equiv
Other school level
No qualifications/missing
information
Economic status
In education
In paid employment, selfemployed or on gov't
training/doing something else
Permanently unable to
work/Looking for/intending to
look for paid work
Retired/Looking after
home/family
Parental NS-SEC
Managerial & professional
Intermediate
Small employers & own
account workers
Lower supervisory & technical
Semi-routine & routine
Not applicable
2008-2011 combined
286
309
337
338
289
194
124
Odds ratio
(p<0.001)
1.00
0.46
1.12
1.35
1.86
1.64
1.65
95% CI
b
0.21, 1.04
0.52, 2.42
0.62, 2.98
0.85, 4.04
0.67, 4.02
0.63, 4.29
Women
Base
(weighted)
1957
268
291
357
357
290
228
165
(p=0.326)
382
446
359
343
346
1.00
1.18
0.91
1.21
1.32
155
1164
196
362
514
140
161
253
485
324
1.00
1.36
0.85
1.37
1.52
0.82, 1.68
0.62, 1.34
0.80, 1.83
0.85, 2.04
0.88, 2.11
0.54, 1.35
0.89, 2.10
0.94, 2.48
0.03,0.39
1.00
406
407
390
355
398
0.77 0.50, 1.20
(p=0.820)
1.00
0.89 0.55, 1.42
221
545
212
318
356
146
379
139
1059
103
1.05 0.67, 1.63
0.92
1.00
0.85
0.72
(p<0.001)
1.00
0.97
1.46
1.78
3.06
2.87
2.10
0.56, 1.68
0.85, 2.53
1.03, 3.07
1.69, 5.55
1.48, 5.56
1.02, 4.32
1.00
1.43
1.18
1.74
1.93
1.05, 1.95
0.86, 1.63
1.24, 2.45
1.34, 2.79
(p=0.442)
1.64 1.10, 2.46
(p=0.005)
0.10
95% CI
(p=0.002)
(p=0.038)
532
225
322
374
108
316
b
Odds ratio
0.59, 1.43
0.69, 1.45
0.60, 1.19
0.42, 1.24
656
486
152
188
265
579
287
1.00
1.07
1.17
1.15
1.43
0.74, 1.56
0.84, 1.64
0.84, 1.59
0.94, 2.17
0.96 0.70, 1.33
(p=0.018)
0.56 0.29, 1.07
1.00
0.96 0.56, 1.67
0.66 0.49, 0.90
(p=0.078)
0.73 0.49, 1.10
1.21 0.82, 1.78
1.10 0.79, 1.53
1.34 1.01, 1.76
1.03 0.70, 1.52
Continued…
Table 7.9
- Continued
Aged 16 and over with valid height, weight and waist measurements
Independent variables
Men
Base
(weighted)
1877
Cigarette smoking status
Never smoked cigarettes at all
Used to smoke cigarettes
occasionally
Used to smoke cigarettes
regularly
Current cigarette smoker
Physical activity levels
Highc
Medium
Low
Marital status
Married/civil partnership
Living as married
Single
Married/civil partnership –
separated/ Divorced/dissolved
civil partnership
Widowed/surviving civil partner
Self-assessed health
Very good/good
Fair
Bad/very bad
2008-2011 combined
932
80
409
Odds ratio
95% CIb
(p=0.121)
1.00
0.83 0.45, 1.53
456
1.01 0.76, 1.35
0.66 0.46, 0.96
847
522
508
(p<0.001)
1.00
1.89 1.40, 2.55
2.41 1.72, 3.36
968
225
506
112
(p=0.005)
1.00
0.84 0.54, 1.30
0.63 0.41, 0.96
Women
Base
(weighted)
1957
978
107
393
Odds ratio
95% CIb
(p=0.016)
1.00
0.69 0.43, 1.10
479
1.24 0.97, 1.59
0.81 0.61, 1.07
667
675
615
(p<0.001)
1.00
1.72 1.35, 2.20
2.56 1.96, 3.34
954
223
410
180
(p=0.348)
1.00
0.92 0.64, 1.33
0.77 0.54, 1.10
65
0.52 0.35, 0.79
0.54 0.31, 0.93
189
0.78 0.56, 1.07
0.82 0.58, 1.18
1463
308
106
(p=0.027)
1.00
1.61 1.14, 2.29
1.33 0.79, 2.25
1530
300
126
(p=0.590)
1.00
1.15 0.84, 1.56
1.22 0.76, 1.97
Longstanding illness
(p=0.749)
(p=0.036)
Limiting longstanding illness
418
1.00
529
1.00
Non limiting longstanding
319
308
illness
1.16 0.79, 1.68
1.22 0.88, 1.69
No longstanding illness
1140
1.08 0.77, 1.52
1119
0.85 0.64, 1.14
a High (or greater) is composed of those classified as at ‘high’, ‘very high’ or ‘extremely high’ risk
according to the disease risk classification system endorsed in the SIGN guidelines on obesity
management (SIGN 115).
b Confidence interval.
c High= 30 minutes or more on at least 5 days a week (this group represents those who meet the current
physical activity recommendations); Medium= 30 minutes or more on 1 to 4 days a week; Low= fewer
than 30 minutes of moderate or vigorous activity a week.
222
Cardiovascular disease,
diabetes and hypertension
Chapter 8
8 CARDIOVASCULAR DISEASE, DIABETES AND HYPERTENSION
Catherine Bromley and Jennifer Mindell
SUMMARY
In 2011, 15.6% of men and 13.8% of women had cardiovascular disease
(CVD).
CVD or diabetes prevalence was also higher for men than for women (19.2%
and 17.0%, respectively) in 2011 and increased markedly with age for both
sexes from 6.3% of men and 7.0% of women under 25 to 57.0% of men and
43.4% of women aged 75 and over.
Rates of ischaemic heart disease (IHD) for men and women were 7.5% and
4.9% respectively, while 9.4% of men and 6.7% of women had IHD or stroke.
Prevalence of these conditions also increased with age for both men and
women.
Between 1995 and 2011 there was a significant increase in the proportion of
men aged 16-64 with CVD or diabetes (from 9.4% to 12.7%). This was largely
accounted for by an increase in the prevalence of diabetes. There was no
clear trend in the figures for women over this same period.
In 2011, 6.1% of men and 4.9% of women aged 16 and over had doctor
diagnosed diabetes.
2.4% of adults (2.6% of men and 2.1% of women) had a glycated haemoglobin
level consistent with undiagnosed diabetes (HbA1C>=6.5%) in the 2008-2011
period-an increase from 1.1% in 2003.
In 2010/2011, a third of men (33%) and women (32%) aged 16 and over had
hypertension.
Hypertension rates increased significantly by age for men and women.
In 2010/2011, almost one in five (18.5%) men and one in six (15.7%) women
had untreated hypertension.
Between 1995 and 2008-2011 mean total cholesterol in men aged 16-64
declined from 5.6 to 5.2 mmol/l. The equivalent figures for women were
5.6mmol/l and 5.3 mmol/l. Most of this decline occurred between 1995 and
1998. As these figures include people taking lipid lowering drugs such as
statins it is likely that the decline is almost entirely due to the increased use of
such drugs.
There was no change in mean HDL cholesterol of adults between 2003 and
2008-2011. Levels were lower in men than in women (mean of 1.3 mmol/l
compared with 1.6mmol/l).
There was an increase in mean fibrinogen levels for 16-74 year olds between
1998 and 2008-2011 (from 2.6g/l to 2.9g/l in men, and from 2.8g/l to 3.1g/l in
women). The figure for all adults from 2003 onwards has been more stable.
There was no significant difference in the fibrinogen levels of men and women
in 2008-2011, but levels did increase by age for both sexes.
Women had higher mean C-reactive protein (CRP) levels than men (3.4 mg/l
compared with 2.9mg/l) in 2008-2011 and levels for both sexes generally
increased with age.
The mean CRP for men aged 16-74 has not varied significantly since 1998,
but there was an increase in the proportion of men in the bottom two CRP
quintiles between 1998 and 2008-2011 (from 20.7% to 27.0%). For women the
224
mean declined (from 3.8mg/l in 2003 to 3.3mg/l in 2008-2011) but there were
no notable changes in the proportions in each quintile group over this period.
8.1
INTRODUCTION
This chapter covers three related topics: cardiovascular disease (CVD),
diabetes and hypertension. In addition, it presents results for a number of blood
analytes measured in the Scottish Health Survey (SHeS) that can be used to
assess diabetes status and CVD risk. As in the three most recent SHeS reports,
the combined prevalence of CVD and diabetes is also reported, reflecting the
status of these two conditions as major health burdens for individuals and the
NHS.1,2,3 Additionally, people with diabetes are at particularly high risk for CVD,
hence the inclusion of estimates of the burden of probable undiagnosed
diabetes in the population.
CVD is one of the leading contributors to the global disease burden. Its main
components are ischaemic heart disease (IHD) and stroke. In this chapter, the
term IHD is used interchangeably with CHD (coronary heart disease). IHD is the
second most common cause of death in Scotland after cancer; in 2011, 14% of
deaths were attributed to it and a further 9% were caused by stroke.4
Prevalence of CVD is higher in lower social classes and in deprived areas.5 A
number of the Scottish Government’s National Performance Framework (NPF)
national indicators6 are linked to key CVD risk factors (such as the smoking,7
physical activity8 and obesity9 indicators described in chapters 4, 6 and 7
respectively). In addition, the revised NPF, published in December 2011,10 now
includes a target to reduce premature mortality (deaths from all causes in those
aged under 75).11 CVD is described as one of the key ‘big killer’ diseases
around which action must be taken if the target is to be met.
NHS Scotland’s HEAT12 performance management system is based around a
series of targets against which the performance of its individual Health Boards
are measured. In 2007, the Scottish Government published Better Health,
Better Care,13 outlining its action plan for improving health and health care in
Scotland. This set out how NHS Scotland’s HEAT 12 system would feed into the
Government’s overarching objectives. As reported in last year’s SHeS report,3 a
HEAT target to achieve 23,579 inequalities-targeted cardiovascular Health
Checks during 2010/11 was far exceeded via the delivery of 41,107 checks.14
The target for 2011/12 was for 26,682 checks to be carried out. This too was
exceeded with 47,776 checks carried out in the year ending March 2012.
There are also HEAT targets addressing primary care of people with acute and
chronic conditions. For example, the quality of acute care in the immediate
aftermath of a stroke is an important factor in people’s recovery rate and
subsequent quality of life. A HEAT target exists to improve performance in this
area: by March 2013, 90% of patients admitted with a stroke should be admitted
to a specialist stroke unit within one day of admission.15 In 2011, 78% of stroke
patients were admitted to a specialist stroke unit within one day of their
admission, up from 67% in 2010 and 61% in 2009.
The introductions to the equivalent chapters in the 2008, 2009 and 2010 SHeS
reports1,2,3 outlined the recent policy context for this topic in more detail,
225
covering a number of strategies and initiatives that have been introduced by the
Scottish Government and NHS Scotland to help reduce the prevalence of these
conditions and improve their management in primary care. These included:
The Scottish Government’s Better Heart Disease and Stroke Care Action
Plan,16 launched in June 2009, which built on the Coronary Heart
Disease and Stroke Strategy for Scotland published in 2002, and
updated in 2004.17
The Quality and Outcomes Framework 18 and initiatives such as the Keep
Well programme.19
The SIGN Guidelines on cardiovascular health 20 published in 2007,
which include a risk assessment tool (ASSIGN) to calculate a person’s
future risk of cardiovascular disease.
The revised SIGN guidelines on diabetes21 published in March 2010.
The revised Diabetes Action Plan, published in August 2010.22
The roll-out of the “Life begins at 40” programme which invites all those
turning 40 to participate in a health assessment delivered by NHS 24 via
telephone or online.23
This chapter takes advantage of the nurse data collected throughout the 20082011 period and reports on the direct measures of blood pressure and a
number of blood analytes that act as useful biomarkers of diabetes status and
CVD risk. As only a sub-sample of participants were invited to have a nurse
interview between 2008 and 2011, results based on the nurse data use either
two or four years of nurse data combined.
This is the first time since the 2003 SHeS report that many of these blood
analytes have been reported in detail.26 From 2012 the survey is no longer
including a nurse visit and instead a sub-sample of adults will be asked to
complete a new biomeasures module, conducted by specially trained
interviewers. The use of dried blood spot samples, collected via finger-pricks, is
currently under investigation (as opposed to the venous blood samples
collected until the end of 2011). As yet, no decision has been taken about their
use, and it is also conceivable that venous samples could be collected again in
future, should funding become available. In contrast, interviewers began taking
blood pressure readings in 2012, using the same equipment and measurement
protocols that the nurses used. A validation study has been conducted to
assess the impact on the time series data of the change in personnel for
measuring blood pressure.24 Future SHeS reports will discuss the implications
in full.
8.2
METHODS AND DEFINITIONS
8.2.1
Methods
CVD conditions
Participants were asked whether they suffered from any of the following
conditions: angina, heart attack, stroke, heart murmur, irregular heart
rhythm, ‘other heart trouble’, and (if they responded affirmatively)
whether they had ever been told they had the condition by a doctor. For
226
the purpose of this report, participants were classified as having a
particular condition only if they reported that the diagnosis was
confirmed by a doctor. Those participants who reported having a
particular condition were also asked if they had had it in the last 12
months.
Diabetes
Participants were asked whether they suffered from diabetes and, if so,
whether they had ever been told they had the condition by a doctor.
Only those who reported that the diagnosis was confirmed by a doctor
were classified as having diabetes. Women whose diabetes occurred
only during pregnancy were excluded from the classification. No
distinction was made between type 1 and type 2 diabetes in the
interview. In some previous SHeS reports, rates for each type were
estimated by examining the age of onset of the condition and whether a
participant was on insulin therapy at the time of interview.25 However,
with increasing rates of type 2 diabetes in younger age groups, and
increasing use of insulin to treat it, this classification method is no
longer considered appropriate.
Hypertension
There have been significant changes to both the definition and
measurement of blood pressure since the survey began in 1995. These
were discussed in detail in the 2003 survey report and are not repeated
here.26
The 2008 to 2011 surveys used the same measurement equipment (the
Omron HEM 907) as in 2003. The protocol for the measurement of
blood pressure in adults remained the same as in all previous years;
blood pressure was measured in participants aged 16 and over who
took part in the nurse interview. Three blood pressure readings were
taken at one minute intervals, on the right arm where possible, with the
participant in a seated position, after a five minute rest. Blood pressure
of pregnant women was not measured. The detailed protocol for blood
pressure measurement is contained in Volume 3 of this report.
The blood pressure levels reported in this chapter are derived from the
means of the second and third measurements obtained and are
restricted to those participants who had not eaten, drunk alcohol,
smoked or exercised in the 30 minutes before the measurement and for
whom three readings were successfully obtained.
Blood samples
The table below shows the numbers of men and women from whom a
non-fasting blood sample was obtained in each of the 2008 to 2011
surveys. Pregnant women, anyone with a history of fitting or
convulsions, and those taking anti-coagulant medicines (such as
warfarin) were excluded from giving a blood sample. Further exclusions
(due to problems in the laboratory or the use of prescription medication
227
that interferes with the analyte) further reduce the sample sizes
available for analysis.
Blood samples obtained, 2008-2011
2008
2009
Men
415
387
Women
488
498
All aged 16+
903
885
2010
372
471
843
2011
333
392
725
Full details of the response to the blood samples in 2008 and 2009
were published in the 2009 technical report,27 and in the respective
technical reports for the 201028 and 2011 surveys (Volume 3 of this
report).
Although blood samples have been collected since the survey began in
1995, changes over the years to the laboratory, the analysis methods
used, or the analytes tested for, mean that trends do not necessarily
start in 1995.
8.2.2
Summary measures of cardiovascular disease and diabetes
Any CVD condition / Any CVD condition or diabetes
Participants were classified as having any CVD condition if they
reported ever having any of the following conditions confirmed by a
doctor: angina, heart attack, stroke, heart murmur, abnormal heart
rhythm, or ‘other heart trouble’.29 A second category that includes
diabetes as well as the above CVD conditions is also presented in the
tables as ‘any CVD condition or diabetes’ so that the total combined
prevalence of these conditions can be seen. The trend table reports the
prevalence of any CVD, and any CVD or diabetes from 1995 onwards.
Ischaemic heart disease
Participants were classified as having IHD if they reported ever having
angina or a heart attack, confirmed by a doctor.
Ischaemic heart disease or stoke
Participants were classified as having IHD or stroke if they reported
ever having angina, or a heart attack, or a stroke, confirmed by a
doctor.
8.2.3
Classification of blood pressure levels
Blood pressure has a normal distribution within a population and
thresholds to indicate the point at which someone has a level that is
definitely clinically significant do not exist. The most recent NICE
guidelines (developed jointly with the British Hypertension Society) cite
evidence suggesting that with each 2mmHg increase in systolic blood
pressure, risk of mortality from IHD increases by 7% and by 10% for
stroke.30 Those guidelines recommend that antihypertensive therapy
should be initiated in people with sustained clinic levels of systolic blood
pressure (SBP) >160 mmHg or diastolic blood pressure (DBP) >100
228
mmHg. They also recommend that treatment should be initiated for
people aged below 80 (who have CVD, diabetes, other target organ
damage (e.g. kidney), or an estimated CVD risk ≥ 20% over 10 years)
and who have sustained clinic levels of SBP between 140 and 159
mmHg and/or DBP between 90 and 99 mmHg. The guidance also
advocates the use of ambulatory blood pressure monitoring, or home
blood pressure monitoring before making the diagnosis. The most
recent guidance from SIGN concurs with the guidance for treating those
with existing or high risk of CVD,31 while separate SIGN guidance
recommends the use of antihypertensive medication for people with a
previous stroke or transient ischaemic attack (TIA, like a stroke but
lasting less than 24 hours) regardless of BP level. 32
These guidelines are not universally accepted. 33 For example, the
United States uses guidelines that are more restrictive so that 140/90
mmHg (irrespective of risk factor) is considered the threshold for
treatment and target to achieve.34 In 2003 the European Society of
Hypertension and the European Society of Cardiology jointly
recommended a threshold of 140/90 mmHg for those without diabetes
and 130/80 mmHg for those with diabetes.35
This report continues to use the blood pressure definition that was
introduced in the 1998 SHeS (140/90 mmHg), in accordance with the
1999 British Hypertension Society guidelines.36
Based on their systolic (SBP) and diastolic (DBP) blood pressure and
current use of anti-hypertensive medications, adult participants were
classified into one of four groups as follows:
Normotensive
SBP<140 mmHg and DBP<90 mmHg, not
currently taking any drug specifically prescribed
to treat high blood pressure
Hypertensive
controlled
SBP<140 mmHg and DBP<90 mmHg, currently
taking a drug specifically prescribed to treat high
blood pressure
Hypertensive
uncontrolled
SBP 140 mmHg or DBP 90 mmHg, currently
taking a drug specifically prescribed to treat high
blood pressure
Hypertensive
untreated
SBP 140 mmHg or DBP 90 mmHg, not
currently taking a drug specifically prescribed to
treat high blood pressure
For the purpose of this report, the term ‘hypertensive’ is applied to those
in the last three categories.
229
8.2.4
Blood analytes
Glycated haemoglobin
Glycated haemoglobin (HbA1C) reflects the level of glucose in the blood
over the preceding two to three months, and is therefore a better
indicator of diabetic control than a random glucose sample, which is
affected by recent food or drink intake. Elevated glycated haemoglobin
in people without diabetes is associated with increased mortality
following acute myocardial infarction.37 Elevated levels are seen in
people with undiagnosed diabetes. In June 2009, an international
expert committee recommended using levels of 6.5% or more to
diagnose diabetes.38 Levels of 5.7% or more have been proposed as a
screening test for diabetes.39 The UK National Screening Committee is
due to review its policy on diabetes screening in 2012/13.
The latest SIGN guidelines for diabetes set <7% as the HbA1C target for
good glycaemic control in people with diabetes, 21 consistent with
indicator DM 23 within the Quality and Outcomes Framework (QOF) for
2009/2010. DM 23, which replaces DM 20, gives GPs the target of 4050% of their diabetic patients having HbA1C <7%, a reduction from
<7.5% within DM 20.40,41 The Task Force on Diabetes and
Cardiovascular Diseases of the European Society of Cardiology (ESC)
and of the European Association for the Study of Diabetes (EASD)
recommends that HbA1C be kept <6.5% to reduce cardiovascular risk.42
For the purpose of this survey, a glycated haemoglobin value of 6.5% or
above in people with no existing diabetes diagnosis was taken to
indicate possible undiagnosed diabetes. The sample size for people
with a diabetes diagnosis was too small to assess whether their
condition is being adequately controlled so the chapter only looks at
people with no such diagnosis.
HbA1C figures for participants with no self-reported diagnosis of
diabetes are presented for 2003 and 2008-2011 combined.
Total cholesterol
Prospective studies have identified an increased risk of coronary
disease associated with raised cholesterol concentration. A metaanalysis of all randomised trials of more than two years duration
showed that lowering serum cholesterol confers clinical benefit as
expressed in lower CHD mortality and total mortality risk, with the
magnitude of benefit directly related to the degree of cholesterol
reduction.43 Lipid-lowering drugs (statins) are effective in primary
prevention44 as well as in people with established disease, and also
reduce the risk of stroke.45
For the purpose of this survey, cholesterol was considered to be raised
at a level of 5.0 mmol/l or over. In 2000, the National Service
Framework for Coronary Heart Disease suggested a total cholesterol
target below 5.0 mmol/l for all patients with arterial heart disease or
significant cardiovascular risk.46 The QOF target for GPs relates to the
percentage of patients with coronary heart disease whose total
230
cholesterol is 5.0 mmol/l or below.47 In 2005, the recommendations for
defining and treating hypercholesterolaemia were superseded by the
second guidance from the Joint British Societies, JBS2.48 European
guidance is based on assessing cardiovascular risk, using the SCORE
tool,49 while in Scotland the ASSIGN risk assessment tool has been
developed to take better account of the risks associated with social
deprivation and family history of CVD.31 SIGN guidance advises the use
of statins in people with pre-existing cardiovascular disease, diabetes,
or estimated 10-year CVD risk of 20% or above, regardless of
cholesterol level, or in those with total cholesterol of 8.0mmol/l or
above.20,31,32 The Scottish Government’s 2009 Better Heart Disease
and Stroke Care Action Plan also covers Familial
Hypercholesterolaemia, a genetic condition in which affected people
have very high cholesterol levels and high risk of premature
cardiovascular disease.16
Total cholesterol figures, which include participants who were taking
lipid-lowering drugs, are presented for 1995, 1998, 2003, and 20082011 combined.50
High-density lipoprotein cholesterol
Studies have shown that high-density lipoprotein cholesterol (HDLcholesterol) is inversely and independently associated with the risk of
developing CHD.51,52 Furthermore, low levels of HDL-cholesterol are
associated with a worse prognosis after myocardial infarction.53
Protection against CVD by HDL-cholesterol is conferred in at least two
ways. The first is that it transports cholesterol back from organs such as
arteries to the liver for elimination, thus protecting the arteries from
further atheromatous plaque formation. The second is by acting as an
antioxidant. Increasing physical activity, drinking alcohol,54 quitting
cigarette smoking and losing weight can elevate HDL-cholesterol.
Attention is generally recommended for HDL-cholesterol concentrations
<1 mmol/l. HDL-cholesterol levels are generally higher in women than
men.
Total: HDL cholesterol ratio
Total cholesterol has been criticised as a measure because it can be
raised when the (beneficial) HDL fraction is high. LDL- (low density
lipoprotein) cholesterol, the component that is directly associated with
increased atherosclerosis (hardening of the arteries), is harder to
measure and is generally considered to require fasting blood samples.
Although LDL-cholesterol levels can be estimated by calculating ‘nonHDL-cholesterol’, and numerous other lipid-related measures have
been suggested, the measure found to be most highly associated with
CVD outcomes is the ratio of total to HDL-cholesterol,55 which is better
than either total or HDL-cholesterol alone for predicting IHD.56
Canadian guidelines recommend treatment with statins for low risk
individuals with a total: HDL cholesterol ratio above 6.0, and for
individuals at moderate CVD risk (10 year CVD risk of 10-19%) with a
ratio above 5.0.57 An American study found that secondary prevention
231
targets in high risk individuals can be monitored using this ratio, aiming
at levels below 3.0.58 However, no country within the UK routinely uses
total: HDL-cholesterol ratio in its lipid-lowering guidance.
HDL-cholesterol and total: HDL cholesterol ratio figures and are
presented for 2003 and for 2008-2011 combined. The figures presented
include participants who were taking lipid-lowering drugs.
C-reactive protein
C-reactive protein (CRP) is an acute-phase reactant which is
synthesised in the liver in response to the pro-inflammatory protein
interleukin 6 (IL-6). It is therefore a sensitive marker of inflammation.
Levels of these acute phase proteins have been related to risk of
coronary heart disease (CHD). Elevated levels of CRP are associated
with increased risk of myocardial infarction (MI) or sudden death among
those with stable and unstable angina pectoris, 59 as well as with
coronary heart disease in the elderly and coronary mortality among
high-risk patients. The follow-up of the Multiple Risk Factor Intervention
Trial (MRFIT) has documented a strong relationship between levels of
CRP and subsequent risk of CHD deaths among cigarette smokers. 60
However, it is more likely that these associations are due to
confounding, with CRP unlikely to be causally related to CHD. 61,62
Although an American study raised the possibility that assessment of
CRP may also provide a method of determining risk of future MI among
apparently low-risk individuals, including non-smokers,63 a review in 31
studies found that CRP was generally no more effective than the
classical Framingham score in predicting CHD.64 In the US, the first set
of guidelines endorsing use of high-specificity CRP (hsCRP) in risk
factor screening for CVD were produced in 2003,65 but CRP is not
currently included in screening in the UK,48 nor is there a recommended
CRP threshold in the UK.
CRP figures are presented for 1998, 2003 and 2008-2011 combined.
Fibrinogen
Fibrinogen is a major blood glycoprotein that plays an essential role in
haemostasis (coagulation) and the maintenance of blood viscosity. High
fibrinogen is a cardiovascular risk factor, being important in the cascade
leading to thrombotic events. Epidemiological observations indicate that
high plasma fibrinogen levels are strongly correlated with the incidence
of two major thrombotic complications of atherosclerosis: stroke and
myocardial infarction. The Scottish Heart Health Study confirmed that
plasma fibrinogen is not only a risk factor for coronary heart disease
and stroke, but is also raised with family history of premature heart
disease and with personal history of hypertension, diabetes, and
presence of intermittent claudication.66 Fibrinogen levels are higher in
more deprived groups (even among non-smokers)67 and in smokers,68
and levels fall after quitting smoking.68 This may explain part of the
excess CVD risk among smokers and those in lower socio-economic
232
groups. However, fibrinogen is not used clinically for individual patients
in determining cardiovascular risk.
Fibrinogen figures are presented for 1998, 2003 and 2008-2011
combined. As per the convention in all previous SHeS reports, and in
contrast to the cholesterol measures, the fibrinogen figures exclude
participants who were taking prescription medications that would affect
fibrinogen levels (lipid lowering drugs and beta blockers).
8.3
PREVALENCE OF CARDIOVASCULAR CONDITIONS AND DIABETES
This section examines trends in the prevalence of: any CVD, any CVD or
diabetes, IHD, stroke, and IHD or stroke from 1995 onwards. Changes to the
sample composition over the first three years of the survey mean that
discussion of the trend between 1995 and 2011 is based on those aged 16-64,
while the trend for all adults aged 16 and over from 2003 onwards is also
included.
8.3.1
Any CVD, and CVD or diabetes, IHD, stroke and IHD and stroke by
age and sex, 2011
Figures for the prevalence of any CVD, any CVD or diabetes, IHD,
stroke, IHD and stroke in 2011 are presented in Table 8.1 and
summarised below. Rates were higher for men than women with
particularly pronounced differences for IHD and IHD or stroke rates.
The proportion of adults with these conditions increased markedly with
age. For example, fewer than one in ten men or women under 45 had
any CVD conditions or diabetes, whereas 57.0% of men and 43.4% of
women aged 75 and over had at least one of these conditions.
Table 8.1
8.3.2
Stroke
IHD
IHD or
stroke
Any
CVD
Any CVD
or
diabetes
Men (%)
2.9
7.5
9.4
15.6
19.2
Women (%)
2.7
4.9
6.7
13.8
17.0
Trends in any CVD, and CVD or diabetes since 1995
The prevalence of any CVD in men aged 16-64 was 8.4% in 1995,
8.1% in 1998 and then increased significantly to 9.7% in 2003. The
figure in 2011, 9.8%, was similar to that reported in the three previous
survey years (9.5% to 10.5%) which suggests that prevalence has been
fairly static since 2003. Prevalence of any CVD in women aged 16-64
has shown small fluctuations over time but with no obvious pattern; the
2011 figure (8.4%) was very similar to that in 1998 (8.5%).
Until 2010, the prevalence of CVD or diabetes among men aged 16-64
increased by a small amount each year (from 9.4% in 1995 to 13.6% in
233
2010). The 2011 and 2009 figures were identical (12.7%). As noted in
previous reports, the overall upward trend in any CVD or diabetes is
largely accounted for by increasing levels of diabetes over time (rather
than increased rates of CVD conditions). However, it is not possible to
establish whether this trend represents an overall increase in the
incidence of CVD and/or diabetes among men and/or improved
diagnostic or survival rates for these conditions.
In contrast, the level of any CVD or diabetes among women has not
followed such a consistent pattern. The rate fluctuated between 9.6%
and 10.2% in the three earliest surveys, peaked in 2008 (12.8%), and
has sat at around 11% since then (11.2%-10.8%).
Table 8.1
8.3.3
Trends in IHD, stroke, and IHD or stroke since 1995
The proportion of men aged 16-64 with IHD has been similar across the
survey years (ranging between 3.2% and 4.1%) with no significant
trend. However, there has been a decrease in IHD prevalence among
particular age groups of men: there was a seven percentage point drop
in IHD among those aged 55-64 between 1995 and 2011, and a four
point decline for those aged 65-74 between 1998 and 2011. This may
well contribute to declining rates of IHD in the future (assuming that IHD
onset has been avoided rather than just delayed for these cohorts of
men).
The prevalence of stroke among men has also been fairly static: it
ranged from 0.7% and 1.2% between 1995 and 2009, was somewhat
higher in 2010 (1.8%), but was lower again in 2011 at 1.3%. The
combined prevalence of IHD or stroke in men has remained relatively
unchanged across the survey years (4.2%-5.0%).
For women aged 16-64, there was a slight decrease in IHD prevalence
between 1995 (2.9%) and 2008 (2.2%), with little change since then
(1.9% in 2009, 2.2% in 2010 and 1.8% in 2011). As was for the case for
men, those aged 55-64 and 65-74 saw larger decreases in IHD
prevalence than any other age group. The most recent figures for stroke
prevalence for women (0.9%-1.2%) have all been a little higher than in
the 1995-2003 period (0.5%-0.7%). With the exception of the 2009 and
2011 figures (2.4% and 2.6%, respectively), the rates of IHD or stroke in
women have remained fairly constant over time at 3.0%-3.2%.
Table 8.1
8.4
DOCTOR-DIAGNOSED AND UNDIAGNOSED DIABETES
8.4.1
Trends in doctor-diagnosed diabetes since 1995
There has been an increase over time in doctor-diagnosed diabetes
among adults aged 16-64 (Table 8.2). Prevalence doubled between
1995 and 2008, from 1.5% to 3.1%, and was a little higher in the three
most recent survey years (3.6%-3.8%). The increase between 1995 and
2008 was slightly steeper for men (from 1.5% to 3.3%) than for women
(from 1.5% to 2.8%), and while prevalence increased further in men
234
from 2009 onwards (4.0%-4.7%), for women it remained fairly stable
(2.8%-3.2%).
The figures for all those aged 16 and over are available from 2003
onwards and the trend shows a similar pattern to that for adults aged
16-64, with prevalence between 2003 and the three most recent survey
years increasing from 3.8% to 6.1-6.3% for men, and from 3.7% to
4.4%-4.9% for women.
Table 8.2
8.4.2
Trends in undiagnosed diabetes since 2003
As described in Section 8.2.4, levels of glycated haemoglobin
(measured in the blood samples collected in the nurse interview) can be
used to estimate the prevalence of undiagnosed diabetes in the
population. Levels of glycated haemoglobin are reported in three groups
in Table 8.3: 6.5% or above (a level consistent with undiagnosed
diabetes), 6.0-<6.5% (a level that could indicate a high risk of
developing diabetes), and <6.0% (low risk). Participants who reported
that they had doctor-diagnosed diabetes have been excluded from the
table. As only a sub-sample of participants was eligible for the nurse
interview each year in the 2008-2011 period, the data for these years
have been combined to provide more robust estimates.
Between 2003 and 2008-2011, the proportion of adults with
undiagnosed diabetes increased from 1.1% to 2.4% (1.2% to 2.6% for
men, 1.0% to 2.1% for women).
Table 8.3
In the table below the self-reported doctor-diagnosed diabetes figures
collected in the survey are combined with the glycated haemoglobin
results (presented in Table 8.3), to estimate prevalence of the total ‘true’
level of diabetes (both diagnosed and undiagnosed) in the population.
Note that the diagnosed diabetes figures here are based on the 20082011 combined data, so differ slightly to those presented in Table 8.2.
The table below also provides an estimate of the proportion of all
diabetes that is undiagnosed. Based on these figures, just under a third
(32%) of all cases of diabetes in adults are undiagnosed.
235
Prevalence of diagnosed and undiagnosed diabetes, 2008-2011
combined
Men Women
All
adults
%
%
%
a
Doctor-diagnosed diabetes
6.0
4.5
5.2
Glycated haemoglobin >6.5%
but no diagnosed diabetes (i.e.
undiagnosed diabetes)b
2.6
2.1
2.4
All diabetes
8.6
6.6
7.6
30%
32%
32%
Undiagnosed diabetes as a
percentage of all diabetes
a Among those interviewed
b Among those providing a blood sample in the nurse interview
There has been a much more notable increase in the prevalence of
glycated haemoglobin levels of 6.0-<6.5% in adults without diagnosed
diabetes, from 2.7% to 11.8% between 2003 and 2008-2011. The scale
of the increase was similar for men and women. The Health Survey for
England has also been measuring glycated haemoglobin over time,
using the same blood collection technique and analysis laboratory as
SHeS. In 2003, 3.4% of adults in England without diabetes had a
glycated haemoglobin level of 6.0-<6.5%, by 2009 (the most recent
comparable year for which data are available) it had increased to 10.9%
(data not shown). Like Scotland, England also experienced a small
increase in the prevalence of glycated haemoglobin levels of 6.5% or
above, from 1.4% in 2003 to 2.5% in 2009 (data not shown).69
It is important to note that, as is always the nature with risk estimates,
only some people in the group classified as being at high risk of
developing diabetes will actually progress to the point of meeting the
diagnostic threshold for the condition, while some people with levels
currently below 6.0% will develop it, so these figures are simply an
estimate of the possible future burden of diabetes. Studies have shown
a very small increase in diabetic retinopathy with increasing glycated
haemoglobin until a threshold at 6.5%, after which it climbs steeply; this
has therefore been taken as the best threshold for diagnosing
diabetes.70 Although there is no specific level at which risk of
developing diabetes clearly begins, the International Expert Committee
report on the use of glycated haemoglobin to diagnose diabetes
suggested that those with glycated haemoglobin levels of 6.0% to
<6.5% are at higher risk and should receive effective lifestyle
interventions. For example, they recommend that those at risk of
developing diabetes should be advised as a minimum to control their
weight and be more physically active; and suggest such individuals may
also benefit from formal assessment of other cardiovascular risk factors,
such as blood pressure.70
Table 8.3
236
8.5
HYPERTENSION
8.5.1
Trends in blood pressure levels since 1998
The four levels used to classify hypertension (presented in Table 8.4)
draw a distinction between people with normal blood pressure who are
not receiving any treatment for hypertension, and those with normal
levels who are taking anti-hypertensive medication. They also
distinguish between people with raised blood pressure who are
receiving treatment, and those who are not. These latter two categories
are important target groups in the population. The first (those with
raised blood pressure who are receiving treatment) includes people with
poorly managed hypertension, while the second provides an estimate of
the prevalence of potentially undiagnosed cases of this condition. It
should be noted, when considering this last category, that not everyone
with a one-off raised blood pressure measurement actually has
hypertension on repeated measurement; the definition of hypertension
is 'sustained raised BP'. Nor does everyone with a blood pressure of
140-159/90-99mmHg warrant treatment, which is indicated for people
aged under 80 with existing CVD, diabetes, damage from raised blood
pressure (e.g. kidney disease) or at high risk of developing CVD.
Blood pressure levels from 1998 onwards are presented in Table 8.4.
The blood pressure categories use information about prescribed
medications. As questions about medications were first included in
SHeS in 1998, the trends in blood pressure levels exclude 1995. Since
adults aged 75 and over were not included in the 1998 survey, the
discussion on the trend since 1998 is based on those aged 16-74. The
figures for all adults aged 16 and over from 2003 onwards are also
included in the table.
Prevalence of hypertension has changed over time, though it is worth
noting, as previous reports have, that the change in the measurement
equipment used between 1998 and 2003 might have contributed to
some of this change.26 Between 1998 and 2003 the proportion of men
aged 16-74 with hypertension increased from 22.3% to 29.5%; the
2008/2009 and 2010/2011 figures were similarly high (31.9% and
29.9%, respectively). The increase occurred across each of the three
separate hypertensive categories.
Table 8.4
A similar, but less pronounced, increase was observed among women;
a significant increase between 1998 and 2003 with prevalence in more
recent years remaining at this higher level. In 1998, 21.2% of women
aged 16-74 had hypertension compared with 26.7% in 2003, 26.5% in
2008/2009 and 26.6% in 2010/2011. As seen with men, prevalence
increased in each of the hypertensive categories.
The pattern for adults aged 16 and over, from 2003 onwards, was very
similar to that described for the 16-74 year old population. In
2010/2011, the total proportions of men and women aged 16 and over
with hypertension (33.0% and 32.0%, respectively) were similar to the
2008/2009 and 2003 figures.
237
Blood pressure levels by age and sex, 2010/2011 combined
In 2010/2011 the prevalence of hypertension (blood pressure of
>140/90 mmHg and/or taking anti-hypertensive medication) was not
significantly different in men (33.0%) and women (32.0%) and the
proportions of men and women in each of the three hypertensive
categories were very similar. As Figure 8A shows, increasing age is a
major risk factor for hypertension, though patterns differ between men
and women. In 2010/2011, prevalence of hypertension among men
doubled between the ages of 16-24 and 45-54 (from 13.6% to 29.1%),
and again between the ages of 45-54 and 65-74 (to 61.0%), and was
highest (69.4%) among those aged 75 and over. Women had lower
hypertension rates than men up until the age of 55-64, after which point
rates were higher than for men. Rates fluctuated among younger
women before showing a steady increase. Prevalence rose from 13.2%
of those aged 35-44, to 26.3% and 50.8% in the next two age groups,
and reached a peak of 77.2% among women aged 75 and over.
Figure 8A, Table 8.4
Figure 8A
Proportion of adults with hypertension, by age and sex, 2010/2011 combined
Men
Women
80
70
60
Percent
8.5.2
50
40
30
20
10
0
16-24
25-34
35-44
45-54
55-64
65-74
75+
All
Age group
Almost one in five men and one in six women had untreated
hypertension in 2010/2011: for both sexes this was the most common
category of hypertension among those aged 16-74 (controlled
hypertension was more common for men aged 75 and over, while
uncontrolled hypertension was more common for women of this age).
As the inset table below shows, untreated hypertension accounted for
around half (52%) of all hypertension detected in the survey. Its
contribution to total hypertension prevalence decreased with age, as
prevalence of both uncontrolled and controlled hypertension increased.
Table 8.4
238
Prevalence of treated and untreated hypertension, 2010/2011
combined
Men Women
All
adults
%
%
%
a
Untreated hypertension
18.5
15.7
17.0
Treated hypertension (controlled
and uncontrolled)b
14.5
16.4
15.5
All hypertension
33.0
32.0
32.5
Untreated hypertension as a
percentage of all hypertension
56%
49%
52%
a Not taking drugs prescribed to treat high blood pressure and with SBP of ≥140
mmHg or DBP ≥90 mmHg.
b Taking drugs prescribed to treat high blood pressure with any BP level.
8.6
BLOOD ANALYTES
8.6.1
Total cholesterol
Between 1995 and 2008-2011 the mean level of total cholesterol in men
aged 16-64 declined from 5.6 to 5.2 mmol/l. This was accompanied by
a notable decline in the proportion of men with a total cholesterol level
of 5.0 mmol/l or above (from 69.8% to 57.8%). The greatest decrease
occurred between 1995 and 1998. The proportion of men with a total
cholesterol level of 5.0 mmol/l or above was lower in every age group in
2008-2011 compared with 1995.
Among women aged 16-64, the overall trend between 1995 and 20082011 was also one of decline both for mean cholesterol (from 5.6
mmol/l to 5.3 mmol/l) and for the proportion with levels of 5.0 mmol/l or
above (from 67.8% to 59.9%). As with men, most of the decline
occurred between 1995 and 1998 with little change in the figures since
then.
The more recent trend, for all adults aged 16 and over from 2003
onwards, also showed a decline on both measures, largely driven by a
particularly pronounced drop among men aged 75 and over (for
example, the proportion of men aged 75 and over with levels of 5.0
mmol/l or above halved between 2003 and 2008-2011). Women aged
65 and over also saw large declines (of 14-17 percentage points) in the
proportions with levels of 5.0 mmol/l or above. These figures include
people taking lipid lowering drugs (LLD) such as statins, so the decline
in total cholesterol will almost entirely be due to the increased use of
such drugs. As the inset table below indicates, between 2003 and 20082011, there was a significant increase in LLD use among men and
women particularly among those aged those aged 65 and over, to the
extent that in 2008-2011, 44% of men, and 38% of women aged 65 and
over took such drugs (compared with 25% and 20%, respectively, in
2003).
239
Prevalence of lipid lowering drug use, 2003 and 2008-2011
combined
Aged
16-44
Aged
45-64
% (95% CI)
Aged
65 and
over
% (95% CI)
All aged
16 and
over
% (95% CI)
Men 2003
% (95%
CI)a
1 (0.3-1.7)
12 (10-14)
25 (21-28)
9 (8-10)
Men 2008-2011
1 (0.4-1.8)
20 (17-23)
44 (40-49)
15 (14-17)
Women 2003
1 (0.3-1.3)
7 (5-9)
20 (17-24)
7 (6-8)
Women 2008-2011
0 (0.1-1.0)
12 (10-15)
38 (34-42)
13 (11-14)
a 95% confidence intervals are shown to help interpret the trend (sample sizes= 5,444
in 2003 and 4,273 in 2008-2011)
Table 8.5 and Figure 8B show that, in 2008-2011, prevalence of a total
cholesterol level of 5.0 mmol/l or above increased notably with age
among men, from 21.9% of those aged 16-24 to 69.6%-73.3% of those
aged 35-64, before declining to 59.9% at age 65-74, and further to
28.4% of those aged 75 and over. For women, the peak occurred at
age 55-64 (84.0%) and the decline thereafter was much less
pronounced so that a majority of women aged 75 and over (64.3%) had
a total cholesterol level of 5.0 mmol/l or above. SIGN’s
recommendations for statin treatment are based on CVD risk and
cholesterol levels, but they advise statins for anyone with a total
cholesterol level of 8.0 mmol/l or above; in the 2008-2011 period just
1.4% of adults fell into this group (data not shown).
Figure 8B, Table 8.5
8.6.2
HDL cholesterol and total: HDL cholesterol ratio
Mean HDL cholesterol levels were the same in 2003 and 2008-2011 for
both men (1.3 mmol/l) and women (1.6 mmol/l) 50 and varied little by
age. Men were more likely than women to have low levels of HDL
cholesterol. While the proportion of men with HDL levels below 1.0
mmol/l increased between 2003 and 2008-2011 (from 7.7% to 10.8%),
240
the figures for women were very similar (2.0% and 3.1%, respectively).
The proportion of men with HDL cholesterol levels below 1.0 mmol/l
varied with age in both 2003 and 2008-2011, but with no consistent
pattern. In contrast, in 2003 the proportion of women with levels below 1
mmol/l was lowest among those aged 35-74, whereas in 2008-2011 it
was broadly similar across all age groups.
As discussed in Section 8.2.4, the ratio of total cholesterol to HDL
cholesterol is a stronger indicator of cardiovascular risk than either
measure alone. The mean ratios were very similar in 2003 and 20082011 (4.2 and 4.1 respectively for men, 3.6 in both years for women).
Ratios in 2008-2011 showed a similar inverted U-shaped distribution
with age to that shown in Figure 8B for men’s total cholesterol. For both
men and women, ratios increased with age from 3.5 and 3.1,
respectively, at age 16-24 to peaks of 4.7 in men aged 45-54, and 4.0 in
women aged 55-64, before dropping to 3.5 for both men and women
aged 75 and over.
Table 8.6
8.6.3
Fibrinogen
Between 1998 and 2008-2011, mean fibrinogen levels in adults aged
16-74 increased from 2.6 g/l to 2.9 g/l in men, and from 2.8 g/l to 3.1 g/l
in women. In contrast, the figures for adults aged 16 and over from
2003 onwards were more stable, for both sexes. Fibrinogen levels did
not differ significantly by sex and increased with age among both men
and women. For example, for men in 2008-2011 they increased from
2.7g/l at age 16-24 to 3.3g/l at age 75 and over. The equivalent figures
for women were 2.9 g/l and 3.3 g/l in respectively.
Table 8.7
8.6.4
C-reactive protein (CRP)
Mean CRP levels (measured as mg/l) from 1998 onwards are
presented in Table 8.8. As CRP is not normally distributed (most people
had very low levels of CRP so it was very skewed to the right), mean
values are not a good measure of levels in the population. Instead,
quintile distributions have been presented and are discussed to help
illustrate the pattern over time, and between men, women and different
age groups.
The 1998 CRP thresholds have been applied to the 2003 and 20082011 data to enable comparisons in quintile distributions over time to be
made. Any analyses based on a single point in time would, of course,
need to apply the quintile thresholds applicable to those data.
Although the mean CRP for men aged 16-74 changed little over time,
there was some change in the proportions in the bottom two quintiles.
Between 1998 and 2008-2011, the proportion in the bottom CRP
quintile increased from 20.7% to 27.0%. This was coupled with a
decrease (from 22.1% to 17.7%) in the proportion in the second quintile.
The increase over time in the proportion of men in the lowest CRP
quintile was greatest for men aged 55-64 (a doubling from 7.8% to
15.3%). However, in absolute terms, it was men aged 25-34 who
241
experienced the largest percentage point increase (from 25.9% to
40.0%).
The pattern among women was a little different: the mean CRP level for
those aged 16-74 was significantly lower in 2008-2011 (3.3 mg/l) than in
2003 (3.8mg/l) and lower, but not significantly, than in 1998 (3.6mg/l).
The only notable changes in the proportions in each of the quintile
groups between 1998 and 2008-2011 were a small decrease in the
proportion in the highest quintile (from 20.0% to 17.3%), and a small
increase in the overall proportions in the second to fourth quintiles (from
80.1% in 1998 to 82.7% in 2008-2011).
In every survey year, CRP levels were higher for women than for men,
and levels for both sexes generally increased with age. For example, in
2008-2011, the proportion of men with a CRP level in the highest
quintile increased from 9.4%-10.5% for those aged 16-34 to 19.9%24.5% for those aged 55-74. The pattern for women fluctuated more,
with those aged 55-74 also the most likely to have a CRP level in the
highest quintile.
Table 8.8
242
References and notes
1
MacGregor, A. (2009). Chapter 8: Cardiovascular disease and diabetes. In Bromley, C.,
Bradshaw, P. and Given, L. [eds.] The 2008 Scottish Health Survey – Volume 1: Main Report.
Edinburgh, Scottish Government. www.scotland.gov.uk/Publications/2009/09/28102003/0
2
MacGregor, A. and Mindell, J. (2010). Chapter 9: Cardiovascular disease, hypertension and
diabetes. In Bromley, C., Given, L. and Ormston, R. [eds.] The 2009 Scottish Health Survey –
Volume 1: Main Report. Edinburgh, Scottish Government.
www.scotland.gov.uk/Publications/2010/09/23154223/0
3
MacGregor, A. and Mindell, J. (2011). Chapter 9: Cardiovascular disease diagnoses and
symptoms. In Bromley, C., and Given, L. [eds.] The 2010 Scottish Health Survey – Volume 1:
Main Report. Edinburgh, Scottish Government.
www.scotland.gov.uk/Publications/2011/09/27084018/0
4
Scotland’s Population 2011 – The Registrar General’s Annual Review of Demographic Trends
157th edition, Edinburgh: National Records of Scotland, 2012. Available from: <http://www.groscotland.gov.uk/statistics/at-a-glance/annrev/2011/index.html>
5
Leyland, A.H., Dundas, R., McLoone, P. and Boddy, F.A. (2007) Inequalities in mortality in
Scotland 1981-2001. Glasgow: MRC Social and Public Health Sciences Unit, Occasional Paper
16.
6
Scottish Budget Spending Review 2007, Edinburgh: Scottish Government, 2007. [online]
Available from: <www.scotland.gov.uk/Publications/2007/11/13092240/0> See also:
<www.scotlandperforms.com>
7
See: <www.scotland.gov.uk/About/Performance/scotPerforms/indicator/smoking>
8
See: <www.scotland.gov.uk/About/scotPerforms/indicator/physicalactivity>
9
See: <www.scotland.gov.uk/About/scotPerforms/indicator/healthyweight>
10
National Performance Framework: Changes to the National Indicator Set, Edinburgh: Scottish
Government, 2012. [online] Available from:
<www.scotland.gov.uk/About/scotPerforms/NIchanges> See also:
<www.scotlandperforms.com>
11
See: <www.scotland.gov.uk/About/Performance/scotPerforms/indicator/mortality>
12
The HEAT targets derive their name from the four strands in the performance framework: the
Health of the population; Efficiency and productivity, resources and workforce; Access to
services and waiting times; and Treatment and quality of services.
13
Better Health, Better Care Action Plan. Edinburgh: Scottish Government, 2009.
14
See:
<www.scotland.gov.uk/About/scotPerforms/partnerstories/NHSScotlandperformance/cardiovasc
ularhealthcheck>
15
See:
<www.scotland.gov.uk/About/scotPerforms/partnerstories/NHSScotlandperformance/Stroke>
16
Better Heart Disease and Stroke Care Action Plan. Edinburgh: Scottish Government, 2009.
17
Coronary Heart Disease and Stroke in Scotland - Strategy Update 2004, Edinburgh: Scottish
Executive, 2004.
18
Details of the Quality and Outcomes Framework are available from:
<www.isdscotland.org/isd/3305.html>
243
19
Health in Scotland 2007 – Annual Report of the Chief Medical Officer. Edinburgh: Scottish
Government, 2008.
20
Scottish Intercollegiate Guidelines Network (February 2007). SIGN Guideline 97 Risk Estimation
and the Prevention of Heart Disease. [online] Available from:
<www.sign.ac.uk/guidelines/fulltext/97/index.html>
21
Scottish Intercollegiate Guidelines Network. Management of diabetes. SIGN guidelines 116.
Edinburgh: SIGN, 2010. <www.sign.ac.uk/guidelines/fulltext/116/index.html>
22
Diabetes Action Plan 2010: Quality Care for Diabetes in Scotland. Edinburgh: Scottish
Government, 2010. < http://www.scotland.gov.uk/Publications/2010/08/17095311/0>
23
See: <www.scotland.gov.uk/News/Releases/2011/02/21091044>
24
Rutherford, L. and Purdon, S. Scottish Health Survey Waist and Blood Pressure Validation
Study, Edinburgh: Scottish Government, Publication forthcoming.
25
See: Shelton, N. (2005). Volume 2: Adult health, Chapter 10: Diabetes. In: Bromley, C.,
Sproston, K. and Shelton, N., (eds.). The Scottish Health Survey 2003. Edinburgh: Scottish
Executive.
26
Chaudhury, M. (2005). Volume 2: Adult health, Chapter 9: Blood pressure in adults. In: Bromley,
C., Sproston, K. and Shelton, N., (eds.). The Scottish Health Survey 2003. Edinburgh: Scottish
Executive.
27
Bromley, C., Corbett, J., D'Souza, J., Given, L. and Miller, M. (2010). Chapter 1: Methodology
and response. In Bromley, C., Given, L. and Ormston, R. The 2009 Scottish Health Survey –
Volume 2: Technical Report. Edinburgh: Scottish Government.
http://www.scotland.gov.uk/Publications/2010/09/27093010/0
28
Bromley, C., Corbett, J., Given, L. McConville, S. and Pickering, K. (2011). Chapter 1:
Methodology and response. In Bromley, C., Given, L. and Ormston, R. The 2010 Scottish
Health Survey – Volume 2: Technical Report. Edinburgh: Scottish Government.
http://www.scotland.gov.uk/Publications/2011/09/27124046/0
29
It should be noted that in common with the definition used since the 2003 report, diabetes and
high blood pressure are not included in this definition of ‘any CVD condition’ (as they had been
in 1995 and 1998), since they are risk factors for CVD.
30
National Institute for Health and Clinical Excellence (August 2011). Hypertension - Clinical
management of primary hypertension in adults. Available from:
<http://guidance.nice.org.uk/CG127/NICEGuidance>
31
Scottish Intercollegiate Guidelines Network. Risk estimation and the prevention of
cardiovascular disease. SIGN guidelines 97. Edinburgh: SIGN, 2007.
<www.sign.ac.uk/pdf/sign97.pdf>
32
Scottish Intercollegiate Guidelines Network. Management of patients with stroke or TIA:
assessment, investigation, immediate management, and secondary prevention. SIGN
guidelines 108. Edinburgh: SIGN, 2008. <www.sign.ac.uk/pdf/qrg108.pdf>
33
Wolf-Maier, K., Cooper, R.S., Kramer, H., Banegas, J.R., Giampaoli, S., Joffres, M.R., Poulter,
N., Primatesta, P., Stegmayr, B and Thamm, M. (2004). Hypertension treatment and control in
five European countries, Canada and the United States. Hypertension 43:10-17
34
Chobanian, A., Bakris, G.L., Black, H.R., Cushman, W.C., Green, L.A. and Izzo, J.L. et al.
(2003). The seventh report of the Joint National Committee on prevention, detection, evaluation,
and treatment of high blood pressure. The JNC7 report. Journal of the American Medical
Association. 289:2560-72.
244
35
Guidelines Committee. (2003). European Society of Hypertension-European Society of
Cardiology guidelines for the management of arterial hypertension. Journal of Hypertension.
21:1011-53.
36
Ramsay, L.E., Williams, B., Johnston, G.D., MacGregor, G.A., Poston, L., Potter, J.F., Poulter,
N.R. and Russel, G. (1999). Guidelines for management of hypertension: report of the Third
Working Party of the British Hypertension Society, 1999. Journal of Human Hypertension.
13:569-592.
37
Chowdhury, T.A. and Lasker, S.S. (1998). Elevated glycated haemoglobin in non-diabetic
patients is associated with an increased mortality in myocardial infarction. Postgraduate Medical
Journal. 74:480-1.
38
International Expert committee. International expert committee report on the role of the A1c
assay in the diagnosis of diabetes. Diabetes Care. 2009;32:1327-34.
39
American Diabetes Association. Standards of medical care in diabetes. Diabetes Care. 2010;33
(suppl1):S11-61.
40
British Medical Association. QOF Changes and New Indicators for 2009/10. London: BMA,
2009. <www.bma.org.uk/images/QOFchanges200910_tcm41-178932.pdf>
41
National Collaborating Centre for Chronic Conditions. Type 2 diabetes: national clinical
guideline for management in primary and secondary care (update). London: Royal College of
Physicians, 2008.
42
Rydén, L. Standl, E. Bartnik, M. et al. (2007). Guidelines on diabetes, pre-diabetes, and
cardiovasular diseases: executive summary. The Task Force on Diabetes and Cardiovascular
Disease of the European Society of Cardiology (ESC) and of the European Association for the
Study of Diabetes (EASD). European Heart Journal. 28:88-136.
43
Gould, A.L., Rossouw, J.E., Santanello, N.C., Heyse, J.F. and Furberg, C.D. (1995) Cholesterol
reduction yields clinical benefit. Circulation. 91:2274-2282.
44
Shepherd J., Cobbe S.M., Ford I., Isles C.G., Lorimer A.R., MacFarlane P.W., McKillop J.H.,
Packard C.J. for the West of Scotland Coronary Prevention Study Group (WOSCOPS).
Prevention of coronary heart disease with pravastatin in men with hypercholesterolaemia. New
England Journal of Medicine. 1995;333:1301-1307.
45
Cholesterol Treatment Trialists’ Collaborators. Efficacy and safety of cholesterol-lowering
treatment: prospective meta-analysis of data from 90,056 participants in 14 randomised trials of
statins. Lancet. 2005;366:1267-1278.
46
National Framework Service for Coronary Heart Disease Modern Standards and Service
Models March 2000.
47
An overview of how the Quality Outcomes Framework operates in Scotland is available from:
<www.isdscotland.org/isd/3310.html>
48
British Cardiac Society, British Hypertension Society, Diabetes UK, HEART UK, Primary Care
Cardiovascular Society, The Stroke Association. JBS 2: Joint British Societies’ guidelines on
prevention of cardiovascular disease in clinical practice. Heart. 2005; 91 (Suppl V):v1-v52.
49
Fourth Joint European Societies’ Task Force on Cardiovascular Disease Prevention in Clinical
Practice. European Guidelines on Cardiovascular Disease Prevention in Clinical Practice.
European Society of Cardiology, 2007.
50
In April 2010 the equipment used by the lab to analyse cholesterol (total and HDL) changed (as
detailed in the 2010 Technical Report). This resulted in the total cholesterol concentrations
245
measured after point this being on average 0.1 mmol/l higher than was the case with the
previous equipment, while the HDL cholesterol concentrations were 0.1 mmol/l lower. As the
tables report data from the whole 2008-2011 period, and the impact was minimal, no
adjustments were made to the data presented in this chapter.
51
Gordon, D.J., Probstfield, J.L., Garrison, R.J., Neaton, J.D., Castelli, W.P., Knoke, J.D., Jacobs,
D.R., Bangdiwala, S. and Tyroler, H.A. (1989). High-density lipoprotein cholesterol and
cardiovascular disease: four prospective American studies. Circulation. 79:8-15.
52
Castelli, W.P., Garrison, R.J., Wilson, P.W.F., Abbott, R.D., Kalousdian, S. and Kannel, W.B.
(1986). Incidence of coronary heart disease and lipoprotein cholesterol levels: the Framingham
Study. Journal of the American Medical Association. 256:2835-2838.
53
Berge, K.G., Cannel, P.L. and Hainline, A. (1982) High-density lipoprotein cholesterol and
prognosis after myocardial infarction. Circulation. 66:1176-1178.
54
De Oliveira e Silva ER, Foster SD, McGee Harper M, et al (2000). Alcohol Consumption Raises
HDL Cholesterol Levels by Increasing the Transport Rate of Apolipoproteins A-I and A-II.
Circulation. 102: 2347-2352
55
Ridker PM, Rifai N, Cook NR, Bradwin G, Buring JE., (2005) Non-HDL cholesterol,
apolipoproteins A-I and B 100, standard lipid measures, lipid ratios, and CRP as risk factors for
cardiovascular disease in women. JAMA. 294: 326-33.
56
Kinosian B, Glick H, Garland G. (1994) Cholesterol and coronary heart disease: predicting risks
by levels and ratios. Ann Intern Med. 121: 641–647.
57
R McPherson, J Frohlich, G Fodor, J Genest. (2006) Canadian Cardiovascular Society position
statement – Recommendations for the diagnosis and treatment of dyslipidemia and prevention of
cardiovascular disease. Can J Cardiol. 22:913-27.
58
Mathews SC, Mallidi J, Kulkarni K, Toth PP, Jones SR (2012) Achieving Secondary Prevention
Low-Density Lipoprotein Particle Concentration Goals Using Lipoprotein Cholesterol-Based
Data. PLoS ONE 7:e33692.
59
Haverkate, F., Thompson, S.G., Pyke. S.D.M., Gallimore, J.R. and Pepys, M.B. (1997). For the
European Concerted Action on Thrombosis, and Disabilities Angina Pectoris Study Group.
Production of C-reactive protein and risk of coronary events in stable and unstable angina.
Lancet 349:462-466.
60
Kuller, L.H., Tracy, R.P., Shaten,J. and Meilahn, E.N. (1996). for the MRFIT Research Group.
Relationship of C-reactive protein and coronary heart disease in the MRFIT nested case-control
study. American Journal of Epidemiology. 144:537-547.
61
Elliott, P., Chambers, J.C., Zhang W et al. (2009). Genetic loci associated with C-reactive
protein levels and risk of coronary heart disease. Journal of the American Medical Association.
302:37-48.
62
Hingorani A, Sofat R, Morris RW, Whincup P, Lowe GD, Mindell J, Sattar N, Casa JP, Shah T
(2012). Is it important to measure or reduce C-reactive protein in people at risk of cardiovascular
disease? Eur Heart J. 2012; doi: 10.1093/eurheartj/ehs168.
63
Ridker, P,M,, Glynn, R.J., and Hennekens, C.H. (1998). C-reactive protein adds to the predictive
value of total and HDL cholesterol in determining risk of first myocardial infarction. Circulation
97:2007-2011.
64
Shah, T., Casa, J.P., Cooper, J.A et al. (2009). Critical appraisal of CRP measurement for the
prediction of coronary heart disease events: new data and systematic review of 31 prospective
cohorts. International Journal of Epidemiology. 38:217-31.
246
65
Pearson, T.A., Mensah, G.A., Alexander, R.W. et al. (2003). Markers of inflammation and
cardiovascular disease: application to clinical and public health practice. A statement for
healthcare professionals from the Centers for Disease Control and Prevention and the
American Heart Association. Circulation. 107: 499–511.
66
Lee AJ, Lowe GDO, Woodward M, Tunstall-Pedoe H. (1993). Fibrinogen in relation to personal
history of prevalent hypertension, diabetes, stroke, intermittent claudication, coronary heart
disease and family history: the Scottish Heart Health Study. Br Heart J. 69:338-42.
67
Aiello AE, Kaplan GA. (2009). Socioeconomic position and inflammatory and immune
biomarkers of cardiovascular disease: applications to the Panel Study of Income Dynamics.
Biodemography Soc Biol. 55:178-205.
68
Folsom AR, Wu KK, Rasmussen M, Chambless LE, Aleksic N, Nieto FJ. (2000) Determinants of
population changes in fibrinogen and factor VII over 6 years: the Atherosclerosis Risk in
Communities (ARIC) Study. Arteriosclerosis, Thrombosis, and Vascular Biology. 20:601-6.
69
Aresu, M., Gordon-Dseagu,V. and Shelton, N (2010). Chapter 4: Diabetes and Glycaemia. In
Craig, R. and Hirani, V. [eds.] The Health Survey for England 2009 – Volume 1: Health and
Lifestyles. The NHS Information Centre, Leeds, 2007.
70
The International Expert Committee. (2009) International Expert Committee Report on the Role
of the A1C Assay in the Diagnosis of Diabetes. Diabetes Care. 32:1327-34.
247
Table list
Table 8.1
Table 8.2
Table 8.3
Table 8.4
Table 8.5
Table 8.6
Table 8.7
Table 8.8
Any CVD, any CVD or diabetes, IHD, stroke, IHD or stroke, 1995, 1998, 2003,
2008, 2009, 2010, 2011, by age and sex
Prevalence of doctor-diagnosed diabetes, 1995, 1998, 2003, 2008, 2009,
2010, 2011, by age and sex
Glycated haemoglobin levels in people with no diabetes diagnosis, 2003,
2008-2011 combined, by age and sex
Blood pressure level, 1998, 2003, 2008/2009 combined, 2010/2011
combined, by age and sex
Total cholesterol, 1995, 1998, 2003, 2008-2011 combined, by age and sex
HDL cholesterol and Total: HDL cholesterol ratio, 2003, 2008-2011 combined,
by age and sex
Fibrinogen 1998, 2003, 2008-2011 combined, by age and sex
C-reactive protein 1998, 2003, 2008-2011 combined, by age and sex
248
Table 8.1
Any CVD, any CVD or diabetes, IHD, stroke, IHD or stroke, 1995, 1998,
2003, 2008, 2009, 2010, 2011, by age and sex
Aged 16 and over
Any CVD / any CVD or
diabetes / IHD / stroke /
IHD or stroke
1995, 1998, 2003, 2008, 2009, 2010, 2011
Total
16+
Age
16-24 25-34
35-44 45-54
55-64 65-74
75+
Total
16-64
%
%
%
%
%
%
%
%
%
Any CVD
1995
1998
2003
2008
2009
2010
2011
3.5
1.3
2.9
4.9
3.9
5.2
4.0
3.2
4.3
5.2
5.9
3.0
4.1
6.7
5.7
5.6
8.0
6.8
5.3
8.1
5.1
10.7
11.3
10.3
10.3
11.7
12.2
12.9
23.8
21.7
23.3
22.0
23.7
23.0
20.1
n/a
36.9
35.9
35.8
36.1
37.9
36.4
n/a
n/a
45.4
45.0
49.4
49.4
49.6
8.4
8.1
9.7
9.9
9.5
10.5
9.8
n/a
n/a
14.9
15.1
15.2
16.3
15.6
Any CVD or diabetes
1995
1998
2003
2008
2009
2010
2011
3.9
2.1
3.4
5.7
3.9
5.2
6.3
3.4
5.2
5.7
6.0
4.5
4.9
7.5
6.5
6.9
9.1
7.3
6.8
10.6
6.1
12.4
13.6
11.1
13.3
16.5
16.3
17.7
26.2
24.7
27.3
29.1
31.3
30.7
25.8
n/a
40.8
41.2
42.2
42.8
44.8
42.6
n/a
n/a
49.6
52.5
55.4
56.5
57.0
9.4
9.7
11.1
12.2
12.7
13.6
12.7
n/a
n/a
16.8
18.2
19.0
20.1
19.2
IHD
1995
1998
2003
2008
2009
2010
2011
0.6
0.2
0.1
0.8
0.3
0.5
-
1.1
0.8
0.9
0.5
0.4
0.9
0.3
6.0
6.6
4.9
3.0
4.1
4.4
5.6
17.0
16.1
15.3
13.1
13.3
11.0
10.4
n/a
27.3
25.3
21.9
22.4
22.6
23.0
n/a
n/a
31.7
26.8
27.9
31.0
30.7
4.0
4.0
4.1
3.2
3.6
3.4
3.4
n/a
n/a
8.2
6.9
7.4
7.5
7.5
Stroke
1995
1998
2003
2008
2009
2010
2011
0.2
0.1
-
0.2
0.3
0.0
0.4
0.6
0.1
0.3
0.7
1.3
0.6
1.2
-
1.7
0.9
0.9
0.8
1.5
1.5
1.5
3.9
2.1
4.6
3.3
3.4
5.8
4.5
n/a
6.4
5.9
5.8
8.1
8.5
7.8
n/a
n/a
11.3
13.6
13.0
12.7
13.3
1.0
0.7
1.2
1.1
1.1
1.8
1.3
n/a
n/a
2.4
2.5
2.7
3.3
2.9
IHD or stroke
1995
1998
2003
2008
2009
2010
2011
0.2
0.1
0.6
0.2
0.4
0.8
0.3
1.0
0.6
1.2
1.0
1.4
1.8
1.0
1.9
0.3
7.2
7.2
5.8
3.8
5.3
5.4
6.4
19.0
17.1
18.1
15.8
15.6
15.5
13.7
n/a
31.0
28.4
25.9
28.5
27.9
26.7
n/a
n/a
37.3
35.9
37.7
38.8
39.6
4.6
n/a
4.4
n/a
5.0
9.6
4.2
8.7
4.4
9.4
4.8
9.8
4.3
9.4
Continued…
Men
249
Table 8.1
- Continued
Aged 16 and over
Any CVD / any CVD or
diabetes / IHD / stroke /
IHD or stroke
1995, 1998, 2003, 2008, 2009, 2010, 2011
Total
16+
Age
16-24 25-34
35-44 45-54
55-64 65-74
75+
Total
16-64
%
%
%
%
%
%
%
%
%
Any CVD
1995
1998
2003
2008
2009
2010
2011
5.1
2.9
4.4
6.4
4.2
5.1
7.0
4.1
3.8
5.3
5.7
6.7
7.3
4.0
7.4
7.6
6.5
8.8
9.3
8.1
5.7
10.5
11.3
11.5
12.9
9.5
10.1
11.6
20.2
18.9
17.5
18.9
14.5
15.3
13.1
n/a
27.1
31.0
30.9
24.5
28.2
28.5
n/a
n/a
36.6
35.5
37.2
33.4
37.5
8.9
8.5
8.9
10.7
9.0
9.3
8.4
n/a
n/a
14.5
15.5
13.7
14.0
13.8
Any CVD or diabetes
1995
1998
2003
2008
2009
2010
2011
5.9
3.5
4.6
8.1
4.5
5.5
7.0
4.8
4.2
5.6
7.0
8.4
8.1
4.5
8.5
8.4
8.4
10.8
10.6
9.7
7.7
11.7
11.9
12.4
15.2
12.2
12.8
14.9
22.6
22.5
20.5
22.4
19.3
19.6
19.2
n/a
29.8
35.4
34.9
30.2
33.0
35.1
n/a
n/a
40.6
40.8
41.9
38.8
43.4
10.1
9.6
10.2
12.8
11.2
11.3
10.8
n/a
n/a
16.4
18.2
16.5
16.7
17.0
IHD
1995
1998
2003
2008
2009
2010
2011
0.3
0.2
0.5
0.4
0.2
0.4
0.2
0.5
0.2
1.0
0.6
0.6
1.1
0.8
1.0
0.2
3.4
3.8
3.6
2.4
2.0
2.6
3.1
11.4
10.7
8.7
7.4
6.2
6.9
4.9
n/a
17.3
17.7
15.9
12.8
15.1
13.0
n/a
n/a
22.9
20.2
21.8
16.8
19.2
2.9
2.7
2.6
2.2
1.9
2.2
1.8
n/a
n/a
6.5
5.6
5.2
5.2
4.9
Stroke
1995
1998
2003
2008
2009
2010
2011
0.0
0.2
-
0.2
0.1
0.2
0.2
0.1
0.2
0.2
0.1
0.9
0.6
0.7
1.4
0.8
0.7
0.5
0.5
1.9
1.0
0.8
1.2
1.8
2.6
2.1
3.2
2.2
3.3
2.7
n/a
5.5
5.0
7.1
5.4
5.7
6.8
n/a
n/a
8.3
10.4
8.8
9.3
10.4
0.5
0.6
0.7
1.2
0.9
1.1
1.0
n/a
n/a
2.1
2.8
2.2
2.5
2.7
IHD or stroke
1995
1998
2003
2008
2009
2010
2011
0.3
0.0
0.4
0.5
0.4
0.3
0.6
0.3
0.6
0.4
1.1
0.7
1.4
1.6
1.4
1.9
1.0
3.9
4.1
3.9
3.9
2.7
3.3
4.0
12.4
11.9
10.4
9.7
7.1
9.3
6.6
n/a
20.9
21.1
20.1
16.7
18.5
17.1
n/a
n/a
28.9
26.7
27.9
23.6
25.6
3.2
n/a
3.0
n/a
3.2
8.0
3.1
7.5
2.4
6.7
3.1
7.0
2.6
6.7
Continued…
Women
250
Table 8.1
- Continued
Aged 16 and over
Any CVD / any CVD or
diabetes / IHD / stroke /
IHD or stroke
Bases (weighted):
Men 1995
Men 1998
Men 2003
Men 2008
Men 2009
Men 2010
Men 2011
Women 1995
Women 1998
Women 2003
Women 2008
Women 2009
Women 2010
Women 2011
Bases (unweighted):
Men 1995
Men 1998
Men 2003
Men 2008
Men 2009
Men 2010
Men 2011
Women 1995
Women 1998
Women 2003
Women 2008
Women 2009
Women 2010
Women 2011
1995, 1998, 2003, 2008, 2009, 2010, 2011
Total
16+
Age
16-24 25-34
35-44 45-54
55-64 65-74
75+
Total
16-64
722
708
580
464
538
515
536
693
677
566
444
515
494
514
979
953
610
481
568
560
583
988
940
658
486
571
556
579
850
904
761
564
635
589
613
867
913
811
616
693
645
671
748
780
668
554
652
630
656
777
798
690
591
700
681
710
599
607
569
480
563
542
564
663
661
602
503
589
571
595
n/a
469
405
327
387
374
389
n/a
583
492
383
450
432
449
n/a
n/a
260
217
259
254
266
n/a
n/a
468
350
408
396
413
3898
3953
3188
2542
2955
2837
2953
3988
3989
3327
2640
3068
2947
3069
n/a
n/a
3857
3086
3601
3465
3608
n/a
n/a
4291
3372
3926
3774
3931
474
399
336
246
272
274
308
546
528
404
333
385
373
364
840
763
455
317
406
421
399
1158
973
600
450
580
565
561
810
828
733
462
551
478
516
989
1008
885
648
779
682
711
708
694
614
534
604
565
599
824
896
794
632
733
762
803
688
683
633
525
575
555
601
880
807
778
631
734
701
739
n/a
571
509
453
517
488
510
n/a
888
580
514
550
574
597
n/a
n/a
327
303
362
331
344
n/a
n/a
493
410
478
470
486
3520
3367
2771
2084
2408
2293
2423
4397
4212
3461
2694
3211
3083
3178
n/a
n/a
3610
2840
3287
3112
3277
n/a
n/a
4538
3618
4239
4127
4261
251
Table 8.2
Prevalence of doctor-diagnosed diabetes, 1995, 1998, 2003, 2008, 2009,
2010, 2011, by age and sex
Aged 16 and over
Doctor-diagnosed
diabetes
1995, 1998, 2003, 2008, 2009, 2010, 2011
Total
16+
Age
16-24 25-34
Men
1995
1998
2003
2008
2009
2010
2011
Women
1995
1998
2003
2008
2009
2010
2011
All adults
1995
1998
2003
2008
2009
2010
2011
35-44 45-54
55-64 65-74
75+
Total
16-64
%
%
%
%
%
%
%
%
%
0.4
0.8
0.5
0.8
2.3
0.2
0.9
0.8
0.3
1.8
1.0
0.8
1.0
1.9
1.3
0.5
1.9
2.9
1.1
2.8
2.8
3.1
4.1
7.0
5.4
6.5
4.3
5.5
7.0
11.1
12.8
13.2
9.3
n/a
8.3
10.3
13.2
13.2
15.1
13.3
n/a
n/a
10.1
16.1
12.6
13.5
18.4
1.5
2.2
2.4
3.3
4.7
4.5
4.0
n/a
n/a
3.8
5.3
6.2
6.3
6.1
0.8
0.7
0.8
1.7
0.2
0.4
-
0.7
0.5
0.3
1.5
1.6
1.1
0.7
1.3
0.8
2.2
2.6
1.8
2.2
2.3
1.7
1.4
1.6
2.7
3.5
3.5
3.9
3.3
4.7
5.1
5.5
7.1
6.6
8.4
n/a
5.8
10.5
8.4
9.4
9.2
11.7
n/a
n/a
8.7
9.1
10.4
10.7
10.8
1.5
1.8
2.0
2.8
2.9
2.8
3.2
n/a
n/a
3.7
4.1
4.5
4.4
4.9
0.6
0.7
0.6
1.2
0.1
0.2
1.2
0.4
0.7
0.6
0.9
1.7
1.1
0.7
1.2
1.3
1.8
1.6
1.9
2.5
1.7
2.2
2.1
2.3
3.4
5.2
4.4
5.2
3.8
5.1
6.0
8.2
9.9
9.8
8.8
n/a
6.9
10.4
10.6
11.2
11.9
12.4
n/a
n/a
9.2
11.8
11.3
11.8
13.8
1.5
n/a
1.8
n/a
2.2
3.7
3.1
4.6
3.8
5.3
3.7
5.3
3.6
5.5
Continued…
252
Table 8.2
- Continued
Aged 16 and over
Doctor-diagnosed
diabetes
1995, 1998, 2003, 2008, 2009, 2010, 2011
Total
16+
Age
16-24 25-34
Bases (weighted):
Men 1995
Men 1998
Men 2003
Men 2008
Men 2009
Men 2010
Men 2011
Women 1995
Women 1998
Women 2003
Women 2008
Women 2009
Women 2010
Women 2011
All adults 1995
All adults 1998
All adults 2003
All adults 2008
All adults 2009
All adults 2010
All adults 2011
Bases (unweighted):
Men 1995
Men 1998
Men 2003
Men 2008
Men 2009
Men 2010
Men 2011
Women 1995
Women 1998
Women 2003
Women 2008
Women 2009
Women 2010
Women 2011
All adults 1995
All adults 1998
All adults 2003
All adults 2008
All adults 2009
All adults 2010
All adults 2011
35-44 45-54
55-64 65-74
75+
Total
16-64
723
708
580
464
538
515
536
695
675
566
445
515
494
514
1418
1384
1147
909
1053
1009
1051
979
953
610
481
568
560
583
990
940
658
487
571
557
580
1969
1896
1268
968
1138
1117
1163
851
902
761
564
635
589
613
870
913
813
616
695
645
671
1721
1817
1574
1180
1330
1234
1285
749
779
670
555
652
631
657
777
795
691
591
700
682
710
1527
1578
1360
1146
1352
1313
1366
600
607
569
480
563
542
565
665
660
602
504
590
571
595
1265
1270
1171
983
1153
1114
1159
n/a
469
406
327
387
374
390
n/a
582
493
384
450
432
449
n/a
1054
899
711
836
806
839
n/a
n/a
260
218
259
255
266
n/a
n/a
468
350
410
397
413
n/a
n/a
729
568
669
652
679
3902
3949
3190
2543
2955
2838
2954
3998
3983
3330
2643
3070
2949
3070
7900
7946
6520
5186
6025
5787
6024
n/a
n/a
3857
3088
3601
3468
3610
n/a
n/a
4291
3377
3930
3777
3932
n/a
n/a
8147
6465
7531
7245
7542
475
399
336
246
272
274
308
547
526
404
334
385
373
364
1022
927
740
580
657
647
672
840
763
455
317
406
421
399
1160
972
600
451
580
566
562
2000
1738
1055
768
986
987
961
811
826
733
462
551
478
516
992
1007
887
648
780
682
711
1803
1836
1620
1110
1331
1160
1227
709
693
616
535
604
566
600
825
894
795
632
733
763
803
1534
1590
1410
1167
1337
1329
1403
689
683
633
525
575
555
602
884
806
778
632
735
701
739
1573
1492
1411
1157
1310
1256
1341
n/a
571
510
453
517
489
511
n/a
885
581
516
550
574
597
n/a
1463
1091
969
1067
1063
1108
n/a
n/a
327
304
363
332
344
n/a
n/a
493
410
480
471
486
n/a
n/a
820
714
843
803
830
3524
3364
2773
2085
2408
2294
2425
4408
4205
3464
2697
3213
3085
3179
7932
7583
6236
4782
5621
5379
5604
n/a
n/a
3610
2842
3288
3115
3280
n/a
n/a
4538
3623
4243
4130
4262
n/a
n/a
8147
6465
7531
7245
7542
253
Table 8.3
Glycated haemoglobin levels in people with no diabetes diagnosis, 2003,
2008-2011 combined, by age and sex
Aged 16 and over and with a valid
glycated haemoglobin measurement
Glycated haemoglobin
level
2003, 2008-2011 combined
Age
Total
16-24
25-34
35-44
45-54
55-64
65-74
75+
%
%
%
%
%
%
%
%
<6.0%
2003
2008-2011
100.0
100.0
100.0
97.0
98.6
92.9
96.7
81.1
96.2
81.5
86.8
71.2
86.9
56.9
96.4
86.2
6.0-<6.5%
2003
2008-2011
-
2.4
1.4
5.5
2.4
15.1
2.7
14.2
7.1
22.7
8.1
38.1
2.3
11.1
≥6.5%
2003
2008-2011
-
0.5
1.5
0.9
3.7
1.1
4.3
6.0
6.1
5.0
5.0
1.2
2.6
<6.0%
2003
2008-2011
100.0
98.5
100.0
99.1
98.7
96.0
98.5
87.4
92.5
77.9
87.6
66.6
88.6
56.2
96.0
85.4
6.0-<6.5%
2003
2008-2011
1.5
0.9
0.7
3.5
1.0
11.3
4.9
20.2
10.4
25.5
9.6
37.3
3.1
12.5
≥6.5%
2003
2008-2011
-
-
0.6
0.6
0.6
1.3
2.6
1.9
2.0
7.9
1.7
6.5
1.0
2.1
<6.0%
2003
2008-2011
100.0
99.3
100.0
98.0
98.6
94.5
97.6
84.4
94.2
79.7
87.2
68.7
88.0
56.4
96.2
85.8
6.0-<6.5%
2003
2008-2011
0.7
1.7
1.1
4.5
1.7
13.1
3.9
17.2
8.8
24.2
9.1
37.6
2.7
11.8
≥6.5%
2003
2008-2011
-
0.3
0.3
1.0
0.7
2.5
1.9
3.1
3.9
7.1
Men
Women
All adults
254
2.9
1.1
6.0
2.4
Continued…
Table 8.3
- Continued
Aged 16 and over and with a valid
glycated haemoglobin measurement
Glycated haemoglobin
level
Bases (weighted):
Men 2003
Men 2008-2011
Women 2003
Women 2008-2011
All adults 2003
All adults 2008-2011
Bases (unweighted):
Men 2003
Men 2008-2011
Women 2003
Women 2008-2011
All adults 2003
All adults 2008-2011
2003, 2008-2011 combined
Age
Total
16-24
25-34
35-44
45-54
55-64
65-74
75+
284
220
271
221
554
441
306
239
331
236
636
475
385
253
397
272
782
525
326
264
341
293
667
557
266
223
291
235
557
459
192
142
213
174
404
317
119
95
211
156
330
251
1877
1437
2054
1587
3931
3024
121
93
127
108
248
201
209
145
247
200
456
345
377
239
442
304
819
543
334
260
427
345
761
605
341
276
409
319
750
595
259
205
258
236
517
441
159
121
201
157
360
278
1800
1339
2111
1669
3911
3008
255
Table 8.4
Blood pressure level, 1998, 2003, 2008/2009 combined, 2010/2011 combined, by
age and sex
Aged 16 and over and with a valid blood
pressure reading and data on medication
Blood pressure level
1998, 2003, 2008/2009 combined, 2010/2011 combined
Total
16+
Age
16-24
25-34
35-44
45-54
55-64
65-74
75+
Total
16-74
%
%
%
%
%
%
%
%
%
94.7
88.4
[90.6]
86.4
92.8
85.5
87.1
83.7
88.6
79.2
77.8
75.6
74.5
73.1
67.8
70.9
55.2
48.4
47.2
56.3
42.9
39.4
28.1
39.0
n/a
23.0
33.4
30.6
77.7
70.6
68.1
70.1
n/a
67.0
65.5
67.0
0.7
3.6
0.1
0.4
-
1.4
2.5
1.7
2.0
4.9
4.0
7.3
6.1
6.5
13.7
19.1
12.5
7.2
13.7
20.9
14.6
n/a
13.5
18.1
28.8
3.0
5.3
7.6
6.0
n/a
5.9
8.4
7.8
-
0.3
0.3
-
1.0
0.5
3.0
0.8
2.8
5.7
7.6
5.0
8.8
7.3
5.8
13.6
14.2
17.3
23.9
18.3
n/a
29.1
19.4
18.8
3.7
4.5
5.9
5.7
n/a
6.3
6.9
6.7
Hypertensive untreated
1998
2003
2008/2009
2010/2011
5.3
10.9
[9.4]
10.0
6.7
14.2
12.5
16.3
9.0
17.9
17.6
21.6
17.8
17.1
17.3
18.1
29.4
30.6
27.9
17.7
35.7
29.6
27.1
28.1
n/a
34.5
29.1
21.8
15.6
19.6
18.4
18.2
n/a
20.7
19.2
18.5
Total with hypertension
1998
2003
2008/2009
2010/2011
5.3
11.9
[9.4]
13.6
7.7
14.8
12.9
16.3
11.3
20.8
22.2
24.4
25.5
27.1
32.2
29.1
44.8
51.4
52.8
43.7
57.0
60.4
71.9
61.0
n/a
77.0
66.6
69.4
22.3
n/a
29.5
33.0
31.9
34.5
29.9
33.0
Continued…
Men
Normotensive
1998
2003
2008/2009
2010/2011
Hypertensive controlled
1998
2003
2008/2009
2010/2011
Hypertensive uncontrolled
1998
2003
2008/2009
2010/2011
256
Table 8.4
- Continued
Aged 16 and over and with a valid blood
pressure reading and data on medication
Blood pressure level
1998, 2003, 2008/2009 combined, 2010/2011 combined
Total
16+
Age
16-24
25-34
35-44
45-54
55-64
65-74
75+
Total
16-74
%
%
%
%
%
%
%
%
%
98.9
98.1
99.3
94.0
98.2
94.5
95.0
97.8
93.5
83.4
89.1
86.8
76.6
72.4
69.1
73.7
53.2
50.9
52.4
49.2
37.4
31.9
33.3
34.9
n/a
22.8
29.1
22.8
78.8
73.3
73.5
73.4
n/a
67.3
68.6
68.0
0.2
-
0.3
0.6
2.1
1.6
2.2
0.5
4.6
6.4
9.1
4.5
12.4
12.6
11.5
14.3
9.3
18.6
20.1
18.4
n/a
15.3
21.4
22.0
4.4
6.0
7.0
6.1
n/a
7.2
8.6
7.8
-
0.3
-
0.9
2.0
2.8
3.8
4.9
4.2
10.0
12.6
11.1
9.8
14.8
22.5
19.6
21.1
n/a
31.7
29.3
32.1
4.0
5.9
5.6
5.8
n/a
9.0
8.2
8.6
Hypertensive untreated
1998
2003
2008/2009
2010/2011
0.9
1.9
0.7
6.0
1.2
5.5
5.0
1.7
4.4
14.1
8.7
10.7
16.1
17.4
16.9
17.6
24.4
23.8
25.0
26.7
38.7
27.0
27.0
25.6
n/a
30.2
20.2
23.1
12.8
14.8
14.0
14.8
n/a
16.6
14.7
15.7
Total with hypertension
1998
2003
2008/2009
2010/2011
1.1
1.9
0.7
6.0
1.8
5.5
5.0
2.2
6.5
16.6
10.9
13.2
23.4
27.4
30.9
26.3
46.7
49.1
47.6
50.8
62.8
68.1
66.7
65.1
n/a
77.2
70.9
77.2
21.2
26.7
26.5
26.6
n/a
32.7
31.4
32.0
491
294
122
117
466
315
123
113
685
296
150
138
650
348
143
129
692
403
159
133
680
440
165
143
612
350
154
139
610
373
183
157
489
314
146
133
491
340
155
139
387
226
101
91
432
285
119
106
n/a
149
67
64
n/a
281
110
93
3356
1883
831
751
3329
2101
889
785
n/a
2032
899
815
n/a
2383
998
879
273
142
48
54
353
181
81
71
549
209
91
84
677
299
125
124
636
369
137
113
741
493
189
156
541
328
140
137
684
454
188
208
549
377
178
144
607
478
217
170
470
301
154
121
647
351
170
140
n/a
207
91
83
n/a
282
114
109
3018
1726
748
653
3709
2256
970
869
n/a
1933
839
736
n/a
2538
1084
978
Women
Normotensive
1998
2003
2008/2009
2010/2011
Hypertensive controlled
1998
2003
2008/2009
2010/2011
Hypertensive uncontrolled
1998
2003
2008/2009
2010/2011
Bases (weighted):
Men 1998
Men 2003
Men 2008/2009
Men 2010/2011
Women 1998
Women 2003
Women 2008/2009
Women 2010/2011
Bases (unweighted):
Men 1998
Men 2003
Men 2008/2009
Men 2010/2011
Women 1998
Women 2003
Women 2008/2009
Women 2010/2011
257
Table 8.5
Total cholesterol, 1995, 1998, 2003, 2008-2011 combined, by age and sex
Aged 16 and over and with a valid total
cholesterol measurement
Total cholesterol
1995, 1998, 2003, 2008-2011 combined
Total
16+
Age
16-24 25-34
35-44 45-54
55-64 65-74
75+
Total
16-64
%
%
%
%
%
%
%
%
%
1995
Mean
Standard error of the mean
10th percentile
90th percentile
% ≥5 mmol/l
4.4
0.03
3.4
5.5
26.4
5.4
0.04
4.2
6.7
65.3
5.9
0.04
4.5
7.4
81.4
6.1
0.04
4.8
7.6
86.9
6.1
0.05
4.8
7.5
86.1
-
-
5.6
0.02
4.2
7.3
69.8
n/a
n/a
n/a
n/a
n/a
1998
Mean
Standard error of the mean
10th percentile
90th percentile
% ≥5 mmol/l
4.3
0.04
3.4
5.4
21.8
5.1
0.04
3.9
6.2
53.0
5.6
0.04
4.3
7.1
69.7
5.9
0.05
4.6
7.3
82.1
5.8
0.06
4.4
7.0
76.0
5.6
0.05
4.3
6.7
71.5
-
5.4
0.02
3.9
6.8
62.0
n/a
n/a
n/a
n/a
n/a
2003
Mean
Standard error of the mean
10th percentile
90th percentile
% ≥5 mmol/l
4.3
0.09
3.3
5.6
21.7
5.2
0.08
3.9
6.5
58.7
5.6
0.06
4.4
6.9
71.5
5.9
0.06
4.7
7.2
82.6
5.7
0.07
4.2
7.1
75.4
5.5
0.08
4.0
6.9
67.1
5.1
0.08
3.8
6.6
55.5
5.4
0.04
3.9
6.9
63.3
5.4
0.04
3.9
6.9
63.2
2008-2011
Mean
Standard error of the mean
10th percentile
90th percentile
% ≥5 mmol/l
4.3
0.10
3.3
5.5
21.9
4.9
0.08
3.8
6.1
47.2
5.5
0.07
4.4
6.7
70.9
5.6
0.09
4.1
7.1
73.3
5.5
0.07
4.0
6.8
69.6
5.2
0.07
3.8
6.6
59.9
4.4
0.09
3.2
6.0
28.4
5.2
0.04
3.8
6.6
57.8
5.2
0.04
3.7
6.6
55.9
1995
Mean
Standard error of the mean
10th percentile
90th percentile
% ≥5 mmol/l
4.7
0.04
3.8
5.8
34.3
5.1
0.04
4.0
6.3
53.7
5.4
0.04
4.3
6.7
68.4
6.1
0.04
4.8
7.5
86.5
6.5
0.05
5.1
8.0
92.0
-
-
5.6
0.02
4.2
7.2
67.8
n/a
n/a
n/a
n/a
n/a
1998
Mean
Standard error of the mean
10th percentile
90th percentile
% ≥5 mmol/l
4.4
0.04
3.6
5.6
23.1
4.9
0.04
3.8
6.1
44.2
5.1
0.03
4.1
6.3
57.9
5.8
0.04
4.6
7.1
78.8
6.1
0.05
4.8
7.5
88.5
6.3
0.06
5.0
7.7
91.5
-
5.3
n/a
0.02
n/a
3.9
n/a
6.7
n/a
59.6
n/a
Continued…
Men
Women
258
Table 8.5
- Continued
Aged 16 and over and with a valid total
cholesterol measurement
Total Cholesterol
1995, 1998, 2003, 2008-2011 combined
Total
16+
Age
16-24 25-34
35-44 45-54
55-64 65-74
75+
Total
16-64
2003
Mean
Standard error of the mean
10th percentile
90th percentile
% ≥5 mmol/l
%
%
%
%
%
%
%
%
%
4.5
0.09
3.5
5.6
26.2
5.0
0.07
3.8
6.3
46.4
5.4
0.05
4.1
6.8
65.3
5.9
0.05
4.6
7.2
83.0
6.3
0.06
4.8
7.8
88.2
6.1
0.08
4.6
7.8
84.3
6.0
0.08
4.4
7.6
78.5
5.5
0.04
4.0
7.1
62.9
5.6
0.03
4.1
7.2
67.0
2008-2011
Mean
Standard error of the mean
10th percentile
90th percentile
% ≥5 mmol/l
4.5
0.09
3.5
5.6
24.8
4.8
0.08
3.7
6.1
42.7
5.2
0.06
4.2
6.4
59.3
5.7
0.05
4.6
6.9
79.8
6.0
0.06
4.6
7.5
84.0
5.7
0.08
4.2
7.2
67.8
5.5
0.10
3.9
7.1
64.3
5.3
0.04
3.9
6.8
59.9
5.4
0.03
4.0
6.8
61.3
540
445
285
220
435
375
274
217
801
613
311
244
696
588
336
239
721
670
386
256
712
620
411
285
628
588
339
280
643
588
348
296
494
460
292
243
500
438
302
251
n/a
342
208
162
n/a
375
244
192
n/a
n/a
133
111
n/a
n/a
235
171
3185
2776
1612
1243
2986
2610
1671
1288
n/a
n/a
1953
1517
n/a
n/a
2150
1651
342
244
123
93
338
277
129
106
676
497
211
148
811
599
251
204
671
601
380
242
804
670
455
317
584
509
345
274
673
650
435
350
558
511
367
300
674
545
426
339
n/a
408
281
232
n/a
572
294
257
n/a
n/a
178
137
n/a
n/a
223
170
2831
2362
1426
1057
3300
2741
1696
1316
n/a
n/a
1885
1426
n/a
n/a
2213
1743
Bases (weighted):
Men 1995
Men 1998
Men 2003
Men 2008-2011
Women 1995
Women 1998
Women 2003
Women 2008-2011
Bases (unweighted):
Men 1995
Men 1998
Men 2003
Men 2008-2011
Women 1995
Women 1998
Women 2003
Women 2008-2011
259
Table 8.6
HDL cholesterol and Total: HDL cholesterol ratio, 2003, 2008-2011 combined,
by age and sex
Aged 16 and over and with a valid HDL-cholesterol
measurement and a valid total cholesterol measurement
HDL-cholesterol (mmol/l)a
2003, 2008-2011 combined
Age
Total
16-24
25-34
35-44
45-54
55-64
65-74
75+
%
%
%
%
%
%
%
%
2003
HDL cholesterol
Mean
Standard error of the mean
10th percentile
90th percentile
% < 1mmol/l
1.3
0.04
0.9
1.7
10.6
1.3
0.02
1.0
1.6
7.1
1.3
0.02
1.0
1.8
8.4
1.4
0.02
1.1
1.8
5.7
1.4
0.02
1.0
1.8
7.4
1.4
0.02
1.0
1.9
8.5
1.4
0.03
1.0
1.8
6.2
1.3
0.01
1.0
1.8
7.7
Total: HDL cholesterol ratio
Mean
Standard error of the mean
3.5
0.08
4.1
0.08
4.4
0.07
4.4
0.06
4.4
0.06
4.2
0.06
3.8
0.08
4.2
0.03
2008-2011
HDL cholesterol
Mean
Standard error of the mean
10th percentile
90th percentile
% < 1mmol/l
1.3
0.04
0.9
1.6
12.2
1.3
0.02
1.0
1.6
6.9
1.3
0.02
0.9
1.7
10.9
1.3
0.02
0.9
1.7
14.9
1.4
0.02
0.9
1.9
10.5
1.4
0.03
1.0
1.8
7.7
1.3
0.03
0.9
1.7
11.1
1.3
0.01
0.9
1.7
10.8
Total: HDL cholesterol ratio
Mean
Standard error of the mean
3.5
0.11
4.0
0.10
4.5
0.10
4.7
0.10
4.2
0.08
4.0
0.09
3.5
0.08
4.1
0.04
2003
HDL cholesterol
Mean
Standard error of the mean
10th percentile
90th percentile
% < 1mmol/l
1.5
0.03
1.1
1.9
3.3
1.6
0.03
1.1
2.0
3.5
1.6
0.02
1.2
2.0
1.2
1.7
0.02
1.2
2.2
1.5
1.6
0.02
1.2
2.2
1.6
1.6
0.02
1.2
2.1
0.4
1.6
0.03
1.1
2.1
2.6
1.6
0.01
1.1
2.1
2.0
Total: HDL cholesterol ratio
Mean
Standard error of the mean
3.2
0.07
3.3
0.07
3.6
0.05
3.7
0.06
4.0
0.06
3.9
0.06
3.8
0.07
3.6
0.03
2008-2011
HDL cholesterol
Mean
Standard error of the mean
10th percentile
90th percentile
% < 1mmol/l
1.5
0.03
1.1
1.8
3.1
1.5
0.03
1.0
1.9
3.0
1.5
0.03
1.1
2.1
3.2
1.6
0.02
1.1
2.2
2.7
1.6
0.03
1.1
2.1
3.2
1.6
0.03
1.1
2.1
3.3
1.6
0.03
1.2
2.2
3.0
1.6
0.01
1.1
2.1
3.1
Total: HDL cholesterol ratio
Mean
Standard error of the mean
3.1
0.08
3.4
0.09
3.6
0.06
3.7
0.06
4.0
0.07
3.7
0.07
3.5
3.6
0.08
0.03
Continued…
Men
Women
260
Table 8.6
- Continued
Aged 16 and over and with a valid HDL-cholesterol
measurement and a valid total cholesterol measurement
HDL-cholesterol (mmol/l)a
2003, 2008-2011 combined
Age
16-24
Bases (weighted):
Men 2003
285
Men 2008-2011
220
Women 2003
274
Women 2008-2011
217
Bases (unweighted):
Men 2003
123
Men 2008-2011
93
Women 2003
129
Women 2008-2011
106
a Including those taking lipid lowering drugs
Total
25-34
35-44
45-54
55-64
65-74
75+
311
244
336
239
386
256
411
285
339
280
348
296
292
243
302
251
208
162
244
192
133
111
235
171
1954
1517
2150
1651
211
148
251
204
381
242
455
317
345
274
435
350
367
300
426
339
281
232
294
257
178
137
223
170
1886
1426
2213
1743
261
Table 8.7
Fibrinogen 1998, 2003 and 2008-2011 combined, by age and sex
Aged 16 and over and with a valid fibrinogen measurement
Fibrinogen (g/l)
1998, 2003, 2008-2011 combined
Total
16+
Age
16-24 25-34
35-44 45-54
55-64 65-74
75+
Total
16-74
%
%
%
%
%
%
%
%
%
1998
Mean
Standard error of the mean
2.2
0.03
2.4
0.02
2.5
0.02
2.7
0.03
2.9
0.04
3.1
0.05
n/a
n/a
2.6
0.01
n/a
n/a
2003
Mean
Standard error of the mean
2.4
0.07
2.6
0.04
2.8
0.05
2.9
0.04
3.1
0.05
3.3
0.07
3.5
0.09
2.7
0.03
2.8
0.03
2008-2011
Mean
Standard error of the mean
2.7
0.06
2.7
0.04
2.9
0.04
3.1
0.05
3.1
0.04
3.2
0.06
3.3
0.08
2.9
0.02
2.9
0.02
1998
Mean
Standard error of the mean
2.6
0.04
2.6
0.03
2.7
0.03
2.8
0.03
3.1
0.04
3.2
0.04
n/a
n/a
2.8
0.01
n/a
n/a
2003
Mean
Standard error of the mean
2.7
0.06
2.9
0.05
3.0
0.04
3.1
0.04
3.3
0.04
3.4
0.05
3.7
0.08
3.0
0.02
3.1
0.02
2008-2011
Mean
Standard error of the mean
2.9
0.06
3.0
0.04
3.0
0.03
3.2
0.04
3.2
0.04
3.2
0.05
3.3
0.06
3.1
0.02
3.1
0.02
425
283
216
352
276
211
596
296
233
570
316
232
632
358
243
581
372
266
523
299
233
537
309
253
382
214
173
366
234
192
257
129
87
296
154
101
n/a
85
45
n/a
150
95
2814
1450
1184
2703
1508
1255
n/a
1664
1230
n/a
1812
1351
233
121
92
258
128
102
485
199
140
581
239
197
567
356
228
638
412
295
458
306
232
593
388
301
422
271
207
455
330
260
315
180
121
455
189
135
n/a
115
58
n/a
144
95
2480
1253
1020
2980
1497
1290
n/a
1548
1078
n/a
1830
1385
Men
Women
Bases (weighted):
Men 1998
Men 2003
Men 2008-2011
Women 1998
Women 2003
Women 2008-2011
Bases (unweighted):
Men 1998
Men 2003
Men 2008-2011
Women 1998
Women 2003
Women 2008-2011
262
Table 8.8
C-reactive protein 1998, 2003 and 2008-2011 combined, by age and sex
Aged 16 and over and with a valid C-reactive protein measurement
C-reactive protein mg/l
1998, 2003, 2008-2011 combined
Total
16+
Age
16-24 25-34 35-44
45-54 55-64 65-74
75+
Total
16-74
%
%
%
%
%
%
%
%
%
1998
Mean
Standard error of the mean
a
% in bottom quintile (≤ 0.40)
% in second quintile (0.41-0.90)
% in middle quintile (0.91-1.70)
% in fourth quintile (1.71-3.50)
% in top quintile (≥ 3.51)
1.4
0.17
44.8
27.3
10.7
8.5
8.7
2.1
0.17
25.9
25.9
18.8
16.1
13.4
2.4
0.21
21.6
21.2
22.1
17.3
17.8
2.6
0.18
13.3
24.3
21.5
24.4
16.4
4.0
0.25
7.8
15.7
17.3
26.9
32.3
5.2
0.45
7.8
14.8
16.8
22.5
38.0
n/a
n/a
n/a
n/a
n/a
n/a
n/a
2.8
0.10
20.7
22.1
18.4
19.1
19.7
n/a
n/a
n/a
n/a
n/a
n/a
n/a
2003
Mean
Standard error of the mean
% in bottom quintile (≤ 0.40)a
% in second quintile (0.41-0.90)
% in middle quintile (0.91-1.70)
% in fourth quintile (1.71-3.50)
% in top quintile (≥ 3.51)
2.5
0.63
47.9
13.3
14.7
13.0
11.1
2.1
0.30
36.5
25.1
12.5
12.9
13.0
2.8
0.36
20.7
21.2
23.5
19.5
15.2
2.9
0.22
16.2
20.1
22.2
18.1
23.3
3.4
0.37
15.4
16.1
21.0
23.5
24.0
4.6
0.51
10.9
10.8
20.7
26.6
31.0
5.3
0.69
n/a
n/a
n/a
n/a
n/a
2.9
0.16
24.9
18.4
19.3
18.5
18.9
3.1
0.16
n/a
n/a
n/a
n/a
n/a
2008-2011
Mean
Standard error of the mean
a
% in bottom quintile (≤ 0.40)
% in second quintile (0.41-0.90)
% in middle quintile (0.91-1.70)
% in fourth quintile (1.71-3.50)
% in top quintile (≥ 3.51)
2.4
0.66
46.9
14.0
13.0
15.7
10.5
1.5
0.22
40.0
17.6
21.5
11.5
9.4
2.5
0.31
25.2
21.7
19.1
18.6
15.4
3.6
0.41
19.1
15.0
23.1
19.9
23.0
2.9
0.25
15.3
19.9
25.1
19.8
19.9
4.0
0.47
14.8
18.0
18.8
23.9
24.5
4.1
0.57
n/a
n/a
n/a
n/a
n/a
2.8
0.16
27.0
17.7
20.3
18.0
16.9
2.9
0.16
n/a
n/a
n/a
n/a
n/a
1998
Mean
Standard error of the mean
% in bottom quintile (≤ 0.40)a
% in second quintile (0.41-0.90)
% in middle quintile (0.91-1.70)
% in fourth quintile (1.71-3.50)
% in top quintile (≥ 3.51)
2.9
0.36
39.5
16.6
19.0
11.3
13.7
3.1
0.29
28.2
19.6
15.0
21.3
15.7
2.7
0.21
29.1
22.6
17.6
15.7
15.0
3.6
0.27
20.7
21.6
17.5
20.1
20.2
4.3
0.32
12.3
16.1
20.4
24.9
26.2
5.6
0.50
8.2
12.0
20.6
26.0
33.3
n/a
n/a
n/a
n/a
n/a
n/a
n/a
3.6
0.13
23.5
18.8
18.0
19.8
20.0
n/a
n/a
n/a
n/a
n/a
n/a
n/a
2003
Mean
Standard error of the mean
a
% in bottom quintile (≤ 0.40)
% in second quintile (0.41-0.90)
% in middle quintile (0.91-1.70)
% in fourth quintile (1.71-3.50)
% in top quintile (≥ 3.51)
2.2
0.31
37.8
14.9
22.7
12.3
12.4
3.1
0.45
25.2
20.9
24.1
16.5
13.3
3.6
0.33
25.6
18.7
21.8
13.7
20.1
3.7
0.46
21.2
19.2
22.7
18.6
18.3
4.9
0.47
10.6
16.0
23.2
22.9
27.4
5.7
0.54
7.8
14.6
22.0
21.7
33.8
6.6
0.93
n/a
n/a
n/a
n/a
n/a
Men
Women
263
3.8
4.1
0.18
0.19
21.9
n/a
17.7
n/a
22.7
n/a
17.4
n/a
20.4
n/a
Continued…
Table 8.8
- Continued
Aged 16 and over and with a valid C-reactive protein
measurement
C-reactive protein mg/l
1998, 2003, 2008-2011 combined
Total
16+
Age
16-24 25-34 35-44
2008-2011
Mean
Standard error of the mean
a
% in bottom quintile (≤ 0.40)
% in second quintile (0.41-0.90)
% in middle quintile (0.91-1.70)
% in fourth quintile (1.71-3.50)
% in top quintile (≥ 3.51)
45-54 55-64 65-74
75+
Total
16-74
%
%
%
%
%
%
%
%
%
2.6
0.38
36.0
16.0
17.5
17.1
13.5
3.5
0.58
27.1
19.7
21.1
14.8
17.3
2.8
0.27
23.1
21.0
25.1
17.0
13.8
3.1
0.24
18.0
21.0
22.5
20.1
18.4
4.0
0.34
11.7
19.4
26.4
21.1
21.3
4.0
0.51
12.7
17.7
28.5
21.4
19.8
4.1
0.44
n/a
n/a
n/a
n/a
n/a
3.3
0.16
21.4
19.3
23.5
18.5
17.3
3.4
0.15
n/a
n/a
n/a
n/a
n/a
324
208
162
370
243
192
n/a
133
111
n/a
231
171
3044
1816
1406
2926
1905
1485
n/a
1949
1517
n/a
2137
1655
397
280
232
563
292
257
n/a
178
137
n/a
220
170
2720
1704
1289
3268
1978
1575
n/a
1882
1426
n/a
2198
1745
Bases (weighted):
Men 1998
439
607
649
573
452
Men 2003
285
311
386
339
288
Men 2008-2011
220
244
256
280
243
Women 1998
369
579
603
572
434
Women 2003
274
334
410
345
299
Women 2008-2011
219
239
285
298
251
Bases (unweighted):
Men 1998
242
495
590
498
498
Men 2003
123
211
381
345
364
Men 2008-2011
93
148
242
274
300
Women 1998
272
593
661
643
536
Women 2003
129
250
454
432
421
Women 2008-2011
107
204
317
351
339
a Quintiles are calculated for ‘total men’ and ‘total women’ separately.
264
Glossary
Appendix A
APPENDIX A: GLOSSARY
This glossary explains terms used in the report, other than those fully described in
particular chapters.
Age
standardisation
Age standardisation has been used in order to enable groups
to be compared after adjusting for the effects of any differences
in their age distributions.
When different sub-groups are compared in respect of a
variable on which age has an important influence, any
differences in age distributions between these sub-groups are
likely to affect the observed differences in the proportions of
interest.
Age standardisation was carried out, using the direct
standardisation method. The standard population to which the
age distribution of sub-groups was adjusted was the mid-2011
population estimates for Scotland. All age standardisation has
been undertaken separately within each sex.
The age-standardised proportion p was calculated as follows,
where pi is the age specific proportion in age group i and N i
is the standard population size in age group i:
p =
i
N i pi
i Ni
Therefore p can be viewed as a weighted mean of pi using
the weights N i . Age standardisation was carried out using the
age groups: 16-24, 25-34, 35-44, 45-54, 55-64, 65-74 and 75
and over. The variance of the standardised proportion can be
estimated by:
var(p ) =
i
( N i2 pi qi / ni )
2
( i Ni )
where qi = 1 - pi .
Anthropometric
measurements
See Body mass index (BMI) and Waist-hip ratio
Arithmetic mean
See Mean
266
Blood analytes
See Cholesterol (total and HDL), Fibrinogen, C-reactive
protein, Glycated Haemoglobin, vitamin D.
Blood pressure
Systolic (SBP) and diastolic (DBP) blood pressure were
measured using a standard method (see Volume 3, Appendix B
for measurement protocol). In adults, high blood pressure is
defined as SBP 140 mmHg or DBP 90 mmHg or on
antihypertensive drugs.
Body mass index
Weight in kg divided by the square of height in metres. Adults
(aged 16 and over) can be classified into the following BMI
groups:
2
BMI (kg/m )
Less than 18.5
18.5 to less than 25
25 to less than 30
30 to less than 40
40 and above
Cardiovascular
Disease
Cholesterol
(Total and HDL)
Description
Underweight
Normal
Overweight
Obese
Morbidly obese
Participants were classified as having cardiovascular disease
(CVD) if they reported ever having any of the following
conditions diagnosed by a doctor: angina, heart attack, stroke,
heart murmur, irregular heart rhythm, ‘other heart trouble’. For
the purpose of this report, participants were classified as
having a particular condition only if they reported that the
diagnosis was confirmed by a doctor. No attempt was made to
assess these self-reported diagnoses objectively. There is
therefore the possibility that some misclassification may have
occurred, because some participants may not have
remembered (or not remembered correctly) the diagnosis made
by their doctor.
Cholesterol is a fat-like substance (lipid) that is present in cell
membranes and is a precursor of bile acids and steroid
hormones. Cholesterol is essential for the body in small
amounts. It is made in the liver and some is obtained from the
diet. Serum total cholesterol concentration is positively
associated with the risk of coronary heart disease (CHD).
In this study, raised total cholesterol has been defined as > 5.0
mmol/l.
In a normal individual, high density lipoprotein (HDL)
constitutes approximately 20-30% of total plasma cholesterol.
Studies have demonstrated a strong direct relationship
between coronary heart disease and low HDL-cholesterol.
267
HDL-cholesterol was considered low at a level of less than 1.0
mmol/l.
Cotinine
Cotinine is a metabolite of nicotine. It is one of several
biological markers that are indicators of smoking. In this
survey, it was measured in saliva. It has a half-life in the body
of between 16 and 20 hours, which means that it will detect
regular smoking (or other tobacco use such as chewing) but
may not detect occasional use if the last occasion was several
days ago. In this report, anyone with a salivary cotinine level of
12 nanograms per millilitre or more was judged highly likely to
be a tobacco user. In previous reports the threshold for
detecting tobacco use was set 15 nanograms per millilitre or
more of cotinine. Chapter 4 in this report explains the
reasoning for the threshold change. Saliva samples were
collected during the nurse visit.
C-reactive protein C-reactive protein is the major protein indicating inflammation
activity in acute illness in humans. It is also a marker of
cardiovascular risk.
Creatinine
This is excreted in urine and unlike sodium and potassium is
relatively stable over time. Therefore in the analysis of urinary
salt, the ratio of sodium to creatinine and of potassium to
creatinine are analysed as proxy measures for dietary sodium
and potassium. See also Urine, Sodium, Potassium.
Demi-span
Demi-span is an alternative to height as a measure of skeletal
size in older people. It is defined as the distance between the
mid-point of the sternal notch and the finger roots with the arm
outstretched laterally. Demi-span measurements were collected
for those aged 65 or over at the stage 2 nurse visit.
Diastolic blood
When measuring blood pressure the diastolic arterial pressure
is the lowest pressure at the resting phase of the cardiac cycle.
See also Blood pressure, Systolic blood pressure.
Equivalised
Household income Making precise estimates of household income, as is done for
example in the Family Resources Survey, requires far more
interview time than was available in the Health Survey.
Household income was thus established by means of a card
(see Volume 3, Appendix A) on which banded incomes were
presented. Information was obtained from the household
reference person (HRP) or their partner. Initially they were
asked to state their own (HRP and partner) aggregate gross
income, and were then asked to estimate the total household
income including that of any other persons in the household.
Household income can be used as an analysis variable, but
268
there has been increasing interest recently in using measures
of equivalised income that adjust income to take account of the
number of persons in the household. Methods of doing this
vary in detail: the starting point is usually an exact estimate of
net income, rather than the banded estimate of gross income
obtained in the Health Survey. The method used in the present
report was as follows. It utilises the widely used McClements
scoring system, described below.
1.
A score was allocated to each household member, and
these were added together to produce an overall household
McClements score. Household members were given scores as
follows.
First adult (HRP)
Spouse/partner of HRP
Other second adult
Third adult
Subsequent adults
Dependant aged 0-1
Dependant aged 2-4
Dependant aged 5-7
Dependant aged 8-10
Dependant aged 11-12
Dependant aged 13-15
Dependant aged 16+
0.61
0.39
0.42
0.36
0.09
0.18
0.21
0.23
0.25
0.27
0.36
0.46
2
The equivalised income was derived as the annual
household income divided by the McClements score.
3
This equivalised annual household income was attributed
to all members of the household, including children.
4
Households were ranked by equivalised income, and
quintiles q1- q5 were identified. Because income was obtained
in banded form, there were clumps of households with the
same income spanning the quintiles. It was decided not to split
clumps but to define the quintiles as ‘households with
equivalised income up to q1’, ‘over q1 up to q2’ etc.
5
All individuals in each household were allocated to the
equivalised household income quintile to which their household
had been allocated. Insofar as the mean number of persons per
household may vary between tertiles, the numbers in the
quintiles will be unequal. Inequalities in numbers are also
introduced by the clumping referred to above, and by the fact
that in any sub-group analysed the proportionate distribution
across quintiles will differ from that of the total sample.
Reference: McClements, D. (1977). Equivalence scales for
children. Journal of Public Economics. 8: 191-210.
269
Fibrinogen
Fibrinogen is a soluble protein involved in the blood clotting
mechanism. Prospective population studies have established
that fibrinogen is an independent predictor for ischaemic heart
disease and stroke.
Reference: Maresca, G., Di Blasio, A., Marchioli, R. and Di
Minno, G. (1999). Measuring plasma fibrinogen to predict
stroke and myocardial infarction. Arteriosclerosis, Thrombosis
and Vascular Biology. 19:1368-1377.
Frankfort plane
The Frankfort Plane is an imaginary line passing through the
external ear canal and across the top of the lower bone of the
eye socket, immediately under the eye. Informants’ heads are
positioned with the Frankfort Plane in a horizontal position
when height is measured using a stadiometer as a means of
ensuring that, as far as possible, the measurements taken are
standardised.
Geometric mean
The geometric mean is a measure of central tendency. It is
sometimes preferable to the arithmetic mean, since it takes
account of positive skewness in a distribution. An arithmetic
mean is calculated by summing the values for all cases and
dividing by the number of cases in the set. The geometric mean
is instead calculated by multiplying the values for all cases and
taking the nth root, where n is the number of cases in the set.
For example, a dataset with two cases would use the square
root, for three cases the cube root would be used, and so on.
The geometric mean of 2 and 10 is 4.5 (2x10= 20, 20=4.5).
Geometric means can only be calculated for positive numbers
so zero values need to be handled before geometric means are
calculated. See also Arithmetic mean.
GHQ12
The General Health Questionnaire (GHQ12) is a scale
designed to detect possible psychiatric morbidity in the general
population. It was administered to informants aged 13 and
above. The questionnaire contains 12 questions about the
informant’s general level of happiness, depression, anxiety and
sleep disturbance over the past four weeks. Responses to
these items are scored, with one point given each time a
particular feeling or type of behaviour was reported to have
been experienced ‘more than usual’ or ‘much more than usual’
over the past few weeks. These scores are combined to create
an overall score of between zero and twelve. A score of four or
more (referred to as a ‘high’ GHQ12 score) has been used in
this report to indicate the presence of a possible psychiatric
disorder.
Reference: Goldberg D, Williams PA. User’s Guide to the
General Health Questionnaire. NFER-NELSON, 1988.
270
Glycated
Haemoglobin
The percentage of glycated haemoglobin is the percentage of
haemoglobin in the circulation to which glucose is bound.
Glycated haemoglobin (HbA1c) concentration is an indicator of
average blood glucose concentration over three months and
has been suggested as a diagnostic or screening tool for
diabetes. Diabetic patients with elevated glycated haemoglobin
are at increased risk of microvascular and macrovascular
events. In this report, a glycated haemoglobin value of 6.5% or
above in people with no existing diabetes diagnosis was taken
to indicate possible undiagnosed diabetes.
HDL-Cholesterol
See Cholesterol
High blood
pressure
See Blood pressure
Household
A household was defined as one person or a group of people
who have the accommodation as their only or main residence
and who either share at least one meal a day or share the
living accommodation.
Household
Reference Person The household reference person (HRP) is defined as the
householder (a person in whose name the property is owned or
rented) with the highest income. If there is more than one
householder and they have equal income, then the household
reference person is the oldest.
Income
Ischaemic
heart disease
See Equivalised household income
Participants were classified as having ischaemic heart disease
(IHD) if they reported ever having angina or a heart attack
diagnosed by a doctor.
Logistic regression Logistic regression was used to investigate the effect of two or
more independent or predictor variables on a two-category
(binary) outcome variable. The independent variables can be
continuous or categorical (grouped) variables. The parameter
estimates from a logistic regression model for each
independent variable give an estimate of the effect of that
variable on the outcome variable, adjusted for all other
independent variables in the model.
Logistic regression models the log ‘odds’ of a binary outcome
variable. The ‘odds’ of an outcome is the ratio of the probability
of it occurring to the probability of it not occurring. The
271
parameter estimates obtained from a logistic regression model
have been presented as odds ratios for ease of interpretation.
For continuous independent variables, the odds ratio gives the
change in the odds of the outcome occurring for a one unit
change in the value of the predictor variable.
For categorical independent variables one category of the
categorical variable has been selected as a baseline or
reference category, with all other categories compared to it.
Therefore there is no parameter estimate for the reference
category and odds ratios for all other categories are the ratio of
the odds of the outcome occurring between each category and
the reference category, adjusted for all other variables in the
model.
The statistical significance of independent variables in models
was assessed by the likelihood ratio test and its associated p
value. 95% confidence intervals were also calculated for the
odds ratios. These can be interpreted as meaning that there is
a 95% chance that the given interval for the sample will contain
the true population parameter of interest. In logistic regression
a 95% confidence interval which does not include 1.0 indicates
the given parameter estimate is statistically significant.
Reference: Hosmer, D.W. Jr. and Lemeshow. S. (1989).
Applied logistic regression. New York: John Wiley & Sons.
Long-term conditions &
limiting long-term
conditions
Long-term conditions were defined as a long-standing physical
or mental condition or disability that has troubled the participant
for at least 12 months, or that is likely to affect them for at least
12 months. Note that prior to 2008 these were described as
long-standing illnesses. Long-term conditions were coded into
categories defined in the International Classification of
Diseases (ICD), but it should be noted that the ICD is used
mostly to classify conditions according to the cause, whereas
SHeS classifies according to the reported symptoms. A longterm condition was defined as limiting if the respondent
reported that it limited their activities in any way.
Mean
Means in this report are Arithmetic means (the sum of the
values for cases divided by the number of cases).
Median
The value of a distribution which divides it into two equal parts
such that half the cases have values below the median and half
the cases have values above the median.
Morbid obesity
See Body mass index.
272
NHS Health Board The National Health Service (NHS) in Scotland is divided up
into 14 geographically-based local NHS Boards and a number
of National Special Health Boards. Health Boards in this report
refers to the 14 local NHS Boards. (See Volume 3: Appendix C)
NS-SEC
The National Statistics Socio-economic Classification (NSSEC) is a social classification system that attempts to classify
groups on the basis of employment relations, based on
characteristics such as career prospects, autonomy, mode of
payment and period of notice. There are fourteen operational
categories representing different groups of occupations (for
example higher and lower managerial, higher and lower
professional) and a further three ‘residual’ categories for fulltime students, occupations that cannot be classified due to lack
of information or other reasons. The operational categories
may be collapsed to form a nine, eight, five or three category
system. This report mostly uses the five category system in
which participants are classified as managerial and
professional, intermediate, small employers and own account
workers, lower supervisory and technical, and semi-routine and
routine occupations. In some instances where there were
insufficient numbers to use the five category classification, the
three category system was used instead. In analyses presented
in this report it is the NS-SEC of the household reference
person which is used. NS-SEC was introduced in 2001 and
replaced Registrar General’s Social Class (which had been
used in the 1995 and 1998 surveys) as the main measure of
socio-economic status.
Obesity
See Body mass index
Odds ratio
See Logistic regression
Overweight
See Body mass index
Percentile
The value of a distribution which partitions the cases into
groups of a specified size. For example, the 20th percentile is
the value of the distribution where 20 percent of the cases have
values below the 20th percentile and 80 percent have values
above it. The 50th percentile is the median.
PEF
Peak Expiratory Flow: the maximal flow in litres per minute
recorded during a forced expiration. In healthy subjects this
index reflects the calibre of central airways and the force
exerted by the expiratory muscles.
Potassium
The intake of potassium (K) can be estimated by measuring
urinary excretion. This is collected in the nurse visit using a
273
spot urine sample. See also Urine, Sodium, Creatinine. There
is an inverse association between potassium intake and blood
pressure.
p value
A p value is the probability of the observed result occurring due
to chance alone. A p value of less than 5% is conventionally
taken to indicate a statistically significant result (p<0.05). It
should be noted that the p value is dependent on the sample
size, so that with large samples differences or associations
which are very small may still be statistically significant. Results
should therefore be assessed on the magnitude of the
differences or associations as well as on the p value itself. The
p values given in this report take into account the clustered
sampling design of the survey.
Quintile
Quintiles are percentiles which divide a distribution into fifths,
i.e., the 20th, 40th, 60th and 80th percentiles.
Scottish Index
of Multiple
Deprivation
The Scottish Index of Multiple Deprivation (SIMD) is the
Scottish Government’s official measure of area based multiple
deprivation. It is based on 37 indicators across 7 individual
domains of current income, employment, housing, health,
education, skills and training and geographic access to
services and telecommunications. SIMD is calculated at data
zone level, enabling small pockets of deprivation to be
identified. The data zones are ranked from most deprived (1) to
least deprived (6505) on the overall SIMD index. The result is a
comprehensive picture of relative area deprivation across
Scotland.
This report uses the SIMD 2009.
http://www.scotland.gov.uk/Topics/Statistics/SIMD
Sodium
The intake of sodium (Na) can be estimated by measuring
urinary excretion. This was collected in the nurse visit using a
spot urine sample. There is an association between sodium
intake and blood pressure. See also Urine, Potassium,
Creatinine.
274
Standard deviation The standard deviation is a measure of the extent to which the
values within a set of data are dispersed from, or close to, the
mean value. In a normally distributed set of data 68% of the
cases will lie within one standard deviation of the mean, 95%
within two standard deviations and 99% will be within 3
standard deviations. For example, for a mean value of 50 with a
standard deviation of 5, 95% of values will lie within the range
40-60.
Standard error
The standard error is a variance estimate that measures the
amount of uncertainty (as a result of sampling error) associated
with a survey statistic. All data presented in this report in the
form of means are presented with their associated standard
errors (with the exception of the WEMWBS scores which are
also presented with their standard deviations). Confidence
intervals are calculated from the standard error; therefore the
larger the standard error, the wider the confidence interval will
be.
Standardisation
In this report, standardisation refers to standardisation (or
‘adjustment’) by age (see Age standardisation).
Systolic blood
When measuring blood pressure, the systolic arterial pressure
is pressure defined as the peak pressure in the arteries, which
occurs near the beginning of the cardiac cycle. See also Blood
pressure, Diastolic blood pressure.
Unit of alcohol
Alcohol consumption is reported in terms of units of alcohol. A
unit of alcohol is 8 gms or 10ml of ethanol (pure alcohol). See
Chapter 3 of volume 1 of this Report for a full explanation of
how reported volumes of different alcoholic drinks were
converted into units. The method for doing this has undergone
significant change since the report of the 2003 SHeS was
published, these are also detailed in Chapter 3.
Urine analysis
A spot urine sample was collected from participants in the
nurse visit. This was used for the analysis of dietary Sodium,
Potassium and Creatinine. Epidemiological, clinical and
animal-experimental evidence shows a direct relationship
between dietary electrolyte consumption and blood pressure
(BP).
275
Vitamin D
WaistCircumference
Vitamin D is a fat-soluble vitamin. It is mainly produced in the
skin in response to sunlight, but is also available from dietary
sources and supplements. Vitamin D deficiency causes the
bone diseases rickets and osteomalacia. The blood samples
were tested for 25 hydroxy-vitamin D (25(OH)D) and were
commissioned by the Food Standards Agency in Scotland and
the Scottish Government Directorate for Chief Medical Officer,
Public Health and Sport.
Waist circumference is a measure of deposition of abdominal
fat. It was measured during the nurse visit. A raised waist
circumference has been defined as more than 102cm in men
and more than 88cm in women.
Waist-hip ratio
Waist-hip ratio (WHR) was defined as the waist circumference
divided by the hip circumference, i.e. waist girth (m)/ hip girth
(m). WHR is a measure of deposition abdominal fat. Unlike BMI
there is no consensus to define cut-off point for WHR. For
consistency the cut-off values as in the 1995, 1998 and 2003
reports have been used. A raised WHR has been taken to be
0.95 or more in men and 0.85 or more in women.
Reference: Molarius A, Seidell JC. Selection of anthropometric
indicators for classification of abdominal fatness - a critical
review. Int J Obes 1998; 22:719-727
WEMWBS
The Warwick-Edinburgh Mental Well-being Scale (WEMWBS)
was developed by researchers at the Universities of Warwick
and Edinburgh, with funding provided by NHS Health Scotland,
to enable the measurement of mental well-being of adults in the
UK. It was adapted from a 40 item scale originally developed in
New Zealand, the Affectometer 2. The WEMWBS scale
comprises 14 positively worded statements with a five item
scale ranging from ‘1 - None of the time’ to ‘5 - All of the time’.
The lowest score possible is therefore 14 and the highest is 70.
The 14 items are designed to assess positive affect (optimism,
cheerfulness, relaxation); and satisfying interpersonal
relationships and positive functioning (energy, clear thinking,
self-acceptance, personal development, mastery and
autonomy).
References:
Kammann, R. and Flett, R. (1983). Sourcebook for measuring
well-being with Affectometer 2. Dunedin, New Zealand: Why
Not? Foundation.
The briefing paper on the development of WEMWBS is
available online from: <www.wellscotland.info/indicators.html>
276
A NATIONAL STATISTICS PUBLICATION FOR SCOTLAND
The United Kingdom Statistics Authority has designated these statistics as National Statistics, in
accordance with the Statistics and Registration Service Act 2007 and signifying compliance with the
Code of Practice for Official Statistics.
Designation can be broadly interpreted to mean that the statistics:
• meet identified user needs;
• are well explained and readily accessible;
• are produced according to sound methods, and
• are managed impartially and objectively in the public interest.
Once statistics have been designated as National Statistics it is a statutory requirement that the Code of
Practice shall continue to be observed.
Further information about Official and National Statistics can be found on the UK Statistics Authority
website at www.statisticsauthority.gov.uk
SCOTTISH GOVERNMENT STATISTICIAN GROUP
Our Aim
To provide relevant and reliable information, analysis and advice that meet the needs of government,
business and the people of Scotland.
For more information on the Statistician Group, please see the Scottish Government website at
www.scotland.gov.uk/statistics
Correspondence and enquiries
Enquiries on this publication should be
addressed to:
Scottish Health Survey Team
Health Analytical Services Division
Scottish Government
B-R St Andrew’s House
Edinburgh EH1 3DG
Telephone: 0131 244 2368
Fax: 0131 244 5412
e-mail: [email protected]
General enquiries on Scottish Government
statistics can be addressed to:
Office of the Chief Statistician
Scottish Government
4N.06, St Andrews House
EDINBURGH EH1 3DG
Telephone: (0131) 244 0442
e-mail: [email protected]
Further contact details, e-mail addresses and details of previous and forthcoming publications can be
found on the Scottish Government Website at www.scotland.gov.uk/statistics
Complaints and suggestions
If you are not satisfied with our service, please write to the Chief Statistician, 4N.06, St Andrews House,
Edinburgh, EH1 3DG, Telephone: (0131) 244 0302, e-mail [email protected].
We also welcome any comments or suggestions that would help us to improve our standards of service.
ScotStat
If you would like to be consulted about new or existing statistical collections or receive notification of
forthcoming statistical publications, please register your interest on the Scottish Government ScotStat
website at www.scotland.gov.uk/scotstat
Scottish Health Survey (Print) ISSN 2042-1605
Scottish Health Survey (Online) ISSN 2042-1613
ISBN 978-1-78045-841-0
Crown Copyright
Brief extracts from the Crown Copyright material in this publication may be reproduced provided the
source is fully acknowledged.
277
© Crown Copyright 2012
ISBN: 978-1-78045-841-0
This document is also available on the Scottish Government
website: www.scotland.gov.uk
Further copies are available from
Scottish Health Survey Team
The Scottish Government
Basement Rear
St Andrew’s House
Regent Road
Edinburgh
EH1 3DG
Telephone: 0131 244 2368
Fax: 0131 244 2371
Email: [email protected]
APS Group Scotland
DPPAS13020 (09/12)
w
w
w
.
s
c
o
t
l
a
n
d
.
g
o
v
.
u
k


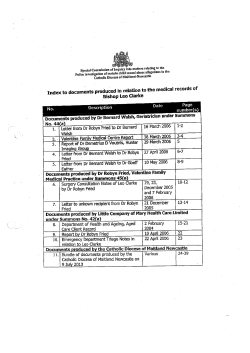
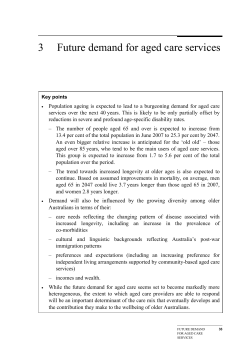


© Copyright 2026