
Chapter 4 RISK QUANTIFICATION
Chapter 4 RISK QUANTIFICATION © M. Ragheb 2/11/2015 “Absence of evidence is not evidence of absence.” “There are three classes of people. Those who see. Those who see when they are shown. Those who do not see.” Leonardo Da Vinci, 1400s “But little Mouse, you are not alone, In proving foresight may be vain: The best laid schemes of mice and men Go often awry, And leave us nothing but grief and pain, For promised joy!” To a Mouse, on Turning Her up in Her Nest with the Plough, Robert Burns, 1785 4.1 INTRODUCTION Probabilistic Risk Assessment, also designated as PRA, is a formal analytical method used for the protection of the public’s health and safety. Its goal is the development of methods for predicting or “anticipating” safety concerns before they become manifest through the possible processes of: 1. Loss, 2. Injury, 3. Death. Probabilistic Risk management, on the other hand, is not about enhancing success; it is about avoiding the failures that are unacceptable. Risk is calculated using mathematical representations and building models. In this context one must distinguish between: a) Calculated risk, b) Perceived risk. Accidents are the leading cause of death for people in the age group 1-41 years in the USA, and they are the fifth leading cause of death overall. One person dies every 5 minutes as the result of an accident. One death occurs every 11 minutes as a result of a motor vehicle accident; half of them as a result of driving under the influence of alcohol or drugs. Accidents claim the lives of 13 people every hour on every day of the year, and one out of every 10 fatal accidents occurs on the job. 4.2 QUANTIFIED RISK It is not sufficient to describe risk in terms of smart sayings like the one advanced by financier Warren Buffet: “Risk is not knowing what you are doing.” A quantification of the level of risk is necessary for objective decision making. Risk is related to the following concepts of: 1. Safety, 2. Danger, 3. Hazard, 4. Loss, 5. Injury, 6. Death, 7. Toxicity, 8. Peril From this perspective, risk can have two possible meanings: 1. It could mean: “hazard, peril, exposure to injury or loss.” In this context it refers to an unrealized potential for harm. It is most important to notice that once the danger becomes realized it is no longer risk: it becomes injury, loss or death. 2. Risk could be considered as the “chance” of loss, injury, or death. Chance, likelihood and probability are all related words for an underlying random process described by the laws of “Probability Theory.” Managing risk uses the tools of Probability Theory and Possibility Theory. For instance, if one wants to keep a stash of 6 dollars in one’s possession; no more, no less, what would be the bet on each roll of a die? The answer is 1 dollar, since the probability of rolling a specific number in the long run is 1/6, and the expected value of the bet outcome can be calculated as: 1 1 1 1 1 1 E ( 1) ( 1) ( 1) ( 1) ( 1) ( 1) 1 6 6 6 6 6 6 4.3 ACTUARIAL OR LINEAR RISK If we accept the definition of risk as the chance of loss, injury, or death one can thus quantify it using the power of mathematics in the following way: Risk = Probability Consequence or in symbolic form: R p.C (1) where: p is the probability of occurrence, C is the consequence from the occurrence. “Insurance” using the concept of the actuarial risk was invented in the 15-th century by the Genoese merchants to protect against catastrophic losses to their trading ships through storms or piracy by sharing the involved risk. In this case, the insurer collects a “premium” of a certain amount of cash per ship: $ R , insured ship to insure a total number of ships per year of: insured ships N . year If the ships lost per year are: lost ships n , year The award paid per lost ship is: $ C . lost ship For the established insurance company to break even, the following balance relationship must hold: N .R n.C (2) This defines the break even premium collected by the insurance company as: R n $ .C N insured ship (3) As the number of insured ships becomes large: N , the ratio n/N tends to a probability p: n p N N lim Comparing Eqns. 3 and 4 we can write: R p.C which corresponds to the definition given in Eqn. 1. (4) EXAMPLE As a numerical example, let us consider a person in a certain age group with a 1 percent probability of dying in a year: p = 0.01 He purchases a life insurance policy with a payoff value of $ 100,000: C = $ 100,000. To break even, or for the net income to the insurance company to be equal to the net award that it must pay, the insurance company must have him pay the following annual premium according to Eqn. 1: $ R=p.C=0.01x100,000=1,000 year In practice, insurance companies incur an overhead in managing the insurance business, so to cover the overhead, either that the probability of death p must be lower, or the insurance company must charge a larger premium R’>R to cover its overhead cost. 4.4 TECHNOLOGICAL RISK Technological risk is an application of the actuarial risk to the technological realm. Let us consider a world with a large chemical or nuclear plant population N, with all plants being identical. We also assume the same demography and geology. Let us also consider the plants to be separated in such a way that they are independent and do not affect each other. Each year let us consider that ni plants fail in the i-th failure mode, and that these failures lead to the release of chemical pollutants or radiation leading to a population dose di due to the i-th failure mode. We can state that the population dose di is proportional to the number of plants failing ni or: d i ni . We can replace the proportionality sign with an equality sign if we use the proportionality constant ci as: di ci .ni (5) where the proportionality constant ci can be identified as the average population chemical or radiation dose per plant due to the i-th failure mode. Over all the failure modes M, the total population dose is the summation: M M i 1 i 1 D di ci .ni (6) The probability of occurrence of the i-th failure mode in the limit of a large number of plants is: ni N N pi lim (7) The plant risk can be taken as population dose per plant as: R = Plant Risk = Population dose per plant D N N = lim (8) Substituting for the population dose D from Eqn. 6, we get: M c .n R = lim N i 1 i N i M ni M ci . pi N N i 1 ci . lim i 1 (9) This suggests that risk is the “expected consequence” in the same sense that an insurance premium is the expected consequence of the awards. Risk as the product of the probability of occurrence (pi) and the consequence (ci) is the “expectation value,” or the “mathematical expectation,” or simply the “mean value” of the consequence. This leads to the important observation that: “Risk is the premium paid by society for the benefit of using a given technology.” 4.5 RISK EXPRESSION The simplest expression of risk is in terms of frequency or likelihood of occurrence of a certain event (Table 1) Table 1. Risk as frequency of occurrence or likelihood. Event Heart disease Cancer Water related disease Car accident Plane crash Frequency or likelihood of death 1:5 1:7 1:20 1:84 1:5,051 Legal execution Lightning strike 1:62,468 1:79,746 Risk can be expressed in practice in many different ways. In one approach it is expressed as a ratio: [ Monetary losses, injuries, deaths ] person. year The monetary losses, injuries or deaths can further be specified, for instance as cancer occurrences per person per year. Table 2 shows estimates of such a risk for a variety of societal causes. Table 2. Cancer occurrence risks from different causes. Source of Risk Cosmic radiation risks One transcontinental flight/year Airline pilot, 50 hours/month at 30,000 ft Frequent airline passenger Living in Denver, Colorado (1 mile elevation), instead of New York at sea level Four months (one summer) camping at 15,000 ft Other radiation sources Average USA medical diagnostic x-rays Living in a brick building (radon gas) rather than a wood structure (C14) Natural radiation background at sea level Food and Drink A single diet drink per day from saccharin sweetener Average USA saccharin consumption Four tablespoons of peanut butter per day from aflatoxin One pint of milk per day from aflatoxin Miami or New Orleans drinking water Cancer risk from ½ lb charcoal broiled steak per week Alcohol averaged over nonsmokers and smokers Tobacco consumption Smoker, cancer only Smoker, all effects including heart disease Person in same room as smoker, second-hand smoke Other Causes Regular use of contraceptive pills Risk [cancer occurrences/(person.year)] 1/2,000,000 1/20,000 1/65,000 1/100,000 1/100,000 1/100,000 1/200,000 1/65,000 1/100,000 1/500,000 1/25,000 1/100,000 1/800,000 1/2,500,000 1/20,000 1/800 1/300 1/100,000 1/50,000 Curable skin cancer from sunbathing, and other outdoor activities 1/200 Another way of expressing risk is in terms of the average loss of life expectancy in days lost due to various causes as shown in Table 3. Table 3. Average loss of life expectancy due to different causes. Cause Being male and unmarried Cigarette smoking, male Heart disease Being female and unmarried Obesity at 30 percent overweight Being a coal miner Cancers Being 20 percent overweight Cigarette smoking, female Strokes Dangerous jobs, accidents Pipe smoking Increasing food intake by 100 cal/day Motor vehicles accidents Alcohol drinking, USA average Accidents in homes Suicides Being murdered, homicide Legal drugs misuse Average job, accidents Drowning Jobs involving radiation exposure Accidental falls Accidents to pedestrians Safest jobs, accidents Fire, burns Energy generation Illicit drug use, USA average Firearms accidents Natural radiation, Biological Effects of Ionizing Radiation (BEIR) Report Medical x-rays Drinking coffee Oral contraceptives use All catastrophes combined Average Loss in Life Expectancy [Days] 3,500 2,250 2,100 1,600 1,300 1,100 980 900 800 520 300 220 210 207 130 95 95 90 90 74 41 40 39 37 30 27 24 18 11 8 6 6 5 3.5 Diet drinks Reactor accidents, assuming all USA electrical power is nuclear, Union of Concerned Scientists. Reactor accidents, Rasmussen Wash-1400 report Radiation from nuclear industry, assuming all USA electrical power is nuclear, Union of Concerned Scientists. 2 2 0.02 0.02 The risk associated with energy generation is shown in Table 4, in terms of the average loss of life expectancy among the public. Table 4. Average loss of life expectancy among members of the public due to different modes of energy generation. Energy Source Coal Air pollution Transportation accidents Sum Oil Air pollution Fires Sum Natural Gas Air pollution Explosions Fires Asphyxiation Sum Hydroelectric Dam failures Nuclear Energy (400 GWatts capacity) Routine emissions Accidents Transportation Waste Plutonium toxicity Sum [Fatalities/year] Average years lost Life expectancy reduction [days] 11,000 300 10 35 11.5 1.0 12.5 2,000 500 10 35 2.2 2.0 4.2 200 100 100 500 10 35 35 25 0.2 0.4 0.4 1.5 2.5 50 35 0.2 8 8 <0.01 0.4 <0.01 20 20 20 20 20 0.018 0.018 0.01 0.037 1,200 Electrocution Total 35 5.0 24 In Table 5 the risk is expressed in terms of fatalities per 100,000 persons per year, for different professional activities. Table 5. Occupational fatality rates for some professions. Occupation Logging workers Aircraft pilots and engineers Fishermen and related workers Structural iron and steel workers Refuse and recycling collectors Farmers and ranchers Roofers Power lines installers and repairers Sales workers and truck drivers Taxi drivers (homicides) and chauffeurs All occupations Fatality rate [fatalities/(100,000 persons.year)] 92.4 92.4 86.4 47.0 43.2 37.5 34.9 30.0 27.6 22.7 4.1 4.6 PERCEIVED VERSUS REAL RISK Some observations can be made about different sources of risks. It must first be admitted that many accidents have trivial and complacency causes and can be averted. The refuse and recycling of trash mortality rate is caused primarily by impatient drivers trying to pass garbage collection trucks and hitting the workers in the process. Given the few airline crashes, the rate for aircraft pilots and engineers seems too high, but is in fact caused by occurrences in small aircraft such as dare-devil crop dusters “buying the farm.”. The USA has one of the highest fire deaths rates in the industrial world. For the year 1997, it was 15.2 deaths / million people. The National Fire Data Center reported 4,050 deaths and 23,750 injuries due to fires in 1997. These were the result of 1,750,000 fires that occurred in 1997. Fully 84 percent of the fatalities occurred in the home. Housing uses primarily flammable materials such as wood. Children with age 5 and under were at the greatest risk of home fire related deaths. They panic and do not know what to do in the case of a fire, hiding behind a bed or in a closet instead of attempting an escape. Ninety percent of children fire deaths occur in homes that are not equipped with fire and smoke detectors. Some of these fires are preventable resulting from the use of matches, unnecessary candles and cigarette smoking. About 1/3 of all house fires in the USA occur during the cold home heating season of December, January and February. According to the National fire Protection Association (NFPA), the major cause of these winter fires can be attributed to faulty and improper use and maintenance of supplemental heating equipment such as space heaters. Some cities have banned the use of many types of portable space heaters. Live and artificial Christmas trees are the ignition source of 300 reported USA home structure fires each year resulting in 14 fatalities, 21 injuries and $16.8 million in property damage. Farming is perceived as an idyllic, healthy, low risk profession, but in fact it involves substantial risk. In addition to exposure to pesticides and farm chemicals, more farmers and rural residents are involved in farm and road accidents. Non highway vehicle accidents such as tractor overturns accounted for 40 percent of the farmer and ranchers deaths. The National Safety Council estimates that each year more than 700 farmers and ranchers perish in work related accidents. Another 120,000 sustain disabling injuries. About 387,000 agricultural producers have disabilities and chronic health conditions limiting their daily activities. Tractors are responsible for 41 percent of the accidental farm deaths of children under age 15; yet 4 out of 5 farm children ride tractors with family members. From farm tractor rollovers to roadway accidents involving farm machinery, agriculture is one of the most risky occupations in the USA. 4.7 SYSTEMIC RISK AND RANDOM RISK Systemic risk depends on predictable events whereas random risk depends on possible or random events. Random risk can be insured against, whereas systemic risk cannot. As an example, the price of an agricultural commodity such as corn involves a systemic risk. The price of corn affects all farmers across the nation without regard to their management ability or agronomic skills. Farmers cannot affect the supply and demand situations that result in lower or higher prices for their crop; they are price takers not price makers. Systemic risk is unsuitable for insurance. First, if the price of the corn goes down, it does so for all farmers, which is similar to all houses in the country burning down in a given year. Second, if prices enter into a multiyear decline, insurance would provide less and less protection as the price falls. At some point, the expected price that is offered in an insurance contract would become below the cost of production and thus offers no protection whatsoever, and guarantees a loss on the produced crop. Insurance companies offering insurance against systemic risk would go bankrupt if the risk is realized. These companies become unstable and must receive some form of government subsidy to remain in business, or they must raise their premiums to unpalatable levels to the insured. On the other hand, the crop yield is a random event and can be insured against. Yield depends on the weather, precipitation distribution, localized drought and disease incidence in different parts of the country. It would be a rare event that all farmers across the nation would be subject to the same yield loss in a given year. Such random risk can be insured against if different regions of the country are rated as to their different probabilities of yield loss. This is similar to offering lower fire insurance rates for a building equipped with a sprinkler system. 4.8 SOCIETAL RISKS ALCOHOL-DRINKING RISK For every ten fatalities of working-age adults, one is attributable to excessive alcohol consumption according to a study by researchers with the USA Centers for Disease Control and Prevention (CDC). Between 2006 and 2010 some 88,000 deaths could be attributed to excessive drinking. Each of these lost lives was cut short by an average of 30 years. Six Americans on-average die each day from drinking too much alcohol. Over a full year, the toll from fatal intoxications passes 2,220, according to the CDC. Binge drinking accounts for most of those lethal events. What is noticeable about the death rate is that he vast majority of cases do not involve college-aged young adults, the group most often associated with binge drinking, but it is middle-aged white males. The CDC reported that more than 75 percent of those 2,220 alcohol poisoning deaths occur among adults between the ages of 35 and 64. More than 75 percent of people who die from alcohol poisoning deaths are men, and nearly 70 percent are white people. The researchers urged that all USA residents be more aware that even one night of alcohol overindulgence can turn deadly. Too much alcohol in the body suppresses breathing. Binge drinking is defined as drinking enough to bring the blood alcohol level to 0.08 percent, which puts drivers past the limit in all 50 states. Once one gets above that level of consumption, the risk of death from alcohol poisoning really goes up. Geographically, clear patterns emerged from the numbers illustrating what might be called America's binging belt. Among the 10 states with the highest average annual number of alcohol poisoning deaths, eight are in the West: Alaska (46.5), New Mexico (32.7), Arizona (18.7), Wyoming (17.7), South Dakota (17.0), Utah (16.7), Colorado (14.4) and Oregon (12.7). In some areas, binge drinking behavior is strongly influenced by state and local laws governing the price and availability of alcohol, as well as other cultural and religious factors. Policies that boost prices and cut the clusters of retailers that make alcoholic beverages more available and accessible have been shown to reduce binge drinking in states. Living in geographically isolated rural areas might increase the likelihood that a person with alcohol poisoning will not be found before death or that timely emergency medical services will not be available. In addition to using blood alcohol levels, health experts define binge drinking as consuming four or more alcoholic beverages in one session for women and five or more for men. The drinks may include shots of liquor, glasses of wine or cans of beer. More than 38 million American adults report they engage in binge drinking, on average, four times per month, and guzzle an average of eight drinks per spree. Most of the alcohol overdoses examined involved people for whom alcohol dependence was not listed as a contributing cause. Roughly two-thirds of people who admitted binge-drinking 10 or more times per month were not alcohol dependent, another recent study found. All totaled, Americans lose approximately 2.56 million years of life each year due to alcohol-related deaths. And though most expect alcohol related deaths to be caused by car crashes and liver failure, excessive drinking leads to all kinds of fatal consequences: acute pancreatitis, psychosis, esophageal cancer, breast cancer, oral cancer, falling injuries, suicide and drowning. Alcohol intake plays a role in at least 54 different conditions linked to death. The victims are often middle-aged wage-earners. It is not just a loss of life, but a major hit to the economy. This lost potential saps some $224 billion a year from the USA economy. From 2006 to 2010, the highest percentage of alcohol related deaths among citizens aged 20 to 64 occurred in Western locales. Sixteen percent of working-age adult fatalities in New Mexico are attributable to alcohol followed by Alaska, Colorado, Wyoming, Arizona, Montana, California, Nevada, Oregon and Idaho. The top three states least plagued by excessive drinking deaths are Maryland, New Jersey and New York, where just above 7 percent of working-age deaths are related to alcohol. Researchers from the Boston University School of Medicine and Boston University School of Public Health have found that alcohol is a “major” contributor to cancer deaths in the USA, even when consumed in small amounts: “Alcohol remains a major contributor to cancer mortality and YPLL [years of potential life lost]. Higher consumption increases risk but there is no safe threshold for alcohol and cancer risk. Reducing alcohol consumption is an important and underemphasized cancer prevention strategy.” Previous research has consistently shown that alcohol consumption is a significant risk factor for cancers of the mouth, throat, esophagus and liver. More recent research has demonstrated that alcohol consumption also increases the risk of cancers of the colon, rectum and female breast. The study used 2 methods to calculate population-attributable fractions. it based relative risks on meta-analyses published since 2000, and adult alcohol consumption on data from the 2009 Alcohol Epidemiologic Data System, 2009 Behavioral Risk Factor Surveillance System, and 2009–2010 National Alcohol Survey. The researchers found that alcohol led to approximately 20,000 cancer deaths annually, indicating that alcohol contributes to about 3.5 percent of all cancer deaths in the USA [2]. Breast cancer was the most common cause of alcohol-attributable cancer deaths in women or about 15 percent of all breast cancer deaths. In men, they found that cancers of the mouth, throat and esophagus were common causes of alcohol-attributable cancer deaths or about 6,000 deaths annually. Each alcohol-related cancer death resulted in an average of 18 years of potential life lost. Average consumption of 1.5 drinks / day or less made up 30 percent of all alcoholattributable cancer deaths. Higher levels of alcohol consumption were associated with a higher cancer risk. Dr. Timothy Naimi from the Department of Medicine at Boston University School of Medicine suggests that: “The relationship between alcohol and cancer is not widely appreciated by the public and underemphasized by physicians.” TRAFFIC AND PEDESTRIAN FATALITIES There were 33,561 traffic fatalities in 2012, according to the Department of Transportation (DOT) National Highway Traffic safety Administration. This is a 3.3 percent increase of 1,082 deaths over 2011. Driving Under the Influence (DUI) fatalities increased by 4.6 percent. Most of the increase involved motorcyclists, cyclists, large-truck occupants, in crashes involving drunken drivers and pedestrians. MOSQUITOES RISK Mosquitoes kill 1 million people each year according to the World Health Organization (WHO). They also pose a threat to livestock. As the deadliest animal to humans in the world, it spreads diseases such as malaria, dengue fever, chikungunya, West Nile Virus and yellow fever. A mosquito weighs only 2.5 mg and lives for only 4-6 weeks. Mosquitoes have existed since 400 million years and are the greatest transmitted disease insect vector challenge to the human race. Fleas and ticks are other challenges. About 176 species of mosquitoes have been identified in the USA. The tree-hole mosquito can spread encephalitis. The inland flood water mosquito has a range of 30-60 miles from its breeding site. The latter hatch in the spring and need warm water with a temperature around 70 oF from spring showers and warming temperatures. Other species do best in hot dry weather and appear in mid-summer. Mosquitoes can breed in house gutters and places where rain water can collect such as tires, bird baths and empty containers. They are attracted to the microbes and the foul odors from standing water to lay their eggs. FIRST AND SECOND HAND SMOKING RISKS OVERVIEW Cigarette smoking in the USA causes an estimated 443,000 deaths each year, including approximately 49,400 deaths due to exposure to secondhand smoke. One out of five Americans or more than 46 million people do smoke. People who smoke are up to six times more likely to suffer a heart attack than nonsmokers, and the risk increases with the number of cigarettes smoked. Smoking also causes most cases of chronic lung disease. It also causes a host of other cancers including throat, mouth, nasal cavity, esophagus, stomach, pancreas, kidney, bladder, cervix, and acute myeloid leukemia. Figure 1. Female smokers were induced to “Believe in Yourself!” and “Don’t test one brand alone … compare them all!” and smoke “Victory Sticks.” Source: Video grab. On January 11, 1964, USA Surgeon General Luther Terry released a 387-page report that linked cigarettes to cancer. It became a ground-breaking report that health advocates say saved the lives of 8 million Americans, and became one of the greatest public health successes of the 20th century. The Surgeon General and his committee had waded through 7,000 documents and put together a report that was a culmination of research on tobacco and smoking with the result that cigarettes could kill. People slowly took notice, and within 50 years, smoking has substantially decreased nationwide. SWEDISH NATIONAL BOARD OF HEALTH AND WELFARE, BLOOMBERG PHILANTHROPIES Globally, the mortalities from second-hand smoke add to an estimated 5.1 million deaths / year linked to first-hand smoking among the world’s 1 billion smokers. Second-hand smoke may have killed more than 600,000 people in 2004, causing one in every 100 deaths. According to a study published in the British medical journal: The Lancet, the main causes of death were heart disease, lower respiratory infections, asthma, and lung cancer. Women accounted for 47 percent of the deaths, children 28 percent and men 26 percent. Deaths in adults were spread evenly across the globe. The research was led by Annette Pruess-Ustuen of the World Health Organization (WHO), in Geneva, Switzerland. The 1 billion smokers in the world are exposing billions of non-smokers to secondhand smoke, a disease-causing indoor air pollutant. Few sources of indoor-air pollution can be completely eliminated. However, smoking indoors can be eliminated with substantial benefits. The researchers used 2004 data gathered in 192 countries to estimate deaths and years of good health lost. The study estimates that 10.9 million persons-years of good health were lost. The research was funded in part by the Swedish National Board of Health and Welfare and Bloomberg Philanthropies. USA SURGEON GENERAL REPORT More than 440,000 deaths per year in the USA are attributed to smoking and exposure to second hand smoke. Occasional smoking or second-hand smoke causes immediate damage to one's organs and poses risk of serious illness or death. There is no risk-free level of exposure to tobacco smoke. A December 2010 report: “How Tobacco Smoke Causes Disease: The Biology and Behavioral Basis for Smoking-Attributable Disease” issued by Surgeon General Regina Benjamin describes tobacco smoke's assault on the body. The chemicals in tobacco smoke reach the lungs quickly every time a smoker inhales causing damage immediately. Inhaling even the smallest amount of tobacco smoke can also damage the DNA, which can lead to cancer. Tobacco smoke is made up of more than 7,000 chemicals. Hundreds are toxic, and at least 70 are carcinogenic. One of these toxic chemicals is benzo-a-pyrene. In addition to chemical toxicity, tobacco smoke is radiologically toxic. It contains daughters arising from the decay of Radon222 deposited in the fields on the leaves of the tobacco plant. Pb210 and Po210 are deposited in the lung’s alveoli and can eventually cause the generation of cancerous tumors by their emitted radiation. Smoking is responsible for more than 85 percent of lung cancers; but there are a host of other chronic diseases directly related to exposure to tobacco smoke. It is also a major cause of heart disease, stroke, aortic aneurysm and Peripheral Arterial Disease, PAD. The report suggests that even low levels of exposure, like occasional smoking; having just a few cigarettes a day and second hand smoke are enough to increase the risk of a cardiovascular event. The report links smoking directly to 13 different cancers including esophagus, trachea, stomach, pancreas, kidney, bladder, cervix and acute myeloid leukemia. It ties smoking to more than a dozen chronic diseases like stroke, blindness, periodontitis, heart disease, pneumonia; reproductive problems like diminishing fertility; Chronic Obstructive Pulmonary Disease (COPD), asthma and other respiratory illnesses. Second-hand smoke affects adults and children differently. According to the report, children exposed can suffer middle ear infections, impaired lung function and are more susceptible to sudden infant death syndrome. Adults are at risk for lung cancer, nasal irritation, heart disease and reproductive problems like low birth weight deliveries. Casual smokers think they are improving their health by cutting back, but there is no safe level. It affects people's DNA immediately, and their heart and blood vessels literally seconds to minutes after being exposed. Second hand smoke is no less dangerous than smoking. It inflames and irritates the lining of blood vessels, making the blood more prone to clotting and the combination of inflammation, irritation and increased clotting can literally cause a heart attack even from the kind of exposure from walking into a smoky restaurant. Today's tobacco products are designed to be more attractive to smokers, and they are more addictive. They deliver nicotine faster making them more subject to abuse than in the past. Additives like ammonia NH3 are added to cigarettes. It converts the nicotine, making it easier to pass through the blood to brain barrier. Other additives like moisture enhancers and sugar reduce the harshness of the smoke and that enhances the taste. This allows smokers to tolerate the smoke and pull it deeper into their lungs. Efforts over the last 20 to 30 years to put out “filtered,” “low-tar” and “light” products have not reduced the overall risk of disease. None of these changes have been effective in making the products safer. The USA Food and Drug Administration, FDA, has been given more regulatory authority over tobacco products, which were totally unregulated. In October 2010, it announced that graphic warning labels would be added to cigarette packs. Quitting smoking at any time gives the body a chance to heal the damage caused by smoking. It is never too late to quit, and the sooner it is done, the better. ELECTRONIC CIGARETTES RISK, ELECTRONIC NICOTINE DELIVERY SYSTEMS (ENDS) Electronic cigarettes or Electronic Nicotine Delivery Systems (ENDS) are devices whose function is to vaporize and deliver to the lungs of the user a chemical mixture typically composed of nicotine, propylene glycol and other chemicals, although some products claim to contain no nicotine. Each device contains an electronic vaporization system, rechargeable batteries, electronic controls and cartridges of the liquid that is vaporized. The manufacturers report that the cartridges typically contain between 6 and 24 mg of nicotine, but sometimes can contain more than 100 mg [10]. As part of the Tobacco Free Initiative (TFI), the World Health Organization (WHO) states that: “The safety of ENDS has not been scientifically demonstrated. The potential risks they pose for the health of users remain undetermined. Furthermore, scientific testing indicates that the products vary widely in the amount of nicotine and other chemicals they deliver and there is no way for consumers to find out what is actually delivered by the product they have purchased.” The risk due to the presence of large concentrations of propylene glycol in ecigarettes is pointed out, considering that the chemical is a known irritant when inhaled. The risk of nicotine poisoning also exists, particularly to certain populations like children if they were to swallow the contents of a nicotine cartridge. The WHO also asserts: “ENDS are often touted as tobacco replacements, smoking alternatives or smoking cessation aids. But we know that for smoking cessation products to be most effectively and safely used, they need to be used according to instructions developed for each product through scientific testing. There are no scientifically proven instructions for using ENDS as replacements or to quit smoking. The implied health benefits associated with these claims are unsubstantiated or may be based on inaccurate or misleading information.” The WHO concludes that consumers should be strongly advised not to use any of these products, including electronic cigarettes [10]. INHERITED PREDISPOSITION TO SMOKING RISK A study published in the journal “Pediatric” suggests that the children of people who smoked only in their teenage years were still 3.2 times more likely to also pick up the habit, compared to children whose parents had never smoked. Researchers gathered data from a sample of ninth grade students in St. Paul, Minnesota and followed this group from 1988 through age 38, and then also gathered data from the children of that cohort, starting at age 11. The rate of smoking was 23-29 percent among kids ages 11 and older whose parents had once smoked or currently smoked, compared with 8 percent among children of parents who had never smoked. Children who had older siblings who smoked were also more likely to smoke. Dr. John Spangler, a family and community medicine specialist at Wake Forest Baptist Medical Center in Winston-Salem, North Carolina stated: “We do not know exactly what is going on here, but my hypothesis is that there is a genetic predisposition toward smoking. Whether it is a genetic predisposition toward risk taking behavior, genetic disposition toward experimentation of substances, or even a genetic disposition toward nicotine addiction itself.” Dr. John Spangler noted that parents can still take action to prevent their children from taking up the unhealthy habit: “A parent should take the opportunity to make it a teachable moment. There is nothing you can do about your past history of smoking; there is something you can do about your current history of smoking. But if you talk and engage the child in a healthy lifestyle, it may make you more likely to quit and also make the child less likely to start smoking.” The authors of the study noted that their research had some limitations including: relatively low levels of education, the fact that only one parent provided information on their smoking history and the inability to determine exactly what caused the link. RADON GAS RISK According to the EPA, radon-induced cancer kills 21,000 Americans per year. A study by Harvard University ranks radon gas as America’s leading in-home hazard. Radon gas is considered as the leading cause of lung cancer among non-smokers. It caused more American fatalities in 2013 than carbon monoxide poisoning, fires and handguns combined. The American Lung Association, Center for Disease Control and National Cancer Institute all agree that radon gas is a national health problem and encourage radon testing in newly purchased homes. Radon is a naturally occurring, invisible and odorless radioactive gas emitted from the decay chains of uranium and thorium. One out of every 15 American homes contains high levels of radon gas, and millions of Americans are unknowingly exposed to this health hazard. Radon gas problems have been detected in every county of the USA. Figure 2. Yearly fatalities from radon gas. Radon is estimated to cause about 21,000 lung cancer deaths per year, according to EPA's 2003 Assessment of Risks from Radon in Homes (EPA 402-R-03-003). The numbers of deaths from other causes are taken from the Centers for Disease Control and Prevention's 2005-2006 National Center for Injury Prevention and Control Report and 2006 National Safety Council Reports. Source: EPA. CANCER RISK One in three Americans are expected to be afflicted by some form of cancer in their lifetime, according to the American Cancer Society. The National Institute of Health estimates that cancer costs Americans $78.2 billion per year in medical bills. The average cost of a single hospital stay is $8,793. In the 1930’s about 1 in four people with cancer had a chance of surviving for at least 5 years. Today the five-year cancer treatment survival rate has risen to 66 percent. Over 1.5 million new cases of cancer were diagnosed in 2010 of the types shown in Table 6. These do not include another 1 million cases of basal cell and squamous cell carcinoma skin cancers, for a total of about 2.4 million new cases per year. Table 6. Types of cancer cases diagnosed in 2010. Cancer Type Lung and Bronchus Prostate Female Breast Colon and Rectum Cases 222,520 217,730 207,090 142,570 Urinary Bladder Non-Hodgkin Lymphoma Melanoma of the skin Leukemia Uterine Corpus Uterine Cervix 70,530 65,540 68,130 43,050 43,470 12,200 SKIN CANCER RISK Ultraviolet (UV) light exposure from the sun, or from indoor tanning devices, increase the risk of developing skin cancer. The chance of developing skin cancer increases with age and a history of severe sunburns at childhood. Other less common conditions can predispose a person to skin cancer: organ transplantations, chronic skin ulcers, prior x-ray treatment for acne in the 1950s, arsenic ingestion, smoking and toxic exposure to tars and mineral oils. Ultraviolet light avoidance is the primary form of prevention and is important at all ages. Solar radiation is at its peak from 10 am to 4 pm. Wide brimmed hats, sunglasses long-sleeved shirts and protective clothing must be used. Broad spectrum sunscreen blocks for both ultraviolet A (UVA) and ultraviolet B (UVB) with a Sun Protection Factor (SPF) of 15 or higher should be applied to the skin even over short periods of sun exposure, and reapplied every 2 hours. Indoor tanning devices should be strictly avoided. SQUAMOUS CELL CARCINOMA Squamous cell carcinoma is the second most common skin cancer with more than 250,000 new cases diagnosed per year in the USA. Middle-age and elderly person, especially those with fair complexions and frequent sun exposure are at risk. These appear as crusted or scaly patches on the skin with a red inflamed base, a growing tumor, or a non-healing ulcer. They occur in the sun exposed areas like the face, neck, arms scalp, backs of the hands and ears. It can occur on the lips, inside the mouth, on the genitalia, or anywhere on the body. The cancer develops in the epithelium or the outer layer of the skin. Some carcinomas develop from small sandpaper-like lesions called solar or actinic keratosis. It is possible for squamous cell carcinomas to spread to other body parts, necessitating early treatment. If left untreated, they can destroy much of the local tissue surrounding the tumor and could result in the loss of an ear or nose. Aggressive types, especially on the lips or ear can spread to the lymph nodes and other organs resulting in 2,500 deaths / year in the USA. Surgical excision to remove the entire cancer is the most common treatment. MELANOMAS The lifetime risk of a person in the USA to develop melanoma is 1 in 75. They appear as moles different than others, with a changing appearance, itches, or bleed. Melanomas are identified by the so-called ABCDD features: Assymetry: One half does not match the other half in size, shape, color or thickness. Border irregularity: The edges are ragged, scalloped or poorly defined. Color: The pigmentation is not uniform with shades of tan, brown and black present. Dashes of red, white, and blue add to the mottled appearance. Diameter: Melanomas are usually larger than 6 mm in diameter or the size of pencil eraser. FIREWORKS RISKS During the 4th of July Independence Day holiday of 2008, about 5,000 Americans were sent to emergency rooms because of injuries due to fireworks. Ninety percent of fireworks injuries that required emergency medical care were approved by Federal regulation agencies. In addition, fireworks injure bystanders more often than those setting them off. According to the USA Consumer Product Safety Commission, CPSC, about 1,000 of these injuries were to the eyes, including contusions, lacerations, debris in the eyes, as well as burns. Young people under the age of 14 accounted for 40 percent of the total injuries. The organization “Prevent Blindness in America” supports the development and enforcement of restrictions on the importation, sale and use of fireworks and sparklers, except for those used in authorized public displays by competent licensed operators. The organization advocates the idea that a ban would be an effective way of eliminating the social and economic impact of fireworks-related trauma and damage. Five USA states ban all consumer sales of fireworks: Delaware, Massachusetts, New Jersey, New York and Rhode Island. SPACE HEATERS FIRE RISK The National Fire Protection Association, NFPA reports that in 2007, USA fire departments responded to 66,400 home structures fires that involved heating equipment. These fires resulted in 580 deaths, injured another 1,850, and were responsible for $608 million in direct property damage. Electric Space Heaters that meet voluntary safety standards in their construction and performance are certified with a label from a recognized testing laboratory such as Underwriters Laboratory (UL), Intertek (ETL) or the Canadian Standards Association (CSA). It is recommended that people purchase electric heaters with automatic shutoffs when tipped over. Heaters must be turned off when people leave the heated room of go to sleep. Power cords must be plugged directly into power outlets and never into an extension cord. A large load on an extension cord can cause it to overheat setting the surrounding furniture or carpeting on fire. Broken plugs, loose connections, cracked or damaged outlets or cords must be regularly checked or replaced before being used. MEDICAL RADIATION PROCEDURES RISK A rule of thumb is that anyone who is given a standard x-ray is exposed to roughly 0.05 centiSievert (cSv) or rem of “effective dose” or “dose equivalent.” Anyone who is examined using computer tomography is exposed to 1.0 cSv or 1 rem of radiation. Medical doctors in the USA ordered Computed Tomography (CT) scans at a rate of 149 tests per 1,000 patients in 2010, nearly triple the rate of 52 scans per 1,000 patients in 1996. Table 7. Age distribution of medical imaging radiation doses of 2 cSv (rem) or more. Data: Journal of the AMA. Age group [years] 0-14 15-44 45-64 > 65 Total 1996 [percent] 0.1 0.8 2.4 6.4 1.8 2010 [percent] 0.3 1.5 5.2 11.5 3.9 The use of Computed tomography CT), Magnetic resonance Imaging (MRI) and other medical imaging tests has increased over the last 15 years, raising the issue of costbenefit considering the potential risk from radiation exposure as well as the cost to the healthcare system. Data from patients enrolled in six large Health Maintenance Organizations (HMOs) found that medical doctors ordered CT scans at a rate of 149 tests per 1,000 patients in 2010, nearly triple the rate of 52 scans per 1,000 patients in 1996. MRI use nearly quadrupled during the period, jumping from 17 to 65 tests per 1,000 patients according to the Journal of the American Medical Association (AMA). The proportion of patients who had any amount of radiation exposure from CT scans rose from 28.5 percent in 1996 to 36.2 percent in 2010. Their average exposure jumped from 0.48 cSv (rem) to 0.78 cSv (rem). At the top end of the spectrum, the proportion of patients in the study who got radiation at high or very high levels rose from 1.8 percent to 3.9 percent. Computed Tomography (CT) scans combine a series of x-rays into a detailed threedimensional image. Magnetic Resonance Imaging (MRI) machines detect energy emitted by hydrogen atoms in the body and convert that into pictures. Both tests can reveal blockages in arteries, bleeding in the brain, tumors and other life-threatening conditions. MRIs do not use ionizing radiation, but CTs do. A number of recent studies have linked increases in medical imaging to higher rates of radiation-induced cancers, including a report in the British Lancet journal suggesting a correlation between CT scans in children and their subsequent risk of developing brain tumors or leukemia. Advanced imaging adds about $100 billion to the USA medical bills each year. There is an agreement in the medical community that imaging tests are being over-utilized, particularly CT scans. In April 2012, the American Board of Internal Medicine released a report that asked medical doctors from numerous medical specialties to list five procedures they felt were used too much. All of them, including cardiologists, oncologists and family physician, listed CT scans among their top five. The increase in testing may be related to unrealistic expectations about the ability of CTs and MRIs to show what is wrong with a patient and doctors fear that if they do not order the tests, they will miss something that could lead to a malpractice lawsuit. About 2.5 percent of the patients in six HMOs were exposed to between 2.0 and 5.0 cSv (rem) of radiation in 2010, a level that the International Commission on Radiological Protection (ICRP) says exceeds the safe limit. Another 1.4 percent of the patients were exposed to more than 5.0 cSv (rem) of radiation in 2010, which exceeds the USA Nuclear Regulatory Commission limit for occupational workers. Patients and medical professionals must jointly weigh the risks against the benefits for each situation at hand. DENTAL X-RAYS RISKS Dental x-rays are essential for detecting serious oral and systemic health problems, and generally the amount of radiation is very low. The radiation from a dental x-ray is equivalent to that received from the potassium-40 K40 radioactive isotope from eating 8 bananas. The notion of dental x-rays to be administered every year and a full set of x-rays every three years for every patient is being abandoned [12]. Dentists strive to minimize unnecessary exposure, particularly to radiation-sensitive youngsters. The effective radiation dose administered depends on how it is taken. If the dentist uses slow film and round collimation, a person gets approximately double the dose from digital imagery and rectangular collimation. Dentists follow the As Low As Reasonably Achievable (ALARA) radiation exposure principle. Dentists who have not switched to digital imagery can reduce patients' risk by opting for faster film. Another important factor is that the technician who is taking the images should be well-trained and skilled, which reduces the amount of re-exposures. For round collimation, the problem is that it exposes more tissue, including the salivary glands, which are sensitive to radiation. Changing to rectangular collimation is not a big expense and systems can be converted for a few hundred dollars. X-rays exposure is especially worrisome for children because their developing tissue is more vulnerable. There is concern about a new trend in orthodontics as popularity grows for cone-beam CT scanners, used to create 3-D images. Radiation doses from these machines can vary dramatically, depending on the manufacturer and settings. Whenever any kind of dental X-ray is done, patients should wear protective lead aprons with thyroid collars. The aprons do not shield from internal radiation scattering, especially with sensitive tissue like the thyroid gland. That is why it is important to reduce the x-ray beam to the smallest size that provides necessary information. Dental x-rays made news in 2012 after the American Cancer Society journal Cancer published a study saying that people with one type of brain tumor remembered having twice as many dental x-rays as individuals in the control group, who did not have brain tumors. Dental x-rays are administered only when medically indicated, tailored to each patient's health needs [12]. DIESEL FUEL EXHAUST FUMES RISK Diesel exhausts are a cancer risk according to the World Health Organization (WHO). The International Agency for Research on Cancer, part of the WHO, elevated diesel exhaust from the "probable carcinogen" to the "known carcinogen" level, a move that could help exhaust be seen as a more serious public health threat. It is on the same order of magnitude as passive smoking. One of the biggest concerns is the large number of people exposed to diesel fuel exhaust. Affected groups include farmers, street pedestrians, ship passengers and crew, railroad workers, truck drivers, mechanics, miners, and people who operate heavy machinery. Diesel is as of 2012 in the same category as other known health risk hazards such as asbestos, alcohol, and ultraviolet radiation. PROCESSED MEAT RISKS Americans eat 16 billion hot dogs per year, according to the National Hot Dog and Sausage Council. Roughly 1.1 million hot dogs were served up to hungry NASCAR fans at the speedway in 2010. Americans consume on average about 60 hotdogs between the Memorial and Labor Day holidays. During the Fourth of July weekend, the nation consumes about 150 million hot dogs, which is enough to stretch from Washington D.C. to California more than five times. Chicago's O’Hare International Airport sells more hot dogs than any other location in the USA; over 2 million a year. President Franklin D. Roosevelt, and his wife, Eleanor Roosevelt, wanting to introduce something truly American to the visiting King George VI of England and his queen, served the royal guests Nathan's hot dogs at a picnic at their estate in Hyde Park, New York on June 11, 1939. The press made a great deal about the hotdogs, and the picnic menu made the front page of The New York Times. The King was so pleased with "this delightful hot-dog sandwich" that he asked Mrs. Roosevelt for seconds. However, health officials say eating processed meat is a really bad idea because it can cause colon cancer. That is the message leaders at the Cancer Project of the group Physicians Committee for Responsible Medicine (PCRM) want to get out. PCRM installed the giant sign and the graphics draws national attention. It features an image of hot dogs sticking out of a cigarette pack with the skull and crossbones stamped on the front. The billboard reads: “Warning: Hot dogs can wreck your health.” Processed meats like hot dogs can increase the risk for diabetes, heart disease, and various types of cancer. The American Institute for Cancer Research suggests one 50-gram serving of processed meat (about the amount in one hot dog) consumed daily increases the risk of colorectal cancer by more than 20 percent. Those who regularly eat processed meats increase their risk for diabetes by about 41 percent. Cancer researchers report that every year about 143,000 Americans are diagnosed with colorectal cancer and approximately 53,000 die of it. A "hot dog" campaign was initiated by the American Institute for Cancer Research and the World Cancer Research Fund after both organizations reached the conclusion that eating processed meats is as risky as smoking cigarettes. Like cigarettes, hot dogs deserve to come with a warning label that helps consumers understand the associated health risk. OCCUPATIONAL FATALITIES, INJURIES AND ILLNESSES RISKS The farming profession is one of the riskiest ones in terms of rotating farm machinery and tractors overturns. The rate of fatal occupational injuries for farmers and ranchers is 38.5 per 100,000 full-time workers, versus 4.4 for firefighters, and 13.1 for police and sheriff’s patrol officers, according to The USA Labor Department data for 2009. The rate of fatal injuries for aircraft pilots and flight engineers is 57.1, and for fishermen and related fishing workers it is 200. Among civilian workers, the military, volunteers and those under 16 being excluded, the fatality rate is an average of 3.3. Other workers face higher-than-average rates of nonfatal occupational injuries and illnesses involving days away from work. State psychiatric aides have an injury and illness rate that is more than twice the rate for local police and sheriff’s patrol officers. Other jobs with surprisingly high incidence rates are: flight attendants, housekeeping workers and bus drivers. The average incidence rate of nonfatal occupational injuries and illnesses, requiring days away from work, was 117 per 10,000 full-time workers in 2009. Police and sheriff’s patrol officers have a rate of 676, and firefighters, with a rate of 512. Local government transit and intercity bus drivers have an incidence of rate is 892. Bus drivers are exposed to a lot of force and vibrations when they are driving. Some health-care workers, including registered nurses, nursing aides, orderlies and attendants, also have higher-than-average rates of illness or injury, though the rates for these jobs are higher for government versus private workers. Being stuck by a needle can be a problem, lifting or moving hospital patients, is another issue. Some workers spend a lot of time maintaining awkward physical positions at work such as dental hygienists, who may assume contorted positions as they work hard on plaque-covered teeth. Other workers lift heavy objects, often repetitively causing an impact on the musculoskeletal system, the nerves, and on the vascular system. The incident rates for injuries and illnesses are higher for public than private workers: the average private incident rate was about 106, compared with 180 for state governments and 185 for local governments. The incident rate for local government police and sheriff’s patrol officers was about 676, versus 2,041 for athletes and sports competitors, and two for computer programmers. Surgeons have a rate of about four; butchers and meat cutters have a rate of 266. Lawyers have a rate of about two, while personal financial advisers have a rate of three, and accountants and auditors weigh in at about seven, but they can still have problems. For employees who log many hours at a workstation, ergonomic-related problems resulting in musculoskeletal disorders may be an issue, such as back, neck and chronic shoulder pain. Some of these statistics can be biased by extraneous factors. For instance, in the city of Parma, Ohio, the police force had a “sick day scam” going. Because of a provision in their union contract, one officer would call in sick, so a fellow officer would have to take “call” and work his shift for “time and a half.” They could then “rotate” the sick days scams to the point that one patrol sergeant is reported to have made $230,000 as an annual salary. Table 8. Occupational fatal injuries incidence rate involving days away from work, for full-time employees. USA Labor Department, 2009. Occupation Fishermen and related fishing workers Aircraft pilots and engineers Farmers and ranchers Police and sheriff’s patrol officers Firefighters Civilian workers (excluding volunteers, the military and those under 16 years of age) Fatalities / 100,000 full-time workers 200.0 57.1 38.5 13.1 4.4 3.3 Table 9. Nonfatal occupational injuries and illnesses incidence rate involving days away from work, for full-time employees, 2009. Occupation Athletes and sports competitors State psychiatric aides Local government bus drivers, transit and intercity local government emergency medical technicians and paramedics Private tree trimmers and pruners Police and sheriff’s patrol officers Local governments nursing aides, orderlies and attendants Private shuttle car operators Local government dieticians and nutritionists Local governments house-keeping workers Firefighters Butchers and meat cutters Local government employees State government employees Average rate Private sector employees Accountants and auditors Surgeons Personal financial advisers Computer programmers Lawyers TEENAGE DRIVING RISKS Injuries and illnesses / 10,000 full-time employees 2,041 1,459 892 712 676 646 610 589 570 512 266 185 180 117 106 7 4 3 2 2 Car crashes in the USA injure about 300,000 teenagers / year and cause the death of about 6,000 of them per year. Being a teenager is a risky period in each person’s life. People must be aware of the situation to safely sail through that treacherous period. The statistics are that 16-year old drivers have crash rates that are 3 times higher than 17-year olds and 5 times higher than 18-year olds. Insurance companies hence impose higher rates for insuring families with teenage drivers. Car rental companies have policies against car rentals to young drivers. The adolescence period entails a significant risk as well as to the rest of society. It is not the fault of bright and mature teenagers when they sometimes commit what is considered by adults as reckless actions. The medical professionals suggest that the reason is that their brains are still in the development stage in the dorsal lateral prefrontal cortex. This part of the brain plays a critical role in decision making, problem solving and understanding future consequences of the present actions. It does not fully develop until they age into the twenties. The surge during the teenage years in anxiety and fearfulness is attributed to a quirk of brain development. Adolescents, on average, experience more anxiety and fear and have a harder time learning how not to be afraid than either children or adults. Different regions and circuits of the brain mature at very different rates. It turns out that the amygdala which are the brain circuit for processing fear is precocious and develops way ahead of the prefrontal cortex, the seat of reasoning and executive control. This means that adolescents have a brain that is wired with an enhanced capacity for fear and anxiety, but is relatively underdeveloped when it comes to calm reasoning: “The amygdala is a region buried deep beneath the cortex that is critical in evaluating and responding to fear. It sends and receives connections to our prefrontal cortex alerting us to danger even before we have had time to really think about it. Think of that split-second adrenaline surge when you see what appears to be a snake out on a hike in the woods. That instantaneous fear is your amygdala in action. Then you circle back, take another look and this time your prefrontal cortex tells you it was just a harmless stick [16].” The brain’s reward center, just like its fear circuit, matures earlier than the prefrontal cortex. That reward center drives much of teenagers’ risky behavior. This also explains why adolescents are particularly prone to injury and trauma. The top three killers of teenagers are: accidents, homicide and suicide [16]. Most adolescents do not develop anxiety disorders, but acquire the skill to modulate their fear as their prefrontal cortex matures in young adulthood, at around age 25. But up to 20 percent of adolescents in the USA experience a diagnosable anxiety disorder, like generalized anxiety or panic attacks, probably resulting from a mix of genetic factors and environmental influences [16]. The fear circuit is a two-way street. While we have limited control over the fear alarm from our amygdala, our prefrontal cortex can effectively exert top-down control, giving us the ability to more accurately assess the risk in our environment. Because the prefrontal cortex is one of the last brain regions to mature, adolescents have far less ability to modulate emotions [16]. “Adolescents are not just carefree novelty seekers and risk takers; they are uniquely vulnerable to anxiety and have a hard time learning to be unafraid of passing dangers. Parents have to realize that adolescent anxiety is to be expected, and to comfort their teenagers, and themselves, by reminding them that they will grow up and out of it soon enough [16].” USE OF CANNABIS RISK Research published in the USA’s Proceedings of the National Academy of Sciences, found that: "Persistent cannabis use over 20 years was associated with neuropsychological decline, and greater decline was evident for more persistent users." Collectively, these findings are consistent with speculation that cannabis use in adolescence, when the brain is undergoing critical development, may have neurotoxic effects. Young people who smoke cannabis for years run the risk of a significant and irreversible reduction in their IQ, according to a study of around 1,000 people Dunedin in New Zealand, over 20 years. An international team found those who started using cannabis below the age of 18, while their brains were still developing, suffered a drop in IQ. People who use the drug often seem to under-achieve. The subjects were assessed as children, before any of them had started using cannabis, and then re-interviewed them repeatedly, up to the age of 38. Taking into account other factors such as alcohol or tobacco dependency or other drug use, as well the number of years spent in education, it was found that those who persistently used cannabis smoking it at least four times a week year after year through their teens, 20s and, in some cases, their 30s - suffered a decline in their IQ. The more that people smoked, the greater the associated loss in their IQ. Researchers found that individuals who started using cannabis in adolescence and then carried on using it for years showed an average eight-point IQ decline. Stopping or reducing cannabis use failed to fully restore the lost IQ. ALL TERRIAN VEHICLES, ATV RISK The Consumer Product Safety Commission reports that 4,541 deaths were associated with ATVs from 1982 to 2001. During that same period, 37 percent of the injuries occurred to youth under the age of 16. Interestingly, 95 percent of the injured drivers under 16 rode adult-sized machines. INFLUENZA, FLU RISK The flu causes the death of 3,000-49,000 people in the USA every year, and about 500,000 globally. On average, about 24,000 Americans die each flu season, according to the Centers for Disease Control and Prevention (CDC). A vaccine is designed to anticipate the three (trivalent) to four (quadrivalent) most active strains for an upcoming flu season, though scientists sometimes get stumped by the rapidly mutating influenza viruses. Vaccination can make a person about 60 percent less likely to get sick. Even when the shot fails to prevent a bout of flu, it can make it much less severe extending over a few days of moderate sickness compared with up to two weeks otherwise. For more than 30 years, the vaccine has offered protection against only three influenza strains: two common Type A strains called H1N1 and H3N2, and one strain of Type B. Flu strains continually evolve, and the recipe for each year’s vaccine includes the subtypes of those strains that experts consider most likely to cause illness that winter. Certain quadrivalent vaccines will guard against four strains of flu rather than the usual three. They may prove more popular for children than their parents. That is because young people tend to catch the newly added strain more often. Type A flu causes more serious disease and deaths, especially the H3N2 form that made 2012 a nasty flu season. But the milder Type B flu does sicken people every year as well, and can kill. Two distinct Type B families circulate the globe, making it difficult to know which to include in each year’s vaccine. Adding both solves the guesswork, and a CDC model estimates it could prevent as many as 485 deaths a year depending on how much Type B flu is spreading. Traditional flu vaccine is made from viruses grown in eggs, and specialists say it is usually not a problem unless someone has a serious egg allergy. The FluBlok vaccine eliminates that concern because it is made with cell technology, like many other non-flu vaccines. The Fluzone High-Dose for seniors vaccine protects against the traditional three strains of flu, but it quadruples the standard vaccine dose in an effort to rev-up ageweakened immune systems that do not respond as actively to regular flu shots. The pharmaceutical company Sanofi Pasteur said initial results from a study of 30,000 seniors vaccinated over two flu seasons suggest the high-dose shot is about 24 percent more effective. The flu costs USA employers $10.4 billion in direct costs of hospitalization and outpatient visits per year. Americans are not very good about going in for checkups or for getting the recommended shots. About 37 percent get vaccinated by November, when the outbreak starts to pick up and then peaks in the Januray-February time frame. It takes two weeks for the vaccine to take full effect. Influenza is present not only in humans, but also in other animals like birds and pigs. Sometimes, a virus jumps between species or combine its genes with a humanspecific version, creating a deadly and highly infectious new variety. New strains constantly emerge to which humans have not developed immunity. Early fall is ideal for vaccination, as it is impossible to predict when flu will start spreading and it takes about two weeks for protection to kick in. Later vaccination is not too late as the flu season typically peaks in January or February. In an average year, the flu lands 200,000 Americans in the hospital. In adults, it imposes an economic burden of $83 billion per year in the USA, a number equal to the annual budget for the state of Florida. RISK OF FLU VACCINES The influenza vaccines are not as effective as most people assume. The effectiveness of the flu shot each year varies significantly and across age groups. That is because the shot is meant against last year’s flu strains. In the flu year of 2012–13, the shot was estimated to be effective for only 32 percent of those above the age of 65. An article in “Morbidity and Mortality Weekly Report” in 2014 shows that this year’s vaccine is protecting an average of 61 percent of the population. For children aged 6 months to 17, the vaccine is proving to be 67 percent effective. For adults 18–64, it is 60 percent effective, and for people over 65, it is 52 percent effective. Although many who get flu shots may still get ill, those who do not get flu shots are far more likely to end up in a hospital, and even intensive care units, fighting for their lives. A study from Duke University published in the American Journal of Respiratory and Critical Care Medicine that looked at flu patients admitted to intensive care, shows that only two of 22 had gotten their shot. The Center for Disease Control and Prevention (CDC) reported in December 2013 that less than 45 percent of eligible Americans got a flu shot in the 2012–13 season, but estimated those shots prevented 6.6 million cases of influenza and kept 79,000 people out of the hospital. The compositions of the vaccines vary from year to year. The 2013-2014 season’s vaccine dose contains protection against an H1N1 strain, an H3N2 strain and a virus known as B/Massachusetts/2/2012. The FDA committee advised adding a fourth strain known as B/Brisbane/60/2008 to the mix for 2014–15. DOG BITES RISK Dog bite losses exceed $1 billion per year. There have been 30 to 35 fatal dog attacks in the USA annually. Each year, more than 350,000 dog bite victims are seen in emergency rooms, and approximately 850,000 victims receive some form of medical attention. That is about 1,000 USA citizens per day. Based on data collected in the USA between 2001 and 2003, the CDC concluded that there were 4.5 million dog bite victims per year, and that figure appears to be rising. Utility workers and postmen are frequent targets of these attacks. One of five dog bites results in injuries that require medical intervention and treatment. Even for those who escape being bitten, they sometimes get hurt in the process of getting away from a dog. Even a friendly dog could become frightened or aggressive around strangers. According to the American Society for the Prevention of Cruelty to Animals (ASPCA), ½ of all American children suffer at least one dog bite before the age of 12. Most of these bites are not from strange animals. It is usually the family pet or a friend or neighbor’s dog that does the biting. The dog strains responsible for serious injury and death are pit bulls, rottweilers, their close mixes and wolf hybrids. Dog bites occur every 75 seconds in the USA. TELEVISION AND FURNITURE TIP-OVER RISK The USA Consumer Product Safety Commission (CPSC) estimates about 43,000 people are injured in a television or furniture tip-over related incident each year, more than 25,000, or 59 percent, of whom are children. Examples are falling dressers, wall units or 50- to 100-pound television units. The statistics show that 349 people were killed between 2000 and 2011 by a falling television, appliance or piece of furniture, 84 percent of them were kids younger than 9 years old. Falling televisions were more deadly, accounting for 62 percent of these fatalities. In 2011, a record 41 tip-over related fatalities occurred. Three children are injured by a tip-over every hour, or 71 children per day, and one child is killed every two weeks. Seventy percent of injuries involving children were caused by televisions, followed by 26 percent caused by furniture like dressers or tables. Known causes of tip-overs included climbing (36 percent of cases involving children), hitting or kicking (14 percent) or playing nearby (7 percent). Some of these incidents are occurring as families swap out their heavier, older TVs for flat-screen models. The CPSC received reports that older, heavier television were moved to other areas of the house like the bedroom, where they were placed without a proper stand or anchoring device. Children younger than 3 years are especially likely to be curious and reach for or try to hold onto a television. Potential injuries include traumatic brain injuries, neck injuries and abdominal trauma such as to the liver or spleen. The CPSC also reported incidents of fractures, bruises and cuts caused by the tip-overs. If a TV cannot be anchored or mounted on a wall properly, then it's safer to place the TV on a low sturdy base. Other recommendations from the CPSC include keeping remote controls, toys and other items that might attract children off of television stands and furniture and making sure cords and cables are out of reach. Anti-tip brackets should also be installed on televisions and freestanding kitchen ranges, ovens and other appliances. HYPOTHERMIA RISK Hypothermia occurs when the normal body temperature of 98.6 oF or 37 oC falls below 95 oF or 35 oC. It follows exposure to low temperatures, high winds or wet clothing. Body heat would be lost at a higher rate than it is produced using up the body’s stored energy. A number of symptoms to hypothermia appear as fatigue, drowsiness, uncontrolled shivering, slurred speech, clumsy movements, irritability, irrational behavior or general confusion. The low body temperature affects the human brain making it difficult to think clearly or move well. A person affected by hypothermia should be moved to a warm dry area, with any wet clothing removed as immediate medical assistance is invoked. The wet clothing would be replaced and the affected person wrapped in a blanket or material that will retain the body heat. To warm the body’s core temperature the affected person should be encouraged to move his legs and arms to generate heat from muscle movement. Caffeinated drinks should be avoided as they cause dehydration. Health conditions including cardiovascular disease, diabetes, hypertension, or taking medicines make people more susceptible to health hazards associated with cold exposure. FROSBITE RISK Frosbite is the freezing of the layers of skin and tissue if people are not dressed properly in cold weather. The ensuing symptoms include pale or waxy white skin color and numbness. It usually affects the extremities such as the fingers, toes, feet, ears and nose. It can damage body tissues permanently and in the extreme require amputation of the affected parts if gangrene is generated. An affected person should be moved to a dry area and any wet or constrictive clothing affecting the blood supply to the affected area should be removed. Warm water can be applied to the affected area. Heating pads, hot water, heat lamps and radiators are not recommended as the areas that are numb can be easily burnt. The affected areas should not be rubbed as it can cause further tissue damage. SUGARY DRINKS RISK Sugar-sweetened beverages are linked to more than 180,000 obesity-related deaths worldwide each year, according to research presented at an American Heart Association conference. This means about one in every 100 deaths from obesity-related diseases is caused by drinking sugary beverages. Among the world's 35 largest countries, Mexico had the highest death rates from sugary drinks, and Bangladesh had the lowest. The USA ranked third. The American Beverage Association dismissed the research as "more about sensationalism than science." When people drink too many beverages containing added sugar, such as soft drinks, fruit drinks, energy or sports beverages, they tend to put on weight. These added pounds increase the risk of developing diabetes, cardiovascular disease and some cancers; conditions often referred to as obesity-related diseases. Researchers at Harvard Universitywanted to find out how often people around the globe drank sugar-sweetened beverages looked at 114 national dietary surveys covering more than 60 percent of the world's population. They also used evidence from studies published in medical journals that discussed sugary drinks and other dietary habits. Their data was included in the 2010 Global Burden of Disease Study, which looks at the health and mortality of populations across the world. The researchers looked at factors that can affect weight such as TV watching, changes in physical activity levels, smoking and the consumption of all kinds of food and drink. When the researchers controlled for these factors, they were able to determine what percentage of deaths from diabetes, heart disease and cancer were linked to sugary drinks. The investigators examined changes in sugar-sweetened beverage consumption and then its association with change in body fatness or Body Mass Index (BMI), and subsequent deaths from cardiovascular disease, diabetes and cancer. Scientists found that more people died from diabetes, heart disease and cancer in parts of the world where consumption of sugary drinks is high. Of the nine world regions in 2010, Latin America and the Caribbean had the most diabetes deaths linked to sugary drinks with 38,000. East and Central Eurasia had the most cardiovascular deaths at 11,000. In the USA, sugary drinks were linked to the deaths of 25,000 people from diabetes and other obesity-related diseases. As in many other countries, the death rates were highest in young adults under age 45, with one in 10 obesity-related deaths associated with sugary beverages. Almost 3/4 of the deaths caused by sugary drinks are in low and middle income countries. The average consumption of sugar-sweetened beverages in Mexico, the country with the highest death rates among larger nations, was 24 ounces per day. The body does not seem to detect fullness as well when you drink sugary drinks. That is one explanation for why sugar-sweetened beverages are associated with obesity. The American Heart Association (AHA) came out with a scientific statement about sugar intake and heart health because it says there is new evidence about the relationship between the two. The statement says some research has found a link between sugar consumption and cardiovascular disease, while other research has not found a direct link. The AHA says that the best way to maintain a healthy weight and to decrease the risk of heart disease is to eat a healthy diet and to limit added sugar to no more than 100 calories a day for women and 150 calories for men. Soft drinks and other sugar-sweetened beverages are the main source of added sugars in the American diet. One 12-ounce regular soda contains the equivalent of 10 teaspoons of sugar and has about 140 calories. “ADDED SUGAR” RISK The “added sugar” hidden in many processed foods substantially raises the risk of dying prematurely from heart problems by nearly three times greater than for people who eat only foods with little added sugar. Someone who normally eats 2,000 calories daily, even if consuming two 12-ounce or 340-gram cans of soda substantially increases the risk. For American adults, sodas and other sugary drinks are the main source of added sugar. Sugar has been shown to increase blood pressure and levels of unhealthy cholesterol and triglycerides; and also may increase signs of inflammation linked with heart disease. A study published in the Journal of the American Medical Association (JAMA), Internal Medicine in 2014 used national health surveys between 1988 and 2010 that included questions about people's diets were used to calculate risks of dying during 15 years of follow-up. More than 30,000 American adults aged 44 on average were involved. Previous studies have linked diets high in sugar with increased risks for non-fatal heart problems, and with obesity, which can also lead to heart trouble. But in the new study, obesity did not explain the link between sugary diets and death. That link was found even in normal-weight people who ate lots of added sugar. The researchers focused on sugar added to processed foods or drinks, or sprinkled in coffee or cereal. Even foods that do not taste sweet have added sugar, including many brands of packaged bread, tomato sauce and salad dressing. Naturally occurring sugar, in fruit and some other foods, was not counted. USA government dietary guidelines issued in 2010 say "empty" calories including those from added sugars should account for no more than 15 percent of total daily calories. The average number of daily calories from added sugar among USA adults is about 15 percent toward the end of the study, slightly lower than in previous years. The authors divided participants into five categories based on sugar intake, from less than the safest amount of 10 percent of daily calories to more than 25 percent. Most adults exceed the safest level; and for 1 in 10 adults, added sugar accounts for at least 25 percent of daily calories. The researchers had death data on almost 12,000 adults, including 831 who died from heart disease during the 15-year follow-up. They took into account other factors known to contribute to heart problems, including smoking, inactivity and excess weight, and still found risks for added sugar. Adults who got at least 25 percent of their calories from added sugar were almost three times more likely to die of heart problems than those who consumed the least at less than 10 percent. For those who got more than 15 percent; or the equivalent of about two cans of sugary soda out of 2,000 calories daily, the risk was almost 20 percent higher than the safest level. Sugar calories quickly add up: One teaspoon has about 16 calories; one 12-ounce can of non-diet soda contains has about 9 teaspoons of sugar or about 140 calories; many cinnamon rolls have about 13 teaspoons of sugar; one scoop of chocolate ice cream has about 5 teaspoons of sugar. CAFEINE ENERGY DRINKS RISK Figure 3. Caffeine energy drinks. Researchers at the University of Bonn, Germany imaged the hearts of 17 people an hour after they had an energy drink. They showed that heart contractions were more forceful after the drink. The team reported at the annual meeting of the Radiological Society of North America that children and people with some health conditions should avoid the drinks. The amount of caffeine in energy drinks is up to three times higher than in other caffeinated beverages like coffee or cola. There are many known side effects associated with a high intake of caffeine, including rapid heart rate, palpitations, rise in blood pressure and, in the most severe cases, seizures or sudden death. The research gave the participants a drink containing 32 mg / 100 ml of caffeine and 400 mg / 100 ml of another chemical, taurine. They observed the chamber of the heart that pumps blood around the body. They report that the left ventricle, was contracting harder an hour after the energy drink was taken than at the start of the study. They concluded that energy drink consumption has a short-term impact on cardiac contractility. It is not clear how this greater contractility of the heart impacts daily activities, athletic performance and people with heart disease. The researchers advise children and people with an irregular heartbeat to avoid the drinks [14]. SODIUM INTAKE RISK A small, steady reduction of sodium in the American diet could save up to half a million lives over the next decade. And a more rapid reduction could save even more lives; as many as 850,000. The New England Journal of Medicine describes how, since the early 1970s, when Finland launched a national campaign to reduce salt intake, daily consumption has dropped by 3,000 mgs / day in men and women, with a corresponding decline in death rates from stroke and coronary heart disease of 75 to 80 percent. Americans still consume a third more than the amount recommended for an otherwise healthy person and more than twice the amount recommended for people with high blood pressure, cardiovascular disease or kidney disease. Sodium is an essential dietary element, but a mere 200 mgs a day is all one needs for good health. The average American, however, takes in 3,300 mgs daily, primarily from salt added to foods prepared commercially and in restaurants. The USA federal Dietary Guidelines for Americans recommend a maximum of 2,300 mgs / day, about one teaspoon for an otherwise healthy person. The guidelines, and the American Heart Association, recommend an even lower limit, 1,500 mgs /day, for about 60 percent of American adults: those already afflicted with ailments adversely affected by sodium such as hypertension, and adults 51 years of age and older. Sodium in the diet causes the body to retain water, placing an added burden on the heart and blood vessels. The journal Hypertension, projects that 280,000 to 500,000 lives would be saved by a 40 percent reduction in sodium intake, to about 2,200 mgs / day over 10 years. An instantaneous reduction, to 1,500 mgs, could avert between 700,000 and 1.2 million deaths in 10 years. Sodium chloride (NaCl) or table salt is just one common dietary source of sodium. Others include Mono Sodium Glutamate (MSG), baking soda, baking powder, disodium phosphate and other Na compounds. About 80 percent of the salt in the American diet, however, is introduced in food factories and restaurant kitchens. Ten types of foods contribute more than 40 percent of the sodium consumed by Americans, according to the Centers for Disease Control (CDC) and Prevention. Other than anchovies, French fries and pretzels, the leading nine main sources of sodium are cold cuts and cured meats, pizza, poultry that is often infused with salt water, soups, sandwiches, cheese, pasta dishes, meat dishes and snacks. HOSPITAL ERRORS RISK About 180,000 patients die in hospitals each year from mistakes and substandard care. In a study, Consumer Reports rates hospitals with a safety score, and most are not making the grade. It looked at more than 2,000 hospitals with an eye on hospital-acquired infections, re-admission rates, lack of communication around medications and discharges, the overuse of CT scans and rate of complications. The Mayo Clinics in Florida, Arizona and Minnesota were all near the top in safety. MEAT AND EGGS HEART DISEASE AND STROKE RISK Dr. Stanley Hazen, of the Cleveland Clinic, USA, reports in the New England Journal of Medicine that red meat and eggs are linked to heart disease. It appears that it is not just what we eat, but how our bodies process it that leads to heart disease [4]. Eggs and meat have high amounts of the fatty substance “lecithin.” The bacterial population in the human gut digests lecithin, producing the chemical TMAO. The TMAO then enters the blood-stream where it makes likely for the arteries to clog. About 4,000 patients with suspected heart disease were followed for three years. Those that had the highest levels of TMAO were 2 1/2 times more likely to undergo a major cardiovascular event than those with the lowest levels, and the risk is higher with processed meats. People with normal or low cholesterol levels can suffer a heart attack. When the amount of gut bacteria is lowered, the TMAO levels also decreased, raising the possibility that heart disease could be prevented or treated by developing drugs that lower the TMAO level. FIZZY SWEETENED DRINKS RISK According to a study by Dr. Dora Romaguera of the Imperial College London, drinking at least one 330 ml can of sugary soft beverage every day leads to a 22 percent higher risk of developing Type-2 diabetes. This is attributed partially to the associated higher average body weight, as well as an associated higher level of insulin resistance in the body cells. Drinking artificially sweetened diet drinks similarly leads to a higher risk of diabetes, but this could be explained by the larger body size; a key contributor to the disease [5]. The research covered data on the consumption of sugar-sweetened and artificiallysweetened soft drinks in 28,000 Europeans. The results were published in the Diabetologia journal. When accounting for higher body weight, drinking at least one sugar–sweetened drink per day leads to an 18 percent higher likelihood to suffer from diabetes. Regularly drinking diet soft drinks, leads to an increased risk of diabetes caused primarily by the higher body weight. This implies that diet soft drinks may not trigger the same mechanisms as sugary soft drinks in the human body, but the use of diet soft drinks is not a refuge if body weight is not managed [5]. CAFFEINATED PRODUCTS RISKS Food manufacturers are marketing for adults caffeine in candy, nuts and other snack foods. Jelly Belly have 50 mg of caffeine in a 100 calorie pack. Decaffeinated coffee still has caffeine. A number of food products boast added caffeine for an energy boost. A caffeinated chewing gum was introduced, and later withdrawn, by Wrigley, a subsidiary of the Mars Company, and is called Alert Energy Gum. It contains 40 mg of caffeine, the equivalent of half a cup of coffee, and more than a 12 ounce can of Coke. The Food and Drug Administration (FDA) investigated the safety of energy drinks and energy shots, prompted by consumer reports of arrhythmias, heart palpitations, illness and death. The only time FDA explicitly approved the added use of caffeine in a food or drink was in the 1950's for cola drinks. Some people are sensitive to caffeine and may display more symptoms when using caffeine products such as tea, coffee, soft drinks, and some over-the-counter medications. Medical associations have warned that too much caffeine can be dangerous for children, who have less ability to process the stimulant than adults. The American Academy of Pediatrics suggests that caffeine has been linked to harmful effects on young people's developing neurologic and cardiovascular systems [6]. “CARAMEL COLORING” IN SOFT DRINKS The golden-brown color of many soft drinks comes from the chemical 4methylimidazole, or 4-MeI. On USA product labels it appears simply as "caramel coloring." Those who say the chemical may possibly cause cancer include The World Health Organization's International Agency for Research on Cancer and the state of California suggest that it is a possible carcinogen and California limits manufacturers to 29 micrograms of exposure for the average consumer per day. Foods exceeding that limit have to carry a warning label that reads: "WARNING: This product contains a chemical known to the State of California to cause cancer." When Consumer Reports purchased sodas in California and had them analyzed by a lab, it found that one 12-ounce serving of Pepsi One or Malta Goya exceeded the levels permitted without a warning label. Ten other brands tested by the group did meet the California standard, which is estimated to limit the risk of cancer from 4-MeI to one case in every 100,000 lifetimes of daily exposure. The Food and Drug Administration does not set federal limits on 4-MeI in food, and the data gathered by Consumer Reports show that in some cases consumers outside California are drinking a slightly different ingredient. For example, Pepsi One purchased by the group in December in New York contains four times as much 4-MeI as the same product bought that same month in California. In a statement to Consumer Reports, PepsiCo Inc. said data indicate that the average person consumes less than one-third a can of diet soda per day; therefore, its product meets the California standard, even if a complete serving exceeds that limit [14]. MENTAL DEPRESSION AND SUICIDE RISKS Suicide moved from being the eighth leading cause of death among middle-aged USA citizens to the fourth position, behind cancer, heart disease and accidents in 2010. The overall national suicide rate in the USA climbed from 12 suicides per 100,000 people in 1999 to 14 per 100,000 in 2010. The Center for Disease Control and Prevention (CDC) reports that there were 33,687 deaths from motor vehicle crashes in 2010, while more people at a 38,364 number, committed suicide. The rate among middle-aged Americans reached 28 percent in a decade within a period that includes the recession and the mortgage crisis. People aged 35- 64 account for about 57 percent of suicides in the USA. The trend was most pronounced among white males and females in that age group. Their suicide rate jumped 40 percent between 1999 and 2010. Luckily, the rates among younger and older people held steady. There was little change among middle-aged African-Americans, Hispanics and most other racial and ethnic groups. The increase among baby boomers in their 50s may be a characteristic of their generation, as they also showed high rates of suicide in their teenage years. Suicides among middle-aged Native Americans and Alaska Natives climbed 65 percent to 18.5 per 100,000. The overall numbers remain very small at 171 such deaths in 2010. Guns are instrumental in nearly half of all suicides in that age group in 2010. Hangings overtook drug overdoses, becoming the second most frequent manner of suicide. Other methods do not result in death. The individual survives, often with even more mental torment, physical scars and other side-effects. DISTRACTED DRIVING RISKS According to the Illinois Governor’s Highway Safety Association, drivers are 4 times more likely to cause an accident while talking on a cellular phone or driving while intoxicated. The likelihood doubles to 8 times if texting is involved. About ½ million people were injured in distracted driving accidents [7]. The youngest and most inexperienced drivers are most at risk with 16 percent of all distracted driving crashes involving drivers under the age of 20 years. Statistics reveal that during daylight hours 800,000 vehicles are driven by somebody using a hand-held cellular phone. Texting is of most concern since it involves multitasking in manual, visual and cognitive skills. Reading or sending a text takes the eyes off the road for 4.6 seconds, during which a car driving at 55 miles/hours travels the length of an entire football field [7]. As of January 1st, 2013, the State of Illinois has instigated the following laws to reduce the risks of distracted driving [7]: i) Ban on texting for all drivers. ii) Ban on the use of cell-phones for novice drivers (hand-held and hand-free). A novice driver is a person under the age of 19 who is driving on an instruction permit or graduated driver’s license. Emergency use of a cell-phone is allowed for these drivers. iii) Ban on use of cell-phones while driving in a school zone or construction zone. (handheld and hands-free) iv) Ban on use of hand-held cell-phones within 500 feet of an emergency scene. (Certain exclusions apply) v) Ban on use of cell-phones by bus-drivers. (hand-held and hands-free) RISK FROM ANESTHESIA IN THE ELDERLY Older people who undergo general anesthesia for major surgery have a 35 percent higher risk of developing dementia later in life. The “Three-City Study” included thousands of people age 65 and older in Bordeaux, Dijon and Montpellier in France starting in 1999. In a subpopulation of 7,008 citizens, 632 participants developed dementia over the course of the study, and those patients were more likely to have had general anesthesia than those who did not develop mental deterioration. A theory exists that post-operative cognitive dysfunction, a common complication in elderly patients in which their thinking and memory is temporarily impaired, is associated with a higher risk of developing dementia. Previous research has suggested that some anesthetics may prompt inflammation of neural tissues, leading to early signs of Alzheimer’s disease including amyloid plaques and protein tangles in the brain [8]. DEHYDRATION RISKS The human body consists of 60-70 percent water. Symptoms of dehydration include a dry and a sticky mouth, sunken eyes, low tears production, little to no urine output and lethargy, according to the National Institutes of Health (NIH). Insufficient water intake could lead to low blood pressure and a rapid heart rate. Water consumption moistens the lungs, whose function uses about a pint of water per day, releasing water through the exhalation process. People who do not drink enough fluids can accumulate excess body fat, show poor muscle tone and a decreased ability to digest food. The general recommendation is to use 8-10 glasses of water per day. Whereas caffeinated and alcoholic beverages are liquid; soda beverages, coffee and tea are diuretic and cause the body to become dehydrated by hastening the body's elimination of fluids. Mild symptoms of dehydration include heart burns, stomach aches, lower back pain, headaches and depression. HYPONATREMIA, WATER INTOXICATION RISKS Too much water intake over a short period of time can be dangerous and even fatal. If a person drinks more water than his/her kidneys can excrete, the overall electrolyte level in the blood will drop significantly and the excess water can enter and swell the brain cells, resulting in a potential seizure and/or a coma. A result of too much water consumption is hyponatremia, a decrease in the blood's Na level. If more water enters the body than the kidneys can process, the mineral content of the blood decreases and the blood's overall Na levels drop. When Na and other electrolyte levels such as K drop in the blood, water can escape the blood and enter the cells as the blood and the cells struggle for electrolyte levels equilibrium. Water intoxication occurs when hyponatremia leads to cerebral edema. The swelling of cells because of water retention becomes risky if it occurs in the brain, which is known as cerebral edema. Brain cell swelling within the confines of the skull could lead to irreversible brain damage. The symptoms of cerebral edema mirror other brain conditions such as tumors and concussions. They start with a headache that increases in intensity followed by mental confusion and seizures. Vomiting and exhaustion are possible. As the brain cells continue to swell, the risk of death from water intoxication increases. An increase in water will add to the body's overall blood volume and place a strain on the heart and the circulatory system. Water drinking contests, are risky from this perspective. Marathon runners are at risk if they try to rehydrate too quickly. The best strategy is to ration the rehydration process over a period of time. GRAIN BIN ENTRAPMENT Farmers get into grain bins to unplug jammed grain. The grain acts like quicksand and can literarily drown those caught in it. A total of 180 fatalities over 28 years occurred over the period 1984-2012, or about 6.4 fatalities per year. A total of 92 fatalities have been listed over the 2006-2011 period at an average of 15.3 fatalities/year. Associated accidents are grain bin collapses and suffocation due to the formation of toxic gases from fires. In 2012, the primary medium of entrapment was soybeans (7 cases) followed by corn (4 cases). Since 1965, there were 1,500 fatal and non-fatal grain entrapments cases. Of 19 entrapments reported in 2012, eight resulted in death, compared with 11 in 2011, 31 in 2010, 19 in 2009, 17 in 2008 and 16 in 2007. GRAIN ELEVATORS DUST EXPLOSIONS The storage and conveyance of grain leads to the generation of dust with a large surface area in which a spark from a starting motor or a cigarette light can initiate a deflagration in the grain dust. In December 1977, a series of five grain elevator explosions killed 59 people and injured 48. Table 10. Dust explosions statistics. Source: OSHA, USA Department of Labor. Year 1976-1989 1990-1999 2000-2010 2011 2012 Number 281 130 89 3 7 Injuries 480 119 77 1 6 Deaths 155 15 7 7 0 Figure 4. Suspected dust explosion and fire aftermath, Broadlands Grain Elevator, Illinois, summer 2013. Photos: B. Ragheb. INTERNET COUNTERFEIT DRUGS RISKS The National Association of Boards of Pharmacy reviewed 10,000 internet drug websites and suggests that 97 percent of them were peddling counterfeit or substandard medications. The National Crime Prevention Council and the USA Food and Drug Administration, after studying the drugs, found the following characteristics to be most prevalent: 1. Some of the counterfeit drugs were found to contain toxic materials as fillers such as drywall, antifreeze and yellow highway paint. 2. Some tested drugs contained three times the active ingredient of their non-counterfeit counterparts. In one case, the counterfeiters emptied bottles of the anti-psychotic drug Zyprexa, replacing them with aspirin. 3. Some fake drugs contain some active ingredient, but are sub-potent, which is hazardous in the treatment of diseases such as malaria and HIV. 4. Some of these drugs are nothing but chalk or water. A version of the growth hormone drug for AIDS patients Serostim, was found to have no active ingredient at all. Patients cannot tell the difference in the imitations without going through detailed laboratory testing. According to the Smithsonian magazine, the anti-malarial drug Artesunate was counterfeited with flour. In 2009, the World Health Organization (WHO) estimated that counterfeit drugs were associated with 20 percent of the 1 million deaths from malaria worldwide, for a total of 106 x 0.2 = .200,000 cases. As forged labeling continues to get sophisticated, wholesalers are buying from multiple sources while shopping for the best price, jumbling up the product line. A growing number of high-demand, but expensive new pharmaceutical treatments allows forgers to rake in substantial profits. In addition, criminals are attracted to the fake drugs business, because they can get away with short prison terms or just fines when they are caught. Loopholes in regulation from country to country make it easy for unscrupulous individuals or organized crime to exploit the situation, making huge profits before disappearing from the market. RISK FROM ARSENIC IN APPLE JUICE The USA Food and Drug Administration (USFDA), after decades of consideration, proposed limiting the amount of inorganic arsenic in apple juice to the same level of the potential cancer-causing chemical allowed in USA drinking water. The USFDA proposed a limit of 10 parts per billion (ppb) for inorganic arsenic in apple juice, the level set by the USA Environmental Protection Agency (EPA) for arsenic in drinking water. Inorganic arsenic may be found in foods because it is present in the environment, both as a naturally occurring mineral and due to the use of arsenic-containing pesticides. Inorganic arsenic has been associated with skin lesions, developmental effects, cardiovascular disease, neurotoxicity and diabetes. Organic forms of arsenic, also found in soil and ground water, are considered essentially harmless. OBESITY RISK About 18.2 percent of premature deaths in the USA between 1986 and 2006 were associated with excess body mass, according to a team of sociologists led by a Columbia University demographer. That estimate, published in the American Journal of Public Health, is far higher than the 5 percent toll widely cited by researchers. The new figures do not reflect newly discovered facts about obesity's effects on health. Rather, they emerged after the researchers applied a finer-grained approach to examining obesity across the USA population [9]. Using historical survey data, the study authors toted up differences in excess weight status across different gender, ethnic and age groups. They combined that data with existing "mortality risk" statistics to estimate how many Americans over age 40 who died during that 20-year period did so because of weight-related causes. The study makes clear that as obesity has become more widespread across successive waves of American generations, it has the momentum to reduce the average life expectancy of an entire population for many years to come. Some premature deaths could still be prevented by public campaigns or medical therapies that drive down obesity or its effect on health. The study found that weight-related early mortality had struck American women harder than men, and that African American women had suffered the most. The premature deaths of 21.7 percent of white women between 1986 and 2006 could be attributed in part to excess weight, as could 26.8 percent of early deaths among African American women. Among white men, 15.6 percent of premature deaths in that period were linked to excess weight. Among black men, the figure was only 5 percent. Though African American men have high rates of obesity, they are also more likely than all other groups to die prematurely of other causes, such as injury or violence. The latest calculation calls into question the emerging belief that obesity in old age confers some protection against premature death or the so-called obesity paradox that has given comfort to many older adults struggling to shed weight. The study concluded, the probability of death among those carrying excess weight continued to rise after age 60, and did so steeply [9]. SURGICAL PROCEDURES INFECTION RISK A report shows that 198 patients acquired new infections while being treated at New Hampshire hospitals in 2012. New Hampshire’s 31 hospitals have been required since 2009 to provide data on patients who develop infections after heart, colon and knee surgeries or through central lines or catheters inserted in blood vessels near the heart or another major vessel. This includes 116 surgical site infections, 21 bloodstream infections associated with central lines and 61 urinary tract infections. RISKS OF SPICES USE IN FOOD According to the USA Food and Drug Administration (USFDA), 7 percent of imported spices over a three-year period were contaminated with the salmonella pathogen. In a report released on October 30, 2013, the USFDA says testing of imported spices between 2007 and 2010 showed that spices were twice as likely as other inspected foods to be contaminated with the pathogen. More than 80 different types of salmonella were detected. The study looked at spices imported from several countries, with many of the shipments coming from India, Mexico, Thailand and Vietnam. In 2009 and 2010, black pepper and red pepper from India, Vietnam and China used in salami caused hundreds of illnesses. The FDA says there have been 14 known outbreaks around the world since 1973, causing almost 2,000 illnesses, many of which were in children. During the three-year period, 749 shipments of spice were refused entry into the USA because of salmonella contamination, while 238 other shipments were denied because of the presence of what the FDA calls "filth" as insects, excrement, hair or other materials. The USFDA said some of the spices that were found contaminated at the border were later cooked or treated to eliminate possible pathogens, so much of the salmonella was likely gone by the time the spices were eaten. The agency also noted that the amount of spice generally eaten at a meal is small, meaning people have less of a chance of getting sick from a contaminated spice than a contaminated fruit or vegetable. Most all of the spices eaten in the USA are imported, and most come from small farms in a variety of countries that have different levels of food safety oversight. The report says spices are produced by a wide variety of agricultural practices, including "on very small farms where farm animals are used to plow, crops are harvested by hand, and spices are dried in open air." All of these practices have potential for animal, bird or human contamination. Off the farm, spices from the small farms are often combined, sold to exchanges or packing companies, or stored for years, increasing the chances that they are temporarily in unclean circumstances. The chances of someone getting sick can be reduced by adding spices to food before it is cooked. Problems arose because of generally unhygienic conditions, including the failure to limit animal and insect access to food and not taking steps like irradiation to kill any potential pathogens. RISK IN ANTIBACTERIAL SOAPS The USA Food and Drug Administration (FDA) warned that antibacterial chemicals in soaps and body washes may pose health risks. It proposed a rule requiring manufacturers to prove such soaps are safe and more effective against infection than plain soap and water. Studies indicate an ingredient in such products could scramble hormone levels and boost drug-proof bacteria. The proposal rule does not apply to alcohol-based hand sanitizers and products used in healthcare settings. Data suggest that the risks associated with long-term, daily use of antibacterial soaps may outweigh the benefits. Certain added ingredients in such products such as “triclosan” in liquid soaps and “triclocarban” in bar soaps, may contribute to bacterial resistance to antibiotics. Such products may also have "unanticipated hormonal effects that are of concern.” Recent studies of such chemicals on animals have shown they may alter hormones, the FDA said, but such results have not yet been proven in humans. In March 2013, a federal appeals court approved a lawsuit by the non-profit Natural Resources Defense Council, aimed at forcing the FDA to review the health impacts of triclosan. MEDICAL DEVICES AND ROBOTIC SURGERY RISK In robotic surgery, a physician sits at a console several feet from the patient and peers into a high-definition display. Foot pedals and hand controls maneuver mechanical arms equipped with tools, guided by a 3-D camera that shows the work as it is done inside a patient. Officials in Australia and the UK tracked hip implants in their countries using registries and first demonstrated high failure rates with metal-on-metal hip implants. Australia’s registry noticed high failure rates in one metal hip model as early as 2007, according to the website of Australia’s Therapeutic Goods Administration. Johnson & Johnson cited failure rate data from the British registry as it recalled two of its metal-onmetal devices in August 2010. In 2012, the British data showed metal-on-metal hips from various manufacturers failed at high rates, according to results published in The Lancet. The USA’s Food and Drug Administration (FDA) made an “initial communication” about potential long-term risks of removable filters to prevent lung blood clots in August 2010, after it received more than 920 reports of serious problems from the filters over five years. The agency’s warning was issued the same day as the Journal of the American Medical Association (JAMA) Internal Medicine released a study showing some models of the devices could fracture in as much as 16 percent of patients, sometimes leaving shards impaled in internal organs. The Intuitive robotic surgery system was cleared by the FDA in 2000, after a trial, done in a Mexico City hospital, of 233 patients in two kinds of surgery, gall bladder removal and heartburn operations. In 2013, it was used in the USA for everything from hysterectomies to heart-valve procedures to operations for head-and-neck and prostate cancer. Few robotic operations have been studied in large randomized trials to identify the advantages and disadvantages, compared with standard less-invasive operations. The FDA received 3,697 adverse reports involving deaths, injuries, or malfunctions linked to robotic surgery procedures in 2013 through November 3, compared with 1,595 in all of 2012. Some of the increase may have come as the result of media attention, announcement of recalls of robotic instruments, or more device use, The number of robotic operations rose 18 percent worldwide in the first nine months of 2013 compared with the first nine months of 2012, according to a regulatory filing from the Intuitive medical robotics company. In 2013, the FDA surveyed 11 doctors who have performed from 70 to 600 robot surgeries each using Intuitive’s robotic instrument, the only such product cleared in the USA for a wide variety of soft tissue procedures such as gynecologic and prostate operations [13]. FRAGMENTED SLEEP RISK A study published in the journal “Cancer Research” suggests that “Fragmented sleep” changes how the immune system deals with cancer in ways that make the disease more aggressive. Toll-like receptor 4, a biological messenger, helps control activation of the innate immune system. It appears to be a lynchpin for the cancer-promoting effects of sleep loss. The researchers used mice, housed in small groups. During the day—when mice normally sleep—a quiet, motorized brush moved through half of the cages every two minutes, forcing those mice to wake up and then go back to sleep. The rest of the mice were not disturbed. After seven days in this setting, both groups of mice were injected with cells from one of two tumor types (TC-1 or 3LLC). All mice developed palpable tumors within 9 to 12 days. Four weeks after inoculation the researchers evaluated the tumors. They found that tumors from mice with fragmented sleep were twice as large, for both tumor types, as those from mice that had slept normally. A follow-up experiment found that when tumor cells were implanted in the thigh muscle, which should help contain growth, the tumors were much more aggressive and invaded surrounding the tissues in mice with the fragmented sleep. PESTICIDES EXPOSURE RISK A study that was published in the Journal of the American Medical Association (JAMA} Neurology reveals that patients with Alzheimer's disease have significantly higher levels of DDE, the long-lasting metabolite of the pesticide DDT, in their blood than healthy people. In a case-control study involving 86 Alzheimer's patients and 79 healthy elderly controls, researchers found that DDE levels were almost four times higher in serum samples from Alzheimer's patients than in controls. Having DDE levels in the highest third of the range in the study increased someone's risk of Alzheimer's by a factor of four. The study identifies a strong environmental risk factor for Alzheimer's disease. The magnitude of the effect is large and is comparable in size to the most common genetic risk factor for late-onset Alzheimer disease. BISPHENOL A, BPA AND PHTHALATES AND OTHER INCORPORATED CHEMICALS RISK Bisphenol A, or BPA, and phthalates are referred to as "everywhere chemicals" because they are found in so many products such as water bottles and kitchen vinyl flooring. BPA epoxy resins can leach into food from the lining of metallic food cans. In one CDC study, researchers found traces of BPA in the urine of nearly all 2,517 participants. BPA is frequently found in plastic wrap, although many companies have started to remove BPA from their products. Scientists have voiced concerns about these chemicals disrupting our bodies' hormones. Recent studies link them to a variety of fertility problems in men and women. The FDA says it is investigating the safety of BPA and monitoring the exposure to phthalates. Most people's exposure to BPA comes from food and water stored in plastic containers, according to the Centers for Disease Control and Prevention. BPA can leach from these containers into meals, especially when they are heated in microwave ovens. The number of chemicals known to be toxic to children's developing brains has doubled over the last seven years. These chemicals can enter the brain through the blood brain barrier and cause neurological symptoms. When this happens in children or during pregnancy, those chemicals are extremely toxic, and the effects are permanent. Five chemicals are identified as neuro-toxicants which are substances that impact brain development and can cause a number of neurodevelopmental disabilities including Attention Deficit Hyperactivity Disorder (ADHD), autism, dyslexia and other cognitive damage: lead, methyl-mercury, arsenic, Poly-Chlorinated Biphenyls, or PCBs, and toluene. Six more chemicals have been added to the list: manganese; fluoride; tetra-chloro-ethylene, a solvent; a class of chemicals called poly-brominated-diphenyl ethers, or flame retardants; and two pesticides, chlorpyrifos, which is widely used in agriculture, and dichlorodiphenyl-trichloroethane, or DDT. Banned in the United States in 1979, PCBs were used in hundreds of products including paint, plastic, rubber products and dyes. Toluene exists in household products like paint thinners, detergents, nail polish, spot removers and antifreeze. Fluoride, in tap water in many areas, leads to a decline on average of about seven IQ points in Chinese children. At least 1,000 chemicals using lab animals have shown that they somehow interfere with brain function in rodents as rats and mice, and those are prime candidates for regulatory control to protect human developing brains. But this testing has not been done systematically. At greatest risk are pregnant women and small children as the biggest window of vulnerability occurs in utero, during infancy and early childhood. Beyond reduced IQ, shortening of attention span, increased risk of Attention Deficit Hyperactivity Disorder (ADHD) are observed. These include emotional problems, less impulse control, being more likely to make bad decisions, get into trouble, dyslexia and dropping out of school. These are problems that are established early, but travel through childhood, adolescence, even into adult life. In 2007, the European Union adopted regulations known as Registration, Evaluation, Authorization and Restriction of Chemicals (REACH) to protect human health from risks posed by chemicals. REACH covers all chemicals, placing the burden of proof on companies to prove that any chemicals they make are safe. Example of products banned in Europe but marketed in the USA are cosmetics and phthalates. Phthalates are a group of chemicals used in hundreds of products from cosmetics, perfume, hair spray, soap, shampoos, plastic and vinyl toys, shower curtains, mini-blinds, food containers and plastic wrap, shampoos and lotions. Phthalates are used in hair spray to help avoid stiffness; they allow the spray to form a flexible film on the hair, according to the FDA. They are found in plastic plumbing pipes, medical tubing and fluid bags, vinyl flooring and other building materials. They are used to soften and increase the flexibility of plastic and vinyl. The floors and walls of homes may also contain phthalates. A 2010 test of four representative vinyl flooring samples found four of the six phthalates severely restricted in children's products, with levels as high as 84,000 parts per million or 84 times what is allowed in toys. Phthalates previously were used in pacifiers, soft rattles and teethers. In 1999, after a push from the USA Consumer Product Safety Commission, American companies stopped using them in those products. The Food and Drug Administration asserts that two of the most common phthalates; di-butyl-phthalate, or DBP, used as a plasticizer in products such as nail polishes to reduce cracking by making them less brittle, and di-methyl-phthalate, or DMP used in hairsprays, are now rarely used in the USA. Di-ethyl-phthalate, or DEP, used in fragrances, is the only phthalate still used in cosmetics, according to the FDA. An expert panel that convened from 1998 to 2000 by the National Toxicology Program (NTP), part of the National Institute for Environmental Safety and Health, concluded that reproductive risks from exposure to phthalates were minimal to negligible in most cases. Toothbrushes can contain phthalates and dental materials used to treat and prevent cavities can contribute to very low-level BPA exposure for a few hours after placement, according to the American Dental Association. Phthalates can be found in kids' toys, rattles and teethers. If a plastic product is flexible, it probably contains phthalates unless the label specifically says it does not, according to the National Institute of Environmental Health Sciences. The biggest risk comes from items children place in their mouths. Congress has permanently banned three types of phthalates: DEHP, DBP and BBP1, in any amount over 0.1 percent in many children's products. The Environmental Working Group; an environmental health research organization that specializes in toxic chemical analysis, has long called for reforms. In 2004, the group tested 10 samples of umbilical cord blood for hundreds of industrial pollutants and found an average of 200 in each sample. The 1976 Toxic Substances Control Act governs the exposure of toxic chemicals. BPA is an endocrine disrupter that can mimic estrogen. In 2012, the Food and Drug Administration said BPA could no longer be used in baby bottles and children’s drinking cups. Canadian regulators formally declared BPA a toxic substance in 2010 and banned it from all children’s products. The American Chemistry Council, an industry trade group, has said BPA is safe and has opposed federal and state legislative proposals to ban it [19]. A study, published in Hypertension, a journal of the American Heart Association, used a randomized controlled trial. The authors, a team from Seoul National University’s department of preventive medicine in Korea, recruited 60 older subjects, most of whom were women, and assigned them to drink soy milk from cans or glass bottles on three separate occasions, weeks apart. A majority had no history of high blood pressure, though some did. The researchers chose soy milk because it does not have any properties that are known to increase blood pressure. And unlike soda, fruit juice and other acidic beverages, which are more likely to leach BPA from containers, soy milk is considered fairly neutral. When the subjects drank from glass bottles, the study found, their urinary BPA levels remained fairly low. But within two hours of drinking from a can, their levels of BPA were about 16 times higher. As BPA levels rose, so too did systolic blood pressure readings – on average by about five millimeters of mercury. In general, every 20 millimeter increase in systolic blood pressure doubles the risk of cardiovascular disease [19]. BPA is known to block certain estrogen receptors that are thought to be responsible for repairing blood vessels and controlling blood pressure. The chemical may also affect blood pressure indirectly by disrupting thyroid hormone. A study in the journal Environmental Health Perspectives found that plastic products advertised as BPA-free still leached chemicals with estrogenic activity, and some of these chemicals were even more potent than BPA [19]. VITAMIN C DEFICIENCY STROKE RISK According to the American Academy of Neurology, consuming foods that contain Vitamin C may lower the risk of the most common kind of hemorrhagic stroke. Fruit and vegetables, such as oranges, papayas, peppers, broccoli and strawberries, contain Vitamin C. According to the American Stroke Association, hemorrhagic stroke accounts for approximately 13 percent of stroke cases. It results from a weakened vessel that ruptures and bleeds into the surrounding brain. The blood collects and compresses the surrounding brain tissue. The reported research involved 65 people who had dealt with an intra-cerebral hemorrhagic stroke. They were examined in contrast to 65 healthy people who had not experienced an intra-cerebral hemorrhagic stroke. The levels of vitamin C in their blood were obtained. Forty-one percent of cases had normal levels of vitamin C, while 45 percent had sapped levels of vitamin C and 14 percent were considered lacking the vitamin. The researchers discovered that, on average, the people who had a stroke had deficient levels of vitamin C, while those who had not experienced a stroke had normal levels of vitamin C. The results suggest that vitamin C deficiency should be considered as a risk factor for this severe type of stroke, as were high blood pressure, drinking alcohol and being overweight. Research is needed to explore specifically how vitamin C may help to reduce stroke risk. For instance, it may regulate blood pressure. RISK OF BRASS GAS CONNECTIONS Manufacturers have stopped making flexible gas connectors made of uncoated brass 4 decades ago, yet many homes still use these corrugated metal tubes for the connection of gas appliances such as stoves and water heaters. Some of these connectors have a serious flaw that places homes at risk for a leak and a fire or a gas explosion. Uncoated brass connection must be replaced by an AGA- certified plastic-coated brass or stainless steel connectors to connect gas appliances. PORTABLE AND STANDBY GENERATORS RISKS Portable generators are used by homeowners and contractors as a temporary power sources in the case of power outages or in the field if electrical connections are not available. Permanent or standby generators are run for an extended period of time using an independent fuel source such as propane gas or natural gas. Permanent generators are connected directly into the home power supply to operate sump pumps, and appliances like furnaces, well pumps and lights. Generators generate CO2 and CO and must not be used in an enclosed area like a garage. They must be used only in well-ventilated outdoor locations away from windows, doors and intake vents. A transfer switch needs to be professionally installed on permanent standby generators to disconnect the home from the power grid while the generator is in in use, to prevent the electrocution risk from the hazardous “back-feed” to the neighbors, the homeowner and to utility crews working on reconnecting the interrupted power supply that would triggered the operation of the standby generator. Portable and standby generators pose a risk of electrocution if operated in a wet environment. Under rainy or wet conditions outdoors they must be placed under a protective canopy and on a dry surface. Hands must be dry before touching the generator. The generator must be allowed to cool down before adding new fuel to avoid fire hazards. HEPATITIS C VIRUS (HCV) RISK Hepatitis C Virus (HCV) infection is a hazardous liver infection that has become the main cause of cirrhosis, liver cancer and liver transplants in the USA, according to the CDC. Some patients who contract HCV recover in a matter of weeks, but at least 75 percent of them eventually develop chronic infections that can last for the rest of their lives. The virus can be spread through contact with infected blood, such as infected blood transfusions or the use of infected hypodermic needles. Health experts estimate that hepatitis C now kills more Americans each year than HIV [15]. Analyzing data from thousands of people who participated in the National Health and Nutrition Examination Survey, researchers from the Centers for Disease Control and Prevention estimated that about 1 percent of the USA population over age 5 have hepatitis C. If so, that would translate to 2.68 million people with HCV. The researchers estimated that 900,000 additional people once had the liver disease but no longer have an active infection. Altogether, 1.3 percent of the USA population has a past or current HCV infection, according to a 2014 study published in the Annals of Internal Medicine [15]. Compared with Americans who never had the virus, those with chronic infections were more likely to have received a blood transfusion before 1992 and to have injected illicit drugs. However, 49 percent of people with chronic infections had neither of these risk factors in their history, therefore, “risk-based screening alone is an incomplete approach to identifying chronically infected persons. [15].” People with hepatitis C are more likely to be men; to be between the ages of 40 and 59; to have less education; and to have lower family income. Overall, 81percent of all people with chronic hepatitis C were born between 1945 and 1965. This is why the CDC recommends that all people born during that window to get tested at least once. Such screening would flag about 800,000 people who otherwise would not know they were infected; if all of them got treatment, an estimated 120,000 deaths due to HCV could be avoided [15]. RISK OF TESTOSTERONE INJECTIONS A National Cancer Institute study published on January 29, 2014 reiterates results from an earlier study that taking testosterone tempts a heart attack. About 3 percent of men in the USA 40 and older receive testosterone therapy. More than 55,000 men were studied for 90 days before receiving a prescription for testosterone therapy and for 90 days afterward. Their increased risk of heart attack or myocardial infarction went up by 36 percent overall. For men over 65 years of age, that risk doubled. A man over 65 taking testosterone is more than 70 percent more likely to have a heart attack within 90 days of starting treatment than a similar person who does not get the therapy. A study of men in the Veterans Affairs health care system published in November 2013 showed a 30 percent increase for risk of stroke, heart attack and death among those taking testosterone therapy. RISK OF BROAD-SPECTRUM ANTIBIOTICS USE The broad-spectrum “azithromycin” antibiotic is easy to take: one pill a day for five days. However, in many cases, azithromycin can make patients sicker, not better. Its widespread use as the most popularly prescribed antibiotic in the USA has helped superbugs, as well as many other threatening bacteria, become resistant to it. In just 2013, the FDA has warned that azithromycin can cause a fatal arrhythmia of the heart known as torsades de pointe. The Canadian Pediatric Society insisted that azithromycin not be used at all in cases of pneumonia, ear infections and sore throats in children. The Infectious Diseases Society of America has recommended that azithromycin not be used at all for sinusitis. A Centers for Disease Control study published on February 14 2014 in Morbidity and Mortality Weekly Report indicates that azithromycin is often ineffective in cases of shigella, a common but potentially fatal diarrhea. Often, there are better antibiotics to prescribe for common illnesses. In October 2013, a review study of 94 million patient visits to doctors published in JAMA Internal Medicine reported that in 73 percent of visits for acute bronchitis and 60 percent of visits for sore throats, patients left with prescriptions for antibiotics. New guidelines suggest only 10 percent of sore throat patients and no acute bronchitis patients should get prescriptions. About 15 percent of all the sore throat prescriptions in the study were made for azithromycin, which is often ineffective. Penicillin, which was prescribed in only 9 percent of cases, remains highly effective in treating sore throats. Researchers suggest that a cough from acute bronchitis, which typically follows a cold or flu, should go untreated for at least three weeks, the amount of time the body takes to overwhelm it. However, studies show that most sufferers in the USA go to their doctors for bronchitis within a week after symptoms begin, and they typically get a prescription. Overuse of antibiotics is not just causing rapidly increased resistance by bacteria. It causes allergies, yeast infections, nausea and an increasing association with irritable bowel syndrome. Countries that have recommended the use of narrow-spectrum antibiotics have seen a fall in their resistance rates. RISKS OF FARM-FED TILAPIA FISH According to the National Fisheries Institute, the Tilapia fish is the fourth most eaten seafood in the USA, behind shrimp, salmon and canned tuna. Its popularity comes from the fact that it is easy to farm, so it is inexpensive as it is adaptable to different types of feed. In 2008, researchers at the Wake Forest University School of Medicine released a study comparing fatty acid levels among popular fish. It found that tilapia contained far less omega-3 fatty acid than other American favorites, such as salmon and mackerel. According to the paper, salmon also has a “more favorable” omega-3 to omega-6 ratio. While both fatty acids are important, omega-3 has anti-inflammatory properties that play a critical role in brain development and cognitive function and may prevent diseases like diabetes and Alzheimer’s. The report suggested that the “inflammatory potential of hamburger (80 percent lean) and pork bacon is lower than the average serving of farmed tilapia (100 g).” The report caused concern when it stated that farmed tilapia contains high levels of arachidonic acid, an omega-6 fatty acid that, while necessary to help repair damaged body tissues, has been linked to brain disorders like Alzheimer’s disease and may exacerbate inflammation. The observation is that tilapia has as much omega-3 as other popular seafood, including lobster, mahi-mahi and yellow-fin tuna. Tilapia is also very low in fat. A 4-ounce serving of tilapia has about 1 gram of saturated fat, 29 grams of protein and around 200 mg of omega-3. By comparison, a 1-ounce serving of bacon of about 4 strips contains 4 grams of saturated fat, 10 grams of protein and 52 mg of omega-3. A rumor going around the Internet: that farm-raised tilapia from China are fed animal feces. A study conducted by the Economic Research Service of the USA Department of Agriculture noted that “many of China’s farms and food processors are situated in heavily industrialized regions where water, air and soil are contaminated by industrial effluents and vehicle exhaust.” The report also stated that it “is common practice to let livestock and poultry roam freely in fields and to spread livestock and poultry waste on fields or use it as fish feed.” The USDA report was based on documents obtained from the Food and Drug Administration, which oversees seafood inspections. According to Monterey Bay Aquarium Seafood Watch, over 95 percent of tilapia consumed in the USA in 2013 came from overseas, and 73 percent of those imports came from China. One reason is that the fish thrives in a subtropical climate, making it a difficult fish to farm in most of the USA. In 2006, Seafood Watch listed farmed Chinese tilapia as “Avoid” due to poor food quality enforcement and high levels of chemicals, antibacterial drugs (nitrofurans) and malachite green, which is used to dye silk, leather and paper, in fish samples. Seafood Watch cautions that the fish currently tests in the “red zone” for the presence of banned or illegal chemicals such as antibiotics, malachite green and methyl testosterone hormones used in Chinese tilapia production. The group says tilapia raised in Ecuador, the USA or Canada are alternative choices. A 2004 paper, “Domestic Wastewater Treatment in Developing Countries,” that cites the practice of using properly treated wastewater as a sustainable, and ultimately profitable, farming technique. Since 2005, Country of Origin Labeling (COOL), which is overseen by the USDA, requires seafood and shellfish retailers to label product origins. But labeling exceptions and a lack of enforcement make it hard to know exactly what is on a dinner plate. Processed seafood such as fish sticks or other prepared food sold at supermarkets and seafood retailers is exempt from labeling. Whole fish sold at grocery stores is required to have a country-of-origin label and to indicate whether the fish has been farm-raised or caught wild, but not everyone does it. The USDA conducts supplier inspections, and stores in violation have a mandated timeframe to correct the problem. RISK FROM MIDDLE EAST RESPIRATORY SYNDROME, MERS The Middle East Respiratory Syndrome (MERS) is a type of corona virus of the same family as the common cold causing respiratory infections that can evolve into pneumonia and kidney failure. Its first death was recorded in Saudi Arabia in June 2012. Camels are under suspicion of being the primary source as well as human to human transmission under unsanitary crowded conditions and in hospitals. Cases occurred in Jordan, Qatar, the United Arab Emirates, France, Germany, Italy, Tunisia, Egypt, the UK and the USA. A report in the New England Journal of Medicine found "identical" MERS viruses in camels and their owners. Other possible carriers could be sheep and goats which are usually bred along with camels in the Middle East. About half of the cases were spread between people. It seems to have spread after close contact with family members or medical staff. The World Health Organization (WHO) does not recommend restrictions on trade or travel. It warns people to avoid raw camel milk, camel urine and to ensure that camel meat is properly cooked. RISK FROM SLUDGE, “BIOSOLIDS” About one half of sewage waste solids are land-filled or incinerated. The other one half of the 15 trillion gallons of sewage Americans flush annually is biologically scrubbed, "dewatered," processed and sold as products with the names BioEdge, Nitrohumus, and Vital Cycle to spread on farmland, lawns, and home vegetable gardens. In 2007 the Carlyle Group paid $772 million for the sludge-residuals company Synagro, whose products are the most popular on the market. Theoretically, recycling municipal sludge into an inexpensive fertilizer means cleaner rivers and oceans. But as sludge has spread across the country, so have concerns that it may cause as many environmental problems as it solves. In communities where sludge has been used, residents have reported ailments ranging from migraines to pneumonia to mysterious deaths. In a 1994 episode often cited by sludge disposal critics, an 11-year-old Pennsylvania boy died of a staph infection after biking through sludge at an abandoned mine. Sludge may contain discarded medications such as Prozac flushed down toilets or motor oil hosed from factory floors. Sludge sold to consumers is pathogen free, but sludge used on farms and industrial sites is permitted to contain low levels of human pathogens. Sludge might be contaminated with radioactive waste. Food companies such as Del Monte and H. J. Heinz would not accept produce grown on sludge-treated land. The Netherlands and Switzerland effectively ban the use of sludge on farmland, and 37 states regulate it more strictly than the EPA. The EPA acknowledges that "biosolids” have their own distinctive odor, but it doesn't regulate their smell. Studies have shown that severe odors can cause health problems, including depression and stress that can lead to chronic hypertension and heart disease. An EPA survey of sludge samples from across the USA found contamination by 10 flame retardants and 12 pharmaceuticals and exceptionally high levels of endocrine disruptors such as triclosan, an ingredient in antibacterial soap that scientists believe is killing amphibians. Some scientists are concerned that dangerous levels of contaminants from sludge are passing into crops and groundwater as well as blowing off fields and becoming airborne. Some chemicals in sludge can interact with one another to become more persistent or toxic. Research has suggested that the toxins such as thallium used in rat poison in sludge can pass into milk and meat. In May 2007, the USA Environmental Protection Agency (EPA) determined that sludge had contaminated as many as 5,000 acres of grazing land about 25 miles from Kimbrough's Alabama ranch with perfluorooctanoic acid (PFOA), a probable carcinogen used in Teflon manufacturing. The chemical was traced back to a local manufacturer that had dumped contaminated wastewater straight into the sewer system. A single American's daily sludge output can generate enough power to light a 60Watt bulb for more than nine hours a day. Sludge is rich in methane, the main component of natural gas. The wastewater sector, which uses about 1 percent of the nation's electricity, could power itself with sludge and possibly have wattage to spare. Fewer than 10 percent of the nation's 6,000 public wastewater plants have anaerobic digesters that can extract methane from sludge. Just 20 percent burn the gas for energy. Flint, Michigan, is one of several cities worldwide to fuel buses with gas from sludge. Los Angeles injects sludge into a mile-deep well, where pressure and heat are expected to release enough methane to power 1,000 homes. Methane removal cuts sludge's volume in half. Leftover sludge is often incinerated, releasing heavy metals into the air and packing landfills with enough ash each year to fill more than 3,100 dump trucks. Using hightemperature or low-oxygen reactions, they covert sludge into a synthetic gas or oil, or a char similar to barbecue briquettes. The process can produce twice as much energy as it consumes. In Southern California, a plant converts sludge from about a third of Los Angeles and Orange counties into a char that replaces coal at a local cement kiln; its ash is mixed into the cement. RISK FROM SWIMMING IN FRESH WATER SOURCES Naegleria fowleri is a heat-loving amoeba commonly found around the world in warm fresh water bodies such as lakes, rivers and hot springs, as well as soil, but notin salt water, according to the Centers for Disease Control and Prevention [17]. If ingested, the amoeba can cause an infection known as Primary Amebic Meningoencephalitis (PAM). Infection-causing PAM is extremely rare, but from 1962 to 2013, there have been 132 cases reported in the USA, with 34 cases coming between 2004 and 2013 [17]. The initial symptoms are exactly the same as bacterial meningitis and typically start five days after the infection: headache, fever, nausea, vomiting and a stiff neck. During the later stages of the infection, people develop seizures, become lethargic and can develop an altered mental state and eventually go into a coma. A precautions to take to lower the risk of infection is using nose plugs since infection typically occurs after the amoeba enters the body through the nose and travels to the brain when a person is swimming underwater. Cases of Naegleria fowleri are more common in July, August and September when there is prolonged heat and thus higher water temperatures and lower water levels. Most of the cases occur in the southern-tier states, and about 50 percent of the cases occurred in Texas and Florida. The following tips for Summer Swimmers are suggested by the CDC [17]: 1. Hold your nose shut, use nose clips or keep your head above water in warm bodies of freshwater. 2. Avoid digging in or stirring up the sediment while taking part in water-related activities in shallow, warm bodies of freshwater. 3. Avoid water-related activities in warm freshwater during periods of high water temperature and low water levels. 4. Do not put your head under water in hot springs. EBOLA RISKS The number of Ebola cases in Liberia and Sierra Leone could rise to between 550,000 and 1.4 million by January 2015 if there are no "additional interventions or changes in community behavior," the Center for Disease Control and Prevention said in a report on September 23, 2014. The range of estimated cases; from 550,000 to 1.4 million, is wide because experts suspect the current count is highly under-reported. The official death toll from Ebola in West Africa has climbed to more than 2,800 in six months, with 5,800 cases confirmed as of September 22, 2014, according to the World Health Organization (WHO). The CDC estimates that if 71 percent of people with Ebola are properly cared for in medical facilities, the epidemic could decrease and eventually end. WHO experts suggest that the "current epidemiologic outlook is bleak." They also warn that without "drastic improvements" in measures to control its spread, the number of cases and deaths from Ebola is expected to continue climbing from hundreds to thousands per week. The cumulative number of cases could exceed 20,000 by November 2, 2014. The spread is blamed not on a particularly virulent strain of the virus, but the outbreak was so deadly because of a "combination of dysfunctional health systems, international indifference, high population mobility, local customs, densely populated capitals, and lack of trust in authorities after years of armed conflict. “Ebola has reached the point where it could establish itself as an endemic infection because of a highly inadequate and late global response." SNOW SHOVELING RISK Every winter season, about 100 people in the USA die while shoveling snow. A study looking at data from 1990 to 2006 by researchers at the USA Nationwide Children's Hospital recorded 1,647 fatalities from cardiac-related injuries associated with shoveling snow. The actual numbers could be double this figure. In Canada, these deaths make the news every winter [18]. When healthy young men shoveled snow, their heart rate and blood pressure increase more than when they exercise on a treadmill. Combining this activity with cold air, which causes arteries to constrict and decrease blood supply, one gets a perfect storm for a heart attack. Snow shoveling is particularly strenuous because it uses arm work, which is more taxing than leg work. Many people hold their breath during the hard work, which also puts a strain on the body. In addition, the prime time for snow clearance is between 6 am and 10 am which is when circadian fluctuations make us more vulnerable to heart attacks. Snow shoveling is so dangerous that anyone over the age of 55 should not to do it. People at greatest risk are those who are habitually sedentary with known or suspected coronary disease, who go out once a year to clear snow. Smoking and being overweight drastically increase the risk. If one must do it, pushing rather than lifting the snow, dressing in layers, taking regular breaks indoors and not eating nor smoking before shoveling is advised. Using a snow-blower may be a better option, but there have also been heart attacks recorded in men using blowers. 4.9 NATURAL VERSUS TECHNOLOGICAL RISKS Technology introduces risks to our modern society. However there are also risks introduced by natural phenomena. Natural risks are sometimes unavoidable, even though modern science is providing us with instruments, techniques and strategies to predict and anticipate them, hence mitigating or sometimes avoiding their consequences. 4.10 DISCUSSION The introduction of technological risk adds to the natural risks that humans face, but our best insight suggests that these can be introduced only as an individual choice. Placing risks in perspective and as a matter of ethics and morals, larger groups of people should not be subjected to risks by smaller groups that are above the natural risks, involuntarily or unknown to them. As an example, as a result of global warming, island dwellers on some pacific islands find their atolls being submerged and are being evacuated. There are also indication that it is at the origin of a massive drought in the Sahel region of Africa and a drying of Lake Chad. All human endeavors involve certain levels of risk that is sometimes wrongly perceived. For instance it is accepted that the construction and mining professions involve a higher level of risk than the office staff profession. Risk quantification is governed by the need to distinguish between objective and perceived or subjective risk. APPENDIX I POPULAR DEFINITIONS OF “UNCERTAINTY” According to Ibn Yami, a 13th-century Persian-Tajik poet: “There are four types of men: One who knows and knows that he knows... His horse of wisdom will reach the skies. One who knows, but does not know that he knows. He is fast asleep, so you should wake him up. One who does not know, but knows that he does not know... His limping mule will eventually get him home. One who does not know and does not know that he does not know... He will be eternally lost in his hopeless oblivion” According to Donald Rumsfeld, USA Defense Secretary, 2002: “There are known knowns; there are things we know that we know. There are known unknowns; that is to say there are things that, we now know we do not know. But there are also unknown unknowns – there are things we do not know we do not know.” According to Albert Einstein: “As far as the laws of mathematics refer to reality, they are not certain; and as far as they are certain, they do not refer to reality.” “The most incomprehensible thing about the world is that it is at all comprehensible.” According to economist John Maynard Keynes in the “The General Theory of Employment,” 1937: “By ‘uncertain’ knowledge, let me explain, I do not mean merely to distinguish what is known for certain from what is only probable. The game of roulette is not subject, in this sense, to uncertainty; nor is the prospect of a Victory bond being drawn. Or, again, the expectation of life is only slightly uncertain. Even the weather is only moderately uncertain. The sense in which I am using the term is that in which the prospect of a European war is uncertain, or the price of copper and the rate of interest twenty years hence, or the obsolescence of a new invention, or the position of private wealth owners in the social system in 1970. About these matters there is no scientific basis on which to form any calculable probability whatever.” APPENDIX II CAUSES OF DEATHS IN THE USA Table I. Leading causes of death, 2010. Data: CDC. Cause Heart disease Cancer Chronic lower respiratory diseases Stroke, cerebro-vascular diseases Accidents, unintentional injuries Alzheimer’s diseases Diabetes Number of deaths 596,577 576,691 142,943 128,932 126,438 84,974 73,831 Influenza and pneumonia Nephritis, nephrotic syndrome, and nephrosis Intentional self-harm, suicide 53,826 45,591 39,518 EXERCISES 1. An insurance company requires a 30 percent overhead on the premiums it collects from its customers. If the payment to a beneficiary is $100,000 and it collects $1,000 per year in premiums, what is the probability of death in the year that the insurance company used to calculate the collected premium? Compare the result to the case of breakeven for the actuarial risk. 2. Estimate the individual risks for each human from the different natural events in units of [death / (capita. year)]. 3. Estimate the distance travelled by a car at 65 miles / hour during the 4.6 seconds taken by a texting event. REFERENCES 1. Michael Behar, Amanda MacMillan, “When Earth Attacks,” Popular Science, pp. 4660, May 2005. 2. James Fluere, “Researchers: ‘There is no Safe Level Threshold for Alcohol and Cancer Risk’,” Science Recorder, February 17, 2013. 3. Jane E. Brody, “Sodium, Hiding in Plain Sight,” The New York Times, April 1, 2013. 4. Jonathan LaPook, “A FreshWay to Test Risk of Heart Attack, Stroke,” CBS Evening News, April 24, 2013. 5. Nick Collins, “One Fizzy a day May Raise Diabetes Risk by Fifth,” The Telegraph, Health News, April 25, 2013. 6. “FDA Probing Caffeinated products, from Gum to Chips,” CBS News, April 29, 2013. 7. _____, “Distracted Driving Kills,” The Illinois Sheriff, pp. 2-3, May 2013. 8. Kristen Hallam, “Dementia Risk Raised 35 percent by General Anesthesia in Study,” Blommberg, May 31, 2013. 9. Melissa Healy, “Obesity’s Death Toll could be Higher than Believed, Study Says,” Science and Health, Los Angeles Times, August 15, 2013. 10. Robert Herriman, “The World Health Organization Advises Against E-Cigarettes,” The Global Dispatch, July, 12, 2013. 11. Jonas Dorner, “Caffeine Energy Drinks ‘Intensify Heart Contractions,” BBC News Health, December 2nd, 2013. 12. Emily Dwass, “Drilling Down on the Necessity of Dental X-rays,” Los Angeles Times Health, December 20, 2013. 13. Robert Langreth, “Unreported Robotic Surgery Injuries Open Questions for FDA,” Bloomberg, December 29, 2013. 14. William Hudson, “Consumer Reports: Too many Sodas contain Potential Carcinogen,” CNN Health, January 23, 2014. 15. Karen Kaplan, “Fewer Americans are living with Hepatitis C, because more have died,” Science Now, March 3, 2014. 16. Richard A. Friedman, “Why Teenagers Act Crazy,” New York Times, Sunday Review, June 28, 2014. 17. Kevin Byrne, “Brain-Eating Amoeba Kills 9-year Old Kansas Girl,” AccuWeather.com, July 16, 2014. 18. Jo Jolly, “Why do so many people die shoveling snow?,” BBC News Magazine, November 19, 2014. 19. Ahanad O’Connor, “BPA in Cans and Plastic Bottles Linked to Quick Rise in Blood Pressure,” The New York Times, Well, December 8, 2014.
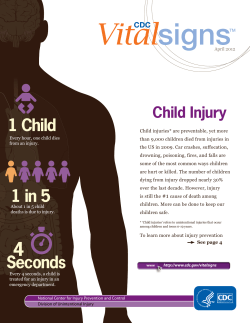


© Copyright 2026