
Package `asbio`
Package ‘asbio’
February 10, 2015
Type Package
Title A Collection of Statistical Tools for Biologists
Version 1.1-5
Depends R (>= 2.15.1), tcltk
Imports scatterplot3d, pixmap, tkrplot, plotrix, mvtnorm, deSolve,
lattice, multcompView
Suggests akima, boot
Date 2015-2-9
SystemRequirements BWidget
Author Ken Aho
Maintainer Ken Aho <[email protected]>
Description Contains functions from: Aho, K. (2014) Foundational and Applied Statistics for Biologists using R. CRC/Taylor and Francis, Boca Raton, FL.
License GPL (>= 2)
LazyLoad yes
NeedsCompilation no
Repository CRAN
Date/Publication 2015-02-10 07:46:45
R topics documented:
agrostis . . . .
aids . . . . . .
alfalfa.split.plot
alpha.div . . . .
anm.ci . . . . .
anm.coin . . . .
anm.cont.pdf .
anm.die . . . .
anm.ExpDesign
anm.geo.growth
.
.
.
.
.
.
.
.
.
.
.
.
.
.
.
.
.
.
.
.
.
.
.
.
.
.
.
.
.
.
.
.
.
.
.
.
.
.
.
.
.
.
.
.
.
.
.
.
.
.
.
.
.
.
.
.
.
.
.
.
.
.
.
.
.
.
.
.
.
.
.
.
.
.
.
.
.
.
.
.
.
.
.
.
.
.
.
.
.
.
.
.
.
.
.
.
.
.
.
.
.
.
.
.
.
.
.
.
.
.
.
.
.
.
.
.
.
.
.
.
.
.
.
.
.
.
.
.
.
.
.
.
.
.
.
.
.
.
.
.
1
.
.
.
.
.
.
.
.
.
.
.
.
.
.
.
.
.
.
.
.
.
.
.
.
.
.
.
.
.
.
.
.
.
.
.
.
.
.
.
.
.
.
.
.
.
.
.
.
.
.
.
.
.
.
.
.
.
.
.
.
.
.
.
.
.
.
.
.
.
.
.
.
.
.
.
.
.
.
.
.
.
.
.
.
.
.
.
.
.
.
.
.
.
.
.
.
.
.
.
.
.
.
.
.
.
.
.
.
.
.
.
.
.
.
.
.
.
.
.
.
.
.
.
.
.
.
.
.
.
.
.
.
.
.
.
.
.
.
.
.
.
.
.
.
.
.
.
.
.
.
.
.
.
.
.
.
.
.
.
.
.
.
.
.
.
.
.
.
.
.
.
.
.
.
.
.
.
.
.
.
.
.
.
.
.
.
.
.
.
.
.
.
.
.
.
.
.
.
.
.
.
.
.
.
.
.
.
.
.
.
.
.
.
.
.
.
.
.
.
.
.
.
.
.
.
.
.
.
.
.
.
.
.
.
.
.
.
.
.
.
.
.
.
.
.
.
.
.
.
.
6
6
7
8
9
10
11
12
13
16
R topics documented:
2
anm.loglik . . . .
anm.ls . . . . . .
anm.ls.reg . . . .
anm.LV . . . . .
anm.mc.bvn . . .
anm.samp.design
anolis . . . . . .
anscombe . . . .
ant.dew . . . . .
AP.test . . . . . .
asthma . . . . . .
auc . . . . . . . .
baby.walk . . . .
bats . . . . . . .
Bayes.disc . . . .
bayes.lm . . . . .
BCI.count . . . .
BCI.plant . . . .
BDM.test . . . .
bear . . . . . . .
beetle . . . . . .
bin2dec . . . . .
bombus . . . . .
bone . . . . . . .
book.menu . . .
boot.ci.M . . . .
bootstrap . . . .
bound.angle . . .
bplot . . . . . . .
bromus . . . . .
bv.boxplot . . . .
bvn.plot . . . . .
C.isotope . . . .
caribou . . . . .
chi.plot . . . . .
chronic . . . . .
ci.boot . . . . . .
ci.median . . . .
ci.mu.oneside . .
ci.mu.z . . . . . .
ci.p . . . . . . .
ci.prat . . . . . .
ci.prat.ak . . . .
ci.sigma . . . . .
ci.strat . . . . . .
cliff.env . . . . .
cliff.sp . . . . . .
ConDis.matrix . .
.
.
.
.
.
.
.
.
.
.
.
.
.
.
.
.
.
.
.
.
.
.
.
.
.
.
.
.
.
.
.
.
.
.
.
.
.
.
.
.
.
.
.
.
.
.
.
.
.
.
.
.
.
.
.
.
.
.
.
.
.
.
.
.
.
.
.
.
.
.
.
.
.
.
.
.
.
.
.
.
.
.
.
.
.
.
.
.
.
.
.
.
.
.
.
.
.
.
.
.
.
.
.
.
.
.
.
.
.
.
.
.
.
.
.
.
.
.
.
.
.
.
.
.
.
.
.
.
.
.
.
.
.
.
.
.
.
.
.
.
.
.
.
.
.
.
.
.
.
.
.
.
.
.
.
.
.
.
.
.
.
.
.
.
.
.
.
.
.
.
.
.
.
.
.
.
.
.
.
.
.
.
.
.
.
.
.
.
.
.
.
.
.
.
.
.
.
.
.
.
.
.
.
.
.
.
.
.
.
.
.
.
.
.
.
.
.
.
.
.
.
.
.
.
.
.
.
.
.
.
.
.
.
.
.
.
.
.
.
.
.
.
.
.
.
.
.
.
.
.
.
.
.
.
.
.
.
.
.
.
.
.
.
.
.
.
.
.
.
.
.
.
.
.
.
.
.
.
.
.
.
.
.
.
.
.
.
.
.
.
.
.
.
.
.
.
.
.
.
.
.
.
.
.
.
.
.
.
.
.
.
.
.
.
.
.
.
.
.
.
.
.
.
.
.
.
.
.
.
.
.
.
.
.
.
.
.
.
.
.
.
.
.
.
.
.
.
.
.
.
.
.
.
.
.
.
.
.
.
.
.
.
.
.
.
.
.
.
.
.
.
.
.
.
.
.
.
.
.
.
.
.
.
.
.
.
.
.
.
.
.
.
.
.
.
.
.
.
.
.
.
.
.
.
.
.
.
.
.
.
.
.
.
.
.
.
.
.
.
.
.
.
.
.
.
.
.
.
.
.
.
.
.
.
.
.
.
.
.
.
.
.
.
.
.
.
.
.
.
.
.
.
.
.
.
.
.
.
.
.
.
.
.
.
.
.
.
.
.
.
.
.
.
.
.
.
.
.
.
.
.
.
.
.
.
.
.
.
.
.
.
.
.
.
.
.
.
.
.
.
.
.
.
.
.
.
.
.
.
.
.
.
.
.
.
.
.
.
.
.
.
.
.
.
.
.
.
.
.
.
.
.
.
.
.
.
.
.
.
.
.
.
.
.
.
.
.
.
.
.
.
.
.
.
.
.
.
.
.
.
.
.
.
.
.
.
.
.
.
.
.
.
.
.
.
.
.
.
.
.
.
.
.
.
.
.
.
.
.
.
.
.
.
.
.
.
.
.
.
.
.
.
.
.
.
.
.
.
.
.
.
.
.
.
.
.
.
.
.
.
.
.
.
.
.
.
.
.
.
.
.
.
.
.
.
.
.
.
.
.
.
.
.
.
.
.
.
.
.
.
.
.
.
.
.
.
.
.
.
.
.
.
.
.
.
.
.
.
.
.
.
.
.
.
.
.
.
.
.
.
.
.
.
.
.
.
.
.
.
.
.
.
.
.
.
.
.
.
.
.
.
.
.
.
.
.
.
.
.
.
.
.
.
.
.
.
.
.
.
.
.
.
.
.
.
.
.
.
.
.
.
.
.
.
.
.
.
.
.
.
.
.
.
.
.
.
.
.
.
.
.
.
.
.
.
.
.
.
.
.
.
.
.
.
.
.
.
.
.
.
.
.
.
.
.
.
.
.
.
.
.
.
.
.
.
.
.
.
.
.
.
.
.
.
.
.
.
.
.
.
.
.
.
.
.
.
.
.
.
.
.
.
.
.
.
.
.
.
.
.
.
.
.
.
.
.
.
.
.
.
.
.
.
.
.
.
.
.
.
.
.
.
.
.
.
.
.
.
.
.
.
.
.
.
.
.
.
.
.
.
.
.
.
.
.
.
.
.
.
.
.
.
.
.
.
.
.
.
.
.
.
.
.
.
.
.
.
.
.
.
.
.
.
.
.
.
.
.
.
.
.
.
.
.
.
.
.
.
.
.
.
.
.
.
.
.
.
.
.
.
.
.
.
.
.
.
.
.
.
.
.
.
.
.
.
.
.
.
.
.
.
.
.
.
.
.
.
.
.
.
.
.
.
.
.
.
.
.
.
.
.
.
.
.
.
.
.
.
.
.
.
.
.
.
.
.
.
.
.
.
.
.
.
.
.
.
.
.
.
.
.
.
.
.
.
.
.
.
.
.
.
.
.
.
.
.
.
.
.
.
.
.
.
.
.
.
.
.
.
.
.
.
.
.
.
.
.
.
.
.
.
.
.
.
.
.
.
.
.
.
.
.
.
.
.
.
.
.
.
.
.
.
.
.
.
.
.
.
.
.
.
.
.
.
.
.
.
.
.
.
.
.
.
.
.
.
.
.
.
.
.
.
.
.
.
.
.
.
.
.
.
.
.
.
.
.
.
.
.
.
.
.
.
.
.
.
.
.
.
.
.
.
.
.
.
.
.
.
.
.
.
.
.
.
.
.
.
.
.
.
.
.
.
.
.
.
.
.
.
.
.
.
.
.
.
.
.
.
.
.
.
.
.
.
.
.
.
.
.
.
.
.
.
.
.
.
.
.
.
.
.
.
.
.
.
.
.
.
.
.
.
.
.
.
.
.
.
.
.
.
.
.
.
.
.
.
.
.
.
.
.
.
.
.
.
.
.
.
.
.
.
.
.
.
.
.
.
.
.
.
.
.
.
.
.
.
.
.
.
.
.
.
.
.
.
.
.
.
.
.
.
.
.
.
.
.
.
.
.
.
.
.
.
.
.
.
.
.
.
.
.
.
.
.
.
.
.
.
.
.
.
.
.
.
.
.
.
.
.
.
.
.
.
.
.
.
.
.
.
.
.
.
.
.
.
.
.
.
.
.
.
.
.
.
.
.
.
.
.
.
.
.
.
.
.
.
.
.
.
.
.
.
.
.
.
.
.
.
.
.
.
.
.
.
.
.
.
.
.
.
.
.
.
.
.
.
.
.
.
.
.
.
.
.
.
.
.
.
.
.
.
.
.
.
.
.
.
.
.
.
.
.
.
.
.
.
.
.
.
.
.
.
.
.
.
.
.
.
.
.
.
.
.
.
.
.
.
.
.
.
.
.
.
.
.
.
.
.
.
.
.
.
.
.
.
.
.
.
.
.
.
.
.
.
.
.
.
.
.
.
.
.
.
.
.
.
.
.
.
.
.
.
.
.
.
.
.
.
.
.
.
.
.
.
.
.
.
.
.
.
.
.
.
.
.
.
.
.
.
.
.
.
.
.
.
.
.
.
.
.
.
.
.
.
.
.
.
.
.
.
.
.
.
.
.
.
.
.
.
.
.
.
.
.
.
.
.
.
.
.
.
.
.
.
.
.
.
.
.
.
.
.
.
.
.
.
.
.
.
.
.
.
.
.
.
.
.
.
.
.
.
.
.
.
.
.
.
.
.
.
.
.
.
.
.
.
.
.
.
.
.
.
.
.
.
.
.
.
.
.
.
.
.
.
.
.
.
.
.
.
.
.
.
.
.
.
.
.
.
.
.
.
.
.
.
.
.
.
.
.
.
.
.
.
.
.
.
.
.
.
.
.
.
.
.
.
.
.
.
.
.
.
.
.
.
.
.
.
.
.
.
.
.
.
.
.
.
.
.
.
.
.
.
.
.
.
.
.
.
.
.
.
.
.
.
.
.
.
.
.
.
.
.
.
.
.
.
.
.
.
.
.
.
.
.
.
.
.
.
.
.
.
.
.
.
.
.
.
.
.
.
.
.
.
.
.
.
.
.
.
.
.
.
.
.
.
.
.
.
.
.
.
.
.
.
.
.
.
.
.
.
.
.
.
.
.
.
.
.
.
.
.
.
.
.
.
.
.
.
.
.
.
.
.
.
.
.
.
.
.
.
.
.
.
.
.
.
.
.
.
.
.
.
.
.
.
.
.
.
.
.
.
.
.
.
.
.
.
.
.
.
.
.
.
.
.
.
.
.
.
.
.
.
.
.
.
.
.
.
.
.
.
.
.
.
.
.
.
.
.
.
.
.
.
.
.
.
.
.
.
.
.
.
.
18
21
22
23
25
27
28
28
30
30
31
32
33
34
34
35
36
37
38
39
40
41
41
42
42
43
44
46
47
49
50
53
53
55
55
57
58
59
60
61
62
65
68
70
71
74
74
75
R topics documented:
corn . . . . . . .
crab.weight . . .
crabs . . . . . . .
cuckoo . . . . . .
D.sq . . . . . . .
death.penalty . .
deer . . . . . . .
deer.296 . . . . .
depression . . . .
DH.test . . . . .
dO2 . . . . . . .
drugs . . . . . .
e.cancer . . . . .
eff.rbd . . . . . .
enzyme . . . . .
ES.May . . . . .
exercise.repeated
Fbird . . . . . . .
fire . . . . . . . .
fly.sex . . . . . .
frog . . . . . . .
fruit . . . . . . .
G.mean . . . . .
g.test . . . . . . .
garments . . . . .
Glucose2 . . . .
goats . . . . . . .
grass . . . . . . .
H.mean . . . . .
heart . . . . . . .
HL.mean . . . .
huber.mu . . . .
huber.NR . . . .
huber.one.step . .
illusions . . . . .
ipomopsis . . . .
joint.ci.bonf . . .
K . . . . . . . .
Kappa . . . . . .
km . . . . . . . .
Kullback . . . . .
larrea . . . . . .
life.exp . . . . .
lm.select . . . . .
loess.surf . . . .
magnets . . . . .
MC . . . . . . .
MC.test . . . . .
3
.
.
.
.
.
.
.
.
.
.
.
.
.
.
.
.
.
.
.
.
.
.
.
.
.
.
.
.
.
.
.
.
.
.
.
.
.
.
.
.
.
.
.
.
.
.
.
.
.
.
.
.
.
.
.
.
.
.
.
.
.
.
.
.
.
.
.
.
.
.
.
.
.
.
.
.
.
.
.
.
.
.
.
.
.
.
.
.
.
.
.
.
.
.
.
.
.
.
.
.
.
.
.
.
.
.
.
.
.
.
.
.
.
.
.
.
.
.
.
.
.
.
.
.
.
.
.
.
.
.
.
.
.
.
.
.
.
.
.
.
.
.
.
.
.
.
.
.
.
.
.
.
.
.
.
.
.
.
.
.
.
.
.
.
.
.
.
.
.
.
.
.
.
.
.
.
.
.
.
.
.
.
.
.
.
.
.
.
.
.
.
.
.
.
.
.
.
.
.
.
.
.
.
.
.
.
.
.
.
.
.
.
.
.
.
.
.
.
.
.
.
.
.
.
.
.
.
.
.
.
.
.
.
.
.
.
.
.
.
.
.
.
.
.
.
.
.
.
.
.
.
.
.
.
.
.
.
.
.
.
.
.
.
.
.
.
.
.
.
.
.
.
.
.
.
.
.
.
.
.
.
.
.
.
.
.
.
.
.
.
.
.
.
.
.
.
.
.
.
.
.
.
.
.
.
.
.
.
.
.
.
.
.
.
.
.
.
.
.
.
.
.
.
.
.
.
.
.
.
.
.
.
.
.
.
.
.
.
.
.
.
.
.
.
.
.
.
.
.
.
.
.
.
.
.
.
.
.
.
.
.
.
.
.
.
.
.
.
.
.
.
.
.
.
.
.
.
.
.
.
.
.
.
.
.
.
.
.
.
.
.
.
.
.
.
.
.
.
.
.
.
.
.
.
.
.
.
.
.
.
.
.
.
.
.
.
.
.
.
.
.
.
.
.
.
.
.
.
.
.
.
.
.
.
.
.
.
.
.
.
.
.
.
.
.
.
.
.
.
.
.
.
.
.
.
.
.
.
.
.
.
.
.
.
.
.
.
.
.
.
.
.
.
.
.
.
.
.
.
.
.
.
.
.
.
.
.
.
.
.
.
.
.
.
.
.
.
.
.
.
.
.
.
.
.
.
.
.
.
.
.
.
.
.
.
.
.
.
.
.
.
.
.
.
.
.
.
.
.
.
.
.
.
.
.
.
.
.
.
.
.
.
.
.
.
.
.
.
.
.
.
.
.
.
.
.
.
.
.
.
.
.
.
.
.
.
.
.
.
.
.
.
.
.
.
.
.
.
.
.
.
.
.
.
.
.
.
.
.
.
.
.
.
.
.
.
.
.
.
.
.
.
.
.
.
.
.
.
.
.
.
.
.
.
.
.
.
.
.
.
.
.
.
.
.
.
.
.
.
.
.
.
.
.
.
.
.
.
.
.
.
.
.
.
.
.
.
.
.
.
.
.
.
.
.
.
.
.
.
.
.
.
.
.
.
.
.
.
.
.
.
.
.
.
.
.
.
.
.
.
.
.
.
.
.
.
.
.
.
.
.
.
.
.
.
.
.
.
.
.
.
.
.
.
.
.
.
.
.
.
.
.
.
.
.
.
.
.
.
.
.
.
.
.
.
.
.
.
.
.
.
.
.
.
.
.
.
.
.
.
.
.
.
.
.
.
.
.
.
.
.
.
.
.
.
.
.
.
.
.
.
.
.
.
.
.
.
.
.
.
.
.
.
.
.
.
.
.
.
.
.
.
.
.
.
.
.
.
.
.
.
.
.
.
.
.
.
.
.
.
.
.
.
.
.
.
.
.
.
.
.
.
.
.
.
.
.
.
.
.
.
.
.
.
.
.
.
.
.
.
.
.
.
.
.
.
.
.
.
.
.
.
.
.
.
.
.
.
.
.
.
.
.
.
.
.
.
.
.
.
.
.
.
.
.
.
.
.
.
.
.
.
.
.
.
.
.
.
.
.
.
.
.
.
.
.
.
.
.
.
.
.
.
.
.
.
.
.
.
.
.
.
.
.
.
.
.
.
.
.
.
.
.
.
.
.
.
.
.
.
.
.
.
.
.
.
.
.
.
.
.
.
.
.
.
.
.
.
.
.
.
.
.
.
.
.
.
.
.
.
.
.
.
.
.
.
.
.
.
.
.
.
.
.
.
.
.
.
.
.
.
.
.
.
.
.
.
.
.
.
.
.
.
.
.
.
.
.
.
.
.
.
.
.
.
.
.
.
.
.
.
.
.
.
.
.
.
.
.
.
.
.
.
.
.
.
.
.
.
.
.
.
.
.
.
.
.
.
.
.
.
.
.
.
.
.
.
.
.
.
.
.
.
.
.
.
.
.
.
.
.
.
.
.
.
.
.
.
.
.
.
.
.
.
.
.
.
.
.
.
.
.
.
.
.
.
.
.
.
.
.
.
.
.
.
.
.
.
.
.
.
.
.
.
.
.
.
.
.
.
.
.
.
.
.
.
.
.
.
.
.
.
.
.
.
.
.
.
.
.
.
.
.
.
.
.
.
.
.
.
.
.
.
.
.
.
.
.
.
.
.
.
.
.
.
.
.
.
.
.
.
.
.
.
.
.
.
.
.
.
.
.
.
.
.
.
.
.
.
.
.
.
.
.
.
.
.
.
.
.
.
.
.
.
.
.
.
.
.
.
.
.
.
.
.
.
.
.
.
.
.
.
.
.
.
.
.
.
.
.
.
.
.
.
.
.
.
.
.
.
.
.
.
.
.
.
.
.
.
.
.
.
.
.
.
.
.
.
.
.
.
.
.
.
.
.
.
.
.
.
.
.
.
.
.
.
.
.
.
.
.
.
.
.
.
.
.
.
.
.
.
.
.
.
.
.
.
.
.
.
.
.
.
.
.
.
.
.
.
.
.
.
.
.
.
.
.
.
.
.
.
.
.
.
.
.
.
.
.
.
.
.
.
.
.
.
.
.
.
.
.
.
.
.
.
.
.
.
.
.
.
.
.
.
.
.
.
.
.
.
.
.
.
.
.
.
.
.
.
.
.
.
.
.
.
.
.
.
.
.
.
.
.
.
.
.
.
.
.
.
.
.
.
.
.
.
.
.
.
.
.
.
.
.
.
.
.
.
.
.
.
.
.
.
.
.
.
.
.
.
.
.
.
.
.
.
.
.
.
.
.
.
.
.
.
.
.
.
.
.
.
.
.
.
.
.
.
.
.
.
.
.
.
.
.
.
.
.
.
.
.
.
.
.
.
.
.
.
.
.
.
.
.
.
.
.
.
.
.
.
.
.
.
.
.
.
.
.
.
.
.
.
.
.
.
.
.
.
.
.
.
.
.
.
.
.
.
.
.
.
.
.
.
.
.
.
.
.
.
.
.
.
.
.
.
.
.
.
.
.
.
.
.
.
.
.
.
.
.
.
.
.
.
.
.
.
.
.
.
.
.
.
.
.
.
.
.
.
.
.
.
.
.
.
.
.
.
.
.
.
.
.
.
.
.
.
.
.
.
.
.
.
.
.
.
.
.
.
.
.
.
.
.
.
.
.
.
.
.
.
.
.
.
.
.
.
.
.
.
.
.
.
.
.
.
.
.
.
.
.
.
.
.
.
.
.
.
.
.
.
.
.
.
.
.
.
.
.
.
.
.
.
.
.
.
.
.
.
.
.
.
.
.
.
.
.
.
.
.
.
.
.
.
.
.
.
.
.
.
.
.
.
.
.
.
.
.
.
.
.
.
.
.
.
.
.
.
.
.
.
.
.
.
.
.
.
.
.
.
.
.
.
.
.
.
.
.
.
.
.
.
.
.
.
.
.
.
.
.
.
.
.
.
.
.
.
.
.
.
.
.
.
.
.
.
.
.
.
.
.
.
.
.
.
.
.
.
.
.
.
.
.
.
.
.
.
.
.
.
.
.
.
.
.
.
.
.
.
.
.
.
.
.
.
.
.
.
.
.
.
.
.
.
.
.
.
.
.
.
.
.
.
.
.
.
.
.
.
.
.
.
.
.
.
.
.
.
.
.
.
.
.
.
.
.
.
.
.
.
.
.
.
.
.
.
.
.
.
.
.
.
.
.
.
.
.
.
.
.
.
.
.
.
.
76
77
77
78
78
79
80
81
81
82
83
84
85
85
86
87
88
89
89
90
91
92
92
93
94
94
95
96
96
97
98
99
100
101
102
102
103
104
105
106
107
108
108
109
110
112
112
113
R topics documented:
4
mcmc.norm.hier
ML.k . . . . .
Mode . . . . .
modlevene.test
montane.island
moose.sel . . .
mosquito . . .
MS.test . . . .
myeloma . . .
near.bound . . .
one.sample.t . .
one.sample.z .
paik . . . . . .
pairw.anova . .
pairw.fried . . .
pairw.kw . . . .
panel.cor.res . .
partial.R2 . . .
partial.resid.plot
PCB . . . . . .
perm.fact.test .
pika . . . . . .
plantTraits . . .
plot.pairw . . .
plotAncova . .
plotCI.reg . . .
PM2.5 . . . . .
polyamine . . .
portneuf . . . .
potash . . . . .
potato . . . . .
power.z.test . .
press . . . . . .
Preston.dist . .
prostate . . . .
prp . . . . . . .
pseudo.v . . . .
qq.Plot . . . . .
r.bw . . . . . .
r.dist . . . . . .
R.hat . . . . . .
r.pb . . . . . .
rat . . . . . . .
refinery . . . .
rinvchisq . . . .
samp.dist . . .
samp.dist.mech
sc.twin . . . . .
.
.
.
.
.
.
.
.
.
.
.
.
.
.
.
.
.
.
.
.
.
.
.
.
.
.
.
.
.
.
.
.
.
.
.
.
.
.
.
.
.
.
.
.
.
.
.
.
.
.
.
.
.
.
.
.
.
.
.
.
.
.
.
.
.
.
.
.
.
.
.
.
.
.
.
.
.
.
.
.
.
.
.
.
.
.
.
.
.
.
.
.
.
.
.
.
.
.
.
.
.
.
.
.
.
.
.
.
.
.
.
.
.
.
.
.
.
.
.
.
.
.
.
.
.
.
.
.
.
.
.
.
.
.
.
.
.
.
.
.
.
.
.
.
.
.
.
.
.
.
.
.
.
.
.
.
.
.
.
.
.
.
.
.
.
.
.
.
.
.
.
.
.
.
.
.
.
.
.
.
.
.
.
.
.
.
.
.
.
.
.
.
.
.
.
.
.
.
.
.
.
.
.
.
.
.
.
.
.
.
.
.
.
.
.
.
.
.
.
.
.
.
.
.
.
.
.
.
.
.
.
.
.
.
.
.
.
.
.
.
.
.
.
.
.
.
.
.
.
.
.
.
.
.
.
.
.
.
.
.
.
.
.
.
.
.
.
.
.
.
.
.
.
.
.
.
.
.
.
.
.
.
.
.
.
.
.
.
.
.
.
.
.
.
.
.
.
.
.
.
.
.
.
.
.
.
.
.
.
.
.
.
.
.
.
.
.
.
.
.
.
.
.
.
.
.
.
.
.
.
.
.
.
.
.
.
.
.
.
.
.
.
.
.
.
.
.
.
.
.
.
.
.
.
.
.
.
.
.
.
.
.
.
.
.
.
.
.
.
.
.
.
.
.
.
.
.
.
.
.
.
.
.
.
.
.
.
.
.
.
.
.
.
.
.
.
.
.
.
.
.
.
.
.
.
.
.
.
.
.
.
.
.
.
.
.
.
.
.
.
.
.
.
.
.
.
.
.
.
.
.
.
.
.
.
.
.
.
.
.
.
.
.
.
.
.
.
.
.
.
.
.
.
.
.
.
.
.
.
.
.
.
.
.
.
.
.
.
.
.
.
.
.
.
.
.
.
.
.
.
.
.
.
.
.
.
.
.
.
.
.
.
.
.
.
.
.
.
.
.
.
.
.
.
.
.
.
.
.
.
.
.
.
.
.
.
.
.
.
.
.
.
.
.
.
.
.
.
.
.
.
.
.
.
.
.
.
.
.
.
.
.
.
.
.
.
.
.
.
.
.
.
.
.
.
.
.
.
.
.
.
.
.
.
.
.
.
.
.
.
.
.
.
.
.
.
.
.
.
.
.
.
.
.
.
.
.
.
.
.
.
.
.
.
.
.
.
.
.
.
.
.
.
.
.
.
.
.
.
.
.
.
.
.
.
.
.
.
.
.
.
.
.
.
.
.
.
.
.
.
.
.
.
.
.
.
.
.
.
.
.
.
.
.
.
.
.
.
.
.
.
.
.
.
.
.
.
.
.
.
.
.
.
.
.
.
.
.
.
.
.
.
.
.
.
.
.
.
.
.
.
.
.
.
.
.
.
.
.
.
.
.
.
.
.
.
.
.
.
.
.
.
.
.
.
.
.
.
.
.
.
.
.
.
.
.
.
.
.
.
.
.
.
.
.
.
.
.
.
.
.
.
.
.
.
.
.
.
.
.
.
.
.
.
.
.
.
.
.
.
.
.
.
.
.
.
.
.
.
.
.
.
.
.
.
.
.
.
.
.
.
.
.
.
.
.
.
.
.
.
.
.
.
.
.
.
.
.
.
.
.
.
.
.
.
.
.
.
.
.
.
.
.
.
.
.
.
.
.
.
.
.
.
.
.
.
.
.
.
.
.
.
.
.
.
.
.
.
.
.
.
.
.
.
.
.
.
.
.
.
.
.
.
.
.
.
.
.
.
.
.
.
.
.
.
.
.
.
.
.
.
.
.
.
.
.
.
.
.
.
.
.
.
.
.
.
.
.
.
.
.
.
.
.
.
.
.
.
.
.
.
.
.
.
.
.
.
.
.
.
.
.
.
.
.
.
.
.
.
.
.
.
.
.
.
.
.
.
.
.
.
.
.
.
.
.
.
.
.
.
.
.
.
.
.
.
.
.
.
.
.
.
.
.
.
.
.
.
.
.
.
.
.
.
.
.
.
.
.
.
.
.
.
.
.
.
.
.
.
.
.
.
.
.
.
.
.
.
.
.
.
.
.
.
.
.
.
.
.
.
.
.
.
.
.
.
.
.
.
.
.
.
.
.
.
.
.
.
.
.
.
.
.
.
.
.
.
.
.
.
.
.
.
.
.
.
.
.
.
.
.
.
.
.
.
.
.
.
.
.
.
.
.
.
.
.
.
.
.
.
.
.
.
.
.
.
.
.
.
.
.
.
.
.
.
.
.
.
.
.
.
.
.
.
.
.
.
.
.
.
.
.
.
.
.
.
.
.
.
.
.
.
.
.
.
.
.
.
.
.
.
.
.
.
.
.
.
.
.
.
.
.
.
.
.
.
.
.
.
.
.
.
.
.
.
.
.
.
.
.
.
.
.
.
.
.
.
.
.
.
.
.
.
.
.
.
.
.
.
.
.
.
.
.
.
.
.
.
.
.
.
.
.
.
.
.
.
.
.
.
.
.
.
.
.
.
.
.
.
.
.
.
.
.
.
.
.
.
.
.
.
.
.
.
.
.
.
.
.
.
.
.
.
.
.
.
.
.
.
.
.
.
.
.
.
.
.
.
.
.
.
.
.
.
.
.
.
.
.
.
.
.
.
.
.
.
.
.
.
.
.
.
.
.
.
.
.
.
.
.
.
.
.
.
.
.
.
.
.
.
.
.
.
.
.
.
.
.
.
.
.
.
.
.
.
.
.
.
.
.
.
.
.
.
.
.
.
.
.
.
.
.
.
.
.
.
.
.
.
.
.
.
.
.
.
.
.
.
.
.
.
.
.
.
.
.
.
.
.
.
.
.
.
.
.
.
.
.
.
.
.
.
.
.
.
.
.
.
.
.
.
.
.
.
.
.
.
.
.
.
.
.
.
.
.
.
.
.
.
.
.
.
.
.
.
.
.
.
.
.
.
.
.
.
.
.
.
.
.
.
.
.
.
.
.
.
.
.
.
.
.
.
.
.
.
.
.
.
.
.
.
.
.
.
.
.
.
.
.
.
.
.
.
.
.
.
.
.
.
.
.
.
.
.
.
.
.
.
.
.
.
.
.
.
.
.
.
.
.
.
.
.
.
.
.
.
.
.
.
.
.
.
.
.
.
.
.
.
.
.
.
.
.
.
.
.
.
.
.
.
.
.
.
.
.
.
.
.
.
.
.
.
.
.
.
.
.
.
.
.
.
.
.
.
.
.
.
.
.
.
.
.
.
.
.
.
.
.
.
.
.
.
.
.
.
.
.
.
.
.
.
.
.
.
.
.
.
.
.
.
.
.
.
.
.
.
.
.
.
.
.
.
.
.
.
.
.
.
.
.
.
.
.
.
.
.
.
.
.
.
.
.
.
.
.
.
.
.
.
.
.
.
.
.
.
.
.
.
.
.
.
.
.
.
.
.
.
.
.
.
.
.
.
.
.
.
.
.
.
.
.
.
.
.
.
.
.
.
.
.
.
.
.
.
.
.
.
.
.
.
.
.
.
.
.
.
.
.
.
.
.
.
.
.
.
.
.
.
.
.
.
.
.
.
.
.
.
.
.
.
.
.
.
.
.
.
.
.
.
.
.
.
.
.
.
.
.
.
.
.
.
.
.
.
.
.
.
.
.
.
.
.
.
.
.
.
.
.
.
.
.
.
.
.
.
.
.
.
.
.
.
.
.
.
.
.
.
.
.
.
.
.
.
.
.
.
.
.
.
.
.
.
.
.
.
.
.
.
.
.
.
.
.
.
.
.
.
.
.
.
.
.
.
.
.
.
.
.
.
.
.
.
.
.
.
.
.
.
.
.
.
.
.
.
.
.
.
.
.
.
.
.
.
.
.
.
.
.
.
.
.
.
.
.
.
.
.
.
.
.
.
.
.
.
.
.
.
.
.
.
.
.
.
.
.
.
.
.
.
.
.
.
.
.
.
.
.
.
.
.
.
.
.
.
.
.
.
.
.
.
.
.
.
.
.
.
.
.
.
.
.
.
.
.
.
.
.
.
.
.
.
.
.
.
.
.
.
.
.
.
.
.
.
.
.
.
.
.
.
.
.
.
115
116
117
118
119
120
121
121
122
123
124
125
126
127
130
132
133
134
135
136
137
138
139
141
142
143
145
145
146
147
147
148
149
150
152
152
155
157
158
159
160
161
162
163
163
164
168
169
R topics documented:
se.jack . . . . . .
sedum.ts . . . . .
see.accPrec.tck .
see.ancova.tck . .
see.anova.tck . .
see.cor.range.tck .
see.exppower.tck
see.HW . . . . .
see.lma.tck . . .
see.lmr.tck . . . .
see.lmu.tck . . .
see.logic . . . . .
see.M . . . . . .
see.mixedII . . .
see.mnom.tck . .
see.move . . . .
see.nlm . . . . .
see.norm.tck . . .
see.power . . . .
see.rEffect.tck . .
see.regression.tck
see.roc.tck . . . .
see.smooth.tck . .
see.ttest.tck . . .
see.typeI_II . . .
selftest.se.tck1 . .
Semiconductor .
shad . . . . . . .
shade.norm . . .
shade.norm.tck .
skew . . . . . . .
SM.temp.moist .
snore . . . . . . .
so2.us.cities . . .
stan.error . . . .
starkey . . . . . .
trag . . . . . . .
transM . . . . . .
trim.me . . . . .
trim.ranef.test . .
trim.test . . . . .
tukey.add.test . .
veneer . . . . . .
Venn . . . . . . .
vs . . . . . . . .
wash.rich . . . .
webs . . . . . . .
wheat . . . . . .
5
.
.
.
.
.
.
.
.
.
.
.
.
.
.
.
.
.
.
.
.
.
.
.
.
.
.
.
.
.
.
.
.
.
.
.
.
.
.
.
.
.
.
.
.
.
.
.
.
.
.
.
.
.
.
.
.
.
.
.
.
.
.
.
.
.
.
.
.
.
.
.
.
.
.
.
.
.
.
.
.
.
.
.
.
.
.
.
.
.
.
.
.
.
.
.
.
.
.
.
.
.
.
.
.
.
.
.
.
.
.
.
.
.
.
.
.
.
.
.
.
.
.
.
.
.
.
.
.
.
.
.
.
.
.
.
.
.
.
.
.
.
.
.
.
.
.
.
.
.
.
.
.
.
.
.
.
.
.
.
.
.
.
.
.
.
.
.
.
.
.
.
.
.
.
.
.
.
.
.
.
.
.
.
.
.
.
.
.
.
.
.
.
.
.
.
.
.
.
.
.
.
.
.
.
.
.
.
.
.
.
.
.
.
.
.
.
.
.
.
.
.
.
.
.
.
.
.
.
.
.
.
.
.
.
.
.
.
.
.
.
.
.
.
.
.
.
.
.
.
.
.
.
.
.
.
.
.
.
.
.
.
.
.
.
.
.
.
.
.
.
.
.
.
.
.
.
.
.
.
.
.
.
.
.
.
.
.
.
.
.
.
.
.
.
.
.
.
.
.
.
.
.
.
.
.
.
.
.
.
.
.
.
.
.
.
.
.
.
.
.
.
.
.
.
.
.
.
.
.
.
.
.
.
.
.
.
.
.
.
.
.
.
.
.
.
.
.
.
.
.
.
.
.
.
.
.
.
.
.
.
.
.
.
.
.
.
.
.
.
.
.
.
.
.
.
.
.
.
.
.
.
.
.
.
.
.
.
.
.
.
.
.
.
.
.
.
.
.
.
.
.
.
.
.
.
.
.
.
.
.
.
.
.
.
.
.
.
.
.
.
.
.
.
.
.
.
.
.
.
.
.
.
.
.
.
.
.
.
.
.
.
.
.
.
.
.
.
.
.
.
.
.
.
.
.
.
.
.
.
.
.
.
.
.
.
.
.
.
.
.
.
.
.
.
.
.
.
.
.
.
.
.
.
.
.
.
.
.
.
.
.
.
.
.
.
.
.
.
.
.
.
.
.
.
.
.
.
.
.
.
.
.
.
.
.
.
.
.
.
.
.
.
.
.
.
.
.
.
.
.
.
.
.
.
.
.
.
.
.
.
.
.
.
.
.
.
.
.
.
.
.
.
.
.
.
.
.
.
.
.
.
.
.
.
.
.
.
.
.
.
.
.
.
.
.
.
.
.
.
.
.
.
.
.
.
.
.
.
.
.
.
.
.
.
.
.
.
.
.
.
.
.
.
.
.
.
.
.
.
.
.
.
.
.
.
.
.
.
.
.
.
.
.
.
.
.
.
.
.
.
.
.
.
.
.
.
.
.
.
.
.
.
.
.
.
.
.
.
.
.
.
.
.
.
.
.
.
.
.
.
.
.
.
.
.
.
.
.
.
.
.
.
.
.
.
.
.
.
.
.
.
.
.
.
.
.
.
.
.
.
.
.
.
.
.
.
.
.
.
.
.
.
.
.
.
.
.
.
.
.
.
.
.
.
.
.
.
.
.
.
.
.
.
.
.
.
.
.
.
.
.
.
.
.
.
.
.
.
.
.
.
.
.
.
.
.
.
.
.
.
.
.
.
.
.
.
.
.
.
.
.
.
.
.
.
.
.
.
.
.
.
.
.
.
.
.
.
.
.
.
.
.
.
.
.
.
.
.
.
.
.
.
.
.
.
.
.
.
.
.
.
.
.
.
.
.
.
.
.
.
.
.
.
.
.
.
.
.
.
.
.
.
.
.
.
.
.
.
.
.
.
.
.
.
.
.
.
.
.
.
.
.
.
.
.
.
.
.
.
.
.
.
.
.
.
.
.
.
.
.
.
.
.
.
.
.
.
.
.
.
.
.
.
.
.
.
.
.
.
.
.
.
.
.
.
.
.
.
.
.
.
.
.
.
.
.
.
.
.
.
.
.
.
.
.
.
.
.
.
.
.
.
.
.
.
.
.
.
.
.
.
.
.
.
.
.
.
.
.
.
.
.
.
.
.
.
.
.
.
.
.
.
.
.
.
.
.
.
.
.
.
.
.
.
.
.
.
.
.
.
.
.
.
.
.
.
.
.
.
.
.
.
.
.
.
.
.
.
.
.
.
.
.
.
.
.
.
.
.
.
.
.
.
.
.
.
.
.
.
.
.
.
.
.
.
.
.
.
.
.
.
.
.
.
.
.
.
.
.
.
.
.
.
.
.
.
.
.
.
.
.
.
.
.
.
.
.
.
.
.
.
.
.
.
.
.
.
.
.
.
.
.
.
.
.
.
.
.
.
.
.
.
.
.
.
.
.
.
.
.
.
.
.
.
.
.
.
.
.
.
.
.
.
.
.
.
.
.
.
.
.
.
.
.
.
.
.
.
.
.
.
.
.
.
.
.
.
.
.
.
.
.
.
.
.
.
.
.
.
.
.
.
.
.
.
.
.
.
.
.
.
.
.
.
.
.
.
.
.
.
.
.
.
.
.
.
.
.
.
.
.
.
.
.
.
.
.
.
.
.
.
.
.
.
.
.
.
.
.
.
.
.
.
.
.
.
.
.
.
.
.
.
.
.
.
.
.
.
.
.
.
.
.
.
.
.
.
.
.
.
.
.
.
.
.
.
.
.
.
.
.
.
.
.
.
.
.
.
.
.
.
.
.
.
.
.
.
.
.
.
.
.
.
.
.
.
.
.
.
.
.
.
.
.
.
.
.
.
.
.
.
.
.
.
.
.
.
.
.
.
.
.
.
.
.
.
.
.
.
.
.
.
.
.
.
.
.
.
.
.
.
.
.
.
.
.
.
.
.
.
.
.
.
.
.
.
.
.
.
.
.
.
.
.
.
.
.
.
.
.
.
.
.
.
.
.
.
.
.
.
.
.
.
.
.
.
.
.
.
.
.
.
.
.
.
.
.
.
.
.
.
.
.
.
.
.
.
.
.
.
.
.
.
.
.
.
.
.
.
.
.
.
.
.
.
.
.
.
.
.
.
.
.
.
.
.
.
.
.
.
.
.
.
.
.
.
.
.
.
.
.
.
.
.
.
.
.
.
.
.
.
.
.
.
.
.
.
.
.
.
.
.
.
.
.
.
.
.
.
.
.
.
.
.
.
.
.
.
.
.
.
.
.
.
.
.
.
.
.
.
.
.
.
.
.
.
.
.
.
.
.
.
.
.
.
.
.
.
.
.
.
.
.
.
.
.
.
.
.
.
.
.
.
.
.
.
.
.
.
.
.
.
.
.
.
.
.
.
.
.
.
.
.
.
.
.
.
.
.
.
.
.
.
.
.
.
.
.
.
.
.
.
.
.
.
.
.
.
.
.
.
.
.
.
.
.
.
.
.
.
.
.
.
.
.
.
.
.
.
.
.
.
.
.
.
.
.
.
.
.
.
.
.
.
.
.
.
.
.
.
.
.
.
.
.
.
.
.
.
.
.
.
.
.
.
.
.
.
.
.
.
.
.
.
.
.
.
.
.
.
.
.
.
.
.
.
.
.
.
.
.
.
.
.
.
.
.
.
.
.
.
.
.
.
.
.
.
.
.
.
.
.
.
.
.
.
.
.
.
.
.
.
.
.
.
.
.
.
.
.
.
.
.
.
.
.
.
.
.
.
.
.
.
.
.
.
.
.
.
.
.
.
.
.
.
.
.
.
.
.
.
.
.
.
.
.
.
.
.
.
.
.
.
.
.
.
.
.
.
.
.
.
.
.
.
.
.
.
.
.
.
.
.
.
.
.
.
.
.
.
.
.
.
.
.
.
.
.
.
.
.
.
.
.
.
.
.
.
.
.
.
.
.
.
.
.
.
.
.
.
.
.
.
.
.
.
.
.
.
.
.
.
.
.
.
.
.
.
.
.
.
.
.
.
.
.
.
.
.
.
.
.
.
.
.
.
.
.
.
.
.
.
.
.
.
.
.
.
.
.
.
.
.
.
.
.
.
.
.
.
.
.
.
.
.
.
.
.
.
.
.
.
.
.
.
.
.
.
.
.
.
.
.
.
169
170
171
171
172
172
173
173
174
174
175
176
176
177
178
178
179
179
180
181
182
182
183
183
184
184
185
185
186
188
189
190
191
192
192
193
193
194
195
196
197
198
199
200
201
201
202
203
6
aids
whickham
wildebeest
win . . .
world.co2
world.pop
.
.
.
.
.
.
.
.
.
.
.
.
.
.
.
.
.
.
.
.
.
.
.
.
.
.
.
.
.
.
.
.
.
.
.
.
.
.
.
.
.
.
.
.
.
.
.
.
.
.
.
.
.
.
.
.
.
.
.
.
.
.
.
.
.
.
.
.
.
.
.
.
.
.
.
.
.
.
.
.
.
.
.
.
.
.
.
.
.
.
.
.
.
.
.
.
.
.
.
.
.
.
.
.
.
.
.
.
.
.
.
.
.
.
.
.
.
.
.
.
.
.
.
.
.
.
.
.
.
.
.
.
.
.
.
Index
agrostis
.
.
.
.
.
.
.
.
.
.
.
.
.
.
.
.
.
.
.
.
.
.
.
.
.
.
.
.
.
.
.
.
.
.
.
.
.
.
.
.
.
.
.
.
.
.
.
.
.
.
.
.
.
.
.
.
.
.
.
.
.
.
.
.
.
.
.
.
.
.
.
.
.
.
.
203
204
205
206
207
208
Agrostis variabilis cover measurements
Description
Percent cover of the grass Agrostis variablis at 25 alpine snowbank sites in the Absaroka-Bearthooth
Mountains.
Usage
data(agrostis)
Format
A data frame with 25 observations on the following 2 variables.
site Site number
cover Percent cover measure
Source
Aho, K. (2006) Alpine and Cliff Ecosystems in the North-Central Rocky Mountains. PhD dissertation, Montana State Univeristy, Bozeman, MT.
aids
Aids and veterans dataset
Description
The veterans administration studied the effect of AZT on AIDS symptoms for 338 HIV-positive
military veterans who were just begining to express AIDS. AZT treatment was withheld on a random component until helper T cells showed even greater depletion while the other group received
the drug immediately. The subjects were also classified by race.
Usage
data(aids)
alfalfa.split.plot
7
Format
A data frame with 338 observations on the following 3 variables.
race A factor with levels black, white.
AZT A factor with levels N, Y.
symptoms Presence/absence of AIDS symptoms.
Source
Agresti, A. (2012) Categorical data analysis, 3rd edition. New York. Wiley.
alfalfa.split.plot
An agricultural split plot design
Description
An experiment was conducted in Iowa in 1944 to see how different varieties of alfalfa responded
to the last cutting day of the previous year (Snedecor and Cochran 1967). We know that in the fall
alfalfa can either continue to grow, or stop growing and store resources belowground in roots for
growth during the following year. Thus, we might expect that later cutting dates inhibits growth for
the following year. On the other hand, if plants are cut after they have gone into senescence, there
should be little effect on productivity during the following year. There are two factors: 1) variety of
alfalfa (three varieties were planted in each of three randomly chosen whole plots), and 2) the date
of last cutting (Sept 1, Sept. 20, or Oct. 7). The dates were randomly chosen split plots within the
whole plots. Replication was accomplished using six blocks of fields.
Usage
data(alfalfa.split.plot)
Format
The dataframe contains four variables:
yield Alfalfa yield (tons per acre).
variety Alfalfa variety. A factor with three levels "L"= Ladak, "C" = Cosack, and "R" = Ranger
describing the variety of alfalfa seed used.
cut.time Time of last cutting. A factor with three levels: "None" = field not cut, "S1" = Sept 1,
"S20" = Sept. 20, or "O7" = Oct. 7.
block The block (whole plot replicate). A factor with six levels: "1", "2", "3", "4", "5", and "6".
Source
Snedecor, G. W. and Cochran, G. C. (1967) Statistical methods, 6th edition. Iowa State University
Press.
8
alpha.div
alpha.div
Functions for calculating alpha diversity.
Description
Alpha diversity quantifies richness and evenness within a sampling unit (replicate).
The function alpha.div runs Simp.index or SW.index to calculate Simpson’s, Inverse Simpson’s
or Shannon-Weiner diversities.
Simpson’s index has a straightforward interpretation. It is the probability of reaching into a plot and
simultaneously pulling out two different species. Inverse Simpson’s diversity is equivalent to one
over the probability that two randomly chosen individuals will be the same species. These measures
have been attributed to Simpson (1949). While it does not allow straightforward interpretation of
results, the Shannon-Weiner diversity (H’) is another commonly used alpha-diversity measure based
on the Kullback-Leibler information criterion (Macarthur and Macarthur 1961).
Usage
alpha.div(x,index)
Simp.index(x,inv)
SW.index(x)
Arguments
x
A vector or matrix of species abundances (e.g. counts). The functions assume
that species are in columns and sites are in rows.
index
The type of alpha diversity to be computed. The function currently has three
choices. simp = Simpson’s diversity, inv.simp=inverse Simpson’s, shan =
Shannon-Weiner diversity.
inv
Logical, indicating whether or not Simpson’s inverse diversity should be computed.
Value
A single diversity value is returned if x is a vector. A vector of diversities (one for each site) are
returned if x is a matrix.
Author(s)
Ken Aho
References
Simpson, E. H. (1949) Measurement of diversity. Nature. 163: 688.
MacArthur, R. H., and MacArthur J. W. (1961) On bird species diversity. Ecology. 42: 594-598.
anm.ci
9
Examples
data(cliff.sp)
alpha.div(cliff.sp,"simp")
anm.ci
Animation demonstrations of confidence intervals.
Description
Provides animated depictions of confidence intervals for µ, σ 2 , the population median, and the
binomial parameter π.
Usage
anm.ci(parent=expression(rnorm(n)), par.val, conf = 0.95, sigma = NULL,
par.type = c("mu", "median", "sigma.sq", "p"), n.est = 100,
n = 50, err.col = 2, par.col = 4, interval = 0.1, ...)
anm.ci.tck()
Arguments
parent
A parental distribution; ideally a distribution with known parameters.
par.val
True parameter value which is being estimated.
conf
Confidence level: 1-P(type I error).
sigma
σ from the normal pdf, if known.
par.type
The parameter whose confidence intervals to be estimated. There are currently
four choices c("mu", "median", "sigma.sq", "p"). These are the normal pdf parameters µ and σ 2 , the population median, and the binomial parameter, π.
n.est
The number of confidence intervals to be created.
n
The sample size used for each confidence interval.
err.col
The line color of the intervals which do not include the true value.
par.col
The line color denoting the parameter value.
interval
The time interval for animation (in seconds). Smaller intervals speed up animation
...
Additional arguments to plot.
Details
Provides an animated plot showing confidence intervals with respect to a known parameter. Intervals which do not contain the parameter are emphasized with different colors. Loading package
tcltk allows use of function anm.ci.tck which provides an interactive GUI to run the function.
10
anm.coin
Value
Returns a plot.
Author(s)
Ken Aho
See Also
Additional documentation for methods provided in: ci.mu.t, ci.mu.z, ci.median, ci.sigma, and
ci.p.
Examples
## Not run:
parent<-rnorm(100000)
anm.ci(parent, par.val=0, conf =.95, sigma =1, par.type="mu")
anm.ci(parent, par.val=1, conf =.95, par.type="sigma.sq")
anm.ci(parent, par.val=0, conf =.95, par.type="median")
parent<-rbinom(100000,1,p=.65)
anm.ci(parent, par.val=0.65, conf =.95, par.type="p")
##Interactive GUI, requires package 'tcltk'
anm.ci.tck()
## End(Not run)
anm.coin
Animated demonstration of frequentist binomial convergence of probability using a coin flip.
Description
Creates an animated plot showing the results from coin flips, and the resulting converence in
P(Head) as the number of flips grows large.
Usage
anm.coin(flips = 1000, p.head = 0.5, interval = 0.01, show.coin = TRUE, ...)
anm.coin.tck()
anm.cont.pdf
11
Arguments
flips
The number of desired coin flips.
p.head
User defined probability of a head; e.g. for a fair coin p.head = 0.5.
interval
The time between animation frames, in seconds.
show.coin
Logical if show.coin=TRUE shows a second plot with coin flip results (head or
tail).
...
Additional arguments to plot.
Value
If show.coin=TRUE, returns two plots configured as a single graphical object. The first plot shows
convergence in estimated P(Head), i.e., number of heads/number of trials, as the number of trials grows large. The second plot shows individual outcomes of coin flips. The second (smaller)
plot is not returned if show.coin=TRUE is specified. Loading tcltk allows use of the function
anm.coin.tck, which creates an interactive GUI to run anm.coin.
Author(s)
Ken Aho
See Also
rbinom
Examples
## Not run: anm.coin()
anm.cont.pdf
Animated demonstration of density for a continuous pdf
Description
A continuous pdf is conceptually a histogram whose bin area sums to one. Infinite, infinitely small
bins, however, are required to allow depiction of an infinite number of distinct continuous outcomes.
Usage
anm.cont.pdf(part = "norm", interval = 0.3)
see.pdf.conc.tck()
12
anm.die
Arguments
part
parent distribution, options are "norm" = N(0, 1), "t" = t(10), "exp" = EXP(1),
and "unif" = UNIF(0,1)
interval
Animation interval
Note
May not work every time becasue random values may exceed histogram range.
Author(s)
Ken Aho
anm.die
Animated depiction of six-sided die throws.
Description
Convergence in probablity for fair (or loaded) six-sided die.
Usage
anm.die(reps = 300, interval = 0.1, show.die = TRUE, p = c(1/6, 1/6, 1/6,
1/6, 1/6, 1/6), cl = TRUE)
anm.die.tck()
Arguments
reps
Number of die throws.
interval
Animation interval in frames per second.
show.die
Logical, indicating whether die outcomes should be shown.
p
A vector of length six which sums to one indicating the probability of die outcomes.
cl
Logical, Indicating whether or not color should be used.
Author(s)
Ken Aho
See Also
anm.coin
anm.ExpDesign
13
Examples
## Not run:
anm.die()
## End(Not run)
anm.ExpDesign
Animated depiction of experimental designs
Description
Describes random treatment allocation for fifteen experimental designs.
Usage
anm.ExpDesign(method="all", titles =
interval = 0.5, iter = 30)
TRUE, cex.text = 1, mp.col = NULL,
ExpDesign(method="all", titles = TRUE, cex.text = 1, mp.col = NULL, ...)
anm.ExpDesign.tck()
Arguments
method
A character vector listing the experimental methods to be demonstrated (see
Details below).
titles
A logical argument specifying whether or not plots should have main titles.
interval
Time length spent on each frame in animation (in seconds).
iter
Number of random iterations in animation.
cex.text
Text character expanasion plots.
mp.col
Arrow colors in "matched" plot. Either a vector of length 3 or a single color.
...
Additional arguments from plot.
Details
The function returns a plot or series of plots illustrating the workings of experimental designs.
Random apportionment of treatments of experimental units (EUs) is illustrated for each of twelve
experimental designs. A character string can be specified in the method arguement using a subset
of any of the following:
"CRD": a one-way completely randomized design,
"factorial2by2": a 2 x 2 design with four EUs,
"factorial2by2by2": a 2 x 2 x 2 factorial designs with 8 EUs,
"nested": a nested design with two levels of nesting,
14
anm.ExpDesign
"RCBD" a randomized complete block design with two blocks, two treatments and four EUs,
"RIBD": a randomized incomplete block design with three blocks, three treatments, and six EUs,
"split": a split plot design with a whole plot (factor A) and a split plot (factor B),
"split.split": a split split-split plot design,
"SPRB": split plots in randomized blocks,
"strip.split": strip-split plot design,
"latin": a Latin squares design with r = 3, and
"pairs": a matched pairs design.
The function anm.ExpDesign.tck provides an interactive GUI. Details on these designs are given
below.
Completely randomized design (CRD)
In a completely randomized design experimental units are each randomly assigned to factor levels
without constraints like blocking. This approach can (and should) be implemented in one way
ANOVAs, and in more complex formats like factorial and hierarchical designs.
Factorial design
Treatments can be derived by combining factor levels from the multiple factors. This is called a
factorial design. In a fully crossed factorial design with two factors, A and B, every level in factor
A is contained in every level of factor B.
Randomized block design (RBD)
In a randomized block design a researcher randomly assigns experimental units to treatments
separately within units called blocks. If all treatments are assigned exactly once within each block
this is known as a randomized complete block design (RCBD)
Latin squares
Latin squares designs are useful when there are two potential blocking variables. These can figuratively or literally be represented by rows and columns. All treatments are assigned to each row
and to each column, and for each row and column treatment assignments differ. Of course this
stipulation limits the number of ways one can allocate treatments.
Nested design
In a nested design factor levels from one factor will be contained entirely in one factor level from
another factor. Consider a design with two factors A and B. When every level of factor A appears
with every level of factor B, and vice versa, then we have a fully crossed factorial design (see above).
Conversely, when levels of B only occur within a single level of A, then B is nested in A.
Split plot design
A split plot design contains two nested levels of randomization. At the highest level are whole
plots which are randomly assigned factor levels from one factor. At a second nested level whole
plots are split to form split plots. The split plots are randomly assigned factor levels from a second
factor. Split plot designs are replicated in units called blocks. Split-split plot design will have two
levels of split plot nesting: C (split-split plots) are split plots within B (split plots), and B are split
anm.ExpDesign
15
plots within A (whole plots). We can see obvious and confusing similarities here to nested designs.
A split plot randomized block (SPRB) design will have whole plots randomly assigned within
blocks, and split plots randomly assigned within the whole plots. Thus, levels of A (whole plot) are
assigned randomly to a block, and split plots containing levels of B (split plot) are assigned within
a level of A.
Strip plot design
Closely related to split plot designs are strip plots. Strip plots can be used address situations when
relatively large experimental units are required for each of two factors in an experiment. A strip
plot will have a row and column structure. Let the number of columns equal to the number of
levels in factor A, and let the number of rows be equal to the number of levels in factor B. Levels
in A are randomly assigned to columns only (across all rows) in a RBD format, and levels in B
are assigned to rows only (across all columns). Interestingly, the levels in A serve as split plots in
B and vice versa. However, unlike a split plot design assignment of treatments at this level is not
entirely random since rows are assigned single levels in A, while columns are assigned single levels
in B. Compared to a factorial design strip plots allow for greater precision in the measurement
of interaction effects while sacrificing precision in the measurement of main effects. Split-block
design discussed by Littell et al. (2006), are indistinguishable from strip plots, described earlier,
except that they are placed in the context of blocks. They are also indistinguishable from SPRBs
except that the design has an explicit row/column structure (one level of A for each column, one
level of B for each row), resulting in larger experimental units for A and B. Conversely, in a SPRB,
different levels of A and B can be assigned within columns and rows respectively. A final type
of split/strip plot design is known as a strip-split plot. Strip-split plots are three way designs (cf.
Hoshmand 2006, Milliken and Johnson 2009). In these models a conventional two factor strip plot
is created (factors A and B) and split plots are placed in the resulting cells (levels in factor C). The
design is indistinguishable from a split-split plot design except for the fact that "columns" always
constitute the same levels in A, while "rows" always constitute the same levels in B, allowing larger
experimental units for A and B, and reflecting the strip plot relationship of A and B. Other, even
more complex variants of split and strip plots are possible are possible. For instance, Littell et al.
(2006) discuss a case study they describe as strip-split-split plot design!
Matched pairs
In a matched pairs design treatments are compared by using the same (or highly similar) experimental units. If treatments are assigned at particular time segments it is assumed that outcomes
within an experimental unit are independent, i.e., there is no "carryover" effect from the previous treatment. Violation of this assumption may result in ashpericity and prevent conventional
approaches.
Author(s)
Ken Aho
References
Hoshmand, A. R. (2006) Design of Experiments for Agriculture and the Natural Sciences 2nd Edition. CRC Press.
Littell, R. C., Stroup, W. W., and R. J. Fruend (2002) SAS for linear models. Wiley, New York.
16
anm.geo.growth
Milliken, G. A., and D. E. Johnson (2009) Analysis of messy data: Vol. I. Designed experiments,
2nd edition. CRC.
See Also
samp.design
Examples
ExpDesign()
## Not run: anm.ExpDesign()
anm.geo.growth
Animated depictions of population growth
Description
Animated depictions of geometric, exponential, and logistic growth.
Usage
anm.geo.growth(n0, lambda, time = seq(0, 20), ylab = "Abundance",
xlab = "Time", interval = 0.1, ...)
anm.exp.growth(n, rmax, time = seq(0, 20), ylab = "Abundance",
xlab = "Time", interval = 0.1, ...)
anm.log.growth(n, rmax, K, time = seq(0, 60), ylab = "Abundance",
xlab = "Time", interval = 0.1, ...)
anm.geo.growth.tck()
anm.exp.growth.tck()
anm.log.growth.tck()
Arguments
n0
Population size at time zero for geometric population growth.
lambda
Geometric growth rate.
time
A time sequence, i.e. a vector of integers which must include 0.
ylab
Y-axis label.
xlab
X-axis label
interval
Animation interval in seconds per frame.
...
Additional arguments to plot
anm.geo.growth
17
n
Initial population numbers for exponential and logistic growth
rmax
The maximum intrinsic rate of increase
K
The carrying capacity
Details
Presented here are three famous population growth models from ecology. Geometric, exponential
and logistic growth. The first two model growth in the presence of unlimited resources. Geometric
growth is exponential growth assuming non-overlapping generations, and is computed as:
Nt = N0 λ t ,
where Nt is the number of individuals at time y, λ is the geometric growth rate, and t is time.
Exponential growth allows simultaneous existience of multiple generations, and is computed as:
dN
= rmax N,
dt
where rmax is the maximum intrinsic rate of increase, i.e. max(birth rate - death rate), and N is the
population size. With logistic growth, exponential growth is slowed as N approaches the carrying
capacity. It is computed as:
dN
K −N
= rmax N
,
dt
K
where rmax is the maximum rate of intrinsic increase, N is the population size, and K is the
carrying capacity
Installation of package tcltk allows implementation of all three models using GUIs.
Author(s)
Ken Aho
See Also
anm.LVexp, anm.LVcomp
Examples
## Not run:
anm.geo.growth(10,2.4)
## End(Not run)
18
anm.loglik
anm.loglik
Animated plots of log-likelihood functions
Description
Plots the normal, exponential, Poisson, binomial, and "custom" log-likelihood functions. By definition, likelihoods for parameter estimates are calculated by holding data constant and varying
estimates. For the normal distribution a fixed value for the parameter which is not being estimated
(µ or σ 2 ) is established using MLEs.
Usage
anm.loglik(X, dist = c("norm", "poi", "bin", "exp", "custom"),
plot.likfunc = TRUE, parameter = NULL, func = NULL, poss = NULL,
plot.density = TRUE, plot.calc = FALSE, xlab = NULL, ylab = NULL,
conv = diff(range(X))/70, anim = TRUE, est.col = 2, density.leg = TRUE,
cex.leg = 0.9, interval = 0.01, ...)
loglik.norm.plot(X, parameter = c("mu", "sigma.sq"), poss = NULL,
plot.likfunc = TRUE, plot.density = TRUE, plot.calc = FALSE,
xlab = NULL, ylab = NULL, conv = 0.01, anim = TRUE, est.col = 2,
density.leg = TRUE, cex.leg = 0.9, interval = 0.01, ...)
loglik.pois.plot(X, poss = NULL, plot.likfunc = TRUE,
plot.density = TRUE, plot.calc = FALSE, xlab = NULL, ylab = NULL,
conv = 0.01, anim = TRUE, interval = 0.01, ...)
loglik.binom.plot(X, poss = NULL, xlab = NULL, ylab = NULL,
plot.likfunc = TRUE, plot.density = TRUE, conv = 0.01, anim = TRUE,
interval = 0.01, ...)
loglik.exp.plot(X, poss = NULL, plot.likfunc = TRUE,
plot.density = TRUE, plot.calc = FALSE, xlab = NULL, ylab = NULL,
conv = 0.01, anim = TRUE, est.col = 2, density.leg = TRUE,
cex.leg = 0.9, interval = 0.01, ...)
loglik.custom.plot(X, func, poss, anim = TRUE, interval = 0.01,
xlab, ylab, ...)
anm.loglik.tck()
Arguments
X
A vector of quantitative data. The function does not currently handle extremely
large datasets, n > 500. Data should be integers (counts) for the Poisson loglikelihood function, and binary responses (0,1) for the binomial log likelihood
anm.loglik
19
function. Data elements for the exponential log likelihood function must be
greater than zero.
parameter
The parameter for which ML estimation is desired in loglik.norm.plot. Specification of either "mu" or "sigma.sq" is required for the normal log-likelihood
function. No specification is required for exponential, Poisson, and binomial
log-likelihood functions since these distributions are generally specified with a
single parameter, i.e. θ for the exponential, λ for the Poisson distribution, and p
(the probability of a success) for the binomial distribution.
poss
An optional vector containing a sequence of possible parameter estimates. Elements in the vector must be distinct. If poss is not specified a vector of appropriate possibilities is provided by the function. This argument can be used to set
xlim in the likelihood function and density plots.
dist
The type of assumed distribution there are currently five possibilities: "norm",
"poi", "binom", "exp", and "custom". Use of custom distributions requires
specification of a custom likelihood function in the argument func.
plot.likfunc
A logical command for indicating whether a graph of the log-likelihood function
should be created.
plot.density
A logical command for indicating whether a second graph, in which densities
are plotted on the pdf, should be created.
plot.calc
A logical command for indicating whether a third graph, in which log-densities
are added to one another, should be created.
xlab
Optional X-axis label.
ylab
Optional Y-axis label.
conv
Precision of likelihood function. Decreasing conv increases the smoothness and
precision of the ML function. Decreasing conv will also slow the animation.
anim
A logical command indicating whether animation should be used in plots.
est.col
Color used in depicting estimation.
density.leg
Logical. Should the legend for density be shown?
cex.leg
Character expansion for legend.
interval
Speed of animation, in seconds per frame. May not work in all systems; see
Sys.sleep.
func
Custom likelihood function to be specified when using loglik.custom.plot.
The function should have two arguments. An optional call to data, and the
likelihood function parameter (see example below).
...
Additional arguments from plot can be specified for likelihood function plots.
Details
These plots are helpful in explaining the workings of ML estimation for parameters. Animation
is included as an option to further clarify processes. When specifying poss be sure to include the
estimate that you "want" the log-likelihood function to maximize in the vector of possibilities, e.g.
mean(X) for estimation of µ.
20
anm.loglik
Value
Three animated plots can be created simultaneously. The first plot shows the normal, Poisson,
exponential, binomial, or custom log-likelihood functions. The second plot shows the pdf with ML
estimates for parameters. On this graph densities of observations are plotted as pdf parameters are
varied. By default these two graphs will be created simultaneously on a single graphics device. By
specifying plot.calc = TRUE a third plot can also be created which shows that log-likelihood
is the sum of the log-densities. Animation in this third plot will be automatically sped up, using
a primitive routine, for large datasets, and slowed for small datasets. The third plot will not be
created for the binomial pdf becasue there will only be a single outcome from the perspective of
likelihood (e.g. 10 successes out of 22 trials). The second and third plots will not be created for
custom likelihood functions. Loading package tcltk allows use of the function anm.loglik.tck
which provides an interactiveanm.loglik GUI to run anm.loglik.
Author(s)
Ken Aho
See Also
dnorm, dpois, dexp, dbinom
Examples
## Not run:
##Normal log likelihood estimation of mu.
X<-c(11.2,10.8,9.0,12.4,12.1,10.3,10.4,10.6,9.3,11.8)
anm.loglik(X,dist="norm",parameter="mu")
##Add a plot describing log-likelihood calculation.
anm.loglik(X,dist="norm",parameter="mu",plot.calc=TRUE)
##Normal log likelihood estimation of sigma squared.
X<-c(11.2,10.8,9.0,12.4,12.1,10.3,10.4,10.6,9.3,11.8)
anm.loglik(X,dist="norm",parameter="sigma.sq")
##Exponential log likelihood estimation of theta
X<-c(0.82,0.32,0.14,0.41,0.09,0.32,0.74,4.17,0.36,1.80,0.74,0.07,0.45,2.33,0.21,
0.79,0.29,0.75,3.45)
anm.loglik(X,dist="exp")
##Poisson log likelihood estimation of lambda.
X<-c(1,3,4,0,2,3,4,3,5)
anm.loglik(X,dist="poi")
##Binomial log likelihood estimation of p.
X<-c(1,1,0,0,0,1,0,0,0,0)#where 1 = a success
anm.loglik(X,dist="bin",interval=.2)
##Custom log-likelihood function
func<-function(X=NULL,theta)theta^5*(1-theta)^10
anm.ls
21
anm.loglik(X=NULL,func=func,dist="custom",poss=seq(0,1,0.01),
xlab="Possibilities",ylab="Log-likelihood")
##Interactive GUI, requires package 'tcltk'
anm.loglik.tck()
## End(Not run)
anm.ls
Animated plot of least squares function.
Description
Depicts the process of least squares estimation by plotting the least squares function with respect to
a vector of estimate possibilities.
Usage
anm.ls(X, poss=NULL, parameter = "mu", est.lty = 2, est.col = 2,
conv=diff(range(X))/50, anim=TRUE, plot.lsfunc = TRUE, plot.res = TRUE,
interval=0.01, xlab=expression(paste("Estimates for ", italic(E),
"(",italic(X),")", sep = "")),...)
anm.ls.tck()
Arguments
X
poss
parameter
est.lty
est.col
conv
anim
plot.lsfunc
plot.res
interval
xlab
...
A numeric vector containing sample data.
An ordered numeric sequence of possible parameter estimates. Inclusion of
the least squares estimate in the vector (e.g. barX for mu will cause the least
squares function be minimized at this value.
Parameter to be estimated. Only estimation for E(X) is currently implemented.
Note that if X ~ N(µ,σ 2 ) then E(X) = µ.
Line type to be used to indicate the least squares estimate.
Line color to be used to indicate the least squares estimate.
Precision of LS function. Decreasing conv increases the smoothness and precision of the function.
A logical command indicating whether animation should be used in plots.
A logical command indicating whether the least-squares function should be plotted.
A logical command indicating whether a plot of residuals should be created.
Speed of animation (in frames per second). A smaller interval decreases speed.
May not work in all systems; see Sys.sleep.
X-axis label.
Additional arguments to plot
22
anm.ls.reg
Value
A plot of the least squares function is returned along with the least squares estimate for E(X) given
a set of possibilities. The function anm.ls.tck provides a GUI to run the function.
Author(s)
Ken Aho
See Also
loglik.plot
Examples
## Not run: X<-c(11.2,10.8,9.0,12.4,12.1,10.3,10.4,10.6,9.3,11.8)
anm.ls(X)
## End(Not run)
anm.ls.reg
Animated plot of least squares function.
Description
Depicts the process of least squares estimation of simple linear regression parameters by plotting
the least squares function with respect to estimate possibilities for the intercept or slope.
Usage
anm.ls.reg(X, Y, parameter="slope", nmax=50, interval = 0.1, col = "red",...)
anm.ls.reg.tck()
Arguments
X
A numeric vector containing explanatory data.
Y
A numeric vector containing response data.
parameter
Parameter to be estimated. Either "slope" or "intercept".
nmax
The number of parameter estimates to be depicted. The true LS estimate will
always be in the center of this sequence.
interval
Speed of animation (in frames per second). A smaller interval decreases speed.
May not work in all systems; see Sys.sleep.
col
Line color.
...
Additional arguments to plot
anm.LV
23
Value
An animated plot of the plot pssible regression lines is created along with an animated plot of the
residual sum of squares. The function anm.ls.reg.tck provides a GUI to run the function.
Author(s)
Ken Aho
See Also
loglik.plot, anm.ls
Examples
## Not run:
X<-c(11.2,10.8,9.0,12.4,12.1,10.3,10.4,10.6,9.3,11.8)
Y<-log(X)
anm.ls.reg(X, Y, parameter = "slope")
## End(Not run)
anm.LV
Animated depictions of Lotka-Volterra competition and exploitation
models
Description
Creates animated plots of two famous abundance models from ecology; the Lotka-Volterra competition and exploitation models
Usage
anm.LVcomp(n1, n2, r1, r2, K1, K2, a2.1, a1.2, time = seq(0, 200), ylab =
"Abundance", xlab = "Time", interval = 0.1, ...)
anm.LVexp(nh, np, rh, con, p, d.p, time = seq(0, 200), ylab = "Abundance",
xlab = "Time", interval = 0.1, circle = FALSE, ...)
anm.LVc.tck()
anm.LVe.tck()
Arguments
n1
Initial abundance values for species one. To be used in the competition function
anm.LVcomp, i.e. N1 in the competition equations below.
n2
Initial abundance values for species two in the competition function, i.e. N2 in
the competition equations below.
24
anm.LV
r1
Maximum intrinsic rate of increase for species one, i.e. rmax1 .
r2
Maximum intrinsic rate of increase for species two in the competition model
anm.LVcomp, i.e. rmax2 .
K1
Carrying capacity for species one, i.e. K1 .
K2
Carrying capacity for species two, i.e. K2 .
a2.1
The interspecific effect of species one on species two, i.e. the term α21 .
a1.2
The interspecific effect of species two on species one, i.e. the term α12 .
nh
Initial abundance values for the host (prey) species. To be used in the the exploitation model anm.LVexp, i.e. the term nh .
np
Initial abundance values for the predator species in the the exploitation model,
i.e. the term hp .
rh
The intrinsic rate of increase for the host (prey) species, i.e. the term rh .
con
The conversion rate of prey to predator, i.e. the term c.
p
The predation rate, i.e. the term p.
d.p
The death rate of predators, i.e. the term dp .
time
A time sequence for which competition or exploitation is to be evaluated.
ylab
Y-axis label.
xlab
X-axis label.
interval
Animation speed per frame (in seconds).
circle
Logical, if TRUE a circular representation of the relation of prey and predator
numbers is drawn.
...
Additional arguments from plot.
Details
The Lotka-Volterra competition and exploitation models require simultaneous solutions for two
differential equations. These are solved using the function rk4 from odesolve.
The interspecific competition model is based on:
dN1
K1 − N1 − α12
= rmax1 N1
,
dt
K1
dN2
K2 − N2 − α21
= rmax2 N2
,
dt
K2
where N1 is the number of individuals from species one, K1 is the carrying capacity for species
one, rmax1 is the maximum intrinsic rate of increase of species one, and α12 is the interspecific
competitive effect of species two on species one.
The exploitation model is based on:
dNh
= rh Nh − pNh Np ,
dt
dNp
= cpNh Np − dp Np ,
dt
anm.mc.bvn
25
where Nh is the number of individuals from the host (prey) species, Np is the number of individuals
from the predator species, rh is the intrinsic rate of increase for the host (prey) species, p is the rate
of predation, c is a conversion factor which describes the rate at which prey are converted to new
predators, and dp is the death rate of the predators.
The term rh Nh describes exponential growth for the host (prey) species. This will be opposed by
deaths due to predation, i.e. the term pNh Np . The term cpNh Np is the rate at which predators
destroy prey. This in turn will be opposed by dp Np , i.e. predator deaths. Loading package tcltk
allows one to run the GUIs in anm.LVe.tck and anm.LVc.tck.
Value
The functions return descriptive animated plots
Author(s)
Ken Aho, based on a concept elucidated by M. Crawley
References
Molles, M. C. (2010) Ecology, Concepts and Applications, 5th edition. McGraw Hill.
Crawley, M. J. (2007) The R book. Wiley
Examples
## Not run:
#---------------------- Competition ---------------------#
##Species 2 drives species 1 to extinction
anm.LVcomp(n1=150,n2=50,r1=.7,r2=.8,K1=200,K2=1000,a2.1=.5,a1.2=.7,time=seq(0,200))
##Species coexist with numbers below carrying capacities
anm.LVcomp(n1=150,n2=50,r1=.7,r2=.8,K1=750,K2=1000,a2.1=.5,a1.2=.7,time=seq(0,200))
#----------------------Exploitation----------------------#
#Fast cycles
anm.LVexp(nh=300,np=50,rh=.7,con=.4,p=.006,d.p=.2,time=seq(0,200))
## End(Not run)
anm.mc.bvn
Animation of Markov Chain Monte Carlo walks in bivariate normal
space
Description
The algorithm can use three different variants on MCMC random walks: Gibbs sampling, the
Metropolis algorithm, and the Metropolis-Hastings algorithms to move through univariate anm.mc.norm
and bivariate normal probability space. The jumping distribution is also bivariate normal with a
mean vector at the current bivariate coordinates. The jumping kernel modifies the jumping distribution through multiplying the variance covariance of this distribution by the specified constant.
26
anm.mc.bvn
Usage
anm.mc.bvn(start = c(-4, -4), mu = c(0, 0), sigma = matrix(2, 2, data = c(1, 0,
0, 1)), length = 1000, sim = "M", jump.kernel = 0.2, xlim = c(-4, 4),
ylim = c(-4, 4), interval = 0.01, show.leg = TRUE, cex.leg = 1, ...)
anm.mc.norm(start = -4, mu = 0, sigma = 1, length = 2000, sim = "M",
jump.kernel = 0.2, xlim = c(-4, 4), ylim = c(0, 0.4), interval = 0.01,
show.leg = TRUE,...)
anm.mc.bvn.tck()
Arguments
start
A two element vector specifying the bivariate starting coordinates.
mu
A two element vector specifying the mean vector for the proposal distribution.
sigma
A 2 x 2 matrix specifying the variance covariance matrix for the proposal distribution.
length
The length of the MCMC chain.
sim
Simulation method used. Must be one of "G" idicating Gibbs sampling, "M"
indicating the Metropolis algorithm, or "MH" indicating the Metropolis-Hastings
algorithm (Gibbs sampling is not implemented for anm.mc.norm).
jump.kernel
A number > 0 that will serve as a (squared) multiplier for the proposal variance covariance. The result of this multiplication will be used as the variance
covariance matrix for the jumping distribution.
xlim
A two element vector describing the upper and lower limits of the x-axis.
ylim
A two element vector describing the upper and lower limits of the y-axis.
interval
Animation interval
show.leg
Logical. Indicating whether or not the chain length should be shown.
cex.leg
Character expansion for legend.
...
Additional arguments from plot.
Value
The functon returns two plots. These are: 1) the proposal bivariate normal distribution in which
darker shading indicates higher density, and 2) an animated plot showing the MCMC algorithm
walking through the probability space.
Author(s)
Ken Aho
References
Gelman, A., Carlin, J. B., Stern, H. S., and D. B. Rubin (2003) Bayesian data analysis, 2nd edition.
Chapman and Hall/CRC.
anm.samp.design
27
anm.samp.design
Animated demonstration of randomized sampling designs
Description
Animated Comparisons of outcomes from simple random sampling, stratified random sampling and
cluster sampling.
Usage
anm.samp.design(n=20, interval = 0.5 ,iter = 30, main = "", lwd = 2, lcol = 2)
samp.design(n = 20, main = "", lwd = 2, lcol = 2)
anm.samp.design.tck()
Arguments
n
The number of samples to be randomly selected from a population of 400.
interval
Time length spent on each frame in animation (in seconds).
iter
Number of random iterations in animation.
main
Main heading.
lwd
line width to distinguish strata in stratified and cluster designs.
lcol
line width to distinguish strata in stratified and cluster designs.
Details
Returns a plot comparing outcomes of random sampling, stratified random sampling and cluster
sampling from a population of size 400. For stratified random sampling the population is subdivided
into four equally strata of size 100. and n/4 samples are taken within each strata. For cluster
sampling the population is subdivided into four equally sized clusters and a census is taken from
two clusters (regardless of specification of n). The function anm.samp.design depicts random
sampling using animation
Value
A plot is returned with four subplots. (a) shows the population before sampling, (b) shows simple
random sampling, (c) shows stratified random sampling, (d) shows cluster sampling. The function
anm.samp.design.tck provides interaction with a tcltk GUI.
Author(s)
Ken Aho
28
anscombe
Examples
samp.design(20)
#Animated demonstration
## Not run: anm.samp.design(20)
anolis
Anolis lizard contingency table data
Description
Schoener (1968) examined the resource partitioning of anolis lizards on the Caribbean island of
South Bimini. He cross-classified lizard counts in habitats (branches in trees) with respect to three
variables: lizard species A. sargei and A. distichus, branch height high and low, and branch size
small and large.
Usage
data(anolis)
Format
A data frame with 8 observations on the following 4 variables.
height Brach height. A factor with levels H, L.
size Brach size. A factor with levels L, S.
species Anolis species. A factor with levels distichus, sagrei.
count Count at the cross classification.
Source
Schoener, T. W. (1968) The Anolis lizards of Bimini: resource partitioning in a complex fauna.
Ecology 49(4): 704-726.
anscombe
Anscobe’s quartet
Description
A set of four bivariate datasets with the same conditional means, conditional variances, linear regressions, and correlations, but with dramatically different forms of association.
Usage
data(anscombe)
anscombe
29
Format
A data frame with 11 observations on the following 8 variables.
x1 The first conditional variable in the first bivariate dataset.
y1 The second conditional variable in the first bivariate dataset.
x2 The first conditional variable in the second bivariate dataset.
y2 The second conditional variable in the second bivariate dataset.
x3 The first conditional variable in the third bivariate dataset.
y3 The second conditional variable in the third bivariate dataset.
x4 The first conditional variable in the fourth bivariate dataset.
y4 The second conditional variable in the fourth bivariate dataset.
Details
Anscombe (1973) used these datasets to demonstrate that summary statsitics are inadequate for
describing association.
Source
Anscombe, F. J. (1973) Graphs in statistical analysis. American Statistician 27 (1): 17-21.
References
Anscombe, F. J. (1973) Graphs in statistical analysis. American Statistician 27 (1): 17-21.
Examples
dev.new(height=3.5)
op <- par(mfrow=c(1,4),mar=c (0,0,2,3), oma = c(5, 4.2, 0, 0))
with(anscombe, plot(x1, y1, xlab = "", ylab = "", main = bquote(paste(italic(r),
" = ",.(round(cor(x1, y1),2)))))); abline(3,0.5)
with(anscombe, plot(x2, y2, xlab = "", ylab = "",, main = bquote(paste(italic(r),
" = ",.(round(cor(x2, y2),2)))))); abline(3,0.5)
with(anscombe, plot(x3, y3, xlab = "", ylab = "",, main = bquote(paste(italic(r),
" = ",.(round(cor(x3, y3),2)))))); abline(3,0.5)
with(anscombe, plot(x4, y4, xlab = "", ylab = "",, main = bquote(paste(italic(r),
" = ",.(round(cor(x4, y4),2)))))); abline(3,0.5)
mtext(expression(italic(y[1])),side=1, outer = TRUE, line = 3)
mtext(expression(italic(y[2])),side=2, outer = TRUE, line = 2.6)
mtext("(a)",side=3, at = -42, line = .5)
mtext("(b)",side=3, at = -26, line = .5)
mtext("(c)",side=3, at = -10.3, line = .5)
mtext("(d)",side=3, at = 5.5, line = .5)
par(op)
30
AP.test
ant.dew
Ant honeydew data
Description
Wright et al. (2000) examined behavior of red wood ants (Formica rufus), a species that harvests
honeydew in aphids. Worker ants traveled from their nests to nearby trees to forage honeydew from
homopterans. Ants descending trees were laden with food and weighed more, given a particular
ant head width, then unladen, ascending ants. The authors were interested in comparing regression
parameters of the ascending and descending ant to create a predictive model of honeydew foraging
load for a given ant size.
Usage
data(ant.dew)
Format
A data frame with 72 observations on the following 3 variables.
head.width Ant head width in mm
ant.mass Ant mass in mg
direction Direction of travel A = ascending, D = descending
Details
Data approximated from Fig. 1 in Wright et al. (2002)
Source
Wright, P. J., Bonser, R., and U. O. Chukwu (2000) The size-distance relationship in the wood ant
Formica rufa. Ecological Entomology 25(2): 226-233.
AP.test
Agresti-Pendergrast test
Description
Provides a more powerful alternative to Friedman’s test for blocked (dependent) data with a single
replicate.
Usage
AP.test(Y)
asthma
31
Arguments
Y
A matrix with treatments in columns and blocks (e.g. subjects) in rows.
Details
The Agresti-Pendergrast test is more powerful than Friedman’s test, given normality, and remains
powerful in heavier tailed distributions (Wilcox 2005).
Value
Returns a dataframe showing the numerator and denominator degrees of freedom, F test statistic,
and p-value.
Note
code based on Wilcox (2005).
Author(s)
Ken Aho
References
Wilcox, R. R. (2005) Introduction to Robust Estimation and Hypothesis Testing, Second Edition.
Elsevier, Burlington, MA.
See Also
friedman.test, MS.test
Examples
temp<-c(2.58,2.63,2.62,2.85,3.01,2.7,2.83,3.15,3.43,3.47,2.78,2.71,3.02,3.14,3.35,
2.36,2.49,2.58,2.86,3.1,2.67,2.96,3.08,3.32,3.41,2.43,2.5,2.85,3.06,3.07)
Y<- matrix(nrow=6,ncol=5,data=temp,byrow=TRUE)
AP.test(Y)
asthma
Asthma repeated measures dataset from Littell et al. (2002)
Description
This dataset was used by Littell (2002) to demonstrate repeated measures analyses. The effect
of two asthma drugs and a placebo were measured on 24 asthmatic patients. Each patient was
randomly given each drug using an approach to minimize carry-over effects. Forced expiratory
volume (FEV1), the volume of air that can be expired after taking a deep breath in one second, was
measured. FEV1 was measured hourly for eight hours following application of the drug. A baseline
measure of FEV1 was also taken 11 hours before application of the treatment.
32
auc
Usage
data(asthma)
Format
The dataframe has 11 columns:
PATIENT The subjects (there were 24 patients).
BASEFEV1 A numerical variable; the baseline forced expiratory volume.
FEV11H Forced expiratory volume at 11 hours.
FEV12H Forced expiratory volume at 12 hours.
FEV13H Forced expiratory volume at 13 hours.
FEV14H Forced expiratory volume at 14 hours.
FEV15H Forced expiratory volume at 15 hours.
FEV16H Forced expiratory volume at 16 hours.
FEV17H Forced expiratory volume at 17 hours.
FEV18H Forced expiratory volume at 18 hours.
DRUG A factor with three levels "a" = a standard drug treatment, "c" = the drug under development, and "p" = a placebo.
Source
Littell, R. C., Stroup, W. W., and R. J. Fruend (2002) SAS for linear models. John Wiley and
Associates.
auc
Area under a reciever operating characterisitic (ROC) curve
Description
A simple algortihm for calculating AUC.
Usage
auc(obs, fit, plot = FALSE)
Arguments
obs
Dichotomous 0, 1 outcomes (i.e. response values for binomial GLM).
fit
Fitted probabilities from some model.
plot
Logical, indicating whether or not ROC curve plot should be created.
baby.walk
33
Author(s)
Ken Aho
References
Agresti, A. (2012) Categorical data analysis, 3rd edition. New York. Wiley.
Examples
obs <-rbinom(30, 1, 0.5)
fit <- rbeta(30, 1, 2)
auc(obs, fit)
baby.walk
Baby walking times experimental data
Description
In general mammals are able to walk within minutes or hours after birth. Human babies, however,
generally don’t begin to walk until they are between 10 and 18 months of age. Humans are born with
rudimentary reflexes for walking, however because they are unused these reflexes largely disappear
by the age of eight weeks. As a result these movements must be relearned by an infant following
significant passage of time, through a process of trial and error. Zelazo et al. (1972) performed a
series of experiments to determine whether certain exercises could allow infants to maintain their
walking reflexes, and allow them to walk at an earlier age. Study subjects were 24 white male
infants from middle class families, and were assigned to one of four exercise treatments.
Active exercise (AE): Parents were taught and were told to apply exercises that would strengthen
the walking reflexes of their infant. Passive exercise (PE): Parents were taught and told to apply
exercises unrelated to walking. Test-only (TO): The investigators did not specify any exercise, but
visited and tested the walking reflexes of infants in weeks 1 through 8. Passive and active exercise
infants were also tested in this way. Control (C): No exercises were specified, and infants were only
tested at weeks one and eight. This group was established to account for the potential effect of the
walking reflex tests themselves.
Usage
data(baby.walk)
Format
A data frame with 22 observations on the following 2 variables.
date Age when baby first started walking (in months)
treatment a factor with levels AE C PE TO
34
Bayes.disc
Source
Ott, R. L., and M. T. Longnecker 2004 A First Course in Statistical Methods. Thompson.
References
Zelazo, P. R., Zelazo, N. A., and S. Kolb. 1972. Walking in the newborn. Science 176: 314-315.
bats
Bat forearm length as a function of bat age
Description
Data from northern myotis bats (Myotis septentrionalis) captured in the field in Vermillion County
Indiana in 2000.
Usage
data(bats)
Format
The dataframe has 2 columns:
days The age of the bats in days.
forearm.length The length of the forearm in millimeters.
Source
Krochmal, A. R., and D. W. Sparks (2007) Journal of Mammalogy. 88(3): 649-656.
Bayes.disc
Bayesian graphical summaries for discrete data.
Description
An simple function for for summarizing a Bayesian analysis given discrete or categorical variables
and priors.
Usage
Bayes.disc(Likelihood, Prior, data.name = "data", plot = TRUE,
c.data = seq(1, length(Prior)), ...)
Bayes.disc.tck()
bayes.lm
35
Arguments
Likelihood
A vector of sample distribution probabilities. This must be in the same order
as Prior, i.e. if θ1 is the first element in Prior, then data|θ1 must be the first
element in Data.
Prior
A vector of prior probabilities, or weights.
data.name
A name for data in conditional statements.
plot
Logical, indicating whether a plot should be made.
c.data
A character string of names for discrete classes
...
Additional arguements to plot.
Author(s)
Ken Aho
bayes.lm
Bayesian linear models with uniform priors
Description
Gelman et al. (2002) described general methods for Bayeisan implementation of simple linear
models (e.g. simple and multiple regression and fixed effect one way ANOVA) with standard noninformative priors uniform on α, σ 2 . The function is not yet suited for multifactor or multivariance
(random effect) ANOVAs.
Usage
bayes.lm(Y, X, model = "anova", length = 1000, cred = 0.95)
Arguments
Y
An n x 1 column vector (a matrix with one column) containing the response
variable.
X
The n x p design matrix
model
One of "anova" or "reg". Parameter output labels are changed depending on
choice.
length
Number of draws for posterior.
cred
Level for credible interval.
Value
Provides the median and central credible intervals for model parameters.
36
BCI.count
Author(s)
Ken Aho
References
Gelman, A., Carlin, J. B., Stern, H. S., and D. B. Rubin (2003) Bayesian Data Analysis, 2nd edition.
Chapman and Hall/CRC.
See Also
mcmc.norm.hier
Examples
## Not run:
data(Fbird)
X <- with(Fbird, cbind(rep(1, 18), vol))
Y <- Fbird$freq
bayes.lm(Y,X)
## End(Not run)
BCI.count
Barro Colorado Island Tree Counts
Description
This dataset, lifted from vegan, contains tree counts in 1-hectare plots in Barro Colorado Island,
Panama.
Usage
data(BCI.count)
Format
A data frame with 50 plots (rows) of 1 hectare with counts of trees on each plot with total of 225
species (columns). Full Latin names are used for tree species.
Details
Data give the numbers of trees at least 10 cm in diameter at breast height (1.3 m above the ground)
in each one hectare square of forest. Within each one hectare square, all individuals of all species
were tallied and are recorded in this table.
The data frame contains only the Barro Colorado Island subset of the original data.
The quadrats are located in a regular grid. See examples for the coordinates.
BCI.plant
37
Source
http://www.sciencemag.org/cgi/content/full/295/5555/666/DC1. Documentation here follows directly from vegan
References
Condit, R, Pitman, N, Leigh, E.G., Chave, J., Terborgh, J., Foster, R.B., Nuñez, P., Aguilar, S.,
Valencia, R., Villa, G., Muller-Landau, H.C., Losos, E. & Hubbell, S.P. (2002). Beta-diversity in
tropical forest trees. Science 295, 666–669.
BCI.plant
Tree presence/absence data from Barro Colorado island
Description
The presence of the tropical trees Alchornea costaricensis and Anacardium excelsum with diameter
at breast height equal or larger than 10 cm were recorded on along with environmental factors at
Barro Colorado Island in Panama (Kindt and Coe 2005). These data were originally from (Pyke et
al. 2001).
Usage
data(BCI.plant)
Format
A data frame with 43 observations on the following 9 variables.
site.no. A factor with levels C1 C2 C3 C4 p1 p10 p11 p12 p13 p14 p15 p16 p17 p18 p19 p2 p20
p21 p22 p23 p24 p25 p26 p27 p28 p29 p3 p30 p31 p32 p33 p34 p35 p36 p37 p38 p39 p4 p5
p6 p7 p8 p9
UTM.E UTM easting.
UTM.N UTM northing.
precip Precipitation in mm/year.
elev Elevation in m above sea level.
age A categorical vector describing age.
geology A factor describing geology with levels pT Tb Tbo Tc Tcm Tct Tgo Tl Tlc.
Alchornea.costaricensis Plant presence/absence.
Anacardium.excelsum Plant presence/absence.
Source
http://www.sciencemag.org/cgi/content/full/295/5555/666/DC1
38
BDM.test
References
Pyke CR, Condit R, Aguilar S and Lao S. (2001). Floristic composition across a climatic gradient
in a neotropical lowland forest. Journal of Vegetation Science 12: 553-566.
Kindt, R. & Coe, R. (2005) Tree diversity analysis: A manual and software for common statistical
methods for ecological and biodiversity studies. http://www.worldagroforestry.org/resources/databases/treediversity-analysis
BDM.test
Brunner-Dette-Munk test
Description
One and two way heteroscedastic rank-based permutation tests. Two way designs are assumed to
be factorial, i.e., interactions are tested.
Usage
BDM.test(Y, X)
BDM.2way(Y, X1, X2)
Arguments
Y
Vector of response data. A quantitative vector
X
A vector of factor levels for a one-way analysis. To be used with BDM.test
X1
A vector of factor levels for the first factor in a two-way factorial design. To be
used with BDM.2way.
X2
A vector of factor levels for the second factor in a two-way factorial design. To
be used with BDM.2way.
Details
A problem with the Kruskal-Wallis test is that, while it does not assume normality for groups, it
still assumes homoscedasticity (i.e. the groups have the same distributional shape). As a solution
Brunner et al. (1997) proposed a heteroscedastic version of the Kruskal-Wallis test which utilizes
the F-distribution. Along with being robust to non-normality and heteroscedasticity, calculations of
exact P-values using the Brunner-Dette-Munk method are not made more complex by tied values.
This is another obvious advantage over the traditional Kruskal-Wallis approach.
Value
Returns a list with two components
Q
The "relative effects" for each group.
Table
An ANOVA type table with hypothesis test results.
bear
39
Note
Code based on Wilcox (2005)
Author(s)
Ken Aho
References
Brunner, E., Dette, H., and A. Munk (1997) Box-type approximations in nonparametric factorial
designs. Journal of the American Statistical Association. 92: 1494-1502.
Wilcox, R. R. (2005) Introduction to Robust Estimation and Hypothesis Testing, Second Edition.
Elsevier, Burlington, MA.
See Also
kruskal.test, trim.test
Examples
rye<-c(50,49.8,52.3,44.5,62.3,74.8,72.5,80.2,47.6,39.5,47.7,50.7)
nutrient<-factor(c(rep(1,4),rep(2,4),rep(3,4)))
BDM.test(Y=rye,X=nutrient)
bear
Grizzly bear litter sizes
Description
Counts of grizzly bear (Ursus arctos) litter sizes from the Greater Yellowstone Ecosystem from
1973-2010.
Usage
data(bear)
Format
A data frame with 38 observations on the following 5 variables.
Year Year.
X1.cub The number of litters with one cub.
X2.cub The number of litters with two cubs.
X3.cub The number of litters with three cubs.
X4.cub The number of litters with four cubs.
40
beetle
Source
Haroldson, M. A (2010) Assessing trend and estimating population size from counts of unduplicated females. Pgs 10-15 in Schwartz, C. C., Haroldson, M. A., and K. West editors. Yellowstone
grizzly bear investigations: annual report of the Interagency grizzly bear study team, 2010. U. S.
Geological Survey, Bozeman, MT.
beetle
Wood boring beetle data.
Description
Saint Germain et al. (2007) modeled the presence absence of a saprophytic wood boring beetle
(Anthophylax attenuatus) as a function of the wood density of twenty-four decaying aspen trees
(Populus tremuloides) in Western Quebec Canada.
Usage
data(beetle)
Format
A data frame with 24 observations on the following 4 variables.
Snag Snag identifier
Yrs.since.death The number of years since death, determined using dendrochronological methods.
Wood.density The density of the decaying wood (dry weight/volume) in units of g cm−3.
ANAT Beetle presence/absence (1/0)
Source
Saint-Germain, M., Drapeau, P., and C. Buddle (2007) Occurrence patterns of aspen- feeding woodborers (Coleoptera: Cerambycidae) along the wood decay gradient: active selection for specific host
types or neutral mechanisms? Ecological Entomology 32: 712-721.
bin2dec
bin2dec
41
Conversion of binary digits to decimal numbers
Description
Converts binary digits e.g. 10101011 to digital numbers. Fractions, e.g. 0.11101 will be evaluated
to the number of bits provided. The function will handle whole number and fractions, but not whole
numbers with fractional parts, e.g. 111.100110.
Usage
bin2dec(digits, round = 4)
Arguments
digits
A string of binary digits.
round
Rounding for fractional results, defaults to 4.
Author(s)
Ken Aho
Examples
bin2dec(1011001101) #=717
bombus
Bombus pollen data.
Description
To investigate how pollen removal varied with reproductive caste in bemblebees (Bombus sp.)
Harder and Thompson (1989) recorded the proportion of pollen removed by thirty five bumblebee queens and twelve worker bees.
Usage
data(bombus)
Format
This data frame contains the following columns:
pollen A numeric vector indicating the proportion of pollen removed.
caste A character string vector indicating whether a bee was a worker "W" or a queen "Q".
42
book.menu
Source
Harder, L. D. and Thompson, J. D. 1989. Evolutionary options for maximizing pollen dispersal in
animal pollinated plants. American Naturalist 133: 323-344.
bone
Bone development data
Description
Neter et al. (1996) described an experiment in which researchers investigated the confounding effect
of gender and bone development on growth hormone therapy for prepubescent children. Gender
had two levels: "M" and "F". The bone development factor had three levels indicating the severity
of growth impediment before therapy: 1 = severely depressed, 2 = moderately depressed, and 3 =
mildly depressed. At the start of the experiment 3 children were assigned to each of the six treatment
combinations. However 4 of the children were unable to complete the experiment, resulting in an
unbalanced design.
Usage
data(bone)
Format
A data frame with 14 observations on the following 3 variables.
gender a factor with levels F M
devel a factor with levels 1 2 3
growth A numeric vector descibing the growth difference before and after hormone therapy
Source
Neter, J., Kutner, M. H., Nachtsheim, C. J., and Wasserman, W (1996) Applied linear Statistical
Models. McGraw-Hill, Boston MA, USA.
book.menu
Pulldown menus for ’asbio’ interactive graphical functions
Description
Provides a pulldown GUI menus to allow access to asbio statistical and biological graphical demos, e.g. anm.ci, samp.dist, anm.loglik, etc. The function demos is deprecated. The function
table.menu currently provides links to over 100 distinct GUIs (many of these are slaves to other
GUIs), which in turn provide distinct graphical demonstrations. The GUIs work best with an SDI
R interface.
boot.ci.M
43
Usage
book.menu()
Author(s)
Ken Aho and Roy Hill (Roy created the book.menu GUI)
See Also
anm.coin, anm.ci, anm.die, anm.exp.growth, anm.geo.growth, anm.log.growth, anm.loglik,
anm.LVcomp, anm.LVexp, anm.ls, anm.ls.reg, anm.transM, see.lmu.tck, samp.dist, see.HW,
see.logic, see.M, see.move, see.nlm, see.norm.tck, see.power, see.regression.tck, see.typeI_II,
selftest.se.tck1, shade.norm, Venn
Examples
## Not run:
book.menu()
## End(Not run)
boot.ci.M
Bootstrap CI of M-estimators differences of two samples
Description
Creates a bootstrap confidence interval for location differences for two samples. The default location estimator is the Huber one-step estimator, although any estimator can be used. The function is
based on a function written by Wilcox (2005). Note, importantly, that P-values may be in conflict
with the confidence interval bounds.
Usage
boot.ci.M(X1, X2, alpha = 0.05, est = huber.one.step, R = 1000)
Arguments
X1
Sample from population one.
X2
Sample from population two.
alpha
Significance level.
est
Location estimator; default is the Huber one step estimator.
R
Number of bootstrap samples.
44
bootstrap
Value
Returns a list with one component, a dataframe containing summary information from the analysis:
R.used
The number of bootstrap samples used. This may not = R if NAs occur because
MAD = 0.
ci.type
The method used to construct the confidence interval.
conf
The level of confidence used.
se
The bootstrap distribution of differences standard error.
original
The original, observed difference.
lower
Lower confidence bound.
upper
Upper confidence bound.
Author(s)
Ken Aho and R. R. Wilcox from whom I stole liberally from code in the function m2ci on R-forge
References
Manly, B. F. J. (1997) Randomization and Monte Carlo methods in biology, 2nd edition. Chapman
and Hall, London.
Wilcox, R. R. (2005) Introduction to Robust Estimation and Hypothesis Testing, 2nd edition. Elsevier, Burlington, MA.
See Also
bootstrap, ci.boot
Examples
## Not run:
X1<-rnorm(100,2,2.5)
X2<-rnorm(100,3,3)
boot.ci.M(X1,X2)
## End(Not run)
bootstrap
A simple function for bootstrapping
Description
The function serves as a simplified alternative to the function boot from the library boot.
Usage
bootstrap(data, statistic, R = 1000, prob = NULL, matrix = FALSE)
bootstrap
45
Arguments
data
Raw data to be bootstrapped. A vector or quantitative data or a matrix if matrix =TRUE.
statistic
A function whose output is a statistic (e.g. a sample mean). The function must
have only one argument, a call to data.
R
The number of bootstrap iterations.
prob
A vector of probability weights for paramteric bootstrapping.
matrix
A logical statement. If matrix = TRUE then rows in the matrix are sampled as
multivariate observations.
Details
With bootstrapping we sample with replacement from a dataset of size n with n samples R times. At
each of the R iterations a statistical summary can be created resulting in a bootstrap distribution of
statistics.
Value
Returns a list. The utility asbio:::print.bootstrap function returns summary output. Invisible
items include the resampling distribution of the statistic, the data, the statistic, and the bootstrap
samples.
Author(s)
Ken Aho
References
Manly, B. F. J. (1997) Randomization and Monte Carlo methods in biology, 2nd edition. Chapman
and Hall, London.
See Also
boot, ci.boot
Examples
data(vs)
# A partial set of observations from a single plot for a Scandinavian
# moss/vascular plant/lichen survey.
site18<-t(vs[1,])
#Shannon-Weiner diversity
SW<-function(data){
d<-data[data!=0]
p<-d/sum(d)
-1*sum(p*log(p))
}
46
bound.angle
bootstrap(site18[,1],SW,R=1000,matrix=FALSE)
bound.angle
Angle of azimuth to a boundary.
Description
The function calculates the angle of azimuth from a Cartesian coordination given in X and Y to a
nearest neighbor coordinate given by nX and nY. The nearest neighbor coordinates can be obtained
using the function near.bound.
Usage
bound.angle(X, Y, nX, nY)
Arguments
X
Cartesian X coordinate of interest.
Y
Cartesian Y coordinate of interest.
nX
Cartesian X coordinate of nearest neighbor point on a boundary.
nY
Cartesian Y coordinate of nearest neighbor point on a boundary.
Details
The function returns the nearest neighbor angles (in degrees) with respect to a four coordinate
system ala ARC-GIS Near(Analysis). Output angles range from −180◦ to 180◦ : 0◦ to the East, 90◦
to the North, 180◦ (or −180◦ ) to the West, and −90◦ to the South.
Value
Returns a vector of nearest neighbor angles.
Author(s)
Ken Aho
See Also
near.bound, prp
bplot
47
Examples
bX<-seq(0,49)/46
bY<-c(4.89000,4.88200,4.87400,4.87300,4.88000,4.87900,4.87900,4.90100,4.90800,
4.91000,4.93300,4.94000,4.91100,4.90000,4.91700,4.93000,4.93500,4.93700,
4.93300,4.94500,4.95900,4.95400,4.95100,4.95800,4.95810,4.95811,4.95810,
4.96100,4.96200,4.96300,4.96500,4.96500,4.96600,4.96700,4.96540,4.96400,
4.97600,4.97900,4.98000,4.98000,4.98100,4.97900,4.98000,4.97800,4.97600,
4.97700,4.97400,4.97300,4.97100,4.97000)
X<-c(0.004166667,0.108333333,0.316666667,0.525000000,0.483333333,0.608333333,
0.662500000,0.683333333,0.900000000,1.070833333)
Y<-c(4.67,4.25,4.26,4.50,4.90,4.10,4.70,4.40,4.20,4.30)
nn<-near.bound(X,Y,bX,bY)
bound.angle(X,Y,nn[,1],nn[,2])
bplot
Barplots with error bars for pairwise comparisons.
Description
Creates barplots for displaying statistical summaries by treatment (e.g. means, medians, M-estimates
of location, standard deviation, variance, etc.) and their error estimates by treatment (i.e. standard
errors, confidence intervals, IQRs, IQR confidence intervals, and MAD intervals). Custom intervals
can also be created. The function can also display letters indicating if results are significant after
adjustment for simultaneous inference.
Usage
bplot(y, x, bar.col = "gray", loc.meas = mean, sort = FALSE, order = NULL, int = "SE",
conf = 0.95, uiw = NULL, liw = NULL, sfrac = 0.1, slty = 1, scol = 1,
slwd = 1, exp.fact = 1.5, simlett = FALSE, lett.side = 3, lett = NULL,
cex.lett = 1, names.arg = NULL, ylim = NULL, horiz = FALSE, ...)
Arguments
y
A quantitative vector representing the response variable.
x
A categorical vector representing treatments (e.g. factor levels).
bar.col
Color of bar.
loc.meas
Measure of location or other summary statistic, e.g. mean, median, etc.
sort
Logical, if TRUE, then treatments are ordered by their location statistics.
order
A vector of length equal to the number of factor levels, specifying the order of
bars with respect to the alphanumeric order of their names.
48
bplot
int
Type of error bar to be drawn, must be one of "SE", "CI", IQR, "MAD", "IQR.CI"
or "bootSE". IQR-derived confidence intervals are based on +/-1.58 IQR/sqrt(n)
and provide an approximate 95% confidence interval for the difference in two
medians. The measure can be attributed to Chambers et al. (1983, p. 62), given
McGill et al. (1978, p. 16). It is based on asymptotic normality of the median
and assumes roughly equal sample sizes for the two medians being compared.
The interval is apparently insensitive to the underlying distributions of the samples. The specification "bootSE" gives bootstrap SEs for the location measure
using the function bootstrap
conf
Level of confidence, 1 - P(type I error).
uiw
Upper y-coordinate for the error bar, if NULL then this will be computed from
int.
liw
Lower y-coordinate for the error bar, if NULL then this will be computed from
int.
sfrac
Scaling factor for the size of the "serifs" (end bars) on the confidence bars, in
x-axis units.
slty
Line type for error bars.
scol
Line color for error bars.
slwd
Line width for error bars.
exp.fact
A multiplication factor indicating how much extra room is made for drawing
letters in top of graph. Only used if simlett = TRUE.
simlett
A logical statement indicating whether or not letters should be shown above
bars indicating that populations means have been determined to be significantly
different.
lett.side
Side that letters will be drawn on, 1 = bottom, 2 = left, 3 = top, 4 = right.
lett
A vector of letters or some other code to display multiple comparison results.
cex.lett
Character expansion for multiple comparison result letters.
names.arg
A vector of names to be plotted below each bar or error bar. If this argument is
omitted, then the names are taken from the names attribute of y.
ylim
Upper and lower limits of the Y-axis
horiz
Logical value. If FALSE, then bars are drawn vertically with the first bar to the
left. If TRUE, then bars are drawn horizontally with the first at the bottom.
...
Additional arguments from barplot.
Details
It is often desirable to display the results of a pairwise comparison procedure using sample measures
of location and error bars. This functions allows these sorts of plots to be made. The function is
essentially a wrapper for the function barplot.
Value
A plot is returned.
bromus
49
Author(s)
Ken Aho
References
Chambers, J. M., Cleveland, W. S., Kleiner, B. and Tukey, P. A. (1983) Graphical Methods for Data
Analysis. Wadsworth & Brooks/Cole.
McGill, R., Tukey, J. W. and Larsen, W. A. (1978) Variations of box plots. The American Statistician 32, 12-16.
See Also
barplot, pairw.anova, pairw.kw, pairw.fried
Examples
eggs<-c(11,17,16,14,15,12,10,15,19,11,23,20,18,17,27,33,22,26,28)
trt<-c(1,1,1,1,1,2,2,2,2,2,3,3,3,3,4,4,4,4,4)
bplot(y=eggs, x=factor(trt),int="SE",xlab="Treatment",ylab="Mean number of eggs",
simlett=TRUE, lett=c("b","b","b","a"))
bromus
Bromus tectorum dataset
Description
Cheatgrass (Bromus tectorum) is an introduced annual graminoid that has invaded vast areas of
sagebrush steppe in the intermountain west. Because it completes its vegetative growth stage relatively early in the summer, it leaves behind senescent biomass that burns easily. As a result areas
with cheatgrass often experience a greater frequency of summer fires. A number of dominant shrub
species in sagebrush steppe are poorly adapted to fire. As a result, frequent fires can change a community formerly dominated by shrubs to one dominated by cheatgrass. Nitrogen can also have a
strong net positive effect on the cheatgrass biomass. A study was conducted at the Barton Road
Long Term Experimental Research site (LTER) in Pocatello Idaho to simultaneously examine the
effect of shrub removal and nitrogen addition on graminoid productivity.
Usage
data(bromus)
Format
The dataframe has 3 columns:
Plot Plot number.
Biomass Grass biomass in grams per meter squared.
Trt Treatment. C = Control, LN = Low nitrogen, HN = Hi Nitrogen, SR = Shrub removal.
50
bv.boxplot
bv.boxplot
Bivariate boxplots
Description
Creates diagnostic bivariate quelplot ellipses (bivariate boxplots) using the method of Goldberg
and Iglewicz (1992). The output can be used to check assumptions of bivariate normality and to
identify multivariate outliers. The default robust=TRUE option relies on on a biweight correlation
estimator function written by Everitt (2004). Quelplots, are potentially assymetric, although the
method currently employed here uses a single "fence" definition and creates symmetric ellipses.
Usage
bv.boxplot(X, Y, robust = TRUE, D = 7, xlab = "X", ylab="Y", pch = 21,
pch.out = NULL, bg = "gray", bg.out = NULL, hinge.col = 1, fence.col = 1,
hinge.lty = 2, fence.lty = 3, xlim = NULL, ylim = NULL, names = 1:length(X),
ID.out = FALSE, cex.ID.out = 0.7, uni.CI = FALSE, uni.conf = 0.95,
uni.CI.col = 1, uni.CI.lty = 1, uni.CI.lwd = 2, ...)
Arguments
X
First of two quantitative variables making up the bivariate distribution.
Y
Second of two quantitative variables making up the bivariate distribution.
robust
Logical. Robust estimators, i.e. robust = TRUE are recommended.
D
The default D = 7 lets the fence be equal to a 99 percent confidence interval for
an individual observation.
xlab
Caption for X axis.
ylab
Caption for Y axis.
pch
Plotting character(s) for scatterplot.
pch.out
Plotting character for outliers.
hinge.col
Hinge color.
fence.col
Fence color.
hinge.lty
Hinge line type.
fence.lty
Fence line type.
xlim
A two element vector defining the limits of the plot.
ylim
The y limits of the plot.
bg
Background color for points in scatterplot, defaults to black if pch is not in the
range 21:26.
bg.out
Background color for outlying points in scatterplot, defaults to black if pch is
not in the range 21:26.
names
An optional vector of names for X, Y coordinates.
bv.boxplot
51
ID.out
Logical. Whether or not outlying points should be given labels (from argument
name in plot.
cex.ID.out
Character expansion for outlying ID labels.
uni.CI
Logical. If true, unviariate confidence intervals for the median at confidence
uni.CI are shown.
uni.conf
Univariate confidence, only used if CI.uni = TRUE
uni.CI.col
Univariate confidence bound line color, only used if CI.uni = TRUE
uni.CI.lty
Univariate confidence bound line type, only used if CI.uni = TRUE
uni.CI.lwd
Univariate confidence bound line width, only used if CI.uni = TRUE
...
Additional arguments from points.
Details
Two ellipses are drawn. The inner is the "hinge" which contains 50 percent of the data. The outer
is the "fence". Observations outside of the "fence" constitute possible troublesome outliers. The
function bivariate from Everitt (2004) is used to calculate robust biweight measures of correlation, scale, and location if robust = TRUE (the default). We have the following form to the quelplot
model:
s
Ei =
2 + Y 2 − 2R∗ X Y
Xsi
si si
si
.
1 − R∗2
∗
∗
∗
)/SY∗ are standardized values for Xi and Yi ,
, and Ysi = (Yi − TX
)/SX
where Xsi = (Xi − TX
∗
∗
∗
and SY∗ are scale estimators for X
respectively, TX and TY are location estimators for X and Y, SX
∗
and Y, and R is a correlation estimator for X and Y. We have:
Em = median{Ei : i = 1, 2, ..., n},
and
2
Emax = max{Ei : Ei2 < DEm
}.
where D is a constant that regulates the distance of the "fence" and "hinge".
To draw the "hinge" we have:
r
1 + R∗
,
2
r
1 − R∗
.
2
R1 = Em
R2 = Em
To draw the "fence" we have:
r
1 + R∗
,
2
r
1 − R∗
.
2
R1 = Emax
R2 = Emax
52
bv.boxplot
For θ = 0 to 360, let:
Θ1 = R1 cos(θ),
Θ2 = R2 sin(θ).
The Cartesian coordinates of the "hinge" and "fence" are:
∗
∗
X = TX
= (Θ1 + Θ2 )SX
,
Y = TY∗ = (Θ1 − Θ2 )SY∗ .
Quelplots, are potentially assymetric, although the current (and only) method used here defines a
single value for Emax and hence creates symmetric ellipses. Under this implemention at least one
point will define Emax , and lie on the "fence".
Value
A diagnostic plot is returned. Invisible objects from the function include location, scale and correlation estimates for X and Y , estimates for Em and Emax , and a list of outliers (that exceed
Emax ).
Author(s)
Ken Aho, the function relies on an Everitt (2004) function for robust M-estimation.
References
Everitt, B. (2004) An R and S-plus companion to multivariate analysis. Springer.
Goldberg, K. M., and B. Ingelwicz (1992) Bivariate extensions of the boxplot. Technometrics 34:
307-320.
See Also
boxplot
Examples
Y1<-rnorm(100, 17, 3)
Y2<-rnorm(100, 13, 2)
bv.boxplot(Y1, Y2)
X <- c(-0.24, 2.53, -0.3, -0.26, 0.021, 0.81,
0.61, -1.79, 0.60, -0.05, 0.39, -0.94, -0.89,
Y <- c(-0.83, -1.44, 0.33, -0.41, -1.0, 0.53,
-1.17, -0.61, 0.37, -0.96, 0.21, -1.29, 1.40,
b <- bv.boxplot(X, Y, ID.out = TRUE, bg.out =
b
-0.85,
-0.37,
-0.72,
-0.21,
"red")
-0.95, 1.0, 0.89, 0.59,
0.18)
0.33, 0.27, -0.99, 0.15,
0.39)
bvn.plot
bvn.plot
53
Make plots of bivariate normal distributions
Description
The function uses functions from lattice and mvtnorm to make wireframe plots of bivariate normal
distributions. Remember that the covariance must be less than the product of the marginal standard
deviations (square roots of the diagonal elements).
Usage
bvn.plot(mu = c(0, 0), cv = 0, vr = c(1, 1), res = 0.3, xlab = expression(y[1]),
ylab = expression(y[2]), zlab = expression(paste("f(", y[1], ",", y[2], ")")), ...)
Arguments
mu
A vector cotanining the joint distribution means.
cv
A number, indicating the covariance of the two variables.
vr
The diagonal elements in the variance covariance matrix.
res
Plot resolution. Smaller values create a more detailed wireframe plot.
xlab
X-axis label.
ylab
Y-axis label.
zlab
Z-axis label.
...
Additional arguments from wireframe.
Author(s)
Ken Aho
C.isotope
Atmospheric carbon and D14C measurements
Description
Atmospheric δ 14 C (per mille) and CO2 (ppm) measurements for La Jolla Pier, California. Latitude:
32.9 Degrees N, Longitude: 117.3 Degrees W, Elevation: 10m; δ 14 C derived from flask air samples
Usage
data(C.isotope)
54
C.isotope
Format
A data frame with 280 observations on the following 5 variables.
Date a factor with levels 01-Apr-96 01-Jul-92 01-Jul-93
02-Nov-94 02-Oct-92 03-Aug-06 03-Aug-92 03-Jan-95
03-Mar-93 03-May-05 03-May-96 03-Nov-05 04-Apr-94
04-Mar-03 04-May-01 04-May-07 04-Sep-96 05-Aug-96
05-Sep-00 06-Aug-02 06-Oct-06 06-Sep-01 06-Sep-07
07-Aug-07 07-Dec-07 07-Feb-01 07-Feb-03 07-Feb-05
07-Sep-05 08-Feb-94 08-Feb-95 08-Feb-99 08-Jan-01
09-Dec-01 09-Feb-93 09-Jan-02 09-Jun-04 09-Nov-00
09-Sep-02 09-Sep-03 09-Sep-92 10-Apr-03 10-Aug-01
10-Jan-98 10-Jun-02 10-Nov-95 10-Oct-00 10-Oct-04
11-Feb-00 11-Jan-07 11-Jan-93 11-Mar-94 11-Mar-96
12-Apr-93 12-Apr-99 12-Aug-93 12-Jul-02 12-Jun-06
13-Jan-98 13-Jun-01 13-Mar-95 13-May-02 13-Sep-06
14-Dec-98 14-Feb-03 14-Jul-00 14-Sep-04 15-Dec-93
15-May-95 15-Oct-99 16-Apr-96 16-Jul-01 16-Jun-00
16-Oct-95 17-Dec-02 17-Feb-02 17-Feb-97 17-Jul-06
17-May-94 17-Nov-99 18-Aug-00 18-Dec-92 18-Jul-97
18-May-93 18-Nov-94 19-Apr-05 20-Apr-04 20-Mar-00
21-Dec-04 21-Jan-00 21-Jul-99 21-Jun-02 21-Jun-93
22-Feb-96 22-Jan-96 22-Jun-94 22-Mar-02 22-May-06
23-Feb-07 23-Jul-92 23-Jun-97 23-Mar-01 23-Mar-05
24-Feb-93 24-Jul-01 24-Jul-02 24-Jun-03 24-Mar-04
25-Jan-06 25-Oct-96 26-Aug-04 26-Dec-03 26-Feb-04
26-Jun-96 26-Mar-04 26-May-00 26-May-04 26-Sep-95
27-Nov-96 27-Oct-05 28-Jul-04 28-Jul-05 29-Aug-03
29-Jun-98 29-Oct-92 29-Oct-98 30-Jun-97 30-Nov-93
31-Oct-01 31-Oct-03
Decimal.date A numeric vector
CO2 CO2 concentration (in ppm)
D14C δ 14 C (in per mille)
D14C.uncertanty measurement uncertainty for D14C(in per mille)
02-Apr-01
03-Jan-97
04-Jun-01
05-Jul-05
07-Apr-05
07-Jun-07
08-Jun-95
09-Nov-02
10-Aug-97
10-Oct-97
11-Nov-93
12-Oct-07
14-Apr-00
15-Feb-06
16-Nov-03
17-Jul-07
18-Jun-05
21-Apr-06
22-Apr-97
22-May-98
24-Apr-03
25-Apr-02
26-Jan-05
27-Jul-04
29-Dec-02
31-Dec-99
02-Feb-96
03-Jul-95
04-Jun-03
05-Jun-00
07-Apr-95
07-Mar-01
08-Sep-99
09-Nov-06
10-Aug-99
11-Dec-92
11-Oct-02
13-Feb-98
14-Aug-00
15-Feb-95
16-Nov-99
17-Mar-06
18-Mar-03
21-Aug-95
22-Feb-00
23-Apr-98
24-Aug-94
25-Aug-98
26-Jan-99
27-Mar-07
29-Jul-98
31-Jan-04
Source
H. D. Graven, R. F. Keeling, A. F. Bollenbacher Scripps CO2 Program (http://scrippsco2.
ucsd.edu) Scripps Institution of Oceanography (SIO) University of California La Jolla, California
USA 92093-0244
and
T. P. Guilderson Center for Accelerator Mass Spectrometry (CAMS) Lawrence Livermore National
Laboratory (LLNL) Livermore, California USA 94550
References
H. D. Graven, T. P. Guilderson and R. F. Keeling, Observations of radiocarbon in CO2 at La Jolla,
California, USA 1992-2007: Analysis of the long-term trend. Journal of Geophysical Research,
caribou
55
doi:10.1029/2011JD016533, in press.
caribou
Caribou count data
Description
Stratified random sampling was used to estimate the size of the Nelchina herd of Alaskan caribou
(Rangifer tarandus) in February 1962 (Siniff and Skoog 1964). The total population of sample units
(for which responses would be counts of caribou) consisted of 699 four mile2 areas. This population
was divided into six strata, and each of these was randomly sampled.
Usage
data(caribou)
Format
A data frame with 6 observations on the following 5 variables.
stratum Strata; a factor with levels A B C D E F
N.h Strata population size
n.h Strata sample size
x.bar.h Strata means
var.h Strata variances
Source
Siniff, D. B., and R. O. Skoog (1964) Aerial censusing of caribou using stratified random sampling.
Journal of Wildlife Management 28: 391-401.
chi.plot
Chi plots for diagnosing multivariate independence.
Description
Chi-plots (Fisher and Switzer 1983, 2001) provide a method to diagnose multivariate non-independence
among Y variables.
Usage
chi.plot(Y1, Y2, ...)
56
chi.plot
Arguments
Y1
A Y variable of interest. Must be quantitative vector.
Y2
A second Y variable of interest. Must also be a quantitative vector.
...
Additional arguments from plot.
Details
The method relies on calculating all possible pairwise differences within y1 and within y2 . Let pairwise differences associated with the first observation in y1 that are greater than zero be transformed
to ones and all other differences be zeros. Take the sum of the transformed values, and let this sum
divided by (1 - n) be be the first element in the 1 x n vector z. Find the rest of the elements (2,..,n)
in z using the same process.
Perform the same transformation for the pairwise differences associated with the first observation
in y2 . Let pairwise differences associated with the first observation in y2 that are greater than zero
be transformed to ones and all other differences be zeros. Take the sum of the transformed values,
and let this sum divided by (1 - n) be be the first element in the 1 x n vector g. Find the rest of the
elements (2,..,n) in g using the same process.
Let pairwise differences associated with the first observation in y1 and the first observation in y2
that are both greater than zero be transformed to ones and all other differences be zeros. Take the
sum of the transformed values, and let this sum divided by (1 - n) be be the first element in the 1 x
n vector h. Find the rest of the elements (2,..,n) in h using the same process. We let:
S = sign((z − 0.5)(g − 0.5))
χ = (h − z × g)/
p
z × (1 − z) × g × (1 − g)
λ = 4 × S × max[(z − 0.5)2 , (g − 0.5)2 ]
We plot the resulting paired χ and λ values for values of λ less than 4(1/(n − 1) − 0.5)2 . Values
√ can be considered non-independent.
outside of 1.78
n
Value
Returns a chi-plot.
Author(s)
Ken Aho and Tom Taverner (Tom provided modified original code to eliminate looping)
References
Everitt, B. (2005) R and S-plus companion to multivariate analysis. Springer.
Fisher, N. I, and Switzer, P. (1985) Chi-plots for assessing dependence. Biometrika, 72: 253-265.
Fisher, N. I., and Switzer, P. (2001) Graphical assessment of dependence: is a picture worth 100
tests? The American Statistician, 55: 233-239.
chronic
57
See Also
bv.boxplot
Examples
Y1<-rnorm(100, 15, 2)
Y2<-rnorm(100, 18, 3.2)
chi.plot(Y1, Y2)
chronic
Chronic ailment counts for urban and rural women in Australia
Description
Brown et al (1996) showed that Australian women who live in rural areas tended to have fewer visits
with general practitioners. It was not clear from this data, however, whether this was because they
were healthier or because of other factors (e.g. shortage of doctors, higher costs of visits, longer
distances to travel for visits, etc.). To address this Dobson issue (2001) compiled data describing the
number of chronic medical conditions for women visiting general practitioners in New South Wales.
Women were divided into two groups; those from rural areas, and those from urban areas. All of the
women were age 70-75, had the same socioeconomic status and reported to general practitioners
three or fewer times in 1996. The question of central interest was: "do women who have the same
level of general practitioner visits have the same medical need?"
Usage
data(chronic)
Format
A data frame with 49 observations on the following 4 variables.
subject The subject number.
count The number of chronic conditions in a subject.
setting a factor with levels RURAL URBAN.
Source
Dobson, A. J. 2001. An Introduction to Generalized Linear Models, 2nd edition. Chapman and
Hall, London.
References
Brown, W. J. Bryon, L., Byles, J., et al. (1996) Women’s health in Australia: establishment of the
Australian longitudinal study on women’s health. Journal of Women’s Health. 5: 467-472.
58
ci.boot
ci.boot
Bootstrap confidence intervals
Description
Bootstrap confidence intervals for the output of function bootstrap. Up to five different interval estimation methods can be called simultaneously: the normal approximation, the basic bootstrap, the
percentile method, the bias corrected and accelerated method (BCa), and the studentized bootstrap
method.
Usage
ci.boot(x, method = "all", sigma.t = NULL, conf = 0.95)
Arguments
x
For ci.boot the list output from bootstrap.
method
CI interval method to be used. One of "all", "norm", "basic", "perc", "BCa",
or "student". Partial matches are allowed.
sigma.t
Vector of standard errors in association with studentized intervals.
conf
Confidence level; 1 - P(Type I error).
Author(s)
Ken Aho
References
Manly, B. F. J. (1997) Randomization and Monte Carlo methods in biology, 2nd edition. Chapman
and Hall, London.
See Also
boot, bootstrap,
Examples
data(vs)
# A partial set of observations from a single plot for a Scandinavian
# moss/vascular plant/lichen survey.
site18<-t(vs[1,])
#Shannon-Weiner diversity
SW<-function(data){
ci.median
59
d<-data[data!=0]
p<-d/sum(d)
-1*sum(p*log(p))
}
b <- bootstrap(site18[,1],SW)
ci.boot(b)
ci.median
Confidence interval for the median
Description
Calculates the upper and lower confidence bounds for the true median, and calculates true coverage
of the interval.
Usage
ci.median(x, conf = 0.95)
Arguments
x
A vector of quantitative data.
conf
The desired level of confidence 1 - P(type I error).
Value
Returns a list of class = "ci". Default printed results are the paramter estimate and confidence
bounds. Other invisible objects include:
coverage
The true coverage of the interval.
Author(s)
Ken Aho
References
Ott, R. L., and M. T. Longnecker (2004) A first course in statistical methods. Thompson.
See Also
median
Examples
x<-rnorm(20)
ci.median(x)
60
ci.mu.oneside
ci.mu.oneside
One sided confidence interval for mu.
Description
In some situations we may wish to quantify confidence in the region above or below a mean estimate. For instance, a biologist working with an endangered species may be interested in saying:
"I am 95 percent confident that the true mean number of offspring is above a particular threshold."
In a one-sided situation, we essentially let our confidence be 1- 2α (instead of 1 - α). Thus, if our
significance level for a two-tailed test is α, our one-tailed significance level will be 2α.
Usage
ci.mu.oneside(data, conf = 0.95, n = NULL, Var = NULL, xbar = NULL,
summarized = FALSE, N = NULL, fpc = FALSE, tail = "upper")
Arguments
data
A vector of quantitative data. Required if summarized=TRUE.
conf
Level of confidence; 1 - P(type I error).
n
Sample size. Required if summarized=TRUE.
Var
Sample variance. Required if summarized=TRUE.
xbar
Sample mean. Required if summarized=TRUE.
summarized
Logical. Indicates whether summary statistics instead of raw data should be
used.
N
Population size. Required if summarized=TRUE.
fpc
Logical. Indicating whether finite population corrections should be made.
tail
Indicates what side the one sided confidence limit should be calculated for.
Choices are "upper" or "lower".
Value
Returns a list of class = "ci". Default output is a matrix with the sample mean and either the
upper or lower confidence limit.
Author(s)
Ken Aho
References
Bain, L. J., and Engelhardt, M. (1992) Introduction to probability and mathematical statistics.
Duxbury press. Belmont, CA, USA.
ci.mu.z
61
See Also
ci.mu.t
Examples
ci.mu.oneside(rnorm(100))
ci.mu.z
Z and t confidence intervals for mu.
Description
These functions calculate t and z confidence intervals for µ. Z confidence intervals require specification (and thus knowledge) of σ. Both methods assume underlying normal distributions although this
assumption becomes irrelevant for large sample sizes. Finite population corrections are provided if
requested.
Usage
ci.mu.z(data, conf = 0.95, sigma = 1, summarized = FALSE, xbar = NULL,
fpc = FALSE, N = NULL, n = NULL)
ci.mu.t(data, conf = 0.95, summarized = FALSE, xbar = NULL, sd = NULL,
fpc = FALSE, N = NULL, n = NULL)
Arguments
data
A vector of quantitative data. Required if summarized = FALSE
conf
Confidence level; 1 - alpha.
sigma
The population standard deviation.
summarized
A logical statement specifying whether statistical summaries are to be used. If
summarized = FALSE, then the sample mean and the sample standard deviation
(t.conf only) are calculated from the vector provided in data. If summarized = FALSE
then the sample mean xbar, the sample size n, and, in the case of ci.mu.t, the
sample standard deviation st.dev, must be provided by the user.
xbar
The sample mean. Required if summarized = TRUE.
fpc
A logical statement specifying whether a finite population correction should be
made. If fpc = TRUE then both the sample size n and the population size N must
be specified.
N
The population size. Required if fpc=TRUE
sd
The sample standard deviation. Required if summarized=TRUE.
n
The sample size. Required if summarized = TRUE.
62
ci.p
Details
ci.mu.z and ci.mu.t calculate confidence intervals for either summarized data or a dataset provided in data. Finite population corrections are made if a user specifies fpc=TRUE and provides
some value for N.
Value
Returns a list of class = "ci". Default printed results are the parameter estimate and confidence
bounds. Other invisible objects include:
Margin
the confidence margin.
Author(s)
Ken Aho
References
Lohr, S. L. (1999) Sampling: design and analysis. Duxbury Press. Pacific Grove, USA.
See Also
pnorm, pt
Examples
#With summarized=FALSE
x<-c(5,10,5,20,30,15,20,25,0,5,10,5,7,10,20,40,30,40,10,5,0,0,3,20,30)
ci.mu.z(x,conf=.95,sigma=4,summarized=FALSE)
ci.mu.t(x,conf=.95,summarized=FALSE)
#With summarized = TRUE
ci.mu.z(x,conf=.95,sigma=4,xbar=14.6,n=25,summarized=TRUE)
ci.mu.t(x,conf=.95,sd=4,xbar=14.6,n=25,summarized=TRUE)
#with finite population correction and summarized = TRUE
ci.mu.z(x,conf=.95,sigma=4,xbar=14.6,n=25,summarized=TRUE,fpc=TRUE,N=100)
ci.mu.t(x,conf=.95,sd=4,xbar=14.6,n=25,summarized=TRUE,fpc=TRUE,N=100)
ci.p
Confidence interval estimation for the binomial parameter pi using
five popular methods.
Description
Confidence interval formulae for µ are not appropriate for variables describing binary outcomes.
The function p.conf calculates confidence intervals for the binomial parameter π (probability of
success) using raw or summarized data. By default Agresti-Coull point estimators are used to
estimate π and σπˆ . If raw data are to be used (the default) then successes should be indicated as
ones and failures as zeros in the data vector. Finite population corrections can also be specified.
ci.p
63
Usage
ci.p(data, conf = 0.95, summarized = FALSE, phat = NULL, S.phat = NULL,
fpc = FALSE, n = NULL, N = NULL, method="agresti.coull", plot = TRUE)
Arguments
data
A vector of binary data. Required if summarized = FALSE.
conf
Level of confidence 1 P(type I error).
summarized
Logical; indicate whether raw data or summary stats are to be used.
phat
Estimate of π. Required if summarized = TRUE.
S.phat
Estimate of σπˆ . Required if summarized = TRUE.
fpc
Logical. Indicates whether finite population corrections should be used. If
fpc = TRUE then N must be specified. Finite population corrections are not
possible for method = "exact" or method = "score".
n
Sample size. Required if summarized = TRUE.
N
Population size. Required if fpc = TRUE.
method
Type of method to be used in confidence interval calculations, method ="agresti.coull"
is the default. Other procedures include method="asymptotic" which provides
the conventional normal approximation, method = "score", method = "LR",
and method="exact" (see Details below). Partial names can be used. The
"exact" method cannot be implemented if summarized=TRUE.
plot
Logical. Should likelihood ratio plot be created with estimate from method = "LR".
Details
For the binomial distribution the parameter of interest is the probability of success, π. ML estimators for the parameter, π, and its standard deviation, σπ are:
π
ˆ=
x
,
n
r
π
ˆ (1 − π
ˆ)
n
where x is the number of succeses and n is the number of observations.
σπˆ =
Becasue the sampling distribution of any ML estimator is asymptotically normal an "asymptotic"
100(1 - α)% confidence interval for π is found using:
π
ˆ ± z1−(α/2) .
This method has also been called the Wald confidence interval.
These estimators can create extremely inaccurate confidence intervals, particulary for small sample
sizes or when π is near 0 or 1 (Agresti 2012). A better method is to invert the Wald binomial
test statistic and vary values for π0 in the test statistic numerator and standard error. The interval
consists of values of π0 in which result in a failure to reject H0 at α. Bounds can be obtained by
64
ci.p
finding the roots of a quadratic expansion of the binomial likelihood function (See Agresti 2012).
This has been called a "score" confidence interval (Agresti 2012). An simple approximation to this
method can be obtained by adding the number two to the number of successes and failures (Agresti
and Coull 1998). The resulting Agresti-Coull estimators for π and σπˆ are:
x+2
,
n+4
r
π
ˆ (1 − π
ˆ)
σπˆ =
n+4
π
ˆ=
As above the 100(1 - α)% confidence interval for the binomial parameter π is found using:
π
ˆ ± z1−(α/2) .
The likelihood ratio method method = "LR" finds points in the binomial log-likelhood function
where the difference between the maximum likelihood and likelihood function is closest to χ21 (1 −
α)/2 for support given in π0 . As support the function uses seq(0.00001, 0.99999, by = 0.00001).
The "exact" method of Clopper and Pearson (1934) is bounded at the nominal limits, but actual
coverage may be well below this level, particularly when n is small and π is near 0 or 1.
Agresti (2012) reccomends the Agresti-Coull method over the normal approximation, the score
method over the Agresti-Coull method, and the likelihood ratio method over all others. The Clopper
Pearson has been repeatedly criticized as being too conservative (Agresti and Coull 2012).
Value
Returns a list of class = "ci".
pi.hat
Estimate for π.
S.p.hat
Estimate for σπˆ .
margin
Confidence margin.
ci
Confidence interval.
Note
This function contains only a few of the many methods that have been proposed for confidence
interval estimation for π.
Author(s)
Ken Aho
References
Agresti, A. (2012) Categorical data analysis, 3rd edition. New York. Wiley.
Agresti, A., and Coull, B . A. (1998) Approximate is better than ’exact’ for interval estimation of
binomial proportions. The American Statistician. 52: 119-126.
ci.prat
65
Clopper, C. and Pearson, S. (1934) The use of confidence or fiducial limits illustrated in the case of
the Binomial. Biometrika 26: 404-413.
Ott, R. L., and Longnecker, M. T. (2004) A first course in statistical methods. Thompson.
Wilson, E. B.(1927) Probable inference, the law of succession, and statistical inference. Journal of
the American Statistical Association 22: 209-212.
See Also
ci.mu.z
Examples
#In 2001, it was estimated that 56,200 Americans would be diagnosed with
# non-Hodgkin's lymphoma and that 26,300 would die from it (Cernan et al. 2002).
# Here we find the 95% confidence interval for the probability of diagnosis, pi.
ci.p(c(rep(0, 56200-26300),rep(1,26300)))
ci.p(c(rep(0, 56200-26300),rep(1,26300)), method = "LR")
ci.prat
Confidence intervals for the ratio of binomial and multinomial proportions
Description
A number of methods have been develeloped for obtaining confidence intervals for the ratio of
two binomial proportions. These include the Wald/Katz-log method (Katz et al. 1978), adjustedlog (Walter 1975, Pettigrew et al. 1986), Koopman asymptotic score (Koopman 1984), Inverse
hyperbolic sine transformation (Newman 2001), the Bailey method (Bailey (1987), and the Noether
(1957) procedure. Koopman results are found iteratively for most intervals using root finding.
Usage
ci.prat(y1, n1, y2, n2, conf = 0.95, method = "katz.log",
bonf = FALSE, tol = .Machine$double.eps^0.25, R = 1000, r = length(y1))
Arguments
y1
The ratio numerator number of successes. A scalar or vector.
n1
The ratio numerator number of trials. A scalar or vector of length(y1)
y2
The ratio denominator number of successes. A scalar or vector of length(y1)
n2
The ratio denominator number of trials. A scalar or vector of length(y1)
conf
The level of confidence, i.e. 1 - P(type I error).
method
Confidence interval method. One of "adj.log", "bailey", "boot", "katz.log",
"koopman", "sinh-1" or "noether". Partial distinct names can be used.
bonf
Logical, indicating whether or not Bonferroni corrections should be applied for
simultaneous inference if y1, y2, n1 and n2 are vectors.
66
ci.prat
tol
The desired accuracy (convergence tolerance) for the iterative root finding procedure when finding Koopman intevals. The default is taken to be the smallest
positive floating-point number of the workstation implementing the function,
raised to the 0.25 power, and will normally be approximately 0.0001.
R
If method "boot" is chosen, the number of bootstrap iterations.
r
The number of ratios to which family-wise inferences are being made. Assumed
to be length(y1).
Details
Let Y1 and Y2 be multinomial random variables with parameters n1 , π1i , and n2 , π2i , respectively;
where i = {1, 2, 3, . . . , r}. This encompasses the binomial case in which r = 1. We define the true
selection ratio for the ith resource of r total resources to be:
θi =
π1i
π2i
where π1i and π2i represent the proportional use and availability of the ith resource, respectively.
Note that if r = 1 the selection ratio becomes relative risk. The maximum likelihood estimators for
π1i and π2i are the sample proportions:
π
ˆ1i =
y1i
,
n1
π
ˆ2i =
y2i
n2
and
where y1i and y2i are the observed counts for use and availability for the ith resource. The estimator
for θi is:
π
ˆ1i
θˆi =
.
π
ˆ2i
Method
Algorithm
Katz-log
θˆi × exp(±z1 − α/2ˆ
σW ),
(1−ˆ
π1i )
π2i )
2
where σ
ˆW = πˆ1i n1 + (1−ˆ
π
ˆ 2i n2 .
Adjusted-log
θˆAi × exp(±z1 − α/2ˆ
σA ),
y1i +0.5/n1 +0.5
ˆ
where θAi = y2i +0.5/n2 +0.5 ,
1
1
1
2
σ
ˆA
= y1 +0.5
− n1 +0.5
+ y2 +0.5
−
1
n2 +0.5 .
1/2
0
0
0
0
1±z1 −(α/2)(π
ˆ 1i
/y1i +ˆ
π2i
/y2i −z1 −(α/2)2 π
ˆ 1i
π
ˆ 2i
/9y1i y2i )
0 /9y
1−z1−(α/2)2 π
ˆ 2i
2i
0
where πˆ1i 0 = 1 - π
ˆ1i , and π
ˆ2i
=1-π
ˆ2i .
Bailey
θˆi
Inv. hyperbolic sine
h
q
z
1
ln(θˆi ) ± 2sinh−1 (1−α/2)
2
y1i −
1
n1
+
1
y2i
−
1
n2
i
,
/3
3
,
ci.prat
Koopman
67
Find X 2 (θ0 ) = χ21 (1 − α), where
π
˜1i =
π
˜2i =
Noether
θ0 (n1 +y2i )+y1i +n2 −[{θ0 (n1 +y2i )+y1i +n2 }2 −4θ0 (n1 +n2 )(y1i +y2i )]
2(n1 +n
n 2)
o
(y1i −n1 π
˜ 1i )2
n1 (θ0 −˜
π1i )
π
˜ 1i
2
θ0 , and X (θ0 ) = n1 π
˜ 1i (1−˜
π1i ) 1 + n2 (1−˜
π1i ) .
θˆi ± z1 − α/2ˆ
σN
,
2
where σ
ˆN
= θˆi2 y11i −
1
n1
+
1
y2i
−
1
n2
0.5
,
.
Exception handling strategies are generally necessary in the cases y1 = 0, n1 = y1 , y2 = 0, and n2 =
y2 (see Aho and Bowyer, in review).
The bootstrap method currently employs percentile confidence intervals.
Value
Returns a list of class = "ci". Default output is a matrix with the point and interval estimate.
Author(s)
Ken Aho
References
Agresti, A., Min, Y. (2001) On small-sample confidence intervals for parameters in discrete distributions. Biometrics 57: 963-97.
Aho, K., and Bowyer, T. (In press: 10/27/2014) Confidence intervals for ratios of proportions:
implications for selection ratios. Methods in Ecology and Evolution.
Bailey, B.J.R. (1987) Confidence limits to the risk ratio. Biometrics 43(1): 201-205.
Katz, D., Baptista, J., Azen, S. P., and Pike, M. C. (1978) Obtaining confidence intervals for the risk
ratio in cohort studies. Biometrics 34: 469-474
Koopman, P. A. R. (1984) Confidence intervals for the ratio of two binomial proportions. Biometrics
40:513-517.
Manly, B. F., McDonald, L. L., Thomas, D. L., McDonald, T. L. and Erickson, W.P. (2002) Resource
Selection by Animals: Statistical Design and Analysis for Field Studies. 2nd edn. Kluwer, New
York, NY
Newcombe, R. G. (2001) Logit confidence intervals and the inverse sinh transformation. The American Statistician 55: 200-202.
Pettigrew H. M., Gart, J. J., Thomas, D. G. (1986) The bias and higher cumulants of the logarithm
of a binomial variate. Biometrika 73(2): 425-435.
Walter, S. D. (1975) The distribution of Levins measure of attributable risk. Biometrika 62(2):
371-374.
See Also
ci.p, ci.prat.ak
68
ci.prat.ak
Examples
# From Koopman (1984)
ci.prat(y1 = 36, n1 = 40, y2 = 16, n2 = 80, method = "katz")
ci.prat(y1 = 36, n1 = 40, y2 = 16, n2 = 80, method = "koop")
ci.prat.ak
Confidence intervals for ratios of proportions when the denominator
is known
Description
It is increasingly possible that resource availabilities on a landscape will be known. For instance,
in remotely sensed imagery with sub-meter resolution, the areal coverage of resources can be quantified to a high degree of precision, at even large spatial scales. Included in this function are six
methods for computation of confidence intervals for a true ratio of proportions when the denominator proportion is known. The first (adjusted-Wald) results from the variance of the estimator σπˆ
after multiplication by a constant. Similarly, the second method(Agresti-Coull-adjusted) adjusts the
variance of the estimator σπˆAC , where π
ˆAC = (y + 2)/(n + 4). The third method (fixed-log) is
based on delta derivations of the logged ratio. The fourth method is Bayesian and based on the beta
posterior distribution derived from a binomial likelhood function and a beta prior distribution. The
fifth procedure is an older method based on Noether (1959). Sixth, bootstrapping methods can also
be implemented.
Usage
ci.prat.ak(y1, n1, pi2 = NULL, method = "ac", conf = 0.95, bonf = FALSE,
bootCI.method = "perc", R = 1000, sigma.t = NULL, r = length(y1), gamma.hyper = 1,
beta.hyper = 1)
Arguments
y1
The ratio numerator number of successes. A scalar or vector.
n1
The ratio numerator number of trials. A scalar or vector of length(y1)
pi2
The denominator proportion. A scalar or vector of length(y1)
method
One of "ac", "wald", "noether-fixed", "boot", "fixed-log" or "bayes"
for the Agresti-Coull-adjusted, adjusted Wald, noether-fixed, bootstrapping, fixedlog and Bayes-beta, methods, respectively. Partial distinct names can be used.
conf
The level of confidence, i.e. 1 - P(type I error).
bonf
Logical, indicating whether or not Bonferroni corrections should be applied for
simultaneous inference if y1, y2, n1 and n2 are vectors.
bootCI.method
If method = "boot" the type of bootstrap confidence interval to calculate. One
of "norm", "basic", "perc", "BCa", or "student". See ci.boot for more
information.
R
If method = "boot" the number of bootstrap samples to take. See ci.boot for
more information.
ci.prat.ak
69
sigma.t
If method = "boot" and bootCI.methd = "student" a vector of standard
errors in association with studentized intervals. See ci.boot for more information.
r
The number of ratios to which family-wise inferences are being made. Assumed
to be length(y1).
gamma.hyper
If method = "bayes". A scalar or vector. Value(s) for the first hyperparameter
for the beta prior distribution.
beta.hyper
If method = "bayes". A scalar or vector. Value(s) for the second hyperparameter for the beta prior distribution.
Details
Koopman et al. (1984) suggested methods for handling extreme cases of y1 , n1 , y2 , and n2 (see
below). These are applied through exception handling here (see Aho and Bowyer in review).
Let Y1 and Y2 be multinomial random variables with parameters n1 , π1i , and n2 , π2i , respectively;
where i = {1, 2, 3, . . . , r}. This encompasses the binomial case in which r = 1. We define the true
selection ratio for the ith resource of r total resources to be:
θi =
π1i
π2i
where π1i and π2i represent the proportional use and availability of the ith resource, respectively. If
r = 1 the selection ratio becomes relative risk. The maximum likelihood estimators for π1i and π2i
are the sample proportions:
π
ˆ1i =
y1i
,
n1
π
ˆ2i =
y2i
n2
and
where y1i and y2i are the observed counts for use and availability for the ith resource. If π2i s are
known, the estimator for θi is:
π
ˆ1i
θˆi =
.
π2i
The function ci.prat.ak assumes that selection ratios are being specified (although other aplications are certainly possible). There it assume that y1i must be greater than 0 if π2i = 1, and assumes
that y1i must = 0 if π2i = 0. Violation of these conditions will produce a warning message.
Method
Algorithm
Agresti Coull-Adjusted
p
2 ,
ˆAC1i (1 − π
ˆAC1i )/(n1 + 4)ˆ
πAC1i π2i
θˆACi ± z1−(α/2) π
y1 +2
π
ˆ AC1i
ˆ
where π
ˆAC1i = n1 +4 , and θACi = π2i .
Bayes-beta
( πα/2
, 1−(α/2)
),
π2i
2i
where X ∼ BET A(y1i + γi , n1 + β − y1i ).
X
X
70
ci.sigma
Fixed-log
Noether-fixed
Wald-adjusted
θˆi × exp ±z1−α/2 σ
ˆF ,
where σ
ˆF2 = (1 − π
ˆ1i )/ˆ
π1i n1 .
2
z1−(α/2)
π
ˆ 1i /π2
1
+
2
2y1i
1+z1−(α/2)
1−ˆ
π1i
2
where σ
ˆN
=
F
n1 π
ˆ 1i .
θˆi ± z1−(α/2)
r
±
2
z1−(α/2)
2
σ
ˆN
F +
2
z1−(α/2)
2
4y1i
,
p
2 .
π
ˆ1i (1 − π
ˆ1i )/n1 π
ˆ1i π2i
Value
Returns a list of class = "ci". Default output is a matrix with the point and interval estimate.
Author(s)
Ken Aho
References
Aho, K., and Bowyer, T. (In press: 10/27/2014) Confidence intervals for ratios of multinomial
random variables (selection ratios). Methods in Ecology and Evolution.
See Also
ci.prat, ci.p
Examples
ci.prat.ak(3,4,.5)
ci.sigma
Confidence interval for sigma squared.
Description
The function calculates confidence intervals for σ 2 . We assume that the parent population is normal.
Usage
ci.sigma(data, conf = 0.95, S.sq = NULL, n = NULL, summarized = FALSE)
ci.strat
71
Arguments
data
A vector of quantitative data. Required if summarized=FALSE.
conf
Level of confidence. 1 - P(type I error).
S.sq
Sample variance, required if summarized=TRUE.
n
Sample size, required if summarized=TRUE.
summarized
Logical. If summarized=TRUE then the user must supply S.sq and n
Value
Returns a list of class = "ci". Default printed results are the point estimate and confidence
bounds. Other objects are invisible.
Author(s)
Ken Aho
References
Bain, L. J., and M. Engelhardt. 1992. Introduction to probability and mathematical statistics.
Duxbury press. Belmont, CA, USA.
See Also
ci.mu.z
Examples
ci.sigma(rnorm(20))
ci.strat
Confidence intervals for stratified random samples.
Description
A statistical estimate along with its associated confidence interval can be considered to be an inferential statement about the sampled population. However this statement will only be correct if the
method of sampling is considered in the computations of standard errors. The function ci.strat
provides appropriate computations given stratified random sampling.
Usage
ci.strat(data, strat, N.h, conf = 0.95, summarized = FALSE, use.t = FALSE,
n.h = NULL, x.bar.h = NULL, var.h = NULL)
72
ci.strat
Arguments
data
A vector of quantitative data. Required if summarized=FALSE.
strat
A vector describing strata.
N.h
A vector dexcribing the number of experimental units for each of the k strata.
conf
Level of confidence; 1 - P(type I error).
summarized
Logical. Indicates whether summarized data are to be used.
use.t
Logical. Indicates whether t or z confidence intervals should be built.
n.h
A vector indicating the number of experimental units sampled in each of the k
strata. Required if summarized=TRUE.
x.bar.h
A vector containing the sample means for each of the k strata. Required if
summarized=TRUE .
var.h
A vector containing the sample variances for each of the k strata. Required if
summarized=TRUE.
Details
the conventional formula for the sample standard error assumes simple random sampling. There
are two other general types of sampling designs: stratified random sampling and cluster sampling.
Since cluster sampling is generally used for surveys involving human demographics we will only
describe corrections for stratified random sampling here. For more information on sample standard
error adjustments for cluster sampling see Lohr (1999).
For a stratified random sampling design let N be the known total number of units in the defined
population of interest, and assume that the population can be logically divided into k strata; N =
N1 + N2 + N3 + . . . + Nk (i.e. we are assuming that we know both the total population size,
and the population size of each stratum). We sample each of the k strata with nh observations;
h = 1, 2, . . . , k.
We estimate the variance in the hth stratum as:
n
Sh2
k
1 X
¯ h )2
=
(Xhi − X
nh − 1 i=1
¯ h is the hth sample mean. We estimate
where Xhi is the ith observation from the hth strata and X
the true population total, T, with:
k
X
ˆ
¯h
T =
Nh X
h=i
We estimate the population mean, µ, with:
ˆ
¯ str = T
X
N
¯ str is:
An unbiased estimator for the standard error of X
v
u k 2 2 uX
Sh
nh
Nh
SX¯ str = t
1−
Nh
N
nh
h=1
ci.strat
73
The standard error of Tˆ is also of interest. Here is an unbiased estimator:
v
u k 2
uX
Sh
nh
t
2
STˆ =
1−
Nh
Nh
nh
h=1
Note that these standard errors have both a finite population correction and adjustments for stratification built into them. Assuming that sample sizes within each stratum are large or that the
sampling design has a large number of strata, a 100(1 - α)percent confidence interval for µ and T
can be constructed using:
¯ str ± z1−α/2 SX¯
X
str
Tˆ ± z1−α/2 STˆ
In situations where sample sizes or the number of strata are small, a t(n − k) distribution can (and
should) be used for calculation of confidence intervals, where n = n1 + n2 + . . . + nk .
Value
Returns a list with two items:
strat.summary
A matrix with columns: N.h,n.h,x.bar.h and var.h
CI
Confidence intervals for µ and T
Author(s)
Ken Aho
References
Lohr, S. L. (1999) Sampling: design and analysis. Duxbury Press. Pacific Grove, USA.
Siniff, D. B., and Skoog, R. O. (1964) Aerial censusing of caribou using stratified random sampling.
Journal of Wildlife Management 28: 391-401.
See Also
ci.mu.z
Examples
#Data from Siniff and Skoog (1964)
Caribou<-data.frame(Stratum=c("A","B","C","D","E","F"),N.h=c(400,30,61,18,70,120),
n.h=c(98,10,37,6,39,21),x.bar.h=c(24.1,25.6,267.6,179,293.7,33.2),
var.h=c(5575,4064,347556,22798,123578,9795))
attach(Caribou)
ci.strat(data,strat=Stratum,N.h=N.h,conf=.95,summarized=TRUE,use.t=FALSE,n.h=n.h,
x.bar.h=x.bar.h,var.h=var.h)
74
cliff.sp
cliff.env
Environmental data for the community dataset cliff.sp
Description
The data here are a subset of a dataset collected by Aho (2006) which describe the distribution
of communities of lichens and vascular and avascular plant species on montane cliffs in Northeast
Yellowstone National Park. Of particular interest was whether substrate (limestone or andesitic
conglomerate) or water supply influenced community composition.
Usage
data(cliff.env)
Format
This data frame contains the following columns:
sub a factor with 2 levels "Andesite" and "Lime" describing substrate type.
water a factor with 3 levels "W" "I" "D" indicating wet, intermediate, or dry conditions.
Details
Two categorical environmental variables are described for 54 sites. sub describes the substrate;
there are two levels: "Andesite" and "Lime". water describes distance of samples from waterfalls
which drain the cliff faces; there are three levels "W" indicating wet, "I" indicating intermediate,
and "D" indicating dry.
Source
Aho, K.(2006) Alpine ecology and subalpine cliff ecology in the Northern Rocky Mountains. Doctoral dissertation, Montana State University, 458 pgs.
cliff.sp
Yellowstone NP cliff community data
Description
A subset of a dataset collected by Aho (2006) which describes the distribution of communities
of lichens and vascular and avascular plant species on montane cliffs in Northeast Yellowstone
National Park. Of particular interest was whether substrate (limestone or andesitic conglomerate)
or water supply influenced community composition.
Usage
data(cliff.sp)
ConDis.matrix
75
Details
Responses are average counts from two 10 x 10 point frames at 54 sites. Abundance data are for
eleven species, 9 lichens, 3 mosses, and 2 vascular plants. Data were gathered in the summer of
2004 on two andesitic/volcanic peaks (Barronette and Abiathar) with sedimentary layers at lower
elevations.
Source
Aho, K.(2006) Alpine ecology and subalpine cliff ecology in the Northern Rocky Mountains. Doctoral dissertation, Montana State University, 458 pgs.
ConDis.matrix
Calculation and display of concordant and discordant pairs
Description
Calculates whether pairs of observations from two vectors are concordant discordant or neither.
These are displayed in the lower diagonal of a symmetric output matrix as 1, -1 or 0.
Usage
ConDis.matrix(Y1, Y2)
Arguments
Y1
A vector of quantitative data.
Y2
A vector of quantitative data. Observations are assumed to be paired with respective observations from Y1.
Details
Consider all possible combinations of (Y1i , Yij ) and (Y2i , Yij ) where 1 <= i < j <= n. A pair
is concordant if Y1i > Y1j and Y2i > Y2j or if Y1i < Y1j and Y2i < Y2j . Conversely, a pair is
discordant if Y1i < Y1j and Y2i > Y2j or if Y1i > Y1j and Y2 i < Y2 j. This information has a
number of important uses including calculation of Kendall’s τ .
Value
A matrix is returned. The lower triangle indicates whether observations are concordant (element =
1), disconcordant (element = -1) or neither (element = 0).
Author(s)
Ken Aho
76
corn
References
Hollander, M., and Wolfe, D. A. (1999) Nonparametric statistical methods. New York: John Wiley
& Sons.
Liebetrau, A. M. (1983) Measures of association. Sage Publications, Newbury Park, CA.
Sokal, R. R., and Rohlf, F. J. (1995) Biometry. W. H. Freeman and Co., New York.
See Also
cor
Examples
#Crab data from Sokal and Rohlf (1998)
crab<-data.frame(gill.wt=c(159,179,100,45,384,230,100,320,80,220,320,210),
body.wt=c(14.4,15.2,11.3,2.5,22.7,14.9,1.41,15.81,4.19,15.39,17.25,9.52))
attach(crab)
crabm<-ConDis.matrix(gill.wt,body.wt)
crabm
corn
Corn yield data
Description
Hoshmand (2006) described a split plot design to test grain yield of corn with respect to corn hybrids
(whole plots) and nitrogen (in split plots). The experiment was replicated at two blocks.
Usage
data(corn)
Format
A data frame with 40 observations on the following 4 variables.
yield Corn yield in bushels per acre.
hybrid Type of hybrid, P = pioneer, levels were: A632xLH38 LH74xLH51 Mo17xA634 P3732 P3747.
N Nitrogen addition in lbs/acre 0 70 140 210.
block A blocking factor with levels 1 2.
Source
Hoshmand, A. R. (2006) Design of Experiments for Agriculture and the Natural Sciences 2nd Edition. Chapman and Hall.
crab.weight
crab.weight
77
crab gill and body weight data
Description
Gill weight and body weight data for 12 striped shore crabs (Pachygrapsus crassipes).
Usage
data(crab.weight)
Format
A data frame with 12 observations on the following 2 variables.
gill.wt Gill weight in mg
body.wt Body weight in grams
Source
Sokal, R. R., and F. J. Rohlf (2012) Biometry, 4th edition. W. H. Freeman and Co., New York.
crabs
Agresti crabs dataset
Description
Horseshoe crab satellite counts as a function of crab phenotype.
Usage
data(crabs)
Format
A data frame with 173 observations on the following 5 variables.
color A factor with levels 1 = light medium, 2 = medium, 3 = dark medium, 4 = dark.
spine A factor with levels 1 = both good, 2 = one worn or broken, 3 = both worn or broken.
width Crab carapace width in cm.
satell Number of satellites.
weight Crab weight in in kg.
Source
Agresti, A. (2012) An Introduction to Categorical Data Analysis, 3rd edition. Wiley, New Jersey.
78
D.sq
References
Brockman, H. J. (1996) Satellite male groups in horseshoe crabs, Limulus polyphemus. Ethology
102(1) 1-21.
cuckoo
Tippett cuckoo egg data
Description
Part of a dataset detailing cuckoo egg lengths found in other birds nests. Units are millimeters
Usage
data(cuckoo)
Format
A data frame with 16 observations on the following 3 variables.
TP Tree pipit
HS Hedge sparrow
RB Robin
Source
Tippett, L. H. C. (1952) The Methods of Statistics, 4th Edition. Wiley.
D.sq
Mahalanobis distance for two sites using a pooled covariance matrix
Description
Allows much easier multivariate comparisons of groups of sites then provided by the function
mahalanobis in the base library.
Usage
D.sq(g1, g2)
Arguments
g1
Community vector for site 1
g2
Community vector for site 2
death.penalty
79
Author(s)
Ken Aho
References
Legendre, P, and L. Legendre (1998) Numerical ecology, 2nd English edition. Elsevier, Amsterdam,
The Netherlands.
See Also
mahalanobis
Examples
g1<-matrix(ncol=3,nrow=3,data=c(1,0,3,2,1,3,4,0,2))
g2<-matrix(ncol=3,nrow=3,data=c(1,2,4,5,2,3,4,3,1))
D.sq(g1,g2)$D.sq
death.penalty
Florida state death penalty data
Description
Dataset detailing death penalty 674 homicide trials in the state of Florida from 1976-1987 with
repect to verdict, and victim and defendant race. The data were previously used (Agresti 2012) to
demonstrate Simpson’s Paradox.
Usage
data(death.penalty)
Format
A data frame with 8 observations on the following 4 variables.
count Counts from cross classifications.
verdict Death penalty verdict No Yes.
d.race Defendant’s race Black White.
v.race Victims’ race Black White.
Details
A reversal of associations or comparisons may occur as a result of lurking variables or aggregating
groups. This is called Simpson’s Paradox.
80
deer
Source
Agresti, A. (2012) Categorical data analysis, 3rd edition. New York. Wiley.
Radelet, M. L., and G. L. Pierce (1991) Choosing those who will die: race and the death penalty in
Florida. Florida Law Review 43(1):1-34.
Simpson, E. H. (1951) The Interpretation of Interaction in Contingency Tables. Journal of the Royal
Statistical Society Ser. B 13: 238-241.
deer
Maternal deer data
Description
Monteith et al. (2009) examined the maternal life history characteristics of white-tailed deer (Odocoileus
virginianus) originating from the Black Hills in southwestern South Dakota and from eastern South
Dakota. Because litter size and dam size affects offspring weight the investigators used proportional
birth mass (dam mass/total litter mass) as a measure of reproductive investment by deer.
Usage
data(deer)
Format
The dataframe contains 6 columns
Birth.Yr Year of birth.
Litter.size Number of offspring.
Region Categorical variable with two factor levels. BH = Black Hills, ER = Eastern Region.
Dam.weight Dam weight in kg.
Total.birth.mass Mass of litter in kg.
Prop.mass Total birth mass divided by dam weight.
Source
Monteith, K. L, Schmitz, L. E., Jenks, J. A., Delger, J. A., and R. T. Bowyer. 2009. Growth of male
white tailed deer: consequences of maternal effects. Journal of Mammalogy 90(3): 651-660.
deer.296
deer.296
81
Mule deer telemetry data
Description
Telemetry data for mule deer #296 from the Starkey Experimental Forest in Northeastern Oregon.
Data are high resolution (10 minute) radio collar readings from 8/20/2008 to 11/6/2008. Also
included are data for nearest neighbor locations of forest/grassland boundaries.
Usage
data(deer.296)
Format
A data frame with 5423 observations on the following 7 variables.
Time Unit of time measurement used at the Starkey Experimental Forest
X Mule Deer X-coordinate, UTM Easting
Y Mule Deer Y-coordinate, UTM Northing
NEAR_X Nearest boundary location X coordinate
NEAR_Y Nearest boundary location Y coordinate
Hab_Type Type of habitat
NEAR_ANGLE A numeric vector containing the angle of azimuth to the nearest point on the boundary
with respect to a four quadrant system. NE = 0◦ to 90◦ , NW is > 90◦ and ≤ 180◦ , SE is < 0◦
and ≤ −90◦ is > −90◦ and ≤ −180◦ .
depression
Hamilton depression scores before and after drug treatment
Description
Hollander and Wolfe (1999) presented Hamilton depression scale factor measurements for 9 patients
with mixed anxiety and depression. Measurements were taken at a time preceding administration
of tranquilizer, and a time after tranquilizer administration.
Usage
data(depression)
82
DH.test
Format
A data frame with 18 observations on the following 3 variables.
subject Experimental subject.
scale Hamilton depression scale score. 0-7 is considered to be normal. Scores of 20 or higher
indicate moderate to very severe depression
time A factor with levels post pre indicating before and after tranqulizer treatment.
Source
Hollander, M., and D. A. Wolfe. 1999. Nonparametric statistical methods. New York: John Wiley
& Sons.
DH.test
Doornick-Hansen test for multivariate normality.
Description
The Doornick-Hansen test for multivariate normality is a powerful alternative to the Shapiro-Wilk
test.
Usage
DH.test(Y, Y.names = NULL)
Arguments
Y
An n x p a dataframe of dependent variables.
Y.names
Names of Y variables; should be a 1 x p character string.
Details
An assumption of multivariate normality is exceedingly difficult to verify. Hypothesis tests tend to
be too stringent, and multivariate diagnostic plots only allow viewing of two variables at a time.
Univariate normality of course can be verified using normal probability plots. However while
marginal non-normality indicates multivariate non-normality, marginal normality does not insure
that Y variables collectively follow a multivariate normal distribution.
The Doornik-Hansen test for multivariate normality (Doornik and Hansen 2008) is based on the
skewness and kurtosis of multivariate data that is transformed to insure independence. The DH test
is more powerful than the Shapiro-Wilk test for most tested multivariate distributions (Doornik and
Hansen 2008). The function DH.test also runs the Doornik-Hansen test for both multivariate and
univariate normality. The later test follows directly from the work of Bowman and Shenton (1975),
Shenton and Bowman (1977) and D’Agostino (1970).
dO2
83
Value
Returns a list with two objects.
multi
A dataframe containing multivariate results, i.e. the test statistic, E, the degrees
of freedom and the p-value.
comp2
A dataframe with p rows detailing univariate tests. Columns in the dataframe
contain the test statistics, degrees of freedom and P-values.
Note
As with all inferential normality tests our null hypothesis is that the underlying population is normal,
in this case multivariate normal.
Author(s)
Ken Aho
References
D’Agostino, R. B. (1970). Transformation to normality of the null distribution of g1, Biometrika,
57: 679-681.
Doornik, J.A. and Hansen, H. (2008). An Omnibus test for univariate and multivariate normality.
Oxford Bulletin of Economics and Statistics, 70, 927-939.
Shenton, L. R. and Bowman, K. O. (1977). A bivariate model for the distribution of b1 and b2,
Journal of the American Statistical Association, 72: 206.211.
See Also
shapiro.test, bv.boxplot
Examples
data(iris)#The ubiquitous multivariate iris data.
DH.test(iris[,1:4],Y.names=names(iris[,1:4]))
dO2
Dissolved levels in locations above and below a town
Description
Dissolved O2 readings in ppm for 15 random locations above and below a riverside community.
Usage
data(dO2)
84
drugs
Format
A data frame with 30 observations on the following 2 variables.
O2 Dissolved O2 levels in ppm.
location River flow location with respect to town. Levels are Above Below.
Source
Ott, R. L., and M. T. Longnecker (2004) A First Course in Statistical Methods. Thompson.
drugs
Contingency data for high school marijuana, alcohol, and cigarette
use
Description
Agresti (2012) incldued a three way contingency table describing cigarette, alcohol, and marijuana
use of high school students in Dayton Ohio.
Usage
data(drugs)
Format
A data frame with 8 observations on the following 4 variables.
alc Alcohol use. A factor with levels N Y.
cig Cigarette use. A factor with levels N Y.
mari Marijuana use. A factor with levels N Y
count Counts for the cross-classification.
Source
Agresti, A. 2012. Categorical data analysis, 3rd edition. New York. Wiley.
e.cancer
e.cancer
85
Esophageal cancer data modified slightly to create a balanced threeway factorial design
Description
Breslow and Day (1980) studied the effect of age, tobacco, and alcohol on esophageal cancer rates
at Ile-et-Vilaine, France. Data are altered slightly to make the design balanced, and to allow enough
degrees of freedom to perform a fully factorial three way ANOVA.
Usage
data(e.cancer)
Format
The dataset contains four variables:
age grp. age group, a factor with four levels: "25-34", "35-44", "45-54", "55-64", and
"65-74".
alcohol alcohol consumed (g/day).
tobacco tobacco consumed (g/day).
cases number of esophageal cancer cases.
Source
Breslow, N. E. and N. E. Day (1980) Statistical Methods in Cancer Research. 1: The Analysis of
Case-Control Studies. IARC Lyon / Oxford University Press.
eff.rbd
Efficiency of a randomized block design compared to a CRD
Description
Calculates the RCBD efficeincy ratio for a linear model with one main factor and one blocking
factor. Values greater than 1 indicate that the RCBD has greater efficeincy compared to a CRD.
Usage
eff.rbd(lm)
Arguments
lm
An object of class lm. The blocking factor must be called "block".
86
enzyme
Author(s)
Ken Aho
References
Kutner, M. H., C. J. Nachtsheim, J. Neter, and W. Li (2005) Applied Linear Statistical Models.
McGraw-Hill Irwin.
enzyme
Enzymatic rate data for the phospholipase protein ExoU
Description
The bacterium Pseudomonas aeruginosa causes disease in human hosts leading to sepsis and even
death in part by secreting lipases (proteins that break down lipids) into cellular environments. The
protein ExoU is a phospholipase produce by particularly virulent strains of P. aeruginosa. Benson
et al. (2009) measured of ExoU enzymatic activity under varying levels of the fluorescent phospholipase substrate PED6.
Usage
data(enzyme)
Format
A data frame with 10 observations on the following 3 variables.
substrate PED6 concentration (in micromoles).
rate enzymatic rate (nmol of cleaved of PED6 per mg EXoU).
sd standard deviation of rate for each level of substrate.
Source
Benson, M. A., Schmalzer, K. M., and D. W. Frank (2009) A sensitive flouresence-based assay for
the detection of ExoU mediated PLA2 activity. Clin Chim Acta 411(3-4): 190-197.
ES.May
87
ES.May
May’s effective specialization index
Description
May and Beverton (1990) created the effective specialization index to quantify the degree of specialization of insects with potential host plants.
Usage
ES.May(mat, digs = 3)
Arguments
mat
A symmetric matrix with potential specialist hosts in rows and and the number
species specializing on each of the host species in columns (see details below).
digs
The number of significant digits in output.
Details
The structure of the object mat is nonintuitive. In the rows of the matrix are species which can be
selected by potential specialists (i.e. hosts). May and Beverton (1990) used four oak species. The
columns indicate the degree of specialization of potential specialists. May and Beverton (1990)
were interested in the specialization of beetles. The first element (row 1, column 1) in their 4 x
4 matrix contained only beetle species found on host 1. The second element (row 1, column 2)
contained the number of beetle species found on host 1 and one other host. The third element (row
1, column 3) contained the number of beetle species found on host 1 and two other hosts. The fourth
element (row 1, column 4) contained the number of beetle species occurring on all four hosts.
Value
Output is a list
E.S_coefficients
Nk
The number of distinct specialists.
Pki.matrix
The proportion of potential specialists on the kth host
N.matrix
The raw data.
fk.matrix
fk.vector
For the kth host, the proportion of species which are effectively specialized.
Nk.vector
The number of species which are effectively specialized on the kth host.
Author(s)
Ken Aho and Jessica Fultz
88
exercise.repeated
References
May, R. M. and Beverton, R. J. H. (1990) How many species [and discussion]. Philosophical
Transactions: Biological Sciences. 330 (1257) 293-304.
Examples
#data from May and Beverton (1990)
beetle<-matrix(ncol=4,nrow=4,data=c(5,8,7,8,20,10,9,8,14,15,11,8,15,15,12,8),
byrow=TRUE)
ES.May(beetle)
exercise.repeated
Repeated measures data for an exercise experiment.
Description
Freund et al. (1986) listed data for a longitudinal study of exercise therapies. The data were analyzed using AR1 covariance matrices in mixed models by Fitzmaurice et al. (2004). In the study 37
patients were randomly assigned to one of two weightlifting programs. In the first program (TRT 1),
repetitions with weights were increased as subjects became stronger. In the second program (TRT
2), the number of repetitions was fixed but weights were increased as subjects became stronger. An
index measuring strength was created and recorded at day 0, 2, 4, 6, 8, 10, and 12.
Usage
data(exercise.repeated)
Format
The dataframe contains a repeated measures dataset describing the strength of 37 subjects with
respect to two weightlifting programs. There are four columns:
ID Subject ID.
TRT The type of weightlifting treatment (a factor with two levels, 1 and 2).
strength A strength index.
day The day that strength was measured on a subject, measured from the start of the experiment.
Source
Fitzmaurice, G. M., Laird, N. M, and Waird, J. H. (2004) Applied longitudinal analysis. Wiley.
Fbird
Fbird
89
Frigatebird drumming frequency data
Description
Male magnificent frigatebirds (Fregata magnificens) have an enlarged red throat pouch that has
probably evolved as the result of sexual selection. During courtship displays males attract females
by displaying this pouch and using it to make a drumming sound. Madsen et al. (2004) noted that
conditions (e.g. oblique viewing angles) often limit females’ ability to appraise pouch size exactly.
Since females choose mates based on pouch size, a question of interest is whether females could
use the pitch of the pouch drumming as an indicator of pouch size. Madsen et al. (2004) estimated
the pouch volume and fundamental drumming frequency for forty males at Isla Isabel in Nayarit
Mexico. Eighteen of these observations are in this dataset.
Usage
data(Fbird)
Format
The dataframe contains two variables:
vol Pouch volume (in cm3 ).
freq Frequency of drumming (in Hz)
Source
Madsen, V., Balsby, T.J.S., Dabelsteen, T., and J.L. Osorno (2004) Bimodal signaling of a sexually
selected trait: gular pouch drumming in the magnificent frigatebird. Condor 106: 156-160.
fire
Fire data from Yellowstone National Park
Description
Fires from 1988 constituted the largest conflagration in the history of Yellowstone National Park.
This dataframe lists burned areas for ten Yellowstone stream catchments (Robinson et al. 1994).
Usage
data(fire)
90
fly.sex
Format
A data frame with 10 observations on the following 2 variables.
fire Burn area in, in hectares2 .
stream A factor with levels Blacktail Cache EF.Blacktail Fairy Hellroaring Iron.Springs
Pebble Rose SF.Cache Twin
Source
Robinson, C. T., Minshall, G. W., and S. R. Rushforth (1994) The effects of the 1988 wildfires on diatom assemblages in the streams of Yellowstone National Park. Technical Report NPS/NRYELL/NRTR93/XX.
fly.sex
Fly sex and longevity
Description
Partridge and Farqaur (1981) studied the effect of the number of mating partners on the longevity of
fruitflies. Five different mating treatments were applied to single male fruitflies. As a concommitant
variable thorax length was measured.
Usage
data(fly.sex)
Format
A data frame with 125 observations on the following 3 variables.
treatment a factor with levels 1 = One virgin female per day, 2 = eight virgin females per day, 3
= a control group with one newly inseminated female per day, 4 = a control group with eigth
newly inseminated females per day, and 5 a control group with no added females.
longevity Age in days.
thorax Thorax length in mm.
Source
Quinn, G. P., and M. J. Keough. 2002. Experimental Design and Data Analysis for Biologists.
Cambridge University Press.
References
Partridge, L., and Farquhar, M. (1981), Sexual activity and the lifespan of male fruitflies, Nature
294, 580-581.
frog
91
Examples
data(fly.sex)
## maybe str(fly.sex) ; plot(fly.sex) ...
frog
Australian frog calls following fire
Description
Driscoll and Roberts (1997) examined the impact of fire on the Walpole frog (Geocrinia lutea) in
catchments in Western Australia by counting the number of calling males in six paired burn and
control sites for three years following spring burning in 1991.
Usage
data(frog)
Format
A data frame with 18 observations on the following 3 variables.
catchment A factor with levels angove logging newpipe newquinE newquinW oldquinE.
frogs The difference in the number of male frog calls for control - burned sites.
year Year.
Source
Quinn, G. P., and M. J. Keough (2002) Experimental Design and Data Analysis for Biologists.
Cambridge University Press.
References
Driscoll, D. A., and J. D. Roberts. 1997. Impact of fuel-reduction burning on the frog Geocrinia
lutea in southwest Western Australia. Australian Journal of Ecology 22:334-339.
92
G.mean
fruit
Fruit weight data from Littell et al. (2002)
Description
Valencia orange tree fruit weights are measured at harvest with respect to five irrigation treatment
applied in eight blocks in a RCBD.
Usage
data(fruit)
Format
A data frame with 40 observations on the following 3 variables.
block a factor describing eight blocks
irrig a factor with levels basin flood spray sprinkler trickle
fruitwt a numeric vector
Source
Littell, R. C., Stroup, W. W., and R. J. Fruend (2002) SAS for linear models. John Wiley and
Associates.
G.mean
Geometric mean
Description
Calculates the geometric mean.
Usage
G.mean(x)
Arguments
x
A vector of quantitative data.
Value
Returns the geometric mean.
Author(s)
Ken Aho
g.test
93
See Also
H.mean, HL.mean
Examples
x<-c(2,1,4,5,6,2.4,7,2.2,.002,15,17,.001)
G.mean(x)
g.test
Likelihood ratio test for tabular data
Description
Provides likelihood ratio tests for one way and multiway tables.
Usage
g.test(y, correct = FALSE, pi.null = NULL)
Arguments
y
A vector of at least 2 elements, or a matrix. Must contain only non-negative
integers.
correct
Logial. Indicating whether Yates correction for continuity should be used.
pi.null
Optional vector or matrix of null proportions. Must sum to one.
Author(s)
Ken Aho
Examples
obs <- c(6022, 2001)
g.test(obs, pi.null = c(0.75, 0.25))
94
Glucose2
garments
Garment Latin square data from Littell et al. (2002)
Description
Four materials (A, B, C, D) used in permenant press garments are subjected to a test fro shrinkag.
The four materials are placed are placed in a heat chamber with with four settings (pos). The test is
conducted in four runs (run).
Usage
data(garments)
Format
A data frame with 16 observations on the following 4 variables.
run Test run, a factor with levels 1 2 3 4
pos Heat position, a factor with levels 1 2 3 4
mat Fabric materials, a factor with levels A B C D
shrink Shrinkage measure, a numeric vector
Source
Littell, R. C., Stroup, W. W., and R. J. Fruend (2002) SAS for linear models. John Wiley and
Associates.
Glucose2
Glucose Levels Following Alcohol Ingestion
Description
The Glucose2 data frame has 196 rows and 4 columns.
Format
This data frame contains the following columns:
Subject a factor with levels 1 to 7 identifying the subject whose glucose level is measured.
Date a factor with levels 1 2 indicating the occasion in which the experiment was conducted.
Time a numeric vector giving the time since alcohol ingestion (in min/10).
glucose a numeric vector giving the blood glucose level (in mg/dl).
goats
95
Details
Hand and Crowder (Table A.14, pp. 180-181, 1996) describe data on the blood glucose levels
measured at 14 time points over 5 hours for 7 volunteers who took alcohol at time 0. The same
experiment was repeated on a second date with the same subjects but with a dietary additive used
for all subjects.
Note
Descriptions and details are from the library nlme.
Source
Pinheiro, J. C. and Bates, D. M. (2000), Mixed-Effects Models in S and S-PLUS, Springer, New
York. (Appendix A.10)
Hand, D. and Crowder, M. (1996), Practical Longitudinal Data Analysis, Chapman and Hall, London.
goats
Mountain goat data from Yellowstone National Park
Description
Mount goat (Oreomnos americanus) feces data and soil nutrient data for eight different mountains
in the Northern Absarokas in Yellowstone National Park.
Usage
data(goats)
Format
The dataframe has 3 columns:
feces feces concentration (Percent occurance per 0.1, m^2 plot).
NO3 Nitrate concentration in ppm.
organic.matter Organic matter concentration (LOI) as a percentage.
Source
Aho, K. (2012) Management of introduced mountain goats in Yellowstone National Park (vegetation
analysis along a mountain goat gradient). PMIS: 105289. Report prepared for USDA National Park
Service. 150 Pgs.
96
H.mean
grass
Agricultural factorial design
Description
Littell et al. (2006) descibe an experiment to distinguish the effects of three seed growing methods
on the yield of five turf grass varieties. The seed growing methods were applied to seed from each
grass variety. Six pots were planted with each variety × method combination. The pots were placed
in a growth chamber with uniform conditions and dry matter (in grams) was weighed from above
ground clips after four weeks.
Usage
data(grass)
Format
The dataframe has three columns:
yield Refers to grass yield.
method Seed growing method. A factor with three levels: a,b,c.
variety Grass variety. A factor with five levels: 1,2,3,4,5.
Source
Littell, R. C., Milliken, G. A., Stroup, W. W., Wolfinger, R. D., and O. Schabenberger (2006) SAS
for mixed models 2nd ed. SAS press.
H.mean
Harmonic mean
Description
Calculates the harmonic mean.
Usage
H.mean(x)
Arguments
x
Vector of quantitative data.
Value
Returns the harmonic mean.
heart
97
Author(s)
Ken Aho
See Also
G.mean, HL.mean
Examples
x<-c(2,1,4,5,6,2.4,7,2.2,.002,15,17,.001)
H.mean(x)
heart
Heart rate data from Milliken and Johnson (2009)
Description
A repeated measures demonstration dataset from Milliken and Johnson (1999). Heart rate was
measured for twenty four subject at four time periods following administration of a treatment. The
treatment types were two active heart drugs and a control. One treatment was assigned to each
subject. Thus each drug was administered to eight subjects.
Usage
data(heart)
Format
A data frame with 96 observations on the following 4 variables.
rate A numeric vector describing heart rate (bpm).
time A factor with levels t1 t2 t3 t4
drug A factor with levels AX23 BWW9 Ctrl
subject A factor describing which subject (in drug) that measurements were made on.
Source
Milliken, G. A., and D. E. Johnson (2008) Analysis of messy data: Vol. I. Designed experiments,
2nd edition. CRC.
Examples
## Not run:
#data(heart)
#aov(rate ~ drug * time + Error(subject
## End(Not run)
98
HL.mean
HL.mean
Hodges-Lehman estimator of location
Description
Calculates the Hodges-Lehman estimate of location –which is consistent for the true pseudomedian–
using Walsh averages (Hollander and Wolfe 1999, pgs. 51-55). If requested, the function also provides confidence intervals for the true pseudomedian. In a symmetric distribution the mean, median,
and pseudomedian will be identical.
Usage
HL.mean(x, conf = NULL, method = "exact")
Arguments
x
A vector of quantitative data.
conf
A proportion specifying 1 - P(type I error).
method
method for confidence interval calculation. One of "approx", which uses a
normal approximation, or "exact", which uses the Wilcoxon sign-rank quantile
function (see Hollander and Wolfe 1999).
Author(s)
Ken Aho
References
Hollander, M., and Wolfe, D. A (1999) Nonparametric Statistical Methods. New York: John Wiley
& Sons.
See Also
H.mean, G.mean
Examples
# Hamilton depression scale (Hollander and Wolfe 1999)
x<-c( -0.952, 0.147, -1.022, -0.430, -0.620, -0.590, -0.490,
HL.mean(x, conf = .96)
0.080, -0.010)
huber.mu
huber.mu
99
Huber M-estimator of location
Description
The Huber M-estimator is a robust high efficiency estimator of location that has probably been
under-utilized by biologists. It is based on maximizing the likelihood of a weighting function. This
is accomplished using an iterative least squares process. The Newton Raphson algorithm is used
here. The function usually converges fairly quickly (< 10 iterations). The function uses the Median
Absolute Deviation function, mad. Note that if MAD = 0, then NA is returned.
Usage
huber.mu(x, c = 1.28, iter = 20, conv = 1e-07)
Arguments
x
A vector of quantitative data.
c
Stop criterion. The value c = 1.28 gives 95 percent efficiency of the mean
given normality.
iter
Maximum number of iterations.
conv
Convergence criterion.
Value
Returns Huber’s M-estimator of location.
Author(s)
Ken Aho
References
Huber, P. J. (2004) Robust Statistics. Wiley.
Wilcox, R. R. (2005) Introduction to Robust Estimation and Hypothesis Testing, Second Edition.
Elsevier, Burlington, MA.
See Also
huber.one.step, huber.NR, mad
Examples
x<-rnorm(100)
huber.mu(x)
100
huber.NR
huber.NR
Huber M-estimator iterative least squares algorithm
Description
Algorithm for calculating fully iterated or one step Huber M-estimators of location.
Usage
huber.NR(x, c = 1.28, iter = 20)
Arguments
x
A vector of quantitative data
c
Bend criterion. The value c = 1.28 gives 95 percent efficiency of the mean
given normality.
iter
Maximum number of iterations
Details
The Huber M-estimator is a robust high efficiency estimator of location that has probably been
under-utilized by biologists. It is based on maximizing the likelihood of a weighting function. This
is accomplished using an iterative least squares process. The Newton Raphson algorithm is used
here. The function usually converges fairly quickly < 10 iterations. The function uses the Median
Absolute Deviation function, mad. Note that if MAD = 0, then NA is returned.
Value
Returns iterative least squares iterations which converge to Huber’s M-estimator. The first element
in the vector is the sample median. The second element is the Huber one-step estimate.
Author(s)
Ken Aho
References
Huber, P. J. (2004) Robust Statistics. Wiley.
Wilcox, R. R. (2005) Introduction to Robust Estimation and Hypothesis Testing, Second Edition.
Elsevier, Burlington, MA.
See Also
huber.one.step, huber.mu, mad
huber.one.step
101
Examples
x<-rnorm(100)
huber.NR(x)
huber.one.step
Huber one step M-estimator
Description
Returns the first Raphson-Newton iteration of the function Huber.NR.
Usage
huber.one.step(x, c = 1.28)
Arguments
x
c
Vector of quantitative data
Bend criterion. The value c = 1.28 gives 95 percent efficiency of the mean
given normality.
Details
The Huber M-estimator function usually converges fairly quickly, hence the justification of the
Huber one step estimator. The function uses the Median Absolute Deviation function, mad. If MAD
= 0, then NA is returned.
Value
Returns the Huber one step estimator.
Author(s)
Ken Aho
References
Huber, P. J. (2004) Robust Statistics. Wiley.
Wilcox, R. R. (2005) Introduction to Robust Estimation and Hypothesis Testing, Second Edition.
Elsevier, Burlington, MA.
See Also
huber.mu, huber.NR, mad
Examples
x<-rnorm(100)
huber.one.step(x)
102
ipomopsis
illusions
Visual illusions illustrating human preception errors.
Description
In development, currently displays three illusions. Illusion 3 is from Yihui Xie’s package animation.
Usage
illusions(ill.no = 1)
Arguments
ill.no
Numeric describing which illusion number to view.
Author(s)
Ken Aho
Examples
illusions(2)
illusions(3)
ipomopsis
Ipomopsis fruit yield data
Description
The following question is based on data from Crawley (2007). We are interested in the effect of
grazing on seed production in the plant scarlet gilia Ipomopsis aggregata . Forty plants were allocated to two treatments, grazed and ungrazed. Grazed plants were exposed to rabbits during the first
two weeks of stem elongation. They were then protected from subsequent grazing by the erection
of a fence and allowed to continue growth. Because initial plant size may influence subsequent fruit
production, the diameter of the top of the rootstock was measured before the experiment began. At
the end of the experiment, fruit production (dry weight in milligrams) was recorded for each of the
forty plants.
Usage
data(ipomopsis)
joint.ci.bonf
103
Format
A data frame with 40 observations on the following 3 variables.
root Rootstock diameter in mm
fruit Fruit dry weight in mg
grazing a factor with levels Grazed Ungrazed
Source
Website associated with – Crawley, M. J. 2007. The R book. Wiley.
joint.ci.bonf
Calculates joint confidence intervals for parameters in linear models
using a Bonferroni procedure.
Description
Creates widened confidence intervals to allow joint consideration of parameter confidence intervals.
Usage
joint.ci.bonf(model, conf = 0.95)
Arguments
model
A linear model created by lm
conf
level of confidence 1 - P(type I error)
Details
As with all Bonferroni-based methods for joint confidence the resulting intervals are exceedingly
conservative and thus are prone to type II error.
Value
Returns a dataframe with the upper and lower confidence bounds for each parameter in a linear
model.
Author(s)
Ken Aho
References
Kutner, M. H., Nachtsheim, C. J., Neter, J., and W. Li. (2005) Applied linear statistical models, 5th
edition. McGraw-Hill, Boston.
104
K
See Also
confint, p.adjust
Examples
Soil.C<-c(13,20,10,11,2,25,30,25,23)
Soil.N<-c(1.2,2,1.5,1,0.3,2,3,2.7,2.5)
Slope<-c(15,14,16,12,10,18,25,24,20)
Aspect<-c(45,120,100,56,5,20,5,15,15)
Y<-as.vector(c(20,30,10,15,5,45,60,55,45))
model<-lm(Y~Soil.C+Soil.N+Slope+Aspect)
joint.ci.bonf(model)
K
Soil potassium analyses from 8 laboratories
Description
Jacobsen et al. (2002) sent nine "identical" soil samples to eight soil testing laboratories in the
Great Plains region of the Central United States over a three year period of time. Among other
characteristics the labs were paid to measure soil potassium. A question of interest was whether the
labs would produce identical analytical results.
Usage
data(K)
Format
A data frame with 72 observations on the following 2 variables.
K Soil K in mg/kg
lab Laboratories, a factor with levels B D E F G H I J
Source
Jacobsen, J. S., Lorber, S. H., Schaff, B. E., and C. A. Jones (2002) Variation in soil fertility test
results from selected Northern Great Plains laboratories. Commun. Soil Sci. plant Anal., 33(3&4):
303-319.
Kappa
105
Kappa
Calculates kappa statistic and other classification error statistics
Description
The kappa statistic, along with user and producer error rates are conventionally used in the remote
sensing to describe the effectiveness of ground cover classifications. Since it simultaneously considers both errors of commission and omission, kappa can be considered a more conservative measure
of classification accuracy than the percentage of correctly classified items.
Usage
Kappa(class1, reference)
Arguments
class1
A vector describing a classification of experimental units.
reference
A vector describing the "correct" classification of the experimental units in class1
Value
Returns a list with 4 items
ttl_agreement
The percentage of correctly classified items.
user_accuracy The user accuracy for each category of the classification.
producer_accuracy
The producer accuracy for each category of the classification.
kappa
The kappa statistic.
table
A two way contingency table comparing the user supplied classification to the
reference classification.
Author(s)
Ken Aho
References
Jensen, J. R. (1996) Introductory digital imagery processing 2nd edition. Prentice-Hall.
Examples
reference<-c("hi","low","low","hi","low","med","med")
class1<-c("hi","hi","low","hi","med","med","med")
Kappa(class1,reference)
106
km
km
Kaplan-Meier survivorship.
Description
Calculates survivorship for individuals in a population over time based on the method of KaplanMeier; cf. Pollock et al. (1989).
Usage
km(r, d, var = "O", conf = 0.95,age.seq=seq(1,length(r)),
ylab="Pr(survivorship from 1st age class)",xlab="Age class", ...)
Arguments
r
Numbers of individuals at risk in each age or time class.
d
Vector of the number of deaths in each age or time class.
var
Type of procedure used to calculate variance in confidence intervals "O" = Oakes,
"G" = Greenwood.
conf
Level of confidence for confidence interval calculations; 1 - P(type I error)
age.seq
A sequence of numbers indicating the age classes used.
ylab
Y-axis label.
xlab
X-axis label.
...
Additional arguments from plot.
Details
Details for this index are given in Pollock et al. (1989).
Value
Returns a list with the following components
s.hat
A vector of estimated survivorship probabilities from the 1st age class onward.
Greenwood.Var
The estimated Greenwood variance for each age class.
Oakes.Var
The estimated Oakes variance for each age class.
CI
Upper and lower confidence bound to the true survivorship.
Author(s)
Ken Aho
References
Pollock, K. H., Winterstein, S. R., and Curtis, P. D. (1989) Survival analysis in telemetry studies:
the staggered entry design. Journal of wildlife Management. 53(1):7-1.
Kullback
107
Examples
##Example from Pollock (1989)
r<-c(18,18,18,16,16,16,15,15,13,10,8,8,7)
d<-c(0,0,2,0,0,1,0,1,1,1,0,0,0)
km(r,d)
Kullback
Kullback test for equal covariance matrices.
Description
Provides Kullback’s (1959) test for multivariate homoscedasticity.
Usage
Kullback(Y, X)
Arguments
Y
An n x p matrix of quantitative variables
X
An n x 1 vector of categorical assignments (e.g. factor levels)
Details
Multivariate general linear models assume equal covariance matrices for all factor levels or factor
level combinations. Legendre and Legendre (1998) recommend this test for verifying homoscedsticiy. P-values concern a null hypothesis of equal population covariance matrices. P-values from the
test are conservative with respect to type I error.
Value
Returns a dataframe with the test statistic (which follows a chi-square distribution if H0 is true),
the chi-square degrees of freedom, and the calculated p-value. Invisible objects include the within
group dispersion matrix.
Author(s)
Pierre Legendre is the author of the most recent version of this function asbio ver >= 1.0. Stephen
Ousley discovered an error in the original code. Ken Aho was the author of the original function
References
Kullback, S. (1959) Information theory and statistics. John Wiley and Sons.
Legendre, P, and Legendre, L. (1998) Numerical ecology, 2nd English edition. Elsevier, Amsterdam, The Netherlands.
108
life.exp
Examples
Y1<-rnorm(100,10,2)
Y2<-rnorm(100,15,2)
Y3<-rnorm(100,20,2)
Y<-cbind(Y1,Y2,Y3)
X<-factor(c(rep(1,50),rep(2,50)))
Kullback(Y,X)
larrea
Creosote bush counts
Description
Phillips and MacMahon (1981) conducted an extensive study of Larrea tridentata (creosote bush)
distributions in the Mojave and Sonoran deserts from several life stage classes based areal coverage:
Life stage 1 (102 -103 cm2 ) Life stage 2 (103 -104 cm2 ), and Life stage 3 (104 -105 cm2 ). Data
were generated to approximate the results of the authors.
Usage
data(larrea)
Format
A data frame with 25 observations on the following 3 variables.
class1 Counts from life stage 1
class2 Counts from life stage 2
class3 Counts from life stage 3
References
Phillips, D. L., and J. A. MacMahon (1981) Competition and spacing patterns in desert shrubs.
Journal of Ecology 69(1): 97-115.
life.exp
Mouse life expectancy data.
Description
Weindruch et al. (1986) compared life expectancy of field mice given different diets. To accomplish
this, the authors randomly assigned 244 mice to one of four diet treatments.
Usage
data(life.exp)
lm.select
109
Format
A data frame with 244 observations on the following 2 variables.
lifespan Lifespan in months
treatment a factor with levels N/N85: Mice were fed normally both before and after weaning (the
slash distinguishes pre and post weaning). After weaning the diet consisted of 85kcal/week, a
conventional total for mice rearing, N/R40: Mice were fed normally before weaning, but were
given a severely restricted diet of 40 kcal per week after feeding, N/R50: Mice were restricted
to 50kcal per week before and after weaning, R/R50: Mice were fed normally before weaning,
but their diet was restricted to 50 kcal per week after weaning.
Source
Ramsey, F. L., and D. W. Schafer (1997) The Statistical Sleuth: A Course in Methods of Data
Analysis. Duxbury Press, Belmont, CA.
References
Weindruch, R., Walford, R. L., Fligiel, S., and D. Guthrie (1986) The retardation of aging in mice by
dietary restriction: longevity, cancer, immunity and lifetime energy intake. The Journal of nutrition
116 (4): 641-54.
Examples
data(life.exp)
## maybe str(life.exp) ; plot(life.exp) ...
lm.select
AIC, AICc, BIC, Mallow’s Cp, and PRESS evaluation of linear models
Description
The function provide model selection summaries using AIC, AICc, BIC, Mallow’s Cp , and PRESS
for a list of objects of class lm
Usage
lm.select(lms, deltaAIC = FALSE)
Arguments
lms
A list containing linear models.
deltaAIC
Logical; Should a ∆ AIC summary be given with relative likelihoods and Akaike
weights?
110
loess.surf
Note
Mallow’s Cp assumes that all models are nested within the first model in the argument lms. Nonnesting will produce a warning message.
Author(s)
Ken Aho
See Also
AIC, press
Examples
Y <- rnorm(100)
X1 <- rnorm(100)
X2 <- rnorm(100)
lms <- list(lm(Y ~ X1), lm(Y ~ X1 + X2))
lm.select(lms)
loess.surf
Loess 2D and 3D smooth plots
Description
The function serves as wrapper for loess and lets one make 2D or 3D smoother plots using loess
specifications.
Usage
loess.surf(Y, X, span = 0.75, degree = 1, family = "gaussian", phi = 20,
theta = 50, xlab = "X", ylab = "Y", zlab = "Fit", line.col = 1,
line.type = 1, scale = TRUE, duplicate = "error", expand = 0.5, ...)
Arguments
Y
A numeric response vector.
X
A numeric explanatory vector or a two column matrix for 3D smooths.
span
Span parameter, i.e. the size of the local neighborhood.
degree
Indicates whether linear degree = 1 or quadratic models degree = 2 are to be
applied to each local neighborhood.
family
Type of error distribution to be optimized in fitting. The default, "gaussian" is
fitting with least squares. Fitting with Tukey’s biweight M-Estimator is used if
family = "symmetric".
loess.surf
111
phi
Parameter from persp,phi provides the colatitude viewing angle.
theta
Parameter from persp theta gives the azimuthmal direction.
xlab
X-axis label.
ylab
Y-axis label.
zlab
Z-axis label
line.col
Color of loess fit line.
line.type
Line type for loess fit.
scale
Logical from persp If scale is TRUE the x, y and z coordinates are transformed
separately. If scale is FALSE the coordinates are scaled so that aspect ratios are
retained.
duplicate
Argument from interp from library akima. Consists of a character string indicating how to handle duplicate data points. The default, duplicate = "error"
produces an error message.
expand
Argument from persp, a expansion factor applied to the z coordinates.
...
Additional arguments from plot
Value
Output is a 2D or 3D smooth plot.
Author(s)
Ken Aho
References
Wilcox, R. R. (2005) Introduction to Robust Estimation and Hypothesis Testing, Second Edition.
Elsevier, Burlington, MA.
See Also
loess
Examples
X1<-sort(rnorm(100))
X2<-rexp(100)
Y<-rgamma(100,1,2)
loess.surf(Y,cbind(X1,X2))
112
MC
magnets
Magnet pain relief data
Description
Magnets have long been used as an alternative medicine, particularly in the Far East, for speeding
the recovery of broken bones and to aid in pain relief. Valbona et al. (1997) tested whether chronic
pain experienced by post-polio patients could be treated with magnetic fields applied directly to pain
trigger points. The investigators identified fifty subjects who not only had post-polio syndrome, but
who also experienced muscular or arthritic pain. Magnets were applied to pain trigger points in 29
randomly selected subjects, and in the other 21 a placebo was applied. The patients were asked
to subjectively rate pain on a scale from one to ten before and after application of the magnet or
placebo.
Usage
data(magnets)
Format
The dataframe contains 4 columns
Score_1 Reported pain level before application of treatment.
Score_2 Reported pain level after application of treatment.
Active Categorical variable indicating whether the device applied was active (magent) or inactive
(placebo).
Source
Vallbona, C. et al (1997) Response of pain to static magnetic fields in postpolio patients, a double
blind pilot study. Archives of Physical Medicine and Rehabilitation. 78: 1200-1203.
MC
Simple functions for MCMC demonstrations
Description
Function MC creates random MArkov Chain from a transitions matrix. Function Rf presents proportional summaries of discrete states from MC. Function mat.pow finds the exponential expnasion of a
martix. Required for finding the expectations of a transition matrix.
Usage
MC(T, start, length)
Rf(res)
mat.pow(mat, pow)
MC.test
113
Arguments
T
A symmetric transition matrix.
start
Starting state
length
Length of the chain to be created
res
Results from MC.
mat
A symmetric matrix.
pow
Power the matrix is to be raised to.
Author(s)
Ken Aho
Examples
A <- matrix(nrow = 4, ncol = 4, c(0.5, 0.5, 0, 0, 0.25, 0.5, 0.25,0, 0, 0.25, 0.5, 0.25,
0, 0, 0.5, 0.5), byrow = TRUE)
pi.0 <- c(1, 0, 0, 0)
Tp10 <- mat.pow(A, 10)
chain <- MC(A, 1, 100)
Rf(chain)
MC.test
Monte Carlo hypothesis testing for two samples.
Description
MC.test calculates a permutation of test statistics from an pooled variance t-test. It compares this
distribution to an initial test statistic calculated using non-permuted data to derive a P-value.
Usage
MC.test(Y,X, perm = 1000, alternative = "not.equal", var.equal = TRUE, paired = FALSE)
Arguments
Y
Response data.
X
Categorical explanatory variable.
perm
Number of iterations.
var.equal
Logical: Should equal variances be assumed?
paired
Logical: Are sample paired?
alternative
Alternative hypothesis. One of three options: "less","greater", or "not.equal".
These provide lower-tail, upper-tail, and two-tailed tests.
114
MC.test
Details
The method follows the description of Manly (1998) for a two-sample test. Upper and lower tailed
tests are performed by finding the portion of the distribution greater than or equal to the observed
t test statistic (upper-tailed) or less than or equal to the observed test statistic (lower-tailed). A two
tailed test is performed by multiplying the portion of the null distribution above the absolute value
of the observed test statistic by two. Results from the test will be similar to oneway_test from the
library coin since it is based on an equivalent test statistic. The function oneway_test allows
additional options including blocking.
Value
Returns a list with the following items:
observed.test.statistic
t-statistic calculated from non-permuted (original)data.
no_of_permutations_exceeding_observed_value
The number of times a Monte Carlo derived test statistic was more extreme than
the initial observed test statistic.
p.value
Empirical P-value
alternative
The alternative hypothesis
Author(s)
Ken Aho
References
Manly, B. F. J. (1997) Randomization and Monte Carlo methods in biology, 2nd edition. Chapman
and Hall, London.
See Also
t.test
Examples
Y<-c(runif(100,1,3),runif(100,1.2,3.2))
X<-factor(c(rep(1,100),rep(2,100)))
MC.test(Y,X,alternative="less")
mcmc.norm.hier
mcmc.norm.hier
115
Gibbs sampling of normal hierarchical models
Description
These functions are designed for Gibbs sampling comparison of groups with normal hierarchical
models (see Gelman 2003), and for providing appropriate summaries.
Usage
mcmc.norm.hier(data, length = 1000, n.chains = 5)
norm.hier.summary(M, burn.in = 0.5, cred = 0.95, conv.log = TRUE)
Arguments
data
length
n.chains
M
burn.in
cred
conv.log
A numerical matrix with groups in columns and observations in rows.
An integer specifying the length of MCMC chains.
The number of chains to be computed for each parameter
An output array from mcmc.norm.hier.
The burn in period for the chains. The default value, 0.5, indicates that only the
latter half of chains should be used for calculating summaries.
Credibility interval width.
A logical argument indicating whether convergence for σ and τ should be considered on a log scale.
Details
An important Bayesian application is the comparison of groups within a normal hierarchical model.
We assume that the data from each group are independent and from normal populations with means
θ[j], j = (1, ..., J), and a common variance, σ 2 . We also assume that group means, are normally
distributed with an unknown mean, µ, and an unknown variance , τ 2 . A uniform prior distribution
is assumed for µ, logσ and τ ; σ is logged to facilitate conjugacy. The function mcmc.norm.hier
provides posterior distributions of θ[j]’s, µ, σ and τ . The distributions are dervided from univariate
conditional distributions from the multivariate likelihood function. These conditional distributions
provide a situation conducive to MCMC Gibbs sampling. Gelman et al. (2003) provide excellent
summaries of these sorts of models.
The function mcmc.summary provides statsitical summaries for the output array from mcmc.norm.hier
including credible intervals (empirically derived directly from chains) and the Gelman/Rubin conˆ
vergence criterion, R.
Value
The function mcmc.norm.hier reurns a three dimensional (step x variable x chain) array. The function mcmc.summary returns a summary table containing credible intervals and the Gelman/Rubin
ˆ
convergence criterion, R.
116
ML.k
Author(s)
Ken Aho
References
Gelman, A., Carlin, J. B., Stern, H. S., and D. B. Rubin (2003) Bayesian data analysis, 2nd edition.
Chapman and Hall/CRC.
See Also
R.hat
Examples
## Not run:
data(cuckoo)
mcmc.norm.hier(cuckoo,10,2)
## End(Not run)
ML.k
Maximum likelihood algorithm for determining the binomial dispersal
coefficient
Description
The function uses the maximum likelihood method described by Bliss and R. A. Fisher (1953)
to determine maximum likelihood estimates for the binomial parameters m (the mean) and k (a
parameter describing aggregation/dispersion).
Usage
ML.k(f, x, res = 1e-06)
Arguments
f
A vector of frequencies for objects in x (must be integers).
x
A vector of counts, must be sequential integers.
res
Resolution for the ML estimator.
Value
Returns a list with two items
k
The negative binomial dispersion parameter, k
m
The negative binomial distribution mean, m
Mode
117
Note
The program is slow at the current resolution. Later iterations will use linear interpolation, or
Fortran loops, or both.
Author(s)
Ken Aho
References
Bliss, C. I., and R. A. Fisher (1953) Fitting the negative binomial distribution to biological data.
Biometrics 9: 176-200.
See Also
dnbinom
Examples
mites <- seq(0, 8)
freq <- c(70, 38, 17, 10, 9, 3, 2, 1, 0)
ML.k(freq, mites)
Mode
Sample mode
Description
Calculates the sample mode; i.e. the most frequent outcome in a dataset. Non-existence of the mode
will return a message. Several errors in earlier versions were corrected in asbio 0.4
Usage
Mode(x)
Arguments
x
A vector of quantitative data.
Value
Returns the sample mode or an error message if the mode does not exist.
Author(s)
Ken Aho
118
modlevene.test
References
Bain, L. J., and M. Engelhardt (1992) Introduction to probability and mathematical statistics.
Duxbury press. Belmont, CA, USA.
See Also
H.mean, HL.mean, mean, median, huber.mu
Examples
x<-round(rnorm(100000,mean=10,sd=2),0)
Mode(x)
modlevene.test
Modified Levene’s test
Description
Conducts the modified Levene’s test for homoscedastic populations.
Usage
modlevene.test(x, groups)
Arguments
x
Vector of residuals from a linear model.
groups
Vector of factor levels.
Details
The modified Levene’s test is a test for homoscedsticity that (unlike the classic F-test) is robust
to violations of normality (Conover et al. 1981). In a Modified Levene’s test we calculate dij =
|eij − e˜i | where e˜i is the ith factor level residual median. We then run an ANOVA on the dij ’s. If
the p-value is < α, we reject the null and conclude that the population error variances are not equal.
Value
An ANOVA table is returned with the modified Levene’s test results.
Author(s)
Ken Aho
montane.island
119
References
Kutner, M. H., Nachtsheim, C. J., Neter, J., and W. Li. (2005) Applied linear statistical models, 5th
edition. McGraw-Hill, Boston.
See Also
fligner.test
Examples
eggs<-c(11,17,16,14,15,12,10,15,19,11,23,20,18,17,27,33,22,26,28)
trt<-as.factor(c(1,1,1,1,1,2,2,2,2,2,3,3,3,3,4,4,4,4,4))
lm1<-lm(eggs~trt)
modlevene.test(residuals(lm1),trt)
montane.island
Mountain island biogeographic data
Description
Lomolino et al. (1989) investigated the relationship between the area of montane forest patches
(islands) and the richness of mammal fauna in the Southwestern United States. This dataset contains
richness and area information for 27 montane islands.
Usage
data(montane.island)
Format
A data frame with 27 observations on the following 3 variables.
Island.name a factor with levels Abajos Animas Blacks Capitans Catalinas Chirucahuas
Chuskas Guadalupes Huachucas Hualapais Lasals Magdalenas Manzanos Mogollon Mt. Taylor
N. Rincon N. Uncompaghre Navajo Organs Pinalenos Prescotts S. Kabib Sacramentos
San Mateos Sandias Santa Ritas Zunis.
Richness A numeric vector; the number of species.
Area A numeric vector; area in km2 .
Source
Lomolino, M. V., Brown, J. H., and R. Davis (1989) Island biogeography of montane forest mammals in the American Southwest. Ecology 70: 180-194.
120
moose.sel
moose.sel
Datasets for resource use and availability
Description
A collection of datasets which can be used to calculate and compare selection ratios. Datasets
are: goat.sel, quail.sel, elk.sel, bighorn.sel, bighornAZ.sel, juniper.sel and are
described (briefly) in Manly et al. (2002) and Aho and Bowyer (in review).
Usage
data(moose.sel)
data(goat.sel)
data(quail.sel)
data(elk.sel)
data(bighorn.sel)
data(bighornAZ.sel)
data(juniper.sel)
Format
Dataframes with observations on the following variables.
resources A factor listing resource types.
avail Proportional availability (for datasets without n2 and y2).
y1 A numeric vector: number of times the resouce was used.
y2 A numeric vector: number of time the resource was observed.
n1 A numeric vector: number of times that all resources were used.
n2 A numeric vector: number of times that all resources were observed.
Source
Manly BF, McDonald LL, Thomas DL, McDonald TL, Erickson WP (2002) Resource Selection by
Animals: Statistical Design and Analysis for Field Studies. 2nd edn. Kluwer, New York
References
Aho, K and Bowyer, T (in review) Confidence intervals for ratios of multinomial proportions: Implications for selection ratios. Methods in eclogy and Evolution.
mosquito
121
mosquito
Mosquito wing length data
Description
Sokal and Rohlf (2012) describe an experiment to gauge the variability in wing length in female
mosquitos (Aedes intrudens). Four females were randomly selected from three cages and two measurements were made on the left wing of each female. Both cage and female (in cage) can be seen
as random effects.
Usage
data(mosquito)
Format
A data frame with 24 observations on the following 4 variables.
length Wing length in micrometers
cage Cage number.
female Female (in cage) number
measures Measurement (in female in cage) number, i.e. pseudoreplicates in female.
Source
Sokal, R. R., and F. J. Rohlf (2012) Biometry, 4th edition. W. H. Freeman and Co., New York.
MS.test
Mack-Skillings test
Description
Runs a Mack-Skillings test for situations applicable to rank-based permutation procedures with
blocking and more than one replicate for treatments in a block.
Usage
MS.test(Y, X, reps)
Arguments
Y
X
reps
A matrix of response data. The MS.test function requires that response data are
organized in columns (see example below).
A vector of treatments. The length of the vector should be equal to the number
of rows in the response matrix.
The number of replicates in each treatment (unbalanced designs cannot be analyzed).
122
myeloma
Details
When we have more than one replication within a block, and the number of replications is equal
for all treatments, we can use the Mack-Skillings test (Mack and Skillings 1980) as a rank based
permutation procedure to test for main effect differences. If ties occur the value of the significance
level is only approximate. Hollander and Wolfe (1996) provide a method for finding exact p-values
by deriving a test statistic distribution allowing ties.
Value
Returns a dataframe summarizing the degrees of freedom, test statistic and p-value.
Author(s)
Ken Aho
References
Campbell, J. A., and O. Pelletier (1962) Determination of niacin (niacinamide) in cereal products.
J. Assoc. Offic. Anal. Chem. 45: 449-453.
Hollander, M., and D. A. Wolfe (1999) Nonparametric statistical methods. New York: John Wiley
& Sons.
Mack, G. A., and J. H. Skillings (1980) A Friedman-type rank test for main effects in a two-factor
ANOVA. Journal of the American Statistical Association. 75: 947-951.
See Also
friedman.test
Examples
#data from Campbell and Pelletier (1962)
Niacin0<-c(7.58,7.87,7.71,8.00,8.27,8,7.6,7.3,7.82,8.03,7.35,7.66)
Niacin4<-c(11.63,11.87,11.40,12.20,11.70,11.80,11.04,11.50,11.49,11.50,10.10,11.70)
Niacin8<-c(15.00,15.92,15.58,16.60,16.40,15.90,15.87,15.91,16.28,15.10,14.80,15.70)
Niacin<-cbind(Niacin0,Niacin4,Niacin8)
lab<-c(rep(1,3),rep(2,3),rep(3,3),rep(4,3))
MS.test(Niacin, lab, reps=3)
myeloma
Patient responses to myeloma drug treatments
Description
Murakami et al. (1997) studied the effect of drugs treatments on levels of serum beta-2 microglobulin in patients with multiple myeloma. Serum beta-2 microglobulin is produced in the body as a
result of myelomas, and thus can be used as an indicator of the severity of disease
near.bound
123
Usage
data(myeloma)
Format
A data frame with 20 observations on the following 2 variables.
mglobulin Levels of serum beta-2 microglobulin in mg/l
drug Drug treatment strategy. Control = sumerifon alone, Trt = malphalan and sumerifon.
Source
Ott, R. L., and M. T. Longnecker (2004) A First Course in Statistical Methods. Thompson.
References
Murakami, H., Ogawara, H., Morita, K., Saitoh, T., Matsushima, T., Tamura, J., Sawamura, M.,
Karasawa, M., Miyawaki, M.„ Schimano, S., Satoh, S., and J Tsuchiy (1997) Serum beta-2microglobulin in patients with multiple myeloma treated with alpha interferon. Journal of Medicine
28(5-6):311-8.
near.bound
Nearest neighbor boundary coordinates
Description
Finds nearest neighbor boundary Cartesian coordinates for use as arguments in function prp.
Usage
near.bound(X, Y, bX, bY)
Arguments
X
A vector of Cartesian X-coordinates (e.g. UTMs) describing an animal’s locations (e.g. telemetry data).
Y
A vector of Cartesian Y coordinates (e.g. UTMs) describing an animal’s locations (e.g. telemetry data).
bX
A vector of boundary X-coordinates.
bY
A vector of boundary Y-coordinates.
Value
Returns Cartesian X,Y coordinates of nearest neighbor locations on a boundary.
124
one.sample.t
Author(s)
Ken Aho
See Also
prp, bound.angle
Examples
bX<-seq(0,49)/46
bY<-c(4.89000,4.88200,4.87400,4.87300,4.88000,4.87900,4.87900,4.90100,4.90800,
4.91000,4.93300,4.94000,4.91100,4.90000,4.91700,4.93000,4.93500,4.93700,
4.93300,4.94500,4.95900,4.95400,4.95100,4.95800,4.95810,4.95811,4.95810,
4.96100,4.96200,4.96300,4.96500,4.96500,4.96600,4.96700,4.96540,4.96400,
4.97600,4.97900,4.98000,4.98000,4.98100,4.97900,4.98000,4.97800,4.97600,
4.97700,4.97400,4.97300,4.97100,4.97000)
X<-c(0.004166667,0.108333333,0.316666667,0.525000000,0.483333333,0.608333333,
0.662500000,0.683333333,0.900000000,1.070833333)
Y<-c(4.67,4.25,4.26,4.50,4.90,4.10,4.70,4.40,4.20,4.30)
near.bound(X,Y,bX,bY)
one.sample.t
One sample t-test
Description
Provides a one-sample hypothesis test. The test assumes that the underlying population is normal.
Usage
one.sample.t(data = NULL, null.mu = 0, xbar = NULL, sd, n = NULL,
alternative = "two.sided", conf = 0.95)
Arguments
data
A vector of quantitative data. Not required if xbar and n are supplied by the
user.
null.mu
The expectation for the null distribution.
xbar
Sample mean. Not required if is.null(data)==FALSE
sd
The sample standard deviation. Not required if is.null(data)==FALSE
n
The sample size. Not required if is.null(data)==FALSE
alternative
Type of test. One of three must be specified "two.sided", "less", or "greater"
conf
Confidence level.
one.sample.z
125
Details
The function can use either raw data is.null(data)==FALSE or summarized data if is.null(data)==TRUE.
With the later xbars, and n must be specified by the user.
Value
Returns a test statistic and a p-value.
Author(s)
Ken Aho
See Also
pt
Examples
one.sample.t(null.mu = 131, xbar = 126, sd = 12, n = 85,
alternative = "two.sided")
one.sample.z
One sample z-test
Description
Provides a one-sample hypothesis test. The test assumes that the underlying population is normal
and furthermore that σ is known.
Usage
one.sample.z(data = NULL, null.mu = 0, xbar = NULL, sigma, n = NULL,
alternative = "two.sided", conf = 0.95)
Arguments
data
A vector of quantitative data. Not required if xbar and n are supplied by the
user.
null.mu
The expectation for the null distribution.
xbar
Sample mean. Not required if is.null(data)==FALSE
sigma
The null distribution standard deviation
n
The sample size. Not required if is.null(data)==FALSE
alternative
Type of test. One of three must be specified "two.sided", "less", or "greater"
conf
Confidence level.
126
paik
Details
The function can use either raw data is.null(data)==FALSE or summarized data if is.null(data)==TRUE.
With the later xbar and n must be specified by the user.
Value
Returns a test statistic and a p-value.
Author(s)
Ken Aho
See Also
pnorm
Examples
one.sample.z(null.mu=131,xbar=126,sigma=12,n=85,alternative="two.sided")
paik
Paik diagrams
Description
Paik diagrmas for the representation of Simpsons Paradox in three way tables.
Usage
paik(formula, counts, resp.lvl = 2, data, circle.mult = 0.4, xlab = NULL,
ylab = NULL, leg.title = NULL, leg.loc = NULL, show.mname = FALSE,...)
Arguments
formula
A two sided formula, e.g. Y ~ X1 + X2, with cross-classified categorical
variables. The second explanatory variable, i.e. X2, is used as the trace variable
whose levels are distinguished in the graph with different colors. Interactions
and nested terms are not allowed.
counts
A vector of counts for the associated categorical variables in formula.
resp.lvl
The level in Y of primary interest. See example below.
data
Dataframe containing variables in formula.
circle.mult
Multiplier for circle radii in the diagram.
xlab
X-axis label. By default this is defined as the categiries in the first explanatory
variable, X1.
pairw.anova
ylab
leg.title
leg.loc
show.mname
...
127
Y-axis label. By default these will be proportions with repsect to the specified
level of interest in the response.
Legend title. By default the conditioning variable name.
Legend location. A legend location keyword; "bottomright", "bottom",
"bottomleft", "left", "topleft", "top", "topright", "right" or "center".
Logical, indcating whether or not the words "Marginal prop" should printed in
the graph above the dotted line indicating marginal proportions.
Additional arguments from plot.
Author(s)
Ken Aho
References
Agresti, A. (2012) Categorical data analysis, 3rd edition. New York. Wiley.
Paik M. (1985) A graphical representation of a three-way contingency table: Simpson’s paradox
and correlation. American Statistician 39:53-54.
Examples
require(tcltk)
data(death.penalty)# from Agresti 2012
op <- par(mfrow=c(1,2), mar=c(4,4,0,0))
paik(verdict ~ d.race + v.race, counts = count, data = death.penalty,
leg.title = "Victims race", xlab = "Defendants race",
ylab = "Proportion receiving death penalty")
par(mar=c(4,2,0,2))
paik(verdict ~ v.race + d.race, counts = count, data = death.penalty,
xlab = "Victims race", leg.title = "Defendants race",leg.loc="topleft",
ylab = "", yaxt = "n")
message("Type: vignette(\"simpson\") for more information about this figure")
par(op)
pairw.anova
Conducts pairwise post hoc and planned comparisons associated with
an ANOVA
Description
The function pairw.anova replaces the defunct Pairw.test. Conducts all possible pairwise tests
with adjustments to P-values using one of five methods: Least Significant difference (LSD), Bonferroni, Tukey-Kramer honest significantly difference (HSD), Scheffe’s method, or Dunnett’s method.
Dunnett’s method requires specification of a control group, and does not return adjusted P-values.
The functions scheffe.cont and bonf.cont allow Bonferroni and Scheffe’s family-wise adjustment of individual planned pairwise contrasts.
128
pairw.anova
Usage
pairw.anova(y, x, conf.level = 0.95, method = "tukey",
MSE = NULL, df.err = NULL, control = NULL)
lsdCI(y, x, conf.level = 0.95, MSE = NULL, df.err = NULL)
bonfCI(y, x, conf.level = 0.95, MSE = NULL, df.err = NULL)
tukeyCI(y, x, conf.level = 0.95, MSE = NULL, df.err = NULL)
scheffeCI(y, x, conf.level = 0.95, MSE = NULL, df.err = NULL)
dunnettCI(y, x, conf.level = 0.95, control = NULL)
scheffe.cont(y, x, lvl = c("x1", "x2"), conf.level = 0.95,
MSE = NULL, df.err = NULL)
bonf.cont(y, x, lvl = c("x1", "x2"), conf.level = 0.95,
MSE = NULL, df.err = NULL, comps = 1)
Arguments
y
A quantitative vector containing the response variable
x
A categorical vector containing the groups (e.g. factor levels or treatments)
conf.level
1 - P(type I error)
method
One of five possible choices: "lsd", "bonf", "tukey", "scheffe", "dunnett"
MSE
Value of MSE from the ANOVA model. Default = NULL
df.err
Degrees of freedom error from the omnibus ANOVA. Default = NULL
control
Control group for Dunnett’s test.
lvl
A two element vector defining two factor levels to be compared using Scheffe’s
and the Bonferroni method.
comps
The number of comparisons to be made in the Bonferroni method.
Details
Adjustment of comparison type I error for simultaneous inference is a contentious subject and will
not be discussed here. For description of methods go to Kutner et al. (2005). For models where the
number of factors is >= 2, MSE and the residual degrees of freedom (used in the computation of
confidence intervals for all pairwise methods used here) will vary depending on the experimental
design and the number of factors. Thus, for multifactor designs the user should specify the residual
degrees of freedom and MSE from the overall ANOVA. This will be unnecessary for one-way
ANOVAs.
pairw.anova
129
Value
The function pairw.anova and the confidence interval functions it calls return a list of class = "pairw".
For all but the LSD test (which also returns LSD) and Dunnett’s test (which does not return adjusted
P-values), the utility function print.pairw returns a descriptive head and a six column summary
dataframe containing:
1) the type of contrast (names are taken from levels in x),
2) the mean difference,
3) the lower confidence bound of the true mean difference,
4) the upper confidence bound of the true mean difference,
5) the hypothesis decision, given the prescribed significance level, and
6) the adjusted P-value.
Other invisible objects include:
cont
a vector of contrasts.
conf
The confidence level.
band
A two column matrix containing the lower and upper confidence bounds.
The pairw class also has a utility function plot.pairw which provides either a barplot of location
measures with errors and letters indicating whether true effects are significant and the defined significance level (argument type = 1) or confidence intervals for the true difference of each comparison
(argument type = 2). See code below and and plot.pairw for examples.
Note
Different forms of these functions have existed for years without implementation into libraries. My
version here, based on the function outer is unique.
Author(s)
Ken Aho
References
Kutner, M. H., Nachtsheim, C. J., Neter, J., and Li., W (2005) Applied linear statistical models, 5th
edition. McGraw-Hill, Boston.
See Also
plot.pairw. Functions from library mult.comp provide more sophisticated comparisons including
customized contrasts and one tailed tests.
130
pairw.fried
Examples
eggs<-c(11,17,16,14,15,12,10,15,19,11,23,20,18,17,27,33,22,26,28)
trt<-as.factor(c(1,1,1,1,1,2,2,2,2,2,3,3,3,3,4,4,4,4,4))
pairw.anova(y = eggs, x = trt,
pairw.anova(y = eggs, x = trt,
pairw.anova(y = eggs, x = trt,
tukey <- pairw.anova(y = eggs,
method =
method =
method =
x = trt,
"lsd")##LSD method
"bonf")##Bonferroni
"scheffe")##Sheffe
method = "tukey")##Tukey HSD
plot(tukey)
#you can also try plot(tukey, type = 2)
blood.count <- data.frame(bc=c(7.4,8.5,7.2,8.24,9.84,8.32,9.76,8.8,
7.68,9.36,12.8,9.68,12.16,9.2,10.55), trt=c(rep("C",6),rep("A",4),rep("B",5)))
with(blood.count,pairw.anova(y=bc,x=trt,control="C",method="dunnett"))##Dunnett
scheffe.cont(y = eggs, x = trt, lvl = c(1, 3))
scheffe.cont(y = eggs, x = trt, lvl = c(1,2))
bonf.cont(y = eggs, x = trt, lvl = c(1,3), comps = 2)
bonf.cont(y = eggs, x=trt, lvl = c(1,2), comps = 2)
pairw.fried
Multiple pairwise comparison procedure to accompany a Friedman
test.
Description
Replaces now defunct FR.multi.comp. As with ANOVA we can examine multiple pairwise comparisons from a Friedman test after we have rejected othe overall null hypothesis. However we will
need to account for family-wise type I error in these comparisons which will be non-orthogonal. A
conservative multiple comparison method used here is based on the Bonferroni procedure.
Usage
pairw.fried(y, x, blocks, nblocks, conf = 0.95)
Arguments
y
A vector of responses, i.e. quantitative data.
x
A categorical vector of factor levels.
blocks
A categorical vector of blocks.
nblocks
The number of blocks.
conf
The level of confidence. 1 - P(type I error).
pairw.fried
131
Value
Returns a list of class = "pairw". The utility print function returns a descriptive head and a six
column summary dataframe containing:
1) the type of contrast (names are taken from levels in x),
2) the mean rank difference,
3) the lower confidence bound of the true mean rank difference,
4) the upper confidence bound of the true mean rank difference,
5) the hypothesis decision given the prescribed significance level, and
6) the adjusted P-value.
Author(s)
Ken Aho
References
Fox, J. R., and Randall, J. E. (1970) Relationship between forearm tremor and the biceps electromyogram. Journal of Applied Physiology 29: 103-108.
Kutner, M. H., Nachtsheim, C. J., Neter, J., and W. Li (2005) Applied linear statistical models, 5th
edition. McGraw-Hill, Boston.
See Also
friedman.test, plot.pairw
Examples
#Data from Fox and Randall (1970)
tremors <- data.frame(freq = c(2.58, 2.63, 2.62, 2.85, 3.01, 2.7, 2.83, 3.15,
3.43, 3.47, 2.78, 2.71, 3.02, 3.14, 3.35, 2.36, 2.49, 2.58, 2.86, 3.1, 2.67,
2.96, 3.08, 3.32, 3.41, 2.43, 2.5, 2.85, 3.06, 3.07), weights =
factor(rep(c(7.5, 5, 2.5, 1.25, 0), 6)), block = factor(rep (1 : 6, each = 5)))
fr <- with(tremors, pairw.fried(y = freq, x = weights, blocks = block, nblocks = 6, conf = .95))
fr
plot(fr, loc.meas = median, int = "IQR")
# you can also try: plot(fr, type = 2, las = 2)
132
pairw.kw
pairw.kw
Multiple pairwise comparison procedure to accompany a KruskalWallis test
Description
Replaces the defunct KW.multi.comp. As with ANOVA we can examine multiple pairwise comparisons from a Kruskal-Wallis test after we have rejected our omnibus null hypothesis. However
we will need to account for the fact that these comparisons will be non-orthogonal. A conservative
multiple comparison method used here is based on the Bonferroni procedure.
Usage
pairw.kw(y, x, conf)
Arguments
y
The response variable. A vector of quantitative responses.
x
An explanatory variable. A vector of factor levels.
conf
The level of desired confidence, 1 - P(type I error).
Value
Returns a list of class = "pairw". The utility print function returns a descriptive head and a six
column summary dataframe containing:
1) the type of contrast (names are taken from levels in x),
2) the mean rank difference,
3) the lower confidence bound of the true mean rank difference,
4) the upper confidence bound of the true mean rank difference,
5) the hypothesis decision given the prescribed significance level,
6) the adjusted P-value.
Author(s)
Ken Aho and Richard Boyce http://www.nku.edu/~boycer/. Richard provided adjustment for
ties.
References
Kutner, M. H., Nachtsheim, C. J., Neter, J., and W. Li (2005) Applied linear statistical models, 5th
edition. McGraw-Hill, Boston.
See Also
pairw.anova, pairw.fried, plot.pairw
panel.cor.res
133
Examples
rye.data <- data.frame(rye = c(50, 49.8, 52.3, 44.5, 62.3, 74.8, 72.5, 80.2,
47.6, 39.5, 47.7,50.7), nutrient = factor(c(rep(1, 4), rep(2, 4), rep(3, 4))))
kw <- with(rye.data, pairw.kw(y = rye, x = nutrient, conf = .95))
kw
plot(kw, loc.meas = median, int = "IQR")
# you can also try: plot(kw, type = 2)
panel.cor.res
Functions for customizing correlation matrices
Description
The functions here can be used to customize upper and lower triangles in correlation matrices. In
particular panel.cor.res provides correlation coefficients (any alternative from cor can be used)
and p-values for correlation tests. The function panel.lm puts linear fitted lines from simple linear
regression in scatterplots. Note that the function panel.smooth provides a smoother fit.
Usage
panel.cor.res(x, y, digits = 2, meth = "pearson", cex.cor=1)
panel.lm(x, y, col = par("col"), bg = NA, pch = par("pch"), cex = 1,
col.line = 2,lty = par("lty"))
Arguments
x
variable 1 in correlation
y
variable 2 in correlation
digits
number of digits in text for panel.cor.res
meth
type of correlation coefficeint from panel.cor.res, one of "pearson", "spearman",
"kendall"
cex.cor
size of text in panel.lm
col
color of points in panel.lm
bg
background color of points in panel.lm
pch
type of symbols for points in panel.lm
cex
symbol size in panel.lm
lty
line type in panel.lm
col.line
color of lines in panel.lm
Author(s)
Ken Aho
134
partial.R2
See Also
cor, cor.test, panel.smooth
Examples
data(asthma)
attach(asthma)
pairs(asthma,cex.labels=1,cex=.95,gap=.1,lower.panel=panel.cor.res,
upper.panel=panel.lm)
partial.R2
Partial correlations of determination in multiple regression
Description
Calculates the partial correlation of determination for a variable of interest in a multiple regression.
Usage
partial.R2(nested.lm, ref.lm)
Arguments
nested.lm
A linear model without the variable of interest.
ref.lm
A linear model with the variable of interest.
Details
Coefficients of partial determination measure the proportional reduction in sums of squares after a
variable of interest, X, is introduced into a model. We can see how this would be of interest in a
multiple regression.
Value
The partial R2 is returned.
Author(s)
Ken Aho
References
Kutner, M. H., Nachtsheim, C. J., Neter, J., and W. Li. (2005) Applied linear statistical models, 5th
edition. McGraw-Hill, Boston.
partial.resid.plot
135
See Also
cor, partial.resid.plot
Examples
Soil.C<-c(13,20,10,11,2,25,30,25,23)
Soil.N<-c(1.2,2,1.5,1,0.3,2,3,2.7,2.5)
Slope<-c(15,14,16,12,10,18,25,24,20)
Aspect<-c(45,120,100,56,5,20,5,15,15)
Y<-as.vector(c(20,30,10,15,5,45,60,55,45))
lm.with<-lm(Y~Soil.C+Soil.N+Slope+Aspect)
lm.without<-update(lm.with, ~. - Soil.N)
partial.R2(lm.without,lm.with)
partial.resid.plot
Partial residual plots for interpretation of multiple regression.
Description
The function creates partial residual plots which help a user graphically determine the effect of a
single predictor with respect to all other predictors in a multiple regression model.
Usage
partial.resid.plot(x, smooth.span = 0.8, lf.col = 2, sm.col = 4,...)
Arguments
x
A output object of class lm or class glm
smooth.span
Degree of smoothing for smoothing line.
lf.col
Color for linear fit.
sm.col
Color for smoother fit.
...
Additional arguments from plot.
Details
Creates partial residual plots (see Kutner et al. 2002). Smoother lines from lowess and linear fits
from lm are imposed over plots to help an investigator determine the effect of a particular X variable
on Y with all other variables in the model. The function automatically inserts explanatory variable
names on axes.
Value
Returns p partial residual plots, where p = the number of explanatory variables.
136
PCB
Author(s)
Ken Aho
References
Kutner, M. H., Nachtsheim, C. J., Neter, J., and W. Li. (2005) Applied linear statistical models, 5th
edition. McGraw-Hill, Boston.
See Also
partial.R2
Examples
Soil.C<-c(13,20,10,11,2,25,30,25,23)
Soil.N<-c(1.2,2,1.5,1,0.3,2,3,2.7,2.5)
Slope<-c(15,14,16,12,10,18,25,24,20)
Aspect<-c(45,120,100,56,5,20,5,15,15)
Y<-c(20,30,10,15,5,45,60,55,45)
x <- lm(Y ~ Soil.N + Soil.C + Slope + Aspect)
op <- par(mfrow=c(2,2),mar=c(5,4,1,1.5))
partial.resid.plot(x)
par(op)
PCB
PCBs and herring egg thickness
Description
Thirteen sites in the Great Lakes were selected for a study to quantify PCB concentrations in 1982
and 1996 (Hughes et al. 1998). At each site 9-13 American herring gull (Larus smithsonianus) eggs
were randomly collected and tested for PCB content.
Usage
data(PCB)
Format
A data frame with 26 observations on the following 3 variables.
nest Nest number
level PCB levels microgram/gram of dry weight
year a numeric vector
Source
Ott, R. L., and M. T. Longnecker (2004) A First Course in Statistical Methods. Thompson.
perm.fact.test
137
References
Hughes, K. D., Weselogh, D. V., and B. M. Braune (1998) The ratio of DDE to PCB concentrations
in Great Lakes herring gull eggs and its use in interpreting contaminants data. Journal of Great
Lakes Research 24(1): 12-31.
perm.fact.test
Permutation test for two and three way factorial designs
Description
Provides permutation tests for two and three way designs, using permutations of of the response
vector with respect to factor levels. One way permutation tests are provided by MC.test, and the
function oneway_test in coin.
Usage
perm.fact.test(Y, X1, X2, X3 = NA, perm = 100, method = "a")
Arguments
Y
A vector of response data. A quantitative vector.
X1
A vector of factor levels describing factor one.
X2
A vector of factor levels describing factor two.
X3
If necessary, a vector of factor levels describing factor three.
perm
Number of permutations.
method
Either "a" or "b", see below.
Details
Manly (1997) describes five factorial permutation methods which allow testing of interactions.
None of these should be considered to be extensively tested or strongly supported by the statistical literature. (a) In the first method observations are randomly allocated to factorial treatments
preserving the sample size for each treatment. Permutation distributions of the F statistics for A,
B, and AB are used for statistical tests. (b) In the second method observations are randomized as
above but permutation distributions of MSA, MSB and MSAB are obtained. (c) Edgington (1995)
recommended a restricted randomization procedure where observations within a main effect are
randomized while holding other effects constant. Either mean squares or F statistics can be used to
create permutation distributions. Edgington emphasized that testing interactions with this method
are not possible, but that by randomizing over all AB combinations (as in alternative "a" above) provides a test statistic sensitive to interactions. (d) Still and White (1981) recommended a restricted
testing procedure (as in "c" above) but recommended testing interactions after "subtracting" main
effects. (e) Ter Braak (1992) recommended replacing observations by their residuals from the initial
linear model. These are then permutated, assuming that sample sizes were equal to original sample
sizes across interactions of treatments. Permutation distributions of the F statistics for A, B, and
AB are then used for statistical tests. Manly (1997) recommends methods a, b, d, or e. Methods a
and b are currently implemented.
138
pika
Value
A dataframe is returned describing initial F test statistics for main effects and interactions, degrees
of freedom, and permutation P-values.
Author(s)
Ken Aho
References
Edgington, E. S. (1995) Randomization tests, 3rd edition. Marcel Dekker, New York.
Manly, B. F. J. (1997) Randomization and Monte Carlo methods in biology, 2nd edition. Chapman
and Hall, London.
Still, A. W., and A. P. White (1981) The approximate randomization test as an alternative to the
F test in analysis of variance. British Journal of Mathematics and Statistical Psychology. 34:
243-252.
Ter Braak, C. F. J. (1992) Permutation versus bootstrap significance tests in multiple regression and
ANOVA. In Jockel, K. J. (ed). Bootstrapping and Related Techniques. Springer-Verlag, Berlin.
See Also
MC.test
Examples
lizard<-data.frame(ants=c(13,242,105,8,59,20,515,488,88,18,44,21,182,21,7,24,312,68,
460,1223,990,140,40,27),size=factor(c(rep(1,12),rep(2,12))),
month=factor(rep(rep(c(1,2,3,4),each=3),2)))
attach(lizard)
perm.fact.test(ants,month,size,perm=100, method = "b")
pika
Nitrogen content of soils under pika haypiles.
Description
Aho (1998) hypothesized that pikas worked as ecosystem engineers by building relatively rich soils
(via decomposing haypiles and fecal accumulations) in otherwise barren scree. Soils from twenty
one paired on-haypile and off-haypile sites were gathered from Rendezvous Peak Grand Teton
National Park to determine if the habitats differed in total soil nitrogen.
Usage
data(pika)
plantTraits
139
Format
A data frame with 22 observations on the following 2 variables.
Haypile a numeric vector
On.Off..N a numeric vector
References
Aho, K., Huntly N., Moen J., and T. Oksanen (1998) Pikas (Ochotona princeps: Lagomorpha) as
allogenic engineers in an alpine ecosystem. Oecologia. 114 (3): 405-409.
plantTraits
Plant traits for 136 species
Description
This dataset, from the library cluster, describes 136 plant species according to biological attributes
(morphological or reproductive).
Usage
data(plantTraits)
Format
A data frame with 136 observations on the following 31 variables.
pdias Diaspore mass (mg).
longindex Seed bank longevity.
durflow Flowering duration.
height Plant height, an ordered factor with levels ’1’ < ’2’ < ... < ’8’.
begflow Time of first flowering, an ordered factor with levels ’1’ < ’2’ < ’3’ < ’4’ < ’5’ < ’6’ < ’7’
< ’8’ < ’9’.
mycor Mycorrhizas, an ordered factor with levels ’0’never < ’1’ sometimes< ’2’always.
vegaer Aerial vegetative propagation, an ordered factor with levels ’0’never < ’1’ present but limited< ’2’important.
vegsout Underground vegetative propagation, an ordered factor with 3 levels identical to ’vegaer’
above.
autopoll Selfing pollination, an ordered factor with levels ’0’never < ’1’rare < ’2’ often< the
rule’3’.
insects Insect pollination, an ordered factor with 5 levels ’0’ < ... < ’4’.
wind Wind pollination, an ordered factor with 5 levels ’0’ < ... < ’4’.
lign A binary factor with levels ’0:1’, indicating if plant is woody.
piq A binary factor indicating if plant is thorny.
140
plantTraits
ros A binary factor indicating if plant is rosette.
semiros Semi-rosette plant, a binary factor (’0’: no; ’1’: yes).
leafy Leafy plant, a binary factor.
suman Summer annual, a binary factor.
winan Winter annual, a binary factor.
monocarp Monocarpic perennial, a binary factor.
polycarp Polycarpic perennial, a binary factor.
seasaes Seasonal aestival leaves, a binary factor.
seashiv Seasonal hibernal leaves, a binary factor.
seasver Seasonal vernal leaves, a binary factor.
everalw Leaves always evergreen, a binary factor.
everparti Leaves partially evergreen, a binary factor.
elaio Fruits with an elaiosome (dispersed by ants), a binary factor.
endozoo Endozoochorous fruits, a binary factor.
epizoo Epizoochorous fruits, a binary factor.
aquat Aquatic dispersal fruits, a binary factor.
windgl wind dispersed fruits, a binary factor.
unsp Unspecialized mechanism of seed dispersal, a binary factor.
Details
Most of factor attributes are not disjunctive. For example, a plant can be usually pollinated by
insects but sometimes self-pollination can occur.
Note
The description here follows directly from that in cluster.
Source
Vallet, Jeanne (2005) Structuration de communautes vegetales et analyse comparative de traits
biologiques le long d’un gradient d’urbanisation. Memoire de Master 2 ’Ecologie-BiodiversiteEvolution’; Universite Paris Sud XI, 30p.+ annexes (in french).
Maechler, M., Rousseeuw, P., Struyf, A., Hubert, M. (2005). Cluster Analysis Basics and Extensions; unpublished.
plot.pairw
plot.pairw
141
Plots confidence intervals and/or bars with letters indicating significant differences for objects from class pairw
Description
Provides a utility confidence interval plotting function for objects of class = "pairw", i.e. objects
from pairw.anova, pair.fried, and pairw.kw.
Usage
## S3 method for class 'pairw'
plot(x, type = 1, lcol = 1, lty = NULL, lwd = NULL,
cap.length = 0.1, xlab = "", main = NULL, ...)
Arguments
x
An object of class pairw.
type
Two types of plots can be made. Type 1 is a barplot with identical letters over
bars if the differences are not significant after adjustment for simultaneous inference. Type 1 plots can be modified using bplot arguments. A type 2 plot
shows confidence intervals for true differences.
lcol
Confidence bar line color for a type 2 plot, see par.
lty
Confidence bar line type, see par.
lwd
Confidence bar line width, see par.
cap.length
Widths for caps on interval bars (in inches).
xlab
X-axis label.
main
Main cpation. Defaults to a descriptive head.
...
Additional arguments from bplot or barplot for type 1 and 2 graphs, respectively.
Author(s)
Ken Aho. Letters for type 1 graphs obtained using the function multcompLetters from package
multcompView which uses the algorithm of Peipho (2004).
References
Piepho, H-P (2004) An algorithm for a letter-based representation of all-pairwise comparisons.
Journal of Computational and Graphical Statistics 13(2): 456-466.
See Also
pairw.anova, pairw.fried, pairw.kw, barplot, bplot, multcompLetters
142
plotAncova
Examples
eggs<-c(11,17,16,14,15,12,10,15,19,11,23,20,18,17,27,33,22,26,28)
trt<-as.factor(c(1,1,1,1,1,2,2,2,2,2,3,3,3,3,4,4,4,4,4))
# Type 1 plot
plot(pairw.anova(y = eggs, x = trt, method = "scheffe", conf = .8), int = "CI",
conf = .8)
# Type 2 plot
plot(pairw.anova(y = eggs, x = trt, method = "scheffe", conf = .8), type = 2)
# Data from Fox and Randall (1970)
tremors <- data.frame(freq = c(2.58, 2.63, 2.62, 2.85, 3.01, 2.7, 2.83, 3.15,
3.43, 3.47, 2.78, 2.71, 3.02, 3.14, 3.35, 2.36, 2.49, 2.58, 2.86, 3.1, 2.67,
2.96, 3.08, 3.32, 3.41, 2.43, 2.5, 2.85, 3.06, 3.07), weights =
factor(rep(c(7.5, 5, 2.5, 1.25, 0), 6)), block = factor(rep (1 : 6, each = 5)))
plot(with(tremors, pairw.fried(y = freq, x = weights, blocks = block, nblocks =
6, conf = .95)), loc.meas = median, int = "IQR", bar.col = "lightgreen",
lett.side = 4, density = 3, horiz = TRUE) # Note how blocking increases power
rye.data <- data.frame(rye = c(50, 49.8, 52.3, 44.5, 62.3, 74.8, 72.5, 80.2,
47.6, 39.5, 47.7,50.7), nutrient = factor(c(rep(1, 4), rep(2, 4), rep(3, 4))))
plot(with(rye.data, pairw.kw(y = rye, x = nutrient, conf = .95)), type = 2)
plotAncova
Creates plots for one way ANCOVAs
Description
ANCOVA plots are created, potentially with distinct line types and/or symbols and colors for treatments. A legend relating ciphers to treatments is also included.
Usage
plotAncova(model, pch = NULL, lty = NULL, col = NULL, leg.loc = "topright",
leg.cex = 1, leg.bty = "o", leg.bg = par("bg"), legend.title = NULL,...)
Arguments
model
Result from lm. An additive model results in a common slope plot. An interaction model results in distinct slopes for treatments
pch
A scalar, or a vector of length n defining symbols for treatments.
lty
A scalar, or a vector of length n defining line types for treatments.
col
A scalar, or a vector of length n defining color for symbols and lines.
leg.loc
Location of the legend. "n" supresses the legend.
plotCI.reg
143
leg.cex
Character expansion from legend.
leg.bty
Box typefrom legend.
leg.bg
Background color from legend.
legend.title
Legend title from legend.
...
Additional arguments from plot
Value
Returns an ANCOVA plot and model coefficients.
Author(s)
Ken Aho
See Also
lm
Examples
x <- rnorm(20)
y <- 3 * x + rnorm(20)
cat <- c(rep("A",5),rep("B",5),rep("C",5),rep("D",5))
l <- lm(y ~ x * cat)
plotAncova(l, leg.loc = "bottomright")
plotCI.reg
Plots a simple linear regression along with confidence and prediction
intervals.
Description
Plots the fitted line from a simple linear regression (y ~ x) and (if requested) confidence and prediction intervals.
Usage
plotCI.reg(x, y, conf = 0.95, CI = TRUE, PI = TRUE, resid = FALSE, reg.col = 1,
CI.col = 2, PI.col = 4, reg.lty = 1, CI.lty = 2, PI.lty = 3, reg.lwd = 1,
CI.lwd = 1, resid.lty = 3, resid.col = 4,...)
144
plotCI.reg
Arguments
x
The explanatory variable, a numeric vector.
y
The response variable, a numeric vector
conf
The level of confidence; 1 - P(type I error)
CI
Logical; should the confidence interval be plotted?
PI
Logical; should the prediction interval be plotted?
resid
Logical; should residuals be plotted?
reg.col
Color of the fitted regression line.
CI.col
Color of the confidence interval lines.
PI.col
Color of the prediction interval lines.
reg.lty
Line type for the fitted regression line.
CI.lty
Line type for the confidence interval.
PI.lty
Line type for the confidence interval.
reg.lwd
Line width for the regression line.
CI.lwd
Line widths for the confidence and prediction intervals.
resid.lty
Line width for the regression line.
resid.col
Line color for residual lines.
...
Additional arguments from plot
Value
Returns a plot with a regression line and (if requested) confidence and prediction intervals
Author(s)
Ken Aho
See Also
plot, predict
Examples
y<-c(1,2,1,3,4,2,3,4,3,5,6)
x<-c(2,3,1,4,5,4,5,6,7,6,8)
plotCI.reg(x,y)
PM2.5
PM2.5
145
PM 2.5 pollutant data from Pocatello Idaho.
Description
PM 2.5 pollutants (those less than 2.5 microns in diameter) can be directly emitted from sources
such as forest fires, or can form when gases discharged from power plants, industries and automobiles react in the air. Once inhaled, these particles can affect the heart and lungs and cause serious
health problems. The DEQ began monitoring PM 2.5 pollutants in Pocatello Idaho in November
1998.
Usage
data(PM2.5)
Format
A data frame with 65 observations on the following 2 variables.
Yr.mos Year and month. A factor with levels 1998 11 1998 12 1999 1 1999 10 1999 11 1999 12
1999 2 1999 3 1999 4 1999 5 1999 6 1999 7 1999 8 1999 9 2000 1 2000 10 2000 11
2000 12 2000 2 2000 3 2000 4 2000 5 2000 6 2000 7 2000 8 2000 9 2001 1 2001 10
2001 11 2001 12 2001 2 2001 3 2001 4 2001 5 2001 6 2001 7 2001 8 2001 9 2002 1
2002 10 2002 11 2002 12 2002 2 2002 3 2002 4 2002 5 2002 6 2002 7 2002 8 2002 9
2003 1 2003 10 2003 11 2003 12 2003 2 2003 3 2003 4 2003 5 2003 6 2003 7 2003 8
2003 9 2004 1 2004 2 2004 3
PM2.5 A numeric vector describing PM 2.5 pollutnat levels in mug/m2 .
Source
Idaho department of Environmental Quality
polyamine
Polyamine data from Hollander and Wolfe (1999)
Description
Polyamines are a class of organic compounds having two or more primary amino groups. They
appear to have a number of important functions including regulation of cell proliferation, cell differentiation, and cell death. Polyamine plasma levels taken for healthy children of different ages
were summarized by Hollander and Wolfe (1999).
Usage
data(polyamine)
146
portneuf
Format
A data frame with 25 observations on the following 2 variables.
age Child age in years (0 indicates newborn)
p.amine Polyamine level in blood
Source
Hollander, M., and D. A. Wolfe (1999) Nonparametric statistical methods. New York: John Wiley
& Sons.
portneuf
Portneuf River longitudinal N and P data.
Description
Portneuf River data from the Siphon Road site near Pocatello Idaho, downstream from an elemental
P refinery.
Usage
data(portneuf)
Format
A data frame with 176 observations on the following 3 variables.
date Dates from 1998-01-15 to 2011-08-16
TKN Total Kjeldahl nitrogen (measured as a percentage)
total.P Total phosphorous (mg/L)
Source
Idaho State Department of Environmental Quality
potash
potash
147
Potash/cotton strength data
Description
An oft-cited RCBD example is an agricultural experiment which evaluates the effect of levels of of
soil K2 O (potash) on the breaking strength of cotton fibers (Cochran and Cox 1957). Five levels of
K2 O were used in the soil subplots ( 36, 54, 72, 108, and 144 lbs per acre) and a single sample of
cotton was taken from each of five subplot. The experiment had three blocks, and each of the K2 O
treatments was randomly assigned to the five subplots within each block.
Usage
data(potash)
Format
A data frame with 15 observations on the following 3 variables.
treatment a factor with levels 36 54 72 108 144
block a factor with levels 1 2 3
strength a numeric vector
Source
Cochran, W. G. and G. M. Cox (1957) Experimental Designs (Second Edition). New York: John
Wiley & Sons.
potato
Fisher’s Rothamsted potato data
Description
In his "Statistical Methods for Research Workers" Fisher (1925) introduced the world to ANOVA
using data from the famous Rothamsted Agricultural Experimental Station. In one example Fisher
compared potato yield (per plant) for twelve potato varieties and three fertilizer treatments (a basal
manure application, along with sulfur and chloride addition). Three replicates were measured for
each of the 12 x 3 = 36 treatment combinations.
Usage
data(potato)
148
power.z.test
Format
A data frame with 108 observations on the following 4 variables.
Yield Potato yield in lbs per plant
Variety Potato variety: Ajax Arran comrade British queen Duke of York Epicure Great Scot
Iron duke K of K Kerrs pink Nithsdale Tinwald perfection Up-to-date
Fert Fertilizer type: B = basal manure, Cl = chloride addition, S = sulfur addition.
Patch Feld patch number 1 2 3 4 5 6 7 8 9
Source
Fisher, R. A. (1925) Statistical Methods for Research Workers, 1st edition. Oliver and Boyd, Edinburgh
power.z.test
Power analysis for a one sample z-test
Description
A power analysis for a one sample z-test. The function requires α, σ, the effect size, the type of test
(one tailed or two-tailed), and either power (1 - β) or n (sample size). If n is provided, then power
is calculated. Conversely, if one provides power, but not n, then n is calculated.
Usage
power.z.test(sigma = 1, n = NULL, power = NULL, alpha = 0.05, effect = NULL,
test = c("two.tail", "one.tail"), strict = FALSE)
Arguments
sigma
The population standard deviation.
n
The sample size. Not required if power is specified.
power
The desired power. Not required if n is specified.
alpha
Probability of type I error.
effect
Effect size.
test
One of two choices: "two.tail" or "one.tail".
strict
Causes the function to use a strict interpretation of power in a two-sided test. If
strict = TRUE then power for a two sided test will include the probability of
rejection in the opposite tail of the true effect. If strict = FALSE (the default)
power will be half the value of α if the true effect size is zero.
press
149
Value
Returns a list
sigma
The prescribed population variance.
n
The sample size.
power
The power.
alpha
The type I error probability.
test
The type of test prescribed.
effect
The effect size.
Author(s)
Ken Aho
References
Bain, L. J., and M. Engelhardt (1992) Introduction to probability and mathematical statistics.
Duxbury press. Belmont, CA, USA.
See Also
pnorm
Examples
power.z.test(sigma=6,effect=5,power=.9,test="one.tail")
press
prediction sum of squares
Description
Calculates PREdiction Sum of Squares (PRESS) for a linear model.
Usage
press(lm)
Arguments
lm
An object of class lm.
150
Preston.dist
Details
The press statistic is calculated as:
n
X
d2i
i=1
where
di =
ei
1 − hii
where hii is the ith diagonal element in the hat matrix.
Value
Returns the PRESS statistic.
Author(s)
Ken Aho
References
Kutner, M. H., Nachtsheim, C. J., Neter, J., and W. Li (2005) Applied linear statistical models, 5th
edition. McGraw-Hill, Boston.
See Also
cor
Examples
Y <- rnorm(100)
X <- rnorm(100)
press(lm(Y ~ X))
Preston.dist
Preston diversity analysis
Description
A diversity and richness analysis method based on the Preston (1948) log-normal distribution.
Usage
Preston.dist(counts, start = 0.2, cex.octave = 1, cex.legend = 1, cex.pt = 1, ...)
Preston.dist
151
Arguments
counts
Vector of counts for species in a community dataset.
start
Starting value for non-linear least squares estimation of a in n = n0 × e−aR .
cex.octave
Character expansion for octave labels.
cex.legend
Character expansion for legend.
cex.pt
Character expansion for symbols.
...
Additional arguments from plot.
2
Details
Preston (1948) proposed that after a log2 transformation species abundances, grouped in bins representing a doubling of abundance (octaves), would be normally distributed. Thus, after this transformation most species in a sample would have intermediate abundance, and there would be relatively few rare or ubiquitous species. The Preston model is based on the Gaussian function:
2
n = n0 × e−aR , where, n0 is the number of species contained in the modal octave, n is the
number of species contained in an octave R octaves from the modal octave, and a is an unknown
parameter. The parameter a is estimated using the function nls, using a starting value, 0.2, recommended by Preston. The area under Preston curve provides an extrapolated estimate of richness and
thus an indication of the adequacy of a sampling effort. Preston called a line placed at the 0th octave
the veil line. He argued that species with abundances below the veil line have not been detected due
to inadequate sampling.
Value
Graph of the Preston log-normal distribution for a dataset given by "counts", and a summary of the
analysis including the fitted Gaussian equation, the estimated number of species, and an estimate
for the percentage of sampling that was completed i.e. [length(counts)/Est.no.of.spp]*100.
Author(s)
Ken Aho
References
Preston, F.W. (1948) The commonness and rarity of species. Ecology 29, 254-283.
See Also
dnorm, nls
Examples
data(BCI.count)
BCI.ttl<-apply(BCI.count,2,sum)
Preston.dist(BCI.ttl)
152
prp
prostate
Prostate cancer data
Description
Hastie et al. (2001) describe a cancer research study that attempted to associate prostate specific
antigenand and a number of prognostic measures in mean with advanced prostate cancer. Data in
the experiment were collected from 97 men who were about to undergo radial prostectomies.
Usage
data(prostate)
Format
A data frame with 97 observations on the following 4 variables.
PSA Serum prostate-specific albumin levle (mg/ml).
vol Tumor volume (cc).
weight Prostate weight (g).
Gleason Pathologically determined grade of disease. Summed scores were either 6, 7, or 8 with
higher scores indicating worse prognosis.
Source
Kutner, M. H., Nachtsheim, C. J., Neter, J., and W. Li (2005) Applied linear statistical models, 5th
edition. McGraw-Hill, Boston.
References
Hastie, T., R. Tibshirani, and J. Friedman (2009) The Elements of Statistical Learning: Data Mining, Inference, and Prediction, Second Edition. Springer.
prp
Perpendicularity
Description
Calculates a perpendicularity index, η, for animal spatial movements. The index has a [0, 1] range
with 0 indicating a perfectly parallel movement with respect to boundary or edge and 1 indicating
perfectly perpendicular movement. Other summaries are also provided.
prp
153
Usage
prp(Time, S.X, S.Y, N.X, N.Y, habitat = NULL, near.angle = NULL,
F.0.NA = TRUE)
Arguments
Time
A numeric vector containing the times when spatial coordinates were recorded.
S.X
X-coordinates of animal.
S.Y
Y-coordinates of animal.
N.X
X-coordinate of nearest point on boundary. These data can be obtained from
function near.bound or from ARCGIS Near output.
N.Y
Y-coordinate of nearest point on boundary. These data can be obtained from
function near.bound or from ARCGIS Near output.
habitat
A character vector of habitat categories.
near.angle
A numeric vector containing the angle of azimuth to the nearest point on the
boundary with respect to a four quadrant system. NE = 0◦ to 90◦ , NW is > 90◦
and ≤ 180◦ , SE is < 0◦ and ≤ −90◦ is > −90◦ and ≤ −180◦ . This output can
be obtained from function bound.angle or from ARCGIS Near output.
F.0.NA
A logical argument specifying whether or not a time interval in which F = 0
should be made NA (see Figure from examples)
Details
This index for perpendicularity, η is based on the following rules:
if δ ≤ 90o then η = δ/90o ; if 90o < δ ≤ 135o then η = [90o − (δ − 90o )]/90o ; if 135o < δ ≤ 180o
then η = (δ − 90o )/90o
For notation create Figures from examples.
Value
Returns a list with four or five items.
lines
A matrix with n - 1 rows containing line lengths for the lines A, B, C, D, and F.
See figure in examples below.
angles
A matrix with n - 1 rows containing line lengths for the angles κ, γ and δ. See
Figure in examples below.
moment.by.moment
This component provides a matrix with n - 1 rows. Included are the columns:
End.time, Eta.Index, Delta, Habitat, and Brdr chng. The columns Habitat,
and Brdr chng are excluded if habitat = NULL or near.angle = NULL.
P.summary
Contains averages and standard errors for η.
crossing.summary
Crossing binomial summaries. Provided if habitat and near.angle are specified.
154
prp
Author(s)
Ken Aho
References
Kie, J.G., A.A. Ager, and R.T. Bowyer (2005) Landscape-level movements of North American elk
(Cervus elaphus): effects of habitat patch structure and topography. Landscape Ecology 20:289300.
McGarigal K., SA Cushman, M.C. Neel, and E. Ene (2002) FRAGSTATS: Spatial Pattern Analysis Program for Categorical Maps. Computer software program produced by the authors at the
University of Massachusetts, Amherst.
See Also
near.bound, bound.angle
Examples
## Not run:
###Diagram describing prp output.
y<-rnorm(100,0,5)
plot(seq(1,100),sort(y),type="l",xaxt="n",yaxt="n",lwd=2,xlab="",ylab="")
op <- par(font=3)
segments(52,-12,46,sort(y)[46],lty=1,col=1,lwd=1)##A
segments(90,-8,85,sort(y)[85],lty=1,col=1,lwd=1)##B
segments(46,sort(y)[46],85,sort(y)[85],lty=1)##F
segments(90,-8,46,sort(y)[46],lty=2)##D
arrows(52,-12,90,-8,length=.1,lwd=3)##C
arrows(20,-12,20,8,lty=2,col="gray",length=.1)#North
arrows(20,sort(y)[46],95,sort(y)[46],length=.1,lty=2,col="gray")
arrows(20,-12,95,-12,length=.1,lty=2,col="gray")#East
text(20,9,"N",col="gray");text(97,-12, "E", col= "gray");text(97,sort(y)[46], "E",
col= "gray")
text(49.5,-12.5,"a");text(92.5,-8.5,"b")
text(45.5,-5.5,"A",font=4,col=1);text(70,-9,"C",font=4,col=1);text(91.5,-1.75,"B",
font=4,col=1)
text(44,sort(y)[46]+1,"c");text(67.5,-2.5,"D",font=4,col=1);text(65,3.9,"F",font=4,
col=1)
text(87,sort(y)[87]+1,"d");text(57,-10,expression(kappa),col=1);
text(81,sort(y)[87]-3,expression(gamma),col=1);text(57,1.3,expression(theta),col=1)
text(64,-11.5,expression(beta),col=1)
library(plotrix)
draw.arc(50,-12,6,1.35,col=1);draw.arc(50,-12,6,.3,col=1);draw.arc(50,-12,6,0.02,
col=1)
draw.arc(46,sort(y)[46],7,.01,col=1);draw.arc(46,sort(y)[46],7,.5,col="white")
draw.arc(85,sort(y)[85],6,-2.7,col=1);draw.arc(85,sort(y)[85],6,-1.4,col="white",
lwd=2)
legend("topleft",c(expression(paste(kappa, " = acos[(",C^2," + ",X^2," - ",D^2,")
pseudo.v
155
/2CX]")),
expression(paste(gamma," = acos[(",Y^2," + ",F^2," - ",D^2,")/2YF]")),
expression(paste(theta," = atan[(",y[f]," - ",y[n],")/(",x[f]," - ",x[n],")]")),
expression(paste(beta, " = atan[(",y[epsilon]," - ",y[alpha],")/(",x[epsilon],
" - ",x[alpha],")]"))),
bty="n",cex=.9,inset=-.025)
###Figure for demo dataset.
bX<-seq(0,49)/46
bY<-c(4.89000,4.88200,4.87400,4.87300,4.88000,4.87900,4.87900,4.90100,4.90800,
4.91000,4.93300,4.94000,4.91100,4.90000,4.91700,4.93000,4.93500,4.93700,
4.93300,4.94500,4.95900,4.95400,4.95100,4.95800,4.95810,4.95811,4.95810,
4.96100,4.96200,4.96300,4.96500,4.96500,4.96600,4.96700,4.96540,4.96400,
4.97600,4.97900,4.98000,4.98000,4.98100,4.97900,4.98000,4.97800,4.97600,
4.97700,4.97400,4.97300,4.97100,4.97000)
X<-c(0.004166667,0.108333333,0.316666667,0.525000000,0.483333333,0.608333333,
0.662500000,0.683333333,0.900000000,1.070833333)
Y<-c(4.67,4.25,4.26,4.50,4.90,4.10,4.70,4.40,4.20,4.30)
plot(bX,bY,type="l",lwd=2,xlab="",ylab="",ylim=c(4,5.1))
lines(X,Y)
for(i in 1:9)arrows(X[i],Y[i],X[i+1],Y[i+1],length=.1,lwd=1,angle=20)
mx<-rep(1,9)
my<-rep(1,9)
for(i in 1:9)mx[i]<-mean(c(X[i],X[i+1]))
for(i in 1:9)my[i]<-mean(c(Y[i],Y[i+1]))
for(i in 1:9)text(mx[i],my[i],i,font=2,cex=1.3)
nn<-near.bound(X,Y,bX,bY)
prp(seq(1,10),X,Y,nn[,1],nn[,2])$moment.by.moment
par(op)
## End(Not run)
pseudo.v
Jacknife pseudo-values
Description
The function returns first-order jackknife pseudovalues which can then be used to create statistical
summaries, e.g. the jackknife parameter estimate, and the jackknife standard error. The function
can be run on univariate data (matrix = FALSE) or multivariate data (matrix =TRUE). In the later
case matrix rows are treated as multivariate observations.
Usage
pseudo.v(data, statistic, order = 1, matrix = FALSE)
156
pseudo.v
Arguments
data
A vector (matrix =FALSE) or matrix (matrix=TRUE) of quantitative data.
statistic
A function whose output is a statistic (e.g. a sample mean). The function must
have only one argument, a call to data.
order
The order of jackknifing to be used.
matrix
A logical statement. If matrix = TRUE then rows in the matrix are sampled as
multivariate observations.
Details
In the first order jackknife procedure a statistic θˆ is calculated using all n samples, it is then calculated with the first observation removed θˆ−1 , with only the second observation removed, θˆ−2 , and so
on. This process is repeated for all n samples. The resulting vector of size n contains pseudovalues
for their respective observations.
Value
A vector of first-order jackknife pseudovalues is returned.
Author(s)
Ken Aho
References
Manly, B. F. J. (1997) Randomization and Monte Carlo methods in biology, 2nd edition. Chapman
and Hall, London.
See Also
empinf, boot, bootstrap
Examples
data(cliff.sp)
siteCD1<-data.frame(t(cliff.sp[1,]))
#Shannon-Weiner diversity
SW<-function(data){
d<-data[data!=0]
p<-d/sum(d)
-1*sum(p*log(p))
}
pv<-pseudo.v(siteCD1,SW)
qq.Plot
qq.Plot
157
Normal quantile plots for multiple factor levels
Description
Provides quantile plots for one or more factor levels overlaid on a single graph.
Usage
qq.Plot(y, x = NULL, col = 1, pch = 1, main = "", R = 5000, fit.lty = 1, env.lty = 2,
conf = 0.95, type = "point", ylim = NULL, xlab = "Normal quantiles",
ylab = "Studentized observed quantiles", ...)
Arguments
y
The response variable
x
A categorical variables to subset y
col
A scalar or vector with length equivelent to the number of levels in x, describing
colors of points and lines for levels in x.
pch
A scalar or vector with length equivelent to the number of levels in x, describing
symbols for levels in x.
main
Main title.
R
Number of bootstrap samples for calculating confidence envelopes
fit.lty
Line type for fit line(s).
env.lty
Line type for fit line(s).
conf
Level of confidence in confidence envelopes.
type
Type of bootstrapped confidence envelope. One of "point" or "overall".
ylim
A two element vector defining the lower and upper y-axis limits .
xlab
X-axis label.
ylab
Y-axis label.
...
Other arguments from plot.
Note
Unlike qqnorm observed quantiles are studentized.
Author(s)
Ken Aho
See Also
qqnorm, qqline, envelope
158
r.bw
Examples
y <- rnorm(50)
x <- c(rep(1, 25), rep(2, 25))
qq.Plot(y, x)
r.bw
Biweight midvariance, and biweight midcorrelation.
Description
Calculates biweight midvariance if one variable is given and biweight midvariances, midcovariance
and midcorrelation if two variables are given. Biweight midcorrelation is a robust alternative to
Pearson’s r.
Usage
r.bw(X, Y=NULL)
Arguments
X
A numeric vector
Y
An optional second numeric variable.
Details
Biweight statistics are robust to violations of normality. Like the sample median the sample midvariance has a breakdown point of approximately 0.5. The triefficeincy of the biweight midvariance
was the highest for any of the 150 measures of scale compared by Lax (1985).
Value
Returns the biweight variance if one variable is given, and the biweight midvariances, midcovariance and midcorrelation if two variables are given.
Author(s)
Ken Aho
References
Lax, D. A. (1985) Robust estimators of scale: finite sample performance in long-tailed symmetric
distributions. Journal of the American Statistical Association, 80 736-741.
Wilcox, R. R. (2005) Introduction to Robust Estimation and Hypothesis Testing, Second Edition.
Elsevier, Burlington, MA.
See Also
cor, r.pb
r.dist
159
Examples
x<-rnorm(100)
y<-rnorm(100)
r.bw(x,y)
r.dist
Visualize the sampling distribution of Pearson’s product moment correlation
Description
A stumbling point for many methods of inference for true correlation and independence is the 1)
assymetry, 2) explicit bounds and 3) dependence on sample size, of the sampling distribution of
r. The functions hwew allow visualization of these characteristics. The algorithm used for the
sampling distribution of r is based on the first two steps in an asympotic series (see Kenney and
Keeping 1951).
Usage
r.dist(rho, r, n)
see.r.dist.tck()
Arguments
rho
Population correlation
r
A numeric vector containing possible estimates of rho.
n
Sample size, an integer.
Details
All distributions are standardized to have an area of one.
Author(s)
Ken Aho
References
Kenney, J. F. and E. S. Keeping (1951) Mathematics of Statistics, Pt. 2, 2nd ed. Van Nostrand,
Princeton, NJ.
Weisstein, E. W. (2012) Correlation Coefficient–Bivariate Normal Distribution. From MathWorld–
A Wolfram Web Resource. http://mathworld.wolfram.com/CorrelationCoefficientBivariateNormalDistribution.html
See Also
cor
160
R.hat
Examples
dev.new(height=3.5)
op <- par(mfrow=c(1,2),mar=c (0,0,1.5,3), oma = c(5, 4.2, 0, 0))
vals <- r.dist(0.9, seq(-1, 1, .001), 5)
plot(seq(-1, 1, .001), vals, type = "l",ylab = "", xlab = "")
vals <- r.dist(0.5, seq(-1, 1, .001), 5)
lines(seq(-1, 1, .001), vals, lty = 2)
vals <- r.dist(0.0, seq(-1, 1, .001), 5)
lines(seq(-1, 1, .001), vals, lty = 3)
legend("topleft", lty = c(1, 2, 3), title = expression(paste(italic(n)," = 5")),
legend = c(expression(paste(rho, " = 0.9")),expression(paste(rho, " = 0.5")),
expression(paste(rho, " = 0"))),bty = "n")
vals <- r.dist(0.9, seq(-1, 1, .001), 30)
plot(seq(-1, 1, .001), vals, type = "l",xlab= "", ylab= "")
vals <- r.dist(0.5, seq(-1, 1, .001), 30)
lines(seq(-1, 1, .001), vals, lty = 2)
vals <- r.dist(0.0, seq(-1, 1, .001), 30)
lines(seq(-1, 1, .001), vals, lty = 3)
legend("topleft", lty = c(1, 2, 3), title = expression(paste(italic(n)," = 30")),
legend = c(expression(paste(rho, " = 0.9")),expression(paste(rho, " = 0.5")),
expression(paste(rho, " = 0"))), bty = "n")
mtext(side = 2, expression(paste(italic(f),"(",italic(r),")")), outer = TRUE, line = 3)
mtext(side = 1, expression(italic(r)), outer = TRUE, line = 3, at = .45)
par(op)
R.hat
R hat MCMC convergence statistic
Description
The degree of convergence of a random Markov Chain can be estimated using the Gelman-Rubin
ˆ based on the stability of outcomes between and within m chains of the
convergence statistic, R,
same length, n. Values close to one indicate convergence to the underlying distribution. Values
greater than 1.1 indicate inadequate convergence.
Usage
R.hat(M, burn.in = 0.5)
Arguments
M
An n x m numeric matrix of Markov Chains.
burn.in
The proportion of each chains to be used as a burn in period. The default value,
ˆ
0.5, means that only the latter half of the chains will be used in computing R.
r.pb
161
Details
Gelman et al. (2003, pg. 296) provides insufficeint details to reproduce this function. To get the real
function see Gelman and Rubin (1992). The authors list one other change in their Statlab version of
this function at http://lib.stat.cmu.edu/S/itsim. They recommend muliplying sqrt(postvar/W) by
sqrt((df + 3)/t(df + 1)). The original code and this function can produce estimates below 1.
Author(s)
Ken Aho and unknown StatLib author
References
Gelman, A. and D. B. Rubin (1992) Inference from iterative simulation using multiple sequences
(with discussion). Statistical Science, 7:457-511.
Gelman, A., Carlin, J. B., Stern, H. S., and D. B. Rubin (2003) Bayesian Data Analysis, 2nd edition.
Chapman and Hall/CRC.
See code recommended by Gelman et al. at: http://lib.stat.cmu.edu/S/itsim
r.pb
Percentage bend correlation
Description
The percentage bend correlation is a robust alternative to Pearson’s product moment correlation.
Usage
r.pb(X, Y, beta = 0.2)
Arguments
X
A quantitative vector
Y
A second quantitative vector
beta
Bend criterion
Details
The percentage bend correlation belongs to class of correlation measures which protect against
marginal distribution (X and Y) outliers. In this way it is similar to Kendall’s τ , Spearman’s ρ, and
biweight midcovariance. A second class of robust correlation measures which take in to consideration the overall structure of the data (O estimators) are discussed by Wilcox (2005, pg. 389). A
value for the bend criterion beta is required in the R.pb function; beta = 0.2 is recommended by
Wilcox (2005).
162
rat
Value
A dataframe with the correlation, test statistic and P-value for the null hypothesis of independence
are returned.
Author(s)
Ken Aho
References
Wilcox, R. R. (2005) Introduction to Robust Estimation and Hypothesis Testing, Second Edition.
Elsevier, Burlington, MA.
See Also
corr, r.bw
Examples
x<-rnorm(100)
y<-rnorm(100)
r.pb(x,y)
rat
Rat glycogen data from Sokal and Rohlf (2012).
Description
This dataset from Sokal and Rohlf (2012) can be used to demonstrate psuedoreplication. Six rats
were randomly given one of three treatments: "control", "compound 217", and "compound 217 +
sugar". After a short period of time the rats were euthanized and the glycogen content of their livers
was measured. Two glycogen measurements were made for three different preparations of each
liver. Clearly the liver preparations and measurements on those preparations are nested in each rat,
and are not independent.
Usage
data(rat)
Format
A data frame with 36 observations on the following 4 variables.
glycogen A numeric vector describing glycogen levels. Units are arbitrary.
diet Nutritional compound: 1 = "control", 2 = "compound 217", 3 = "compound 217 + sugar".
rat Rat animal number.
liver Liver preperation.
measure Measurement number.
refinery
163
Source
Sokal, R. R., and Rohlf, F. J. (2012) Biometry, 4th edition. W. H. Freeman and Co., New York.
refinery
Refinery CO dataset
Description
In the early 1990s an oil refinery northeast of San Francisco agreed with local air quality regulators [the Bay Area Air Quality Management District (BAAQMD)] to reduce carbon monoxide
emissions. Baselines for reductions were to be based on measurements of CO made by refinery
personnel, and by independent measurements from BAAQMD scientists for the roughly the same
time period
Usage
data(refinery)
Format
The dataframe contains three columns:
CO Carbon monoxide. Measured in ppm.
Source The source of measurements; either refinery or BAAQMD.
Date Month/Day/Year
Source
http://lib.stat.cmu.edu/DASL/Stories/MeasuringAirPollution.html; accessed 6/29/110
rinvchisq
Random draws from a scaled inverse chi-square distribution
Description
The distribution is an important component of Bayesian normal hierchical models with uniform
priors.
Usage
rinvchisq(n, df, scale = 1/df)
164
samp.dist
Arguments
n
The number of random draws.
df
Degrees of freedom parameter.
scale
Scale non-centrality parameter.
Details
Code based on a function with same name in package goeR.
See Also
The function is a wrapper for rchisq.
samp.dist
Animated and/or snapshot representations of a statistic’s sampling
distribution
Description
This help page describes a series of asbio functions for depicting sampling distributions. The function samp.dist samples from a parent distribution without replacement with sample size = s.size,
R times. At each iteration a statistic requested in stat is calculated. Thus a distribution of R statistic
estimates is created. The function samp.dist shows this distribution as an animated anim = TRUE
or non-animated anim = FALSE density histogram. Sampling distributions for up to four different statistics utilizing two different parent distributions are possible using samp.dist. Sampling
distributions can be combined in various ways by specifying a function in func (see below). The
function samp.dist.n was designed to show (with animation) how sampling disributions vary with
sample size, and is still under development. The function samp.dist.snap creates snapshots, i.e.
simultaneous views of a sampling distribution at particular sample sizes. The function dirty.dist
can be used to create contaminated parent distributions.
Usage
samp.dist(parent = NULL, parent2 = NULL, biv.parent = NULL, s.size = 1, s.size2
= NULL, R = 1000, nbreaks = 50, stat = mean, stat2 = NULL, stat3 = NULL, stat4
= NULL, xlab = expression(bar(x)), func = NULL, show.n = TRUE, show.SE = FALSE,
anim = TRUE, interval = 0.01, col.anim = "rainbow", digits = 3, ...)
samp.dist.snap(parent = NULL, parent2 = NULL, biv.parent = NULL, stat = mean,
stat2 = NULL, stat3 = NULL, stat4 = NULL, s.size = c(1, 3, 6, 10, 20, 50),
s.size2 = NULL, R = 1000, func = NULL, xlab = expression(bar(x)),
show.SE = TRUE, fits = NULL, show.fits = TRUE, xlim = NULL, ylim = NULL, ...)
samp.dist.method.tck()
samp.dist
165
samp.dist.tck(statc = "mean")
samp.dist.snap.tck1(statc = "mean")
samp.dist.snap.tck2(statc = "mean")
dirty.dist(s.size, parent = expression(rnorm(1)),
cont = expression(rnorm(1, mean = 10)), prop.cont = 0.1)
samp.dist.n(parent, R = 500, n.seq = seq(1, 30), stat = mean, xlab = expression(bar(x)),
nbreaks = 50, func = NULL, show.n = TRUE,
show.SE = FALSE, est.density = TRUE, col.density = 4, lwd.density = 2,
est.ylim = TRUE, ylim = NULL, anim = TRUE, interval = 0.5,
col.anim = NULL, digits = 3, ...)
Arguments
parent
A vector or vector generating function, describing the parental distribution. Any
collection of values can be used. When using random value generators for
parental distributions, for CPU effiency (and accuracy) one should use parent = expression(rpdf(s.si
Datasets exceeding 100000 observations are not recommended.
parent2
An optional second parental distribution (see parent above), useful for the construction of sampling distributions of test statistics. When using random value
generators use parent2 = expression(rpdf(s.size2, ...)).
biv.parent
A bivariate (two column) distribution.
s.size
An integer defining sample size (or a vector of integers in the case of samp.dist.snap)
to be taken at each of R iterations from the parental distribution.
s.size2
An optional integer definining a second sample size if a second statistic is to be
calculated. Again, this will be a vector of integers in the of samp.dist.snap.
R
The number of samples to be taken from parent distribution(s).
nbreaks
Number of breaks in the histogram.
stat
The statistic whose sampling distribution is to be represented. Will work for any
summary statistic that only requires a call to data; e.g. mean, var, median, etc.
stat2
An optional second statistic. Useful for conceptualizing sampling distributions
of test statistics. Calculated from sampling parent2.
stat3
An optional third statistic. The sampling distribution is created from the same
sample data used for stat.
stat4
An optional fourth statistic. The sampling distribution is created from the same
sample data used for stat2.
xlab
X-axis label.
func
An optional function used to manipulate a sampling distribution or to combine
the sampling distributions of two or more statistics. The function must contain the following arguemets (although they needn’t all be used in the function):
s.dist, s.dist2, s.size, and s.size2. When sampling from a single parent
166
samp.dist
distribution use s.dist3 in the place of s.dist2. For an estimator invovlving two parent distributions and four statistics, six arguments will be required:
s.dist, s.dist2, s.dist3, s.dist4. s.size, and s.size2 , s.dist3, and as
non-fixed arguments (see example below).
show.n
A logical command, TRUE indicates that sample size for parent will be displayed.
show.SE
A logical command, TRUE indicates that bootstrap standard error for the statistic
will be displayed.
anim
A logical command indicating whether or not animation should be used.
interval
Animation speed. Decreasing interval increases speed.
col.anim
Color to be used in animation. Three changing color palettes: rainbow, gray,
heat.colors, or "fixed" color types can be used.
digits
The number of digits to be displayed in the bootstrap standard error.
fits
Fitted distributions for samp.dist.snap A function with two argument: s.size
and s.size2
show.fits
Logical indicating whether or not fits should be shown (fits will not be shown if
no fitting function is specified regardless of whether this is TRUE or FALSE
xlim
A two element numeric vector defining the upper and lower limits of the X-axis.
ylim
A two element numeric vector defining the upper and lower limits of the Y-axis.
statc
Presets for certain statistics. Currently one of "custom", "mean", "median",
"trimmed mean", "Winsorized mean", "Huber estimator", "H-L estimator",
"sd", "var", "IQR", "MAD", "(n-1)S^2/sigma^2", "F*", "t* (1 sample)",
"t* (2 sample)", "Pearson correlation" or "covariance".
cont
A distribution representing a source of contamination in the parent population.
Used by function dirty.dist.
prop.cont
The proportion of the parent distribution that is contaminated by code.
n.seq
A range of sample sizes for samp.dist.n
est.density
A logical command for samp.dist.n. if TRUE then a density line is plotted over
the histogram. Only used if fix.n = true.
col.density
The color of the density line for samp.dist.n. See est.density above.
lwd.density
The width of the density line for samp.dist.n. See est.density above.
est.ylim
Logical. If TRUE Y-axis limits are estimated logically for the animation in
samp.dist.n. Consistent Y-axis limits make animations easier to visualize.
Only used if fix.n = TRUE.
...
Additional arguments from plot.histogram.
Details
Sampling distributions of individual statistics can be created with samp.dist, or the function can
be used in more sophisticated ways, e.g. to create sampling distributions of ratios of statistics, i.e.
t*, F* etc. (see examples below). To provide pedagogical clarity animation for figures is provided.
To calculate bivariate statistics, specify the parent distribution with biv.parent and the statistic
with func (see below).
samp.dist
167
Two general uses of the function samp.dist are possible. 1) One can demonstrate the accumulation of statistics for a single sample size using animation. This is useful because as more and more
statistics are acquired the frequentist paradigm associated with sampling distributions becomes better represented (i.e the number of estimates is closer to infinity). This is elucidated by allowing the
default fix.n = TRUE. Animation will be provided with the default anim = TRUE. Up two parent
distributions, up to two sample sizes, and up to four distinct statistics (i.e. four distinct sampling
distributions, representing four distinct estimators) can be used. The arguments stat and stat3
will be drawn from parent, while stat3 and stat4 will be drawn from parent2. These distributions can be manipulated and combined in an infinite number of ways with an auxiliary function
called in the argument func (see examples below). This allows depiction of sampling distributions
made up of multiple estimators, e.g. test statistics. 2) One can provide simultaneous snapshots of a
sampling distribution at a particular sample size with the function samp.dist.snap.
Loading the package tcltk allows use of the functions samp.dist.tck, samp.dist.method.tck,
samp.dist.snap.tck1 and samp.dist.snap.tck2, which provide interactive GUIs that run samp.dist.
Value
Returns a representation of a statistic’s sampling distribution in the form of a histogram.
Author(s)
Ken Aho
Examples
## Not run:
##Central limit theorem
#Snapshots of four sample sizes.
samp.dist.snap(parent=expression(rexp(s.size)), s.size = c(1,5,10,50), R = 1000)
##sample mean animation
samp.dist(parent=expression(rexp(s.size)), col.anim="heat.colors", interval=.3)
##Distribution of t-statistics from a pooled variance t-test under valid and invalid assumptions
#valid
t.star<-function(s.dist1, s.dist2, s.dist3, s.dist4, s.size = 6, s.size2 =
s.size2){
MSE<-(((s.size - 1) * s.dist3) + ((s.size2 - 1) * s.dist4))/(s.size + s.size2-2)
func.res <- (s.dist1 - s.dist2)/(sqrt(MSE) * sqrt((1/s.size) + (1/s.size2)))
func.res}
samp.dist(parent = expression(rnorm(s.size)), parent2 =
expression(rnorm(s.size2)), s.size=6, s.size2 = 6, R=1000, stat = mean,
stat2 = mean, stat3 = var, stat4 = var, xlab = "t*", func = t.star)
curve(dt(x, 10), from = -6, to = 6, add = TRUE, lwd = 2)
legend("topleft", lwd = 2, col = 1, legend = "t(10)")
#invalid; same population means (null true) but different variances and other distributional
#characteristics.
samp.dist(parent = expression(runif(s.size, min = 0, max = 2)), parent2 =
168
samp.dist.mech
expression(rexp(s.size2)), s.size=6, s.size2 = 6, R = 1000, stat = mean,
stat2 = mean, stat3 = var, stat4 = var, xlab = "t*", func = t.star)
curve(dt(x, 10),from = -6, to = 6,add = TRUE, lwd = 2)
legend("topleft", lwd = 2, col = 1, legend = "t(10)")
## Pearson's R
require(mvtnorm)
BVN <- function(s.size) rmvnorm(s.size, c(0, 0), sigma = matrix(ncol = 2,
nrow = 2, data = c(1, 0, 0, 1)))
samp.dist(biv.parent = expression(BVN(s.size)), s.size = 20, func = cor, xlab = "r")
#Interactive GUI, require package 'tcltk'
samp.dist.tck("S^2")
samp.dist.snap.tck1("Huber estimator")
samp.dist.snap.tck2("F*")
## End(Not run)
samp.dist.mech
Animated representation of sampling distribution basics
Description
Mountain goats are randomly sampled 10 at a time and weighed [goat weights are normal N(90.5,
225)], a mean weight is calculated from these measures and added to collection of mean weights in
the form of a histogram.
Usage
samp.dist.mech(rep, int = 0.05)
samp.dist.mech.tck()
Arguments
rep
Number of samples. Should not greatly exceed 100.
int
The time interval for animation (in seconds). Smaller intervals speed up animation
Note
Nice goat image from http://all-free-download.com
Author(s)
Ken Aho
sc.twin
sc.twin
169
Matched pairs schizophrenia data
Description
Scientists have long been concerned with identifying physiological characteristics which result in
a disposition for schizophrenia. Early studies suggested that the volume of particular brain regions
of schizophrenic patients may differ from non-afflicted individuals. However these studies often
contained confounding variables (e.g. socioeconomic status, genetics) which obscured brain volume/ schizophrenia relationships (Ramsey and Schafer 1997). To control for confounding variables
Suddath et al. (1990) examined 15 pairs of monozygotic twins where one twin was schizophrenic
and the other was not. Twins were located from an intensive search throughout the United States
and Canada. The authors used magnetic resonance imaging to measure brain volume of particular
regions in the twin’s brains.
Usage
data(sc.twin)
Format
The dataframe has 2 columns:
unaffected Left hippocampus volumes for unaffected twins.
affected Left hippocampus volumes for affected twins.
se.jack
Jackknife standard error from a set of pseudovalues
Description
Calculates the conventional jackknife standard error from a set of pseudovalues. The function
se.jack provides Tukey’s jackknife estimator. The function se.jack provides a measure associated with first order jackknife estimates of species richness (Heltsche and Forester 1983).
Usage
se.jack(x)
se.jack1(x)
Arguments
x
A numeric vector of pseudovalue, for instance from function pseudo.v.
170
sedum.ts
Author(s)
Ken Aho
References
Heltshe, J. F., and N. E. Forrester (1983) Estimating species richness using the jackknife procedure.
Biometrics 39: 1-12.
See Also
pseudo.v
Examples
trag <- c(59, 49, 75, 43, 94, 68, 77, 78, 63, 71, 31, 59, 53, 48, 65, 73, 50, 59, 50, 57)
p <- pseudo.v(trag, statistic = mean)
se.jack(p[,2])
sedum.ts
CO2 exchange time series data
Description
Gurevitch et al. (1986) demonstrated time series analysis with data describing change in CO2
concentration of airstreams passing over a Sedum wrightii test plant.
Usage
data(sedum.ts)
Format
A data frame with 24 observations on the following 3 variables.
exchange CO2 exchange, measured as: [change in CO2 concentration (g/mg)]/ plant fresh mass
(g). Thus units are 1/mg. Positive values indicate net CO2 uptake while negative values
indicate net CO2 output.
time A numeric vector indicating two hour intervals
treatment Dry = water withheld for several week, Wet = plant well watered.
Source
Gurevitch, J. and S. T. Chester, Jr (1986) Analysis of repeated measures experiments. Ecology
67(1): 251-255.
see.accPrec.tck
see.accPrec.tck
171
Interactive depiction of precision and accuracy
Description
Slider GUI for examing the interaction of precision and accuracy.
Usage
see.accPrec.tck()
Author(s)
Ken Aho
see.ancova.tck
Visualize ANCOVA mechanics
Description
An interactive GUI to view ANCOVA meachnics. Exp. power tries to simulate explanatory power
in the concomitant variable. It simply results in (1 - Exp. power) * Residual SE.
Usage
see.ancova.tck()
Author(s)
Ken Aho
172
see.cor.range.tck
see.anova.tck
Interactive depiction of the ANOVA mechanism
Description
Slider control of the means and (constant) variablility of three factor level populations. An ANOVA
is run based on a random sample of these populations.
Usage
see.anova.tck()
Author(s)
Ken Aho
see.cor.range.tck
Depict the effect of range on correlation
Description
Function interactively depicts the effect of the data range on association measures.
Usage
see.cor.range.tck(sd = 0.5)
Arguments
sd
Amount of noise added to linear association. Residuals around line pulled from
a normal distribution centered at zero with this standard deviation.
Author(s)
Ken Aho
References
Based on a figure from http://en.wikipedia.org/wiki/Correlation_and_dependence
see.exppower.tck
173
see.exppower.tck
Visualize exponential power functions
Description
Visualize exponential power functions, including a Gaussian distribution.
Usage
see.exppower.tck()
Details
The normal distribution and Gaussian distribution are based on an exponential power function:
f (x) = exp(−|x|m )
Letting m = 2 results in a Gaussian distribution. Standardizing this so that the area under the curve
= 1 results in the standard normal distribution.
Author(s)
Ken Aho
See Also
book.menu
see.HW
Visualize the Hardy Weinberg equlibrium
Description
Allows interactive depiction of the Hardy Weinberg equilibrium.
Usage
see.HW(parg)
see.HW.tck()
Arguments
parg
Proportion of the allele p in the population, i.e. a number between 0 and 1.
174
see.lmr.tck
Details
Solves and depicts the Hardy Weinberg equilibrium, i.e:
pp + 2pq + qq = 1
Author(s)
Ken Aho
see.lma.tck
ANOVA linear models
Description
Derives ANOVA linear model using matrix algebra
Usage
see.lma.tck()
Author(s)
Ken Aho
see.lmr.tck
Regression linear model derivation from linear algebra
Description
Given Y and X matrices a regression linear model is demonstrated using matrix algebra.
Usage
see.lmr.tck()
pm1(Y, X, sz=1, showXY = TRUE)
Arguments
Y
Response variable
X
Explanatory variables
sz
Text expansion factor
showXY
Logical, indicating whether or not X and Y matrices should be shown.
see.lmu.tck
175
Details
X requires a Y intercept variable X0 and at least one other variable.
Author(s)
Ken Aho
See Also
lm
see.lmu.tck
Unbalanced and balanced linear models
Description
The default design is balanced, as a result Type I = Type II = Type III SS. A student can then delete
one or more Y responses, and corresponding X responses to see create an unallanced design. Now
the types of SS will no longer be equal. Furthermore, the order that X1 and X2 are specified will
now matter in the case of Type I SS, although it will not matter for type II and III SS.
Usage
see.lmu.tck()
pm(Y, X1, X2, X1X2, change.order = FALSE, delete = 0)
Arguments
Y
Response variable.
X1
First column in design matrix with effect coding.
X2
Second column in design matrix.
X1X2
An interaction column. The product of design matrix columns one and two
change.order
A logical command specifying whether or not the order of X1 and X2 should
changed in the model specification.
delete
when delete != 0 an observation number to be deleted.
Author(s)
Ken Aho
See Also
lm
176
see.M
see.logic
Interactive worksheet for logical and fallacious arguments
Description
It is vital that scientists understand what logical and fallacious arguments are. This worksheet
provides a predagogical tool for logic.
Usage
see.logic()
Author(s)
Ken Aho
References
Salmon, W (1963) Logic. Prentice-Hall
See Also
book.menu
Examples
## Not run:
see.logic()
## End(Not run)
see.M
Visualization of the M-estimation function
Description
The function provides interactive visualization of robust M estimation of location.
Usage
see.M()
Details
The value c = 1.28 gives 95 percent efficiency of the mean given normality. The sample median
and mean can be considered special cases of M-estimators. The value c = 0 provides the sample
median, while the value, c = ∞ gives the sample mean.
see.mixedII
177
Author(s)
Ken Aho
References
Wilcox, R. R. (2005) Introduction to Robust Estimation and Hypothesis Testing, Second Edition.
Elsevier, Burlington, MA.
See Also
huber.mu, huber.NR
see.mixedII
Depiction of the effect of random level selection on inferences concerning fixed effects
Description
The levels for a fixed factor are shown in rows, while the columns are levels for a random factor.
Thus, the table depicts a mixed model. Assume that the values in the table are population means.
For instance, the true mean of random level R1 for the fixed level F1 is 1. Using information from
all random factor levels, the null hypothesis for the fixed factor is true. That is, µF 1 = µF 2 = µF 3 .
However when we select a subset of random levels, this is obscured. In fact, for any subset of
random factor levels it appears as if there is evidence against H0, i.e. there appears to be variability
among the fixed factor level means. Thus, to avoid inflation of type I error (rejection of a true
null hypothesis) we must consider the interaction of the random and fixed factors when considering
inference for the fixed factor level populations.
Usage
see.mixedII()
Author(s)
Ken Aho, thanks to Ernest Keeley
References
Maxwell, S. E., and H. D. Delaney (2003) Designing Experiments and Analyzing Data: A Model
Comparison Perspective, 2nd edition. Routledge Academic.
178
see.move
see.mnom.tck
Interactive depiction of the multinomial distribution
Description
tcltk GUI representation of the multinomial in a simple (binomial) context.
Usage
see.mnom.tck()
Author(s)
Ken Aho
see.move
Interactive visualization of least squares regression.
Description
Scatterplot points can be moved with see.move, while points can be added and deleted with
see.adddel. The function see.move is an appropriation from tcltk demos, with a few bells and
whistles added.
Usage
see.move()
see.adddel()
Author(s)
the R Development Core Team for see.move, Ken Aho for see.adddel.
see.nlm
see.nlm
179
Visualize important non-linear functions
Description
A number of important equation forms require that their parameters be estimated using the nonlinear least squares. Here are six.
Usage
see.nlm()
Author(s)
Ken Aho
References
Crawley, M. J. (2007) The R book. Wiley.
see.norm.tck
Visualize pdfs
Description
Interactive GUIs for visualizing how distributions change with changing values of pdf parameters,
e.g. µ and σ. The basic ideas here are lifted largely from a clever function from Greg Snow’s
package TeachingDemos. The functions see.pdfdriver.tck and see.pdfdriver are tcltk utility
functions.
Usage
see.norm.tck()
see.normcdf.tck()
see.beta.tck()
see.betacdf.tck()
see.bin.tck()
see.bincdf.tck()
see.chi.tck()
see.chicdf.tck()
see.exp.tck()
see.expcdf.tck()
see.F.tck()
see.Fcdf.tck()
see.gam.tck()
see.gamcdf.tck()
180
see.power
see.geo.tck()
see.geocdf.tck()
see.hyper.tck()
see.hypercdf.tck()
see.logis.tck()
see.logiscdf.tck()
see.nbin.tck()
see.nbincdf.tck()
see.lnorm.tck()
see.lnormcdf.tck()
see.pois.tck()
see.poiscdf.tck()
see.t.tck()
see.tcdf.tck()
see.unif.tck()
see.unifcdf.tck()
see.weib.tck()
see.weibcdf.tck()
see.pdfdriver.tck()
see.pdfdriver(pdf, show.cdf = TRUE)
Arguments
pdf
Name of probability density function
show.cdf
Logical, indicating whether or not the cumulative distribution function should
be shown.
Author(s)
Ken Aho
Examples
## Not run:
see.norm.tck()
## End(Not run)
see.power
Interactive depiction of type I and type II error and power
Description
Provides an interactive pedagogical display of power.
see.rEffect.tck
181
Usage
see.power(alpha = NULL, sigma = NULL, n = NULL, effect = NULL,
test = "lower", xlim = c(-3, 3), strict = FALSE)
see.power.tck()
Arguments
alpha
Type I error.
sigma
Standard deiviation of underlying population.
n
sample size
effect
Effect size
test
Type of test, one of c("lower","upper","two").
xlim
X-axis limits
strict
Causes the function to use a strict interpretation of power in a two-sided test. If
strict = TRUE then power for a two sided test will include the probability of
rejection in the opposite tail of the true effect. If strict = FALSE (the default)
power will be half the value of α if the true effect size is zero.
Details
The function see.power provides an interactive display of power. The function see.power.tck
provides a tcltk GUI to manipulate see.power
Author(s)
Ken Aho
see.rEffect.tck
Visualize random effects model
Description
An experiment to ascertain the effect of two randomly selected brands of soil fertilizer on wheat
yield. In the upper figure two brands of fertilizer (1 and 2) are randomly chosen from a population of
potential choices. The mean yields produced by the population of fertilizers E(Y|Ai) are normally
distributed. That is, it is possible to select a factor level that will result in very small average
yields, or one that will result in large average yields, but it is more likely that a chosen factor level
will produce some intermediate average effect. We proceed with the experiment by assigning two
experimental units (two wheat fields) to each fertilizer. We assume that the yield of fields is normally
distributed for each fertilizer, and furthermore that the factor levels are homoscedastic. We weigh
our evidence against the H0 of a non-zero population variance by estimating the variability among
factor levels. The more that yield varies with respect to nutrient treatments the more evidence we
will have against H0.
182
see.roc.tck
Usage
see.rEffect.tck()
Author(s)
Ken Aho
see.regression.tck
Demonstration of regression mechanics
Description
Population and sample regression lines are interactively depicted. The same random observations
generated by the true error distribution is used for both models.
Usage
see.regression.tck()
Author(s)
Ken Aho
see.roc.tck
Interactive depiction of ROC curves
Description
Sliders allow users to change distinctness of dichotomous classes (success and failure). This will
affect the ROC curve. One can also change the criteria defining what constitutes a success. While
this will not change the ROC curve (which compares true positive and false negative rates at all
possible success cutoff), it The will change empirical rates of true positives, true negatives, false
positives, and false negatives given the defined cutoff.
Usage
see.roc.tck()
Author(s)
Ken Aho, inspired by a graphical demo at http://www.anaesthetist.com/mnm/stats/roc/Findex.
htm
see.smooth.tck
see.smooth.tck
183
Interactive smoother demonstrations
Description
LOWESS, kernel, and spline smoothers are depicted, using tcltk widgets.
Usage
see.smooth.tck()
Author(s)
Ken Aho, appropriated ideas from demo in library tcltk.
See Also
loess, ksmooth, smooth.spline
see.ttest.tck
Visualize t-tests
Description
Interactive GUI for demonstrating t-tests
Usage
see.ttest.tck()
Author(s)
Ken Aho
184
selftest.se.tck1
see.typeI_II
Interactive depiction of type I and II error
Description
The function provides a tcltk driver illustrating type I, type II error, and power.
Usage
see.typeI_II()
Author(s)
Ken Aho
See Also
see.power,power.z.test
selftest.se.tck1
Interactive self-testing statistical questions
Description
These functions provide interactive multiple-choice questions.
Usage
selftest.se.tck1()
selftest.se.tck2()
selftest.conf.tck1()
selftest.conf.tck2()
selftest.pdfs.tck1()
selftest.pdfs.tck2()
selftest.pdfs.tck3()
selftest.prob.tck1()
selftest.prob.tck2()
selftest.prob.tck3()
selftest.sampd.tck1()
selftest.sampd.tck2()
selftest.stats.tck1()
selftest.stats.tck2()
Author(s)
Ken Aho
Semiconductor
Semiconductor
185
Split plot computer chip data from Littell et al. (2006).
Description
Littell et al. (2006) use the data here to introduce analysis of split plot designs using mixed models.
Twelve silicon wafers were randomly selected from a lot, and were randomly assigned to four
different processing modes. Resistance on the chips was measured in four different positions (four
different chips) on each wafer. Mode of processing and position of chips were fixed factors, while
wafer was a random effect. The experimental units with respect to process are the wafers. The
experimental units with respect to position are individual chips. Thus the wafer is the whole plot,
while the positions (chips) are split plot units
Usage
data(Semiconductor)
Format
The dataframe contains four columns:
Resistance The response variable of interest. Measured in ohms.
Process The explanatory variable of interest. The type of process used to create the computer
chips. A factor with 4 levels.
Wafer The whole plot containing four chips. There were four wafers tested, i.e. four levels,
1,2,3,4.
Chip Position on the wafer. These are split plots within the whole plots. Four levels: 1,2,3,4.
Source
Littell, R. C., Milliken, G. A., Stroup, W. W., Wolfinger, R. D., and O. Schabenberger (2006) SAS
for mixed models 2nd ed. SAS press.
shad
American gizzard shad data
Description
Hollander and Wolfe (1999) describe young of year lengths at four sites for American gizzard shad,
Dorosoma cepedianum, a fish of the herring family.
Usage
data(shad)
186
shade.norm
Format
A data frame with 40 observations on the following 2 variables.
length Fish length in cm
site a factor with levels I II III IV
Source
Hollander, M., and D. A. Wolfe (1999) Nonparametric Statistical Methods. New York: John Wiley
& Sons.
shade.norm
Shading functions for interpretation of pdf probabilities.
Description
Creates plots with lower, upper, two-tailed, and middle of the distribution shading for popular pdfs.
Usage
shade.norm(x = NULL, from = NULL, to = NULL, sigma = 1, mu = 0,
tail = "lower", show.p = TRUE, show.d = FALSE, show.dist = TRUE, digits = 5,
legend.cex = .9, shade.col="gray",...)
shade.t(x = NULL, from = NULL, to = NULL, nu = 3, tail = "lower",
show.p = TRUE, show.d = FALSE, show.dist = TRUE, digits = 5,legend.cex = .9,
shade.col="gray",...)
shade.F(x = NULL, from = NULL, to = NULL, nu1 = 1, nu2 = 5,
tail = "lower", show.p = TRUE, show.d = FALSE, show.dist = TRUE,
prob.to.each.tail = 0.025, digits = 5, legend.cex = .9,shade.col="gray",...)
shade.chi(x = NULL, from = NULL, to = NULL, nu = 1, tail = "lower",
show.p = TRUE, show.d = FALSE, show.dist = TRUE, prob.to.each.tail = 0.025,
digits = 5,legend.cex = .9,shade.col="gray",...)
shade.bin(x=NULL,from=NULL,to=NULL,n=1,p=0.5,tail="X=x",show.p=TRUE,
show.dist=TRUE, show.d=FALSE,legend.cex = .9,digits=5, ...)
shade.poi(x=NULL,from=NULL,to=NULL,lambda=5,tail="X=x",show.p=TRUE,
show.dist=TRUE, show.d=FALSE,legend.cex = .9,digits=5, ...)
shade.wei(x = NULL, from = NULL, to = NULL, theta = 1, beta = 1, tail = "lower",
show.p = TRUE, show.d = FALSE, show.dist = TRUE, prob.to.each.tail = 0.025,
digits = 5, legend.cex = 0.9, shade.col = "gray", ...)
shade.norm
187
Arguments
x
A quantile, i.e. X = x, or if tail = "two.custom" ins shade.norm, a two
element vector specifying the upper bound of the lower tail and the lower bound
of the upper tail.
from
To be used with tail = "middle"; the value a in P (a < X < b).
to
To be used with tail = "middle"; the value b in P (a < X < b).
sigma
Standard deviation for the nomral distribution.
mu
Mean of the normal distribution.
tail
One of four possibilities: "lower" provides lower tail shading, "upper" provides upper tail shading, "two" provides two tail shading, and "middle" provide shading in the middle of the pdf, between "from" and "to". The additional
option "two.custom" is allowed for shade.norm. This allows calculation of
assymetric two tailed probabilities. It requires that the argument x is a two element vector with elements denoting the upper bound of the lower tail and the
lower bound of the upper tail. For discrete pdfs (binomial and Poisson) the possibility "X=x" is also allowed, and will be equivalent to the density. Two tailed
probability is not implemented for shade.poi.
show.p
Logical; indicating whether probabilities are to be shown.
show.d
Logical; indicating whether densities are to be shown.
show.dist
Logical; indicating whether parameters for the distribution are to be shown.
nu
Degrees of freedom.
nu1
Numerator degrees of freedom for the F-distribution.
nu2
Denominator degrees of freedom for the F-distribution.
prob.to.each.tail
Probability to be apportioned to each tail in the F and Chi-square distributions
if tail = "two".
digits
Number of digits to be reported in probsabilities and densities.
n
The number of trials for the binomial pdf.
p
The binomial probability of success.
lambda
The Poisson parameter (i.e. rate).
legend.cex
Character expansion for legends in plots.
shade.col
Color of probability shading.
theta
Pdf parameter.
beta
Pdf parameter.
...
Additional arguments to plot.
Value
Returns a plot with the requested pdf and probability shading.
Note
Lower-tailed chi-squared probabilities are not plotted correctly for df < 3.
188
shade.norm.tck
Author(s)
Ken Aho
Examples
## Not run:
##normal
shade.norm(x=1.2,sigma=1,mu=0,tail="lower")
shade.norm(x=1.2,sigma=1,mu=0,tail="upper")
shade.norm(x=1.2,sigma=1,mu=0,tail="two")
shade.norm(from=-.4,to=0,sigma=1,mu=0,tail="middle")
shade.norm(from=0,to=0,sigma=1,mu=0,tail="middle")
shade.norm(x=c(-0.2, 2),sigma=1,mu=0,tail="two.custom")
##t
shade.t(x=-1,nu=5,tail="lower")
shade.t(x=-1,nu=5,tail="upper")
shade.t(x=-1,nu=5,tail="two")
shade.t(from=.5,to=.7,nu=5,tail="middle")
##F
shade.F(x=2,nu1=15,nu2=8,tail="lower")
shade.F(x=2,nu1=15,nu2=8,tail="upper")
shade.F(nu1=15,nu2=8,tail="two",prob.to.each.tail=0.025)
shade.F(from=.5,to=.7,nu1=15,nu2=10,tail="middle")
##Chi.sq
shade.chi(x=2,nu=5,tail="lower")
shade.chi(x=2,nu=5,tail="upper")
shade.chi(nu=7,tail="two",prob.to.each.tail=0.025)
shade.chi(from=.5,to=.7,nu=5,tail="middle")
##binomial
shade.bin(x=5,n=20,tail="X=x",show.d=TRUE)
shade.bin(x=5,n=20,tail="lower")
shade.bin(x=5,n=20,tail="two")
shade.bin(from=8,to=12,n=20,tail="middle")
##Poisson
shade.poi(x=5,lambda=6,tail="X=x",show.d=TRUE)
shade.poi(x=5,lambda=7,tail="lower")
shade.poi(x=5,lambda=8,tail="upper")
shade.poi(from=8,to=12,lambda=7,tail="middle")
## End(Not run)
shade.norm.tck
GUI display of probability
skew
189
Description
Provides tcltk GUIs to manage asbio shade functions.
Usage
shade.bin.tck()
shade.chi.tck()
shade.F.tck()
shade.norm.tck()
shade.poi.tck()
shade.t.tck()
Author(s)
Ken Aho
See Also
shade
skew
Sample skewness and kurtosis
Description
Functions for skewness and kurtosis.
Usage
skew(x,method="unbiased")
kurt(x,method="unbiased")
Arguments
x
A vector of quantitative data.
method
The type of method used for computation of skew and kurtosis. Two choices
are possible for skewness: "moments" and "unbiased", and three choices are
possible for kurtosis: "unbiased", "moments", and "excess".
190
SM.temp.moist
Details
Aside from centrality and variability we can describe distributions with respect to their shape. Two
important shape descriptors are skewness and kurtosis. Skewness describes the relative density in
the tails of a distribution while kurtosis describes the peakedness of a distribution. When quantified
for a population skewness and kurtosis are denoted as γ1 and γ2 respectively. For a symmetric
distribution skewness will equal zero; i.e. γ1 = 0. A distribution with more density in its right-hand
tail will have γ1 > 0, while one with more density in its left-hand tail will have γ1 < 0. These
distributions are often referred to as positively-skewed and negatively-skewed respectively. If a
distribution is normally peaked (mesokurtic) then γ2 = 3. As a result the number three is generally
subtracted from kurtosis estimates so that a normal distribution will have γ2 = 0 . Thus strongly
peaked (leptokurtotic) distributions will have γ2 > 0, while flat-looking (platykurtotic) distributions
will have a kurtosis γ2 < 0.
Several types of skewness and kurtosis estimation are possible.
For method of moments estimation let:
mi = (1/n)
X
¯ i,
Xi − X
i
3/2
then the method of moments skewness is: m3 /m2 , the method of moments kurtosis is: m4 /m22 ,
and the excess method of moments kurtosis is m4 /m22 − 3.
These estimators are biased low, particularly given small sample sizes. A more complex estimator
is required to account for this bias. This is provided by method = "unbiased" in skew and kurt.
Value
Output will be the sample skewness or kurtosis.
Author(s)
Ken Aho
Examples
exp<-rexp(10000)
skew(exp)
kurt(exp)
SM.temp.moist
Alpine soil temperature and moisture time series
Description
Soil temperature and water availabilty from Mt. Washburn in Yellowstone National Park. Data were
taken at depth of 5cm from a late snowmelt site at UTM 4960736.977 544792.225 zone 12T NAD
83, elevation 3070m.
snore
191
Usage
data(SM.temp.moist)
Format
A data frame with 30 observations on the following 4 variables.
year A numeric vector describing year.
day The "day of year", whereby Jan 1 = day 1 and Dec 32 = day 365 (366 for leap years).
Temp_C Temperature in degrees celsius.
Moisture Soil water availability sensor reading. A reading of 35 is approximately equal to -1.5
MPa.
Source
Aho, K. (2006) Alpine ecology and subalpine cliff ecology in the Northern Rocky Mountains.
Doctoral dissertation, Montana State University, 458 pgs.
snore
Snoring and heart disease contingency data
Description
Norton and Dunn (1985) compiled data from four family practice clinics in Toronto to quantify the
association between snoring and heart disease for 2484 subjects.
Usage
data(snore)
Format
A data frame with 2484 observations on the following 3 variables.
snoring A factor with levels every.night nearly.ever.night never occasional
ord.snoring Agresti (21012) transformed the explanatory levels to ordinal values in his analysis
of this data.
disease Presence/absence of heart disease
Source
Norton, P. G., and E. V. Dunn (1985) Snoring as a risk factor for disease: an epidemiological survey.
British Medical Journal 291: 630-632.
192
stan.error
so2.us.cities
SO2 data for 32 US cities with respect to 6 explanatory variables
Description
Of concern for public health officials and biologists are models of air pollution as a function of
environmental characteristics. Using a meta-analysis of government publications Sokal and Rolf
(1995) compiled an interesting dataset which investigates air pollution (measured as annual mean
SO2 concentration per m3 ) as a function of six environmental variables for 32 cities in the United
States. Whenever the data were available they are based on averages of three years 1969, 1970, and
1971.
Usage
data(so2.us.cities)
Format
The dataset contains 8 variables:
City US city.
Y Average annual SO2 concentration per m3 .
X1 Average annual temperature (degrees Celsius).
X2 Number of industrial companies with more than 20 employees.
X3 Population size (1970 census) in thousands.
X4 Average Annual average wind speed.
X5 Average Annual precipitation (cm).
X6 Average number of days with precipitation.
Source
Sokal, R. R., and F. J. Rohlf (2012) Biometry, 4th ed. Freeman.
stan.error
Variance and standard error estimators for the sampling distribution
of the sample mean
Description
2
Estimator for the variance for the sampling distribution
p of the sample mean, i.e. S /n, and the
standard deviation of the sampling distribution, i.e. S/ (n).
starkey
193
Usage
stan.error(x)
stan.error.sq(x)
Arguments
x
A vector of quantitative data.
Author(s)
Ken Aho
See Also
sd
starkey
DEM data from the Starkey experimental forest in NE Oregon.
Description
UTM northing and easting data along with 18 other environmental variables describing the Starkey
experimental forest.
Usage
data(starkey)
Source
www.fs.fed.us/pnw/starkey/data/tables/Starkey_OR_Main_Habitat_1993-1996_Data.txt
trag
Salsify height dataset
Description
Heights of slasify Tragapogon dubius at the Barton Road long term experiental site in Pocatello
Idaho.
Usage
data(trag)
Format
A data frame with 20 observations on the following variable.
height T. dubius plant height in cm
194
transM
transM
Transition matrix analysis
Description
Creates a plot showing expected numbers of individuals in specified age classes or life stages given
survivorship probabilities from a transition matrix (cf. Caswell 2000). The function anm.transM
provides an animated view of the population growth curves. The function anm.TM.tck provides a
tcltk GUI to run anm.TM.tck.
Usage
transM(A, init, inter = 100, stage.names = c("All grps",1:(ncol(A))),
leg.room = 1.5, ...)
anm.transM(A,init,inter=100,stage.names =c("All grps",1:(ncol(A))),
leg.room = 1.5, anim.interval=0.1,...)
anm.TM.tck()
Arguments
A
Transition matrix containing survivorship probabilities and fecundities see Caswell
(2000).
init
A numeric vector containing initial numbers in each age class of interest.
inter
Number of time intervals for which population numbers are to be calculated.
stage.names
A character vector giving life stage names.
leg.room
A Y-axis multiplier intended to create room for a legend.
anim.interval
Speed of animation in frames per second.
...
Additional arguments for plot
Value
Returns a plot and proportions of the population in each age class for the number of time intervals
in inter.
Author(s)
Ken Aho
References
Caswell, H (2000) Matrix Population Models: Construction, Analysis and Interpretation, 2nd Edition. Sinauer Associates, Sunderland, Massachusetts.
Gurevitch, J., Scheiner, S. M., and G. A. Fox (2006) The Ecology of Plants. Sinauer.
trim.me
195
Examples
#Endangered cactus data data from Gurevitch et al. (2006)
A<-matrix(nrow=3,ncol=3,data=c(.672,0,.561,0.018,0.849,0,0,0.138,0.969),
byrow=TRUE)
init<-c(10,2,1)
transM(A,init,inter=100,stage.names=c("All","Sm. Juv.","Lg. Juv.","Adults"),
xlab="Years from present",ylab="n")
#animated version
## Not run:
anm.transM(A,init,inter=100,stage.names=c("All","Sm. Juv.","Lg. Juv.","Adults"),
xlab="Years from present",ylab="n")
## End(Not run)
trim.me
Trim data
Description
Trims observations above and below the central (1 − 2λ) part of an an ordered vector of data.
Usage
trim.me(Y, trim = 0.2)
Arguments
Y
A vector of quantitative data.
trim
Proportion (0-1) to be trimmed from each tail of an ordered version of Y.
Value
Returns a trimmed data vector.
Author(s)
Ken Aho
Examples
x<-c(2,1,4,5,6,2.4,7,2.2,.002,15,17,.001)
trim.me(x)
196
trim.ranef.test
trim.ranef.test
Robust test for random factors using trimmed means.
Description
Provides a robust hypothesis test for the null: Var(X) = 0, for a population of random factor levels.
Usage
trim.ranef.test(Y, X, tr = 0.2)
Arguments
Y
Vector of response data. A quantitative vector.
X
Vector of factor levels
tr
Amount of trimming. A number from 0-0.5.
Details
Robust analyses for random effect designs are particularly important since standard random effects
models provide poor control over type I error when assumptions of normality and homoscedasticity
are violated. Specifically, Wilcox (1994) showed that even with equal sample sizes, and moderately
large samples, actual probability of type I error can exceed 0.3 if normality and homoscedasticity
are violated.
Value
Returns a list with three components dataframe describing numerator and denominator degrees of
freedom, the F test statistic and the p-value.
Note
code based on Wilcox (2005)
Author(s)
Ken Aho
References
Wilcox, R. R. (2005) Introduction to Robust Estimation and Hypothesis Testing, Second Edition.
Elsevier, Burlington, MA.
Examples
rye<-c(50,49.8,52.3,44.5,62.3,74.8,72.5,80.2,47.6,39.5,47.7,50.7)
nutrient<-factor(c(rep(1,4),rep(2,4),rep(3,4)))
trim.ranef.test(rye,nutrient,tr=.2)
trim.test
trim.test
197
Robust one way trimmed means test.
Description
A robust heteroscedastic procedure using trimmed means.
Usage
trim.test(Y, X, tr = 0.2)
Arguments
Y
A vector of responses. A quantitative vector
X
A vector of factor levels.
tr
The degree of trimming. A value from 0-0.5.
Details
The method utilized here is based on the simple idea of replacing means with trimmed means and
standard error estimates, based on all the data, with the standard error of the trimmed mean (Wilcox
2005). The method has the additional benefit of being resistant to heteroscedasticity due to the use
of the Welch method for calculating degrees of freedom. With no trimming the degrees of freedom
reduce to those of the one way Welch procedure in oneway.test.
Value
Returns a dataframe with numerator and denominator degrees of freedom, a test statistic, and a
p-value based on the F-distribution.
Note
code based on Wilcox (2005)
Author(s)
Ken Aho
References
Wilcox, R. R. (2005) Introduction to Robust Estimation and Hypothesis Testing, Second Edition.
Elsevier, Burlington, MA.
See Also
oneway.test
198
tukey.add.test
Examples
rye<-c(50,49.8,52.3,44.5,62.3,74.8,72.5,80.2,47.6,39.5,47.7,50.7)
nutrient<-factor(c(rep(1,4),rep(2,4),rep(3,4)))
trim.test(rye,nutrient,tr=.2)
tukey.add.test
Tukey’s test of additivity.
Description
With an RBD we are testing the null hypothesis that there is no treatment effect in any block. As a
result randomized block designs including RBDs, Latin Squares, and spherical repeated measures
assume that there is no interaction effect between blocks and main factors (i.e. main effects and
block are additive). We can test this assumption with the Tukey’s test for additivity. We address the
following hypotheses:
H0 : Main effects and blocks are additive, versus HA : Main effects and blocks are non-additive.
Usage
tukey.add.test(y, A, B)
Arguments
y
Response variable. Vector of quantitative data.
A
Main effects. Generally a vector of categorical data.
B
Blocking variable. A vector of categories (blocks).
Details
Tukey’s test for additivity is best for detecting simple block x treatment interactions; for instance,
when lines in an interaction plot cross. As a result interaction plots should be used for diagnosis
of other types of interactions. A high probability of type II error results from the inability Tukey’s
additivity test to detect complex interactions (Kirk 1995). As a result a conservative value of should
be used, i.e. 0.1 - 0.25.
Value
Returns a table with test results.
Author(s)
Orginal author unknown. Modified by K. Aho
veneer
199
References
Kutner, M. H., Nachtsheim, C. J., Neter, J., and W. Li. (2005) Applied linear statistical models, 5th
edition. McGraw-Hill, Boston.
Kirk, R. E. 1995. Experimental design. Brooks/Cole. Pacific Grove, CA.
Examples
treatment<-as.factor(c(36,54,72,108,144,36,54,72,108,144,36,54,72,108,144))
block<-as.factor(c(rep(1,5),rep(2,5),rep(3,5)))
strength<-c(7.62,8.14,7.76,7.17,7.46,8,8.15,7.73,7.57,7.68, 7.93,7.87,7.74, 7.8,7.21)
tukey.add.test(strength,treatment,block)
veneer
Veneer data from Littell et al. (2002)
Description
Four examples of each of five brands of a synthetic wool veneer material were subjected to a friction
test, and a measure of wear was determined for each experimental unit.
Usage
data(veneer)
Format
A data frame with 20 observations on the following 2 variables.
wear a numeric vector
brand a factor with levels ACME AJAX CHAMP TUFFY XTRA
Source
Littell, R. C., Stroup, W. W., and R. J. Fruend (2002) SAS for linear models. John Wiley and
Associates.
200
Venn
Venn
Venn probability diagrams for an event with two outcomes
Description
The user specifies the probabilities of two outcomes, and if applicable, their intersection. A Venn
diagram is returned. The universe, S, will generally not have unit area, but in many applications
will be a good approximation. The area of the intersection will also be an approximation.
Usage
Venn(A, B, AandB = 0, labA = "A", labB = "B", cex.text = .95, ...)
Venn.tck()
Arguments
A
probability of event A
B
probability of event B
AandB
probability of the intersection of A and B
labA
Label assigned to event A in the diagram
labB
Label assigned to event B in the diagram
cex.text
Character expansion for text.
...
Additional arguments from plot
Value
A Venn diagram is returned.
Author(s)
K. Aho
References
Bain, L. J., and M. Engelhardt (1992) Introduction to probability and mathematical statistics.
Duxbury press. Belmont, CA, USA.
Examples
Venn(A=.3,B=.2,AandB=.06)
vs
201
vs
Scandinavian site by species community matrix
Description
Scandinavian, lichen, bryophyte, and vascular plant data from Vare et al. (1995).
Usage
data(vs)
Format
A data frame with 24 observations (sites) on 44 variables (species).
Details
Lifted from dataframe varespec in package vegan.
Source
varespec
References
Vare, H., Ohtonen, R., and J. Oksanen (1995) Effects of reindeer grazing on understory vegetation
in dry Pinus sylvestris forests. Journal of Vegetation Science 6: 523-530.
wash.rich
Species richness and environmental variables from Mt Washburn
Description
Aho and Weaver (2010) examined the effect of environmental characteristics on alpine vascular
plant species richness on Mount Washburn (3124m) a volcanic peak in north-central Yellowstone
National Park.
Usage
data(wash.rich)
202
webs
Format
A data frame with 40 observations on the following 7 variables.
site Site identifier.
Y Species richness.
X1 Percent Kjeldahl (total) soil N.
X2 Slope in degrees.
X3 Aspect in degrees from true north.
X4 Percent cover of surface rock.
X5 Soil pH.
Source
Aho, K., and T. Weaver (2010) Ecology of alpine nodes: environments, communities, and ecosystem evolution (Mount Washburn; Yellowstone Natl. Park). Arctic, Antarctic, and Alpine Research.
40(2): 139-151.
webs
Spider web length data
Description
Gosline et al. (1984) applied heat to strands of spider web to determine whether the structure
underlying webs was rubber-like. Data are estimated from a scatterplot in Gosline et al..
Usage
data(webs)
Format
The dataframe contains 4 columns
obs Observation number.
relative length Relative strand strand length after heat application.
temp.C Temp in degrees celsius.
residuals Residuals from the linear model length~temp.C.
Source
Gosline, J. M., Denny, M. W. and Demont, M. E. (1984). Spider silk as rubber. Nature 309, 551552.
wheat
wheat
203
Agricultural randomized block design
Description
Allard (1966) sought to quantify variation in the yield in wheat grasses. Five wheat crosses were
selected from a breeding program and were grown at four randomly selected locations where the
wheat would be grown commercially. At each location crosses (families) were randomly assigned to
particular sections of fields, i.e. at each location a one way randomized block design was conducted.
Usage
data(wheat)
Format
The dataframe has four columns:
yield Refers to wheat yield.
loc Refers to randomly selected locations where wheat were grown commercially. A factor with
four levels: 1,2,3,4.
block Refers to the replicate block within location. A factor with four levels: 1,2,3,4. Within
each block five wheat crosses were randomly assigned and grown.
cross Refers to wheat crosses. A factor with five levels: 1,2,3,4,5.
Source
Littell, R. C., Milliken, G. A., Stroup, W. W., Wolfinger, R. D., and O. Schabenberger (2006) SAS
for mixed models 2nd ed. SAS press.
whickham
Whickham contingency table data for smokers and survivorship
Description
Appleton et al. (1996) summarized a study from the Whickham district of England to quantify the
association of smoking, age, and death. 1314 women were interviewed in early 1970s with respect
to their smoking habits. Twenty years later the women were relocated and classified with respect
to survival at the time of the follow up yes or no, whether they smoked at the time of the original
interview yes or no, and age at the time of the original study 1 = 18-24, 2 = 35-64, 3 = >65.
Usage
data(whickham)
204
wildebeest
Format
A data frame with 12 observations on the following 4 variables.
age A factor with levels 1 2 3.
survival A factor with levels N Y.
smoke A factor with levels N Y.
count Cross-classification count.
Source
Appleton, D. R., French, J. M., Vanderpump, M. P. J. (1996) Ignoring a covariate: AN example of
Simpson’s paradox. The American Statstician 50(4): 340-341.
wildebeest
Wildebeest carcass categorical data
Description
To test the "predation-sensitive food" hypothesis, which predicts that both food and predation limit
prey populations, Sinclair and Arcese (1995) examined wildebeest (Connochaetes taurinus) carcasses in the Serengeti. The degree of malnutrition in animals was measured by marrow content
since marrow will contain the last fat reserves in ungulates. Carcasses were cross-classified with
respect to three categorical variables: sex (M, F), cause of death (predation, non-predation), and
marrow type (SWF = Solid White Fatty, indicating healthy animals, OG = Opaque Gelatinous,
indicating malnourishment, and TG = Translucent Gelatinous, the latter indicating severe malnourishment).
Usage
data(wildebeest)
Format
A data frame with 12 observations on the following 4 variables.
marrow A factor with levels OG SWF TG.
sex A factor with levels F M.
predation A factor with levels N P.
count Count in each cell
Source
Sinclair, A. R. E., and P. Arcese (1995) Population consequences of predation-sensitive foraging:
the Serengeti wildebeest. Ecology 76(3): 882-891.
win
205
win
Winsorize data
Description
Winsorizes the proportion of ordered data given by lambda from each tail.
Usage
win(x, lambda = 0.2)
Arguments
x
A vector of data.
lambda
A proportion from 0-1 giving the amount of data to be Winsorized in each tail
of an ordered dataset.
Details
In Winsorization we we replace responses that are not in the central 1−2λ part of an ordered sample
with the minimum and maximum responses of the central part of the sample.
Value
Returns Winsorized data.
Author(s)
Ken Aho
References
Wilcox, R. R. (2005) Introduction to Robust Estimation and Hypothesis Testing, Second Edition.
Elsevier, Burlington, MA.
Examples
x<-c(2,1,4,5,6,2.4,7,2.2,.002,15,17,.001)
win(x)
206
world.co2
world.co2
World CO2 levels, by country, from 1980 to 2006
Description
The US department of energy has compiled data since 1980 detailing total carbon dioxide emissions
from the consumption and flaring of fossil fuels (in millions of metric tons of carbon dioxide). Data
can be broken down by country.
Usage
data(world.co2)
Format
The dataframe contains 16 columns
Year The year of CO2 measure (1980-2006).
Afghanistan CO2 emissions in Afghanistan from 1980-2006 (1x10⁶ metric tons).
Belgium CO2 emissions in Belgium...
Brazil CO2 emissions in Brazil...
Canada CO2 emissions in Canada...
China CO2 emissions in China...
Finland CO2 emissions in Finland...
Ghana CO2 emissions in Ghana...
Italy CO2 emissions in Italy...
Japan CO2 emissions in Japan...
Kenya CO2 emissions in Kenya...
Mexico CO2 emissions in Mexico...
Saudi.Arabia CO2 emissions in Saudi Arabia...
United.Arab.Emirates CO2 emissions in the United Arab Emirates..
United.States CO2 emissions in United States...
World.Total CO2 emissions totals for the world...
Source
US Department of energy; www.eia.doe.gov/emeu/iea/
world.pop
world.pop
207
Population levels in various countries since 1980
Description
Population levels of 13 countries since 1980. Population numbers are rounded to the nearest
100,000.
Usage
data(world.pop)
Format
The dataframe contains 14 columns
Year The year of population measurements (1980-2006)
Afghanistan Population in Afghanistan from 1980-2006, rounded to the nearest 100,000.
Brazil Population in Brazil...
Canada Population in Canada...
China Population in China...
Finland Population in Finland...
Italy Population in Italy...
Japan Population in Japan...
Kenya Population in Kenya...
Mexico Population in Mexico...
Saudi.Arabia Population in Saudi Arabia...
United.Arab.Emirates Population in the United Arab Emirates...
United.States Population in United States...
World.Total Population totals for the world...
Source
US census bureau; http://www.census.gov/ipc/www/idb/idbsprd.html
Index
fruit, 92
garments, 94
Glucose2, 94
goats, 95
grass, 96
heart, 97
ipomopsis, 102
K, 104
larrea, 108
life.exp, 108
magnets, 112
montane.island, 119
moose.sel, 120
mosquito, 121
myeloma, 122
PCB, 136
pika, 138
plantTraits, 139
PM2.5, 145
polyamine, 145
portneuf, 146
potash, 147
potato, 147
prostate, 152
rat, 162
refinery, 163
sc.twin, 169
sedum.ts, 170
Semiconductor, 185
shad, 185
SM.temp.moist, 190
snore, 191
so2.us.cities, 192
starkey, 193
trag, 193
veneer, 199
vs, 201
wash.rich, 201
webs, 202
∗Topic datasets
agrostis, 6
aids, 6
alfalfa.split.plot, 7
anolis, 28
anscombe, 28
ant.dew, 30
asthma, 31
baby.walk, 33
bats, 34
BCI.count, 36
BCI.plant, 37
bear, 39
beetle, 40
bombus, 41
bone, 42
bromus, 49
C.isotope, 53
caribou, 55
chronic, 57
cliff.env, 74
cliff.sp, 74
corn, 76
crab.weight, 77
crabs, 77
cuckoo, 78
death.penalty, 79
deer, 80
deer.296, 81
depression, 81
dO2, 83
drugs, 84
e.cancer, 85
enzyme, 86
exercise.repeated, 88
Fbird, 89
fire, 89
fly.sex, 90
frog, 91
208
INDEX
wheat, 203
whickham, 203
wildebeest, 204
world.co2, 206
world.pop, 207
∗Topic design
anm.ExpDesign, 13
anm.samp.design, 27
∗Topic graphs
anm.ci, 9
anm.coin, 10
anm.cont.pdf, 11
anm.die, 12
anm.ExpDesign, 13
anm.geo.growth, 16
anm.loglik, 18
anm.ls, 21
anm.ls.reg, 22
anm.LV, 23
anm.mc.bvn, 25
anm.samp.design, 27
Bayes.disc, 34
book.menu, 42
bplot, 47
bv.boxplot, 50
bvn.plot, 53
chi.plot, 55
illusions, 102
paik, 126
panel.cor.res, 133
partial.resid.plot, 135
plot.pairw, 141
plotAncova, 142
plotCI.reg, 143
Preston.dist, 150
r.dist, 159
R.hat, 160
samp.dist, 164
samp.dist.mech, 168
see.accPrec.tck, 171
see.ancova.tck, 171
see.anova.tck, 172
see.cor.range.tck, 172
see.exppower.tck, 173
see.HW, 173
see.lma.tck, 174
see.lmr.tck, 174
see.lmu.tck, 175
209
see.logic, 176
see.M, 176
see.mixedII, 177
see.mnom.tck, 178
see.move, 178
see.nlm, 179
see.norm.tck, 179
see.power, 180
see.rEffect.tck, 181
see.regression.tck, 182
see.roc.tck, 182
see.smooth.tck, 183
see.ttest.tck, 183
see.typeI_II, 184
shade.norm, 186
shade.norm.tck, 188
transM, 194
Venn, 200
∗Topic htest
AP.test, 30
BDM.test, 38
boot.ci.M, 43
ci.mu.oneside, 60
ci.mu.z, 61
ci.p, 62
ci.sigma, 70
ci.strat, 71
DH.test, 82
eff.rbd, 85
g.test, 93
joint.ci.bonf, 103
km, 106
Kullback, 107
MC.test, 113
modlevene.test, 118
MS.test, 121
one.sample.t, 124
one.sample.z, 125
pairw.anova, 127
pairw.fried, 130
pairw.kw, 132
panel.cor.res, 133
perm.fact.test, 137
plot.pairw, 141
plotCI.reg, 143
r.pb, 161
trim.ranef.test, 196
trim.test, 197
210
tukey.add.test, 198
∗Topic manip
boot.ci.M, 43
bootstrap, 44
ci.boot, 58
MC, 112
pseudo.v, 155
∗Topic multivariate
bv.boxplot, 50
chi.plot, 55
D.sq, 78
DH.test, 82
Kappa, 105
Kullback, 107
∗Topic univar
anm.loglik, 18
AP.test, 30
BDM.test, 38
boot.ci.M, 43
ci.median, 59
ci.mu.oneside, 60
ci.mu.z, 61
ci.p, 62
ci.sigma, 70
ci.strat, 71
joint.ci.bonf, 103
km, 106
lm.select, 109
loess.surf, 110
MC.test, 113
modlevene.test, 118
MS.test, 121
one.sample.t, 124
one.sample.z, 125
pairw.anova, 127
pairw.fried, 130
pairw.kw, 132
partial.resid.plot, 135
perm.fact.test, 137
plotCI.reg, 143
press, 149
r.bw, 158
r.pb, 161
shade.norm, 186
skew, 189
stan.error, 192
trim.ranef.test, 196
trim.test, 197
INDEX
tukey.add.test, 198
agrostis, 6
AIC, 110
aids, 6
alfalfa.split.plot, 7
alpha.div, 8
anm.ci, 9, 42, 43
anm.coin, 10, 12, 43
anm.cont.pdf, 11
anm.die, 12, 43
anm.exp.growth, 43
anm.exp.growth (anm.geo.growth), 16
anm.ExpDesign, 13
anm.geo.growth, 16, 43
anm.log.growth, 43
anm.log.growth (anm.geo.growth), 16
anm.loglik, 18, 42, 43
anm.ls, 21, 23, 43
anm.ls.reg, 22, 43
anm.LV, 23
anm.LVc.tck (anm.LV), 23
anm.LVcomp, 17, 43
anm.LVcomp (anm.LV), 23
anm.LVe.tck (anm.LV), 23
anm.LVexp, 17, 43
anm.LVexp (anm.LV), 23
anm.mc.bvn, 25
anm.mc.norm (anm.mc.bvn), 25
anm.samp.design, 27
anm.TM.tck (transM), 194
anm.transM, 43
anm.transM (transM), 194
anolis, 28
anscombe, 28
ant.dew, 30
AP.test, 30
asthma, 31
auc, 32
baby.walk, 33
barplot, 48, 49, 141
bats, 34
Bayes.disc, 34
bayes.lm, 35
BCI.count, 36
BCI.plant, 37
BDM.2way (BDM.test), 38
BDM.test, 38
INDEX
bear, 39
beetle, 40
bighorn.sel (moose.sel), 120
bighornAZ.sel (moose.sel), 120
bin2dec, 41
bombus, 41
bone, 42
bonf.cont (pairw.anova), 127
bonfCI (pairw.anova), 127
book.menu, 42, 173, 176
boot, 44, 45, 58, 156
boot.ci.M, 43
bootstrap, 44, 44, 48, 58, 156
bound.angle, 46, 124, 153, 154
boxplot, 52
bplot, 47, 141
bromus, 49
bv.boxplot, 50, 57, 83
bvn.plot, 53
C.isotope, 53
caribou, 55
chi.plot, 55
chronic, 57
ci.boot, 44, 45, 58, 68, 69
ci.median, 10, 59
ci.mu.oneside, 60
ci.mu.t, 10, 61
ci.mu.t (ci.mu.z), 61
ci.mu.z, 10, 61, 65, 71, 73
ci.p, 10, 62, 67, 70
ci.prat, 65, 70
ci.prat.ak, 67, 68
ci.sigma, 10, 70
ci.strat, 71
cliff.env, 74
cliff.sp, 74
ConDis.matrix, 75
confint, 104
cor, 76, 133–135, 150, 158, 159
cor.test, 134
corn, 76
corr, 162
crab.weight, 77
crabs, 77
cuckoo, 78
D.sq, 78
dbinom, 20
211
death.penalty, 79
deer, 80
deer.296, 81
depression, 81
dexp, 20
DH.test, 82
dirty.dist (samp.dist), 164
dnbinom, 117
dnorm, 20, 151
dO2, 83
dpois, 20
drugs, 84
dunnettCI (pairw.anova), 127
e.cancer, 85
eff.rbd, 85
elk.sel (moose.sel), 120
empinf, 156
envelope, 157
enzyme, 86
ES.May, 87
exercise.repeated, 88
ExpDesign (anm.ExpDesign), 13
Fbird, 89
fire, 89
fligner.test, 119
fly.sex, 90
FR.multi.comp (pairw.fried), 130
friedman.test, 31, 122, 131
frog, 91
fruit, 92
G.mean, 92, 97, 98
g.test, 93
garments, 94
Glucose2, 94
goat.sel (moose.sel), 120
goats, 95
grass, 96
gray, 166
H.mean, 93, 96, 98, 118
heart, 97
heat.colors, 166
HL.mean, 93, 97, 98, 118
huber.mu, 99, 100, 101, 118, 177
huber.NR, 99, 100, 101, 177
huber.one.step, 99, 100, 101
212
illusions, 102
ipomopsis, 102
IQR, 48
joint.ci.bonf, 103
juniper.sel (moose.sel), 120
K, 104
Kappa, 105
km, 106
kruskal.test, 39
ksmooth, 183
Kullback, 107
kurt (skew), 189
KW.multi.comp (pairw.kw), 132
larrea, 108
legend, 143
life.exp, 108
lm, 103, 135, 142, 143, 175
lm.select, 109
loess, 110, 111, 183
loess.surf, 110
loglik.binom.plot (anm.loglik), 18
loglik.custom.plot (anm.loglik), 18
loglik.exp.plot (anm.loglik), 18
loglik.norm.plot (anm.loglik), 18
loglik.plot, 22, 23
loglik.plot (anm.loglik), 18
loglik.pois.plot (anm.loglik), 18
lowess, 135
lsdCI (pairw.anova), 127
mad, 99–101
magnets, 112
mahalanobis, 79
mat.pow (MC), 112
MC, 112
MC.test, 113, 137, 138
mcmc.norm.hier, 36, 115
mean, 118, 165
median, 59, 118, 165
ML.k, 116
Mode, 117
modlevene.test, 118
montane.island, 119
moose.sel, 120
mosquito, 121
MS.test, 31, 121
INDEX
multcompLetters, 141
myeloma, 122
near.bound, 46, 123, 153, 154
nls, 151
norm.hier.summary (mcmc.norm.hier), 115
one.sample.t, 124
one.sample.z, 125
oneway.test, 197
outer, 129
p.adjust, 104
paik, 126
pairw.anova, 49, 127, 132, 141
pairw.fried, 49, 130, 132, 141
pairw.kw, 49, 132, 141
panel.cor.res, 133
panel.lm (panel.cor.res), 133
panel.smooth, 133, 134
par, 141
partial.R2, 134, 136
partial.resid.plot, 135, 135
PCB, 136
perm.fact.test, 137
persp, 111
pika, 138
plantTraits, 139
plot, 9, 11, 13, 16, 19, 21, 22, 24, 26, 35, 56,
106, 111, 127, 135, 143, 144, 151,
157, 187, 194, 200
plot.histogram, 166
plot.pairw, 129, 131, 132, 141
plotAncova, 142
plotCI.reg, 143
pm (see.lmu.tck), 175
pm1 (see.lmr.tck), 174
PM2.5, 145
pnorm, 62, 126, 149
points, 51
polyamine, 145
portneuf, 146
potash, 147
potato, 147
power.z.test, 148, 184
predict, 144
press, 110, 149
Preston.dist, 150
print.addtest (tukey.add.test), 198
INDEX
print.bci (boot.ci.M), 43
print.BDM (BDM.test), 38
print.blm (bayes.lm), 35
print.bootstrap (bootstrap), 44
print.ci (ci.mu.z), 61
print.ciboot (ci.boot), 58
print.kback (Kullback), 107
print.mltest (modlevene.test), 118
print.oneSamp (one.sample.z), 125
print.pairw (pairw.anova), 127
print.prp.index (prp), 152
prostate, 152
prp, 46, 123, 124, 152
pseudo.v, 155, 169, 170
pt, 62, 125
qq.Plot, 157
qqline, 157
qqnorm, 157
quail.sel (moose.sel), 120
r.bw, 158, 162
r.dist, 159
r.eff (see.rEffect.tck), 181
R.hat, 116, 160
r.pb, 158, 161
rainbow, 166
rat, 162
rbinom, 11
rchisq, 164
refinery, 163
Rf (MC), 112
rinvchisq, 163
samp.design, 16
samp.design (anm.samp.design), 27
samp.dist, 42, 43, 164
samp.dist.mech, 168
sc.twin, 169
scheffe.cont (pairw.anova), 127
scheffeCI (pairw.anova), 127
sd, 193
se.jack, 169
se.jack1 (se.jack), 169
sedum.ts, 170
see.accPrec.tck, 171
see.adddel (see.move), 178
see.ancova.tck, 171
see.anova.tck, 172
213
see.beta.tck (see.norm.tck), 179
see.betacdf.tck (see.norm.tck), 179
see.bin.tck (see.norm.tck), 179
see.bincdf.tck (see.norm.tck), 179
see.chi.tck (see.norm.tck), 179
see.chicdf.tck (see.norm.tck), 179
see.cor.range.tck, 172
see.exp.tck (see.norm.tck), 179
see.expcdf.tck (see.norm.tck), 179
see.exppower.tck, 173
see.F.tck (see.norm.tck), 179
see.Fcdf.tck (see.norm.tck), 179
see.gam.tck (see.norm.tck), 179
see.gamcdf.tck (see.norm.tck), 179
see.geo.tck (see.norm.tck), 179
see.geocdf.tck (see.norm.tck), 179
see.HW, 43, 173
see.hyper.tck (see.norm.tck), 179
see.hypercdf.tck (see.norm.tck), 179
see.lma.tck, 174
see.lmr.tck, 174
see.lmu.tck, 43, 175
see.lnorm.tck (see.norm.tck), 179
see.lnormcdf.tck (see.norm.tck), 179
see.logic, 43, 176
see.logis.tck (see.norm.tck), 179
see.logiscdf.tck (see.norm.tck), 179
see.M, 43, 176
see.mixedII, 177
see.mnom.tck, 178
see.move, 43, 178
see.nbin.tck (see.norm.tck), 179
see.nbincdf.tck (see.norm.tck), 179
see.nlm, 43, 179
see.norm.tck, 43, 179
see.normcdf.tck (see.norm.tck), 179
see.pdf.conc.tck (anm.cont.pdf), 11
see.pdfdriver (see.norm.tck), 179
see.pois.tck (see.norm.tck), 179
see.poiscdf.tck (see.norm.tck), 179
see.power, 43, 180, 184
see.r.dist.tck (r.dist), 159
see.rEffect.tck, 181
see.regression.tck, 43, 182
see.roc.tck, 182
see.smooth.tck, 183
see.t.tck (see.norm.tck), 179
see.tcdf.tck (see.norm.tck), 179
214
see.ttest.tck, 183
see.typeI_II, 43, 184
see.unif.tck (see.norm.tck), 179
see.unifcdf.tck (see.norm.tck), 179
see.weib.tck (see.norm.tck), 179
see.weibcdf.tck (see.norm.tck), 179
selftest.conf.tck1 (selftest.se.tck1),
184
selftest.conf.tck2 (selftest.se.tck1),
184
selftest.pdfs.tck1 (selftest.se.tck1),
184
selftest.pdfs.tck2 (selftest.se.tck1),
184
selftest.pdfs.tck3 (selftest.se.tck1),
184
selftest.prob.tck1 (selftest.se.tck1),
184
selftest.prob.tck2 (selftest.se.tck1),
184
selftest.prob.tck3 (selftest.se.tck1),
184
selftest.sampd.tck1 (selftest.se.tck1),
184
selftest.sampd.tck2 (selftest.se.tck1),
184
selftest.se.tck1, 43, 184
selftest.se.tck2 (selftest.se.tck1), 184
selftest.stats.tck1 (selftest.se.tck1),
184
selftest.stats.tck2 (selftest.se.tck1),
184
Semiconductor, 185
shad, 185
shade, 189
shade (shade.norm), 186
shade.bin.tck (shade.norm.tck), 188
shade.chi.tck (shade.norm.tck), 188
shade.F.tck (shade.norm.tck), 188
shade.norm, 43, 186
shade.norm.tck, 188
shade.poi.tck (shade.norm.tck), 188
shade.t.tck (shade.norm.tck), 188
shapiro.test, 83
Simp.index (alpha.div), 8
skew, 189
SM.temp.moist, 190
smooth.spline, 183
INDEX
snore, 191
so2.us.cities, 192
stan.error, 192
starkey, 193
SW.index (alpha.div), 8
Sys.sleep, 19, 21, 22
t.test, 114
trag, 193
transM, 194
trim.me, 195
trim.ranef.test, 196
trim.test, 39, 197
tukey.add.test, 198
tukeyCI (pairw.anova), 127
var, 165
varespec, 201
varespec (vs), 201
veneer, 199
Venn, 43, 200
vs, 201
wash.rich, 201
webs, 202
wheat, 203
whickham, 203
wildebeest, 204
win, 205
wireframe, 53
world.co2, 206
world.pop, 207

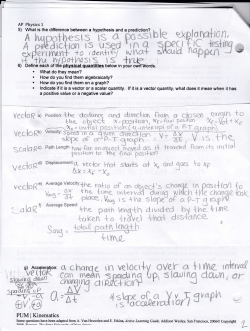


© Copyright 2026