
Quarter 3 Physics Project: Playground Physics (Part 3) Due
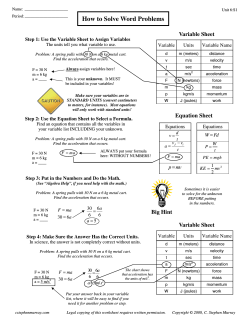
Quarter 3 Physics Project: Playground Physics (Part 3) Due Wednesday, March 18th, 2015 Equipment: You will need ♦ A Stopwatch ♦ A tape measure ♦ An accelerometer or accelerometer app ♦ A scale ♦ A camera ♦ A playground with a swing ♦ An elevator ♦ For the Extra Credit experiment: A Merry-Go-Round The Project: For this project, you will perform three separate experiments, and provide a detailed report of your procedures and results, as well as an error analysis. Adhere to the following instructions in your reports: ♦ The experimental reports will consist of an introduction, explaining what the experiment is and what physical concepts it is demonstrating, a table of data, all calculations, your results, and a detailed error analysis. Each of the questions in the experiments will be answered in full sentences. ♦ All parts of the report are to be typed, including calculations. Consult the help menu of your word processor for information on entering equations. On the website there is a link to several commonly used symbols for cut-and-paste. Each experiment in this packet has sufficiently detailed instructions. The rules for this project are as the last one: You are on your own. You may not ask myself or any other physics teacher for help, but you are free to discuss with others in your group and class any matters involving the experiments. You may work in groups, but each person must have their own, unique data and calculations. Everyone will perform every experiment Experiment 1: Playground Physics: The Swing In this lab you will measure the maximum acceleration on a swing and compare this to a value arrived at through the principles of conservation of energy and centripetal force. Discussion On a swing, we see a number of important physical phenomena, including simple harmonic motion, driven harmonic motion, inertia, conversion of energy between gravitational, potential, and kinetic, and centripetal force. In this experiment, we use the latter two ideas to calculate an acceleration and then compare the results with the acceleration we actually measure. At least two people are needed to carry out this lab. They will need both a horizontal and a vertical accelerometer, or an app that performs these functions. Experiment 1: Period of a (person) Pendulum Predict (not guess) the period of the swing when you are the bob. To do this, first take whatever measurements are relevant to the problem, and then test your results. To test the results, swing yourself up to a decent height, and then just allow yourself to swing and time your swings to find the period. Find the percent error between your prediction and your results and write a detailed error analysis. Show all work for predictions and measurements Experiment 2: Energy and Acceleration 1. Person A begins swinging with the vertical accelerometer. Person B takes up a position to the side so that he/she can see and measure the angle of the swinger’s motion. 2. Person A on the swing keeps the vertical accelerometer pointed upwards along the chain or rope, and will focus on reading the maximum value as he/she passes through the bottom-most point of the swing. Record this value as amax 3. Measure the maximum angle that the swinger moves to during the swing. Line the straw side of the accelerometer or phone with angle app up with the chain. Consider the rest position to be 0º, and make necessary adjustments to the measurement accordingly. The angle that is indicated on the accelerometer may be 90º minus the angle from the vertical, depending upon the device. The angle measured should be recorded as well as its complement. See Figure 1. 4. When the person on the swing gets to a point where the observer on the ground has a good reading on the maximum angle, write down both the angle and the maximum acceleration. Repeat in this manner for at least three different angles, then change places and repeat. Record your data in a data table. 5. To determine the change in the height of the swinger, use the recorded angle as shown in figure 2 or measure directly. Perform at least 3 trials and record all data and calculations in a clear, organized data table Analysis 1. From your measurements and the potential and kinetic energy formulas, determine your velocity at the bottom of the swing 2. The acceleration at the bottom of the swing has two parts: gravity and centripetal. We can show that the centripetal acceleration is just v2/L, where L is the length of the swing. Calculate this value and convert to g’s by dividing your result by 9.8 m/s2. Add 1g due to gravity to get the total acceleration. 3. Compare the values you calculated and the corresponding values measured on the swing. Examine the situation and suggest areas where your calculations could have been off due to approximations. Picture 4. Have your partner take a picture from the side at the moment you have reached your maximum height. On this picture, measure and indicate the angle of displacement from the rest position and include this picture with your project. Calculate the force due to gravity (Fg), force of tension (FT), and the restoring force (FR) and draw vectors to scale for each on the picture. FR FT Fg Part 2: Elevator Physics The SHA elevator may not be used for this experiment, because it is too slow to yield accurate readings. In general, the taller the building, the faster the elevators. You do not need to go to the Empire State Building, there are plenty of buildings in the local area with sufficiently fast elevators. In your report, indicate where the elevator is and include a picture of yourself in the elevator with the vertical accelerometer as you are ascending or descending. The net force on the mass in the accelerometer is given by the relationship: F - mg = Fnet = manet where F is the force applied to the accelerometer and mg is the weight due to gravity of the mass. When the mass is at rest or moving with constant speed in an upward or downward direction, the net force is zero and the net acceleration of the mass is zero. If the accelerometer is calibrated to read “1g” when it is at rest, that recognizes the 1g effect of gravity. To get the net acceleration of zero, you subtract 1g from the reading. If the mass is accelerating upward at a reading greater than 1g. Again, the net acceleration can be determined by subtracting 1g from the accelerometer reading. The reading will still be above zero (positive) indicating an upward acceleration. If the mass is accelerating downward, it will be above the “1g” position, or a reading of less than 1g. Subtracting 1g will yield a negative net acceleration in agreement with the downward acceleration of the mass. Procedure Hold the accelerometer stationary against the wall of the elevator and record the readings during each of the following instances: Standing still Beginning ascent Middle of ascent Slowing ascent Stopped Beginning descent Middle of descent Slowing descent Stopped Trial 1 Trial 2 Trial 3 This table is to be retyped with your data for inclusion in your project Questions 1. Are the magnitudes of the accelerations different at the beginning of the ascent than in the middle of the ascent? Explain why this is so. 2. How does the starting acceleration compare with the stopping acceleration? Was it the same during the ascent as it was during the descent? 3. Were the acceleration values constant during any of the periods of acceleration, or did they vary? How did they vary? Were they all the same pattern? 4. How did you feel in each of the situations where you took readings? Compare your feelings with the accelerometer readings. Analysis From your acceleration data, create another table and determine the net force you experienced during each portion of the trip for all three trials. Describe any additional measurements you need to take and show all work for calculations and measurements. Picture Have your partner take a picture of you on the elevator while it is ascending. Make sure that both you and the accelerometer are visible in the picture. Draw a free-body diagram to scale of the forces on you as the elevator ascends. Show all work for calculations and measurements. Smile! Extra Credit: Merry-Go-Round Physics You may use either a playground merry-go-round or an amusement park merry-go-round for this section. The former “Nunley’s” carousel is nearby on Museum Row. 1. Measure a distance from the center of rotation. Place the lateral accelerometer at that distance, holding it against a bar if necessary to keep it from moving, and holding it so that it is level. . Record the distance, r, in Table 1. Note: Several riders, each with a lateral accelerometer, could be positioned simultaneously at different distances. 2. Push the merry-go-round at a constant speed. 3. Measure the period of rotation as accurately as possible.. make not of the method used for finding the period and record all data 4. Record the lateral acceleration while rotating. 5. Repeat the above steps at a different radius. Analysis: Show all work for calculations and measurements. 1. Calculate your tangential velocity on the merry-go-round. 2. Calculate your centripetal acceleration from the velocity and your other measurements 3. Compare the calculated acceleration to your measured acceleration and calculate the percent error between them. 4. From your data, determine the relationship between radis and centripetal acceleration. Picture While you are on the merry-go-round, have your partner take your picture. On the picture, draw to scale a vector representing your tangential velocity at that moment.


© Copyright 2026