
Old Mutual Smoothed Bonus portfolios
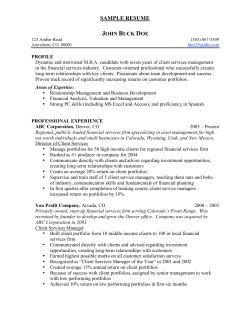
QUARTERLY REPORT
Q4 2014
OLD MUTUAL
SMOOTHED
BONUS
PORTFOLIOS
1
2
OLD MUTUAL SMOOTHED BONUS PORTFOLIOS QUARTERLY REPORT - Q4 2014
> CONTENTS
Q4
TAKING RESPONSIBILITY FOR THE FUTURE
FRED VAN DER VYVER – HEAD: GUARANTEED INVESTMENT PORTFOLIOS, INCOME AND GUARANTEED SOLUTIONS
04
Unrest in Ukraine, ratcheting sanctions against Russia, a plummeting oil price, Greece potentially exiting the Eurozone and a surprise in
Switzerland as the Franc strengthens and equities fall. Each of these are significant world events on their own, but when all these events occur at
the same time in a turbulent world of uncertainty the big question is what will the ultimate impact of these events be on investment markets and
people’s life savings? Read more...
RESPONSIBLE INVESTMENT INTERVIEW: ONE ON ONE WITH JON DUNCAN
06
KATLEGO THABA – ACTUARIAL SPECIALIST, INCOME AND GUARANTEED SOLUTIONS
"How we invest today determines the quality of the future that we will get." Read more...
INVESTING IN SUSTAINABILITY: FUNDS MAKING A DIFFERENCE 08
PHILIP WELGEMOED – ACTUARIAL SPECIALIST, INCOME AND GUARANTEED SOLUTIONS
We will be looking at some of the funds we invest in, which is making a real difference in the world: Development Impact Funds (DIF’s),
Agriculture and Renewable Energy. We also highlight some of the achievements in sustainability they have made to date. Read more...
INCORPORATING RESPONSIBLE INVESTING INTO OUR INVESTMENT PROCESS 11
JONATHAN LARCOMBE – PORTFOLIO MANAGER: GENERAL EQUITIES
The starting point for us, as investment managers, is to deliver on our mandate by optimising returns relative to risk. At the same time, we have
a responsibility to invest in companies that are managed in a sustainable way with respect to the environment, its employees and society. In the
absence thereof it is unlikely that the company has a long-term future. Read more...
REAPING RETURN ON INVESTING IN FARMLAND
12
PAUL RACKSTRAW – MANAGING DIRECTOR OF FUTUREGROWTH ASSET MANAGEMENT
In an industry where asset managers are punting increasingly complex, abstract and financially-engineered offerings, one straightforward, real
and consistent asset has remained below the radar – agricultural land. Read more...
UNDERLYING PERFORMANCE AND POSITIONING
15
TABASOEM PARKER – PERFORMANCE MEASURER, INCOME AND GUARANTEED SOLUTIONS
KREAN GOVENDER – INVESTMENT ANALYST, MANDATE MANAGEMENT
In this section we comment on how global and local investment markets performed over the quarter, discuss underlying performance over the
past three years, and provide reasoning for the current asset allocation positioning of the Old Mutual Smoothed Bonus portfolios. Read more...
PERFORMANCE TO 31 DECEMBER 2014
19
BONUS SMOOTHING RESERVES
20
KEY FEATURES
21
3
>TAKING RESPONSIBILITY
FOR THE FUTURE
FRED VAN DER VYVER
HEAD: GUARANTEED INVESTMENT PORTFOLIOS,
INCOME AND GUARANTEED SOLUTIONS
Unrest in Ukraine, ratcheting sanctions against Russia, a plummeting oil price, Greece potentially exiting
the Eurozone and a surprise in Switzerland as the Franc strengthens and equities fall. Each of these are
significant world events on their own, but when all these events occur at the same time in a turbulent world
of uncertainty the big question is what will the ultimate impact of these events be on investment markets and
people’s life savings?
The uncertainty about the impact of these extreme events on
been totally discredited. Instead of teaching, financial professionals
investment markets and people’s life savings can have very negative
should look to implement practices that influence the investor’s focus
effects on their emotions as the fear of losing hard earned savings
and expectations in ways that lead to more prudent investment
increases. This is completely understandable, especially when
decisions.”2
people have worked extremely hard and saved diligently for a long
period of time and are about to retire in the near future.
Smoothed bonus portfolios can protect investors against the risk of
making irrational decisions by consistently investing in the right assets
EMOTION MANAGEMENT
over the long term and then smoothing the returns to protect investors
A great risk during uncertain times such as these is that investors
from the emotions that may be experienced in volatile markets. The
start making irrational investment decisions by investing in asset
potential benefit of such a strategy over the long-term can be one of
classes when prices are high and disinvesting when prices are low.
the most valuable factors that determine the actual return earned by
This type of behavior detracts significantly from the actual returns
investors over the long-term.
that investors earn. A well-known study in the United States show
how over a period of approximately 30 years, the S&P 500 Index
RESPONSIBILITY STARTS WITH US
delivered a return of 11.11% per year, while the average actual
Smoothed bonus portfolios have long-term time horizons. With this
returns earned by equity investors over the same period were only
in mind, it is critical that we take responsibility for the future and
3.69% per year1.
consider the long-term sustainability of the investments that we make
to achieve our return objectives. This is not only to ensure that we
Although it is easy to understand why investors should not make
leave the world in a better place for the generations that follow us,
investment decisions in such an irrational way, the reality is that they
but it is also critical to ensure that our own long-term return objectives
still do. One of the key findings of the research mentioned above
can be met.
also commented that “Attempts to correct irrational investor behavior
through education have proved to be futile. The belief that investors
In this edition of our Quarterly Investment Report, we focus on
will make prudent decisions after education and disclosure has
Responsible Investment (RI). We discuss Old Mutual’s approach to
1
Source: “Quantitative Analysis of Investor Behavior, 2014,” DALBAR, Inc. www.dalbar.com
2
Source: “Quantitative Analysis of Investor Behavior, 2014,” DALBAR, Inc. www.dalbar.com
4
OLD MUTUAL SMOOTHED BONUS PORTFOLIOS QUARTERLY REPORT - Q4 2014
RI and have a focused interview with Jon Duncan who shares
RETURNS DELIVER ON PROMISES
various insights about this important topic.
The combination of staying on course with our investment strategy,
We also have a feature that focus on real on the ground investing
in sustainability by focusing on our Development Impact Funds,
agriculture and infrastructure investments. Investing directly in
sustainability through these funds can be seen as the ultimate practical
implementation of Responsible Investment. These investments in
the future of South Africa are a great way in which our Smooth
managing our emotions and being responsible have enabled our
Smoothed bonus portfolios to have had another great year delivering
returns significantly above inflation in 2014. The impressive
performance of all our smoothed bonus portfolios, together with the
usual disclosure of bonus smoothing reserve levels can be found on
page 17.
bonus portfolios contribute to the long-term economic, social and
I hope you will find this report interesting and that it will leave you
ecological sustainability of our country. These types of investments
with a sense of comfort in knowing that despite the volatile times that
do great things, while also providing investors with sustainable high
we find ourselves in, we have managed to stay on course, keep our
long-term real returns.
head and continue to deliver on our objectives.
5
>RESPONSIBLE INVESTMENT
INTERVIEW:
ONE ON ONE WITH
JON DUNCAN
KATLEGO THABA
ACTUARIAL SPECIALIST,
INCOME AND GUARANTEED SOLUTIONS
“How we invest today determines the quality of the future that we will get.”
We recently had an opportunity
investment; 3. Responsible to our employees; 4. Responsible to
to interview Jon Duncan, Head
our communities; 5. Responsible environmental management. This
of
and
framework is central to delivering on our core business growth
Engagement at the Old Mutual
Sustainability
Research
strategy. RI, as one aspect of the framework, effectively seeks
Investment Group. Jon gave us
to ensure that we direct the monthly premiums we gather into
a better understanding of how
investments that generate long-term sustainable growth.
Old Mutual engages with the
Jon Duncan
ideas and principles of Responsible
KT:How is RI relevant to Old Mutual’s business
Investment (RI) as well as an
model of developing investment products that enable
overview of RI activity globally.
its customers to save for the long term?
JD: We believe that the products we sell are critical to achieving
Katlego Thaba (KT): What is your role within the
long-term sustainable economic growth. Equally important is that
Old Mutual Group?
money collected from the sale of our products is productively put
Jon Duncan (JD): I lead the Old Mutual Group Responsible
back into the economy. Essentially, this means being mindful of the
Investment programme. This involves catalysing change in our
fact that how we invest today determines the quality of the future
organisation’s thinking about the risks and opportunities of long-
that we will get. Investing in areas of the economy such as those
term sustainability issues. It also means trying to encourage both
highlighted by the NDP – water, low carbon electricity, education,
the asset owner and investment managing parts of our business to
affordable housing etc. – creates the kind of stable, macro-thematic
understand the financial context to some of these environmental,
environment that will allow our customers to thrive and prosper.
social and governance (ESG) risks and to integrate them effectively
into our investment decision-making processes. I do this work
KT: What are some of the milestones Old Mutual has
with a committed and passionate team of three other Responsible
achieved since embarking on its RI journey?
Investment specialists.
JD: An early and important milestone was Old Mutual’s active
predication in the drafting of the South African Code for Responsible
KT:How does Responsible Investing fit into the
Investment (CRISA), and I’m pleased to say we are still actively
Old Mutual Group’s Responsible Business programme?
engaged as a CRISA committee member. Another important
JD: Old Mutual has a Responsible Business programme that is
milestone was Old Mutual Group becoming a signatory to the
designed to respond to our understanding of the broad sustainability
United Nations-backed Principles for Responsible Investment (PRI) in
issues impacting our operational and stakeholder environments. We
June 2012. We annually disclose progress towards the application
co-ordinate our response to these issues under the following five-
of these principles and in 2013 were happy to be one of the
pillar framework: 1. Responsible to our customers; 2. Responsible
co-sponsors in bringing the annual PRI event to South Africa.
6
OLD MUTUAL SMOOTHED BONUS PORTFOLIOS QUARTERLY REPORT - Q4 2014
KT: Please tell us about the global context of RI.
better access to new markets, all of which effectively mean better
JD: The global context is that the sustainability spotlight has swung
economic performance in the long run.
onto the financial services sector, challenging it to consider ESG
issues in capital allocation decisions. This is particularly important
for market participants that have long-term time horizons. Formally,
the global RI movement was kicked off by then Secretary General of
the UN, Kofi Annan, in 2005 with the launch of PRI. Currently, there
are over 1 260 PRI signatories representing over 45 trillion dollars
of capital under management.
I think what Ban Ki Moon is referring to in terms of 2015 is that
this is the year when all the member nations of the UN Framework
Convention on Climate Change (the UNFCCC) meet in Paris
later this year, to hopefully sign a universal agreement on climate
change, which will set carbon reduction commitments by various
nations around the world. Why this is significant is that putting a limit
on carbon emissions, fundamentally alters the economics of growth
PRI signatories meet annually. The 2014 meeting was held in
since countries and companies will have to internalise the costs of
Montreal and this year (2015) we’ll meet in London, where
previously unpriced carbon emissions. So yes, world leaders have
Old Mutual will again be a key sponsor. A highlight for me from
a historic opportunity to make a transformative change to the global
Montreal was the debate on investment risks and opportunities
economy, environment and society.
associated with decarbonising long-term economic growth. Science
is telling us that carbon emissions need to be reduced globally; the
trick, of course, is doing that in a manner that doesn’t kill growth. The
investment implications of this are that many listed companies have
fossil fuel assets on their balance sheet which may become stranded
KT:The Old Mutual Investment Group Responsible
Investment team has done research on governance
practices of JSE-listed companies. What key findings
emerged from this?
due to regulatory action limiting carbon emissions. It wasn’t all
JD:An important part of Responsible Investment is showing
just talk though: several large institutional investors made over two
up as a responsible steward or custodian of our clients’ assets.
billion dollars’ commitments to index products producing benchmark
In listed environments we do this by voting at company AGMs
returns but also significantly reducing carbon risk exposure. Such
and engaging on material issues. To support this work, we have
innovations evidence that you don’t have to sacrifice returns in order
developed a proprietary model for rating the governance practices
to invest in sustainability.
of listed companies. We use this research to focus our engagement
activity on issues and/or companies where we believe we can
KT: Secretary General of the UN, Ban Ki Moon, has
materially reduce risk for our clients. Our proxy voting policy is
described 2015 as the year for sustainability. What
publicly available on our website along with our proxy vote results.
investment risks and opportunities arise from the
sustainability trend?
To read more about the functioning of our RI programme please see our
JD:We see sustainability as a macro-thematic trend that is
latest CRISA disclosure (at: http://ww2.oldmutual.co.za/old-mutual-
fundamentally reshaping the competitive landscape across all
investment-group/about-us/responsible-investing/ri-resources).
industries. Companies that can respond to these trends early should
show better resource efficiency, lower operating costs, lower cost of
capital, better staff retention, stronger social licence to operate and
7
>INVESTING IN
SUSTAINABILITY:
FUNDS MAKING A DIFFERENCE
PHILIP WELGEMOED
ACTUARIAL SPECIALIST,
INCOME AND GUARANTEED SOLUTIONS
We will be looking at some of the funds we invest in, which is making a real difference in the world:
Development Impact Funds (DIF’s), Agriculture and Renewable Energy. We also highlight some of the
achievements in sustainability they have made to date.
DEVELOPMENT IMPACT FUNDS
independent low-fee paying schools, as well as for building new
The primary objective of the Old Mutual Alternative Investment
schools, to support the improvement of education in the country.
boutiques' Development Impact Funds (DIFs) is to invest in assets
that benefit lower income households and communities, while still
generating a commercially acceptable return for investors.
The FSC Fund invests in assets that meet the criteria as set out in
terms of the Financial Sector Charter. The Fund targets a range of
opportunities and innovations at the low-income level, including
This includes the following three funds:
housing microfinance, black SMME (Small, Medium or Micro-
• Housing Impact Fund South Africa (HIFSA)
sized Enterprise) finance and transformational infrastructure in
•
Schools and Education Investment Impact Fund South Africa
underdeveloped areas.
(Schools Fund)
• Financial Sector Charter (FSC) Fund
Success by numbers
• 3 397 housing units built
The HIFSA Fund focuses on new developments, as well as rental
• 3 293 housing units sold
and end-user finance for residential purposes in the affordable
• 206 mortgages granted
market. The affordable market targets households with an income of
• 3 815 rental units made available
under R18 600 pm.
• 8 928 student units made available
The Schools Fund delivers a significant social impact by providing
quality education. It provides innovative funding and infrastructure
delivery mechanisms for expansion and upgrading of existing
8
• 9 916 taxis financed (SMME)
• 10 322 learners educated in 2014
• Grade 12 pass rate of 90% achieved in 2014
• 365 distinctions achieved across five schools
OLD MUTUAL SMOOTHED BONUS PORTFOLIOS QUARTERLY REPORT - Q4 2014
> INVESTING IN SUSTAINABILITY
FUNDS MAKING A DIFFERENCE
AGRICULTURE: RETURNS THAT MATTER
workers on the funds’ farms are enrolled on a pre-paid healthcare
Investment in agriculture is integral to economic and social
programme (OCSA Care Gold), which gives them unlimited access
upliftment in Africa. Old Mutual has investments in Futuregrowth
to CareCross network doctors, dentists and opticians, as well as
Asset Management’s agricultural funds in South Africa and the rest
free medicines and radiology and pathology services. This ground-
of Africa. These agri funds invest in farmland that is managed and
breaking benefit has been noted and adopted by some of the farms
improved in partnership with select operators over a 10- to 12-year
surrounding the funds’ investments, thereby extending the reach of
period.
the funds as a catalyst for change.
Environmental impact and worker welfare are key considerations
One of the first workers to enrol for the literacy training was 55 years
in the agri funds’ investment decisions and ownership practices,
of age at the time and had to be taught how to hold a pen before
with a minimum of 0.5% of invested capital allocated specifically
beginning to learn how to write. She persevered and was presented
to worker healthcare and education programmes. These aspects
with a framed certificate for her achievement at the first ‘graduation’
are critical to creating meaningful and sustainable change in the
ceremony held by the agri fund. Her sense of accomplishment on
lives of farm workers and their communities. Literacy levels in rural
that day was palpable, but the impact of being able to read and
areas are often low and healthcare is inadequate. Where possible,
write her own name for the first time is immeasurable.
9
> INVESTING IN SUSTAINABILITY
FUNDS MAKING A DIFFERENCE
RENEWABLE ENERGY: OLD MUTUAL’S
GREEN APPROACH STRETCHES BEYOND
ITS BRAND
projects, with our Infrastructural, Developmental and Environmental
A power deficit affects our economic growth in many ways,
have a clean power generation capacity of 631 MW.
including forcing industries to scale back on production or
expansion plans as well as deterring foreign investment. To make
matters worse, South Africa is also the continent’s biggest producer
of carbon emissions.
With a growing global awareness that the private sector can assist
in addressing the shortages of adequate infrastructure as well as
facilitating skills development and job creation, the South African
Department of Energy put their Renewable Energy Independent
Assets (IDEAS) Managed Fund investing over R1.9 billion in nine
solar, five wind and one hydro-generation project. These projects
Combining a development agenda with bottom-line
returns
While high social and environmental impact investments are
important, the IDEAS Managed Fund’s top priority remains
its investors – including the many South Africans invested via
Old Mutual products. Infrastructure investments have shown
the potential to generate strong real returns that are generally
uncorrelated with traditional asset classes, and have strong
Power Producer Procurement Programme (REIPPPP) in place.
inflation protection characteristics with stable projected cash flows.
To date, Old Mutual has been a leading investor in many of these
Fund’s performance.
One of our larger projects is the COOKHOUSE WIND FARM, located in the
Eastern Cape Province. Environmental impact: It has a generation capacity
of up to 138.6 megawatts (MW) of renewable electricity, enough to power
150 943 low-income homes, and an implied carbon offset of 379 776
tonnes a year.
Kathu Solar Energy Plant is located approximately 16 kilometres
north-west of the mining town Kathu. The project consists of a
75 MW mono axis mounted tracking system comprising 344 540
photovoltaic (PV) modules designed to follow the sun throughout the day.
It generates 75 MW of clean, renewable energy to power thousands of
homes across South Africa.
10
Renewable energy assets are currently a large contributor to the
OLD MUTUAL SMOOTHED BONUS PORTFOLIOS QUARTERLY REPORT - Q4 2014
>INCORPORATING
RESPONSIBLE INVESTING
INTO OUR INVESTMENT
PROCESS
JONATHAN LARCOMBE
PORTFOLIO MANAGER:
GENERAL EQUITIES
The starting point for us, as investment managers, is to deliver on our mandate by optimising returns
relative to risk. At the same time, we have a responsibility to invest in companies that are managed in a
sustainable way with respect to the environment, its employees and society. In the absence thereof it is
unlikely that the company has a long-term future.
Recent events such as accounting scandals and poor governance
engage with those companies to change and vote against relevant
at African Bank, price collusion by the construction industry, work
resolutions. The last resort is not to own those particular companies.
stoppages due to poor labour relations or mines losing production
due to poor safety standards (certain platinum and gold mines),
illustrate that environmental, social, and governance (ESG) factors
can have an impact on a company’s share price performance.
Therefore, integrating ESG into the investment process is important
for optimising the risk return profile of an investor’s portfolio. A focus
on sustainability encourages long-term thinking, particularly as these
themes take a long time to play out. As we are long-term investors,
this approach fits comfortably within the Old Mutual Equities OME
investment process.
While the earth’s resources become scarcer and companies’ cost
to the environment comes increasingly under the spotlight – e.g.
carbon emissions and mine closure costs – governments are looking
at ways to penalise/tax those companies and in turn drive more
environmentally friendly methods. While this is a vexed issue for some
companies, the sustainability of the environment is an important and
a vital one. In the long term, we believe that unless companies are
proactive in dealing with ways to mitigate their negative impacts on
the environment and its resources, they will struggle to find capital
providers that are well disposed towards them. In our process we
The concept of “responsible investing” and the underlying guiding
explicitly forecast the cost of some of these taxes to reflect the intrinsic
principles of ESG have become topical in recent times. The
value of the relevant companies. For example, we have calculated
concept can mean different things to different people and some
the potential present value of the carbon tax for Sasol as being R10
approaches focus on either a negative or a positive screening
billion and lowering its value by about 5%.
method for selecting a universe. As opposed to reducing our
investable universe, we choose to incorporate a “principles based”
rather than a “rules based” approach. It is our view that companies
demonstrating sound and/or improving principles and managing
ESG issues effectively are, overall, more likely to have sustainable
business models, a competitive edge and the ability to manage
long-term risk to shareholder value.
While implicitly and explicitly incorporating ESG into our process,
via the Old Mutual Investment Group we have a dedicated ESG
team that provides an overlay to the work we do and assists us in
performing sustainability research and engagement with companies
to encourage improved ESG performance. In addition, we subscribe
to the MSCI ESG ratings system and incorporate the scores into
each of our company’s investment cases. The system rates each
For example, good governance practices as demonstrated through
company based on its detailed ESG score and provides flags on
a company’s appropriately structured board of directors, along
pertinent news issues on a company-specific basis.
with appropriately remunerated and incentivised executives, are
generally correlated to creating shareholder value over the long
term. The opposite is true where companies don’t reflect good
governance. Then as a shareholder we, on behalf of our clients, can
Lastly, Old Mutual is a signatory to the United Nations-backed
Principles for Responsible Investing (UN PRI), which provides an
important framework for integrating ESG into our investment process.
11
>REAPING RETURNS ON INVESTING IN
FARMLAND
PAUL RACKSTRAW
MANAGING DIRECTOR OF
FUTUREGROWTH ASSET MANAGEMENT
In an industry where asset managers are punting increasingly complex, abstract and financially-engineered
offerings, one straightforward, real and consistent asset has remained below the radar – agricultural land.
Agricultural land and infrastructure investments, of course, have been
AFRICA'S ROAD TO PROSPERITY
around since before financial markets existed. Most institutional
In 1970, more than 20 countries in sub-Saharan Africa were
investors’ exposure to agriculture as an asset, however, has been
involved in armed conflict; by 1990 that had dropped to 15; and
through the commodities futures market, which is highly liquid,
by 2012 only two countries were openly at war. This legacy of
volatile, expensive, and subject to short-term market movement.
conflict has now been turned into a future of opportunity as a broad
Many investors are now turning to tangible assets. Over the last
decade, the combination of population growth, rising incomes and
urbanisation has driven up food and agricultural prices globally –
range of reforms and infrastructure initiatives open new avenues
of commerce, strengthened by regulatory and legal systems that
provide greater levels of transparency and accountability.
and in Africa. Food security has become an important issue since
In 2000, the Economist described Africa’s economies as “hopeless”.
the food price shocks in 2007 and 2008. A sustainable solution to
A decade later that perception had been turned around and the
this is to be found in policies that encourage investment in farmland.
continent is now viewed as an attractive, a viable and prosperous
Consider that according to TIAA-CREF, US agriculture has
outperformed stock and bond markets for the last 40 years.
Institutional investors are increasingly demanding asset classes
investment destination. A number of factors have contributed to
this, not least of which has been the growth of democracy and the
establishment of appropriate fiscal and governance policies.
with strong capital preservation characteristics, low or negative
By 2025, the continent’s population will reach 1.4 billion and 47%
correlation to stocks and bonds, natural inflation hedge and superior
will be living in cities. More than 128 million households will have
performance in an inflationary environment. This can be met by the
discretionary income by 2020 when the collective GDP will hit
inclusion of farmland assets in a diversified portfolio that suits the
US$2.6 trillion. GDP growth in sub-Saharan Africa is expected to
long-term horizon of investors who seek stability and higher risk-
average 5% over the next 10 years, significantly higher than the
adjusted returns.
1.5% expected in Western Europe, and indications are that many
A UN report, World Population Prospects, states that by 2050 the
countries on the continent will exceed 7% economic growth.
global population will be nine billion. It goes on to say “land will be
By 2011, the middle-class population had grown by more than
at a premium and food prices will rise significantly, with a growing
61%, over the previous decade from196 million to 316 million. By
demand for more effective and productive farming techniques”.
2020, the food and consumer goods market will be worth more than
Over the same period, the global demand for food will double from
US$185 billion, and the food and beverage markets are projected
five billion tons a year to 10 billion. Africa comprises 20% of the
to reach US$1 trillion by 2030. According to the Organisation for
world’s land and contains 60% of the world’s uncultivated arable
Economic Co-operation and Development (OECD) the consumption
land but is only 15% of the world’s population. According to the
of meat proteins in the developing world will increase by more than
Economist magazine and the International Monetary Fund, seven
22% over the next 10 years, and as livestock require feed grain the
of the top 10 countries with the fastest growing GDP in the period
demand will grow accordingly. In addition, the shift to alternative
2011-2015 are in Africa. Increasing domestic demand, rising
energy sources, such as ethanol and biofuels, will see increased
incomes and urbanisation drive this growth.
demand for corn, sugarcane, soybeans and canola. Such farmland
12
OLD MUTUAL SMOOTHED BONUS PORTFOLIOS QUARTERLY REPORT - Q4 2014
>R
EAPING RETURNS ON INVESTING IN FARMLAND
investments are referred to as row crops and can serve as part of a
assessment, together with a key understanding of market dynamics.
diversified portfolio.
The expansion potential not only gives an increased lease yield as
Africa is on the road to prosperity, and farmland presents a viable
investment opportunity. Firstly due to the availability of low-valued,
soon as the new land reaches production, but the capital value is
also enhanced on revaluation.
premium farmland and agribusinesses, and secondly due to the
The social impact of the investment is significant and caters for a
shortage of locally available capital and skills for agribusiness
minimum 0.5% of invested capital spend a year on healthcare
development.
and educational programmes for workers. From year two of each
investment, motivated farm workers are identified and provided with
UNEARTHING OPPORTUNITIES
the opportunity to receive training in farm management skills.
Given the rapid development on the continent, much of the risks
present 10 years ago have either disappeared or been significantly
reduced.
Futuregrowth's agricultural suite of funds invests in commercial farms
across Africa and increases their value through consolidation,
expansion, and growing production yields to provide investors with
a long-term investment strategy opportunity in agriculture. While it
ADVANTAGES OF INVESTING IN FARMLAND
There are a number of advantages to investing in farmland,
notwithstanding the most obvious: as long as people eat, productive
farmland will have value. Farmland also produces internationally
traded commodities and provides a good capital preservation tool;
is a reliable inflation hedge; and there is a low to negative correlation
may include row crops in its portfolios, the funds are more clearly
with traditional asset classes and thus greater diversification benefits.
focused on permanent crops that have a typical life span of 15 to
Returns on farmland investments include two components: the long-
25 years – citrus, grapes, apples, etc. – and which deliver higher
average income returns than row crops.
The funds invest in upgrading farmland and increasing production
in rural areas, thereby creating sustainable employment in these
regions. Communities are never displaced and only land that has
already been earmarked for agriculture is considered. UFF Agri
Asset Managers (UFF) is the dedicated advisor for this suite of
funds, and is mandated to deliver financial returns, while upholding
positive environmental, social and governance (ESG) concerns.
The investments are in the actual farmland and infrastructure, which
is leased to an approved operator to manage, develop, and run
in partnership with the large scale agricultural operators to further
enhance its value. Each deal must have sufficient growth potential
to enable the funds to develop existing arable land, as well as to
purchase additional land, thus deploying capital to maximise the
potential available to create large-scale commercial farms.
term appreciation value of the land and the annual lease income.
Investors are secure in the knowledge that the value of their farmland
investments will adjust over time in response to currency fluctuations
outside their control, and thus it serves as a built-in currency hedge.
A further factor to consider is that as water becomes an increasingly
scarce resource – due to factors such as global warming – farmland
with sustainable water resources will increase in value.
As part of their developmental investment strategy, the funds look
to value-added components, such as technologies that improve
production and distribution of food, educational services in the
communities and water treatment plants.
All investment decisions are integrated with an environmental, social
and governance (ESG) process from the start. Once an opportunity
has been identified, the eligibility analysis begins and takes into
account the principles laid down in the Code for Responsible
Investing in South Africa (CRISA), the UN Principles of Responsible
The due diligence process prior to purchase is stringent and
Investment (UNPRI) and OECD guidelines. At the due diligence
necessitates intense work on soil quality, water rights and infrastructure
stage, an initial ESG assessment is conducted in line with global
13
>R
EAPING RETURNS ON INVESTING IN FARMLAND
good agricultural practices (GAP) and a final assessment is done
According to the World Bank study, agricultural investments have
when the transaction is closed. Throughout the remainder of the
a two- to four-times greater impact on poverty reduction than
investment, annual ESG assessments are conducted, which include
investments in other sectors in terms of GDP. A report from the
elements such as worker empowerment.
UN Industrial Development Organisation (UNIDO), Agribusiness
UFF maintains a close relationship with the operators on its
investment farms, providing advice related to strategy and daily
operations, working in close cooperation with related third parties
and institutions, and identifying value enhancing opportunities.
Investments in South African farmland consistently have yielded a
higher return in comparison to local and international equity indices
for Africa’s Prosperity, showed that “countries that have achieved
economic growth and solved their food problems have also
advanced to higher levels of agricultural mechanisation”.
We believe private investment in agriculture is a key enabler to
increasing efficiencies, boosting production, and achieving
economic growth through modern, mechanised farming practices.
(FTSE/JSE All Share Index and MSCI World), the local bond index
Institutional investors and high net worth individuals can invest in
(ALBI BEASSA), and local real estate (IPD Index). Compared to other
these funds, which offer a unique investment strategy and access
asset classes, South African farmlands have produced higher returns
to a pool of assets not generally available to investors. They also
with moderate volatility, and that volatility can further be reduced
offer the opportunity to participate in positive long-term development
when the assets are leased to an agri-operator, which insulates the
within the agricultural sector.
investor from operational and commodity risk. In short, farmland
provides a natural protection tool against market volatility.
With agricultural commodity prices recovering after years of
decline and the economies and population growth set to boom in
By applying the South African model to the rest of Africa, the funds
Africa, investing in agricultural funds offer a compelling investment
assure that agricultural expansion and development in Africa is done
proposition. This sort of growth, quite literally, needs to be fed and
in a responsible and sustainable way that makes a positive impact
Africa is a massive landmass that has the potential to feed itself three
in the countries and communities in which they invest.
times over.
SA FARMLAND RISK AND RETURN VS OTHER ASSET CLASSES
(2003-2013)
SA CPI
SA Farmland
20%
• SA Equities
• SA Real Estate
15%
• SA Bonds
10%
SA Equities
0%
5%
10%
15%
20%
25%
•
SA Bonds
30%
-0.40
Standard deviation
Sources: Bloomberg, MSCI, IPD, StatsSA, HSRC, UFF
14
International Equities
International
Equities
5%
0%
SA Real Estate
Asset classes
Average return (ZAR)
25%
CORRELATION TO SA FARMLAND (2003-2013)
-0.20
0.00
0.20
Correlation
Sources: Bloomberg, MSCI, IPD, StatsSA, HSRC, UFF
OLD MUTUAL SMOOTHED BONUS PORTFOLIOS QUARTERLY REPORT - Q4 2014
0.40
0.60
0.80
> UNDERLYING
PERFORMANCE
AND
POSITIONING
TABASOEM PARKER
PERFORMANCE MEASURER,
INCOME AND GUARANTEED SOLUTIONS
KREAN GOVENDER
INVESTMENT ANALYST,
MANDATE MANAGEMENT
In this section we comment on how global and local investment markets performed over the quarter, discuss
underlying performance over the past three years, and explain the rationale behind the current asset
allocation position of the Old Mutual Smoothed Bonus portfolios.
GLOBAL MARKETS
Cheaper oil fuels global growth
a boost of about 0.5% to global growth over the next year or so
(provided oil stays around US$60 a barrel).
The international highlight in December 2014 was the continued
In the meantime, global growth remains pretty slow, except in the
slide in global oil prices. After having fallen from US$110 to
US where the growth momentum remains solid. Indeed, after an
US$85 a barrel during October, the price slid to below US$75
unexpected contraction of 2.1% at an annual rate in the first quarter
by the end of November and then slumped to US$57 by the end
of this year, US GDP growth bounced back strongly to 4.6% in the
of December. While the initial slide was triggered by downward
second quarter and 5.0% in quarter three. Moreover, high frequency
revisions to global oil demand, a stronger dollar and easing supply/
indicators suggest that the growth momentum remained solid in the
demand conditions, as energy output around the world rose sharply,
fourth quarter, tracking around a 3% annual rate.
the sharp slump in December was caused by OPEC’s decision late
in November not to rein in oil production in order to try to support
LOCAL MARKETS
prices. With this decision, OPEC clearly signalled that it was willing
Nothing grows in the dark
to accept lower prices in order to squeeze out growing production
elsewhere around the world. So, initial assessments that the falling
oil price would be modest and relatively short-lived quickly proved to
be wrong and the latest assessments are that oil prices may remain
at current low levels for far longer than initially thought.
Winners and Losers
As is always the case with big commodity price moves, there
are winners and losers. The obvious losers in this case are the oil
producers and the exchange rates of a number of these countries
have tumbled further in December. Other losers include companies
that supply the oil industry and substitute industries, such as shale
gas producers and exploration companies. The key winners are
also pretty obvious: global oil-consuming countries. On balance,
News flow in December 2014 was a little better, but not universally
so. While we saw no more load shedding by Eskom during the
month, largely because of seasonally low demand from industrial
users, industry experts continued to warn that further load shedding
will be hard to avoid – at least in the first half of 2015. Even
more worrying is the growing realisation that the electricity bind
is going to constrain the economy for far longer than previously
anticipated. Eskom indicated that even if Medupi comes on line
as planned, albeit more than two years late, the electricity supply
will remain restricted for at least another two years. This is because
extensive maintenance is required at existing power stations and will
have to be done as soon as Medupi’s additional capacity becomes
available.
the sharply lower oil price is a net gain for the world economy as it
This again starkly highlighted the considerable constraint being
acts like a tax cut for oil consumers. It is commonly estimated that a
placed on the economy – not only dampening growth in the
US$10 drop in the oil price, sustained over a full year, should raise
short term, but also acting as a serious constraint on the country’s
overall global growth by about one-tenth of a percent. This implies
medium-term growth potential. As a result of this and other structural
15
> UNDERLYING PERFORMANCE AND POSITIONING
headwinds, both the South African Reserve Bank (SARB) and the
be less than expected). If Finance Minister Nene follows through in
International Monetary Fund (IMF) now reckon the economic growth
the February 2015 National Budget with the tighter fiscal policy he
potential has dropped to only 2.5% for 2015, far below the rate
promised in the Medium Term Budget Policy Statement, the outlook
needed to absorb new entrants into the labour market, let alone
for interest rates may brighten even further.
making a dent in the already huge pool of unemployed people.
Another piece of good news was the release of healthy fiscal
Brighter outlook for interest rates
numbers for November, as tax revenues bounced sharply and
On a more positive note, the implications of the sharply lower oil
spending held close to government targets. With a few months
price came into focus over the past month as the oil price dropped
of the fiscal year left, chances have improved that the 2014/15
further. Apart from a considerable saving for households and forecasts
fiscal targets will be met, despite the sharply slower growth over the
of sharply lower inflation into 2015, with a cyclical low of around
course of 2014 than foreseen at the time of the National Budget in
4.5% possible if the oil price and the rand hold at current levels, the
February 2014.
foreign trade balance should also benefit, as oil imports account for
about 9% of South Africa’s total imports of goods and services.
More welcome news in December was that both Fitch and Standard
& Poor’s rating agencies decided to keep South Africa’s ratings and
Moreover, with prospects for inflation and the trade balance both
the related ‘outlooks’ unchanged for now.
improving on the back of the lower oil price, the SARB kept interest
rates unchanged at its November monetary policy committee (MPC)
meeting. Looking forward, chances have improved that the further
UNDERLYING ASSET ALLOCATION OF OUR SMOOTHED BONUS
PORTFOLIOS
interest rate increases repeatedly stated as necessary by the SARB,
The tactical asset allocation decisions in the underlying portfolios
will be postponed into the second half of 2015 (and there may also
are made by Old Mutual Investment Group’s MacroSolutions
The table below shows the actual asset allocation as at 31 December 2014 compared to the long-term strategic asset allocation targets:
Asset class
Absolute Growth
Portfolios
CoreGrowth
Portfolios
Multi-Managed
Smoothed Bonus
Portfolios
Guaranteed Fund
and Genesis
Actual
Target
Actual
Target
Actual
Target
Actual
Target
Local equities
44.8%
47.7%
25.6%
28.5%
29.4%
28.5%
37.7%
39.5%
Local interest-bearing assets
15.1%
13.3%
34.0%
32.5%
36.4%
32.5%
21.2%
21.5%
Local alternative assets
6.6%
7.5%
6.6%
7.5%
3.7%
7.5%
6.6%
7.5%
Property
6.3%
6.5%
6.3%
6.5%
6.1%
6.5%
6.2%
6.5%
21.3%
15.0%
18.6%
12.3%
11.4%
12.3%
20.5%
14.5%
Global interest-bearing assets
0.9%
4.0%
3.7%
6.7%
6.4%
6.7%
2.0%
4.5%
Global alternative assets
3.1%
3.5%
3.3%
3.5%
4.1%
3.5%
4.0%
3.5%
African assets
1.9%
2.5%
1.9%
2.5%
2.5%
2.5%
1.8%
2.5%
Global equities
16
OLD MUTUAL SMOOTHED BONUS PORTFOLIOS QUARTERLY REPORT - Q4 2014
Q4
boutique. The boutique takes tactical overweight or underweight
Inflation over the three-year period was 5.5% and products provided
positions based on their relative view on each assets class. These
gross real returns ranging from 13.9% (Absolute Growth Portfolio)
views apply to all Old Mutual Smoothed Bonus portfolios, with
to 9.8% (MMSB).
the exception of the Multi-Managed Smoothed Bonus Portfolio.
The Multi-Managed Smoothed Bonus Portfolio is managed by
Old Mutual Multi-Managers and rebalances back to its strategic
weight when the respective asset class weight deviates more than 3%.
MacroSolutions’ tactical asset allocation calls had a positive impact
of approximately 0.9% on returns over the three-year period.
However, the effect of stock selection within the asset classes
Local interest-bearing assets and alternatives have supported relative
performance while local equity and properties were the main
detractors from relative performance.
The table below shows the three-year underlying asset class
performance of the Smoothed Bonus Portfolios to 31 December
2014.
reduced the overall performance. Preference to global equity and
Asset Class
Returns (p.a.)
local interest-bearing assets were the key contributors to the positive
Local equities
20.1%
alpha.
Local interest-bearing assets
UNDERLYING PORTFOLIO PERFORMANCE The following section provides a detailed analysis of the gross
returns delivered by the portfolios as well as the assets underlying
the Old Mutual Smoothed Bonus portfolios. The focus is primarily on
the three-year returns ending 31 December 2014.
8.8%
Local alternative assets
17.0%
Property
13.5%
Global equities
29.0%
Global interest-bearing assets
12.9%
Global alternative assets
19.7%
African assets
22.0%
Total Return
Benchmark
Return
Absolute Growth Portfolio
19.4%
19.1%
CoreGrowth Portfolio
16.7%
15.9%
of Old Mutual Multi-Managers (OMMM) and Electus. The OMMM
Multi-Managed Smoothed Bonus
15.3%
15.6%
portfolio had a tough fourth quarter with both Kagiso and Coronation
Guaranteed Fund & Genesis
18.5%
17.5%
Product
The Old Mutual Smoothed Bonus portfolios delivered strong returns
over the three-year period ending 31 December 2014. Total
portfolio returns ranged from 19.4% p.a. for the Absolute Growth
The local equities portfolio lagged its SWIX benchmark by 1.5%
over the three-year period. This was due to the underperformance
underperforming the SWIX. ELECTUS’s performance detracted over
three years through significant overweight positions in Lonmin, Altron
and AngloGold. An underweight allocation to Sanlam and Firstrand
further hurt performance as financials outperformed other market
sectors.
Portfolio to 15.3% p.a. for the Multi-Managed Smoothed Bonus
The Old Mutual Equities (OME) boutique and the Quantitative
Portfolio (MMSB). Guaranteed Fund, CoreGrowth and the Absolute
Investment boutique outperformed their benchmark delivering alpha
Growth Portfolio outperformed their benchmarks by 1.8%, 0.8% and
of 1.2% and 2.3% respectively over the same period. The OME
0.3% respectively. MMSB underperformed its benchmark by 0.3%.
portfolio benefited from robust stock selection across all sectors.
17
> UNDERLYING PERFORMANCE AND POSITIONING
The allocation to local interest-bearing assets continues to deliver
0.4% over the three-year period. Underperformance can mostly be
positive returns of approximately 1.1% p.a. over three years. The
attributed to the emerging market overlay, which detracted in value
core bond mandate, managed by Futuregrowth, has delivered
over the course of 2013. However, the style blend of global equity
returns of 9.7% p.a. over three years, ahead of its performance
managers has delivered in line with expectations.
target and slightly ahead of the median manager return of the
Alexander Forbes S.A Bond Manager watch survey of 9.2% p.a.
(gross of fees). The Enhanced Money Market portfolio continues
to remain ahead of benchmark and performance target over all
Global interest-bearing assets comprise of an allocation to the
Global Government Bond Portfolio and the Global Aggregate
Bond Portfolio. The Global Government Bond Fund managed by
periods.
Old Mutual Investment Group underperformed by 0.6% over the
The local alternatives portfolio delivered excellent performance over
the Global Aggregate Bond Fund managed by Rogge outperformed
the last three years, outperforming its benchmark of CPI + 7% by
its benchmark by 0.9% (in USD).
three years to December 2014. However, over the same period,
9.5% p.a., this is a real return of 16.5%. Returns can be attributed
to renewable energy deals materialising.
Global Alternatives, which is largely made up of private equity,
The property returns lagged its composite benchmark by 1.0%.
has outperformed its benchmark by 5.8% over the last 12 months
However, returns have improved substantially over the past two
to December 2014.
years. The improved performance was due to lower vacancies and
remains behind benchmark over three- and five-year periods, but
sales of poor performing assets.
Our portfolios are actively managed to ensure that they are well
The global equity portfolio underperformed its benchmark by
continue to meet policyholders long-term objectives.
18
positioned to gain competitive returns where possible, as we aim to
OLD MUTUAL SMOOTHED BONUS PORTFOLIOS QUARTERLY REPORT - Q4 2014
1.44%
1.40%
1.40%
0.64%
1.30%
Absolute Smooth Growth (2009 Series)2
Absolute Stable Growth
Absolute Stable Growth (2009 Series)2
Guaranteed Fund
Genesis
1.25%
1.10%
1.14%
1.18%
0.90%
0.94%
0.98%
Absolute Secure Growth (2009 Series)2
CoreGrowth 100
CoreGrowth 95
CoreGrowth 90
Multi-Managed Smoothed Bonus 100
Multi-Managed Smoothed Bonus 95
Multi-Managed Smoothed Bonus 90
3.41%
0.51%
-3.64%
0.18%
Local Bonds (BEASSA ALBI)
Local Cash (STeFI)
Rand/Dollar
Consumer Price Index (CPI)
-0.18%
3.74%
0.52%
-1.51%
-0.19%
1.08%
1.04%
1.00%
1.08%
1.04%
1.00%
1.24%
1.24%
1.20%
0.64%
1.39%
1.39%
1.43%
1.43%
Dec
2014
0.0%
1.5%
1.5%
4.2%
1.4%
2.9%
2.7%
2.6%
3.3%
3.2%
3.0%
3.3%
3.3%
3.6%
1.9%
3.7%
3.7%
3.9%
3.9%
Quarter*
Not comparable over the short-term
0.00%
1.55%
0.50%
2.36%
0.54%
0.78%
0.74%
0.70%
0.98%
0.94%
0.90%
0.75%
0.75%
1.10%
0.64%
0.91%
0.91%
0.94%
0.94%
Nov
2014
5.3%
10.6%
5.9%
10.1%
10.9%
14.3%
13.8%
13.2%
15.7%
15.1%
14.6%
16.3%
16.3%
15.4%
12.9%
18.5%
18.5%
19.0%
19.0%
1
Year
12.9%
18.3%
5.5%
12.4%
5.5%
8.7%
19.5%
13.7%
13.1%
12.6%
14.5%
14.0%
13.4%
15.0%
14.5%
13.8%
13.6%
17.1%
16.6%
17.6%
17.1%
3
Years
11.8%
15.3%
5.2%
9.1%
5.9%
10.0%
15.8%
12.1%
11.6%
11.0%
12.2%
11.7%
11.1%
12.5%
10.8%
11.2%
11.3%
14.5%
13.3%
15.0%
13.8%
5
Years
12.9%
15.7%
6.0%
7.3%
7.4%
8.5%
18.0%
14.2%
13.7%
13.1%
13.9%
13.4%
12.8%
N/A
N/A
13.4%
13.5%
N/A
N/A
N/A
N/A
10
Years
4.0%
5.9%
1.4%
13.6%
0.1%
6.9%
10.0%
0.6%
0.6%
0.6%
0.6%
0.6%
0.6%
0.9%
1.0%
0.6%
1.0%
0.9%
1.0%
0.9%
1.0%
Annualised
Volatility
3.2
3.1
N/A
0.9
55.0
1.3
2.0
22.8
21.8
21.0
24.2
23.3
22.3
16.7
14.5
23.0
13.6
19.0
16.6
19.6
17.1
Return/
Risk
Risk Analysis
(Based on 3-year
Performance)
-2.8%
-3.7%
N/A
N/A
N/A
-7.9%
-5.7%
0.7%
0.6%
0.6%
0.7%
0.6%
0.6%
0.7%
0.7%
0.6%
0.6%
0.8%
0.8%
0.9%
0.9%
Performance
R203
R213
R2 247
R5 297
R918
R1 148
R10 741
R49 460
R14 588
(R million)
Fund size
Notes
1
Worst cumulative negative performance. Where no negative return exists. it is taken as the lowest positive monthly return.
2
Uses 2009 Series returns prior to the merger. The 2007 and 2009 Series of the Absolute Growth Portfolios merged on 1 May 2012.
3
Source: Alexander Forbes Manager Watch Survey for Large Global Funds (median).
4
Source: Alexander Forbes Manager Watch Survey for Conservative Global Funds (median).
Performance figures are net of capital charges and gross of investment management fees for all products except Guaranteed Fund. The Guaranteed Fund’s performance is net of capital charges and
asset management charges. gross of investment administration fees.
Typical Balanced Fund (Conservative Global)4
Typical Balanced Fund (Large Global)3
1.01%
Local Equities (JSE ALSI)
Other Indices and Comparative Performance
1.25%
Absolute Secure Growth
Protection-focused Portfolios
1.44%
Absolute Smooth Growth
Growth-focused Portfolios
Oct
2014
Performance over periods to
31 December 2014
(Annualised except*)
Max
Drawdown1
(Based over
a 3-year
period to
December
2014)
> SMOOTHED
BONUS PRODUCTS:
PERFORMANCE 31 DECEMBER 2014
Q4
19
> SMOOTHED
BONUS PRODUCTS:
BONUS SMOOTHING RESERVES
FORMULAIC SMOOTHED BONUS PRODUCTS: QUARTERLY DISCLOSURE
Sep
2013
Dec
2013
Mar
2014
June
2014
Sep
2014
Dec
2014
Absolute Growth Portfolios
Greater than 25%
20% to 25%
15% to 20%
10% to 15%
5% to 10%
0% to 5%
-5% to 0%
-10% to -5%
-15% to -10%
Less than -15%
DISCRETIONARY SMOOTHED BONUS PRODUCTS: ANNUAL DISCLOSURE
CoreGrowth
Multi-Managed
Smoothed Bonus
Guaranteed Fund
Discretionary Portfolios at 30 June 2014
Greater than 25%
20% to 25%
15% to 20%
10% to 15%
5% to 10%
0% to 5%
-5% to 0%
-10% to -5%
-15% to -10%
Less than -15%
20
OLD MUTUAL SMOOTHED BONUS PORTFOLIOS QUARTERLY REPORT - Q4 2014
Genesis
1
Return on a conservative to moderate
market-linked fund
over the long term,
less the guarantee
charge
61%
61%
Old Mutual
Multi-Managers
Boutique
(non-OMIG
Managers)
Includes equities, properties and alternative assets (including private equity).
Notes
90
95
100
90
95
Return on a conservative to moderate
market-linked fund
over the long term,
less the guarantee
charge
Genesis
100
Return on a
broadly balanced
market-linked fund
over the long term,
less the guarantee
charge
74%
Positive bonuses
each month
Positive bonuses
each year
Guaranteed Fund
OMIGSA Boutiques
including
Old Mutual
Multi-Managers
(OMMM)
Boutique
(non-OMIG
Managers)
Return on a
broadly balanced
market-linked fund
over the long term,
less the guarantee
charge
Secure
1.00%
1.80%
1.30%
0.80%
1.80%
1.30%
0.80%
100% of fund
credit on claim
95% of fund credit
on claim
90% of fund credit
on claim
100% of fund
credit on claim
95% of fund credit
on claim
90% of fund credit
on claim
0.75%
2.70%
0.70%
0.20%
Guarantee
charge
(per
annum)
100% of capital
invested and a
portion of bonuses
declared
100% of capital
invested and a
portion of bonuses
declared
100% of fund
credit on claim
Targets CPI+3.5%
over medium to long
term (after guarantee charge)
Stable
83%
80% of fund credit
on claim
Absolute Growth Portfolios
CoreGrowth
Portfolios
Multi-managed
Smoothed
Bonus Portfolios
Positive bonuses
each month
Guarantee
in extreme
environments
Targets CPI+5.5%
over medium to long
term (after guarantee charge)
Protection
objective
50% of fund credit
on claim
Management
style and
manager
Targets CPI+6%
over medium to long
term (after guarantee charge)
Strategic
allocation to
growth assets1
in underlying
portfolio
Protection
Smooth
Performance
objective
Growth
0.47% - 0.75%
(depending on fund
size)
0.23% - 0.50%
(depending on fund
size)
0.23% - 0.50%
(depending on fund
size)
0.25% - 0.35% (asset
management charge
depending on asset
allocation) plus
0.20% - 0.35%
(investment
administration fee
depending on fund size)
0.600% - 0.725%
(investment
management fee
depending on asset
allocation)
Investment
management fee
(per annum)
Costs
April 2003
January
2003
January
2003
March
1998
July 1999
July 1967
April 2007
(new series
launched
in April
2009)
Inception
date
Q4
> SMOOTHED BONUS PRODUCTS:
KEY FEATURES
21
Q4
> HOW TO CONTACT US
Find out more about the investment portfolios in Old Mutual’s range of Growth and Protection Solutions.
Contact your Old Mutual Corporate Consultant, Broker or call your nearest
Old Mutual Corporate office:
• Johannesburg:
011 217 1000
• Pretoria:
012 360 0000
• Western Cape:
021 530 9600
• KwaZulu-Natal:
031 275 0800
• Eastern Cape:
041 391 6300
Email us:
• [email protected]
Visit our corporate website:
• www.oldmutual.co.za/corporate
Old Mutual Life Assurance Company (South Africa) Limited is a licensed financial services provider.
Jan Smuts Drive. Pinelands 7405. South Africa. Company registration no: 1999/004643/06.
omms 02.2015 L78876


© Copyright 2026