
Leaders of the Pack: ACEEE`s Third National Review of Exemplary
Leaders of the Pack: ACEEE’s Third National Review of Exemplary Energy Efficiency Programs Seth Nowak, Martin Kushler, Patti Witte, and Dan York June 2013 Report Number U132 © American Council for an Energy-Efficient Economy 529 14th Street NW, Suite 600, Washington, DC 20045 Phone: (202) 507-4000 Twitter: @ACEEEDC Facebook.com/myACEEE www.aceee.org Contents Acknowledgments ii Executive Summary iii Background 1 Major New Trends 1 Scope and Objectives 4 Solicitation of Program Nominations 4 Expert Panel Program Review and Selection 6 Results 6 Analysis of Nominations and Programs Recognized 7 Observations and Common Traits of Leading Programs 8 Conclusions 10 Roster of Award-Winning Programs 11 References 17 Appendix: Profiles of Exemplary and Honorable Mention Programs 19 i Acknowledgments ACEEE thanks the following organizations for their funding support of this project: the Energy Foundation, Kresge Foundation, National Grid, NStar, Southern California Edison, U.S. Environmental Protection Agency, and U.S. Department of Energy. ACEEE also thanks Jeff Schlegel of Jeff Schlegel and Associates, Ed Vine of Lawrence Berkeley National Laboratory, and Doug Baston of North Atlantic Energy Advisors for serving on the expert panel that reviewed program nominations and worked with the authors to select the programs that are honored in this project. ACEEE also thanks all the program managers, staff people, and other individuals associated with all the honored programs—administrators, field staff, implementation contractors, corporate communications staff, and others—for their valuable assistance in developing the program profiles. Finally, the authors thank fellow ACEEE staff for their valuable contributions: Renee Nida for editing and producing the final report; Charlie Herron for organizing and producing the award certificates; and Eric Schwass for web publication. ii Executive Summary Energy efficiency programs serving electric and natural gas utility customers have grown and matured since the 1970s when a few such programs were first created. They now are prevalent across the United States. Most utility customers in all 50 states plus the District of Columbia are served by energy efficiency programs, which typically provide a range of services, such as technical assistance and financial incentives for a wide variety of energy efficiency improvements. To recognize and profile best program practices and outstanding energy efficiency programs, the American Council for an Energy-Efficient Economy (ACEEE) initiated and completed its first “national review of exemplary programs” in 2003. Following the success of this initial review, ACEEE completed a second national review of exemplary programs in 2008. The key objectives of these reviews were to provide profiles of leading programs as models for emulation and to recognize the programs for their accomplishments. In 2012, ACEEE initiated its third national review of exemplary programs in order to provide an updated catalog of leading customer energy efficiency programs, which have continued to evolve in response to sometimes dizzying numbers of changes in technologies, energy markets, economic conditions, and policies. Overall such customer programs have grown rapidly over the past ten years as state legislatures and/or regulatory commissions have enacted policies seeking to achieve high energy savings and the associated economic and environmental benefits that accrue from successful customer energy efficiency programs. As in its earlier national exemplary program reviews, ACEEE solicited program nominations from across the United States. ACEEE staff worked with an expert review panel to review and select programs from the set of nominations as either “exemplary” or “honorable mention.” ACEEE selected a total of 63 programs for recognition. As in its previous national reviews, the programs span the wide spectrum of the types of programs serving different types of customers and targeting different customer technologies and end-uses of energy, from residential lighting programs to industrial process efficiency improvement programs. There are a total of 23 program categories identified and used to classify programs in this third national review. ACEEE received nominations from programs serving customers in a total of 36 states, up from the 23 states represented in the 2008 review. ACEEE also observed an increase in the diversity of the types of organizations submitting proposals. The types of organizations submitting nominations included federal power authorizes, municipal utilities, investor-owned utilities, state agencies, regional energy efficiency organizations, third-party program administrators, and rural electric cooperatives. ACEEE also saw a significant increase in nominations from programs serving customers in Southeastern states, a region that historically has not had as many programs in place. ACEEE observed a number of common trends and characteristics among the programs considered in this review. These include: • • Targeting market niches and customer sub-segments is an increasingly common strategy. Program administrators are finding ways to reach previously underserved customers with new programs and program approaches. iii • • • • • • • • • Programs have been growing larger. There are many “tried and true” approaches that continue to save energy costeffectively year after year. A clear trend among programs with the most staying power is the ability to adapt and tune their core offerings to maintain and grow cost-effective energy savings. Simplifying processes to make participation simpler for customers is important to increase the number of program participants. A related common trait is “one-stop shopping” and similar approaches. Financing has become widespread among exemplary programs, both electric and gas, business and residential, new and mature, large and small. Relationship building is becoming more widely recognized as an important factor for improving conversion rates (from energy assessment/audit to program participant) and overall program participation. Programs are working to incorporate the latest energy-efficient technologies, such as LEDs and other newly emphasized technologies. There is a continuing emphasis on statewide approaches and programs. Energy efficiency programs for electric and natural gas utility customers are a proven means to help customers reduce their energy costs. There are exemplary programs serving all types of customers. Increasingly programs have emerged to address the unique needs and challenges associated with various “hard-to-serve” customer segments, such as multifamily housing and small business. Exemplary programs are incorporating innovative program designs and new technologies to better serve customers. There also are exemplary programs that are based on long-standing, proven approaches with little change from year to year. ACEEE’s third national review of exemplary programs captures leading practices for customer energy efficiency programs. Such programs continue to evolve, but what remains constant is their commitment to helping customers save energy through improved energy efficiency. In so doing these programs also provide important economic and environmental benefits. iv LEADERS OF THE PACK Background Energy efficiency programs for electric and natural gas utility customers have existed since the 1970s. Recognizing that programs had evolved and expanded over the years, in 2003 ACEEE seized the opportunity to review the state of the practice for successful programs. The result was ACEEE’s first national review of exemplary programs (York and Kushler 2003). In 2008 ACEEE completed its second national review of exemplary energy efficiency programs, Compendium of Champions: Chronicling Exemplary Energy Efficiency Programs from Across the U.S. (York, Kushler, and Witte 2008). That report included profiles of 90 programs selected as models for recognition and emulation for their success in helping customers increase the energy efficiency of their homes, offices, businesses, and industries. Like the first ACEEE review of exemplary programs in 2003, the profiles programs had been selected from a large set of nominations received by ACEEE. ACEEE also completed two follow-up efforts to the initial national review, one on natural gas energy efficiency programs (Kushler, York, and Witte 2003) and one that focused on low-income energy efficiency programs (Kushler, York, and Witte 2005). All of these projects were very well received. The first two of the national reviews encompassed a broad spectrum of program types, serving customers in all major categories (low income, residential, commercial, and industrial). The resulting catalogs of programs proved to be popular and useful references for program designers embarking on new initiatives and managers of existing programs who wished to benchmark their efforts against best practices. Program administrators and implementation contractors greatly appreciated the public recognition for their successful efforts. Over the years, ACEEE has continued to hear anecdotes about how the recognition and publicity resulting from inclusion in the reviews of exemplary programs has helped to build support for the program administrators, implementation contractors, and other organizations and programs recognized—helping to ensure continued and increased funding and continued and expanded services. To aid in this effort, ACEEE provided communication materials to assist organizations in getting local media coverage of their awards and inclusion in the Compendium of Champions report. Approximately five years passed between the first national program reviews in 2003 and the second in 2008. The reviewers and authors were struck by the degree to which new programs had proliferated and existing ones had matured in that interval. Now five years more have passed, and the large-scale economic, resource, and political trends influencing utility-sector energy efficiency programs have shifted yet again. In recognition of these changes, as well as the huge increase in new program efforts in states that heretofore have not had efficiency programs, ACEEE initiated its third national review of exemplary programs in the summer of 2012. MAJOR NEW TRENDS While neither the process nor the rationale for conducting ACEEE’s third national review of energy efficiency programs has changed substantially, many of the programs themselves 1 LEADERS OF THE PACK © ACEEE have undergone sea changes, and the environment and markets in which the programs operate have altered substantially as well. None of those economic, resource, or political trends mentioned above and cited in ACEEE’s second review have remained static, and most have accelerated, reversed, or changed the landscape for energy efficiency programs significantly. The exemplary programs featured in this compendium have many common attributes. Some trends we observe among the leaders today are: Customer energy efficiency programs have continued to grow rapidly. Total U.S. spending on utility-sector electric energy efficiency when the Compendium of Champions report was published in early 2008 was about $2 billion. Today it is approximately triple that, with combined state budgets nearing $6 billion annually (Foster et al. 2012). The “Great Recession,” and Washington’s response to it, altered the landscape. It has clearly had an impact on residential consumer willingness to participate in their utility energy efficiency programs. The business case for commercial and industrial sector efficiency programs was also affected to varying degrees. Many program administrators reported that business customers were unwilling to invest in any efficiency projects—even those with rapid paybacks—until there was some sense that Washington lawmakers had a policy agreement on a tax and spending response and also that a recovery was underway. At the state level, different states responded differently. In some states, like Nevada, the downturn has resulted in large curtailment of customer energy efficiency programs. In others, like Massachusetts, Rhode Island and Connecticut, policymakers doubled down on their commitments to expanded investments in energy efficiency. A potentially large wave of new electric power plant construction has not materialized as expected. Instead of the forecasted 100 to 150 new coal-fired generators that were thought to be needed to be constructed (or already in the permitting process), a smaller total capacity of natural gas plants have been permitted or built. Forces aligning against coal included higher plant construction costs, higher environmental compliance costs under the Clean Air Act, lower natural gas prices, and mounting evidence that energy efficiency has been—and continues to be—deployed as a reliable utility-system level energy resource at a fraction of the cost of building new supply-side generation capacity. There has been a great turnaround in coal-fired electric generation capacity. What had been an overall capacityconstrained situation has shifted dramatically in some cases to an over-capacity of electric supply. Coal plant retirements, rather than new construction, are an emerging trend. Fossil fuel market changes combined with environmental regulations have begun to factor into the retirement of existing coal-fired electric power plants, placing as much as 40 gigawatts of generation capacity at risk of retirement (Elliott 2011). These plants are predominantly located in the Ohio Valley, Upper Midwest, Mid-Atlantic, and Southeast—areas that simultaneously are sharply increasing investment in energy efficiency programs. Given new regulatory structures to provide incentives to large energy-using customers to make the necessary investments, energy efficiency and 2 LEADERS OF THE PACK combined heat and power could arguably replace the retiring coal generation capacity at a lower cost, reducing customer rate impacts (Elliott 2011). Energy efficiency remains a low cost resource. The cost differential that was apparent at the time of ACEEE’s 2nd review between conventional fossil fuel plant construction and energy efficiency in particular has persisted and in many cases widened further. ACEEE research found that the cost of saved energy through customer energy efficiency programs averages about $0.025 per kWh (Friedrich 2009). Conventional energy supply-side options typically cost between $0.07 and $0.15 per kWh—about three times as much as energy efficiency resources (Lazard Ltd. 2012). Energy fuel costs that had risen dramatically continued to do so, with one major exception: natural gas prices have dropped. Lower natural gas prices have put some degree of pressure on natural gas efficiency programs to meet their benefit-cost tests in many cases, with implications for natural gas energy efficiency program design and budgets. How long and to what extent natural gas prices will remain at their current relative lows is a matter of debate, as are the nature and extent of price impacts and influence on energy efficiency programs. This applies less to electric efficiency programs (Young et al. 2012); however, to the extent that efficiency lowers the avoided costs of new combined-cycle natural gas electric generating plants, it does apply to some degree. There is renewed concern for global warming and increased interest in addressing it through a variety of means. The impacts of Hurricane Sandy among other factors have contributed to increases in consumer concern for taking meaningful action to address climate change again. In 2008, global climate change was noted as an issue that had moved from debate to action, with numerous states and regions taking concrete steps to reduce greenhouse gas emissions through energy efficiency and conservation. After waning in subsequent years, today there is again federal support for action to address climate change, but such support is in the form of administrative efforts through the executive branch rather than legislation. Regional and state initiatives to reduce emissions are currently being implemented in the Northeast (Regional Greenhouse Gas Initiative) and in California. State energy efficiency resource standards (EERS) have grown rapidly and are now in place in more than half the states. These standards set specific savings targets for energy efficiency programs and utility-sector portfolios, and have dramatically expanded program spending and the resulting energy savings (Nadel 2006; Sciortino et al. 2011). Energy efficiency baselines are increasing due to a variety of policies and market developments. In addition to the fundamental and direct effects of EERS, leading to larger and additional utility-sector energy efficiency programs and portfolios, there are second-order effects emerging as savings mandates ramp up and the lowhanging fruit of energy savings becomes scarcer. Increased activity on building energy codes and federal appliance standards have directly raised baselines against which energy savings from utility programs are measured. Federal lighting 3 LEADERS OF THE PACK © ACEEE efficiency standards in particular have influenced programs. New technologies, higher financial incentives, complementary state policies, and more extensive and better-trained trade ally and contractor networks have all emerged as the efficiency industry matures and evolves far beyond its former boundaries (York et al. 2013). Scope and Objectives Consistent with ACEEE’s 1st and 2nd national reviews of exemplary programs, this 3rd national review has two main objectives: (1) to provide information about leading energy efficiency program designs and implementation practices that might help others improve their programs or serve as models for new programs and initiatives for the jurisdictions just now entering this space; and (2) to provide recognition and acknowledgement to those who are doing an excellent job in their energy efficiency efforts. Again in keeping with the first two national reviews, and given the increased role and impacts of energy efficiency within energy resource portfolios, ACEEE believes that it is especially critical and more valuable than ever for program planners, developers, administrators, and implementers to have access to up-to-date, quality data and information about leading program designs and results. This 3rd national review includes as equally broad a range of program categories, customer sectors, technologies, and end-uses as its predecessor projects. ACEEE leveraged its organizational experience, professional contacts, and information networks across the utility and public benefits field in order to attract candidate programs for nominations. The project is intended to further the spread of successful program designs, ideas, and approaches to new geographic locations, new market segments, and organizations that stand to improve their effectiveness by employing them. Solicitation of Program Nominations ACEEE solicited nominations nationally. The kick-off for the nomination process occurred in conjunction with the 2012 ACEEE Summer Study on Energy Efficiency in Buildings, a biennial industry event that brings together program staff, allies, researchers, and energy policymakers and regulators from across the United States and internationally, held in August 2012. In addition to publicizing the call for nominations at the event, ACEEE also publicized this call through its website and a series of mass e-mail blasts. ACEEE staff and allies also used personal contacts and knowledge to encourage the submission of nominations for the review. Through the nomination process, ACEEE sought leading examples of energy efficiency programs for all types of customers (residential, commercial, industrial, and agricultural) and end-uses. The key qualifying criterion was that they had to be “utility-sector” energy efficiency programs (i.e., funded by customers through utility rates, public benefits charges, or other similar utility revenue mechanisms). The programs could be administered by utilities, government agencies, or “third-party” independent administrators. Both electric and natural gas programs were eligible. Programs recognized in ACEEE’s 2002-3 and 2007 reviews were also eligible for this 3rd national review. In those cases, program data and results were required to be updated to reflect the latest information available. 4 LEADERS OF THE PACK ACEEE did not solicit programs that were primarily ARRA-funded, programs outside of the United States, or where the administrator was not either a utility or an independent entity performing the function of an “efficiency utility.” These qualifications provide a pool of energy efficiency programs that have relatively common or comparable regulatory structures and customer funding streams, and also are susceptible to replication (not onetime stimulus-funding), so that exemplary approaches may be promulgated and adapted. Organizations could nominate a maximum of three energy efficiency programs. In cases in which a contractor or other party independently nominated a program administered by a utility or other program administrator, ACEEE verified with the program administrator that they were aware of, concurred with, and supported the nomination. ACEEE did not seek nominations for load management or demand response programs, with one exception: “integrated” programs where broader energy efficiency measures and savings are incorporated as an explicit priority in the program design in addition to load management. It was required that the inclusion of integrated, significant energy efficiency measures and savings, not just peak reduction, be well-documented. The primary selection criteria for recognition by ACEEE were: 1. Direct Energy Savings: Demonstrated ability of the program to deliver significant immediate and long-term kWh (and/or therm) savings from energy efficiency. 2. Market Impacts: Demonstrated ability of the program to produce desirable and lasting improvements in the energy efficiency characteristics and performance of the targeted market. 3. Cost Effectiveness: Demonstrated ability to yield significant energy savings and related benefits relative to the costs of the program. 4. Customer Service and Satisfaction: High quality of services available and provided to customers participating in programs. 5. Innovation: Incorporation of particularly innovative measures, program designs, and/or implementation techniques that have achieved positive near-term results and promise significant future impacts. 6. Transferability: Well-documented programs with characteristics amenable to replicating the program design in other similar settings. Additional factors that were regarded favorably by the program review panel included: success in serving “hard to reach” target populations; success in achieving deep energy savings by participants; and the ability to leverage significant customer investments in energy efficiency. ACEEE specifically sought out programs from geographically underrepresented areas and from cooperative and public power utilities, and took into consideration that what constitutes an exemplary program varies based on program size, type of organization, state regulation, customer sectors and industry served, program budgets, and other factors. 5 LEADERS OF THE PACK © ACEEE To demonstrate achievement according to the various criteria, ACEEE announced that nominated programs should have used good quality ex post evaluation and verification methodologies to document savings impacts, market effects, and other results achieved by the program. The review panel paid considerable attention to, and looked favorably on, the provision of program evaluation reports for the nominated programs, and to their awareness and knowledge of strong evaluation procedures. Nominations could be submitted by program staff, utility staff, or anyone familiar with the program enough to complete the online nomination forms. ACEEE only solicited nominations within the United States and did not recognize nominations from other countries as eligible. Expert Panel Program Review and Selection ACEEE convened an expert panel that consisted of three external industry experts (all three of whom had served on the panels for both previous ACEEE exemplary programs reviews) and ACEEE staff. The review panel used a consensus process to select programs. ACEEE staff made final decisions in cases where there were differences among the expert panel. While the panel relied on as much objective data and descriptive material as possible, ultimately the decisions were subjective, based on group discussion of available information and collective judgments regarding each program. The panel did not necessarily select programs for awards in all program categories received. Rather, the objective of the panel’s choices was first and foremost to select those programs which, in their opinion, merited recognition for their performance or innovation, and that were excellent models for emulation and replication by others. Secondary objectives of the expert panel were to assemble a set of programs that represented residential, commercial, and industrial sectors and were diverse in other important attributes, such as type and size of program administrator (from small rural electric co-ops to large investor-owned utilities), and nature of the programs (community-based programs, market transformation programs, and industry niche program were extended consideration along these lines). Results The response to ACEEE’s call for nominations was robust and included submissions from leading programs large and small, electric and natural gas, in a broad array of program categories, industries, and market segments. The overall quality of the nominations was high, reflecting the depth of program experience that has developed over 25 years or more in many cases. Those submitting nominations could also draw upon ACEEE’s previous national exemplary program reviews for guidance as to the types of programs sought and criteria for selection. As in the preceding national reviews, ACEEE selected programs to be recognized with two types of awards: Exemplary Programs and Honorable Mention Programs. These distinctions were made by the expert review panel on a case-by-case basis. In many cases for which a 6 LEADERS OF THE PACK program was given Honorable Mention, the program displayed innovation and effectiveness at a level that held promise for the future, yet may have had an insufficient track record of results upon which to fully evaluate its level of success. In these situations, the expert panel may have considered the program to be notable and worth monitoring for future results. For some other programs, there may have been program approaches, certain techniques, or new ideas that merit highlighting, rather than the program considered as a whole. ANALYSIS OF NOMINATIONS AND PROGRAMS RECOGNIZED One primary objective of this review is to give recognition and attention to programs that have exemplary attributes and results. Another objective is to analyze the attributes of programs selected as a group to identify a set of best practices criteria and proven design features in the efficiency industry. The exemplary energy efficiency programs of today are leaders in a greatly expanded industry, and it takes more to stay out in front of the pack: More states have energy efficiency resource standards in place now than five years ago when ACEEE conducted the 2nd review, building a demand for programs that collectively can reach such savings targets and still be cost-effective. Budgets and spending for customer/ratepayer-funded funding have approximately tripled over the last five years. ACEEE received nominations from programs serving customers in a total of 36 states, up from 23 states represented in the 2008 review. States and regions of the country that accounted for particularly large numbers of nominations corresponded closely to where there are long records of utility and public programs to support energy efficiency, larger budgets, and more programs overall. The increase in the number of states with at least one nominated program suggests that more customers across the United States are being served by quality energy efficiency programs than five years ago. In particular, the Southeastern states served by the Tennessee Valley Authority (portions of Alabama, Georgia, Kentucky, Mississippi, North Carolina, and Virginia and the majority of Tennessee) account for seven states in which consumers have greatly expanded energy efficiency programs available to them. TVA is not the only organization expanding efficiency in the Southeast, as Duke Energy and others exceed their prior accomplishments in participation, spending, programs, and energy savings. In addition to wider geographic diversity in the nominations, there was continued diversity in the types of organizations that fund, administer, and implement the nominated programs. The types of organizations nominated for their programs include: Federal public utilities such as Bonneville Power Administration and Tennessee Valley Authority Municipal public utilities Investor-owned utilities State agencies Regional market transformation organizations Third-party program implementers 7 LEADERS OF THE PACK © ACEEE Rural electric cooperatives OBSERVATIONS AND COMMON TRAITS OF LEADING PROGRAMS In reviewing the set of exemplary programs, we observed a number of common trends and characteristics among similar and related programs. Some of these successfully address challenges or capture energy efficiency opportunities that had previously eluded costeffective program designs. Some are staking out new energy savings opportunities by promoting efficient technologies or finding ways to reach the harder-to-reach customer segments. All of them demonstrate how strategies being employed in the field can inform the enhanced design and operation of programs with comparable objectives in similar economic and regulatory environments. Features and trends in the programs recognized in 2013 include the following: Targeting market niches and customer sub-segments is an increasingly common strategy. Program implementers have clearly become more sophisticated and experienced in identifying and targeting finely-tailored offerings to market subsegments. Such targeting and more focused marketing enhances program design, can increases participation, and can improve the effectiveness of program communications. This is the case at the program level, such as is the case with CenterPoint Energy Foodservice Program and the Public Service Electric and Gas (PSE&G) Hospital Efficiency Program, as well as within programs such as small business programs. Program administrators are finding ways to reach previously underserved customers with new programs and program approaches. Sometimes this is made possible first by improving cost-effectiveness: streamlining program delivery; costcutting; and even in one case eliminating the customer co-payment that had been too low to justify. In short, program cost-effectiveness is a pathway to greater participation and, in absolute terms, higher energy savings. Programs have been growing larger. Many of the exemplary programs have been increasing spending substantially, some consistently—and others exponentially— over the last three reported program years as they seek to reach more customers and achieve higher savings. There are many “tried and true” approaches that continue to save energy costeffectively year after year. Some of the larger programs have been running for two decades or longer, demonstrating that one of the findings from the second national review of exemplary programs continues to be the case today: program managers, administrators, and implementers have found models and structures that work to reliably generate savings. This category of programs is particularly important, because new program planners and managers can have the assurance that by replicating the models in this portfolio they will have a high likelihood of early and sustained success 8 LEADERS OF THE PACK A clear trend among programs with the most staying power is the ability to adapt and tune their core offerings to maintain and grow cost-effective energy savings. Tactical shifts have involved revising incentive levels, re-focusing on energy efficiency technologies to harvest the most savings (in absolute terms) or to anticipate areas for capturing marginal increases in energy savings, adding new or additional communication tools, or partnering with outside organizations for customer education and marketing. Simplifying processes to make participation simpler for customers is important to increase the number of program participants. Examples include dropping the requirement for an energy assessment, automating the enrollment and other processes, and providing designated account representatives with expertise in the areas needed by the customer. A related common trait is “one-stop shopping” and similar approaches. The customer-facing elements of the program are more comprehensive so that participants’ experience is less confusing and complicated. Often the program will provide a single point of contact—they conduct (or hire a contractor to conduct) an on-site energy assessment, present the customer with a menu of efficiency measures, offer financing, and hire prequalified implementation contractors. Financing has become widespread among exemplary programs, both electric and gas, business and residential, new and mature, large and small. Programs are partnering with banks, nonprofit organizations, and state government lending institutions. Usually interest rates are offered at below-market rates or “bought down” by the program or utility/program administrator, and frequently the loans are interest-free or at zero percent interest rates. Addressing or eliminating the upfront cost barrier to energy efficiency upgrades is not the only benefit, as programs often structure loan terms and amounts to ensure that the customer has positive cash flow (i.e., the monthly dollar savings exceed the loan payments) as well. Therefore, rather than removing an impediment only, they are designed to provide a positive incentive. Financing is not a panacea; its availability does not replace, but rather supplements, program incentives.1 Relationship building is becoming more widely recognized as an important factor for improving conversion rates (from energy assessment/audit to program participant) and overall program participation. This trend is observed in a variety of There are also an increasing variety of approaches and varying degrees of involvement by the program administrators in project financing. Some programs stop at promoting the availability of loans for projects via their lending partners; others provide low-cost, fixed rate, long-term loans to participants. Two exemplary programs in this report are statewide on-bill financing (OBF) or on-bill repayment/recovery programs. These serve participants in the other energy efficiency programs offered by the utilities and state agencies, enabling more and larger projects to be done by a greater number of customers, and expanding energy savings across the efficiency portfolio. 1 9 LEADERS OF THE PACK © ACEEE ways, often in the form of careful selection of the people who represent the program to customers and potential participants. They need to be trusted information sources and/or experts in the eyes of the customer. Who is that “messenger” varies by sector and industry. Often programs use their account managers to represent offerings to larger and more sophisticated customers, where intimate knowledge of that client’s business objectives and constraints is critical to structuring an efficiency offer. With smaller customers, training contractors or trade allies in energy-efficient technologies play a role. Other programs do outreach through and with professional, trade, or community organizations; others emphasize the importance of hiring energy auditors that have direct sales experience for enhancing conversation rates. Programs are working to incorporate the latest energy-efficient technologies, such as light-emitting diodes (LEDs) and other newly emphasized technologies. While this has been a foundational part of energy efficiency programs all along, there is a trend toward higher tiers of efficiency and to promote the adoption of new classes of technology. In this review, we assigned four programs to a “market transformation” category to highlight that aspect. There is a continuing emphasis on statewide approaches and programs. Often all the investor-owned utilities in a state may provide parallel programs, each in their own service territories. Utilities in the states of California, Connecticut, and Massachusetts offer many programs based on a common program platform of services. This provides advantages with branding and messaging, as well as offering consistency to suppliers and contractors across larger market areas. Conclusions Energy efficiency programs for electric and natural gas utility customers are a proven means to help customers reduce their energy costs. The savings achieved through such programs constitute a significant, low-cost energy resource for helping utilities meet system energy needs. These programs also provide important environmental and economic benefits. Today’s leading energy efficiency programs embody over three decades of experience of utilities and related organizations working with customers to improve the energy efficiency of their homes, businesses, institutions, and factories. In this review of leading energy efficiency programs, we found that a common, prominent feature is that they are focused on meeting customer needs. By better understanding customer barriers, motivations, and behavior, programs have evolved to be more and more “customer friendly.” There are exemplary programs serving all types of customers. Increasingly programs have emerged to address the unique needs and challenges associated with various “hard-toserve” customer segments, such as multifamily housing and small business. There also is diversity in the types of organizations administering and providing customer energy efficiency programs, including investor-owned utilities, publicly owned utilities, nonprofit organizations, government agencies, and contractors. The size of such organizations varies widely from small municipal utilities to large utilities serving millions of customers. We 10 LEADERS OF THE PACK found exemplary programs being administered and provided by a wide variety of organizations. Exemplary programs are incorporating innovative program designs and new technologies to better serve customers. There also are exemplary programs that are based on longstanding, proven approaches with little change from year to year. The programs selected and profiled in this report comprise another “compendium of champions,” as were ACEEE’s earlier reports in this series. There are examples of leading programs that are well worth examination and emulation by other interested organizations and program staff. A strength of the energy efficiency program industry is an openness and willingness to share experiences and learn from others. This third national review of exemplary programs captures leading practices for customer energy efficiency programs. Such programs continue to evolve, but what remains constant is their commitment to helping customers save energy through improved energy efficiency. The continued success of these programs is a testament to the skills, creativity, and hard work of an ever-growing number of energy efficiency program professionals. Roster of Award-Winning Programs SMALL BUSINESS Exemplary One-Stop Efficiency Shop® —Minnesota Center for Energy and Environment and Xcel Energy Small Business Energy Advantage (SBEA) —The United Illuminating Company and Connecticut Light and Power in partnership with The Connecticut Energy Efficiency Fund Small Business Program —National Grid Honorable Mention Main Street Program — NSTAR Electric & Gas BUSINESS NATURAL GAS Exemplary CenterPoint Energy Custom Rebate Program—CenterPoint Energy Vermont Gas Systems Commercial Retrofit Program —Vermont Gas Systems, Inc. Honorable Mention Nicor Gas Energy Efficiency Program—Economic Redevelopment Program—Nicor Gas COMMERCIAL AND INDUSTRIAL COMPREHENSIVE Exemplary Arizona Public Service Solutions for Business—Arizona Public Service Existing Facilities Program—New York State Economic Research and Development Authority (NYSERDA) COMMERCIAL AND INDUSTRIAL CUSTOM Exemplary E+ Business Partners Program—NorthWestern Energy 11 LEADERS OF THE PACK © ACEEE Self Direct Custom Efficiency—Xcel Energy COMMERCIAL LIGHTING Exemplary Enhanced Lighting Program—Puget Sound Energy COMMERCIAL AND INDUSTRIAL RETROCOMMISSIONING Exemplary SCE's Commercial Retrocommissioning Program—Southern California Edison ComEd Smart Ideas for Your Business Retro-Commissioning and Monitoring-Based Commissioning—ComEd Energy Efficiency Services Industrial Recommissioning —Pacific Gas and Electric Company and Nexant, Inc. INDUSTRIAL AND LARGE CUSTOMER PROGRAMS Exemplary Production Efficiency (PE)—Energy Trust of Oregon Bonneville Power Administration’s Energy Smart Industrial program—Bonneville Power Administration Focus on Energy Industrial Program—Wisconsin Focus on Energy Honorable Mention Customer Memorandums of Agreement—NSTAR Electric & Gas COMMERCIAL NEW CONSTRUCTION Exemplary New Construction Program—New York State Energy Research and Development Authority (NYSERDA) New Buildings—Energy Trust of Oregon RESIDENTIAL AUDIT AND WEATHERIZATION Exemplary Home Performance Solutions—Nisource/Columbia Gas of Ohio EnergyWise—National Grid Home Energy Squad—CenterPoint Energy, Xcel Energy, Center for Energy and Environment, and Neighborhood Energy Connection RESIDENTIAL HVAC Exemplary Nicor Gas Energy Efficiency Program—Home Energy Efficiency Rebate Program—Nicor Gas Home Energy Solutions (HES)—The United Illuminating Company and Connecticut Light and Power in partnership with The Connecticut Energy Efficiency Fund Honorable Mention High Efficiency Air Conditioning Program—Xcel Energy RESIDENTIAL LIGHTING Exemplary 12 LEADERS OF THE PACK Residential Upstream Lighting Program—Pacific Gas and Electric Company Efficiency Vermont’s Retail Efficient Products Residential Lighting Program—Efficiency Vermont Honorable Mention Residential Retail Lighting—Puget Sound Energy RESIDENTIAL NEW CONSTRUCTION Exemplary Efficiency Vermont and Vermont Gas Systems—Residential New Construction service— Efficiency Vermont and Vermont Gas Systems, Inc. Residential New Construction (RNC)—The United Illuminating Company and Connecticut Light and Power in partnership with The Connecticut Energy Efficiency Fund Rocky Mountain Power wattsmart New Homes Program—Rocky Mountain Power RESIDENTIAL PRODUCTS AND APPLIANCES Exemplary Appliance Recycling Program—Southern California Edison Retail Strategy Initiative—Pacific Gas and Electric Company RESIDENTIAL WHOLE HOME Exemplary Home Energy Assessment Program—UniSource Energy Services Mass Save® Home Energy Services (HES) Program—Berkshire Gas, Cape Light Compact, Columbia Gas, National Grid, New England Gas, NSTAR, Unitil, WMECO RESIDENTIAL NATURAL GAS Exemplary WarmChoice—Nisource/Columbia Gas of Ohio Vermont Gas Systems Residential Equipment Replacement Program —Vermont Gas Systems, Inc. RESIDENTIAL LOW INCOME Exemplary Efficiency Vermont Low Income Services—Efficiency Vermont Low Income Retrofit Program—National Grid Low-Income Multi Family Energy Retrofits/LEAN Multifamily Program—Action for Boston Community Development and Massachusetts program administrators MULTIFAMILY Exemplary PSE&G Residential Multifamily Housing Program—Public Service Electric and Gas (PSE&G) Energy Savers—CNT Energy (CNTe) and Community Investment Corporation (CIC) COMMUNITY-BASED PROGRAMS Honorable Mention 13 LEADERS OF THE PACK © ACEEE Energize Phoenix and Arizona Public Service (APS) Solutions for Business—City of Phoenix Arizona and Arizona Public Service (APS) Marketing Energy Leader Partnerships Program—Southern California Edison Fresno Energy Watch—Pacific Gas and Electric Company COOPERATIVES AND PUBLIC POWER, RESIDENTIAL Exemplary Green Home House Call—Burbank Water and Power Honorable Mention Help My House—Central Electric Power Cooperative (Central) and The Electric Cooperatives of South Carolina (ECSC) EnergyRight® In-Home Energy Evaluation (IHEE) Pilot Program—Tennessee Valley Authority COOPERATIVES AND PUBLIC POWER, BUSINESS Exemplary Energy Efficient Cities —Austin Utilities, Minnesota Energy Resources, Owatonna Public Utilities, Rochester Public Utilities, and Minnesota Center for Energy and Environment EnergyRight® Solutions for Business (ERSB) /EnergyRight® Solutions for Industry (ERSI)—Tennessee Valley Authority Honorable Mention LPEA Energy Efficient Commercial Lighting Retrofit Rebate Program—La Plata Electric Association ON-BILL FINANCING Exemplary On-Bill Financing Program for Nonresidential Customers—California investor-owned utilities On-Bill Recovery Financing —New York State Energy Research and Development Authority (NYSERDA) MARKET TRANSFORMATION Exemplary LED Accelerator—Energy Solutions and Pacific Gas and Electric Company Northwest Ductless Heat Pump Project —Northwest Energy Efficiency Alliance PG&E Distributor Channel Engagement—Pacific Gas and Electric Company and Energy Solutions Honorable Mention ENERGY STAR Pilot Program for Manufactured Homes —Tennessee Valley Authority NICHE/OTHER PROGRAMS Exemplary New York Power Authority Energy Services Schools Program—The New York Power Authority CenterPoint Energy Foodservice Program—CenterPoint Energy Honorable Mention— 14 LEADERS OF THE PACK Energy Efficient Pools and Spas—NV Energy Nonprofit Energy Efficiency Program—Energy Outreach Colorado and Xcel Energy Public Service Electric and Gas (PSE&G) Hospital Efficiency Program —Public Service Electric and Gas (PSE&G) 15 LEADERS OF THE PACK © ACEEE 16 LEADERS OF THE PACK References Elliott, R. Neal, Rachel Gold, and Sara Hayes. 2011. Avoiding a Train Wreck: Replacing Old Coal Plants with Energy Efficiency. White paper. Washington, D.C.: American Council for an Energy-Efficient Economy. Foster, Ben, Anna Chittum, Sara Hayes, Max Neubauer, Seth Nowak, Shruti Vaidyanathan, Kate Farley, and Kaye Schulz. 2012. The 2012 State Energy Efficiency Scorecard. Report Number E12C. Washington, D.C.: American Council for an Energy-Efficient Economy. Friedrich, Katherine, Maggie Eldridge, Dan York, Patti Witte, and Marty Kushler. 2009. Saving Energy Cost-Effectively: A National Review of the Cost of Energy Saved Through Utility-Sector Energy Efficiency Programs. Report Number U092. Washington, D.C.: American Council for an Energy-Efficient Economy. Kushler, Martin, Dan York, and Patti Witte. 2003. Responding to the National Gas Crisis: America’s Best Natural Gas Energy Efficiency Programs. Report Number U035. Washington, D.C.: American Council for an Energy-Efficient Economy. ------------. 2005. Meeting Essential Needs: The Results of a National Search for Exemplary UtilityFunded Low-Income Energy Efficiency Programs. Report Number U035. Washington, D.C.: American Council for an Energy-Efficient Economy. Lazard Ltd. 2012. Levelized Cost of Energy Analysis: Version 6.0. Lazard Ltd. Nadel, Steven. 2006. Energy Efficiency Resource Standards: Experience and Recommendations. Report Number E063. Washington, D.C.: American Council for an Energy-Efficient Economy. Sciortino, Michael, Seth Nowak, Patti Witte, Dan York, and Martin Kushler. 2011. Energy Efficiency Resource Standards: A Progress Report on State Experience. Report U112. Washington, D.C.: American Council for an Energy-Efficient Economy. York, Dan and Martin Kushler. 2003. America’s Best: Profiles of America’s Leading Energy Efficiency Programs. Report Number U032. Washington, D.C.: American Council for an Energy Efficient Economy. York, Dan, Marty Kushler, and Patti Witte. 2008. Compendium of Champions: Chronicling Exemplary Energy Efficiency Programs from Across the U.S. Report Number U081. Washington, D.C.: American Council for an Energy-Efficient Economy. York, Dan, Maggie Molina, Max Neubauer, Seth Nowak, Steven Nadel, Anna Chittum, Neal Elliott, Kate Farley, Ben Foster, Harvey Sachs, and Patti Witte. 2013. Frontiers of Energy Efficiency: Next Generation Programs Reach for High Energy Savings. Research Report U131. Washington, D.C.: American Council for an Energy-Efficient Economy. 17 LEADERS OF THE PACK © ACEEE Young, Rachel, R. Neal Elliott, and Martin Kushler. 2012. Saving Money and Reducing Risk: How Energy Efficiency Enhances the Benefits of the Natural Gas Boom. White paper. Washington, D.C.: American Council for an Energy-Efficient Economy. 18 LEADERS OF THE PACK Appendix: Profiles of Exemplary and Honorable Mention Programs Small Business — Exemplary 23 One-Stop Efficiency Shop® 23 Small Business Energy Advantage 27 Small Business Program 31 Small Business — Honorable Mention 34 Main Street Program 34 Business Natural Gas — Exemplary 38 Custom Rebate Program 38 Commercial Retrofit Program 42 Business Natural Gas — Honorable Mention 45 Nicor Gas Economic Redevelopment Program Commercial and Industrial Comprehensive — Exemplary 45 49 Arizona Public Service Solutions for Business 49 Existing Facilities Program 53 Commercial and Industrial Custom — Exemplary 57 E+ Business Partners Program 57 Self Directed Custom Efficiency 62 Commercial Lighting — Exemplary 65 Enhanced Lighting Program 65 Commercial and Industrial Retrocommissioning — Exemplary 68 Commercial Retrocommissioning Program 68 ComEd Smart Ideas for Your Business Retro-Commissioning (RCx) and Monitoring-Based Commissioning (MBCx) Program 71 Pacific Gas and Electric (PG&E) Industrial Recommissioning (IRCx) 76 19 LEADERS OF THE PACK © ACEEE Industrial and Large Commercial — Exemplary 79 Production Efficiency 79 Energy Smart Industrial (ESI) 85 Focus on Energy Industrial Program 89 Industrial and Large Commercial — Honorable Mention 94 Customer Memorandums of Agreement 94 Commercial New Construction — Exemplary 97 New Construction Program 97 New Buildings 100 Residential Audit and Weatherization — Exemplary 106 Home Performance Solutions 106 EnergyWise 110 Home Energy Squad 113 Residential Heating, Ventilating, and Air Conditioning — Exemplary 118 Nicor Gas Energy Efficiency Program — Home Energy Efficiency Rebate Program 118 Home Energy Solutions™ 122 Residential Heating, Ventilating, and Air Conditioning — Honorable Mention High Efficiency Air Conditioning Program Residential Lighting — Exemplary 127 127 131 Pacific Gas and Electric Company Residential Upstream Lighting Program 131 Efficiency Vermont’s Retail Efficient Products Residential Lighting Program 134 Residential Lighting — Honorable Mention 140 Residential Retail Lighting 140 Residential New Construction — Exemplary 144 20 LEADERS OF THE PACK Efficiency Vermont and Vermont Gas Systems- Residential New Construction Service 144 Residential New Construction (RNC) 149 Rocky Mountain Power wattsmart New Homes 154 Residential Products and Appliances — Exemplary 157 Appliance Recycling Program 157 Retail Strategy Initiative 160 Residential Whole Home — Exemplary 164 Efficient Home Program (formerly BrightSave Home) 164 MassSave Home Energy Services (“HES”) Program 169 Residential Natural Gas — Exemplary 173 WarmChoice Program 173 Vermont Gas Systems Residential Equipment Replacement Program 178 Residential Low Income 182 Efficiency Vermont Comprehensive Low Income Services 182 Low Income Retrofit Program 188 Low-Income Multi Family Energy Retrofits: The Low-income Energy Affordability Network (LEAN) Multifamily Program 194 Multifamily — Exemplary 197 PSE&G Residential Multifamily Housing Program 197 Energy Savers 203 Community Based Programs — Honorable Mention 207 Energize Phoenix and Arizona Public Service (APS) Solutions for Business 207 Energy Leader Partnership Program (ELPP) 211 Fresno Energy Watch 216 Cooperatives and Public Power Residential — Exemplary 21 220 LEADERS OF THE PACK © ACEEE Green Home House Call 220 Cooperatives and Public Power Residential Programs— Honorable Mention 224 Help My House 224 EnergyRight Solutions® In-Home Energy Evaluation (IHEE) Pilot Program 228 Cooperatives and Public Power, Business — Exemplary 232 Energy Efficient Cities 232 EnergyRight® Solutions for Business and Industry 236 Cooperatives and Public Power Business — Honorable Mention LPEA Commercial Lighting Retrofits 241 241 On-Bill Financing — Exemplary 244 On-Bill Financing for Nonresidential Customers 244 On-Bill Recovery Financing 247 Market Transformation — Exemplary 251 LED Accelerator 251 NW Ductless Heat Pump Project 255 PG&E Distributor Channel Engagement Program 260 Market Transformation — Honorable Mention ENERGY STAR Pilot Program for Manufactured Homes Niche/Other Category — Exemplary 266 266 269 Energy Services for Schools Program 269 CenterPoint Energy Foodservice Program 273 Niche/Other — Honorable Mention 277 Energy Efficient Pools and Spas Program 277 Nonprofit Energy Efficiency Program 280 Hospital Efficiency Program 285 22 LEADERS OF THE PACK SMALL BUSINESS — EXEMPLARY ONE-STOP EFFICIENCY SHOP® XCEL ENERGY, SPONSOR CENTER FOR ENERGY AND ENVIRONMENT, ADMINISTRATOR AND IMPLEMENTER Program Overview Approved in 2000, the One-Stop Efficiency Shop® is an innovative, full service lighting rebate program designed to save energy in the hard-to-serve small business sector. Sponsored by Xcel Energy and designed and implemented by Center for Energy and Environment (CEE), the One-Stop Efficiency Shop targets small businesses with a 400 kW demand or less. This sector requires a more focused and unique approach because small businesses have been historically difficult to serve with traditional lighting rebate programs due to limitations in financial resources, time, knowledge of lighting products and access to quality contractors. The One-Stop Efficiency Shop is structured specifically to address these needs and concerns by offering qualified businesses a free, no obligation lighting audit, significant lighting rebates and below-market rate financing. The program currently offers a 3.9% commercial loan as well as a 0% financing option for qualified non-profits. The loan payments are structured to match the owner’s monthly savings so that a neutral cash flow is maintained. Because the One-Stop Efficiency Shop does not sell lighting products, auditors offer customers unbiased recommendations. Yet, due to collaboration with local electrical contractors, the One-Stop Efficiency Shop is also able to offer standard program pricing quotes and a pool of qualified contractors to eliminate the hassle of collecting bids. This combination of services brings education, financial resources and minimal time commitment directly to the customer. During the first few months of the program, CEE learned that although fundamental to the success of the program, attractive rebates and a full-service model were only one part of the equation. Many business owners are not knowledgeable about lighting and are not easily convinced that efficient technology will provide adequate lighting. Others may have tried retrofitting previously when the technology was not as reliable, had a bad experience and are hesitant to try it again. At the beginning of the program these concerns were not adequately taken into account and too much emphasis was placed on completing audits with a lesser priority placed on followup and implementation. CEE realized that this approach was not productive and that the proposed energy savings were not being achieved. CEE redesigned the program in January 2001 and placed more emphasis on selling efficiency by promoting implementation to the customer instead of making completion of the audit the primary focus. 23 LEADERS OF THE PACK © ACEEE The results of this refocused effort were almost immediate. During the first half of 2001, the sales rate increased 50% and the average kW saved per week almost doubled. The Minnesota Department of Commerce approved a one-year extension of the One-Stop Efficiency Shop for 2002. The savings goal was set at 1,600 kW and two additional, full-time auditors with sales experience were hired. Over the course of the year, the program generated savings that exceeded goals by 51%. In each of the following years, the One-Stop Efficiency Shop has continued to exceed program goals. Although accurate audits and incentives are fundamental to the success of the program, educating the customer and marketing the program to address their specific needs is just as, if not more, important. Auditors do not assume that rebates and energy savings will be enough to convince customers to participate. Instead, they work closely with the customer to find out exactly what their lighting needs are and to explain how the One-Stop Efficiency Shop can meet these needs. The significant savings the One-Stop Efficiency Shop has generated for businesses and ratepayers confirms that the program’s sales mentality coupled with a full-service design for implementing energy savings in the small business sector has been a successful approach. A performance evaluation of the program in 2010 further validated this design. An independent firm was hired to conduct the evaluation and found that the One-Stop Efficiency Shop’s combination of full-service and premium rebates is critical to high participation of small businesses; a sector which would likely not otherwise engage in lighting retrofits. The evaluators also found that when compared to peer programs the OneStop Efficiency Shop is one of the lowest cost, full-service lighting retrofit programs in North America. The One-Stop Efficiency Shop is achieving environmental goals by successfully reducing energy use in a market sector that is historically difficult to serve. Within this sector, the One-Stop Efficiency Shop specifically addresses inefficient lighting technology, which accounts for a significant portion of energy use and demand in small businesses. These proven, energy-saving change outs are embedded within a package of attractive incentives, unbiased recommendations and the necessary resources to implement the retrofit. This package is then presented to potential program participants by sales-oriented program staff who know how to identify the specific needs of each business owner and show them how energy-efficiency can help them meet those needs. Program Performance Since the beginning of the program, the One-Stop Efficiency Shop has retrofitted 9,019 businesses saving 88,230 kW and 323,600,000 kWh. 24 LEADERS OF THE PACK Program Goal (kW) Actual Savings (kW) 2000 2001 2002 2003 2004 2005 2006 2007 2008 2009 2010 2011 2012 2100 2100 1600 1775 1625 5200 5200 5546 5546 5546 9000 10,000 11,000 55 1272 2412 2998 3718 5972 6438 7805 8786 11,839 10,798 11,886 14,251 The previous table and the table below illustrate the substantial growth the program has achieved since it was launched in 2000. 2010 2011 2012 Program Expenditures ($ million) $12.4 $14.44 $18.2 Energy Savings (MWh)* 43,200 41,200 47,300 Demand Savings (MW)* 10.8 11.9 14.3 Number of Participants 1122 1489 1898 *Gross savings. Minnesota’s utility efficiency programs report gross first-year savings. The program is cost-effective based on the utility, participant and societal tests. In the last few years the lifetime cost/kWh of the program has been between $.015 and $.019. Cost Effectiveness 2010 2011 2012* Utility 4.05 3.52 3.01 Participant 3.86 3.03 3.30 Societal 1.99 1.79 1.70 Lifetime Cost/kWh $0.0152 $0.0185 $0.0185 *Cost effectiveness numbers for 2012 are as approved in the original proposal. Actual numbers have not yet been calculated for 2012. Lessons Learned Small businesses are difficult to serve with energy efficiency programs. Small business owners have limited resources and energy efficiency is often the last thing on their minds. To serve this market effectively program administrators need to design aggressive programs that bring a wide range of services directly to potential participants, which are founded on a sales, not an educational, mentality. Administrators should foster a culture of sales from lead generation through issuing a rebate check. Key aspects in developing a sales-oriented program include: Offering a full-service program – significant rebates, technical guidance, education, financing and quality contractors to complete the work 25 LEADERS OF THE PACK © ACEEE Defining what a good lead is and creating a process for lead development and follow-up – is there good savings potential, can the potential participant pay for the project, are they really interested? Hiring staff with sales experience – when staff interacts with potential participants their goal should be to close a sale, not just provide information. Aggressively building relationships with vendors and other relevant organizations that can generate leads. Employing robust supporting software – program software should not only be a repository for audit information, but have the functionality to allow staff to organize and track projects to promote implementation. None of these elements is sufficient by itself to create a successful energy efficiency program, but as One-Stop Efficiency Shop administrators have learned over the years their combination can lead to significant implementation of energy efficiency projects in the small business market. Program at a Glance Program name One-Stop Efficiency Shop® Targeted Customer Segment Small businesses with a 400 kW demand or less Program Start Date 1/1/2000 Annual Energy Savings Achieved 131,700 MWh (2010-2012) Peak Demand (Summer) Savings Achieved 37 MW (2010-2012) Other Measures of Program Results to Date $24M annual savings for all program participants since 2000 $360M in savings over lifetime of equipment (15 years) 550M tons of CO2 emissions eliminated Budget for most recent year (and next budget cycle if available) 2012 Funding Sources (name and description) Conservation Improvement Program dollars Website www.mncee.org $18.2M Best Person to Contact for Information about the Program: Name Kristen Funk Position Program Manager Organization Center for Energy and Environment Phone number Email address 612-335-3487 [email protected] 26 LEADERS OF THE PACK SMALL BUSINESS — EXEMPLARY SMALL BUSINESS ENERGY ADVANTAGE UNITED ILLUMINATING COMPANY AND CONNECTICUT LIGHT AND POWER, ADMINISTRATORS VENDOR POOL OF 20 CONTRACTORS, IMPLEMENTER Program Overview Since its inception in 2000, the Small Business Energy Advantage (SBEA) Program has been designed to provide cost effective, turn key energy efficiency services to various types of small businesses. Commercial and industrial customers with an average 12-month peak demand between 10 kilowatts (kW) and up to 200 kW qualify for the program. As part of the program, an SBEA-authorized, licensed professional conducts an energy assessment of a United Illuminating Company (UI) or Connecticut Light and Power (CLP) customer’s facility at no cost. This assessment is reviewed by the utility and, if accepted, the contractor presents a proposal to the customer. The comprehensive proposal will include all possible energy-efficiency measures, the complete costs and estimated energy savings, along with available SBEA program incentives and financing options. Typical energy-efficiency measures include: Energy-Efficient Lighting High-performance fluorescent lighting Induction and LED lighting technology Occupancy sensors Photocells Energy-Efficient Heating/Ventilation/Air Conditioning (HVAC) Equipment upgrades Programmable thermostats Energy-Efficient Refrigeration Anti-condensation door heater controls Evaporator fan controls Open case night covers Plus… Air compressors Variable frequency drives The more comprehensive a project is, the higher the incentive is. For example, a lightingonly project incentive may be approximately thirty percent (30%) of the project cost whereas an incentive for a comprehensive lighting, refrigeration and heating, ventilation and air conditioning (HVAC) project may be forty (40%) to fifty percent (50%) of the project cost. In most cases, comprehensive projects cap at the fifty percent (50%) incentive level. 27 LEADERS OF THE PACK © ACEEE Zero percent (0%) financing with on-bill repayment is available to qualified customers. The interest expense of approximately 6.5% - 9.5% is bought down by the Efficiency Fund. To qualify for a loan, a customer must have a good utility bill payment history for the past six months. The minimum loan amount offered by both companies to the customer is $500, and the maximum loan to UI customers is $100,000 and to CL&P customers is $150,000. The maximum loan term is 48 months. The loans are fully transferrable and assumable. This particular feature is noteworthy since eighty percent (80%) of the customers enrolled in this program are tenants. The most unique feature about the loan program is the source of the capital. The utilities provide the funds that are loaned to the customer. The Efficiency Fund is used as a loan loss reserve fund, allowing the utility to recover any losses from defaulted loans pending quarterly review by Public Utility Regulatory Authority (PURA). The interest paid to the utility on the outstanding loans is the company’s after-tax cost of capital (a mix of debt and equity) - - the same rate the utility would earn on investments on distribution system equipment. By making the investments in energy efficiency appear similar to traditional utility investments, the utility is encouraged to invest in energy efficiency. The impact of energy efficiency financing for small businesses is significant. Approximately ninety-four percent (94%) of UI customers qualify for financing, and of this percentage, fifty percent (50%) decide to participate. Seventy percent (70%) of CL&P’s customers qualify for financing, and of this percentage, sixty seven percent (67%) decide to participate. In contrast, for those who do not qualify for the financing, less than twenty percent (20%) participate for both companies. With the combination of incentives and 0% financing, the utilities have been able to empower the small business community to become more energy efficient. UI and CLP have also partnered with the State of Connecticut which received a State Energy Sector Partnership grant to implement a coordinated statewide workforce development effort to meet increasing demand for skilled workers in the green energy industries. The five Workforce Investment Boards (WIBs) are charged with coordinating Project Teams to guide the initiative. As members of the team, UI and CLP have worked collaboratively with the WIBs across the state to guide the implementation of the State’s plan. The following initiative is an example of growing the workforce and green job growth. A Commercial Energy Audit Program was created by Gateway Community College in response to UI’s and CLP’s need for standardized training for small business auditors. Approximately thirty six students consisting of various contractors and/or their employees have completed the first three classes. Funding for the training is available by the State Energy Sector Partnership grant to qualified candidates. The program has been designed to attract new workers to the field. As a result of the new Step Program, an initiative of the Connecticut Department of Labor and the five Connecticut Workforce Investment Boards, qualified small businesses will receive wage subsidies when they hire eligible unemployed job candidates. These incentives are made possible through the Governor’s jobs bill. Funding for the class will be provided by the State Energy Sector 28 LEADERS OF THE PACK Partnership grant as well. One of the goals is to create an audit workforce that better replicates the diverse small business market. Program Performance The program has been very successful. Accomplishments include: Over $73 million in CEEF (Connecticut Energy Efficiency Fund) incentives paid since inception Over $111 million in 0% loans financed The program has been replicated nationwide Program served as testimony before US Senate Over 4.9 gigawatts in lifetime savings Under $1.09 million in loan defaults For every dollar invested in energy efficiency, there is a $4.00 return on the investment Since 2000 over 16,400 projects have been installed Program expenditures, net annual energy and demand savings, net lifetime savings and number of participants are provided for the UI and CLP SBEA Programs in the tables below. United Illuminating 2010 2011 2012 Program Expenditures ($ million) $2.97 $1.47 $2.64 Energy Savings (kWh 000s) 7,789.0 5,115.0 6,321.4 Energy Savings (kW) 1,172.0 811.0 814.5 Net Lifetime Savings (kWh 000s) 97,574 63,381 79,627 Number of Participants 340 300 302 Connecticut Power and Light 2010 2011 2012 Program Expenditures ($ million) Energy Savings (kWh 1,000s) Energy Savings (kW) Net Lifetime Savings (kWh 1,000s) Number of Participants $12.10 $11.93 $11.80 30,392.0 29,681.0 28,938.3 5,244.0 4,759.0 3,692.4 376,215 368,832 1546 1504 353,640 1508 Benefit/Cost Ratios, based on the Electric System and Total Resource Cost tests, demonstrate that the UI and CLP SBEA Programs are cost-effective. Lifetime cost per kWh is also provided. 29 LEADERS OF THE PACK © ACEEE United Illuminating 2010 2011 2012* Electric System 5.6 3.3 2.6 TRC 2.7 1.6 1.2 $0.030 $0.031 $0.033 2010 2011 2012* Electric System 3.2 2.4 2.6 TRC 1.8 1.5 1.4 $0.032 $0.032 $0.033 Lifetime Cost per KWh ($) Connecticut Power and Light Lifetime Cost per KWh ($) Lessons Learned In 2000, when the program started, the expectations of the participating contractors were not well defined as the program was in the development stage. Managers found clear definition of expectations to be critical in administering an effective program. To address this, a “workflow” process was developed to guide the contractor from lead to completed project. The workflow guide included a common process for communicating each stage of a project’s milestones in the software provided. Administrators also established a process for e-mail communication when requesting leads, project approvals and final installation notification. They found that a simple thing, such as entering the name of the project in the subject of the e-mail request to be extremely helpful in identifying a priority request, especially when there are over a hundred requests at any given time. At the end of 2000 program managers found that there were inconsistent performance issues among the participating contracts. At that time they established a quarterly evaluation process. This is critical is setting a performance standard. It has well received by the contractors so that they can gauge the way they do their job and there are no “surprises’ in the event an underperformer needs to be released from the program. The utility and the contractor learned the hard way that it is critical for a contractor to note in the memo section on a project if there are “pre-existing conditions” at a facility. In a few cases the customer stated that the contractor caused the issue and it wasn’t there prior to them starting the installation. They highly recommend that the contractor to take ‘before and after” photos or the (unhappy) customer will “own” the issue. Administrators found that an effective way to increase participation without increasing incentives is by extending the 0% loan term beyond the payback period. In the first few years a typical project with a 2 year payback would end up with a 25 month loan creating a slightly positive payback. In that same scenario Administrators would now make it a 28 to 30 month loan. The rate of participation has increased without increasing the incentive funds. 30 LEADERS OF THE PACK Program at a Glance Program name Small Business Energy Advantage Targeted Customer Segment Small Business Customers up to 200,000 kW Program Start Date 2000 Annual Energy Savings Achieved 36m kWh Annual Peak Demand (Summer) Savings Achieved 5k kW Other Measures of Program Results to Date (such as number of participants, participation rates or 16400 since program inception market penetration). Budget for most recent year (and next budget cycle if available) $13.2 million Funding Sources (name and description) Public fund from charge on energy bill, RGGI and Class III Website www.uinet.com Best Person to Contact for Information about the Program: Dennis O’Connor Name Dennis O’Connor Position Senior Program Administrator Organization The United Illuminating Company Phone number 203-499-3715 Email address dennis.o’[email protected] SMALL BUSINESS — EXEMPLARY SMALL BUSINESS PROGRAM NATIONAL GRID, ADMINISTRATOR (IMPLEMENTATION CONTRACTS VIA STATE-BY-STATE BID PROCESS) Program Overview The Small Business Program’s (SBP) direct install model has been recognized by many national best practices studies and awards as the best delivery mechanism to comprehensively and cost effectively address the small business energy efficiency market, and it has been implemented in many parts of the U.S. and Canada including Massachusetts, Rhode Island, New York, Vermont, and Nova Scotia. 31 LEADERS OF THE PACK © ACEEE In Massachusetts, each Program Administrator (PA) began offering some kind of specialized efficiency services for small business customers in the 1990s. The direct install turnkey model was first offered by National Grid in 1990 for customers 50 kW and smaller. With experience, it has evolved and improved over time and has been subsequently adopted, with some minor variations, by all the Massachusetts PAs. The Program was adopted in Rhode Island shortly after the original launch in MA and was subsequently launched in New York in 2008. The threshold for participating in the Program in MA was changed to 300kW as of 2010 when, as a group, and as documented in the 1st Massachusetts 3 Year Energy Efficiency Plan, all the Massachusetts PAs agreed to harmonize, to the extent possible, their offerings to small business customers. For a period of time prior to this, to be eligible, National Grid customers needed to have a maximum demand of 200kW. In RI, the threshold for participation is 200 kW while the threshold in NY is 100 kW. Since its inception when the Program focused primarily on lighting and refrigeration direct install measures, it has broadened its continuously expanded its scope to include a vast array of both electric and gas measures spanning lighting, lighting controls, motors, compressed air, VFDs, cooling, ventilation, energy management systems, and plug loads, water heating, building envelope, insulation, HVAC, and kitchen equipment. In Massachusetts, PAs offer incentives of 70% of project costs with the exception of Cape Light Compact which offers 80%. The 70% incentives are also provided by National Grid in both RI and NY. On-bill repayment (OBR) is available as an option for customers’ to finance their 30% share of project costs, either over up to 24 months at zero percent interest or as a lump sum payment with an additional 15% discount, resulting in most customers’ projects having a positive cash flow when they choose the 24 month repayment option. The implementation vendor for the Program in each state is selected through a competitive bidding process based on proposed standard rates for labor and materials to install eligible measures. Through a turnkey process, this vendor markets the Program, performs audits of the customers‘ facilities, offers recommendations to customers encompassing both prescriptive (fixed $) and custom (based on unique savings criteria of a project) measures, completes audit forms and questionnaires, purchases lighting equipment from a supplier also selected through a competitive bid process, installs measures, inputs data into a project database, and prepares progress reports on a regular basis. A separate vendor handles services for recycling ballasts and lamps to ensure proper disposal. Marketing of the program is handled primarily by the implementation vendor using lists of eligible customers. The vendor uses direct mail and telemarketing, as well as specialized targeting efforts for hard-to-reach market segments such as customers in economic development zones and ethnic neighborhoods, and outreach through neighborhood business associations. Trade allies, industry stakeholders, suppliers and company field personnel also inform customers about the program‘s benefits and incentive mechanisms. In addition, small business customers with high-bill complaints may be referred to the program as a way for them to reduce their electric and gas usage. 32 LEADERS OF THE PACK Program Performance Program expenditures, natural gas and electric net annual energy savings and participation levels are provided in the table below. A 2010 Process Evaluation is available for the Massachusetts version of the program at http://www.ma-eeac.org/docs/ 2011%20EM&V%20 Studies/MA%20NR%20SB%20%202010%20Process%20Evaluation%20Report%20-%20 FINAL.pdf. 2010 2011 2012* Program Expenditures ($ million) $43.2 $60.3 $34.7 Energy Savings (MWh) 145,165 178,992 155,000 Energy Savings (Therms) 83,342 288,916 186,100 Number of Participants 9,388 12,160 11,200 *Note: 2012 values are preliminary. Benefit/Cost Ratios, based on the Total Resource Cost test, demonstrate that the program is cost-effective. 2010 2011 2012* Electric TRC 3.14 3.14 N/A Natural Gas TRC 12.59 9.6 N/A *Note: 2012 values are preliminary and not available. BCR’s are for MA and RI only; tracking of BCRs is not a regulatory requirement in NY. Lessons Learned Three key lessons have been learned from this program: 1. A turnkey approach, making the process easy and non-intrusive, is critical because of the lack of time and resources available to typical small businesses. 2. Generous incentives are required to overcome the lack of available capital typically found in small businesses. 3. On-bill repayment, which can make many projects cash flow positive on day one, can be a significant inducement to participate while also simplifying the payment process. Program at a Glance Program name Small Business Program Targeted Customer Segment All customers in all sectors with demand < 300kW in MA, < 200kW in RI, and < 100kW in NY Program Start Date Early 1990s 33 LEADERS OF THE PACK © ACEEE Annual Energy Savings Achieved Roughly half a million annual KWh and therms cumulatively over past 3 years Peak Demand (Summer) Savings Achieved More than 32,000 MW over past 3 years Other Measures of Program Results to Date Over 30,000 participants in past 3 years Budget for most recent year (and next budget cycle if available) Total Budget 2012 = $63,000,000 2013 = $55,000,000 Funding Sources (name and description) Systems Benefit Charge Website www.MassSave.com Best Person to Contact for Information about the Program: Name David Gibbons Position Principal, Program Strategy Organization National Grid Phone number 781.697.1074 Email address [email protected] SMALL BUSINESS — HONORABLE MENTION MAIN STREET PROGRAM NSTAR ELECTRIC & GAS ADMINISTRATOR AND IMPLEMENTER Program Overview Main Street targets a hard-to-reach subset of the small business customer class served by NSTAR’s Small Business Services direct install program. This subset includes the smallest of these business customers, those <20kW, who, while numerous and vital to local economies, individually offer a very small savings potential relative to the transaction cost of serving them. Even under the simplified standard Small Business Services direct install model that has been offered in Massachusetts for over twenty years to the one-chair barbershop, the corner convenience store, the shoe store, gift shop, and florist all require a sales call, an audit, a scheduled retrofit installation, some kind of payment arrangement, and a post installation for quality control. In addition, since these savings are so minor as compared to other operating costs it is very difficult to get these customers’ attention. Program targets both gas and electric measures that can be quickly identified and replaced and that offer predictable savings in all applications. Measures include: T12/T8 lamp and ballast retrofits to High Performance T8s, exit sign retrofits, CFLs, pre-rinse spray valves, etc. A long history of impact evaluation results has verified that lighting constitutes more 34 LEADERS OF THE PACK than 85% of the savings potential in the small business market, and Main Streets focuses on that opportunity. NSTAR’s premise was the customer acquisition costs exceeded the benefit of collecting the standard small business program customer co-pay of 30%. By removing the co-pay, making the offer free, close ratios could be improved, sales time could be reduced, and the cost of collecting and processing very small customer payments could be eliminated. To further reduce costs, implementation could be streamlined by targeting simple common measures in specific targeted compact and “customer-dense” business districts, while referring other measures/customers to the traditional program. Even with an increased incentive, by leveraging these strategies the potential to actually reduce costs existed. To test this hypothesis, NSTAR piloted several variations of a Main Street community-based campaign model that essentially represented a “bare-bones”, streamlined version of its conventional direct install program. The company targeted geographical areas with high densities of small customers (defined a <20kW) in order to achieve economies of scale in implementation cost. These were neighborhood business districts in the City of Boston – Mattapan and Washington Gateway - and in several of the city’s older inner suburbs – Cambridge (two districts) and Newton. These pilots were presented as a limited time – often one day – opportunity to have a limited menu of the most common efficiency measures found in these business types installed at absolutely no cost. Delivery was structured as follows: 1. A neighborhood was selected based on self-identification and density. That is, it was: (a): an identifiable (usually named) and definable area that; (b) contained a minimum number of contiguous and abutting businesses within that were; (c) predominately engaged in retail and personal and professional services. 2. Businesses in the targeted zone received a mailing explaining the free service and identifying the single date when their “neighborhood blitz” would take place and the no-cost service would be available, fostering a sense of urgency and need for decision. 3. On the day of the service, a program representative – a “canvasser/auditor” would proceed through the district just in advance of a team of electricians/installers. The canvasser would do a quick count of the number of eligible measures, secure the owner’s approval for the installation, and deliver the measure count to the installation team. 4. The team would perform the installations, drawing materials from a pre-stocked supply truck that moved with them. 5. Any businesses that declined, or businesses outside of the target size, would be advised that they could go on a list to be subsequently served by the conventional Small Business Services direct install program, with its accompanying co-pay requirements, at a subsequent date. 35 LEADERS OF THE PACK © ACEEE As noted above, the offer is free, thereby vastly reducing sales expenses and increasing uptake (100% of eligible customers in some cases) and eliminating co-pay collection and administration costs. Program Performance A primary purpose of the pilot was to establish if a program like this was cost-effective at the pilot level. It was determined to be more expensive than the conventional statewide direct install delivery model, but it reaches an unserved/underserved market that does contribute to the system benefit fund. That having been determined, it t will now be rolled out as a selected offering to interested identifiable geographically-proximate business communities. Streamlining direct install delivery in the field tests did reduce the impact of the 100% incentive, but delivery costs were still about 15% higher than the traditional Small Business Services/direct install program. However, NSTAR’s analysis is that, fully scaled, this effort could be delivered at a 5% increase in costs over the standard Small Business Services offering; e.g., .43/kWh. This was a controlled pilot, so the budget was minimal. Actual spending was $100,000. Total gross electric savings from the five pilot one-day events was 236,000 kWh. There were 76 participants total in 5 pilot locations. The pilot was evaluated by internal NSTAR evaluation staff (see below). Lessons Learned Recall that NSTAR’s premise for the pilot project was that the customer acquisition costs exceeded the benefit of collecting the standard small business program customer co-pay of 30%. Main Street established that by making the offer free and by introducing the program through a “trusted messenger”, close ratios could be dramatically improved. Further reductions in cost were achieved by: voiding the multiple separate audit, proposal presentation and contract signing, and installation visits (these are now compressed into a one-day, one-touch operation); dispensing with the collection and processing very small customer payments; and by targeting simple common measures in specific targeted compact and “customerdense” business districts, while referring other measures/customers to the traditional program. Thus, even with a 100% incentive, deploying these strategies reduced costs significantly. The cost-effectiveness of this delivery model is highly dependent on gaining participation of virtual all of the customers in the target area during the focused short time period of the offer. Several field tests were conducted using this model with variations in delivery and 36 LEADERS OF THE PACK demographic location. The largest determinant of uptake appears to be how the canvasser/auditor is received as a “trusted messenger” for the offer. For example, representatives from community-based groups were used as the canvassers in one neighborhood test. There the participation rate was around 25%. In three other neighborhoods, an NSTAR employee, identified as such, was the canvasser. In these tests participation ranged from 70% to 100%. NSTAR’s conclusion is that small business owners have more trust in utility representatives on energy matters than do community-based organizations. Evaluations have not probed the “why” of this result, but it could be associated with familiarity (the utility has touched the customer every month for years with a bill, and generally a bill insert) and/or accountability (if the retrofit is unsuccessful, customers know that they regulatory and political channels by which to influence a utility). Cost of acquisition ranged from .63/kWh (using community-based organizations for sales) to .52/kWh (when an NSTAR employee made the sales calls). Program at a Glance Program name Main Street Program Targeted Customer Segment Very small (<20kW) businesses in urban business districts. Under 20kW demand is the monthly average over a 12 month period. This is actual demand and not summer peak. Some of these customers are also on 0 demand meters. Program Start Date 12-2009 Annual Energy Savings Achieved Pilot achieved 236,000kWh from 76 customers in 5 pilot locations Annual Peak Demand (Summer) Savings Achieved: 40 kW Other Measures of Program Results to Date (such as number of participants, participation rates or market penetration). Under preferred delivery model, close to 100% participation. Customer samples indicate 100% satisfaction. Budget for most recent year (and next budget cycle if available) N/A Funding Sources (name and description) System Benefit Fund Website N/A Best Person to Contact for Information about the Program: Name Frank Gundal Position Manager, Implementation Organization NSTAR Electric & Gas Phone number (781) 441-8151 Email address [email protected] 37 LEADERS OF THE PACK © ACEEE BUSINESS NATURAL GAS — EXEMPLARY CUSTOM REBATE PROGRAM CENTERPOINT ENERGY MINNESOTA GAS: ADMINISTRATOR AND IMPLEMENTER Program Overview Through its Conservation Improvement Program (CIP), CenterPoint Energy offers a customized program for its commercial and industrial customers in Minnesota who use natural gas for their process and/or heating load. CenterPoint Energy’s Custom Rebate Program is designed for the unique equipment needs of large commercial and industrial customers. CenterPoint Energy’s industrial sector in Minnesota (excluding CIP-exempt customers) is dominated by the four largest segments of food and beverage, fabricated metal products, paper, and construction. The primary gas uses in these four segments are conventional boilers, process heating and HVAC. The Custom Rebate Program provides a sizeable amount of energy savings. Industrial customers use the greatest amount of energy on a per customer basis, and therefore generate the greatest potential savings with any individual energy efficiency improvement. Based upon the 2011 calendar year CenterPoint Energy’s gas forecast shows that 24% of overall gas consumption is by the Industrial sector. The company offers rebates to these customers for increased efficiency of equipment installed in such facilities versus standard equipment available or equipment currently in use and not in need of replacement. Examples of some of the technologies that have been rebated through the Custom Rebate Program include: Infrared processing equipment Curing and coating systems Tower/shaft aluminum melting furnace Process drying Heat treating furnaces Energy recovery systems (including biogas energy recovery) Process steam and hot water systems Thermal curtains Other customized equipment installations CenterPoint Energy’s Custom Rebate Program is implemented through Key Account Sales Managers who are assigned by market segment as technical experts for the processes their customers use. By understanding these customers’ energy consumption patterns on a caseby-case basis, Account Managers are able to help identify savings opportunities among CenterPoint Energy’s largest customers that would otherwise not be realized through prescriptive program offerings. CenterPoint Energy’s Key Account Managers work closely 38 LEADERS OF THE PACK with customers and dedicated CenterPoint Energy CIP engineers to develop the efficiency improvements that ensure that the most energy- and cost-efficient equipment appropriate for the customer’s use is installed. CenterPoint Energy Key Account Managers and engineers verify the level of savings associated with each project; ensure the project meets state regulatory requirements for cost-effectiveness and other program policies; and determine the appropriate level of rebate for the project. The company’s engineers document the project description, evaluation of energy savings, calculation of costeffectiveness and the amount rebated to the customer and make documentation available to state regulators. Rebates for the Custom Rebate Program typically range from $2.00 to $3.50 per dekatherm of verified savings, depending on project cost and other factors. The Custom Rebate Program was developed in the mid-nineties to address the potential energy savings in the niche market segment of large industrial customers, which represents a substantial percent of CenterPoint Energy’s throughput. Since its inception the program has evolved and expanded in a number of ways. For one, the current program is much larger – participation in the program has increased by six-fold in the past five years. Further, as the Custom Rebate Program matured, the projects rebated have become increasingly more innovative and inclusive of a diverse range of customers. The program initially focused on industrial customers; however, the program now includes non-industrial commercial customers such as schools, churches and office buildings. One impetus for the broader range of customers targeted in this program came from a policy change in 2011 that gave large customers the opportunity to opt out of the CIP program. The opt-outs decreased custom project opportunities in the large industrial customer market, and required CenterPoint Energy’s Custom Rebate Program to become even more innovative and proactive in finding savings opportunities for smaller industrial and commercial customers. Increased state energy efficiency targets have also driven the expansion of the program since their adoption in 2007. Program Performance Program spending, energy savings and participation increased between 2009 and 2011. Annual program spending over the last 3 years ran between one and two million dollars. Program participation more than doubled during that same time period. Program Expenditures ($ million) Energy Savings (MCF) Number of Participants 2009 2010 2011 $1.29 $1.42 $1.77 237,076 277,741 350,132 59 88 148 Note: Minnesota’s utility efficiency programs report gross first-year savings. Impact evaluations have not been performed for the Custom Rebate Program. However, each individual custom rebate project is evaluated by CenterPoint Energy’s technical experts to verify savings calculations and cost-effectiveness. The overall Custom Rebate 39 LEADERS OF THE PACK © ACEEE Program, as well as individual custom projects, must pass the societal and utility cost tests with a score of 1.0 or above to qualify for a CIP rebate. Each project must have adequate and appropriate documentation to support project costs and savings and this documentation is made available to the Minnesota Department of Commerce for review. Projects estimated to exceed 20,000 Dth of annual savings require a formal measurement and verification plan, consistent with Minnesota’s EM&V Protocols. Each measurement and verification plan is reviewed and approved by the Minnesota Department of Commerce. The results of each evaluation are also provided to the Department for review and acceptance of the final claimed savings amount. Minnesota requires the societal test for utility conservation projects. Minnesota also requires utilities to provide the utility cost test, the participant cost test and the ratepayer impact test for utility-run conservation projects. The results of each required test are provided below, along with the lifetime cost of energy conserved (dollar per lifetime MCF saved), for the most recent three years of the Custom Rebate Program. Participant Test Ratepayer Impact Test Lifetime Cost of Conserved Energy ($/MCF) 3.09 3.03 0.93 $0.34 22.87 4.22 3.02 1.19 $0.38 20.52 4.12 3.01 1.21 $0.46 Program Year Utility Cost Test Societal Test 2009 20.07 2010 2011 Lessons Learned Over the years, the Custom Rebate Program has evolved to address the needs and opportunities of commercial and industrial customers and deliver greater energy savings. One of the keys to the program’s success has been the market segmentation of the company’s Key Account Managers, which allows each account manager to become intimately familiar with the industries they serve. This allows account managers to develop a deep understanding of customers’ energy needs and provides opportunities to bring successful energy saving ideas to other participants in the industry. This focus, in combination with the strategy of making conservation an integral part of traditional sales and marketing activities, makes the account managers experts in their customers’ industries as well as key partners in the customers’ business. The use of value-based profiling allows the Key Account Managers to focus on customers with the greatest potential and propensity to engage in efficiency projects. The use of dedicated engineers who focus on energy efficiency projects ensures that the Custom Rebate Program is not competing with the company’s operational areas for internal technical resources. Finally, the practice of identifying and pursuing untapped savings opportunities, either through new technologies or by engaging with under-represented markets, is key to ensuring continued program performance over time. 40 LEADERS OF THE PACK Program at a Glance Program name Custom Rebate Program Targeted Customer Segment Large Commercial and Industrial Customers Program Start Date 1995 Annual Energy Savings Achieved 2009: 237,076 MCF; 2010: 277,741 MCF; 2011: 350,132 MCF Peak Demand (Summer) Savings Achieved N/A Other Measures of Program Results to Date CenterPoint Energy’s Custom Rebate Program has been recognized in each of ACEEE’s previous reviews of exemplary efficiency programs. Budget for most recent year (and next budget cycle if available) 2011 Spending: $ 1,765,469 2012 Budget: $ 2,802,720 2013 Budget: $ 2,495,980 Funding Sources (name and description) Ratepayer-funded Conservation Improvement Program (CIP) Website: http://www.centerpointenergy.com/services/naturalgas/business/re batesforbusiness/customrebates/MN/ Best Person to Contact for Information about the Program: Name Todd Berreman Position CIP Implementation Manager Organization CenterPoint Energy Phone number 612-321-4311 Email address [email protected] 41 LEADERS OF THE PACK © ACEEE BUSINESS NATURAL GAS — EXEMPLARY COMMERCIAL RETROFIT PROGRAM VERMONT GAS SYSTEMS, INC., ADMINISTRATOR AND IMPLEMENTER Program Overview The Commercial Retrofit Program is designed to reduce natural gas consumption and peak day demand by encouraging Vermont Gas Systems’ (VGS) commercial and industrial customers (building owners or occupants) to install cost-effective, natural gas-saving space, water and/or process heating measures. VGS currently has approximately 5,400 commercial and industrial customers. Measures that are typically recommended and installed include such items as insulation and air sealing for small retail and office spaces, high efficiency boilers and furnaces, carbon dioxide sensors for demand control of ventilation systems, direct digital burner controls for large commercial and industrial boilers, improved steam and process controls, heat recovery projects, and retro-commissioning. VGS provides customers with a free walk-through audit of their facility to identify potentially cost-effective energy efficiency measures. Engineering assistance is provided by VGS to customers where potentially cost-effective measures are identified in the walkthrough evaluation. When outside engineering assistance is required or requested by the customer, VGS may assist with the cost of the engineering study. VGS offers financial incentives to customers who install cost-effective energy efficiency projects, typically in the form of rebates. Rebate amounts vary and are project specific, based on the customer's savings and payback for the investment, and the value of the avoided cost savings to VGS ratepayers. Rebates are capped at the amount necessary to buy-down customers' paybacks for their investments to three years or to a budgeted $/Mcf saved. Energy efficiency projects for Interruptible customers are treated no differently than projects for firm customers in the Commercial Retrofit program, with the exception that no peak day savings are projected for interruptible customers. VGS encourages both interruptible and firm customers to participate in VGS' Commercial Retrofit program. The Commercial Retrofit Program has been offered to this customer group since October of 1992. Since then the program has continued to evolve to include more complex measures such as exhaust stack heat recovery, commissioning, and complex boiler re-builds for industrial boilers. In the past year, VGS began to offer low interest project financing for smaller scale customers who may not have a defined avenue of financing their project. 42 LEADERS OF THE PACK Program Performance The table below summarizes actual program expenditures, energy savings and number of participants for the Commercial Retrofit Program between 2009 and 2011. Actual annual expenditures ranged from $240,000 to $340,000 with annual savings between 13,400 and 58,250 Mcfs. 2009 2010 2011 Program Expenditures ($ million) $.24 $.23 $.34 Energy Savings (Mcf)* 13,435 13,407 58,243 Number of Participants 25 completions + 26 audits, no install 20 completions + 27 audits, no install 20 completions + 28 audits, no install *All savings are net. The cost-effectiveness of the Commercial Retrofit Program is shown in the following table. Results of the utility cost test and the total resource test are provided with and without external benefits. Cost Effectiveness 2009 2010 2011 Utility Cost Test with External Benefits 16.1 15.6 41.9 Utility Cost Test without External Benefits 9.6 9.3 24.8 Total Resource Test with External Benefits 4.6 4.3 7.0 Total Resource Test without External Benefits 2.7 2.5 4.2 Lessons Learned VGS' Commercial Retrofit Program offers complete flexibility to explore and encourage any gas-saving technologies that might be cost-effective within established criteria. This allows VGS to respond to high bill concerns from smaller gas customers such as neighborhood stores, restaurants, and others while also pursuing highly cost-effective industrial process savings for manufacturers and local schools and universities. Large commercial retrofit opportunities provide a significant savings opportunity for VGS as well as for building operators. Taking a more comprehensive look at small commercial operations has confirmed that there are significant barriers to retrofitting these projects. The costs associated with successfully modifying building envelopes in the small commercial market is often quite high relative to the available energy savings, and small businesses typically have significant constraints in making longer term investments of this kind, even with VGS rebates taken into consideration. The difficulty of bringing these projects to construction is a compelling argument in favor of C&I new construction programs, which can much more costeffectively address design issues that will result in reduced natural gas usage than a retrofit program can over the lifetime of the building. The incremental cost of building a more 43 LEADERS OF THE PACK © ACEEE efficient building is almost always far less than the cost of retrofitting an existing inefficient building. While the savings and cost-effectiveness of small commercial retrofits may pale in comparison with large commercial and industrial projects, VGS is committed to providing efficiency services to all customer classes. Program administrator persistence is the key in project completion for large projects since many of these can be on the planning/drawing board for up to three years before construction is ultimately completed. VGS works hard to put a consistent message to the market place for all of its commercial program offerings, so that the engineer, who designs a new office building one year, knows to contact VGS when working on a system change-out for an apartment building the next year. In addition to the direct resource acquisition benefits that accrue to VGS, there are additional benefits for the three VGS commercial programs. These benefits continue to influence the typical construction specifications created by area designers and mechanical contractors, thus providing additional future Market Transformation benefits as well. Program at a Glance Program name Vermont Gas Systems Commercial Retrofit Program Targeted Customer Segment Commercial and Industrial Retrofit Program Start Date October 1993 Annual Energy Savings Achieved 290,870 Mcf Annualized since 1993 Peak Demand (Summer) Savings Achieved: 958 Mcf winter peak day savings since 1993 Other Measures of Program Results to Date: Lifetime savings 5,237,102 Mcf since 1993 Budget for most recent year (and next budget cycle if available): 2011 CY projection $239,864 2012 FY projection $268,911 Funding Sources (name and description): Recovered entirely from rates Website: http://www.vermontgas.com/efficiency_programs /comm_programs.html Best Person to Contact for Information about the Program: Name Scott Harrington or Raymond Keller Position Energy Services Manager or Energy Services Engineer Organization Vermont Gas Systems, Inc. Phone number 802-951-0372 or 802-951-0389 Email address [email protected] or [email protected] 44 LEADERS OF THE PACK BUSINESS NATURAL GAS — HONORABLE MENTION NICOR GAS ECONOMIC REDEVELOPMENT PROGRAM NICOR GAS AND ENERGY CENTER OF WISCONSIN, ADMINISTRATORS; CNT ENERGY, IMPLEMENTER Program Overview In developing its first three year energy-efficiency program plan, Nicor Gas recognized the need and opportunity to assist customers that were working in economically challenged areas. Nicor Gas envisioned a plan that would provide financial incentives to make energy efficiency projects more affordable in these regions. Such a program would allow Nicor Gas to: Provide the additional resources necessary to ensure that valuable energy efficiency projects are completed in economically-challenged areas, while also creating a positive impact in the community. Work with Chambers of Commerce, economic redevelopment organizations, nonprofit organizations and private businesses to leverage energy efficiency funds with other investments that are being made specifically for community improvement purposes. Work with community-based and non-profit organizations to increase the energy efficiency of their facilities. The program will help to reduce their energy cost burden, allowing organizations to devote more of their resources to providing community services. The Nicor Gas Economic Redevelopment Program targets existing commercial, industrial and large multi-family buildings located in areas of the utility service territory in need of economic redevelopment. Additionally, the program also assists entities located anywhere in the Nicor Gas service territory that contribute to the overall objective of sustainable economic and community redevelopment. Eligible organizations typically offer community services such as health care, education, affordable housing and job creation/retention. The program also supports efforts to redevelop environmentally contaminated industrial and commercial sites, commonly known as “brownfields,” with energy-efficient facilities. Funding focuses on projects that demonstrate a strong positive community impact including: Brownfield site rehabilitation Job creation Affordable housing solutions 45 LEADERS OF THE PACK © ACEEE Community-based private programs, such as health care centers, charter schools, daycare programs and activities The core of the Economic Redevelopment Program is comprised of customized energyefficiency retrofits designed to meet the needs of individual facilities. Improvements to the building envelope, high-efficiency HVAC equipment, steam traps and improved boiler controls are just a few examples of measures used in making existing buildings more energy efficient. The Economic Redevelopment Program offers comprehensive expert technical assistance and extensive guidance throughout the process of identifying and completing energyefficiency improvements. Services provided by a team of professional energy engineers and building designers include: A complete evaluation of the project and design documents. A report detailing recommended energy-efficiency technologies and systems, estimated savings and available incentives. Assistance in applying for additional incentives. Design review and construction oversight to ensure quality results. Financial incentives available through this program include: Technical consulting, design and engineering assistance (estimated $20,000 value) provided at no cost. Financial incentives of $0.75 per therm saved (up to $100,000) per project based on the performance of energy-efficient upgrades. Financial incentives for design teams to help cover the cost of design services. The actual incentive dollar amounts and the total value of technical assistance provided are based on the scope of the project, measures implemented and therms saved. An example of a typical project in the Nicor Gas Economic Redevelopment Program is the comprehensive renovation of a 93,000 square foot industrial building that has been vacant for thirty years. After a two-phase renovation, the facility will provide light manufacturing and office space for a company that recycles end-of-life electronics. The new owners are upgrading energy efficiency beyond code requirements with help from the program. In the first phase, the facility will receive upgrades to building shell, interior and exterior lighting and HVAC equipment. This project will bring jobs and new business to a Tax Increment Financing (TIF) district and divert e-waste from the landfill. When complete, annual natural gas savings are expected to exceed 92,000 therms. The project is also eligible for electric incentives from ComEd for savings in excess of 460,000 kWh. Program Performance Program performance measures are detailed in the table below. The program served only one participant in the first year but participation in the second year has significantly increased. The first year evaluation report is not yet complete. 46 LEADERS OF THE PACK Program Expenditures ($ million) Year 1 (6/1/11-5/31/12) $.12 Year 2 (6/1/12-5/31/13) $.36 (to date) Year 3 (6/1/13-5/31/14) N/A Energy Savings (Gross Therms) 893.0 178,399 (to date) N/A Number of Participants 1 32 (to date) 7 (to date) In Nicor Gas’ approved Energy Efficiency Plan, the UCT benefit-cost ratio for the Economic Redevelopment Program was 3.2. (This analysis evaluated the program over its first three years, which allowed for participation levels high enough to offset startup costs). Total Resource Cost values filed in Nicor Gas’ approved Energy Efficiency Plan were 2.4 for Program Year 1, 2.5 for Program Year 2 and 2.6 for Program Year 3. Nicor Gas estimates the lifetime cost of conserved energy (CCE) for the Economic Redevelopment Program as $0.19 per therm. (This estimate assumes all therms reserved or verified to-date and the estimated cost to-date to achieve those therms). Lessons Learned The lessons learned in this program have been numerous: There is no single source from which to obtain maps of tax increment financing (TIF) or enterprise zones. The economic development zones change so often that communities have stopped developing maps. The most efficient method to determine economic development eligibility is to contact the economic development staff for a particular community and review the project site address. Forming partnerships with community loan funds, foundations and economic development professionals is of key importance. It is helpful to leverage existing and create new relationships with social service or community assistance organizations. If there is a community agency, partner with them to bring energy efficiency to their process and clients. Program flexibility is important. For many clients, cash flow is an issue. They may not have access to the capital needed to complete a project and must continue fundraising as the project is implemented. This results in a longer project implementation time and the completion of projects in phases. Continuous, high-touch outreach is required. Several contacts are needed to bring a project to application. Informational webinars are helpful to introduce the program to potential clients. It is critical to quantify the lifetime energy dollar savings that will result from an improvement, as economic development clients are risk averse when it comes to capital investment. Emphasize that operating cost savings can be reallocated to support more of the organizations’ core activities. Engineering and technology selection assistance helps clients prioritize improvements. 47 LEADERS OF THE PACK © ACEEE Make the client experience as positive and painless as possible, and exceed expectations. Once a client experiences the program, they are eager to participate in other projects. Program at a Glance Program name Nicor Gas Energy Efficiency Program Economic Redevelopment Targeted Customer Segment Commercial and industrial facilities and large multi-family buildings served by Nicor Gas Program Start Date January 1, 2012 Annual Energy Savings Achieved PY1: 893 gross therms PY2: 179,292 gross therms (to date) Peak Demand (Summer) Savings Achieved N/A Other Measures of Program Results to Date Total number of applications to date: 49 Budget for most recent year (and next budget cycle if available) $2,029,900 for the three year Nicor Gas Energy Efficiency Program period, June 1, 2011, thru May 31, 2014 Program Year 1: $139,904 Program Year 2: $827,858 Program Year 3: $1,062,138 Funding Sources (name and description) The Nicor Gas Energy Efficiency Program is a multi-year program funded by Nicor Gas ratepayers in compliance with state law through a small charge identified on customer bills as “Energy Program.” The portfolio of programs is funded through proceeds from Nicor Gas Rider 29, the tariff rider that allowed Nicor Gas to begin to offer energy efficiency programs in 2010. The Economic Redevelopment Program is one offering in the Nicor Gas Energy Efficiency Program. Website: NicorGasRebates.com/economic Best Person to Contact for Information about the Program: Name Tracy La Haise Position Program Administrator Organization Energy Center of Wisconsin Phone number 608.210.7130 Email address [email protected] 48 LEADERS OF THE PACK COMMERCIAL AND INDUSTRIAL COMPREHENSIVE — EXEMPLARY ARIZONA PUBLIC SERVICE SOLUTIONS FOR BUSINESS ARIZONA PUBLIC SERVICE, ADMINISTRATOR KEMA SERVICES INC., IMPLEMENTER Program Overview The Arizona Public Service (APS) Solutions for Business program is the largest nonresidential energy efficiency program in Arizona. The program offers cash incentives, training, and energy information services to help nonresidential customers increase energy savings and reduce demand. KEMA Services Inc. implements the program on behalf of APS, providing technical, marketing, outreach and application processing services. Since inception, the program has paid upward of $73.5 million in incentives to more than 4,000 unique customers for implementing energy efficiency projects that represent more than $926 million in lifetime energy savings. APS launched the Solutions for Business program in 2006 as part of its portfolio of energy efficiency offerings and targets four customer project types: large existing (retrofit), large new construction, small (retrofit) and schools (retrofit). Customer segments and building types targeted within those project categories focus on: Colleges/Universities Data Centers Grocery Stores Hotels/Motels K-12 Schools Medical Facilities (In-patient/outpatient) Offices Industrial Process Industrial Restaurants Retail Warehouse Facilities Solutions for Business offers cash incentives, training and energy information services to help nonresidential customers increase energy savings and reduce demand. The program offers incentives for a range of existing and new construction projects that implement energy-saving equipment or controls to reduce energy use and qualify under the program’s offerings. Technologies include lighting, HVAC, refrigeration, motors, controls and building envelope materials. 49 LEADERS OF THE PACK © ACEEE Training workshops are open to customers and industry professionals on a variety of program-specific information (trade ally orientation and application training) as well as specific energy-related topics and technologies. APS collaborates with the Arizona chapter of the Association of Energy Engineers to coordinate and conduct training; over the past two years, more than 600 participants have attended this program-sponsored training. Topics range from energy studies, to motor systems and energy codes. Local subject-matter experts serve as instructors and continuing education credits offered to attendees for most training topics. In 2012, the program collaborated with the Governor’s Office of Energy Policy to conduct training on energy codes and standards, and pump systems for wastewater treatment facilities. The team also provides coordination services for the Certified Energy Manager course and supports the ENERGY STAR® Portfolio Manager training offered by the Phoenix chapter of BOMA. Financing is available for energy efficiency projects through a partnership between APS and the National Bank of Arizona. The financing option offers low interest rates to customers who qualify for incentives from the Solutions for Business program and helps reduce barriers to participation. Contractors are invited to apply for membership in a Trade Ally program, launched in 2006, that today includes more than 250 members trained in the Solutions for Business program offerings and application process. By October 2012, 41% of members had generated 870 projects representing 70 GWh in savings and $7.9 million in incentives. Promotion and delivery of the program occur through a highly knowledgeable team of outreach professionals who contact customers and contractors directly to answer questions about the program and offer assistance during the application process. Targeted and broad marketing initiatives serve to establish a visible presence of the program offerings in the business community and to reach smaller, niche audiences with the core message of the value of energy efficiency. The 250-plus membership of program-trained industry professionals in the program’s Trade Ally program, mentioned earlier, market the APS incentives directly to customers as a key component of their own energy-related services. The Solutions for Business program pays incentives on a variety of energy efficiency improvements in both new construction and existing buildings, including prescriptive, custom, technical assistance, and whole building incentives: Prescriptive incentives pay on common equipment upgrades including lighting, cooling, HVAC testing and repair, refrigeration and motors, in a retrofit, major renovation or new construction project; the Express Solutions approach (formerly referenced as “direct install”) is available to all schools in APS territory regardless of size and to APS business customers with a monthly per-site demand of 100 kW or less; custom incentives are offered for retrofit, major renovation and new construction energy-saving measures not included in the list of qualified prescriptive measures; technical assistance and energy study incentives help cover costs for energy feasibility studies, design assistance, commissioning and retrocommissioning for new or existing business facilities; and whole building incentives are available to explore higher performance designs and implementation of new buildings. 50 LEADERS OF THE PACK Each year, the Arizona utility regulatory agency (Arizona Corporation Commission) reviews and approves/amends the program offerings. Since inception those offerings have included a list of incentives available by type of equipment installed based on the quantity, size or operating level of the equipment. For example, in 2012 the incentive for replacing an incandescent exit sign with an LED model was $25 per sign. Similarly, adding variable speed drives to motors paid $50 per horsepower. Custom incentives are paid at an annually set price per kilowatt hour savings up to a percentage of incremental costs. For example, in 2012 custom incentives paid $0.09 per kWh up to 75% of incremental costs. Customers are subject to an annual incentive cap and require an energy analysis that demonstrates that Societal Benefits exceed Societal Costs to meet eligibility prior to any payment of incentive. Other offerings, including technical studies and design assistance, pay incentives based on a percentage of the incremental cost up to a set amount as approved by the regulatory agency. In 2012, these measures paid 50% of the cost up to $10,000. While the program reduces the initial investment required for an energy-improvement project, some businesses need additional assistance to fund the upfront costs. Financing offers one solution to this project obstacle. For the past three years, APS has teamed with the National Bank of Arizona to offer financing options for all customers who use the Solutions for Business rebate program. Customers must meet eligibility requirements prior to submitting a loan application, and loans cannot exceed project costs minus the rebate — with a minimum amount of $1,000. From 2006 to 2009, the Solutions for Business implementation team focused on promoting incentives through customer outreach and events, and training for contractors who provided energy-related services or products. The program designed incentives to bring customers into the program by making energy savings affordable, attractive and accessible. The team presented to customers and associations to educate a wide range of business segments about the potential of energy efficiency and help generate interest in the program. By 2010, participation and interest had grown significantly — thanks to an educated market and to economic conditions that served to sustain customer interest. In response, the implementation team quickly shifted its focus to managing requests for incentives with program funds available and customer expectations for future program years. This focus included assisting customers with application submittals and promoting financing, rebate sales and new products through outreach and training. In 2011, the program became a partner in the AARA-funded Energize Phoenix program that helped boost interest and participation in the program from APS customers along the Phoenix light-rail corridor. Program Performance The result of these efforts and innovations has been increased participation since the launch in 2006 that has kept pace with a steady growth in goals. Higher goals are required of the program each year in order to achieve the state mandate to cut 22% of APS energy use by 2020. 51 LEADERS OF THE PACK © ACEEE Performance 2010 2011 2012 Program Spending (actual) $19,753,000 $23,763,000 $31,715,000 Program Savings (net GWh) 174 185 274 No. of Participants (each year) 1,677 1,806 1,781 Cost effectiveness of energy efficiency measures installed in 2011 (from 2011 results, 2012 values currently under development): Lifetime benefits of installed energy efficiency measures (Societal Benefits): $148 million Estimated Societal effectiveness (benefit to cost): 3.0 Program Cost per lifetime kWh saved: $0.00228 per kWh Lessons Learned As the market became educated and the program grew in popularity, the program went from processing 58 project applications in 2006 to more than 3,400 in 2012, representing a significant increase in participation among APS customers. Over the past six years since APS launched the program, adjustments and innovations to the program’s focus and incentives helped increase participation across a range of segments. This focus included adjusting incentive levels, promoting technologies that offered the greatest potential for energy savings and tailoring marketing and outreach to reach specific segments and technology goals. The Solutions for Business program expanded its consumer education offerings, added new tools to communicate with customers and collaborated with outside entities to promote energy efficiency through special channels and to targeted customers. Program at a Glance Program name APS Solutions for Business Targeted Customer Segment Commercial & Industrial nonresidential customers Program Start Date March 2006 Annual Energy Savings Achieved 2012 – 274 GWh Peak Demand (Summer) Savings Achieved: N/A Other Measures of Program Results to Date: N/A Budget for most recent year (and next budget cycle if available): 2012 - $29.4 million Funding Sources (name and description): Business rates and Demand Side Management Adjustment Charge (DSMAC) Website: www.aps.com/businessrebates 52 LEADERS OF THE PACK Best Person to Contact for Information about the Program: Name Wayne Dobberpuhl Position Program Manager, Solutions for Business Organization Arizona Public Service (APS) Phone number 602-250-2535 Email address [email protected] COMMERCIAL AND INDUSTRIAL COMPREHENSIVE — EXEMPLARY EXISTING FACILITIES PROGRAM NEW YORK STATE ENERGY RESEARCH & DEVELOPMENT AUTHORITY (NYSERDA), ADMINISTRATOR AND IMPLEMENTER Program Overview At its inception, NYSERDA’s Existing Facilities Program (EFP) was primarily focused on establishing the presence of Energy Service Company’s (ESCO’s) in the marketplace to deliver Performance-Based energy efficiency projects. Until 2008, only third party ESCOs could apply. As the focus of ratepayer funding in New York State shifted to resource acquisition, the program evolved to allow end use customers to be direct applicants. EFP is continuously and deliberately refined through market feedback. EFP targets commercial and institutional businesses in sectors such as healthcare, commercial real estate, schools, universities and colleges, and big box retail. The primary target audience for EFP is large energy users within these verticals that will yield the highest electric and natural gas savings. EFP has developed a key account approach; the goal of which is to foster long-term customer relationships wherein NYSERDA can serve all of a customer’s energy efficiency needs. These relationships focus on how the customer’s long term energy plans can be improved with NYSERDA’s technical expertise and implemented with the help of NYSERDA’s financial incentives in a way that maximizes achieved potential. EFP offers a portfolio of incentive opportunities to offset the capital cost of energy improvements in existing commercial/institutional facilities across New York State, with an integrated approach of combining electric (kWh) and natural gas (MMBtu) incentives. EFP has helped thousands of businesses and institutions since the award-winning program began in 1999. EFP focuses on custom, systems-based approaches that encourage comprehensive energy solutions. These projects require more time to develop, design and implement but yield higher energy savings potential. 53 LEADERS OF THE PACK © ACEEE EFP offers two types of incentives: Pre-Qualified and Performance-Based. Pre-Qualified incentives encourage customers working on small-sized energy projects and equipment replacement projects to purchase and install more energy efficient measures. These prescriptive incentives are structured on a fixed dollar-per-unit basis. Some of the measures available to qualifying customers include lighting, HVAC, chillers, motors, VFDs, commercial refrigeration, commercial kitchen equipment and washers, interval meters, and natural gas equipment. Performance-Based incentives are offered for customers working on large-scale projects and the incentive amount is based on the amount of annual energy savings achieved (kWh, MMBtu, or kW). These incentives are typically higher than those for Pre-Qualified projects, and Performance-Based projects must meet minimum incentive thresholds to be eligible. Performance-Based projects require an engineering analysis to substantiate energy savings, and larger projects are potentially subject to measurement and verification (M&V) protocols that meet international standards. The M&V process is collaboration between the applicant, NYSERDA and technical review contractors. EFP offers Performance-Based incentives for electric and natural gas efficiency, demand response, energy storage and monitoring based commissioning projects. NYSERDA is not a utility provider but has been ordered by New York’s Public Service Commission to administer financial incentives for energy-efficiency projects cost-effectively. Contrary to NYSERDA’s Pre-Qualified path which offers incentives on a fixed-dollars-perunit basis, EFP Performance-Based path offers energy efficiency projects $0.16 per kWh saved in Consolidated Edison’s utility territory (i.e. NYC) and $0.12 per kWh saved for restof-state or “upstate” (which constitutes the remaining five (5) investor-owned utility territories of National Grid, New York State Electric and Gas, Rochester Gas & Electric, Central Hudson Gas & Electric, and Orange & Rockland). For energy storage projects, the incentives rates are $300/kW and $600/kW for upstate and Con Edison’s territory respectively. For natural gas efficiency projects the incentive rates are $15/MMBtu saved and $20/MMBtu saved for upstate and Con Edison’s territory respectively. For demand response projects the incentive rates are $100/kW and $200/kW for upstate and Con Edison’s territory respectively. Lastly, the offered incentive rate for Monitoring-Based Commissioning projects is $0.05/kWh saved statewide. All projects must go through a total resource cost (TRC) screening for eligibility at a measure and project level. In addition to the Performance-Based incentives mentioned above, NYSERDA also offers a Super-Efficient Chiller Bonus for eligible chiller projects. This financial bonus encourages customers to maximize efficiency potential for the installation of new chillers that will last decades. Water-cooled electric chillers greater than or equal to 300 tons cooling capacity are eligible for a bonus if the proposed efficiencies exceed the associated ASHRAE 90.1 2007 (Addendum ‘bt’) centrifugal chiller full load standard (Path A) by at least 3% or Integrated Part Load Value (IPLV – Path B) by at least 12.5%. Bonus incentive calculations are based on nameplate efficiencies. 54 LEADERS OF THE PACK Performance-Based Demand Response incentives are offered to offset the cost of equipment that enables facilities to participate in New York State’s Demand Response programs. Common measures include: load shedding controls, automation equipment and new generation equipment. Additionally, bonus incentives are available for “fleet” installation of new demand response-enabled load shedding ballasts and room air conditioners [window, through-the-wall, package terminal air-conditioning (PTAC) & package terminal heat pump (PTHP)]. Bonus incentives are offered to offset the cost of adding integrated/tamper-proof direct load control and shedding capability to the fleet. Lastly, higher cost sharing is offered to applicants who integrate energy efficiency and demand response. EFP is the product of merging two predecessor programs, the kWh-acquisition based Enhanced Commercial / Industrial Performance Program (ECIPP) and the kW-based Peak Load Management Program. Merging the two programs into one cleared up any marketplace confusion and offered a one-stop shop for incentives. ECIPP itself was a combination of previous offerings, incorporating the former Pre-Qualified program at the time (then called the Smart Equipment Choices Program) and the custom incentive program (CIPP). Having a consolidated umbrella offering has provided the opportunity to build a better brand image in a single program, rather than having several smaller programs marketed separately. Program Performance EFP’s most recent 3 years of performance metrics are available for 2009, 2010 and 2011. In 2009, 2010 and 2011 the program expenditures were $24.0M, $29.8M and $26.1M respectively. Information regarding the evaluation of the EFP program is provided on NYSERDA’s website at http://www.nyserda.ny.gov/Energy-Data-and-Prices-Planningand-Policy/Program-Evaluation.aspx. 2009 2010 2011 Program Expenditures ($ million) $24.0 $29.8 $26.1 Net Energy Savings1 (GWh) 161 152 115a Demand Savings2 (MW) 71 160 63a Gas3 (MMBtu) NA 251 35,729 Number of Participants 1,431 2,564 2074 1GWh 2MW savings, and all metrics in this table (unless otherwise noted) include SBC and EEPS results reductions aggregates callable and permanent load reduction 3Gas MMBtu EEPS results only a Savings for the Cooling Recommissioning component of the Existing Facilities Program were reduced in Q4 2011 to account for the retirement of installed measures reaching the end of their useful life. This affects cumulative 2011 savings-to-date but not achievement in year 2011. Note: An impact evaluation was completed recently and new factors will be applied retroactively and subsequently, future reports will have new metrics. The metrics in the table above are accurate thru the 2011 year-end report and include all factors applicable at that time. 55 LEADERS OF THE PACK © ACEEE NYSERDA uses the Program Administrator Cost test, or PAC, (calculated like the Utility Cost Test) to calculate the cost-effectiveness of the EFP. The PAC ratio is 10.2 with resource benefits only and 11.6 with participant non-energy impacts. The Total Resource Cost (TRC) test results for EFP is 1.8 with resource benefits only, and 2.0 with participant non-energy impacts considered. The lifetime cost of conserved energy (CCE) is calculated the same as the levelized cost of MWh for EFP. The program’s levelized cost is $58 to $87 per MWh ($0.058 to $0.087 per kWh) and $10 to $15 per MWh ($0.010 kWh to $0.015 per kWh) depending on the discount rate (0% or 5.5%) used in the calculation. Lessons Learned Some of the lessons learned over the evolution of the Existing Facilities Program include the value of utilizing nationally-recognized lists for qualifying/approved technologies and the importance of getting involved in the process. For example, the DesignLights Consortium’s (DLC) Qualifying Products List for Solid-State Lighting (i.e., LED’s) and/or Energy Starrated LED listed products are a requirement for eligibility for incentives through EFP. NYSERDA staff in EFP, as well as in EFP’s counterparts in New Construction, serve as part of the advisory board and technical committee for DLC. It’s important for program administrators to keep abreast of the testing procedures and the best products available in the marketplace. In recent years, EFP has become more engaged with large end-users through an evolving key account manager strategy. This is a more proactive approach to procuring projects and building relationships with large end-users which emphasizes the value of participating in a NYSERDA offering that, with its measurement and verification (M&V) processes may, at first, seem onerous. Both NYSERDA project managers and contracted outreach providers for the program must enlighten potential customers to see the benefits of participating in EFP, with its savings-verifying M&V process. In conclusion, NYSERDA’s EFP operates in a somewhat competitive environment, in that customers can choose to participate in a NYS utility-offered program instead, of which many offer lucrative incentives and their M&V process may not be stringent. History has proven to NYSERDA that customers see the benefit of M&V, in addition to sometimes more-strict efficiency standards (like NYSERDA’s LED policy), and appreciate what NYSERDA’s EFP has to offer. Customers respect NYSERDA’s key-account approach to providing technical resources, maximizing their financial benefits through NYSERDA’s research & development and offering deployment programs (like EFP) to maximize the potential energy efficiency incentives while delivering a cost-effective program for New York State. 56 LEADERS OF THE PACK Program at a Glance Program Name Existing Facilities Program Targeted Customer Segment Commercial / Institutional Program Start Date 2008* (*As mentioned above, please note NYSERDA has run slight versions of this program since 1999) Annual Energy Savings Achieved 1,513.6 GWh Peak Demand (Summer) Savings Achieved 308.9 MW (Permanent) Other Measures of Program Results to Date 656.6 MW (Callable) Budget for most recent year (and next budget cycle if available) 2012 - $30M; 2013 - $42M; 2014 - $42M; 2015 - $42M Funding Sources (name and description) System Benefits Charge (SBC) Website http://nyserda.ny.gov/efp Best Person to Contact for Information about the Program Name Scott Smith Position Program Manager Organization NYSERDA Phone Number (518) 862-1090 x3344 Email Address [email protected] COMMERCIAL AND INDUSTRIAL CUSTOM — EXEMPLARY E+ BUSINESS PARTNERS PROGRAM NORTHWESTERN ENERGY, ADMINISTRATOR AND IMPLEMENTER Program Overview The E+ Business Partners Program targets electric and natural gas commercial and small industrial NorthWestern Energy customers in Montana. In general, this program promotes site-specific projects that include packages of DSM measures that are relevant to the business and of interest to the business owner. A Business Partners proposal is prepared by the property owner, usually with the help of an engineering or architectural firm. This proposal may include any/all DSM measures that can be demonstrated as cost-effective. Typical measures are to improve lighting, heating and cooling (HVAC) systems, refrigeration, air handling, and pumping systems. Recently popular measures include variable air volume systems, variable speed drive motors and associated control equipment, and new refrigeration cases. Typically, these package proposals include a comprehensive 57 LEADERS OF THE PACK © ACEEE retrofit of the retail and warehouse lighting systems in addition to the other more specialized measures. The Business Partners proposals must include calculations of energy savings and cost-effectiveness. Complex proposals must include results of computer energy simulation using an approved software package. Both new and retrofit facilities are eligible. The Business Partners program is a non-prescriptive rebate program with two unique elements. The first unique element of the program is that outside service providers (vendors) are contracted to seek out E+ Business Partners Projects and work them to completion. NorthWestern has five of these contractors active at this time. These service providers are placed on a “Performance Contract”. If these contractors do not produce successful projects, they do not get paid by NorthWestern. They receive the following levels of incentives: Project signing and customer commitment: 11% of electric resource value, and/or 5.5% of the natural gas resource value Project completion, and additional payment of: 11% of electric resource value, and/or 5.5% of the natural gas resource value The second unique element of the program is that NorthWestern has developed a totally separate team of professionals whose sole purpose is to find qualified E+ Business Partners Program leads among commercial/small industrial customers and refer those leads to the contractors/vendors described above. They have no other purpose than to tirelessly promote the E+ Business Partners Program and find and qualify leads for referral. They have no alliances, loyalties or allegiances to any program vendor or contractor. They are accountable directly to NorthWestern DSM staff. E+ Business Partners Program offers customized incentives to unique, site-specific projects and can accommodate most projects that provide cost-effective conservation. Costeffectiveness must be supported by specifications and energy savings calculations that pass muster with utility engineering staff. Projects for the Business Partners program can originate with the customer, with the implementation staff, or with NWE staff. Utility program staff will provide project scoping studies both at a customer’s request and in cold calls. A proposal includes a facility description, the proposed measures, cost estimates, an economic analysis, and a project implementation schedule. The proposal is reviewed and analyzed by program implementation staff and by NorthWestern staff. Incentives for a project are capped so as to not reduce the project’s payback period to less than one and one-half years. When utility program staff are satisfied that a proposed project meets the program requirements, they submit a rebate funding request internal to NorthWestern based upon the project’s scope, cost, and projected energy savings. Upon approval of the request by 58 LEADERS OF THE PACK NorthWestern management, the program staff makes an offer to the customer to fund the proposed project. If the customer agrees to the offer, a contract is drafted. The contract must be previewed by the same NorthWestern parties who were required to approve the rebate amount and, following the customer’s signature, is executed by all of those same parties. This process can take two to three months. During the project implementation phase, program staff and implementation staff sometimes provide advisory services to the customer such as assistance in review of design or bid documents, assistance in investigating or arranging financing options, project management assistance, and assistance with project commissioning. Upon receiving the customer’s written notification of project completion, for which there is no prescribed form or format, the program staff authorize a rebate check. All Business Partners projects are verified and inspected by program staff or Customer Advocates. When Customer Advocates perform an inspection, they typically take the rebate check with them to deliver to the customer at the time of the inspection. Financial incentives to the property owner/participant (different from the vendor/contractor incentives discussed above) are given in the form of a cash incentive, paid by check upon completion of the project and inspection by the utility or its agent. This incentive is based on the electric and/or natural gas resource value of the energy saved over the life of the measure(s). The incentive offered ranges up to approximately 50% of the avoided cost-based resource value of the project. Customers/participants are expected to contribute some of their own money to the project, and the utility also considers the simple payback faced by the customer when calculating this financial incentive. Negotiation of the incentive amount also occurs to encourage customers to commit and complete their projects. In the negotiations, the utility bases its position on the results of the Utility Cost Test benefit/cost ratio. NorthWestern’s DSM Program staff have worked in this field for most of their careers, and they know well the difficulty of trying to directly reach those customers whose facilities or processes are both eligible for and would benefit from the program. Direct contact is best, and ongoing support and “hand-holding” is needed and most effective in getting commercial DSM done. Utility staff cannot be in the field and in the office at the same time, so an extension of their reach and presence is achieved through the design and ongoing operation of the E+ Business Partners Program. While there is no project minimum or maximum size, not every project that qualifies for the program warrants the effort required for program participation (for example, the mere replacement of a water heater). The program seeks custom applications that, ideally, involve multiple measures or system redesign and not simply the change of a single piece of equipment. This program was initiated in 2005 with one outside contractor who was somewhat reluctant to try the Performance Contract approach. At that time, utility avoided costs were somewhat higher which enabled fairly attractive financial incentives to be paid to both contractors and customers. The first program contractor met with success in finding and 59 LEADERS OF THE PACK © ACEEE completing projects, and then expressed interest in a longer term contract with NorthWestern Energy. NorthWestern introduced more competition into the E+ Business Partners Program by finding and hiring additional vendors/contractors who began to compete with one another to find the best projects and get them completed and claim the incentive. NorthWestern then identified a group of talented and highly motivated individuals within the ranks of its other outside service providers and assigned them to be marketing and outreach specialists for the E+ Business Partners Program. This team is paid a salary and their travel costs are fully reimbursed by NorthWestern. They make cold calls, hold training and informational sessions, and “work their turf” like seasoned sales representatives. Program Performance Various measures of the E+ Business Partners Program’s performance are provided in the table below. Average electric program expenditures have ranged from one to two million dollars. Natural gas program expenditures have been significantly lower. A realization rate of .95 was applied to gross electric savings to calculate net electric savings. A realization rate of 1.14 was applied to gross natural gas savings to calculate net natural gas savings. 2009 2010 2011 Electric Program1 Expenditures ($ million) $1.57 $1.29 $2.10 Nat. Gas Program2 Expenditures ($ million) $0.02 $0.10 $0.21 Gross Electric Savings (kWh) 3,594,233 2,803,257 3,628,957 Net Electric Savings (kWh) 3,406,881 2,657,135 3,439,795 Net Demand Savings (kW) 389 303 393 Gross Natural Gas Savings (dKt) 2,283 1,709 5,214 Net Natural Gas Savings (dKt) 2,597 1,944 5,932 Number of Participants (Completed Projects) 35 39 34 1 2 Order 17063 Order 17070 Both the electric and natural gas components of the program are cost-effective with Utility/Program Administrator Cost (UCT) Test ratios of 1.55 and 2.04 respectively over all years (2007-2011). Similarly, the Total Resource Cost (TRC) Test indicates that the program is cost-effective with a benefit/cost ratio of 1.07 for the electric portion of the program and of 1.44 for the natural gas portion of the program for the 2007-2011 time period. Lifetime cost of conserved energy for this program is estimated at $0.055/kwh and $4.826/dekatherm based on the TRC test and $0.037/kwh and $2.966/dekatherm based on the UCT test. 60 LEADERS OF THE PACK Additional evaluation results can be found in the process and impact DSM Program Evaluation completed for NorthWestern by SBW Consulting, Inc. in January, 2013 (see http://www.northwesternenergy.com/documents/StudiesReports/ExhibitMHB1a.pdf). Lessons Learned The mix of competition, performance-based compensation for contractors, site-specific projects, flexibility with qualifying DSM measures, customized incentives and aggressive marketing support in the E+ Business Partners Program has been successful for NorthWestern and its participating customers. Experience from this program affirms what many in the DSM community already believe to be true: Customers need convincing and persuading. They need the program “hassle factor” reduced. They need hand-holding, and somebody to help them decide and then help them get the work done. They want cash. They want somebody they can trust. The program’s approach encourages the development of one-on-one relationships with customers and vendors, an approach that works well in a state like Montana with a small population. The greatest marketing success has come from direct outreach to folks in the industry – engineers and equipment vendors. Over time, the development of personal contacts and relationships has resulted in customers coming to the program with projects. Program at a Glance Program name E+ Business Partners Program Targeted Customer Segment Commercial/small industrial electric and natural gas Program Start Date July 2005 Annual Energy Savings Achieved 18,500,000 kwh; 5,526 dKt Peak Demand (Summer) Savings Achieved 2 MW Other Measures of Program Results to Date Budget for most recent year (and next budget cycle if available) $1,900,000 Funding Sources (name and description) Energy Supply Website: http://www.northwesternenergy.com/eplus Best Person to Contact for Information about the Program: Name David Bausch, PE Position Senior DSM Engineer 61 LEADERS OF THE PACK © ACEEE Organization NorthWestern Energy Phone number (406) 497-2322 Email address [email protected] COMMERCIAL AND INDUSTRIAL CUSTOM — EXEMPLARY SELF DIRECTED CUSTOM EFFICIENCY XCEL ENERGY, ADMINISTRATOR AND IMPLEMENTER Program Overview Xcel Energy launched the Colorado Self Directed Custom Efficiency Product in 2009. The Product provides increased rebates to large commercial and industrial electricity customers who engineer, implement and commission qualifying projects at their facilities. Under the Self-Direct Custom Efficiency Product, the customer performs the design, engineering, measurement, verification, and reporting of energy efficiency projects approved by Xcel Energy. Eligible business customers must be in the Colorado service territory, have aggregate peak demand at all meters of at least two megawatts (MW) in any single month, and have an aggregate annual usage of at least 10,000,000 kWh. Any technology, process, or system improvement that saves electricity and meets rebate eligibility requirements can be rebated through the program. Self Direct was designed to provide a path for customers who have access to appropriate resources to properly identify, quantify, scope and implement a project, without the assistance of Xcel Energy. Due to this increased reporting and validation burden placed on the customer, Xcel Energy is able to provide a larger rebate. The Self-Direct Product also allows the customer to “bundle” electric energy saving opportunities into one project, which allows them to more accurately define a project and capture all of their qualifying energy saving activities. All measures included in the bundled project must have electric energy (kWh) or demand (kW) savings on Xcel Energy's service. The intent of the offering is to allow customers with the internal expertise, or access to expertise, to drive their own energy efficiency projects while providing utility incentives to help them overcome financial barriers to implementation. This work can either be performed by the customer, if they have the available internal resources, through a third party such as an ESCO (Energy Service Company), or by utilizing an engineering firm in order to meet the Product participation requirements. 62 LEADERS OF THE PACK Participation is a multi-step process. Customers first receive a rebate application from their Xcel Energy account manager, who ensures that all Product eligibility requirements are met. Pre-qualified customers then identify energy efficiency opportunities in their building and submit a detailed energy efficiency improvement plan to Xcel Energy. Xcel Energy reviews the project and provides a TRC (total resource cost) calculator for the customer to analyze the cost/benefit relationship of the project. The TRC must be greater than 1.0 to qualify for a rebate. Payback periods must be greater than one year and less than the lifetime of the equipment to qualify for a rebate. Upon review and pre-approval of the improvement plan, customers are notified of their project’s approval and their potential rebate amount. At this stage a monitoring plan is finalized to verify the project’s results. When the customer has completed implementation of the project, they will submit a completion report including measurement and verification of the energy savings if savings are anticipated to be greater than 250,000 kWh. Once the completion report is approved by Xcel Energy, the rebate based on M&Vd savings will be issued to the customer. The Self-Directed Custom Efficiency Product offers increased performance-based rebates in exchange for the customer bearing the responsibility of project commissioning and M&V. Rebate amounts are based on the energy savings of the project with the customer choosing whether they would like to receive up to $525/kW or $0.10/kWh. The rebate is capped at 50 percent of the project’s incremental costs. The Self-Direct Product was launched in 2009 as a result of discussions with stakeholders and approval by the Public Utility Commission during Xcel Energy’s 2009/2010 Biennial DSM Plan application. Program Performance Now in its third year of implementation, has seen considerable customer interest and has achieved early success. Participating customers report high satisfaction with the program and vendors are optimistic for the future of performance contracting due to increasing customer prioritization in addressing energy costs. After launch in 2009 and 0 participants, the Self Direct Product realized significant growth in 2010 with ten projects completed and 8.97 GWh achieved against a goal of 4.4 GWh. 2011 had 2 participants and achieved 7.67 GWh achieved against a goal of 5.6 GWh. One customer received the largest rebate given to date in any DSM program of $731,263. This same customer participated in the program in 2011 and has now realized 9.1 GWh of savings and received rebates totaling $1,444,202. 2012 had 5 projects completed and achieved a record 9.7 GWh of savings against a goal of 8.98 GWh, and paid the second highest rebate of $685,378. 2013 has a pipeline of over 8 GWh. Average savings per participant is 1.7 GWh with TRC’s of over 2.0. Since the 2009 launch the Self Direct program has achieved over 26 GWh and 3531 kW of savings and paid rebates in excess of 3.4 Million Dollars 63 LEADERS OF THE PACK © ACEEE Actual program spending dropped from $1,877,874 in 2010 down to $977,629 in 2011 before being increased again in 2012 to $1,182,587. Program savings and cost effectiveness, especially in the context of annual spending, are summarized in the table below: Net kWh Net kW 2010 8,965,180 1,955 Net kW 2011 7,666,147 428 Net kW 2012 9,723,468 1,148 Net kW Cost Effectiveness TRC (2012 Plan) 1.79* *Utility Cost Test (UCT) is 4.67; lifetime cost of conserved energy (CCE) is $.01 ($0.00 per kWh). Impact evaluations are available at: http://www.xcelenergy.com/About_Us/Rates_&_Regulations/Regulatory_Filings/CO_D SM Lessons Learned With such a small pool of very large eligible customers and the potential for wide variability in participation, this program should be utilized as a key component of a well-rounded portfolio, but should not be expected to carry the weight of the entire business offering. The cycle from evaluation of an improvement to implementation of a project typically occurs over multiple years so a DSM portfolio will need to manage the peaks and valleys of a program like this. Designing a program to maximize responsiveness to industrial customers' needs is critical. Establishing strong working relationships between the program staff and customers, thereby providing continuity of program staffing and offerings, is a key element of success. Program at a Glance Program name Self Direct Custom Efficiency Targeted Customer Segment Large Commercial and Industrial Program Start Date 2009 Annual Energy Savings Achieved 2012 Net Generator kWh 9,723,468 Peak Demand (Summer) Savings Achieved: 2012 Net Generator kW 1,128 Other Measures of Program Results to Date: Exceeded 2012 goal by 108% Budget for most recent year (and next budget cycle if available): $1,908,790 $1,914,342 Funding Sources (name and description): DSMCA rate rider and utility base rates Website: www.xcelenergy.com/business 64 LEADERS OF THE PACK Best Person to Contact for Information about the Program: Name Dominic Kennedy Position Product Portfolio Manager Organization Xcel Energy Phone number Email address 303-294-2918 [email protected] COMMERCIAL LIGHTING — EXEMPLARY ENHANCED LIGHTING PROGRAM PUGET SOUND ENERGY, PROGRAM ADMINISTRATOR AND IMPLEMENTER Program Overview With a change in federal lighting efficiency standards impacting T12 technology effective in July 2012, there is a need to encourage lighting projects to include more extensive measures than simple T12 to T8 conversions to ensure continued success of commercial lighting efficiency programs. Puget Sound Energy’s (PSE’s) Enhanced Lighting Program comprehensive approach meets that need. To set solid foundation, projects must follow several rules and guidelines in order to qualify for participation in the Enhanced Lighting Program: they must cut lighting power density, be comprehensive themselves, only certain qualified products and technologies are permitted, and in many cases and application projects are mandated to include lighting controls or automated lighting controls. Building lighting power density (LPD) after the project is complete must be at least 10% below that required by section 1530 of the Washington State Energy Code edition effective at the time of project initiation. Projects not meeting this requirement will be paid at Tier 1 levels unless changes are made to bring them within compliance of this rule. This requirement may be increased or decreased in response to changes in the Washington State Non Residential Energy Code and/or as PSE gains more understanding of capabilities to exceed code-mandated Lighting Power Allowance (LPA) requirements. Projects performed in this program must be comprehensive. All lighting on the qualifying PSE account must be addressed, inside and out. If the business has more than one account, sub-account, or meter serving the business, all within one building, the entire building must be encompassed by the project. If a business uses a space within a building that is used by one or more other businesses, the entire space being used by this business must be encompassed by the project. If a business has more than one building, and the buildings are on separate accounts or sub-accounts, the customer may elect to perform a comprehensive project on the individual buildings identifiable by separate accounts or sub-accounts. 65 LEADERS OF THE PACK © ACEEE All interior and exterior lighting must be considered part of the project All incandescent lamps must be replaced with a qualifying LED, CFL or T8 technology. Exterior lighting must also be addressed if it is the responsibility of the business being retrofitted. This includes wall packs, walk-way lighting, façade lighting, decorative lighting, and parking lot lighting. Appropriate controls must be installed in all spaces. LED products may be used if they are on one of these lists: ENERGY STAR qualifying commercial LED lighting products, Design Lights Consortium list of qualifying products, or Lighting Design Lab list of qualifying products (or meet the qualifications to be on the Lighting Design Lab list). (Exit signs and backlit signage are exempt from this requirement.) CFL products may be used if they are currently listed by ENERGY STAR on their list of qualified CFL lamps. Other lighting technologies may be used if demonstrated to be more efficient and cost effective than other options if all other criteria of this program are met, with the exceptions of the following lighting technologies: incandescent, T12, high pressure sodium, and low pressure sodium. Controls must be used anywhere they would be required by the current Washington State Energy Code if the building were being built new at the time of the project with the exception of section 1513.3 Daylight Zone Control requirements. If not otherwise required by code (if the building were currently being built), automatic lighting controls must be used in the following places: Individual offices Restrooms Open plan office spaces Parking garages and lots High bay spaces (warehouses, barns, gyms, etc…) Exterior area lighting Stairwells Perimeter lighting photo-control when appropriate (optional) Follow Washington State Energy Code requirements per 1513.3 Daylight Zone Control. Program Performance The Program has ramped up energy savings quickly and become a major contributor to overall lighting energy savings. The Enhanced Lighting program has been integral in Puget Sound Energy’s energy efficiency portfolio even though it has only been active since August 66 LEADERS OF THE PACK of 2011. To date the Enhanced Lighting Program totals 10% of all custom commercial lighting projects while accounting for 23% in total savings for all custom commercial lighting projects. The table below summarizes the savings and costs over the life of the program. Puget Sound Energy Enhanced Lighting Program Data Participants Projects Project Cost Incentives 1st Year 22 22 $918,031 $594,549 Completed 2nd Year 44 45 $2,984,980 $1,945,195 In Process 42 45 $3,408,405 $1,864,153 Totals 108 112 $7,311,416 $4,403,897 1) 1st Year consists of data from 8-1-2011 thru 7-31-2012. 2) 2nd Year consists of data from 8-1-2012 thru 2-15-2013. 3) Cost Effectiveness Threshold "Total Resurce Cost" (TRC) = 0.50 Annual Savings (kWh/yr) 2,212,392 12,178,371 6,899,448 21,290,211 TRC 1.90 3.22 1.60 2.30 The enhanced incentive provided through the program has assisted the participating businesses to not only lower their energy cost but to also exceed mandated energy codes for lighting while becoming a community steward of energy efficiency. Lessons Learned Implementing the Enhanced Lighting Program has brought about some challenges resulting in the following lessons learned: • • • PSE soft launched the program for a period of approximately 4 months. This allowed PSE to fine tune various aspects of the program including the excel tool used to calculate energy savings, expand training to staff, provide one-on-one training with trade allies, and expand / revise program requirements based upon internal staff and trade ally feedback. Trade allies have found various facility types that work well with this program. One type of facility that works well with this program is car dealerships. It seems that the increased incentive levels offered through PSE’s Enhanced Lighting program help drive the more costly retrofits to exterior pole lighting. There was some initial confusion with our trade allies on what distinguished this program from PSE’s other lighting offerings. It has taken some time to get them familiar with the program requirements. Additionally, we have improved the Excel tool used to calculate energy savings to make it more clear when a project qualifies and when it doesn’t. Program at a Glance Program name Enhanced Lighting Program Targeted Customer Segment Commercial Program Start Date August 2011 Annual Energy Savings Achieved 21,290,211 kWh/yr 67 LEADERS OF THE PACK © ACEEE Other Measures of Program Results to Date: N/A Budget for most recent year (and next budget cycle if available): N/A - Part of our custom programs. Funding Sources (name and description): PSE Conservation Rider – Customer Conservation Charge to PSE Utility Bill Peak Demand (Summer) Savings Achieved: N/A Website: http://pse.com/savingsandenergycenter/ForBusinesses/Pages/ Enhanced-Lighting-Program.aspx Best Person to Contact for Information about the Program: Name Corey Corbett Position Supervising Engineer Organization Puget Sound Energy Phone number 253-395-6978 Email address [email protected] COMMERCIAL AND INDUSTRIAL RETROCOMMISSIONING — EXEMPLARY COMMERCIAL RETROCOMMISSIONING PROGRAM SOUTHERN CALIFORNIA EDISON, ADMINISTRATOR AND IMPLEMENTER Program Overview With an annual budget of $3 million, the Southern California Edison (SCE)’s commercial retrocommissioning (RCx) program is one of the largest programs of its kind. The program was first implemented on a full scale in the 2006-09 program cycle. With a budget of $8 million in 2006-09, the program was designed to improve the operation of large commercial buildings with a square footage of 100,000 square feet or higher (this limit was later dropped to 25,000 square feet in 2010-12 to allow for small- and medium-sized commercial buildings). By the end of 2009, the program saved SCE customers 17 GWh and 1.1 MW in electricity and 200,000 therms in natural gas on an annual basis (gross savings). The program was co-funded by Southern California Gas (SCG), and this co-funding arrangement ensured that participating customers received full benefits in terms of savings and financial incentives for all major fuel sources. Despite the cofounding, the program is managed solely by SCE. The RCx program provided free investigation/study to participants via approved RCx providers in the network. Along with this no-cost investigation, the participants qualified for financial incentives based on gross energy savings (kWh), peak demand reduction (kW), and natural gas savings (therms). Targeted end uses and measures included HVAC systems, 68 LEADERS OF THE PACK refrigeration systems, control systems, and some lighting systems. Due to the long-project cycle and the upfront investment to pay for the RCx investigation study, the 2006-09 program introduced several safeguards to ensure that only serious participants and viable projects were enrolled in the program. These safeguards included having the participant sign an agreement upfront to implement all reasonable measures under a year in simple payback (or the participant would have to reimburse the investigation cost to the program), and paying implementation incentives only for measures with a simple payback of over a year. While the 2006-09 program was a resounding success in terms of meeting program metrics and savings goals (in an impact evaluation done on behalf of the California Public Utilities Commission the realization rate was estimated at 94% for kWh, 204% for kW, and the netto-gross ratio was 86%), a process evaluation done by SCE-contracted consultants found several areas for improvement. The recommendations included simplifying the calculation process to avoid having RCx service providers spend too much of their own resources to perform calculations, and improving drop-out rates of projects from the investigation stage to implementation. In response to the recommendations by the process evaluation, the program management team implemented simplified calculations methodologies for simple measures, which led to standardized calculation templates and the Building Optimization Analysis (BOA) tools, and introduced a scoping phase, where the potential RCx provider is allowed one day on the building site to perform preliminary analysis before committing to the project. This scoping phase is coupled with a pay-for-performance structure on the provider’s contract to ensure that they can deliver the level of savings predicted in their scoping analysis. As SCE’s RCx program looks toward the future, it will keep evolving and improving to ensure that the program remains relevant and effective in the marketplace. In 2013-14, the RCx program is rolling out further enhancements that are expected to improve the program further. One of the major changes is with respect to how the program works with RCx providers. The RCx program sees an opportunity to further transform the RCx market by introducing a new program design that will allow all eligible RCx providers to participate and thrive with the program. The program is also looking forward to integrating Energy Management and Information tools into its program delivery. Program Performance The Commercial RCx program performed well in the 2010-2012 program cycle. Throughout the three years, there were over 150 project applications submitted from 56 distinct customers. A total of fifty-five projects were committed for incentive payments. Presently, the gross energy savings to be claimed total to about 6.95 million kWh, with 500 kW of permanent peak demand reduction and 265,100 therms of natural gas savings. To achieve these savings, the program spent around $2.1 million, which includes provider costs and incentive payments. Based on these costs, the program’s cost effectiveness is right around $0.30 per gross kWh, which is a significant improvement from $0.47 per gross kWh in the 2006-2009 program cycle. As a point of clarification, this cost effectiveness estimation does not include other SCE program costs such as SCE labor, administrative costs, and overhead 69 LEADERS OF THE PACK © ACEEE costs At this point, there is not an impact evaluation available for the 2010-2012 program cycle but there are plans to conduct one in 2013. The table below breaks down program expenditures, energy savings and participation by year for the 2010-2012 program cycle. 2010 Program Expenditures 2011 $307,294 2012 $586,478 $773,526 Gross Electric Savings (kWh) - - 6,878,149.5 Gross Natural Gas Savings (Therms) - - 262,154.5 Gross Demand Savings (kW) - - 499.7 Number of Participants (Committed Projects) 21 33 Lessons Learned The Commercial RCx program is currently undergoing a program re-design for the 20132014 program cycle to take into account some of the lessons learned from the 2010-2012 program cycle. One main lesson to focus on involves allowing for a greater number of approved providers to conduct customer sites screening and RCx investigations. Having only one consultant screening customer sites and nine approved providers in the previous cycle was detrimental to program participation and pipeline growth. Another lesson to address involves the policy of only paying incentives on measures with greater than 1-year payback. This policy results in less incentive money for the participants and adds a natural limitation in participation. Offering incentives for all measures, regardless of payback, will help in this arena. Lastly, changes to the project application flow to be less cumbersome would allow for a more streamlined approach. Too many project phases exist (Screening, Scoping, Investigation, Application, MLF Review, Customer Agreement, Installation Report, IST Review, Incentive Payment) and a streamlined approach would provide a less complicated format for participants. Program at a Glance Program name Southern CA Edison’s Commercial Retrocommissioning Program Targeted Customer Segment Non-residential Commercial Customers with a square footage of 25,000 or higher Program Start Date 1/1/2010 Annual Energy Savings Achieved Average of 2,316,958 kWh per year Peak Demand (Summer) Savings Achieved ~ 500 kW 70 LEADERS OF THE PACK Other Measures of Program Results to Date ~ 265,122 therms Budget for most recent year (and next budget cycle if available) 2012 budget: ~ $5,362,300 2013-2014 budget: ~ $2,182,000 Funding Sources (name and description) SCE Customer Rates Website http://www.sce.com/rcx/ (undergoing revisions) Best Person to Contact for Information about the Program: Name Zhong Li Position Manager Organization Southern CA Edison Phone number 626-302-0397 Email address [email protected] COMMERCIAL AND INDUSTRIAL RETROCOMMISSIONING — EXEMPLARY COMED SMART IDEAS FOR YOUR BUSINESS RETRO-COMMISSIONING (RCX) AND MONITORING-BASED COMMISSIONING (MBCX) PROGRAM COMED, IN PARTNERSHIP WITH NICOR GAS, NORTH SHORE GAS, AND PEOPLES GAS, ADMINISTRATOR NEXANT, IMPLEMENTER Program Overview In February 2008, the Illinois Commerce Commission approved ComEd’s 2008-2010 Energy Efficiency and Demand Response Plan. The company was authorized to collect funds for the implementation of energy efficiency programs targeting residential and business customers through a rider on all bills. On June 1 of that year, ComEd launched Smart Ideas for Your Business (SIFYB), which offered incentives for standard (prescriptive) and custom energy efficiency projects. Four retro-commissioning pilot projects were conducted during the first program year, with Nexant providing the engineering services. Those initial RCx projects established the basic program incentive structure, which remains in place today. Customers receive a free expert analysis of the performance of their building’s energy-using systems conducted by an approved engineering firm. In return, they agree to spend at least a minimum amount on implementation of low and no-cost operational improvements with a combined simple payback of 18 months or less. The program targets retail/office buildings, commercial real estate, hospitals, education, hospitality, and other building types with more than 150,000 ft2 of air-conditioned floor space. 71 LEADERS OF THE PACK © ACEEE Since that first year, several significant enhancements have been made to program strategy. Most important, a multiple service provider model was implemented beginning in Program Year 2. The engineering firms selected to be approved service providers act as the primary sales channel for the program, typically generating over 80% of new projects in a given year. By paying for all engineering costs, ComEd allows service providers to offer an RCx study at no charge to qualified customers, which helps the providers to strengthen their existing relationships with building management and to generate new revenues. In turn, the program gains visibility and valuable access to decision-makers at facilities which fit the program criteria. A periodic RFP process is conducted to add new service providers and remove underperformers. In this way, the program not only gains access to additional customer decisionmakers, it also enables the recruitment of providers with strengths in specific market segments (hospitals, office buildings, hotels, educational facilities, etc.) Currently, there are 27 firms serving as approved RCx providers. A second major strategic shift was the expansion of the program to include investigation for potential therm saving opportunities. Partnering with the gas utilities in ComEd’s territory has brought considerable value to the program; investigating for gas and electric savings simultaneously is far more efficient than doing so separately, which makes RCx more costeffective for all parties. Further, it allows the utilities to address the energy efficiency needs of their customers in a more comprehensive manner. Another important refinement has been to allow increased flexibility in project processes. For example, combining planning and investigation phases into a single process and single engineering report lowers costs and helps providers meet short customer timelines without sacrificing technical quality. Customer budget cycles also present frequent challenges; by being flexible with implementation schedules for specific measures, delays related to waiting for allocation of funds can sometimes be reduced. These modifications have all contributed to the program’s success. By the end of Program Year 5 (May 31, 2013), nearly 100 GWh and over 2.3 million therms in savings will have been generated by approximately 150 completed RCx projects. While service providers continue to successfully recruit new participants -- a substantial pipeline of projects is developing for Program Year 6 – the program will need continued innovation to maintain its growth. As the ideal, easy-to-get RCx projects are captured, it will be increasingly important to broaden the program’s appeal, both in terms of customer flexibility and in types of buildings served. Some examples of this expanded approach have already been implemented. In mid-2012, a monitoring-based commissioning option was introduced to give customers the opportunity to look for operational improvements on a longer-term basis. A cash incentive is provided to help defray the cost of installing enhanced building automation software, and then participants are paid 7 cents per kWh (and $1.00 per therm in Nicor territory) for verified savings that result from the project during a monitoring period of at least 18 months. 72 LEADERS OF THE PACK In February 2013, ComEd launched a new study that will be offered at no cost to all customers with buildings meeting RCx program eligibility guidelines. As opposed to the operational measures identified by RCx, this study will search for capital and retrofit opportunities for gas and electric energy-saving improvements at customer facilities, and also provide analysis of available standard and custom incentives and payback periods. Implemented improvements will lower the building’s energy usage baseline, increasing the effectiveness of any ensuing RCx. In the longer term, the program is studying the substantial body of data from completed projects to date to search for potential improvements. For example, it is clear that a relatively small group of operational measure types generated a large portion of total energy savings in most projects. In Program Year 4 (the first full year of gas utility participation), over 90% of the electrical savings and almost 80% of the gas savings fell into three categories: economizer and ventilation control, equipment scheduling, and fan optimization/air distribution. Within those categories, two measures - scheduling of air handling units and reducing/resetting of duct static pressure - generated 52% of the program’s total electric savings for the year. By determining common measures that provide the most savings per dollar spent, ComEd is working to develop a scaled-down process that will allow a limited-scope RCx to be offered to smaller and less ideal buildings and still remain cost-effective. The program is also building out its analytical capabilities to better target specific market segments. While office buildings, hospitals, and educational institutions represent most of the completed RCx projects to date, ComEd is developing tools to better understand the market potential across various other building types. Through its efforts to build out an innovative IT platform that merges utility information, usage data, program participation data, and firmographic data, ComEd is rapidly developing its ability to identify promising customer segments for not just RCx, but for its entire suite of energy efficiency programs. In the end, the goal of the entire Smart Ideas for Your Business portfolio is to achieve deep energy savings for its customers, whether those savings come from RCx or other approaches. Better understanding of what customers are looking for in terms of energy efficiency, and what opportunities are present at their individual buildings, is critical in determining the best ways to help them reduce energy usage. Data collected by the RCx program is shared with other programs, and vice versa; in that way, ComEd and its partners and implementers can use their expanding analytical capabilities to determine the approach that best fits each customer’s unique requirements. Program Performance The table below provides the expenditures, gross and net electric savings and participation for the ComEd Smart Ideas for Your Business Retro-Commissioning (RCx) and MonitoringBased Commissioning (MBCx) Program for the three most recent years with available data. Expenditures, energy savings and participation have all increased over this time period. 73 LEADERS OF THE PACK © ACEEE Program Yr 2 Program Yr 3 Program Yr 4 Program Expenditures ($ million) $2.19 $3.19 $4.84 Gross Electric Savings (MWh) 7,174 21,574 27,315 Net Electric Savings (MWh) 6,574 15,382 25,021 Number of Participants 14 34 50 Data regarding the program’s cost-effectiveness is summarized in the following table. Program Yr 2 Program Yr 3 Program Yr 4 Total Resource Cost Test Ratio 1.41 .7 TBD Lifecycle Program Cost $.078/kWh $.116/kWh TBD Note: ComEd feels that there is considerable uncertainty inherent to the methodology used to determine the above metrics for cost-effectiveness: Many RCx projects in the Smart Ideas program span multiple program years, making it very difficult to attribute costs or savings to a single year for analytical purposes During one program year (PY3), several compressed air pilot projects were evaluated as part of the RCx program; in other years, compressed air projects are not included in RCx program evaluation The need to make multiple assumptions about measure persistence and various other factors also increases uncertainty Lessons Learned Several lessons have been learned in the areas of marketing and customer service and satisfaction, including the following: Using multiple RCx service providers is an extremely effective method to increase program visibility with target customers and to gain access to customer decision-makers Potential roadblocks on the customer side of projects, such as legal/contractual and funding approval issues, should be addressed at the earliest time possible to minimize the risk of delays Providing process flexibility where possible can help address customer concerns and broaden the target market. Successful strategies so far include: combining planning and investigation phases to accelerate project timelines; developing a campus approach to allow a groups of smaller buildings to undergo RCx; allowing staggered implementation of selected measures; and including savings from decreased usage of district energy in RCx. Conducting joint RCx with gas utility partners improves customer satisfaction and makes the process more cost-effective for all parties Gathering feedback from all sources – customers, service providers, program implementers, and evaluators – is critical to ongoing improvement in program processes and marketing strategy Some of the lessons learned concerning program design, management, and other areas are: A relatively small number of measure types generate the majority of both electric and gas savings for most RCx projects 74 LEADERS OF THE PACK Information management is key to maximizing the identification of possible energy saving opportunities across efficiency programs Developing and sharing scorecards to rank service providers drives performance improvement, as each firm seeks to differentiate itself from its peers Evaluation survey tools used to determine program influence should be different from self-reporting customer surveys used for the same purpose, as the customer may be reluctant to admit a lack of knowledge regarding potential savings from RCx measures that in fact required detailed engineering analysis to identify Program at a Glance Program name ComEd Smart Ideas For Your Business RetroCommissioning and Monitoring-Based Commissioning Targeted Customer Segment Retail/office buildings, commercial real estate, hospitals, education, hospitality, and other building types with more than 150,000 ft2 of air-conditioned floor space Program Start Date June 1, 2008 Annual Energy Savings Achieved 27.3 GWh and 1.1M therms saved (gross) for Program Year 4, which ended May 31, 2012 Peak Demand (Summer) Savings Achieved n/a Other Measures of Program Results to Date By end of Program Year 5 (May 31, 2013), 150 RCx projects expected to be completed in total. In Program Year 4, the RCx program achieved the following results: 50 completed projects for 35 different participants (several participants had multiple projects) 22 joint gas-electric projects $3.1 million in verified annual energy cost savings 32 million square feet of floor area impacted, with an average building size of 640,000 ft2 Budget for most recent year (and next budget cycle if available) Projected program costs for PY5 are $3.5M as of January 2013 Funding Sources (name and description) Energy efficiency tariff / rider on customer bills Website www.ComEd.Com/RCx Best Person to Contact for Information about the Program: Name Rick Tonielli Position Sr. Energy Efficiency Program Manager Organization ComEd Energy Efficiency Services Phone number (630) 437-2438 Email address [email protected] 75 LEADERS OF THE PACK © ACEEE COMMERCIAL AND INDUSTRIAL RETROCOMMISSIONING — EXEMPLARY PACIFIC GAS AND ELECTRIC (PG&E) INDUSTRIAL RECOMMISSIONING (IRCX) PG&E, ADMINISTRATOR NEXANT, INC., IMPLEMENTER Program Overview Since 2010, Nexant has been implementing the Industrial Recommissioning (IRCx) program sponsored by Pacific Gas and Electric Company (PG&E)—the largest investor-owned utility in the United States. As a performance-based resource program operating in one of the most advanced energy efficiency markets in California, the IRCx program targets the heavy industry and manufacturing sector and generates energy savings by helping PG&E customers optimize their manufacturing processes by systematically studying low-profile energy losses that commonly occur in manufacturing facilities. These energy losses rarely receive much attention from facility staff and can occur for a variety of reasons such as compressed air leaks, damaged equipment insulation, and “dirty” heat transfer surfaces. In many cases, these losses can account for nearly 15% of a facility’s total energy consumption. By focusing on energy savings measures that do not require a major capital commitment but are effective in lowering energy bills and reducing maintenance time and expense, the program improves equipment life, reliability, productivity, and—most importantly— increases customer knowledge of preventive maintenance techniques and technology. Under the IRCx program, industrial customers receive a free recommissioning audit as well as financial incentives for implementing both recommissioning measures and preventive, proactive maintenance plans. Primary elements of the IRCx program include: A preliminary energy audit (or walkthrough) identifies the energy-using equipment at each facility that is a good candidate for recommissioning (RCx). Identified RCx opportunities are then discussed with the customer to help in evaluating which ones they would like to pursue. If a customer is interested in the identified measures, a detailed survey is conducted by Nexant or vendor firms having expertise in the targeted processes, such as quantifying steam trap leaks, optimizing compressed air system performance, or documenting boiler operating efficiency. A final implementer-approved study report is presented to the customer to inform management of the benefits of such measures and to encourage the long-term implementation of recommissioning. The facility owner engages in energy measure and persistence method planning and execution. 76 LEADERS OF THE PACK The implementer verifies savings produced and the maintenance plan. PG&E renders the qualifying incentive payment to the customer with the implementer’s final approved energy savings. To ensure savings persistence, the IRCx program requires the customer to implement a maintenance plan for the systems analyzed that can consist any of the following: Computerized maintenance management system (CMMS) with a designated staff operator Advanced monitoring, diagnostic, and control system One- to three-year service contract with a preventive maintenance contractor Once the program is implemented in a particular facility, cash incentives based on verified savings are paid directly to the customer to offset up to 50% of the recommissioning cost and the maintenance plan. Common IRCx measures include: Leak repairs and maintenance (compressed air, steam, compressed gases) Combustion efficiency optimization Insulation repair Belt drive upgrades Sequencing and compressor controls Heat transfer surface cleaning and maintenance Process optimization through system tuning Process cooling system optimization Providing proactive maintenance services and achieving persistent savings over time in industrial facilities is challenging. In the industrial arena, each plant is unique, even within a single industry type. For example, in glass manufacturing, a facility that produces flat glass is very different from one that produces bottles; in addition, for each subsystem within the plant (e.g. compressed air, combustion), a different type of expertise is required along with a unique, proactive maintenance plan. In general, companies providing services for compressed air systems do not have in-house experts on combustion systems. The IRCx program facilitates the delivery of audits, and if needed, maintenance services, by subject matter experts in these types of specific disciplines. IRCx is also ideal for increasing cross marketing and collaboration among the other utilitysponsored incentive programs. During the IRCx audits, retrofit measures are routinely identified and customers are referred to other applicable retrofit incentive programs, as appropriate. Similarly, many projects are referred to the IRCx program by such collaborative retrofit programs, enabling customers to receive maximum benefits in an efficient manner. As part of PG&E’s Energy Efficiency Portfolio, the 2010-2012 IRCx program was an overall success, with PG&E recently extending the program into the 2013-2014 cycle and expanding the program market to include food processing customers as well. 77 LEADERS OF THE PACK © ACEEE PG&E’s 2013-2014 Energy Efficiency Portfolio is funded through a public goods charge placed on customer rates as mandated by the California Public Utilities Commission. Where possible, portfolio programs leverage additional outside funding which may come from such sources as federal, state, and local governments, manufacturers, trade allies, and other stakeholders. The IRCx program is a performance-based resource program (also known as 3rd party program in California) which focuses on rewarding a non-utility program implementer (3rd party program implementer) based on actual energy savings installed. This model shifts performance risks from California utilities (EE fund administrator) to 3rd party implementers. Program Performance Participation in the IRCx program has ranged between six and eleven customers in the last three years. Annual program expenditures have run between $675,500 in 2010 and $1.64 million in 2012. The program is cost-effective with a Utility Cost Test benefit/cost ratio of 1.51 and a Total Resource Cost Test benefit/cost ratio of 1.39. The lifetime cost of conserved energy is $.1033/kWh and $.93/therm. Gross and Net energy savings are provided in the tables below. Impact evaluations are currently in progress and will be available in the near future. 2010 2011 Program Expenditures ($ million) 2012 $.68 $1.66 $1.64 Gross Energy Savings (kWh) 3,130,561 1,572,591 6,331,906 Gross Demand Savings (kW) 368.3 181.6 726.4 56,470 1,373,345 164,524 Net Energy Savings (kWh) 2,191,393 1,100,814 4,432,334 Net Demand Savings (kW) 257.8 127.1 508.5 39,529 961,342 115,167 6 10 11 Gross Therm Savings Net Therm Savings Number of Participants Lessons Learned Utilizing subject matter experts (SME) in marketing the PG&E IRCx program, in addition to performing audits, has greatly increased program participation as the customer has increased confidence that their needs will be met in a streamlined fashion. Prior to performance of energy audits, initial screenings of potential candidates ensures program resources are spent only on qualified and motivated customers with the financial resources to install the recommended energy efficiency measures. 78 LEADERS OF THE PACK Program at a Glance Program name Pacific Gas and Electric (PG&E) Industrial Recommissioning (IRCx) Targeted Customer Segment Industrial and Food Processing Sectors Program Start Date 1/1/2010 Annual Energy Savings Achieved (total 2010-2012 cycle savings divided by three) 3,678,353 kWh per year 531,446 therms per year Annual Peak Demand (Summer) Savings Achieved (total 2010-2012 cycle savings divided by three) 425.4 kW per year Other Measures of Program Results to Date (such as number of participants, participation rates or market penetration) 27 Participants Budget for most recent year (and next budget cycle if available) 2010-2012 Cycle: $4,729,807 2013-2014 Cycle: $3,000,000 Funding Sources (name and description) California Public Utilities Commission public goods charge on customer rates. Website http://ircx.nexant.com/ Best Person to Contact for Information about the Program: Name Mushtaq Ahmad Position Senior Program Manager Organization Nexant, Inc. Phone number 415-369-1039 Email address [email protected] INDUSTRIAL AND LARGE COMMERCIAL — EXEMPLARY PRODUCTION EFFICIENCY ENERGY TRUST OF OREGON, ADMINISTRATOR AND IMPLEMENTER Program Overview Energy Trust of Oregon provides energy-efficiency services and cash incentives to all sizes and types of industrial and agricultural customers through the Production Efficiency program (PE). Production Efficiency (PE) provides a diverse set of custom and streamlined offerings that have been designed to help these energy-intensive and complex businesses achieve significant amounts of savings on an ongoing basis. Production Efficiency aims to 79 LEADERS OF THE PACK © ACEEE acquire cost-effective electric and gas savings through technical assistance and financial incentives for high-efficiency design, equipment and operations in existing and new industrial and agricultural processes and facilities. Energy Trust promotes innovative technological and behavioral approaches to industrial energy efficiency and provides technical expertise, training and project funding to help companies plan, manage and improve their energy efficiency. Energy Trust opened its doors in 2002 as a nonprofit organization with a mission to invest in cost-effective energy-efficiency, buy down the above-market costs of renewable energy and transform markets. Production Efficiency started in 2003 as one of Energy Trust’s first programs, and has remained a significant and highly cost-effective portion of the Energy Trust efficiency portfolio. Managed by an external Program Management Contractor for the first 5 years, PE used a custom project approach to focus primarily on the highly costeffective efficiency opportunities in primary and secondary process equipment. In late 2005, program evaluation and an organization-wide management audit both recommended that a change in delivery model could be beneficial in order to establish more effective communications and build long-term relationships with larger customers who have significant and ongoing savings potential. In 2007, program management was brought in house, and since that time, there have been rapid innovations in program design, development of new channels to market, and diversification of sources of savings. These new offerings and strategies complement and increase the throughput of custom capital projects that continue to provide the majority of savings. The program is organized around and achieves savings through two primary pathways to market: custom and trade ally driven. Each is targeted to specific industry needs and/or market segments with differing complexity, delivery channels and development is delivered by Program Delivery Contractors (PDCs) acting as energy efficiency account managers. The Custom track includes capital, operations & maintenance (O&M) measures and strategic energy management (SEM) offerings. By performing custom analysis and verification of savings for each project, the program has the flexibility to work with large industrial retrofits, unique process improvement projects and emerging technologies and practices. The Custom track works with medium to large industries, which are provided energy efficiency services and incentives to drive deep and persistent process efficiencies. Custom capital and O&M projects are supported by assigned PDCs and a pool of technically specialized Allied Technical Assistance Contractors (ATACs), who provide detailed technical studies. SEM opportunities are identified by PDCs and delivered by a separate pool of Industrial Technical Service Providers (ITSPs). All in all, approximately 30 Oregon firms participate as contractors in some role in the Custom track. Custom incentives are based on the project: Energy Trust offers cash incentives, calculated on an individual case-by-case basis for almost any type of energy efficiency project with savings that can be quantified through a study and verified. PE provides free custom technical analysis studies through qualified Allied Technical Assistance Contractors. Custom track incentives 80 LEADERS OF THE PACK are $.25/ annual kWh saved and $2.00 per annual therm saved, capped at 50% of eligible project costs The 90 x 90 industrial O&M incentive is for stand-alone Custom O&M measures and provides 90% of implementation costs to sites that implement recommended O&M measures and required persistence strategies within 90 days, capped at $.08/kWh and $.40/therm. Sites that complete after the 90 day implementation period revert to the standard O&M incentive for 50% of project costs. Sites participating in Energy Trust’s Strategic Energy Management initiatives receive valuable free training, technical support and coaching to establish or develop a comprehensive SEM program at their plant. Incentives for achieving behavioral/ O&M energy savings during implementation of a Strategic Energy Management (SEM) offering are $0.02/annual kWh saved, or $0.20/annual therm saved. Industrial lighting and the Small Industrial Initiative are both delivered through trade ally networks, developed and organized by a different set of PDCs. Trade allies are recruited and provided with calculated savings tools and a simplified incentive process. This is effective for standard measures where savings are easily calculated by common formulas with a small number of inputs. It streamlines program participation and reduces the cost of delivery, enabling a cost-effective approach to smaller projects. Measures include simpler energy-efficient equipment upgrades such as lighting, drives, insulation, HVAC, pumps, motors, small compressed air, irrigation upgrades, refrigeration/cold storage, and process equipment. Program Performance A summary of the program’s expenditures, energy savings, sites served and projects completed is in the table below. Preliminary data for 2012 indicates energy savings of 14.5 aMW and 879,387 Therms. Program volume for the Production Efficiency program has more than quadrupled over the past 5 years as Energy Trust has expanded tracks and created new initiatives. The Trade Ally tracks in lighting and small industrial have been the major contributors to this growth. Currently, Production Efficiency completes close to a thousand projects a year and expects this to be about the same or a higher in 2013. 2009 2010 2011 Program Expenditures ($ million) $16.2 $20.0 $26.6 Electric Savings (aMW) 9.0 aMW 15.9 aMW 13.8 aMW Natural Gas Savings (Therm) 232,341 606,116 1,032,517 Number of Sites Served 475 626 708 Number of Projects Completed 645 872 976 Energy savings from the PE program have been and remain the lowest cost resource in the Energy Trust portfolio, with levelized costs in 2011 of $0.025/kWh and $0.19/therm. As 81 LEADERS OF THE PACK © ACEEE code changes and other market effects continue to challenge cost-effectiveness in residential and commercial resource acquisition programs, the PE program plays an essential role in keeping average acquisition cost for the portfolio below the 2011 levelized cost performance benchmarks of $0.035/ kWh and $0.60/therm set by the Oregon Public Utility Commission. Evaluations for the PE program are located at http://energytrust.org/library/reports/Evaluation_2007-2008_Production_Efficiency.pdf, http://energytrust.org/library/reports/100903_PE_ImpactEval0.pdf. The 2009-2012 impact and process evaluations are expected to be completed in 2013. 2009 2010 2011 Levelized Cost/kWh* $0.027 $0.022 $0.025 Levelized Cost/Therm* $0.23 $0.22 $0.19 *Note: Lifetime cost of conserved energy The Energy Trust cost effectiveness policy includes an in-depth description of the various costs and benefits that are included in the Energy Trust’s societal cost test. The following table shows the utility cost and societal cost benefit cost ratios for PE. 2011 Benefit Cost Ratios NPV 1 of Utility Energy Benefits (millions) NPV of Societal Energy Benefits (millions) NonEnergy Benefits Utility Cost Societal Cost Utility BCR Societal BCR Production Efficiency $78.8 $97.3 $22.4 $24.4 $52.7 3.2 2.3 Production Efficiency - Gas $8.7 $10.8 $.44 $2.0 $5.8 4.3 1.9 Production Efficiency - Electric $70.1 $86.5 $21.9 $22.3 $46.8 3.1 2.3 Lessons Learned Industrial sites have huge and ongoing potential for cost-effective efficiency opportunities. While many industrial customers believe they’ve done all efficiency at their sites, Energy Trust has found that advances in technology, changes in production capacity or product mix and emerging waste-reduction priorities are providing new opportunities to save energy in manufacturing. Manufacturers rarely initiate energy efficiency without program intervention. With Oregon’s low energy costs, energy can represent less than 5% of costs associated with production, which is not a priority for most customers. Customers will engage with a well-designed program. In some states, manufacturers have been exempt from public benefits programs in the belief they could be more successful on their own (self-direction). In Oregon, self82 LEADERS OF THE PACK direction is on the decline as some large customers are opting to pay the public purpose charge to receive the services and incentives of the PE program. (See ACEEE research on self-direct programs, Chittum 2011.) The program priority must be to lower the first cost of projects. Industries typically make investment decisions on simple payback criteria, or simple return on investment (ROI) and internal rate of return (IRR) calculations. Our market research identified a target payback range of 0 – 6 years at most sites. Incentives paid upon project completion have the biggest impact on investment decisions. Financing is not a barrier to efficiency investment for medium to large industries. Most manufacturers are in owner occupied facilities, with maintenance and engineering staff. They have ready access to credit, but often self-capitalize projects. These customers rarely outsource essential services or lease equipment. Energy Trust’s market research showed a strong cultural bias against incurring debt for operations. Staff capacity -- the knowledge and dedicated time to change how they are using energy – is a challenge. Industrial participants are technical people, often engineers, who understand why energy projects make sense. The focus on Lean manufacturing, and a lean workforce, has stretched our champions’ capacity and energy efficiency is often an add-on to their already full-time job. Program offerings should be designed, tuned and focused make it as easy as possible for staff to be successful. Additional customer support surfaces more cost-effective savings. PE is salesbased with a focus on developing long-term relationships to help customers achieve significant ongoing savings. In Oregon, increased program delivery expenditures have delivered higher savings and lower resource acquisition costs than increased incentive levels. Customers recognize the value of program assistance in customer satisfaction surveys. There are big savings in low and no-cost O&M measures. Operational inefficiencies are often not visible to customers without program intervention. The PE program assigns a 3-year measure life to qualified O&M projects which are implemented along with persistence strategies such as monitoring, changes to standard operating procedures and controls programming. Strategic Energy Management is a game-changer for industrial efficiency programs. SEM drives changes to help sites manage their energy use. Energy Trust achieves immediate savings through operational changes and enables greater participation with larger capital projects. Energy Trust Production Efficiency has led the country in implementing SEM programs since 2009, delivering training and support to 70+ industrial sites. Targeting by sector may be off-target. Sectors can help identify customers and target outreach to customer with high technical potential for savings. In Oregon, food processors and nurseries have strong professional associations with energy efficiency campaigns. But Energy Trust believes that manufacturers have more 83 LEADERS OF THE PACK © ACEEE affinity by culture than by sector – for example, Lean manufacturers have more in common with each other than with less creative organizations in their sector. Program at a Glance Program name Production Efficiency Targeted Customer Segment All Industrial and Agricultural Customers Program Start Date 2003 Annual Energy Savings Achieved 2012: 127,020,000 kWh; 879,387 therms Peak Demand (Summer) Savings Achieved This is not a metric that Energy Trust reports on. Other Measures of Program Results to Date Budget for most recent year (and next budget cycle if available) 2012 Budget : $32.7 million total ($29.3 electric, $3.4 gas) 2013 Budget: $34.2 million total ($30.9 electric, $3.3 gas) Funding Sources (name and description) Energy Trust began operation in March 2002, charged by the Oregon Public Utility Commission with investing in cost-effective energy efficiency, above-market costs of renewable energy and market transformation activities. Through state legislation, tariffs and other requirements, Energy Trust is funded by 1.5 million customers of Portland General Electric, Pacific Power, NW Natural and Cascade Natural Gas. Customers of all four utilities pay a dedicated percentage of their utility bills to support a variety of energy-efficiency and renewable energy services and programs. Oregon State Legislated Public Purpose Charge; SB 1149 & SB 838 Website: http://energytrust.org/industrial-and-ag/ Best Person to Contact for Information about the Program: Name Kim Crossman Position Industrial Sector Lead Organization Energy Trust of Oregon Phone number (503) 459.4074 Email address [email protected] 84 LEADERS OF THE PACK INDUSTRIAL AND LARGE COMMERCIAL — EXEMPLARY ENERGY SMART INDUSTRIAL (ESI) BONNEVILLE POWER ADMINISTRATION (BPA), ADMINISTRATOR CASCADE ENERGY, INC., IMPLEMENTER Program Overview Public utilities in the Pacific Northwest have over 2,400 MW of industrial load. From the Northwest Power and Conservation Council’s Sixth Power Plan, BPA set the goal to reduce industrial energy usage by 12 aMW (or 105,120,000 kWh) in fiscal year2 (FY) 2010 and by 15 aMW (or 131,400,000 kWh) in FY2011. These energy savings goals were nearly double the industrial savings achieved in the previous two years. In response to new energy savings targets, BPA management decided to collaborate with an outside partner for the design and implementation of a new industrial program to assist BPA utility customers and their industrial end users increase the cost- effective realization of energy efficiency savings. After an extensive RFP process, BPA selected Cascade Energy (program partner) to work with the BPA Industrial team in develop and roll out the new program. In just four months, BPA and Cascade Energy designed the new regional industrial program, Energy Smart Industrial (ESI), which officially launched on October 1, 2009. ESI primarily targets industrial market segments common to the Pacific Northwest, including pulp & paper, wood products, food processing, and water/wastewater. However, any industrial customer of a participating utility is eligible for program participation. All industrial measures are targeted through the following: Traditional custom projects (e.g., energy efficiency measures in systems such as, refrigeration, compressed air, wastewater and lighting, to name just a few). Simplified deemed calculator projects for lighting and small compressed air. No-cost/low-cost operations and maintenance improvements. Behavior-based/continuous improvement methods. The BPA ESI program is designed to offer a fully integrated set of components for participating utilities to choose from and uses several innovative delivery approaches. Everything from custom projects to energy management savings to “small industrial measures” that provide simplified tools and streamlined processes to handle everything 2 BPA’s fiscal year (FY) period is from October 1st to September 30th. 85 LEADERS OF THE PACK © ACEEE from small capital projects to a robust lighting trade ally component that leverages a strong team of lighting specialists in the field to identify, support, and process prescriptive lighting projects. BPA’s ESI program flexibility can be applied to a broad range of industrial needs, facility sizes, and technologies. One critical barrier, having limited BPA staff (e.g., not having enough dedicated full-time employees or “FTE”), was solved by outsourcing the program delivery/implementation to a third-party program partner —adding the necessary “boots on the ground.” [Note: BPA staff provide overall program management and oversight.] Two components that bring additional innovative approaches to the ESI program are: 1. The utility-assigned ESI partners (or “ESIPs”), which are also called the ‘face of the program,’ serve as the single point-of-contact to both utilities and their industrial customers –—helping them meet their industrial sector goals by defining, developing, and managing all forms of electrical energy saving projects from “cradle to grave.” Their professional qualifications include a mix of formal engineering education, marketing and communications skills, and backgrounds in energy management. Several ESIPs have experience in major regional industries like pulp and paper, food processing, water/wastewater, and mining. 2. BPA’s ESI program developed processes and procedures for market delivery through the following three program components: Energy Program Manager (EPM): funding of energy efficiency resources at qualifying industrial facilities to alleviate staffing impediments to energy conservation. Track and Tune (T&T): low/no-cost operations and maintenance improvements with incentive funding for three-to-five years and include tools for interval data acquisition and performance tracking. High Performance Energy Management (HPEM): a 12- to 15-month management systems approach to energy efficiency, using behavior-based and continuous improvement methods. Measurement and incentive funding is available for three-to-five years. Savings from T&T and HPEM are quantified relative to a program-supported, multivariable regression model that follows the guidelines of International Performance Measurement and Verification Protocol (IPMVP). Both components reward persistence in savings through ongoing monitoring and annual performance-based incentives over a three-to-five year period. Another change the ESI program made was requiring utilities pass through 100% of BPAfunded incentives to their industries. Initially in October 2009, the program’s maximum incentive rate for custom projects was the lesser of $0.25/kWh of verifiable energy savings, up to 70% of the incremental project cost. Then in October 2011, BPA allowed utilities more flexibility to reduce those incentive rates (on a project-by-project basis) to better manage their allocated energy efficiency incentive (EEI) budgets. In addition to incentives, the ESI program could pay up to 100% of the costs for technical consulting services needed to 86 LEADERS OF THE PACK identify energy saving opportunities, analyze the impact of projects, and generate the appropriate technical reports. Program Performance3 Program expenditures, energy savings, demand savings and participation levels are provided in the following two tables. 2010 2011 2012 Program Expenditures ($ million) $30.4 $36.7 $15.2 est. Energy Savings (kWh)* 115,632,000 253,514,400 91,980,000 est. Demand Savings (aMW)* 13.20 28.94 10.50 est. Participation 2010 2011 2012 Enrolled Utilities 99 104 105 Engaged Utilities 63 80 86 Participating End Users 219 378 478. *Net savings. Over the course of a short period of time, the ESI program significantly increased the realization of industrial energy savings above that of previous historic levels. Savings have been acquired in a very cost-effective manner. The total cost of industrial acquisition ranks among the lowest at BPA ($1.59 MM/aMW or $0.18/kWh total cost). The lifetime cost of conserved energy is $23/MWh. The overall levelized cost is $0.025/kWh for the FY20102011 program period. A recently conducted process evaluation of BPA’s ESI program indicates participants are highly satisfied with the program and believe it offers a broad range of tools to help save energy. Approximately 8 out of 10 respondents from the industrial sector said they were highly satisfied with the services provided through the program. According to evaluation results, 84% of BPA utility customers who responded said they have been able to offer a comprehensive energy efficiency program that covers all types of saving opportunities. Nearly 9 out of 10 utility respondents said BPA’s ESI program equipped them to expand efficiency-related technical support to their industrial accounts. And finally, 3 out of 4 utilities said the program helped them complete more energy efficiency projects within the industrial sector. The process evaluation covers the 2010 and 2011 program period was conducted and produced by Research into Action (RIA) and is available at the following link: In October 2012, BPA attempted to change “utility reporting systems;” however, due to multiple issues, the system was taken off-line in December 2012 and sometime later was replaced with an interim solution; therefore at this time, BPA is unable to provide sector/programmatic/utility incentive details. 3 87 LEADERS OF THE PACK © ACEEE http://www.bpa.gov/energy/n/reports/evaluation/pdf/ESI_Process_Evaluation_20102011.pdf A separate impact evaluation was also conducted which verified savings claimed by the ESI program’s innovative Energy Management pilot. Independent evaluators statistically verified 92% of the more than 14 million kilowatt-hours industrial participants realized during the program’s first year. The results of a series of cost tests, also reported the ratepayer funds used for energy management makes for a solid public investment. Utilities and participants alike reap a payoff when industrial businesses engage in the energy management for three-to-five years, or longer. The statistical analysis in the impact evaluation report was conducted by the Cadmus Group. The full report is available at the following link: http://www.bpa.gov/energy/n/reports/evaluation/pdf/BPA_Energy_Management_Imp act_Evaluation_Final_Report_with_Cover.pdf. Lessons Learned Prior to BPA’s ESI program, another barrier identified by consultants in an initial market characterization study was substantial confusion by utilities and industries on who to contact about available industrial offers; this led to a lack of accountability. BPA had used a Customer Service Team (CST) approach where each utility worked with an assigned BPA Energy Efficiency Representative and BPA Engineer that would contact the utility and/or industry. BPA’s ESI program design consolidated the CST approach into one position – the ESIP. For all things industrial, the utility and industry now have one point-of-contact to coordinate and market ESI program components and address specific needs to meet their goals. This simplified communication to help utilities better access and understand the new program components; it also helped establish trust and a strong working relationship among BPA, utilities, and their industries. An additional key factor was the decision to approach each utility as a separate customer by understanding their needs, concerns, and barriers to taking on industrial energy efficiency and working to help them overcome those barriers. With over 100 participating utilities and over 600 industrial facilities visited, there obviously is not a “one-size fits all” communication protocol. Everything from small project successes coupled with assistance in completing current projects to clearly explaining the details of the ESI program components have been fundamental to bringing new utilities and their industries into the program while expanding the participation of historically active utilities. Program at a Glance Program name Energy Smart Industrial Targeted Customer Segment Industrial Sector End Users Program Start Date 10/1/2009 88 LEADERS OF THE PACK Annual Energy Savings Achieved* FY2010: 13.20 aMW = 115 632,000 kWh FY2011: 28.94 aMW = 253,514,400 kWh FY2012: 10.50 aMW = 91,980,000 kWh (estimated) Peak Demand (Summer) Savings Achieved N/A Other Measures of Program Results to Date Exceeded the FY2010/2011 savings target 90% of eligible utilities have enrolled Utility and end users high satisfied (see ESI Process Evaluation) Budget for most recent year (and next budget cycle if available)* FY2010/2011: $67.1MM FY2012/2013: $31.1MM estimate FY2014: $ unavailable Funding Sources (name and description) BPA/Utility paid incentives Website www.energysmartindustrial.com Best Person to Contact for Information about the Program: Name Jennifer Eskil Position Agriculture/Industrial Sector Lead Organization Bonneville Power Administration Phone number 509-527-6232 Email address [email protected] *Note: The savings and budget figures provided for FY2012/2013 are estimates at this time, given BPA’s limited utility reporting system. We are unable to provide estimates for FY2014 due to BPA’s implementation contract with Cascade Energy expiring on September 30, 2013. BPA staff is working with Supply Chain. INDUSTRIAL AND LARGE COMMERCIAL — EXEMPLARY FOCUS ON ENERGY INDUSTRIAL PROGRAM WISCONSIN ENERGY CONSERVATION CORPORATION (2005-2010); THE SHAW GROUP (A CB&I COMPANY) (2011-CURRENT), ADMINISTRATORS ; SCIENCE APPLICATIONS INTERNATIONAL CORPORATION (SAIC), ENERGY, ENVIRONMENT & INFRASTRUCTURE, LLC, IMPLEMENTERS Program Overview The Focus on Energy Industrial Program has targeted all eligible industrial customers in Wisconsin that received electricity or natural gas from a participating utility. The industrial sector consists of approximately 12,000 customers ranging in size from small light manufacturing to heavy industrial processes. In Wisconsin, the largest and most energyintensive industries, and those with the greatest opportunities to realize the benefits for 89 LEADERS OF THE PACK © ACEEE energy savings are pulp and paper mills, food processors, metal casters, plastics manufacturers, printers, ethanol producers, and wastewater facilities. All end uses for which there are energy efficiency best practices are or have been included. Electric efficiency measures include lighting, motors/drives, compressed air, pumps, blowers, controls, filtration, refrigeration, aeration, vacuum, HVAC, information technology, process heating and cooling, and other manufacturing processes. On the natural gas side, the Program has targeted steam systems, hot water, process heating, comfort heating, building shell, heat recovery, biomass and biogas conversion. Expert field energy advisors have provided direct service delivery through communication channels with customers, trade allies, and utility key account managers. The Program has relied on relationships with key Trade Allies, business associations, and participating utilities to support program awareness and incentive delivery. Best Practice training events, in the form of classroom courses and webinars, have been delivered for a wide array of technologies and systems, including steam, process heat, ventilation, pumps, compressed air, refrigeration, and Practical Energy Management. The Program has applied its Energy Best Practice Guidebooks to bring Best Practices to key cluster industries. To drive additional savings and customer participation the Industrial Sector Program released special offers designed to break down critical barriers customers often face when trying to implement efficiency projects such as lack of staff time and resources. These offers have included a Large Project Competitive RFP which increased the annual customer cap by $100,000 so that customers could do larger projects, Staffing Grants which allow companies to “hire” a full-time equivalent to identify energy efficiency projects, and the bundling of a U.S. DOE ARRA grant. There are five types of incentives offered: Prescriptive Incentives - hundreds of prescriptive incentive offerings for technologies such as lighting, compressed air, VFDs, and boiler tune-ups have been offered by the Program. Custom incentives – offered in two (2) tiers for verified electric and natural gas projects: Tier I offered$0.04 per kWh and $0.40 per Therm, and Tier II offered $0.06 per kWh and $0.60 per Therm. Feasibility Studies – up to 50 percent of the cost of a study, not to exceed $7500, was paid to studies that showed good potential for energy saving projects. Staffing Grants – for customers who could demonstrate need for human resources to complete projects. Special offers, including DOE Energy Savings Assessments, Compressed Air Leak Study and Repair, Compressed Air Retro-commissioning, Process Energy Bounties, and Performance Based Assessments were used to engage Trade Allies and leverage new projects. 90 LEADERS OF THE PACK Beginning largely as an incentive program, with energy advisor field support, the Focus on Energy Industrial Program has built upon this core service offering to provide technical expertise for Wisconsin’s industrial customers. The Program has reached out to key business allies, including especially business associations, Trade Allies, and utility key account representatives. Critical to program design, the Program conducted one on one and business roundtables to better understand the needs, both in terms of customer barriers and of program design. The rewards have been customer trust and program participation in a market that tends to be very conservative and focused on production. While standard and custom incentives have led the way, innovative approaches, including feasibility studies, performance-based assessments, staffing grants, and competitive RFPs, developed over the years, have yielded even more robust participation in this sector program. Early on, the Program introduced Practical Energy Management©, geared to teaching and providing individual customers with a customizable template that enables them to gain control of their energy costs. Over the years, Focus on Energy had developed and supported training in the key industrial systems such as steam, heat processing, compressed air, and refrigeration, relying heavily on the U.S.DOE’s Best Practices approach. While employing a targeted cluster approach, through the development and dissemination of industry-specific Energy Best Practice Guidebooks for Pulp & Paper, Food Processing, Metal Casting, Plastics, Ethanol, and Water/Wastewater, the program has consistently exceeded its contractual goals and increased participation throughout the state. The Program has also initiated special offerings and self-use tools to reach the more numerous smaller industrial customers which are dominated by metal fabrications and other similar industries. The Program immediately seized upon the industrial opportunities afforded by the U.S.DOE’s Best Practice approach when it came out, about eight years ago, leveraging specialized training and project grant resources, including the DOE ARRA funding. In 2012, Focus on Energy decided to restructure the program to target customers stratified by energy usage. With this change Focus on Energy created programs such as a Large Energy Users (LEU) program, a general Business Incentive Program, a Chains and Franchise program, and Small Business program. Because 70% of the current LEU program participants are industrial customers, the LEU program uses many of the same components from the previous incarnation as the Industrial Sector program recognized here. (The LEU program was not nominated for this review because it is too new.) Program Performance The Focus on Energy Industrial Program consistently exceeded its goals for both natural gas and electric savings and recently has provided a Program cost-effectiveness of approximately 2.75. Over the years, spanning from 2001 into 2012, the Program reached almost 4000 customers, over one-third of the market. This includes all of the top 200 eligible 91 LEADERS OF THE PACK © ACEEE industrial energy users in the state. There were 952 individual companies participating in 2011 alone. Year Incentives* Labor Total 2009 $15,209,018 $8,175,782 $23,984,800 2010 $13,783,470 $7,420,860 $21,204,330 2011 $12,555,605 $4,395,000 $16,950,605 2012** (3 mo) $2,010,100 $1,037,020 $3,047,120 TOTAL $43,558,193 $21,028,662 $64,586,855 *Does not include $14.6 million of USDOE ARRA funding for nine large customer projects in 2010-2011 ** In 2012 the Industrial Sector Program ceased operating and customers were transitioned into the Large Energy Users Program. Natural gas savings have increased, while electric power and energy savings have been declining, as shown in the table below. Year kW kWh 2009 40,136 220,741,895 11,296,428 2010 26,451 177,045,564 8,730,693 2011 19,642 145,180,531 8,513,558 88,632,532 19,810,982 631,600,522 48,351,661 2012 (3 mo) TOTAL 12,010 99,239 Therms All values are net gross, except for 2012 which are tracked gross savings. In spite a downturn in the economy and a slow recovery, Program participation has continued relatively steady over the past few years. Strong participation is largely due to program awareness and the maturity of industrial customers as the Program has grown over the years and the availability of talented energy advisors and key Trade Allies distributed throughout the state. Year Projects Participants 2009 5,427 950 2010 4,600 800 2011 5,038 952 2012 (3 mo) TOTAL 1,200 459 16,265 3,161 A Program Cost Test is done by the Evaluation Team, in lieu of a Utility Cost Test, since a non-utility entity administers the program for the Public Service Commission of Wisconsin and Wisconsin participating utilities. Program design, including the incentive rate structure, are generating by DSM modeling software that provides reasonable values in the context of 92 LEADERS OF THE PACK market penetrations for various measures. Model development generally ensures that program delivery is cost-effective from a program standpoint. Periodic B/C analyses are conducted from the Program Cost and Total Resource Cost perspectives. One recent Benefit-Cost analysis was completed in 2009 and showed an Industrial Program B/C of 3.5. Please contact the administrators for the report. Also, a more recent independent evaluation of the entire Focus on Energy Program done by Cadmus for CY2011, yielded a Business Programs’ TRC of 3.41, with the Industrial Program generating 42 percent and 62 percent of savings, respectively, for electricity and therm savings. The report is available through the Focus on Energy website. Lessons Learned Over the 12 program years, the Industrial Program learned many lessons related to program design and delivery, and of course they do not all fit here. A few key principles: The need to listen closely to customers to determine what program initiatives will be most effective in addressing their barriers. Understanding this lesson has generated strong program credibility and trust and is responsible for many of our offerings, including the Staffing Grant. A combination of technical expertise and financial incentives are powerful for effective program delivery. Energy management support ensures long-term customer participation and savings. Independent studies can generate significant project activity if strategically administered, especially if they are performance-based. Leveraging partnerships with organizations having similar missions, such as the Wisconsin Paper Council or the U.S.DOE, can yield significant results. Program at a Glance Program name Focus on Energy Industrial Program Targeted Customer Segment Industrial electricity and natural gas users of Wisconsin Program Start Date 2001 Annual Energy Savings Achieved 154 million kWh; 9.3 million Therms (2011) Peak Demand (Summer) Savings Achieved: 21.0 MW (2011) Other Measures of Program Results to Date: Over $15 million in U.S.DOE support grants Budget for most recent year (and next budget cycle if available): $17 million (2011) Funding Sources (name and description): Public Benefits charge on electric and gas bills Website: www.focusonenergy.com 93 LEADERS OF THE PACK © ACEEE Best Person to Contact for Information about the Program: Name John Nicol Position Program Manager Organization SAIC Phone number 608-277-2941 Email address [email protected] INDUSTRIAL AND LARGE COMMERCIAL — HONORABLE MENTION CUSTOMER MEMORANDUMS OF AGREEMENT NSTAR ELECTRIC & GAS, ADMINISTRATOR AND IMPLEMENTER Program Overview The Customer Memorandums of Agreement program targets customers in the top 2 quartiles of NSTAR’s energy sales. Like most utilities, NSTAR has a few very large customers who have opportunities that are many orders of magnitude beyond the next lowest cohort of customers. For NSTAR, the top 2 represents about 150 customers out of a total of 70,000 C&I customers which represent 50% of total sales and therefore, as a proxy, 50% of the efficiency opportunity. The NSTAR effort began with one pilot, MIT, and now has multiyear memorandums of understanding (MOUs) with 15 customers. NSTAR’s experience has been that the trade ally driven simplified “prescriptive” incentive model does not serve larger customer needs. Large customers have complex systems that require individualized, sophisticated analysis and customized solutions and they often have sophisticated internal engineering and financial capabilities. From NSTAR’s perspective, this combination of savings potential and in-house capacity increases the possibilities for deep savings – and warrants dedication of a like match of utility resources and expertise. The NSTAR MOU process begins with discussions between senior NSTAR and customer decision makers to help NSTAR understand the customer’s near and long-term business motivations and limitations. This sets a framework to develop a mutually satisfactory, customized, multiyear efficiency plan to capture opportunities that meet NSTAR’s resource acquisition criteria and the customer's investment and operational needs. The final MOU details very specific commitments and strategies by each party to acquire target levels of efficiency resources. NSTAR only moves forward when there is a match between our acquisition requirements and a sincere customer commitment to engage resources – only when it truly benefits both parties, and both parties are willing to commit. In implementation, a core team of customer and utility subject matter experts is established. The team must include a key champion from the customer’s organization who has the 94 LEADERS OF THE PACK appropriate stature to represent it to his/her upper management. The team may also include sales, technical, implementation, procurement, political or any other constituency that is deemed critical to address barriers to success. The team must also have access to resources to augment its own expertise where necessary with outside experts. The team should be small enough to remain functional and be empowered to make decisions. It is responsible for designing the MOU and plan as well as implementing it. The Customer Memorandums of Agreement program includes electric and gas end uses. Projects to date have involved campus-wide lighting upgrades, numerous mechanical system recommissioning and retrocommissioning projects, space-specific (office, classroom, laboratory) reduction targets of >20%, replacement of fan coil units with ECM’s and modulating valves, employee/occupant behavioral challenges, etc. The mix of services offered and delivery approach is different in every case, and is captured with specificity in each MOU. The MOU is the culmination of structured negotiations between key decision makers (e.g., those who can make resource commitments) from NSTAR and the customer. Examples include: leverage of existing utility equipment procurements for volume pricing; turnkey installation services through pre-approved utility contractors; integration of customer and utility engineering reviews and installation inspections to maximize skills utilization and minimize costly duplication; simplified incentives such as $/kwh; expansion of eligible technologies/strategies beyond the common portfolio; support of behavioral efforts; facility staff and user training; joint application for outside federal and state funding/grants; sharing of company-specific expertise; test bed for new technologies and promotions; and publicized status as an elite company/institution in the industry or community. Incentives are negotiated individually with each customer, but never exceed the NSTAR’s portfolio-wide average. While each MOU is confidential, because the cost structure is designed not to exceed the portfolio average of the portfolio savings, acquisitions can grow to scale without negatively impacting the company. The total benefit package to the customer includes not only the incentives but also the ancillary services – loaned technical expertise, access to volume pricing in equipment purchasing, staff and occupant training, etc. Program Performance Expenditure information for this program is confidential. When NSTAR negotiates MOUs, the company establishes a mutual agreement that customer investments and NSTAR incentives will be held in confidence. This allows NSTAR to customize and maximize investments for each agreement, based on the unique financial circumstances and hurdle rates of each customer. Publicizing these details could be a detriment to negotiations going forward. In aggregate, the incentives offered in the MOU agreements are no more than the average incentive paid across NSTAR’s portfolio of C&I programs. Program energy savings for the Customer Memorandums of Agreement program are summarized in the table below. 95 LEADERS OF THE PACK © ACEEE 2011 2012 Gross Annual Electric Savings (kWh) 102,570,984 78,643,508 Net Lifetime kWh 2,194,573,914 1,123,374,147 Gross Natural Gas Savings (Therm) 298,252 509,738 Lessons Learned NSTAR begins with high level discussions because it must determine at the onset, before it commits significant resources, if there is a match between its resource acquisition requirements and the customer’s objectives for their facility, and their willingness/ability to make change and to commit resources and make decisions to do so. Not all of the goals need to be aligned, however, there must be significant overlap in order to expect success. The pathway from the initial discussions to a final plan is unique to each MOU. Sometimes the initial discussions reveal insufficient overlap of goals to progress further. NSTAR’s experience is that the work from initial meeting to a signed MOU takes 6-12 months. It is important that Memorandums of Understanding capture, in detail, the very specific commitments and strategies each party will commit to and an action plan and schedule to execute them. The MOU must be implemented by a core team that consists of customer and utility subject matter experts. The team must include a key champion from the customer’s organization who is both committed to the effort and has the appropriate stature to represent it to his/her upper management. The team may also include sales, technical, implementation, procurement, political or any other constituency that is deemed critical to address barriers to success. In addition, the team must also have access to resources to augment its own expertise where necessary with outside experts. The team should be small enough to remain functional and be empowered to make decisions. Program at a Glance Program name Customer Memorandums of Agreement Targeted Customer Segment NSTAR’s largest 150 customers – who have control 50% of the total system savings opportunity. Program Start Date 2010 Annual Energy Savings Achieved 200,000,000 Net Lifetime kWh Peak Demand (Summer) Savings Achieved Other Measures of Program Results to Date Provides multi-year backlog of projects. Ability to drive comprehensiveness through deep engagement. Budget for most recent year (and next budget cycle if available) Not published due nature of negotiated program design Funding Sources (name and description) EE program funds – SBC, RGGI, other 96 LEADERS OF THE PACK Website Best Person to Contact for Information about the Program: Name Frank Gundal Position Senior, Manager Implementation Organization NSTAR Electric & Gas Phone number 781-441-8151 Email address [email protected] COMMERCIAL NEW CONSTRUCTION — EXEMPLARY NEW CONSTRUCTION PROGRAM NEW YORK STATE ENERGY RESEARCH & DEVELOPMENT AUTHORITY (NYSERDA), ADMINISTRATOR VARIOUS IMPLEMENTERS Program Overview The New Construction Program (NCP) has been in continuous operation since it was established by NYSERDA in 2000. The long term objective is to effect a permanent transformation of the way commercial and industrial buildings are designed and constructed in New York State. The NCP is currently soliciting applications for the eleventh round of the open enrollment program. The NCP has tailored each Program Opportunity Notice (PON) in response to regulatory requirements, changes in the energy efficiency and construction markets and State energy codes. The program targets commercial/industrial and some multifamily customers. NCP provides technical assistance and financial incentives to promote the adoption of energy efficient equipment and green construction in new and substantially renovated buildings. Technical assistance is provided on a cost shared basis. Capital financial incentives are designed to offset a portion of the incremental cost between equipment and systems proposed by the applicant, as compared to equipment and systems that meet a baseline requirement for energy efficiency (currently ASHRAE 90.1-2007, equivalent to the current New York State Energy Conservation Construction Code). Additional incentives are available for building commissioning, applicant design teams and projects which achieve LEED® or NY-CHPS certification. Incentives are tailored for upstate projects (outside New York City) and projects within the Consolidated Edison service territory (New York City and immediate surrounding area). Copies of the current incentive offerings are available upon request. 97 LEADERS OF THE PACK © ACEEE The NCP team includes in-house project managers and coordinators, who develop the program, provide oversight of individual projects and process applications and payments. The internal team works with external firms under contract to NYSERDA as outreach project consultants (OPCs) and technical assistants (TAs). OPCs provide outreach, field liaison and customer support, while TAs work directly with customers and design teams to identify and analyze energy efficient designs and measures. From the outset the NCP recognized that large, complex projects and small, simple structures present different opportunities for energy savings. The program responded to these differences with multiple approaches to participation, including pre-qualified equipment, custom measure analysis and whole building design. Through support of several green rating systems, including the USGBC LEED® program and the New York Collaborative for High Performance Schools (NY-CHPS), NCP also recognized the interrelationship between saving energy and sustainable building design. Realizing that optimum performance of energy efficient systems impacts long term energy savings, the NCP provided incentives for building commissioning. Understanding the unique characteristics of agriculture, manufacturing assembly lines, process equipment and data centers, NYSERDA gradually developed separate programs to address these process opportunities, and split them off from their original home in the NCP. NCP found that customers of larger, more complex projects were willing to push for deeper energy savings, provided additional financial support was available. NCP capitalized on this opportunity by creating a tiered incentive for design teams and a tiered financial incentive structure for whole building design projects, which provide higher incentives for correspondingly higher energy savings. For many years NCP was fully subscribed, but the severe economic downturn coupled with increasing savings goals per program dollar resulted in a reduction in applications. NCP responded by dramatically increasing program outreach, with a focus on architecture/engineering firms, industrial development agencies, real estate legal firms, developers and other groups with an early knowledge of upcoming projects. In 2011 the aggressive outreach yielded a 154% increase in project leads and a 32% increase in project applications, as compared to 2010. Program Performance Electric program expenditures for the last three years were $16.8 million in 2010, $24.3 in 2011 and $21.5 in 2012. There were a total of 1571 program applicants for 2010 through 2012. Average projected first year net energy savings for the most recent 3 years is 18.1 GWh and 5.3 MW projected first year summer peak. The most recent impact evaluation is located at http://www.nyserda.ny.gov/Program-Evaluation/NYE$-Evaluation-ContractorReports/2012-Reports/Impact-Evaluation.aspx, in the pdf titled New Construction Program. The New Construction Program is cost effective with benefit/cost ratios for the Program Administrator Cost (PAC) Test ranging from 4.3 to 7.8 and ratios for the Total Resource Test 98 LEADERS OF THE PACK ranging from 1.6 to 2.9. With both of these tests, the lower number incorporates resource benefits only and the higher number incorporates both resource benefits and non-energy impacts. The Lifetime cost of conserved energy (CCE) is described in the table and notes below: Metric CCE for New Construction Program Total Cost per MWh $48 to $76 NYSERDA Cost per MWh $17 to $28 Notes: The table above summarizes the cost per MWh analysis conducted for the NYSERDA New Construction Program. First-year costs were levelized over the lifetime of the energy savings. Levelized cost is the first-year cost converted to equal annual payments (using an assumed discount rate) divided by the annual MWh. The low end of the range is based on a discount rate of 0%. The high end of the range is based on a discount rate of 5.5%. Program and customer costs associated with non-electric savings were excluded. The proportion of costs attributed to electricity was estimated as the proportion of the combined electric and natural gas savings represented by electric savings. Electric savings were converted to MMBtus using a factor of .00341 per kWh. Lessons Learned Primary lessons learned from the New Construction Program are in the areas of promotion and marketing of the program. Aggressive outreach can significantly increase applications, particularly when conducted at a small group or individual level. Project kickoff meetings are great opportunities to encourage applicants to consider deeper energy savings, particularly when the discussion is supported with case studies of similar projects. The plaque program is well received by participants. NYSERDA provides a bronze plaque to participants whose buildings are projected to perform at least 30% better than the baseline. Participants often display the plaques in a prominent location. Plaque delivery combined with public presentation of a large display check is a great way to recognize the participant’s adoption of energy efficient construction, while helping to advertise NYSERDA’s programs. NYSERDA promotes early involvement for larger projects, to maximize opportunities for energy savings and incentives. Early guidance by NYSERDA Technical Assistants reduces or eliminates costly re-drawing and re-specifying by the applicant’s design team. The downside is that the failure rate of building projects tends to be higher in the early phases of design. Applicants may be unable to obtain financing, may lose proposed tenants, or may not obtain zoning or planning approvals; the reasons projects terminate are many and unpredictable. As a result, NCP has experienced an historic dropout rate in the range of 40-50 percent. This creates challenges in reaching program savings goals with built projects. NCP routinely accepts a large number of applications to offset the dropouts. Through an analysis of applications NCP has discovered a relationship between the applications per month, and the Architecture Billings Index (ABI) published by the American Institute of Architects. The application curve appears to lag the ABI curve 99 LEADERS OF THE PACK © ACEEE by a month or two, implying that the ABI may be a predictor of near term NCP application activity. The analysis is ongoing. Program at a Glance Program name NYSERDA New Construction Program Targeted Customer Segment Commercial/Industrial, and some Multifamily (multifamily min. 4 stories, min. 5 units and pursuing LEED® certification) Program Start Date 2000 Annual Energy Savings Achieved 458 GWh Peak Demand (Summer) Savings Achieved 122,000 kW Other Measures of Program Results to Date 941,000 MMBtu annual natural gas savings; $109 million paid incentives for 1567 projects; 170 million square feet of new and substantially renovated buildings with improved energy performance; 32% market penetration (most recent Market Characterization and Assessment report); 95% of participants likely to recommend NCP to others and 93% likely to participate again (most recent Process Evaluation report) Budget for most recent year (and next budget cycle if available) $37 million (2012) Funding Sources (name and description) System Benefits Charge collected by New York State Investor Owned Utilities Website: www.nyserda.ny.gov/new-construction Best Person to Contact for Information about the Program: Name Priscilla Richards Position Program Manager Organization NYSERDA Phone number 518-862-1090 x 3312 Email address [email protected] COMMERCIAL NEW CONSTRUCTION — EXEMPLARY NEW BUILDINGS 100 LEADERS OF THE PACK ENERGY TRUST OF OREGON, ADMINISTRATOR PORTLAND ENERGY CONSERVATION, INC., IMPLEMENTER 101 LEADERS OF THE PACK © ACEEE Program Overview Energy Trust New Buildings works with Oregon commercial real estate developers and building owners to support energy-efficient new buildings and major renovations within Portland General Electric, Pacific Power, NW Natural and Cascade Natural Gas territories. The program serves all vertical markets ranging from office and retail to schools and data centers — more than 40 market sectors overall. The program includes ground-up new construction, major renovation and tenant improvement projects. New Buildings serves electric and gas end uses by targeting building envelope; prescriptive and custom gas equipment; prescriptive, calculated and custom HVAC and lighting; controls; plug load; water heating; solar thermal; foodservice equipment; motors and variable speed drives; LEED® building; and process measures for custom and prescriptive data center measures. Also targeted are commissioning and post-occupancy through ENERGY STAR® using EPA’s ENERGY STAR Portfolio Manager, and cross-promoting solar electric with Energy Trust’s solar program. Energy Trust New Buildings provides incentives for energy-efficient design and equipment to support construction of high-performance commercial buildings and major renovations of all sizes and types of buildings. In total, the program provides a comprehensive set of services and incentives: plan reviews; early design assistance; energy modeling assistance; enhanced technical assistance; commissioning; standard equipment incentives (more than 100 prescriptive measures not including lighting); calculated lighting power density reductions and HVAC incentives; modeled savings incentives for whole building approaches; special measures (incentives for energy-efficient equipment or systems that are not prescriptive, calculated or included in an energy model); LEED incentives for projects that achieve LEED certification and save energy beyond the 2010 Oregon Energy Efficiency Specialty Code; low-rise multifamily ENERGY STAR Builder Option Package for projects three stories or less that install specific equipment types; and post-occupancy incentives. Once the building is constructed and occupied, Energy Trust can help cover the costs of earning the ENERGY STAR from the U.S. Environmental Protection Agency. New Buildings is positioned as a technical resource and market innovator. Two successful pilots — Path to Net Zero and Small Commercial Efficiency — spawned 20 buildings in Oregon bringing new ideas to help transform the built environment. Taking a target market approach to deliver small retail and small office packages, building owners and trade ally contractors are collaborating more than ever to build a “Good, Better or Best” building — an attractive new standard Energy Trust is setting. To advance even further down the path toward net zero, together, design firms, contractors and owners are actively working with Energy Trust’s technical staff in the earliest stages of a project to lock-in winning design strategies and tiered incentives of up to $0.30/kWh. Energy Trust has also looked to collaborate with many other organizations leading the way, such as the American Institute of Architects’ Committee On The Environment, and Cascadia Chapter of the U.S. Green Building Council to provide training on specific topics of interest such as financial business case, post-occupancy and net zero strategies — providing the “how to” not just the “why to” incorporate efficiency. 102 LEADERS OF THE PACK Energy Trust began serving utility customers in 2002 as a nonprofit organization with a mission to invest in cost-effective energy efficiency, buy down the above-market costs of renewable energy and transform markets. Within a year, the New Buildings program was designed and launched with a few standard offers and two engineers. Demand for the program grew quickly. In only a decade, New Buildings cumulatively saved more than 219 million kilowatt hours and 3.9 million therms of natural gas, and caught the attention of small and large key market players that continue to push the envelope of savings — spurring the cycle of innovation and making Energy Trust’s investment of ratepayer dollars more effective. Energy Trust celebrated its 10-year anniversary in 2012, and during that time has helped customers use energy efficiently or generate renewable power at nearly 438,000 residences, businesses and industrial facilities. Between 2002 and 2011, participating customers have saved more than $1 billion on their energy bills. In addition to these accomplishments, New Buildings’ contributions include: 70% market penetration rate based on square footage Comprehensive services and delivery starts with early design assistance, and leads to installation incentive opportunities, post-occupancy and commissioning Tiered incentives and enhanced technical assistance to support projects on the path to net zero energy 100 standard measures offered, not including lighting measures Offer tiered “good, better, best” packages for six small commercial building types (developed using a batched modeled savings approach) The program plays a role in the state as a whole as well. Oregon is among the leading states in building code energy efficiency, and most recently introducing a significant code baseline change of 15%. Oregon is one of a few states with a Reach code. Program Performance The expenditures, energy savings and sites served for the Energy Trust New Buildings program over the last three years is in the table below. Impact evaluations for the program are available for 2008 through 2011. 2010 2011 2012* Program Expenditures ($ million) $13.04 $11.15 $14.10 Net Electric Energy Savings (kWh) 41,793,155 35,720,120 57,550,434 Gross Electric Energy Savings (kWh) 50,126,700 40,656,593 67,129,823 Net Gas Energy Savings (Therm) 716,857 583,137 586,750 Gross Gas Energy Savings (Therm) 1,137,898 813,937 643,680 Number of Sites 252 297 302 *2012 savings and financial information are preliminary. Official results will be available April 15, 2013, in the Energy Trust 2012 Annual Report to the Oregon Public Utility Commission. 103 LEADERS OF THE PACK © ACEEE The program is cost-effective as indicated by the utility cost and societal cost test ratios shown below. 2009 2010 2011 Utility Cost Test 2.6 3.8 3.0 Societal Cost Test 2.2 2.8 1.8 Levelized Cost ($/kWh) $0.036 $0.021 $0.024 Levelized Cost ($/Therm) $0.41 $0.32 $0.40 Note: 2012 analysis is pending. Lessons Learned The primary lessons learned from the Energy Trust New Buildings program are: Early engagement. It is essential to engage with projects early in the design process to maximize program influence and energy-efficiency potential. New Buildings’ early design incentives and assistance has helped to provide a good “carrot” for projects to engage Energy Trust early on. Education and training. The program naturally operates in parallel to the code cycle and has a distinct opportunity to help educate on code updates and prepare the market for likely future code changes. New Buildings has enhanced its training and code assistance role and begun to capture additional market transformation savings. Target market offerings. Offerings that cater to a specific market’s project types and savings potential are essential for simplifying participation, ensuring predictability of incentives, and increasing participation and depth of savings from small commercial projects. Leverage and collaboration. Particularly in the engagement of the design community, the program benefits from leveraging existing organizations and initiatives, and aligning offerings with those that have momentum and familiarity in the market. For instance, the New Buildings LEED track has ensured a streamlined process for those projects pursing LEED certification. Program at a Glance Program name New Buildings Targeted Customer Segment Serves electric and gas end uses by targeting building envelope; prescriptive and custom gas equipment; prescriptive, calculated and custom HVAC and lighting; controls; plug load; water heating; solar thermal; foodservice equipment; motors and variable speed drives; LEED building; and process measures for custom and prescriptive data center measures. Also targeted are commissioning and postoccupancy through ENERGY STAR using EPA’s ENERGY STAR Portfolio Manager and solar electric. Program Start Date January 2003 Annual Energy Savings Achieved Total from 2003 through 2012: 218,896,634 kWh and 3,875,910 104 LEADERS OF THE PACK therms Peak Demand (Summer) Savings Achieved: Approximately 134% of average MW on a net basis Other Measures of Program Results to Date: 97% overall savings realization 1,634 sites served 70% market penetration rate Participant satisfaction with the program was 4.2 on a 5 point scale Evaluators recently indicated that early design assistance appears to be having market transformation effects 150 trade allies, contractors, equipment suppliers 71 design allies developers, owners, professional design firms, Expanding the overall ally network to also include solar trade allies and solar design allies in addition to lender allies, including banks, credit unions and qualifying financial institutions with a preferred green lending product Host and won an award from the Oregon Association of Professional Energy Managers for our role and sponsorship of the Building Energy Simulation Forum, a local and national group created for energy analysts/modelers to collaborate, share the latest techniques, problem-solve and share lessons learned — this has improved the quality of energy models we review Recently added a Lighting Design expert to provide consultation Technical Outreach Managers provide one-on-one project support statewide Budget for most recent year (and next budget cycle if available): 2013: $18,059,856 2014: $16,784,857 Funding Sources (name and description): In 1999, Oregon lawmakers and citizens envisioned a future with Oregon homes and businesses powered by clean, affordable energy. A new nonprofit organization — Energy Trust of Oregon — was created to lead the way. Energy Trust began operation in March 2002, charged by the Oregon Public Utility Commission with investing in cost-effective energy efficiency, above-market costs of renewable energy and market transformation activities. Through state legislation, tariffs and other requirements, Energy Trust is funded by 1.5 million customers of Portland General Electric, Pacific Power, NW Natural and Cascade Natural Gas. Customers of all four utilities pay a dedicated percentage of their utility bills to support a variety of energy-efficiency and renewable energy services and programs. Website: http://energytrust.org/newbuildings Best Person to Contact for Information about the Program: Name Jessica Rose Position Business Sector Manager Organization Energy Trust of Oregon 105 LEADERS OF THE PACK © ACEEE Phone number 503-459-4060 Email address [email protected] RESIDENTIAL AUDIT AND WEATHERIZATION — EXEMPLARY HOME PERFORMANCE SOLUTIONS COLUMBIA GAS OF OHIO, ADMINISTRATOR CONSERVATION SERVICES GROUP, IMPLEMENTER Program Overview In February 2008, Columbia formed a Demand Side Management (DSM) Stakeholder Group to help develop a comprehensive DSM portfolio for its residential natural gas customers. The DSM Stakeholder Group included representatives from the Office of the Ohio Consumers’ Counsel (“OCC”), the Public Utilities Commission of Ohio (“PUCO”), building trades, state and local government, business and industry, and energy conservation service providers. Michael Blasnik and Associates was selected to design the residential DSM programs. The goal of the initial DSM portfolio was to achieve natural gas customer usage reductions in a cost-effective manner, while maintaining or improving the comfort, health and safety of customers and the durability of their premises. On September 9, 2011 Columbia filed an application to continue and expand DSM programs by investing approximately $20 million annually for calendar years 2012-2016. One of the key residential programs in the portfolio is Home Performance Solutions. The objective of the Home Performance Solutions program is to provide incentives to Columbia customers living in existing residential buildings to install high quality attic and wall insulation and advanced air sealing retrofits, and to increase the market share of highefficiency furnaces installed during heating system replacements. Other than the low-income sector, Ohio’s home performance industry and market had not been developed prior to the implementation of Columbia’s DSM programs in 2009. While electric utilities had requirements for energy efficiency beginning in 2009 and gas utilities now have certain negotiated programs, the development of home performance in Ohio was recent. While all of Columbia’s residential customers are eligible for the Home Performance Solutions program, marketing efforts target customers with high usage (>100 Mcf per year) and customers already replacing an existing furnace. Customers who live in homes built before the implementation of Ohio residential building energy codes are considered primary targets for this program. 106 LEADERS OF THE PACK Home Performance Solutions offers rebates to customers for attic and wall insulation, blower door guided air sealing, and HVAC measures that are deemed cost-effective by the program energy audit. Rebates are approximately 40% of the insulation cost, approximately 60% of the air sealing cost, and $200 for a high-efficiency furnace upgrade for single measure installations. More comprehensive retrofits are encouraged by increasing the rebates when multiple energy conservation measures are installed to: approximately 60% for insulation, approximately 70% for air sealing, and $400 for a furnace upgrade. Customers with incomes at or below 80% of AMI receive rebates of 90% of the insulation and air sealing costs and $1,000 for a high-efficiency furnace upgrade. There are no caps on the air sealing or insulation rebates. Rebates are offered on a per hour basis for air sealing and per square foot for attic and wall insulation. In 2009, Conservation Services Group (CSG) was hired as the program implementation firm through a competitive bid process. One energy audit tool is used in the program and energy audits are conducted by CSG employees and a limited number of independent energy auditors in order to ensure a sound and consistent approach. The energy audit fee for customers with incomes greater than 80% of area median income (AMI) is $50, while the audit fee for customers with incomes equal to or less than 80% AMI but greater than 150% of the Federal Poverty Guidelines (FPG) is $20. Using industry best practices, the highly-trained, BPI-certified energy auditors conduct comprehensive energy audits that include blower door testing, infrared thermography, and combustion safety and efficiency testing. The energy audit also includes installation of lower-cost energy conservation measures, including programmable thermostats and efficient, low-flow showerheads, when applicable, to improve program savings. Weather normalized natural gas usage data is integrated into the energy audit process to accurately calculate cost effectiveness of HVAC replacement, attic and sidewall insulation, and air sealing retrofits. Only those air sealing and insulation measures determined to be cost effective at the time of audit are eligible for incentives, while the furnace must be cost effective at the package level to be rebate-eligible. Major program retrofit energy conservation measures are performed by “pre-qualified” insulation, air sealing, and HVAC contractors. Contractors must attend program training and be in good standing with the Better Business Bureau in order to be accepted into the program. A key component of the initial program orientation is the review of the program’s Materials and Installation Standards to ensure best installation practices and solid realworld savings. A rigorous quality assurance plan is a key program component, with 100% of the first 10 jobs inspected and an additional 10% thereafter, depending on the current standing of the contractor in the “Contractor Scoring System”. Implemented in 2011, the Contractor Scoring System provides a systematic approach to evaluate the contractors’ quality of work. Contractor overall scores increased from 8.8 to 9.2 (on a 10 point scale) in 2012, while scores in sidewall insulation increased from 7.41 to 9.42 in that same year. 107 LEADERS OF THE PACK © ACEEE Home Performance Solutions was designed to simplify the process of identifying and implementing cost-effective energy improvements through the provision of high quality, but simplified, home energy audits and generous customer financial incentives. As the program has grown, so have the requirements to include the mandatory use of infrared cameras and sidewall density calculation forms on all sidewall insulation jobs and Manual J heat load calculations for all HVAC jobs. A robust continuing education program now exists for the contractor network, including BPI Building Analyst and Whole House Air Leakage Control Installer training. Program Performance A summary of the program’s expenditures, projected energy savings and audit and retrofit activity for 2010-2012 is provided in the table below. 2010 2011 2012 Program Expenditures (actual, $ millions) $5.09 $11.08 $8.04 Projected Savings (gross Mcf) 76,172 133,955 98,371 No. of Audits/Home Retrofits (each year) 5,011/3,303 6,500/3,982 5,846/2,072 The program boasts an impressive 54% conversion rate. A 2010 evaluation4 of the pilot phase of the Home Performance Solutions program determined a Utility Cost Test (UCT) benefit/cost ratio of 1.07 and a Total Resource Cost Test (TRC) benefit/cost ratio of .93. Benefit/cost ratios for the program measures were 2.07 (UCT) and 1.57 (TRC). The lifetime cost of conserved energy (CCE) was $0.66/ccf (based on a discount rate of 5.94%). Lessons Learned A successful residential retrofit program needs to remain fluid to adapt to market needs. Throughout the program cycle, Columbia and CSG have remained in-tune to the program needs, from back end processes and procedures, to energy auditor, contractor and customer needs. The program has remained flexible, from the institution of the contractor scoring system, to the creation of a customer “kicker”-- an additional customer incentive that was developed in 2010 to incentivize customers to “Act Now” to complete energy efficiency upgrades, resulting in a 20% increase in conversion rates and a shortened conversion cycle. Innovative marketing ideas to respond to the market needs, including the Neighborhood Home Performance program—an approach wherein entire communities can be qualified for the additional benefits based on the average median income of the community, not the individual—also represent the fluid nature of the program. While adapting to the ever-changing market needs, program management has also learned that there are industry best practices that must also be adhered to in order to remain successful in today’s marketplace. These best practices include, but are not limited to: 4 Columbia Gas of Ohio, HPS & SES Impact Evaluation, M. Blasnik & Associates 108 LEADERS OF THE PACK Comprehensive BPI audits to include blower door testing, infrared thermography, combustion safety testing Integration of customer billing data to accurately model projected energy savings BPI certification requirements for energy auditors and installation crew leads Documented Materials & Installation Standards Program operations manual Rigorous hands-on continuing education plan for contractor network; including NATE training and certification, BPI Building Analyst training and certification, BPI Whole House Air Leakage Control Installer training and certification Mandatory use of infrared thermography and sidewall insulation density calculations, blower door guided air sealing, Manual J heat load calculations for HVAC system replacements Program at a Glance Program name Home Performance Solutions Targeted Customer Segment Residential gas heating customers Program Start Date August 2009 Annual Energy Savings Achieved 2012: 98,371 Mcf projected Peak Demand (Summer) Savings Achieved NA Other Measures of Program Results to Date The Home Performance Solutions program produced an incremental projected savings of 211,080 Mcf (258% of goal) in the initial 20092011 program cycle. To date, 63% of 2009-2011 audits have moved forward with at least one major measure (retrofit). Over $9.7 million in rebate dollars was provided to customers over the initial three years. Additionally, 135 jobs were created or sustained because of the program. A rigorous quality assurance plan, combined with the ongoing training of both home energy auditors and contractors and the maintenance of a toll-free customer service line has led to a 94% customer satisfaction rating. Budget for most recent year (and next budget cycle if available) 2012: $8,706,469 2013: $9,026,922 Funding Sources (name and description) DSM rider Website columbiagasohio.com/hps Best Person to Contact for Information about the Program: Name Jack Laverty Position Manager, Demand Side Management Organization Columbia Gas of Ohio 109 LEADERS OF THE PACK © ACEEE Phone number 614-460-4714 Email address [email protected] RESIDENTIAL AUDIT AND WEATHERIZATION — EXEMPLARY ENERGYWISE NATIONAL GRID, ADMINISTRATOR RISE ENGINEERING, IMPLEMENTER Program Overview Rhode Island's EnergyWise program serves single family (1 -4 units per building), market rate multifamily (five or more units per building) and income eligible multifamily customers. The program offers a no-cost in-home energy assessment to evaluate a home's energy efficiency. The assessment puts the customer on the path to reducing costs and saving big on energy-efficient upgrades. The home energy assessment includes a visit from an Energy Specialist who evaluates the home's energy use including air leakage, insulation, window and door units, heating system, hot water system, appliances, lighting and water saving enhancements. Also, a personalized summary of energy-saving recommendations is presented at the end of the assessment with actionable steps that can lower heating and cooling costs. Rebates of 75% of insulation costs up to $2,000 and up to $750 worth of free air sealing for gas and electrically heated homes are available. Finally, 0% financing is available for the installation of qualified energy efficient improvements to the home. Income eligible services for multifamily customers are at no charge to the customer. Specific measures targeted include: Comprehensive energy assessment, including customer education Weatherization, including wall, attic, basement, and pipe and duct insulation, as well as air sealing (caulking, weather stripping, door and window hardware, window parting beads and stops) Combustion safety testing of heating systems Blower door analysis Low-flow showerheads and faucet aerators Metering of refrigerators Installation of compact fluorescent lamps (CFLs) and LEDs (in some applications) Advanced power strips Multifamily building measures include common area lighting fixtures, HVAC motors and controls, and heating systems 110 LEADERS OF THE PACK Rise Engineering is the lead vendor and oversees the day-to-day operations including scheduling, assessing and installing energy efficient instant savings measures such as advanced power strips and lighting and water conservation measures. In addition, Rise coordinates the independent insulation contractors that provide air sealing and weatherization services when customers request follow on work. Finally, the lead vendor also conducts quality assurance inspections of all weatherization work. Rise invoices the Program Administrator, National Grid, and updates the savings for each project. EnergyWise is approved by the Environmental Protection Agency (EPA) and Department of Energy (DOE) for the Home Performance with ENERGYSTAR® national initiative. EnergyWise in Rhode Island supports multiple customer segments. Customers include single family (1 -4 units per building), market rate multifamily (five or more units per building) and income eligible multifamily. With the single family delivery process, customers schedule a home energy assessment either by calling the lead vendor or filling out an on-line form for an assessment. Once the appointment is scheduled, Rise provides a comprehensive whole house/whole building assessment and installs instant savings measures. Customer education is provided by verbal communication during the audit and additional program materials are also provided to the customer at the end of the visit. An Action Plan detailing additional weatherization and air sealing recommendations is provided at the completion of the assessment. If a customer proceeds with additional work, a contractor is scheduled by Rise to perform the follow-on work. Once a contractor is selected and scheduled, a blower door test will be conducted at the beginning of the work day before weatherization begins. Another blower door test is conducted at the completion of weatherization work. When work is completed, Rise conducts the quality assurance and quality control of weatherization services, provides invoicing to National Grid, and inputs savings achieved. A third-party vendor is also used to provide additional quality assurance inspections Multifamily assessments proceed in a similar manner with an initial assessment of the facility. An additional component of the visit is that common room visits are included in recommendations. For units with more than 50% of occupants below sixty-percent of the state median income level, all services are provided at no charge to the customer. EnergyWise was first offered in 1998 by National Grid’s predecessor company, Narragansett Electric. While the Company has provided a home energy audit program for more than 20 years, there have been some significant changes in recent years including: Transition from a single vendor model to Lead Vendor role that oversees a pool of independent insulation contractors Emphasis on air sealing with no cost air sealing up to $750 Emphasis on Building Performance Institute (BPI) training and certification Innovative marketing campaign - GetHouseFit 111 LEADERS OF THE PACK © ACEEE Program Performance The two tables below provide electric and natural gas results for the EnergyWise program. Each table provides expenditures, net annual and lifetime savings, number of participants and cost of conserved energy for 2010 through 2012. The results for 2012 are preliminary. Electric 2010 2011 2012* Electric Expenditures ($ millions) $3.86 $4.29 $6.79 Electric Demand Savings (Summer kW) 1,159 929 262 Net Energy Savings (MWh) 6,614 9,696 7,451 Net Lifetime Savings (MWh) 79,163 99,521 70,888 Electric Participants 9,105 9,979 12,871 Cost of Conserved Energy ($/lifetime kWh) $0.049 $0.043 $0.096 * 2012 results are preliminary for both gas and electric programs Natural Gas 2010 2011 2012* Natural Gas Expenditures ($ millions) $.86 $1.34 $4.02 Net Energy Savings (Therms) 89,848 119,430 399,693 Net Lifetime Savings (Therms) 1,796,819 2,642,567 8,428,975 Natural Gas Participants 1,281 1,496 4,024 Cost of Conserved Energy ($/lifetime Therm) $0.479 $0.506 $0.477 * 2012 results are preliminary for both gas and electric programs Lessons Learned In 2012, the EnergyWise program introduced some innovative program enhancements. First, the GetHouseFit campaign was introduced. The messaging behind the campaign communicates that an energy efficient home is a home that is fit. Similar to human fitness that takes continuous improvement, getting a house fit is not a one- time solution, but one step in a continuous process. The next program enhancement was to move from a single-vendor implementation model to one where qualified independent insulation contractors were used to provide weatherization and air sealing. This change allowed more contractors to participate in statefunded programs, enhanced education and outreach to the contractors, and the change also positions the program for future growth. Program at a Glance Program name EnergyWise Targeted Customer Segment Residential retrofit customers 112 LEADERS OF THE PACK Program Start Date 1998 Annual Energy Savings Achieved 2011 Electric – 9,696 annual MWh (net) 2011 Gas – 119,430 annual therms (net) Peak Demand (Summer) Savings Achieved 2011 Annual Peak Demand Savings (summer kW) 929 Other Measures of Program Results to Date 2011 Electric participants 9,979 2011 Gas participants 1,496 Budget for most recent year (and next budget cycle if available) 2012** Electric $6,887,120, Gas $4,040,844 2013*** Electric 9,873,750, Gas $5,604,700 Funding Sources (name and description) Energy Efficiency Charge on customer bill for both gas and electric programs. Website: https://www1.nationalgridus.com/HomeRI-RI-RES Best Person to Contact for Information about the Program: Name Michael Rossacci Position Senior Program Manager Organization National Grid Phone number 781-907-1621 Email address [email protected] ** 2012 results are preliminary *** 2013 budgets include single-family EnergyWise, multifamily EnergyWise, and multifamily income eligible program budgets. In 2012 all three of these customer segments comprised the EnergyWise program. Going forward in 2013, reporting for the segments are disaggregated. RESIDENTIAL AUDIT AND WEATHERIZATION — EXEMPLARY HOME ENERGY SQUAD CENTERPOINT ENERGY AND XCEL ENERGY, ADMINISTRATORS CENTER FOR ENERGY AND ENVIRONMENT AND THE NEIGHBORHOOD ENERGY CONNECTION, IMPLEMENTERS Program Overview The Home Energy Squad is offered in the Twin Cities metropolitan area as a partnership between CenterPoint Energy and Xcel Energy. The program is available to residential customers who have electric service from Xcel Energy and natural gas service from either CenterPoint Energy or Xcel Energy. This includes both Minneapolis and St Paul, and the majority of the surrounding metro area. 113 LEADERS OF THE PACK © ACEEE The program was originally described as “Residential Quick Fix” and later branded as the “Home Energy Squad” in an attempt to better resonate with the program’s target demographics. Many customers are interested in energy efficiency but don’t know where to start, and often don’t have the time or skill to complete even small scale improvements. This program was designed with three under-served customer segments in mind: savvy household managers (interested in saving money), busy professionals (interested in saving time), and people with the interest but not the skill to make energy efficient home improvements (interested in avoiding hassle). The program delivery team decided “Squad” would evoke a superhero image. The Home Energy Squad: a team of energy experts equipped to help you reach your goals in one convenient visit. The program focuses on measures that together can create substantial energy savings and can be installed quickly. Several end uses are targeted. Compact fluorescent light bulbs increase lighting efficiency. Exterior door and attic hatch weather-stripping improve the tightness of the building envelope and reduce heating and cooling energy. Water heating is addressed through three measures: high-efficiency showerheads and faucet aerators reduce hot water usage; water heater blankets reduce standby losses; and water heater temperature correction improves both water heating efficiency and safety. Finally, programmable thermostats – perhaps the measure most responsible for driving participation – help promote efficient heating and cooling usage patterns. The Home Energy Squad offers direct installation of high efficiency measures in a single athome visit. Two non-profit vendors perform the at-home visits according to natural gas service territory: the Center for Energy and Environment (www.mncee.org) is assigned the CenterPoint Energy territory while the Neighborhood Energy Connection (www.thenec.org) serves the Xcel Energy natural gas footprint. After the customer schedules a visit, a Squad van is assigned to the job. The van is stocked with all available measures and staffed by two trained technicians. During the at-home consultation, the Squad technicians perform a quick inspection of the home looking for all upgrade opportunities. The technicians then review their recommendations with the customer who determines which measures will be installed. The visit ends when all measures are installed and the customer is educated on their proper use. In the early years of the program, 2010 to 2012, Basic and Premium packages were offered. The Basic service included a list of available measures at a fee of $50, while the Premium service included more measures and an $80 fee. The fee covered the approximate cost of materials while the labor costs were covered by the utilities. Beyond the in-home visit and the expertise of the Squad technicians, the initial financial incentive was free installation labor. In 2013, two significant changes were made to the pricing model. First the two-tiered offering was eliminated in favor of a single Home Energy Squad package covering all available measures at a fee of $70. Once a customer signed up and the visit was underway, there was no reason to leave any available upgrades undone. Second, the value statement to 114 LEADERS OF THE PACK the customer was revised. Instead of charging the customer a fee for materials with free labor, the fee is now described as a trip charge. The idea was to bring the stature of the Home Energy Squad program in line with other professional services. Many skilled trades charge a fee just to make a house call, and through the trip charge, the customer is encouraged to think of the Squad as an equivalent high-value service. However, unlike a plumber or electrician, the Home Energy Squad does not charge additional fees once the work begins. Rather, to fully exploit the power of the word “free” all material and labor is included in the cost of the visit at no additional charge. The program was originally developed to take advantage of simple conservation opportunities at home. Many customers are unaware of the low-cost and quick-fix improvement opportunities in their homes, while others are aware but unable to make improvements for any of a variety of reasons ranging from lack of experience to simple inertia. The goal of the program was to help customers overcome the various intangible barriers to “getting the job done” by sending a team of professionals to the home to do the work for them. By leveraging the direct-install program model along with offering a number of different measures in a single visit, the cost-effectiveness of the overall program is improved compared to promoting the measures through separate programs, and correct installation of the measures is ensured. When CenterPoint Energy and Xcel Energy decided to offer the program together, the potential to realize both natural gas and electric energy savings made this delivery model even more promising. The program was launched in 2010 and in the first year saw participation of 2,007 gas customer visits and 4,448 electric customer visits, rising to 3,746 gas customer visits and 4,880 electric customer visits in 2011. The first significant change in the delivery strategy was to go beyond traditional print advertising and initiate more intimate customer contacts including door knocking campaigns and telemarketing. Many of these outreach methods were adapted from the One-Stop Community Energy Services campaign developed by the Center for Energy and Environment. Next, the Squad team began to leverage online limited time 50% discount campaigns to attract customers who may not be particularly tuned in to energy efficiency, but may say yes to a good deal. More recently, the utilities simplified the offering and modified the pricing structure as described above. In terms of the measures offered, the program originally included weather-stripping for windows in addition to exterior doors and attic access hatches. Window weather-stripping was phased out after the team determined that this measure was not a good fit for the Squad delivery model. While window weather-stripping is often needed, particularly in older homes, the number and variety of windows in a typical Minnesota home make it difficult to adequately address in a single 60 to 90 minute visit. In 2012, the program began offering water heater temperature setback to capture energy savings and address an important safety opportunity. In 2013, an optional blower-door test diagnostic component is being introduced in response to customer feedback. 115 LEADERS OF THE PACK © ACEEE Program Performance The tables below summarize the expenditures, energy savings, participation levels and benefit-cost ratios for Home Energy Squad between 2010 and 2012. Expenditures ($ millions) 2010 2011 2012* CenterPoint Energy $.21 $.31 $.36 Xcel Energy (combined gas and electric) $.96 $1.54 $1.70 Total Project $1.17 $1.85 $2.06 2010 2011 2012* Gross First Year Gas Savings (MCF) 20,022 34,726 35,571 Gross First Year Electric Savings (kWh) 2,057,987 2,763,730 3,027,574 Gas Customer Participants 2,007 3,746 4,338 Electric Customer Participants 4,448 4,880 5,241 *Note: 2012 data are preliminary and subject to revision. *Note: Minnesota’s utility efficiency programs report gross first-year savings. Gas savings are combined total of CenterPoint Energy and Xcel Energy gas customer savings. 2012 data are preliminary and subject to revision. Minnesota does not use the total resource cost test for utility conservation programs, but rather requires the societal test. Minnesota also requires utilities to provide the utility cost test, the participant cost test and the ratepayer impact test for utility-run conservation projects. The results of each required test are provided below, along with the lifetime cost of energy conserved (dollar per lifetime MCF/kWh saved) for the program. Gas and electric savings are evaluated separately; figures for gas savings reflect combined savings for CenterPoint Energy and Xcel Energy gas customers. Electric Savings 2010 2011 2012* Utility Cost Test 2.84 3.95 3.84 Societal Test 2.22 3.28 3.09 Participant Test 8.05 11.64 11.52 Ratepayer Impact Test 0.84 1.12 0.96 Lifetime Cost of Conserved Energy ($/kWh) $0.032 $0.030 $0.020 *Note: 2012 data are preliminary and subject to revision. Natural Gas Savings 2010 2011 2012* Utility Cost Test 3.07 3.61 2.62 Societal Test 3.61 3.83 3.25 Participant Test 28.41 32.38 31.99 Ratepayer Impact Test 0.65 0.65 0.63 116 LEADERS OF THE PACK Lifetime Cost of Conserved Energy ($/kWh) $2.54 $2.52 $3.13 *Note: 2012 data are preliminary and subject to revision. Lessons Learned After three years of program delivery, the team has learned that two utilities can effectively work together to deliver energy savings to their shared customers. Perhaps the greatest value to customers comes from the invisible mechanics of the Home Energy Squad’s combined utility delivery platform. Customers benefit directly from the convenience of a single in-home visit, the low price of bulk sourced materials, and the simplicity of a program that unifies gas and electric energy savings with professional direct installation. The challenges of running such a program have been navigated solely by the delivery team. Since launching in 2010, this delivery platform and the team behind it have been remarkably adaptable. From a branding perspective our customers wanted simplicity so the utilities created a program name and logo that emphasized a team of helpful professionals and deemphasized the complexities of the two-utility combined gas and electric delivery platform. From a marketing perspective the utilities learned that customers are changing from year to year, so they have adapted the messaging to stay relevant. At first traditional print marketing was effective at reaching customers interested in energy efficiency. Then the utilities shifted to direct engagement via telemarketing and door knocking to go after customers who were willing to participate but less pro-active. The utilities also created several online discount campaigns to entice customers who were interested in a good deal. From a program design perspective the utilities learned to use the flexibility of the delivery platform to accommodate different energy saving measures and changing customer demand. In 2011 window weather-stripping was phased out to improve the cost effectiveness of the program. In 2012 water heater temperature setback services were added to capture additional energy savings. Finally, in 2013 the utilities are adding an optional blower-door test component to entice customers who value the direct-install piece but also want more advanced diagnostics. As technologies and our customers continue to change, the utilities are confident the Squad’s combined delivery platform will remain an important and valuable innovation. Program at a Glance Program name Home Energy Squad Targeted Customer Segment Residential natural gas and electric customers Program Start Date January 2010 Annual Energy Savings Achieved 2010: 2,057,987 kWh; 20,022 MCF 2011: 2,763,730 kWh; 34,726 MCF 2012: 3,027,574 kWh; 35,571 MCF 117 LEADERS OF THE PACK © ACEEE Peak Demand (Summer) Savings Achieved 2010: 759 kW 2011: 1,578 kW 2012: 1,376 kW Other Measures of Program Results to Date Budget for most recent year (and next budget cycle if available) 2012 Budget: $2,714,520 (Combined CenterPoint Energy and Xcel Energy budget) 2013 Budget: $2,948,812 (Combined) Funding Sources (name and description) CenterPoint Energy and Xcel Energy ratepayerfunded Conservation Improvement Programs (CIP) Website: www.homeenergysquad.net Best Person to Contact for Information about the Program: Name Todd Berreman Position Manager, CIP Implementation Organization CenterPoint Energy Phone number 612-321-4311 Email address [email protected] *Note: 2012 data are preliminary and subject to revision. RESIDENTIAL HEATING, VENTILATING, AND AIR CONDITIONING — EXEMPLARY NICOR GAS ENERGY EFFICIENCY PROGRAM — HOME ENERGY EFFICIENCY REBATE PROGRAM NICOR GAS, PROGRAM ADMINISTRATOR RESOURCE SOLUTIONS GROUP, IMPLEMENTER Program Overview In June 2010, Nicor Gas launched a pilot program to offer residential customers rebates for the purchase and installation of high-efficiency storage water heaters, furnaces and boilers. The residential offerings were part of a broader portfolio serving multiple customer segments. After a successful year of customer participation, on June 1, 2011, Nicor Gas launched the Nicor Gas Home Energy Efficiency Rebate Program. In the first year of the Program’s three-year cycle, rebates for high-efficiency gas storage water heaters, furnaces and boilers were offered in addition to a joint rebate offered by both the Nicor Gas Energy Efficiency Program and Commonwealth Edison for the installation of a high-efficiency furnace and central air conditioner, also known as the “Complete System Replacement” program. At the start of the second full program year on June 1, 2012, Nicor Gas the Energy Efficiency Program expanded the Home Energy Efficiency Rebate offerings to include rebates for high 118 LEADERS OF THE PACK performance windows, hot water pipe insulation, indirect water heaters and programmable thermostats. As with any heating equipment-based program, there is typically a significant drop-off in awareness and participation during the hot months of summer. The Nicor Gas Energy Efficiency Program viewed this ongoing challenge as an opportunity to enhance the program, sustain a connection with its customers, maximize energy efficiency opportunities for customers, and seek to increase energy savings during an otherwise slow time of year. The solution: the Nicor Gas Home Energy Efficiency Rebate Program’s Summer Staycation. The Summer Staycation was a highly effective marketing campaign that ran from July through September 2012. The campaign encouraged residential customers to participate in the Nicor Gas Home Energy Efficiency Rebate Program during off-season months, by upgrading one or more pieces of HVAC or water heating equipment in their home. The campaign included five promotional offerings tied together with a cohesive marketing theme created to resonate with consumers. The creative platform for this campaign needed to emphasize a sense of urgency to motivate customers to participate during the promotional period, while addressing the sluggish economy, the off-season for heating equipment, and the benefits of energy efficiency. The primary focus for consumer messaging was to demonstrate how participation in the Program results in saving money, saving energy and improving home comfort. Graphic design elements included lively, retro-themed images to evoke feelings of being on vacation and to stand out from typical utility communications. The campaign included the following elements, all retaining the vacation theme that addressed the market challenges and program goals. Summer Staycation: Turn your home into an energy-efficient retreat! July 1, 2012, through September 30, 2012, the Nicor Gas Home Energy Efficiency Rebate Program will offer homeowners limited time summer rebates for purchasing and installing qualifying energy efficient equipment. Here’s this summer’s Hot List: Summer Sauna Rebate (Furnace Replacement) Steam Up While Cashing In! Plan ahead this winter. This program introduced a higher efficiency rebate tier for furnaces with an Annual Fuel Utilization Efficiency (AFUE) of > 97% that were included on the ENERGY STAR® Most Efficient List. This new measure offered customers an incentive of $500, and was the first known utility incentives program to offer rebates in the ENERGY STAR Most Efficient Heating and Cooling category. Surf & Ski Rebate (Central Air Conditioner and Furnace Combination) Ride the Wave and Save! This two-for-one bundled package enabled Nicor Gas and ComEd customers to earn bonus rebates for replacing a furnace and central air conditioner together. The Surf & Ski Rebate was an enhanced version of the Program’s existing Complete System Replacement rebate. Surf & Ski offered customers an incentive of $600 - $750 based on equipment efficiency levels. All-Inclusive Vacation Rebate (5 Efficiency Projects at One Time) Warm Up with the Works! This package was available to Nicor Gas and ComEd customers who got “The Works” – replacing all equipment including the furnace, air conditioner, water heater, pipe insulation and programmable thermostat. 119 LEADERS OF THE PACK © ACEEE The All-Inclusive Vacation rebate was a new rebate and offered customers $1,000 $1,500 depending on the installed equipment’s efficiency levels. Frequent Flyer Rebate (Repeat Participants) Welcome Back Bonus! This package thanked returning participants, who had previously been paid a rebate through the program by offering a bonus rebate when they completed a second efficiency project such as installing a furnace, central air conditioner, storage water heater or windows. (To capture customers who have already shown an interest in energy efficiency, the Frequent Flyer rebate offered repeat customers a $100 bonus incentive when they were approved for another energy efficiency measure.) Spa Retreat Rebate (Storage Water Heaters) A Spavelous Upgrade! This package enabled customers who upgraded to a highefficiency natural gas storage water heater to receive an increased rebate. (The Spa Retreat incentive awarded customers who purchased and installed programqualifying water heating equipment with a $300 incentive.) The Summer Staycation campaign theme was promoted through a variety of marketing channels to reach customers through multiple touch points, including: Metra commuter rail advertising Facebook advertising Community newspaper advertorials Radio, print and television media outreach/earned media Direct mail communications Email communications Community and trade association events Flyers Promotion on NicorGasRebates.com The Summer Staycation promotion offered an avenue to experiment with new ideas, including rebates for bundled measures (All-Inclusive Vacation Package) and markettesting of new measure tiers (through the ENERGY STAR® Most Efficient List). The Nicor Gas Energy Efficiency Program could not be certain how the market or customers would react and success was not guaranteed. Program Performance The first two months of the aggressive marketing campaign resulted in therm savings that delivered approximately 250 percent of the energy savings forecasted, during a summer of record high temperatures. The Summer Staycation was proven a success. It spurred natural gas savings during non-heating season months and a sluggish economy, and the light, cheerful messaging of the innovative marketing campaign resonated with customers. The promotion had such a profound impact on the Nicor Gas Home Energy Efficiency Rebate Program, that in November 2012, the program launched its “Best Value” measures, 120 LEADERS OF THE PACK measures that offer customers the largest rebate and the highest potential for energy savings. “Best Value” measures include rebates for equipment on the ENERGY STAR® Most Efficient List as well as “Value Packages” or rebates for the purchase and installation of a qualifying furnace, central air conditioner, storage water heater, hot water pipe insulation and programmable thermostat. The Summer Staycation was valuable not only in its ability to lift participation in the Program during its off-season, but it also provided valuable feedback and experience that will feed into the ongoing evolution of the Program. Some of the more successful elements of the campaign have found their way back into the Program through subsequent initiatives and promotions, and the lessons learned through the Summer Staycation are informing the planning for the program year to come. Please note that the data provided in the table below represents the entire Nicor Gas Home Energy Efficiency Rebate Program for the period stated; the Summer Staycation represents a subset of this budget and savings. Impact evaluation for Program Year 2 is forthcoming. Program Year Program Spending Actual ($million) Savings (Million Gross Therms) Savings (Million Net Therms) Number of Participants PY 1 (6/1/2011 – 5/31/2012) $4.65 1.72 1.21 10,326 PY 2 (6/1/2012) – 12/31/2012) $4.12 1.30 0.90 9,633 Total $8.77 3.02 2.11 19,959 Cost Effectiveness Total Resource Cost (TRC) 1.5 Program Admin. Cost: 4.6 Lessons Learned The concepts and strategies of the campaign can be effectively replicated in other energy efficiency programs. Key lessons learned include: It is crucial that all industry stakeholders (manufacturers, distributors, installing contractors, trade associations, etc.) know about the promotion. Webinars and electronic communications are impactful, low-cost ways to engage trade allies and facilitate open discussions. To increase the impression of a promotion, limit the duration of the offering. Limited time incentives instill a sense of urgency in consumers’ minds and therefore increase participation. Partnering with ENERGY STAR® is an effective way to increase brand recognition as well as move the market to equipment with higher efficiency standards. 121 LEADERS OF THE PACK © ACEEE When offered, customers will take advantage of bundled measure rebates. Program at a Glance Program name Nicor Gas Energy Efficiency Program - Home Energy Efficiency Rebate Program Targeted Customer Segment Residential Customers Program Start Date June 1, 2011 Annual Energy Savings Achieved 1,291,791 Gross Therms Saved (6/1/2012 – 12/31/2012) Peak Demand (Summer) Savings Achieved: N/A Other Measures of Program Results to Date: 250 percent of forecast participation achieved during promotion period Budget for most recent year (and next budget cycle if available): $9,773,329 Funding Sources (name and description): Nicor Gas Nicor Gas Rate 4 Residential Service Ratepayers Website: NicorGasRebates.com Best Person to Contact for Information about the Program: Name Jim Jerozal Position Managing Director – Energy Efficiency Organization Nicor Gas Phone number (630) 388-3390 Email address [email protected] RESIDENTIAL HEATING, VENTILATING, AND AIR CONDITIONING — EXEMPLARY HOME ENERGY SOLUTIONS™ THE UNITED ILLUMINATING COMPANY, CONNECTICUT LIGHT & POWER, CONNECTICUT NATURAL GAS, SOUTHERN CONNECTICUT GAS AND YANKEE GAS5, PROGRAM ADMINISTRATORS IMPLEMENTED THROUGH 30 HOME PERFORMANCE CONTRACTING COMPANIES AND OVER 100 SUBCONTRACTOR COMPANIES The United Illuminating Company, Connecticut Light & Power, Connecticut Natural Gas, Southern Connecticut Gas and Yankee Gas, are referred to throughout this document as “The Companies,” in their capacity as administrators of the Connecticut Energy Efficiency Fund. 5 122 LEADERS OF THE PACK Program Overview Since 1998, CL&P and UI have designed and implemented programs offered to both residential and commercial industrial customers through a 3 mill Systems Benefit Charge on customer bills that has become known as the Connecticut Energy Efficiency Fund. One of these exemplary programs is Home Energy Solutions (HES). HES began as a Connecticut Energy Efficiency Fund electric distribution company duct sealing pilot in 2006. Later in that year, the three natural gas companies in Connecticut (Yankee Gas, Connecticut Natural Gas, and Southern Connecticut Gas) began offering weatherization and hot water saving measures in conjunction with the duct sealing pilot thus providing customers with onestop-shopping for comprehensive energy efficiency services. In 2006, over 2,000 customers were served by four participating HES program vendors. HES was well received by customers and continued to grow. In 2007, program participation more than doubled and over 6,000 customers were served. The innovative program design began to receive attention outside of Connecticut and was recognized by the American Council for an Energy Efficient Economy (ACEEE). In 2008, a formal training and certification process was rolled out requiring Building Performance Institute (BPI) Building Analyst 1 Certification for all participating vendors. The program continued to grow and served 8,895 customers in 2008. By 2009, the program had grown to 19 vendors with over 200 technicians. In 2010 HES was recognized by ACEEE as an Exemplary State Energy Efficiency program and received the Connecticut Quality Improvement Award, Innovation Gold Prize and the Connecticut Green Business Award. In late 2010, a Request for Proposal (RFP) was issued to select vendors for the 2011 HES core services program and forty-eight responses were received. The RFP selection criteria included cost for services, technical certifications and qualifications, state licensure requirements, mandatory equipment, and overall experience. From the RFP respondents, twenty-six companies were selected to deliver the program. Another RFP was issued in late 2012, resulting in a total of 30 vendors selected to deliver Core Service to customers. Currently, it is estimated that over 300 jobs in Connecticut are directly attributed to the HES program while there are numerous sub-contractors in the HVAC, insulation, and home improvement trades that benefit from the HES program by performing energy efficiency add-on upgrades that are recommended during the HES visit. Therefore, HES continues to provide both energy savings to customers as well as economic development through job creation and retention throughout Connecticut. The HES Program consists of seven program tracks; these are the Core Service, Income Eligible Core Service, Additional Energy Savings Measures, Home Performance, HVAC, Multi-family, and Consumer Financing as described below. The program tracks successfully target all residential customers, regardless of dwelling unit size or heating fuel. The largest component of HES is the “Core Service.” The objective of Core Service is to identify comprehensive cost effective energy conservation opportunities in single family homes, provide on the spot improvements and educate and communicate further opportunities to the homeowner. HES does so by providing blower door guided air sealing, 123 LEADERS OF THE PACK © ACEEE duct sealing, installation of CFLs, LEDs, domestic hot water measures, and pipe insulation during the first visit. This Core Service is provided at an affordable $75-$99 co-pay for customers, and no charge to income eligible customers. As part of HES Core Service, the technician provides the customer with a “kitchen table wrap-up” to summarize the work done and highlight estimates of energy savings resulting from the direct installation of measures during the core services. The Companies provide a tool to contractors to present to customers which features estimates of payback and investment information to help customers make decisions on purchasing and implementing additional energy efficiency measures. Rebates are provided for appropriate energy efficiency measures including rebates for HVAC equipment replacement, water heater upgrades, appliance upgrades, and window and insulation upgrades. The “kitchen table wrap-up” provides customers with a road map of opportunities and options including rebates, tax credits, on bill financing and next steps. In 2012, a mobile application was developed to streamline data collection and generate custom reports for the customer to enhance the kitchen table wrap up experience. As the program has grown, the vendor base has been successfully managed using a report card that evaluates contractor performance based on energy savings achieved in each home, field inspection results, customer surveys, and compliance with program rules. In late 2009 the Companies applied to the U.S. EPA Home Performance with ENERGY STAR Program to have HES recognized as a program participant. Based on HES’ current program offering and the promotion of comprehensive services and measures, HES met the criteria and in early 2011, Connecticut was recognized as a U.S. EPA Home Performance with ENERGY STAR state. Non Core-Service contractors are encouraged to submit projects through this program element, which is designed to encourage and enable customers to complete comprehensive projects tailored to meet their individual needs. The HVAC component of HES provides incentives to increase heating and air conditioning equipment efficiency and to improve system installation quality. Currently, rebates are available for qualifying furnaces, boilers, heat pumps including ductless mini-split heat pumps, central air conditioners, water heating equipment, and ground source heat pumps. Through HES, customers can qualify for enhanced incentives for early retirement of older, inefficient equipment before it fails. Proper performance of central air conditioners, heat pumps including ground source heat pumps, and fossil fuel heating systems are addressed through a Quality Installation and Verification (QIV) component of HES. The Multi-Family initiative is a program component that encourages energy efficiency measures in multi-family projects. Customers are offered a “one-stop” approach by having a single Program Administrator (“PA”) serve as the primary contact to help facilitate the process and package the project making participation seamless. The MF initiative serves any type of MF property including assisted living facilities, dorms, group homes, apartment complexes high-rise dwellings and mixed-use developments. The final program component is attractive third-party consumer financing for energy improvement projects recommended and/or offered through HES. HES first began to offer financing through a Residential Financing Pilot Program which was initiated on June 1, 2010 124 LEADERS OF THE PACK and continued through May 31, 2011. The pilot program offered loans at attractive below market interest rates and allowed the Companies to engage the customer and contractor/vendor in a new way by helping reduce a barrier to deeper energy efficiency. Program Performance Currently, Connecticut is ranked number one in the country in Home Performance with ENERGY STAR jobs completed per household. The Residential Financing Pilot successfully funded loans to over 1,250 loans funded and over $14.5 million in energy efficiency home improvements. Based on the success of the financing pilot, the Companies, in conjunction with the Connecticut Energy Efficiency Board, sought alternative financing models to reduce the costs. On June 1, 2011 the Companies began an expanded relationship with the Connecticut Housing Investment Fund (CHIF) to offer a residential financing program. This program offers cost-effective financing for specific energy efficiency measures. This program is one of the first in the nation to offer on bill repayment of energy efficiency measures for residential customers. To qualify for the subsidized interest rates and obtain a loan, a customer must participate in the HES program. All measures or equipment financed must meet energy efficiency criteria including the HES participation criteria. The tables below show reliable savings each year, with overall participation increasing. Annual Program Savings - Net Year Program Spending Electric (MWh) Natural Gas (ccf) Fuel Oil (gallons) Participants 2012 $41,249,430 33,456 1,560,694 1,774,513 53,484 2011 $41,822,922 42,589 1,542,300 1,308,900 46,946 2010 $45,750,231 44,521 1,366,000 1,706,000 45,261 Lifetime Program Savings - Net Year Electric (MWh) Natural Gas (ccf) Fuel Oil (gallons) 2012 381,888 25,128,361 35,040,462 2011 416,375 25,200,000 21,500,000 2010 541,919 23,900,000 20,440,000 Cost Effectiveness Utility B/C ratio 2.1 Total Resource B/C Ratio: 1.8 Lifetime cost of conserved energy (CCE) $0.068 per kwh 125 LEADERS OF THE PACK © ACEEE Lessons Learned Leveraging measures with high benefit-cost ratios (BCRs) to incorporate measures with lower BCRs provided the flexibility to offer a comprehensive program. Key factors contributing to success involve processes -- quality, stakeholder input, and messaging: Importance of having a robust QA/QC process: When working with contractors expectations must be clear and measurable, so insufficient performance can be identified and addressed to prevent service disruptions to customers. We use a monthly report card to evaluate contractors on their energy savings achieved per home, customer survey (satisfaction) results, compliance to program rules and field inspection results. The monthly report card has been extremely successful in managing the contractors as the program quickly expanded. Having a process for stakeholder input: This program touches tens of thousands of customers a year and various trade associations, non-profit organizations and other stakeholders have valuable input and suggestions. We solicit public comment on our annual plan, and feedback from customers themselves through customer surveys. Working with community based groups has also provided value to our program and helped to generate leads. Managing customer expectations: the HES program evolved from an energy audit program, so the messaging has shifted from targeting participation alone to selling home performance. Program at a Glance Program name Home Energy Solutions™ Targeted Customer Segment All residential customers Program Start Date 2006 Annual Energy Savings Achieved 50 million kWh electric, 1.5 million ccf gas, 1.3 million gal oil Annual Peak Demand (Summer) Savings Achieved: 3,334 kW Other Measures of Program Results to Date (such as number of participants, participation rates or market penetration). Participants: 50,000 Customer Survey results – average 99.4% positive Budget for most recent year (and next budget cycle if available) $33,800,000 Funding Sources (name and description) Customer collections (Mill Rate for electric customers, CAM for natural gas customers); ISO-New England Forward Capacity Market (FCM) revenues; Class III Renewable Energy Credits; Regional Greenhouse Gas Initiative (RGGI) Website www.energizect.com Best Person to Contact for Information about Energy Information Line: 1-877-Wise-Use 126 LEADERS OF THE PACK the Program: Name Jane Bugbee Position Home Energy Solutions Program Manager Organization The United Illuminating Company Phone number (203) 499-2822 Email address [email protected] RESIDENTIAL HEATING, VENTILATING, AND AIR CONDITIONING — HONORABLE MENTION HIGH EFFICIENCY AIR CONDITIONING PROGRAM XCEL ENERGY, PROGRAM ADMINISTRATOR AND IMPLEMENTER Program Overview The High Efficiency Air Conditioning (HEAC) Program comprehensively addresses energy efficiency opportunities related to residential central air conditioners and air source heat pumps. The Product is comprised of four measures, each meeting a different need in the residential cooling marketplace. These components include: equipment rebates, quality installation, trade in rebates, and ground source heat pump rebates. This program consists of three major components: o o o Equipment Rebates– Central air conditioners and air-source heat pumps ranging from 14.5 to 16 SEER or greater are eligible for a rebate. Rebates range from $250$500. Trade-In Rebates- Trade-in central air conditioners units must be replaced by a new AC unit of a SEER 14 and maximum efficiency of EER 12 and installed by Xcel Energy registered contractor. Rebate is $500. Quality Installation – This component is the cornerstone of the product since the other two components are built with the quality installation process in mind. This process is based on standards developed by the Air Conditioning Contractors of America (ACCA), which dictate the steps a contractor must take to ensure a quality installation. Contractors who meet the quality installation requirements are eligible to receive a $100 incentive from Public Service. The program provides rebates to Xcel Energy residential electric customers for the upgrade to energy efficient cooling equipment and the adherence to specified equipment installation practices. The program includes three types of cooling equipment: central air conditioners, air source heat pumps and ground source heat pumps. The central AC unit provides the majority of the energy savings for this program. 127 LEADERS OF THE PACK © ACEEE The HEAC program, based on quality installation, is in its fifth year of providing demandand energy savings to Xcel Energy while improving residential customer comfort, satisfaction, appliance efficiency and energy cost savings. The Central AC Quality Installation program is supported by the Xcel Energy’s Demand Side Management program. It provides kW and kWh savings as well as reducing consumption during peak load conditions. It also supports the company’s core objective and commitment to environmental leadership. During a recent program evaluation participants expressed a 94% of satisfaction with the HEAC Program. The target market consists of residential electric customers in Xcel Energy’s Colorado territory. The targeted customers are residential single-family homes, both new and existing. HVAC contractors (Trade Partners) servicing Xcel Energy CO Electric customers are also considered customers of this program. HVAC Contractors are the main channel of the HEAC rebate program. Customers can only qualify for Xcel Energy rebates if they use a pre-approved contractor to install their new central A/C system. Xcel Energy “Registered Contractors” will need to have applied (and be approved) to participate with Xcel Energy, need to have NATE certification, and will have completed on-line training or in person training in order to be eligible to participate in the program. Program Performance The following table shows the program’s achievements over the past four years. There has been an increase in demand and energy savings since the program’s inception in 2009. The main drivers for the continual increases in savings are consistent and engaging marketing to residential customers and strong partnerships with AC contractors in Xcel Energy’s service area. While the program will continue to focus on these areas moving forward, managers expect the yearly percentage increase of demand and energy savings to diminish. Similar to other energy efficiency programs, changes in code and market saturation will make it difficult to maintain current savings levels. 2009 2010 2011 2012* Net Gen kW Goal – Filed 1,623 3,247 2,548 2,871* Net Gen kW Actual 112 875 2,151 2,988* Net Gen kWh Goal – Filed 1,108,888 2,217,776 2,181,463 2,372,400* Net Gen kWh Actual 87,725 673,790 1,734,126 2,428,198* $1,370,000 $2,400,000 $1,940,949 $2,405,385* $418,288 $1,159,863 $1,793,963 $2,492,482* 2,000 4,000 1,785 2,010* 119 855 1,655 2,243* Electric Budget – Filed Electric Spend Actual Participation Filed Participation Actual 128 LEADERS OF THE PACK Modified TRC ($) .46 .80 1.24 1.31* Rate Impact Test ($) .38 .87 1.10 1.02* Utility Test ($) .42 1.10 1.62 1.70* Utility Program Cost per kWh Lifetime ($) .52 .20 .14 .14* *2012 program achievements are estimations only. 2012 HEAC Program Evaluation: http://www.xcelenergy.com/About_Us/Rates_&_Regulations/Regulatory_Filings/CO_D SM Lessons Learned Xcel Energy maintains great relationships with contractors and they believe this is imperative to the program’s success. Xcel does this through a variety of ways including regular outreach from their trade relations manager, sponsored trainings, events recognizing top performers and program related give-a-ways. With the majority of participants not only reporting having first heard about the program from their contractor, but also that their contractor was the key source of other energy-saving information, contractors and retailers are clearly key sources of program information for participants and a critical part of program success. To maintain relationships with AC contractors and ensure the new units are being installed to the standards defined by the Quality Install (QI) component of the program AC contractors must qualify to participate in the program. NATE certification in AC or ASHP (Air Source Heat Pump) and annual rebate and technical training are required of each participating HVAC company in order to be on the registered contractor list. To help contractors meet the requirements Xcel Energy offers the following: High Performance Sales for High Efficiency Solutions: There are companies in the market whose prices are well above average, and they are winning plenty of business. Xcel Energy has brought in a nationally-known speaker who specializes in residential HVAC and whole house improvement sales trainings, will be our presenter for this full day class. NATE Core Exam Prep: Xcel Energy will bring in one of the leading NATE (North American Technical Excellence) instructor in the country. In two days, he will cover electrical fundamentals, heat and matter, trade math and much more. This will help prepare contractors for the core exam, their starting point for NATE certification. NATE Air Conditioning Exam Prep: A two day class, using the same NATE instructor, for technicians with prior field experience designed to give them in-depth training to achieve their NATE AC/ASHP certification. 129 LEADERS OF THE PACK © ACEEE Air Conditioning Rebates Overview: Xcel will share the “easy” button for AC rebates, walking through the rebate process with you from start to finish. Improving and increasing the number of these trainings has been essential to the program’s success. As the program has matured, so have our relationships with contractors. This has reduced the number of errors we see on rebate applications and, more importantly, has given contractors the skill set needed to sell more efficient equipment. In addition to the program’s direct contract with contractors the HEAC is a significant part of Xcel Energy’s residential marketing campaign. The objective of their new point of view (POV) residential campaign is to drive awareness by inspiring customers to understand the value Xcel Energy brings to their daily lives through energy efficiency programs and rebate offerings. The Colorado AC Rebates program advertising runs May through August and aims to help raise awareness of the benefits of high-efficiency air conditioning (i.e., quality installation, energy savings) and related rebate offerings. The program messages will be delivered through various mediums including, print, radio, out of home, interactive, mobile and social media throughout the summer months. Visit responsiblebynature.com to see example of this campaign. Program at a Glance Program name High Efficiency Air Conditioning Program Targeted Customer Segment Residential Program Start Date 2009 Annual Energy Savings Achieved 2,428,198 Gen kWh (2012 achievements) Peak Demand (Summer) Savings Achieved: 3,099 (2012 achievements) Other Measures of Program Results to Date: 2,243 participants (2012 achievements) Budget for most recent year (and next budget cycle if available): $2,415,130 (2012 budget) $2,415,130 (2013 budget) Funding Sources (name and description): Xcel Energy – Demand Side Management Website: www.xcelenergy.com Best Person to Contact for Information about the Program: Name Phil Flaherty Position Associate Product Portfolio Manager Organization Xcel Energy Phone number 303-294-2135 Email address [email protected] 130 LEADERS OF THE PACK RESIDENTIAL LIGHTING — EXEMPLARY PACIFIC GAS AND ELECTRIC COMPANY RESIDENTIAL UPSTREAM LIGHTING PROGRAM PACIFIC GAS AND ELECTRIC COMPANY, ADMINISTRATOR Program Overview Pacific Gas and Electric Company (PG&E) administers the Residential Upstream Lighting Program to encourage energy efficiency throughout its territory of 15 million customers. PG&E has supported the Upstream Lighting Program for more than a decade and it has been one of the most successful energy efficiency programs in the country. Currently, PG&E uses its annual budget of approximately $10 million to support the stocking and purchase of energy efficient lighting products. This support comes in the form of actual monetary incentives, codes and standards development, marketing and education, collaboration with other stakeholders in the energy efficiency industry, and dissemination of relevant information. To distribute incentives, the PG&E lighting team uses two different models under the umbrella of the Upstream Lighting Program. In one model, the team develops partnerships with manufacturers and provides incentives to buy down the cost of manufacturing energy efficient lighting products. The manufacturers are then able to provide these products to retailers at a reduced price. In the other model, PG&E works with other retailers to provide them incentives directly so they can sell energy efficient lighting products at a price that is more competitive with traditional incandescent lighting. To reach a broad range of customer segments across the territory, PG&E has developed relationships with a variety of retailers including large home improvement stores, hardware stores, discount grocery stores, and lighting and electronics specialty shops. PG&E has also been successful in making incentivized products available to “hard-to-reach” customers. PG&E uses the Residential Upstream Lighting Program to encourage adoption of quality energy efficient lighting products, including ENERGY STAR® listed products. Over the past decade, the Program has promoted the adoption of CFLs, including both bare spiral and specialty, for residential use. To continue leading the way in market transformation, PG&E shifted its focus in 2012 to increase support for LED products. In 2013, PG&E anticipates using the majority of its lighting budget to encourage consumers to switch to LED lighting. In addition to working with manufacturers and retailers, PG&E understands the marketplace by conducting daily visits to lighting retail locations and interacting with customers and sales people in these stores. PG&E’s field team visits stores – from big box chains to small mom and pop stores – that sell PG&E-incented products. The field team ensures that store employees are aware of the various lighting products and they have the 131 LEADERS OF THE PACK © ACEEE proper signage and educational components that convey product energy savings to customers. To accompany store displays, PG&E has developed marketing materials that can be displayed next to rebated products to educate customers on using lumens instead of watts when choosing an efficient lighting product. To assist people in their lighting purchases before they enter a store, PG&E’s Lighting Buyer’s Guide (Attachment) is available on PG&E’s website to guide customers in the process of choosing efficient lighting products. PG&E works closely with manufacturers to understand their manufacturing processes, stay informed of the trends they observe in the market, and keep them apprised of new regulations and standards in our market. These close relationships ensure PG&E understands the market and works together with partners to identify new opportunities to further encourage market transformation. PG&E leads market transformation efforts by collaborating with other utilities and regulatory agencies. In California, PG&E collaborates closely with the other investor owned utilities and municipal utilities to provide a strong and consistent program throughout the state. PG&E also works with the Western Region Utility Network to expand the reach of its programs and provide consistency in program implementation throughout the Western United States (representing almost 20% of the United States population). PG&E has successfully supported CFLs for many years. Although LEDs are currently not as cost-effective as CFLs, PG&E is now supporting them early in their product lifecycle to encourage market transformation of this effective product. PG&E believes this is the best way to drive customers toward the most energy efficient and high quality products. In addition to providing price signals in the market, PG&E helps to drive customers toward more efficient products by supporting codes and standards development. In California, PG&E serves on the Board of the California Lighting Technology Center, which works with manufacturers, regulators, and efficiency programs to test the latest energy efficiency products and recommend quality parameters. PG&E is actively engaged in the development of the latest California Title 20 standards to continue to drive quality lighting products, and contributes to work on Title 24, which enhances existing building codes. PG&E also helped to develop the California LED Quality Specification in conjunction with the California Energy Commission, the California Public Utilities Commission, and the other California IOUs. This Specification encourages manufacturers to produce high quality LED products, and is one of the many ways PG&E is pushing the quality of efficient lighting higher. For many years, PG&E has collaborated closely with ENERGY STAR®, providing: Consumer education and increased awareness of the ENERGY STAR® brand, Input and guidance on Specification development, Resources and support when communicating to the manufacturing community, and 132 LEADERS OF THE PACK Feedback on the Qualified Products List and implementation of the list in retail environments. Program Performance Program performance measures indicate the program is cost-effective and delivers savings proportionate to incentive spending. This is significant for one of most mature markets for energy efficient lighting products (California), on such a large scale, at the start of the transition from CFLs to LEDs. PG&E’s Residential Upstream Lighting Program is one of the largest energy efficiency programs in the country. In the 2010-2012 Program Cycle, PG&E worked with more than twenty manufacturers and more than 1,300 retail locations. Several manufacturers have reported that they are able to offer their efficient lighting products because of the PG&E rebate; they would not be cost-effective products without PG&E’s incentive. Program incentive spending actual Net program savings 2010 $19.3 million 59.5 MW, 412 GWh 2011 $ 9.5 million 34.4 MW, 237 GWh 2012 $10.8 million 36.5 MW, 245 GWh Cost effectiveness $44/MWh TRC is greater than 2.0 Lessons Learned Running the program for more than 12 years has demonstrated three fundamental recommendations for program management and design: Program funding makes the greatest impact when the incentives are applied upstream to the manufacturer to reduce the wholesale price of the product. In the most recent Program Cycle, this model allowed PG&E to bring CFLs to the “dollar store” channel and ethnic/ discount grocery channel which would not have stocked efficient lighting without program support. This strategy was helpful in making products available to “hard-to-reach” customers. In collaboration with retailers, create a set of standard point of purchase promotional and educational materials across retailers to increase utility attribution, so that the credit energy savings achieved by consumers will be given to the program: without this, net savings and cost effectiveness indicators are not as strong. This will also build brand consistency and help retail customers identify products with the utility rebate. Work with regulators on program logic before the program begins, keep them abreast of program updates, and be actively involved in the program evaluation process. 133 LEADERS OF THE PACK © ACEEE Program at a Glance Program Name Residential Upstream Lighting Program Targeted Customer Segment Residential Program Start Date January 1999 Annual Energy Savings Achieved: 245 GWh in 2012 Peak Demand (Summer) Savings Achieved: 36.5 MW in 2012 Other Measures of Program Results to Date: Incentivized purchase of 5.4 million CFL & LED lamps/fixtures, and avoided 61,500 MTCO2 emissions 6 in 2012 Budget for most recent year (and next budget cycle if available): $10.8 million for 2012 Funding Sources (name and description): California Public Goods Charge (Ratepayers’ Funds) Website: http://www.pge.com/lighting/ http://www.pge.com/myhome/saveenergymoney/moneysave r/ Best Person to Contact for Information about the Program: Name Winsey Kan/Amy Kochanowsky/Joey Barr Position Organization Phone number Email address Sr. Program Manager/Program Manager/Sr. Product Manager Pacific Gas and Electric Company 415-973-8981/415-973-9804/415-973-6009 [email protected]/[email protected]/[email protected] RESIDENTIAL LIGHTING — EXEMPLARY EFFICIENCY VERMONT’S RETAIL EFFICIENT PRODUCTS RESIDENTIAL LIGHTING PROGRAM EFFICIENCY VERMONT, PROGRAM ADMINISTRATOR VERMONT ENERGY INVESTMENT CORPORATION (VEIC), IMPLEMENTER Using an emissions factor of 0.254 MTCO2/MWh. Available here: http://www.pge.com/includes/docs/pdfs/shared/environment/calculator/pge_ghg_emission_factor_info_sh eet.pdf. 6 134 LEADERS OF THE PACK Program Overview Efficiency Vermont, a statewide energy efficiency utility now in its fourteenth year of operation, has a long history of taking residential lighting to the next level. It has pushed market transformation of residential lighting through a deliberate process of putting the customer first, identifying their needs, guiding their choices, overcoming market barriers to participation, and making efficient technologies affordable to market rate and low-income customers alike. The maturity of the program can be seen in the success in the past three years alone. Over these last three years, the program has generated 653,256 MWh in total lifetime savings—a significant amount for a state as small as Vermont. This achievement is also noteworthy for a state that has such a long-running efficiency program, with a permanent, dedicated focus on residential lighting. Constant engagement with customers in new and effective ways has been shown to be key to increasing savings and providing significant amounts of resource benefits. Today, the program has upstream promotions, midstream buydowns, and downstream coupons as well as distributes bulbs at through the Foodbank, employs promotional models for big retailers and independent retailers alike, and has a new education campaign that helps customers understand the benefits and value of efficient lighting, From coupons to buydowns: The first ten years. Efficiency Vermont was created in 1999 to consolidate into a single program the energy efficiency work of 22 electric utilities. When the new program rolled out in 2000, it inherited a marketplace in which customers were accustomed to coupons for efficient lighting. When Efficiency Vermont took over these programs, it continued the instant coupon promotion, but added community-based CFL campaigns and other initiatives. This predominantly downstream approach shifted in 2005, when Efficiency Vermont began its first retail midstream (buydown and markdown) promotions. Partnerships with retailers meant that utility customers could purchase CFLs off the shelf, at reduced cost, with no rebate coupons or other inconveniences at the point of purchase. In 2008, CFL sales grew significantly with the successful launch of their first multimedia lighting campaign. This campaign focused on the savings and longevity that CFLs bring (as well as responsible recycling practices), presented within the context of an engaging “Wild West” cartoon theme. Through the campaign’s television commercials, newspaper advertisements, and website content, CFL sales rose to 843,000 in 2008, a 45% increase from the previous year. Getting creative in the economic downturn: The next five years. In 2009, lighting participation followed the general economic decline and took a significant downturn. Lighting program managers tried a new model that looked at affordability differently. It developed a new partnership with the Vermont Foodbank. The program administrator arranged with a manufacturer to send bulbs directly to the two main Foodbank distribution warehouses, cutting out the middle man and using the existing infrastructure to send out CFLs with food and other necessities to the 280 partner agencies (food shelves and pantries, 135 LEADERS OF THE PACK © ACEEE meal sites, group homes, etc.). Each food shelf and pantry in the network is set up like a small retail store, with the clientele using shopping baskets and carts to select their items. Many of these food shelves have limits on the quantity of any individual item that can be taken, and they all advise the clientele to take only what they need and can use. The CFL bulbs in this promotion were effectively just another item on the shelf. This model keeps the cost of the CFLs as low as possible, therefore maximizing the benefits of the program and helping those with the greatest energy burden save energy and money. The program has expanded since 2009 and in the course of the last three years, 355,000 specialty and standard CFLs have been distributed to 280 Foodbank partner agencies. Reaching the hard-to-reach. The program administrator has also involved independent and small retailers throughout the state to better serve small or remote communities and provide economic benefits to small businesses. The lighting program developed an independent turnkey promotion in 2010, that put a competitively manufacturer in touch with a retailer to provide competitive pricing, high-quality products, and additional customer service. The promotion succeeded, and now serves 35 small general stores, independent groceries, and local hardware stores that would not typically be able to work with the program on their own. Putting the needs of the customer first. The efficiency program’s prescriptive, fixed incentives statewide meant that purchase prices still varied, causing customers to shop around for the best deal in CFLs. Inconsistent retail pricing caused sufficient confusion at the point of purchase to make it easy for customers to walk away without CFLs. The efficiency program shifted its message to the benefits of CFLs in all their varieties—and helped retailers drop the price to a consistent $0.99 a bulb, even for specialty CFLs. With instant identification of a low price and high benefits and taking price out of the decision criteria, customers picked up the bulbs quickly and became more willing to try a different technology from the traditional incandescent bulbs. The campaign saw universal reaction across the state to the $0.99 price point and pointed Vermonters to Efficiency Vermont’s recommendation for premium bulbs. The program saw a 36% increase in participation in 2010 and a participation increase of approximately 70% in 2011, compared to 2009. CFL sales jumped from 555,000 units in 2009 to 993,000 in 2011, with the share of specialty CFLs as a percent of overall CFL sales doubling in 2011. Vigilance on performance and knowing when to scale back. Between the Foodbank program and the low-cost specialty CFL promotion, more than one million bulbs were sold in 2011, breaking all previous program records. The successful $0.99 specialty CFL campaign was continued for the first half of 2012, but when energy savings began to decline, the incentives were adjusted and the cost of specialty CFLs rose to $3.99; standard CFLs were kept $0.99. Early results show continued high rates of participation. It is important to note that socket saturation increased significantly as a result of these two programs, rising from 23% to 33%. Getting ahead of the curve. Efficiency Vermont engaged early with LED technology, understanding the importance of program support for ENERGY STAR-qualified units. Using coupons in 2009 and subsequent markdowns at retail locations, the program has 136 LEADERS OF THE PACK brought LED downlights and screw-based bulbs firmly into the Vermont marketplace. There is also a program also offers discounts on LED replacement screw-based bulbs through the upstream SMARTLIGHT initiative with participating electrical distributors. To date, customers have purchased 32,000 LED bulbs through the SMARTLIGHT program and 15,300 LED bulbs through the retail program. “Love Your Light,” a 2012 initiative, gets customers to think about lumens instead of watts when they purchase bulbs, and to understand new lighting labels. This initiative responds to a customer survey, which overwhelmingly indicated that customers simply wanted to know how to buy light bulbs. Love Your Light looks at all technologies according to three features: brightness, color, and cost—in a multimedia campaign ranging from in-store pointof-purchase materials to digital media, to an educational video, to an interactive education wheel, to social media, and to in-store customer engagement through QR codes. Essentially, Efficiency Vermont: Works with retailers from small independent stores to national retail chains Delivers programs through downstream, midstream, and upstream program models to ensure accessibility to all customers. Provides incentives for many types of technologies and supports new technologies. Supports new products with incentives and through national partnerships, as well as by directly engaging the U.S. Environmental Protection Agency on specifications or manufacturers to guide design or market needs. Influences national policy through well-developed relationships and early product support. Influencing a diverse stakeholder network outside the state ensures more effectively served market segments and the absence of tough market barriers, thus maximizing benefits to Vermont customers. Constantly strives to keep programs fresh and effective for ratepayers and to transform the market to make affordable, energy-efficient products available. Program Performance The Retail Efficient Products Lighting program has generated 653,256 MWh in total lifetime savings in the past three years, yielding a 33% socket penetration rate. As the lighting program has matured, it has consistently evolved to overcome barriers in the market. The $0.99 pricing campaign successfully overcame a barrier to participation. The Vermont Foodbank promotion eliminated cost barriers and used established networks to reach a class of ratepayers that was historically under-represented in terms of participation in utility efficiency programs. Efficient Products Lighting Program Cost Effectiveness Utility Cost Test 2009 2010 Lifetime Avoided Electric Costs, Energy and Capacity $16,443,270 $18,742,699 Total Program Costs $991,784 $1,991,840 Net Benefit: $15,451,486 $16,750,860 Benefit -Cost Ratio: 16.58 9.41 Total Resource Cost 2009 2010 137 2011 $18,094,737 $3,100,158 $14,994,579 5.84 2011 LEADERS OF THE PACK © ACEEE Lifetime Avoided Electric Costs, Energy and Capacity Lifetime Fossil Fuel Savings Lifetime Water Savings Lifetime O&M Savings Total Program Costs Participant Costs Third Party Costs Net Benefit: Benefit -Cost Ratio: Lifetime Cost/kWh: Total Program Costs Total Lifetime kWh Savings Cost per Lifetime kwh Savings Lifetime Cost/kWh: Total Program Costs Total Lifetime kWh Savings Cost per Lifetime kwh Savings Program Performance Total Program Costs Total Gross kWh Savings Total Net kWh Savings Total Gross MMBtu Savings Total Net MMBtu Savings Non-Foodbank Participation Foodbank Participation Total Participation Total Bulb Numbers Inflation Rate 2009 to 2010 2009 to 2011 $16,443,270 ($16,248) $0 $5,582,952 $991,784 $2,429,660 $289,861 $18,298,670 5.93 2009 $991,784 178,835,374 $0.006 2009 $991,784 178,835,374 $0.006 2009 $991,784 18,029,506 22,781,169 -264 -301 17,053 6,509 23,562 504,971 $18,742,699 ($15,516) $0 $11,003,804 $1,991,840 $1,516,258 $348,407 $25,874,481 7.71 2010 $1,991,840 241,927,600 $0.008 2010 $1,991,840 241,927,600 $0.008 2010 $1,991,840 26,740,234 31,182,488 -354 -421 17,669 16,538 34,207 696,123 1.020 $18,094,737 $0 $0 $13,437,719 $3,100,158 $248,023 $738,136 $27,446,138 7.72 2011 $3,100,158 232,493,431 $0.013 2011 $3,100,158 232,493,431 $0.013 2011 $3,100,158 26,789,356 30,680,664 0 0 13,235 25,449 38,684 679,092 1.051 Notes: Total Program Costs are operating costs, incentive costs and technical assistance costs. Inflation Rates are used to inflate Benefits (avoided cost of electricity, fossil fuel savings, water savings, O&M savings) all reported in 2009 $ in the Efficiency Vermont Annual Report. The Vermont Department of Public Service annually verifies Efficiency Vermont’s portfolio of residential, multifamily, and commercial programs. Beyond that process, there has not been an impact evaluation specifically on the residential lighting programs. Lessons Learned Program success exemplified by the Retail Efficient Products Residential Lighting Program has been tied to: Straightforward messaging The $0.99 CFL campaign identified market confusion and provided guidance to the end consumer. Customers responded well when they could see the information specific to the promotion could guide them to the best efficient lighting options for 138 LEADERS OF THE PACK their homes. The easily understandable and low price not only took cost out of the equation, but allowed for a very consistent message across the state. Finding new market niches and new partnerships The Vermont Foodbank program that began in 2009 was unique. It looked at the needs of an underserved population and used an existing infrastructure to serve this segment cost-effectively. This successful approach exemplifies the benefit of considering new ways to work with new partners, to reach new customers. Listening to customers By asking what was holding people back from buying energy-efficient lighting, Efficiency Vermont learned that the answer was well within the scope of the existing program. The new lighting marketing campaign helps customers choose the correct bulb and therefore, participate in the program. Continuing to rethink promotions and programs Engage new partners, thinking about different delivery methods, supporting and understanding new technologies, and seeking out engagement with colleagues and national entities all contribute to getting increasing numbers of customers to participate. Program at a Glance Program Name Efficiency Vermont’s Retail Efficient Products Residential Lighting Program Targeted Customer Segment All of Vermont’s residential customers through retail markets (applies to some business customers as well) Program Start Date 2000 Annual Energy Savings Achieved Total net kWh savings in 2011 - 30,680,664 Annual Peak Demand (Summer) Savings Achieved: Summer coincident peak kW savings in 2011 – 5,247 Other Measures of Program Results to Date (such as number of participants, participation rates or market penetration). Number of residential bulbs tied to incentives: 2009: 504,971 2010: 696,123 2011: 679,092 Budget for most recent year (and next budget cycle if available) Total program costs in 2011: $3,100,158 Funding Sources (name and description) Systems benefit charge (known in Vermont as the “energy efficiency charge”) Website http://www.efficiencyvermont.com/for_my_home/ways-to-saveand-rebates/Lighting/general_info/lighting_overview.aspx Best Person to Contact for Information about the Program: Name Lara Bonn Position Retail Efficient Products Program Manager 139 LEADERS OF THE PACK © ACEEE Efficiency Vermont’s Retail Efficient Products Residential Lighting Program Program Name Organization Efficiency Vermont Phone number 802.540.7853 Email address [email protected] RESIDENTIAL LIGHTING — HONORABLE MENTION RESIDENTIAL RETAIL LIGHTING PUGET SOUND ENERGY (PSE): ADMINISTRATOR AND IMPLEMENTER Program Overview Puget Sound Energy’s residential lighting program began in 2002 with CFL bulbs and fixtures, but it was not until 2009 that the program got the attention of the utility’s entire customer service territory by using cutting edge campaigns and being the first to launch new LED rebate measures. In 2009, Rock the Bulb changed everything. This was a big campaign with a big vision, that customers could get excited about a CFL light bulb in the same way that they could get excited about a rock concert. The program delivered. An ambitious multi-city outreach campaign was launched that included a bulb-exchange (incandescent to CFL), a CFL pledge and numerous energy efficiency education opportunities. The first campaign was in 16 cities, over 16 weekends, resulted in 511,540 CFL bulbs given to PSE customers, and yielded 118,379,650 kWh in savings. Rock the Bulb had 24,480 PSE customers attend and touched an additional 286,620 customers with engagement bulbs. Due to this initial success, Rock-the-Bulb added two additional tours. The first was Rockthe-Bulb: The RE-Energize Tour 2011, which focused on ethnic and lower income markets. Rock-the-Bulb: The RE-Energize Tour 2012 focused on rural markets and introduced the LED bulb for customer exchange and engagement. Both of these tours have delivered success similar to the first in terms of bulbs given to PSE customers and customer attendance. It has amounted to a tremendous amount of media exposure putting energyefficient lighting in the spotlight. The success of Rock the Bulb even landed into a Social Marketing college text book, Influencing Behavior for Good. Starting in 2011, instant LED rebate measures were born within PSE’s residential lighting program. The retail lighting program followed the lead of the commercial programs in the northwest by allowing rebates for LEDs approved using a calculator created by PSE and modeled after the ENERGY STAR calculator. This would allow quality LEDs to receive incentives while waiting for final ENERGY STAR certification. With that, PSE again hit the 140 LEADERS OF THE PACK ground running to make LEDs exciting to customers by partnering with key retailers and manufacturers to offer limited time offers. Examples of the wording of marketing offerings included: “If you’re looking for a great deal on LED bulbs, Greenlite is the best option. Twopacks of Greenlite LED bulbs retail for under $6 after PSE instant discounts. PSE and Greenlite teamed up to successfully implement one of the first three-party mark down agreements with Lowe’s and this promotion is now being carried out for limited time offers across the country.” “Want to bundle additional energy-saving gadgets with your LED purchase? PSE and Home Depot are offering customers three Phillips Endura LED bulbs and a Lutron Maestro Occupancy Sensor for $39.99. This program has expanded beyond the 18 Home Depot stores in the PSE service area and is now available in an additional 128 stores because of our success.” At the end of 2011, PSE launched an end-of-year Holiday Outreach campaign. This campaign was designed to achieve deeper energy savings that provide positive customer experiences. It also included outreach to ethnic PSE customers. This involved more than 90 events throughout the utility service territory. It achieved, through a creative customer pledge, the distribution of 80,000 CFL bulbs, and 40,000 low-flow showerheads. This resulted in 3,800,000 kWh and 149,500 therm savings and touched roughly 40,000 PSE customers. For Rock-the-Bulb, Holiday Outreach, and Re-Energize Your Community, PSE gave away free light bulbs in exchange for either the customer’s existing incandescent bulbs or for their pledge to use it. At retail stores throughout the service territory, the standard retail incentives are as follows: Lamp Type Maximum Everyday Incentive Maximum Promotional Incentive Standard CFL $1.25 $2.25 Specialty CFL $2.50 $4.00 Omni-Directional A-Lamp LED $7.00 $15.00 Non-Standard A-Lamp LED $2.00 $4.00 Reflector LED $5.00 $10.00 Other LED $5.00 $10.00 Program Performance This campaign became the starting point to what would become known as Re-Energize Your Community 2012. Re-Energize Your Community inspires PSE customers to pledge to 141 LEADERS OF THE PACK © ACEEE take energy-saving action in exchange for resource-efficient CFLs and/or showerheads. This continues to be highly successful as an entry for customers into energy-efficiency. Dramatic growth is seen in key performance results for the last three years, although savings per unit declined in 2012, as shown in the table below: Program spending actual Program savings (net kWh) Participation (lighting units) 2010 $5,356,177 56,499,789 2,287,840 2011 $8,964,631 86,062,465 3,760,774 2012 $12,605,565 86,738,007 4,714,776 The program is highly cost effective, with a Utility Cost Test (UCT) of 4.22 and a Total Resource Cost (TRC) of 2.39. Specific for LEDs within 2012, PSE is measuring the success of their residential LED program against market share for residential CFLs. Since the launch of the program, there have been increases each quarter in residential program market share beyond the previous quarter: Q1 to Q2: 280% market share increase over Q1 Q2 to Q3: 60% market share increase over Q2 Q3 to Q4: 30% market share increase over Q3 The unit results break out as follows: 214,131 4,555,145 4.7% Individual residential LED unit sales over the past 12 months Total residential CFL and LED bulb sales over past 12 months Residential LED program market share LEDs make up a much higher portion of kWh savings in 2012: 7,165,661 81,714,466 8.8% Residential LED kWh savings over the past 12 months Total residential CFL and LED kWh savings over the past 12 months Residential LED kWh share Lessons Learned Since the introduction of PSE’s LED measure, and within 2012, the LED market has changed dramatically. Product offerings have expanded exponentially both with more manufacturers entering the market and the styles of LED product offerings. All of this has created greater supply and so the prices have come down – a great thing for PSE customers. 142 LEADERS OF THE PACK The adjusting marketplace meant program managers had to be flexible with the LED incentive levels. This has actually worked well for PSE’s planned limited-time offerings and LED campaigns. They leveraged relationships with retail and manufacturer partners to further produce desirable and lasting improvements. These partnerships have allowed them to leverage resources and stretch their utility budget to achieve mutual goals while achieving the most cost effective program. Through these efforts PSE learned that more incentives do not necessarily translate to more sales. With the drop in product prices, the sweet spot has been in the everyday range of $5 to $7 per bulb. The limited-time offerings increased the rebate up to $10 for a short 30-60 day burst of deeper discounts/rebates. This creates a sense of urgency for customers to act and PSE has seen a 200% to 300% increase in sales during these short bursts. If the program just used a high rebate all the time, it would not create a sense of urgency and would not be a good value for customers. A high rebate all the time could be artificially inflating the market instead of letting the supply and demand conditions truly influence product pricing. Lighting has long been a gateway into energy efficiency. LEDs are no different, but it does two things; brings in a fresh group of PSE customers who were turned off by CFLs, and refreshes the base of energy-efficiency customers. Now that they have their attention, PSE re-engages them about all of the other PSE programs designed to help them save further energy. It further lays the groundwork to inspire customers to adopt a lifestyle using the top energy saving products and they look to PSE to help them do it. PSE does more than get customers to buy, they get them engaged and excited. Program at a Glance Program Name Residential Retail Lighting Targeted Customer Segment Residential Electric Customers Program Start Date 2002 Annual Energy Savings Achieved 2012: 86,738,007 kWh Budget for most recent year (and next budget cycle if available): 2012: $12,605,565.00 Funding Sources (name and description): Customer Rates Website: www.pse.com Best Person to Contact for Information about the Program: Name Kim Saganski Position EES Program Manager Organization PSE Phone number 425-462-3313 Email address [email protected] 143 LEADERS OF THE PACK © ACEEE RESIDENTIAL NEW CONSTRUCTION — EXEMPLARY EFFICIENCY VERMONT AND VERMONT GAS SYSTEMS- RESIDENTIAL NEW CONSTRUCTION SERVICE EFFICIENCY VERMONT AND VERMONT GAS SYSTEMS, PROGRAM ADMINISTRATORS EFFICIENCY VERMONT, IMPLEMENTER Program Overview Efficiency Vermont and Vermont Gas System’s Residential New Construction (RNC) service provides comprehensive energy efficiency services to customers building or gut-rehabbing new single and multifamily homes in Vermont. Vermont Gas Systems provides additional support for homes in its service territory. This co-sponsored new construction service has been provided since 2001. Vermont Gas has had an RNC service in place since 1993. Efficiency Vermont’s RNC goals are based on KWh savings, however our cost effectiveness is assessed through the Total Resource Cost methodology so fossil fuel, water and O&M savings are also accounted for. Vermont Gas Systems focuses on Mcf savings that are incented accordingly. The RNC service promotes cost-effective energy efficiency measures that result in homes that are affordable to operate, comfortable to live in, and durable over time. Efficiency Vermont and Vermont Gas staff work closely with enrollees to consider options for deeper savings during the planning stages of new projects. Collaboration with marketplace partners to support education and outreach efforts are critical as the service seeks to meet its goals of reaching 40% market share for single family homes by 2014 and the state goal of net-zero new construction by 2030. The RNC service has adapted over the years to account for new technologies, changes to the ENERGY STAR guidelines, and changes to the building energy codes in Vermont. The core RNC service remains Vermont ENERGY STAR Homes which builds on the national ENERGY STAR Homes criteria by requiring higher levels of insulation and air sealing in addition to ENERGY STAR lights, appliances, and HVAC equipment. The EPA recognized Efficiency Vermont and Vermont Gas Systems with the 2011 and 2012 Partner of the Year award in the Energy Efficient Program Delivery category. In 2011, Efficiency Vermont’s RNC services expanded to include an Energy Code Plus tier designed to engage builders wishing to exceed Vermont’s new energy code but who were not interested in pursuing the expanded ENERGY STAR V.3 criteria. This has proven an effective means of maintaining market share in a time when both energy codes and ENERGY STAR specifications are changing. As a sign of market transformation, the average Home Energy Rating System (HERS) Index on single family homes improved by seven points from 2008 – 2012, from 60 to 53, an improvement of 12%. Throughout 2011 and 2012 Efficiency Vermont worked on several low load home projects that are achieving 70% energy reductions over Vermont’s baseline home. The most noteworthy of these projects is the nation’s first Habitat for Humanity House to receive 144 LEADERS OF THE PACK Passive House certification. In 2013, Efficiency Vermont is using the information learned from building these high performance homes and subsequent performance monitoring to launch a High Performance Home tier. This tier is designed to drive market transformation in a substantive way by providing a framework for building low-load homes in a manner that is not significantly more expensive than standard new construction, but results in a substantial (+/-70%) reduction in overall energy use. Efficiency Vermont and Vermont Gas provide personalized technical assistance from the planning stages of a project through construction. An energy rating is performed on every home to assess overall efficiency and show compliance with the performance requirements of Vermont’s energy code. At the beginning of each project staff determine what the enrollee’s goals are and use that information to inform how they can best work with each customer. All services, including the energy rating, are provided at no cost to the program enrollee and Vermont Gas Systems helps cover a portion of the service delivery costs for projects in their service territory. Homes that successfully complete the Residential New Construction Program (single family) receive incentives including: 1) financial incentives up to $1700 (Vermont Gas pays up to $650 in their service territory. VGS will now be paying a portion of the incentive at all service tiers); 2) a Home Energy Rating Certificate; 3) a Residential Building Energy Standards (energy code) certificate; 4) an ENERGY STAR label (if applicable) and 5) verification of $2,000 EPACT tax credit eligibility. The multifamily program offers an incentive of $750/unit for ENERGY STAR projects rather than the HERS index incentive. Additional incentives are available from Vermont Gas Systems for thermal saving measures, and Washington Electric Cooperative for electric customers in their territory. Marketing for the Residential New Construction program encompasses various media sources and partnerships. Many enrollments come from repeat builders in the program and word of mouth from past program participants. Vermont Gas and electric utilities provide leads on new homes being built which allows follow-up directly with new homeowners to encourage participation. Both Efficiency Vermont and VGS reach out to builders and new homeowners with brochures and through social media, home shows, and publications targeted at individuals who may be building a new home. Vermont Gas markets the service directly to builders at the time of their application for natural gas service. Program information is available at www.vermontgas.com/efficiency_programs/res_programs.html, including a link to the Efficiency Vermont website www.efficiencyvermont.com/vesh for users seeking more information. VGS utilizes an internal software query as a lead generator for the service by capturing new construction sign ups and referring them to Efficiency Vermont’s ENERGY STAR program administrator for the appropriate program follow up. Efficiency Vermont and Vermont Gas Systems have demonstrated a long-term commitment to the new home construction industry in Vermont. The organizations are committed to working with builders and homeowners to find the most efficient solutions for all, and are continually implementing new support structures and looking to the future to best meet the 145 LEADERS OF THE PACK © ACEEE energy efficiency needs of residential buildings. By leveraging their relationship with ENERGY STAR and their role as trusted third party voices, Efficiency Vermont and Vermont Gas Systems work in partnership with contractors and homeowners to meet their efficiency goals while driving market transformation towards net zero construction practices. Program Performance Efficiency Vermont performance data represents an overview of Single Family and Multifamily Residential New Construction work throughout the state of Vermont, with the exception of territory serviced through Burlington Electric Department. Efforts to maximize the efficiency of each home resulted in stable net kWh savings despite the slow housing market and overall decrease in total number of program participants. The Total Resource Benefit-Cost Ratio remained between 3.36 and 3.94 through the 2009-2011 period, signifying that the Residential New Construction program is resulting in significant societal benefit relative to program cost. Efficiency Vermont anticipates that the addition of new tier offerings (Energy Code Plus and High Performance Homes) will provide more opportunities for program participation and ultimately lead to increased market share and energy savings. Additional customer outreach through market partners will also help drive program participation. Efficiency Vermont 2009 2010 2011 Total Gross kWh Savings 1,588,000 1,314,000 1,300,000 Total Net kWh Savings 1,666,000 1,390,000 1,427,000 Total Gross MMBtu Savings 19,632 20,370 17,861 Total Net MMBtu Savings 20,528 21,348 18,604 $2.35 $2.28 $2.04 964 927 789 Program Spending Actual, millions Number of participants Vermont Gas Systems performance data includes Single Family and Multifamily projects and is specific to homes served within Vermont Gas Systems territory in Northwestern Vermont. Vermont Gas Systems 2009 2010 2011 Total Gross Mcf Savings 6,328 5,630 7,109 Total Net Mcf Savings 6,144 5,466 6,902 $180,902 $215,058 $222,936 Program Spending Actual, VGS Thermal Number of participants 96 98 85 Specific impact evaluations are not available, however savings are verified on an annual basis and thus program impact is determined. The State of Vermont conducts residential new construction baseline studies every three years. 146 LEADERS OF THE PACK Efficiency Vermont Residential New Construction Program Performance Efficiency Vermont (EVT) Residential New Construction Program Utility Cost Test Lifetime Avoided Electric Costs, Energy and Capacity Total Program Costs Net Benefit: Benefit -Cost Ratio: 2009 $2,193,201 $2,347,023 ($153,822) 0.93 2010 $1,533,959 $2,278,731 ($744,772) 0.67 2011 $1,528,760 $2,041,813 ($513,053) 0.75 Total Resource Cost Lifetime Avoided Electric Costs, Energy and Capacity Lifetime Fossil Fuel Savings Lifetime Water Savings Lifetime O&M Savings 2009 $2,193,201 $5,692,407 $341,555 $1,260,667 2010 $1,533,959 $7,218,953 $324,478 $480,003 2011 $1,528,760 $6,451,358 $248,463 $491,670 Total Program Costs Participant Costs Third Party Costs $2,347,023 $290,669 $185,623 $2,278,731 $390,929 $207,798 $2,041,813 $23,635 $148,198 Net Benefit: Benefit -Cost Ratio: $6,664,515 3.36 $6,679,935 3.32 $6,506,605 3.94 2009 $2,347,023 29,720,000 2010 $2,278,731 22,848,000 2011 $2,041,813 25,378,000 Lifetime Cost/kWh: Total Program Costs Total Lifetime kWh Savings Cost per Lifetime kwh Savings $0.08 $0.10 $0.08 Additional Data: (Section 5, Program 2009 2010 2011 Vermont GasPerformance) Systems Cost Effectiveness Table Program Costs $2,278,731 $2,041,813 Mcf Lifetime Est Per Total Lifetime Utility $2,347,023 Total Utility Utility Total Total savings Therm Cost Spending 1,588,000 Costs B/C 1,314,000 B/C Resourc Resource Total Gross kWh Savings 1,300,000 Rate (avg Savings (includes without e B/C B/C Total Net kWh Savings 1,666,000 With1,390,000 1,427,000 for cy of utility & ext. ext. with ext. without Total Gross MMBtu Savings 19,632 20,370 17,861 Rate R) participant ext. Total Net MMBtu Savings 20,528 21,348 18,604 Costs) Participants, Total 964 927 789 2011 6,902 144,942 $ 1.3765 $199,513 $222,936 $505,014 7.4 3.9 4.5 2.7 Inflation Rates: 2009 to 2010 2010 5,466 109,320 $ 1.3582 $148,478 $215,058 $376,530 6.0 1.020 3.1 4.8 2.8 2009 to 2011 1.051 2009 122,880 $ 1.4027 $172,364 $180,902 $262,254 8.0 4.2 7.7 Notes: 6,144 Total Program Costs include Operating Costs, Incentive Costs and Technical Assistance Costs. Inflation Rates are used to inflate Benefits (Avoided Cost of Electricity, Fossil Fuel savings, Water savings, O&M savings) which are all reported in the EVT Annual Report in 2009 dollars. 147 4.6 LEADERS OF THE PACK © ACEEE Lessons Learned Evolving into a multi-tier system has multiple benefits. The residential new construction program in Vermont has evolved recently into a multi-tier system to promote market transformation both by increasing market share (breadth) and supporting projects that exemplify extremely high levels of efficiency (depth). While Vermont ENERGY STAR Homes remains a core service offering for the RNC program, the addition of an Energy Code Plus tier has resulted in Efficiency Vermont and Vermont Gas System’s ability to maintain significant market share in a time when the ENERGY STAR Homes program undertook significant changes towards the ENERGY STAR V.3 specification. While the cash incentives are not as robust at the Energy Code Plus level, the program administrators are finding that many of their builder partners place a great deal of value on the technical assistance received and the energy rating documentation that helps them market homes. One barrier to participation in this service is the difficulty in valuing energy efficiency improvements in the marketplace because they are, in effect, invisible. Ratings and certifications make energy efficiency more visible, and efforts are under way to promote these attributes in the marketplace. In 2011, the Residential New Construction service, in collaboration with Realtors, lenders and other home building organizations, worked with the Northern New England Real Estate network (NNEREN) to get energy ratings and green building certifications listed on the Multiple Listing Service (MLS) website. The result is that Realtors and homeowners can see how efficient a home is compared to other homes on the MLS, which adds marketability to efficient homes. While there is still work underway to educate the real estate community on how to use and interpret efficiency information on the MLS, it is a significant step forward in raising awareness of energy efficiency in the housing market. In conjunction with Realtor outreach, Efficiency Vermont is working with the Vermont Appraisal Institute to determine how efficiency measures can be better accounted for in appraisals. The ultimate goal is that appraisers will take efficiency improvements into consideration in a more substantive way than they do currently. Program at a Glance Program name Efficiency Vermont and Vermont Gas Residential New Construction Program Targeted Customer Segment All developers, builders or homeowners of Single Family and MF residential new construction and gut rehab projects Program Start Date November 1. 2001 EVT/VGS partnership formed Annual Energy Savings Achieved EVT: 1,427 MWh (2011) VGS: 119,020 annualized MCF saved since 1993 Peak Demand (Summer) Savings Achieved: EVT: 139 kW Summer Coincident Peak kW Savings (2011) VGS: 1,149 Peak day Mcf avoided since 1993 Other Measures of Program Results to Date: EVT: 25,378 Lifetime MWh savings (2011) VGS: 2,704,305 Lifetime Mcf saved since 1993 Budget for most recent year EVT 2012 (actual): $1.6 million 148 LEADERS OF THE PACK (and next budget cycle if available): EVT 2013: $2.05 million VGS 2012 Budget $303,384 VGS 2013 Budget $300,824 Funding Sources (name and description): EVT: Energy Efficiency Charge on electric bills VGS: recovered from rates Website: www.efficiencyvermont.com/vesh www.vermontgas.com/efficiency_programs/res_programs.html Best Person to Contact for Information about the Program: Efficiency Vermont Name Chris Gordon Position Program Manager Organization Efficiency Vermont Phone number 802-540-7683 Email address [email protected] Vermont Gas Systems Name Scott Harrington Position Energy Services Manager Organization Vermont Gas Systems, Inc. Phone number 802-951-0372 Email address [email protected] RESIDENTIAL NEW CONSTRUCTION — EXEMPLARY RESIDENTIAL NEW CONSTRUCTION (RNC) CONNECTICUT LIGHT & POWER (CL&P) AND UNITED ILLUMINATING (UI), PROGRAM ADMINISTRATORS AND IMPLEMENTERS Program Overview Since deregulation in Connecticut in 1998, CL&P and UI have designed and implemented programs offered to both residential and commercial industrial customers through a “public benefit charge” on customer bills known as the Connecticut Energy Efficiency Fund. One of these exemplary programs is the Residential New Construction Program (RNC). The RNC program has roots prior to 1998. It began as the Energy Crafted Homes program which was offered to builders in the mid-1990s in Connecticut. In 2001, the program adopted ENERGY STAR Certified Homes (and HERS ratings) as the primary tool to evaluate homes. 149 LEADERS OF THE PACK © ACEEE In order to streamline the rating process and reduce program costs, CL&P and UI worked with the EPA to develop state specific Builder Option Package (BOPs). In 2009, the three natural gas utilities in Connecticut (Connecticut Natural Gas Corporation, Yankee Gas, and Southern Connecticut Gas) formally adopted the RNC Program with CL&P and UI maintaining roles as the primary administrators. In 2012, the RNC program official adopted Version 3.0 of ENERGY STAR Certified Homes. Another important milestone in the evolution of the RNC program is the leadership role that has been taken on training the building industry, on both the changes to ENERGY STAR Homes (Version 3.0) and the recent adoption of the 2009 International Energy Conservation Code (IECC) in Connecticut. By offering resources to builders, industry contractors, and code officials, the adoption of these new changes have become a smoother transition and program participation continues to increase. A total of twelve 2009 IECC code trainings were offered throughout 2011 and 2012 with a total 653 builders, architects, HVAC contractors, and code officials in attendance. Additionally, a comprehensive five part training series was offered in 2012 titled, “IMPLEMENTING ENERGY STAR® VERSION 3.0 WORKSHOP SERIES.” Over 200 builders, HERS raters, HVAC contractors, and architects attend the training series. The target market of the RNC program is any residentially metered single or multifamily unit being built in Connecticut. Additionally, those projects proposing a major renovation are also eligible for the program. Based on data from the Connecticut Department of Economic and Community Development (DECD), a total of 3,616 housing permits in 2012 were issued in Connecticut, of which 906 units participated in the RNC program in 2012 (represents a twenty-five percent market share). End uses and measures served by the program include high performance insulation and air sealing , HVAC (ENERGY STAR® furnaces, boilers, central AC systems, heat pumps, ductless mini-split heat pumps, geothermal heat pumps) , ENERGY STAR fluorescent and LED lighting, water heating (tankless water heaters, heat pump water heaters, condensing tank water heaters), and TopTen USA appliances . The RNC program is comprehensive, offering participants incentives for high performance home certifications (ENERGY STAR Certified Homes) and individual measure incentives for insulation, HVAC, and appliances to offset a portion of the incremental cost of improving the energy efficiency of the home. The majority of the participants in the RNC program strive for an ENERGY STAR Certified Home which involves working with a certified Home Energy Rating System (HERS) rater. HERS raters serve a major role in the delivery and high participation rate of ENERGY STAR Homes. There are two types of financial incentives: ENERGY STAR Certification incentives and prescriptive measure incentives (i.e. high performance insulation, geothermal heat pump). The table below shows a breakdown of the incentives currently available: 150 LEADERS OF THE PACK ENERGY STAR Certification Incentives Tier HERS Index Incentive Tier 1 74-65 $500 Tier 2 64-55 $1,500 Tier 3 54-50 $2,500 Tier 4 <50 $3,000 + $50/point below 50 Additional $500 bonus incentive for LEED for Homes, NGBS, or DOE Challenge Home Additional HERS Rating incentive awarded to help offset the cost of hiring a HERS rater. HERS Rating incentive based on tier level achieved. Prescriptive Measure Incentives High Performance Insulation - $.50/sq ft ENERGY STAR HVAC Systems: $250 Central A/C, heat pumps, split ductless heat pumps $500 natural gas furnaces $300 natural gas boiler Geothermal Heating and Cooling – $500 per ton up to $1,500 per home ENERGY STAR Hot Water Heaters: $200 Natural Gas Tankless Water Heater $200 Natural Gas Condensing Tank Water Heater $400 Heater Pump Water Heater TopTen USA Appliances - $50 per refrigerators, dishwasher, clothes washer Homes that are built for residents who meet state limited income eligibility requirements (60% state median income) will receive 125% of the incentives offered Examples of typical RNC participants: Natural gas heated home participating would receive approximately $4,500 (ENERGY STAR Certification, High Performance Insulation, High Efficiency Natural Gas Furnace, ENERGY STAR Central A/C, and TopTen USA Appliances). Geothermal heated and cooled home would receive approximately $6,000 (ENERGY STAR Certification, High Performance Insulation, Geothermal Heating and Cooling, Heat Pump Water Heater, and TopTen USA Appliances). Program Performance Despite a sluggish housing market, the program is generating robust results. These results are driven primarily by the following program features: 151 LEADERS OF THE PACK © ACEEE 1) The program design caters to builders of all levels and all housing markets. The program offers tiered incentives for ENERGY STAR Certification and includes low-load homes incentive for advanced builders (builders moving closer to zero energy performance). In addition, there are unique multi-family incentives that are tailored specifically to that harder to reach market builders who are only including limited measures can still participate and qualify for "prescriptive measures only" incentives e.g. incentives for high efficiency HVAC. This feature allows a wide range of builders active in the program and maintains their interest in the program. Once builders initially start participating on a “perceptive measures only” basis, this allows the program administrator the opportunity to push builders to more advanced tiers and higher levels of efficiency. 2) HERS rater incentives are also tiered based on performance. This feature provides an incentive to HERS raters to push builders to reach higher and higher tiers. 3) The program has a strong codes and education components. Workshops are held on a regular basis which focus on code compliance, building science and advanced building. These workshops typically target building officials, builders, designers and other market actors (e.g. HVAC contractors). These workshops not only provide a direct benefit to the building industry through education, while also attracting more participants into the program. A new feature in the 2013 program uses HERS raters to provide code compliance for duct and air tightness requirements as part of Connecticut's move to adopt the 2009 IECC. Program Year Electric and Natural Gas Budget Spending Total electric costs ($) Total RNC natural gas costs ($) 2010 $1,210,637 $956,278 2011 $1,687,263 $2,039,511 2012 Planned $1,438,329 $1,150,000 2012 (actual) $1,594,845 $864,936 Electric Savings (Gross kWh) Program Year Annual kWh (000) Lifetime kWh (000) 2010 1,704 27,011 2011 2,900 46,600 2012 Planned 1,960 32,842 2012 (actual) 1,726 29,585 152 LEADERS OF THE PACK Natural Gas Energy Savings (Gross CCF) Program Year Annual CCF (000) Lifetime CCF (000) 2010 90.6 2,264.4 2011 106.8 2,700.0 2012 Planned 98.3 2,456.9 2012 (actual) 80.5 1,960.3 Participation Program Year Total RNC Participation (# of Units) 2010 650 2011 831 2012 Planned 612 2012 (actual) 906 A baseline study of the RNC program was completed in 2012. Below is a link to the evaluation report: http://www.ctenergyinfo.com/ConnecticutNewResidentialConstructionBaseline-10-112.pdf Cost Effectiveness Program Year Total Resource Cost (B/C ratio) Utility Cost Test 2010 1.5 2.1 2011 1.4 2.1 2012 1.4 2.2 Lessons Learned A major lesson learned is that multifamily new construction can be a great opportunity to incorporate into Residential New Construction programs. It offers a tremendous energy savings potential and the ability to effect a whole building in a comprehensive way, including all measures effecting the energy performance. Prior to 2010, the RNC program didn’t have a streamlined process for multifamily new construction. Starting in 2011, the program began to address these projects with a whole building approach working with project engineers, architects, and energy consultants to offer incentives on individual measures as well as whole building certifications. In previous years, these types of projects would lack the comprehensiveness and would not address savings and incentives for all of the building, residential spaces, common areas, amenities, retail, mixed use areas, etc. Now, each of these areas of the building go through a review and analysis by utility program administrators to capture the most energy savings and create a comprehensive project. 153 LEADERS OF THE PACK © ACEEE Thanks to this more organized program structure for multifamily projects, the RNC program has over 1,000 multi-family units signed up and scheduled for completion in 2013 and 2014. Program at a Glance Program name Residential New Construction (RNC) Targeted Customer Segment Any residential single or multifamily new construction Program Start Date 1998 Annual Energy Savings Achieved (2012): 1,726 MWH Peak Demand (Summer) Savings Achieved (2012): 601 kW Budget for most recent year (and next budget cycle if available): Electric Budget: (2012 $1,438,329) (2013 $1,527,217) Natural Gas Budget: (2012 $1,150,000) (2013 $2,378,549) Funding Sources (name and description): Connecticut Energy Efficiency Fund (primarily funded through mill rate charge on electric and natural gas customer bills) Website: www.energizect.com 80.5 MCF Best Person to Contact for Information about the Program: Name Enoch Lenge Position Program Administrator , Residential New Construction Organization Connecticut Light & Power Phone number (860) 665-5369 Email address [email protected] RESIDENTIAL NEW CONSTRUCTION — EXEMPLARY ROCKY MOUNTAIN POWER WATTSMART NEW HOMES ROCKY MOUNTAIN POWER (RMP), PROGRAM ADMINISTRATOR NEXANT INC., IMPLEMENTER Program Overview The New Homes program (electric only) targets the new homes market in RMP territory, specifically residential construction. Rocky Mountain Power wattsmart New Homes Program fosters the construction of energy efficient new homes built above code in Utah by 154 LEADERS OF THE PACK offering incentives to builders. The Program was redesigned in 2011 to offer incentives for both “stand-alone” incentives and “whole-home options” to reach a wider audience since the ENERGY STAR certification was the basis of the program from its inception in 2005. The program has developed customized incentive request forms and hybrid ENERGY STAR Inspection Checklists to reduce barriers for rater submissions. Program applications were designed to upload to the database reducing data entry time in addition to capturing more information to analyze the program more closely. Program conducts a 5% quality assurance field inspection on all measures but has expanded that to include what is called “Rater RideA longs” to provide educational opportunities to discuss installation standards and compliance. The marketing and outreach efforts have included a recent redesign of the program website, which now includes clear information about builder incentives, program guidelines and training information. Other marketing and outreach efforts have been development of collateral and displays as well as contractor support materials, extensive training and support for ENERGY STAR Version 3.0 in addition to the planning of marketing events in partnership with other utilities, home builder associations, local non-profits focused on energy efficiency, and building suppliers to increase understanding of efficient homes for builders, raters, subcontractors, realtors, appraisers, and homeowners. The program only offers incentives for electric savings, although the list of measures is extensive. End uses and measures targeted include Whole Home Measures (ENERGY STAR V 3, HERS 50, and IECC 2009), Lighting, HVAC Technology (SEER, EMC) and quality installation and design/AC Technology and Ventilation Installation and Design, Evaporative Cooling, and Building Envelope and Fenestration. To view detailed list of measures, click here . Rocky Mountain Power wattsmart New Homes Program (“the program”) fosters the construction of energy efficient new homes built above code in Utah by offering incentives to builders. The program was redesigned in 2011 to offer incentives for both “stand-alone” incentives and “whole-home options” to reach a wider audience since the ENERGY STAR certification was the basis of the program from its inception in 2005. The whole-home options include incentives for IECC 2009 and ENERGY STAR certified homes which includes one measure for a home that exceeds a HERS 50. The stand-alone measures like energy efficient lighting, air-conditioning equipment and HVAC design can be utilized independently or in combination with other individual or whole-home measures. Program Performance Despite declining avoided costs values, the New Homes program has been able to weather the storm of a flat building market, decrease in average energy consumption, increasing energy building codes, and energy prices through targeted builder outreach and flexible incentive structures. Through market research, the program was able to learn what the primary barriers are to builder participation in utility incentive programs and has sought to reduce those barriers. Perhaps the greatest barrier to participation has been the perception 155 LEADERS OF THE PACK © ACEEE of time-prohibitive paperwork and documentation requirements for program participation. To address this perception, the program has and continues to simplify submission forms and where possible streamline documentation requirements. In conjunction with these efforts, the program continues to educate builders about how simple and easy program participation can be. Another barrier to participation that the program has had to overcome is unwillingness of many builders to install bundles of energy efficient measures to receive incentives. The program has had to structure incentives to accommodate a broad range of builder willingness to participate and yet at the same time keep the incentive structure as simple as possible. Seeking buy in from key participating builders throughout the program design process was key to creating a program that appeals to the general builder market. Year Program spending Program savings (kWh) Participants (Homes/Year) Utility Cost Test (UCT) Total Resource Cost (TRC) 2010 $2,604,552 6,515,958 2,275 1.08 .91 2011 $3,078,749 5,882,289 1,784 1.01 .91 2012 $1,789,948 3,027,677 1,650 NA NA Link here to access the evaluation report. http://www.pacificorp.com/es/dsm/utah.html Lessons Learned The New Home program had to evolve significantly over the years in order to survive cost effectiveness threshold requirements. The market has been volatile over the past 7 years due to various factors: increasing appliance standards and energy building codes, decline in new home starts, decreasing average residential energy consumption, and decreasing energy costs. Needless to say, it’s been a challenge to implement a cost effective, standalone program. While the program was exclusive to ENERGY STAR in years past, the program expanded its measure offerings to appeal to the larger new homes market. The plan is to bring more energy savings to the program by attracting builders to measures that are “above code” and over time encourage newly participating builders to consider a whole home approach in the market. Program at a Glance Program name Rocky Mountain Power wattsmart New Homes (Utah) Targeted Customer Segment Residential New Construction (Single and Multi-Family) 156 LEADERS OF THE PACK Program Start Date 2005 Annual Energy Savings Achieved 3,027,677 (net savings-at site) Program Year 2012 Budget for most recent year (and next budget cycle if available): 2012 Budget $1,789,948 2013 NA Funding Sources (name and description): Ratepayer Funded Website: http://www.rockymountainpower.net/res/sem/epi/utah/esnh.h tml Best Person to Contact for Information about the Program: Name Jason Berry Position Program Manager Organization Rocky Mountain Power Phone number 801.220.3443 Email address [email protected] RESIDENTIAL PRODUCTS AND APPLIANCES — EXEMPLARY APPLIANCE RECYCLING PROGRAM SOUTHERN CALIFORNIA EDISON, PROGRAM ADMINISTRATOR APPLIANCE RECYCLING CENTERS OF AMERICA (ARCA), JACO ENVIRONMENTAL, AND ENERPATH, IMPLEMENTERS Program Overview The Appliance Recycling Program (ARP) at Southern California Edison (SCE) has been offered to its customers for over 19 years. ARP produces cost-effective peak demand reduction and annual energy savings in residential and non-residential market sectors by removing operable, inefficient refrigerators and freezers from the power grid in an environmentally safe manner. ARP incentivizes SCE customers to remove their old refrigerator/freezer by offering a cash incentive ($35.00/unit7) to the customer as well as free removal of the appliance. Since the inception of the program, SCE’s ARP has removed from the grid and recycled over 1,000,000 working, inefficient refrigerators and freezers. Rebuild L.A. (RLA), a non-profit corporation, was formed after the 1992 Los Angeles civil disturbances to restore the health and vitality of Los Angeles. SCE joined the efforts in 1993 to help rebuild neglected areas of Los Angeles by utilizing the Appliance Recycling Program 7 2010-2011 Cash incentive was $50.00/unit. 2012 Cash incentive was lowered to $35.00/unit. 157 LEADERS OF THE PACK © ACEEE as a way to secure employment for those in need while also stimulating the local economy. To that end, SCE and the Appliance Recycling Centers of America (ARCA) partnered to open a state-of-the-art appliance recycling facility in Compton, California. Hundreds of jobs became available through the introduction of ARP into Southern California communities and the program still continues to provide new jobs. With the increase in volume of appliances being collected over the last years thru SCE’s ARP, both ARP implementers moved their call centers to Southern California (ARCA from Minneapolis to Compton and JACO from Seattle to Fullerton) which has provided more employment opportunities to local residents. Further, and as part of SCE’s continued commitment to its local communities, an innovative concept was introduced that allows participants in SCE’s Appliance Recycling Program to donate all or a portion of their $35 program incentive directly to SCE’s Energy Assistance Fund (EAF) during the program process. EAF is funded by voluntary, tax-deductible donations from SCE customers, employees and shareholders and was created to help SCE customers in need pay their electric bills. Since the inception of this offering, over 5,600 customers have donated all or a portion of their rebates to EAF, resulting in over $183,000 in donations. SCE has partnered with the United Way of Greater Los Angeles, a communitybased non-profit organization, to help raise and disburse the funds donated to EAF to qualified customers throughout SCE's service area. This innovative program concept has not only supported the company’s efforts to help SCE customers in need pay their electric bills, it has reduced the costs of ARP by eliminating the need to issue a customer incentive check when the customer chooses to donate their entire program incentive to EAF. SCE’s ARP has extremely high customer satisfaction ratings. In 2011, 95% of all participants rated the program an 8, 9, or 10 (on a 10-point scale where 10 is the highest level of satisfaction), an increase of 8 percentage points from 2007 (87%). SCE attributes much of this increase in the customer satisfaction level to the operational excellence activities that ARP has implemented to increase the quality of customer engagement and ease of use (see Lessons Learned). Program Performance Each year, SCE delivers a mix of energy efficiency programs as a part of its efforts to deliver cost effective energy solutions to customers. Program participation rates may vary year to year based on internal program characteristics and/or external factors which may include economic conditions, levels of program marketing and outreach and other factors. 158 LEADERS OF THE PACK Program spending Year Year Spending Recorded 2010 12,303,712 2011 12,146,432 2012 7,862,378 Total 32,312,523 Program savings kWh Gross Savings kW Gross Savings 2010 61,486,052 11,935 2011 64,944,199 12,611 2012 41,604,456 8,053 Total 168,034,707 32,599 Participation levels Year Number of refrigerators and freezers recycled: 2010 72,704 2011 76,763 2012 49,309 Total 198,776 There are two 2006-2008 impact evaluations reports available on CALMAC.org. To find these reports, please go to the CALMAC website and use the searchable database or type ‘ARP” and both of these reports will come up or use the report IDs. One is an SCE ARP process evaluation study, Report ID SCE0281.01, by Innvologies LLC. The other is a statewide impact evaluation study, Report ID CPUC0029.01, by Cadmus Group. Cost effectiveness: Cumulative for 2012 and 2011 results. UCT (PAC): 1.35 TRC: 1.35 $/kWh: $0.19 Lessons Learned Finding a solution to customer cancellations and implementing that solution is at the top of the list in our lessons learned. Long customer wait times between appointment registration and appliance pick-up was the main reason for the majority of customer cancellations from 159 LEADERS OF THE PACK © ACEEE the program, before an IT systems solution was implemented. Once ARP’s systems implementer (EnerPath) introduced a new operational system, customer satisfaction ratings increased, and now approximately 25% of customers receive next-day pick-up of their appliances when they schedule their appointment. Upon implementing the system, SCE reduced average appliance pick up time (e.g., customer sign-up to actual appliance pick-up) from 14 days to less than 3 days. This system, built specifically for SCE’s program, is sustainable and has already been leveraged by other North American utilities as an industry best practice. This program is a direct customer touch-point, and this high level of customer satisfaction also helps to raise customer favorability for SCE. Program at a Glance Program name Appliance Recycling Program Targeted Customer Segment Residential and Non-residential Program Start Date 1/1/2010 Annual Energy Savings Achieved 56,011,569 kWh (Annual avg of total 3 years) Peak Demand (Summer) Savings Achieved: 10,866 kW (Annual avg of total 3 years) Other Measures of Program Results to Date: Budget for most recent year (and next budget cycle if available): $10,124,024 Funding Sources (name and description): Ratepayers Website: www.sce.com/pickup Best Person to Contact for Information about the Program: Name Tom Schober Position Project Manager Organization Southern California Edison Phone number (626) 302-0753 Email address [email protected] RESIDENTIAL PRODUCTS AND APPLIANCES — EXEMPLARY RETAIL STRATEGY INITIATIVE PACIFIC GAS AND ELECTRIC, PROGRAM ADMINISTRATOR CHANNEL ENGAGEMENT TEAM, IMPLEMENTER 160 LEADERS OF THE PACK Program Overview To maximize consumer appreciation of the benefits of energy efficient products when they are in stores, making purchasing decisions, PG&E has built solid relationships with a number of large retailers who are market leaders in the appliance, home improvement, and electronics product categories. Operating more than 500 stores within the PG&E service territory, these retailers provide hundreds of millions of customer touch points each year. Building on these partnerships—and noting that close to 40% of PG&E’s total gross electricity savings in 2011 was generated through retail sales of light bulbs, dishwashers, clothes washing machines, consumer electronics, and refrigerators—PG&E in 2011 targeted five retailers for strategic partnerships: Best Buy, Home Depot, Lowe’s, Orchard Supply Hardware, and Sears. The utility signed strategic agreements with executives of all five retailers by June 2012, creating partnerships for collaborative efforts to build programs, communicate with and educate customers, and share best practices. The Retail Strategy seeks to leverage the entire PG&E portfolio including energy efficiency, demand response, and marketing efforts through the retail channel. The primary customer segment is currently the residential customer, either through the retail channel as a store, or through contracting efforts provided through retail outlets. Based on the availability of measures that are available to commercial customers, the option to add additional retailers that serve the commercial customers is a future option. Currently, the measures that are being delivered through the retail strategy include televisions, lighting, appliances, appliance recycling, and water heaters. The opportunity to leverage the retail relationships to provide services for Energy Upgrade California, HVAC Quality Maintenance, and other programs is currently being developed. The Business Consumer Electronics Program (BCE) provides incentives to the retailers to promote the stocking of more efficient televisions resulting in a consumer’s option to purchase a more efficient product. The lighting program provides incentives to manufacturers to buy-down the cost of the bulbs resulting in a lower price to the customer giving participating retailers the desire to stock and sell qualifying products. Rebates given to customers for all other products can be leveraged by the retailer to sell more products and close sales on the sales floor. PG&E has delivered programs such as Point-of-Sale (POS) and One-Touch Recycling to offer retailers an added value to our incentives as well as to provide our mutual customers a better experience with the retailer and PG&E. For years, PG&E has been providing point-of-purchase materials in-store to identify qualifying products. In 2008, with the launch of the BCE program, PG&E was able to garner the attention of retailer corporate management providing a deeper engagement that enabled conversations across multiple categories. Today, PG&E has strategic agreements with retailers Best Buy, Lowe’s, Home Depot, Sears, and Orchard Supply Hardware in order to maximize the broader engagement opportunity. 161 LEADERS OF THE PACK © ACEEE Program Performance Following are the incentives and energy savings related to the five strategic retail participants stated in the program summary and are not reflective of ALL retailers who also participate in the programs. Overall: Incentives through the retail channel are challenged moving forward due to decreased budget availability in key categories such as BCE and Lighting. Moving forward, we are targeting service based programs driven through other parts of the retail organization to maintain relevance through this channel. We are also investigating nonresidential programs to drive through these retail partners. BCE Overview: Dollars driven through strategic retail partners was impacted by budget availability and reduced incentives. This reduction in incentives and the planned sunset of the program in the near future requires that we create a replacement strategy for these dollars. Appliance Overview: The reduction in dollars for appliances is due to the sunset of dishwashers in Q1 2012 which was a high volume measure which was replaced by refrigerators which is not high volume. In 2013, we will see these numbers include our push for water heaters. We are also working with retailers to increase the number of qualifying refrigerators on their floors. Lighting Overview: The increase in lighting dollars driven through our strategic retail partners is due to the addition of Lowe’s and Home Depot to our lighting program. Appliance Recycling Overview: These numbers reflect the One Touch Recycling Program portion of our Appliance Recycling program launched at Sears and piloted at Lowe’s. Incentives Business Consumer Electronics (BCE) 2010 2011 2012 $ 2,127,384 $ 4,312,924 $ 1,817,118 Appliances $ 4,913,654 $ 4,982,150 $ 3,747,360 Lighting $ 220,565 $ 410,551 $ 1,835,489 $ 81,190 $ 136,330 Other $ 96,679 $ 70,909 $ 120,365 Total $ 7,360,292 Appliance Recycling KW KWh Therms $ 9,859,735 $ 7,658,674 7,436.4 9,715.2 8,049.5 42,460,825.3 60,058,564.2 50,303,785.1 350,115.4 23,396.8 -640,923.7 Savings are gross numbers. Negative therms are due to the lighting and refrigerator measures as they generate heat and therefore create negative therms. There is no program evaluation for the retail strategy nor is one expected as it is not a program in and of itself. Similarly, because the retail strategy leverages a number of programs, there is no calculation for cost effectiveness for the effort. 162 LEADERS OF THE PACK Lessons Learned PG&E’s retailer engagement has provided a number of lessons learned. One of the most impactful pieces of the retail strategy is the PG&E field team of five people who are constantly in the stores identifying qualifying products with POP material, providing sales person engagement, providing help implementing programs such as Point of Sale, and providing market intelligence. It is also imperative that the initiative be socialized amongst the Channel team as well as the Products team to allow for additional opportunities to be directed to the retail channel. Retailers also need a reason to be engaged. Their goals are not inherently to sell energy efficient products, but rather to sell as much product at a profit as possible. It is important that the utility understand their market drivers to successfully have a long term engagement and to provide value in whatever means possible to contribute to their ultimate success. It is also important for utilities to understand that for retailers to work with individual utilities across the country is cumbersome and difficult to execute against. Utilities must collaborate to offer consistent program delivery, marketing and messaging opportunities. Program at a Glance Program name Retail Strategy Initiative Targeted Customer Segment Residential Program Start Date 2010 Annual Energy Savings Achieved See chart Peak Demand (Summer) Savings Achieved: Because this program crosses a number of programs, this information is not available. Other Measures of Program Results to Date: Sales associate trainings, in-store displays, kiosk interactions. Budget for most recent year (and next budget cycle if available): This initiative leverages the incentives and budgets of multiple programs. No specific budget is assigned to the retail strategy other than 1 FTE to manage the strategic relationships. Funding Sources (name and description): Energy Efficiency Incentives Website: N/A Best Person to Contact for Information about the Program: Name Kari Binley Position Sr. Industry Relations Manager Organization Channel Engagement Phone number 415-973-0167 Email address [email protected] 163 LEADERS OF THE PACK © ACEEE RESIDENTIAL WHOLE HOME — EXEMPLARY EFFICIENT HOME PROGRAM (FORMERLY BRIGHTSAVE HOME) UNISOURCE ENERGY SERVICES, PROGRAM ADMINISTRATOR UNISOURCE ENERGY SERVICES (UES) AND CONSERVATION SERVICES GROUP (CSG), IMPLEMENTERS Program Overview The UES Efficient Home Program is a PUC authorized demand side resources program designed to achieve two goals: (1) incentivize the installation of specific residential energy efficient measures within existing homes, and (2) motivate market transformation by requiring customers utilize program approved, licensed contractors in order to access incentives. The program was introduced to replace a 2010 HVAC mail-in rebate program that was deemed not cost-effective. The program was designed as a first step toward cultivating consumer demand for and a contractor base to deliver whole home, performance based residential retrofit services across a vast rural territory. The program is open to residential customers living in single family detached homes and townhomes of up to 4 units. UES provides electrical service to over 80,000 residential customers across a territory of 8,056 square miles. The territory’s most populace towns are Kingman (population 28,068) and Lake Havasu City (population 52,527) in northwestern Arizona, and 300 miles to the southeast the city of Nogales, Arizona (population 20,837). Within this territory the target market for residential retrofit services was defined as existing dwellings with a market value of $150,000 and greater, constructed prior to 2000, and occupied by residents with a combined household income of $50,000 and above. This target group was considered to be in the best position to afford retrofit services not covered by the utility’s Low-Income Weatherization program. Based on purchased data and Assessor’s records only 4,516 residential customers fit the target market profile, a factor that would lead to program modifications shortly after launch. The program’s licensed trade contractors constitute a second customer base served by the program. Contractors who sign a participation agreement and meet the programs quality and training standards are awarded access to provide program incentives to utility’s customers in addition to referrals from the program’s website. The core eligibility standards for program participating contractors are: Maintain good standing with the Registrar of Contractors Maintain a B or better rating from the Better Business Bureau Maintain proof of required insurance coverage(s) Pull all required permits for each installation job 164 LEADERS OF THE PACK Provide a BPI trained employee to field supervise/install each job The program was launched in 2011 as an audit based program requiring customers first undergo a comprehensive blower door guided home energy assessment. The audit was administered by CSG program staff utilizing energy modeling software and providing direct installation kits of 10 CFL bulbs and 1 smart power strip. The decision to provide utility delivered audits was based on the lack of precedent in the existing contractor base, and the desire to provide customers with a pressure free utility branded experience. Customers were charged $99 for the audit while the utility incented the implementation contractor an additional $200. Upon completion of the audit customers were given a printed report itemizing recommended program measures and their impact on the customer’s annual energy bill. Incented measures available to customers through participating contractors were: HVAC Replacement on Burn Out with Q.I. (also requires Duct Sealing), $900 HVAC Early Retirement with Q.I (also requires Duct Sealing), $500 HVAC Downsizing of 1/2 ton or more, $150 Duct Sealing, $3/CFM 25 reduced with $650 cap and maximum of 50% of installation cost Air Sealing, $250 and maximum of 50% of installation cost Air Sealing with Insulation, $800 and maximum of 50% of installation cost Shade Screens/Solar Window Film, $1.00/SF with $250 cap Measure installations were allowed as prescriptive measures for the 2011 calendar year and transitioned to performance measurement based incentives effective January 1, 2012. The UES program launched in May of 2011 and by September had only logged 44 home audits despite significant radio and print media exposure. The slow uptake of the utilityprovided audits coupled with the requirement of obtaining an audit in order to access measure incentives created a bottleneck preventing customers from accessing incentives, participating contractors from up-selling more efficient solutions, and the utility from achieving its load reduction goals. By fall of 2011 the team met several times to review and make changes to the program strategy. The team recognized that the slow pace of audits was consistent with the demographic target market analysis applying a 3% realization rate. Reaffirming the overarching goal of proliferating energy efficient measures through cost effective means, the team decided it would work to increase the uptake of audits while simultaneously removing the requirement that an audit must be completed in order to qualify for measure incentives. In consultation with the programs core contractors the team also evaluated the programs media strategy and audit delivery work flow. The feedback on the program’s “utility-centric” media campaign and proposition of placing utility energy experts in customers’ homes indicated that customers were not favorably 165 LEADERS OF THE PACK © ACEEE engaged by the prospect of utility “employees” in their home. Customers and contractors were also strongly deterred by the delays and additional service hours caused by multiple added touches. Contractors were also concerned about the investment in training and equipment required to provide performance tested installations. Program Performance The resolution reached was to transition the audit opportunity to those contractors interested in providing that service while allowing all participating contractors to offer qualifying measures without requiring a comprehensive audit. Contractors convinced the team that given the freedom to sell audits and measures uncoupled, they could directly pitch these energy efficient measures to every customer in need of equipment servicing or replacement. With a customer base of 80,000 and an estimated 15 year cycle time from AC install to service or replacement the team concluded the potential market was upward of 5,000 per year – a much greater market potential than the demographic analysis suggested. From a technical standpoint these compromises were mitigated by the programmed transition in 2012 from prescriptive to performance-based incentives, and the program’s coupling of duct sealing with all HVAC replacements. Effective 2012 every participating home, except those participating only in shade screens/solar film, received whole house blower door testing and/or duct leakage testing even without a whole house audit. These changes led to a dramatic increase in performance in 2012 and helped transform a non-cost effective program into a robust and cost effective. The tables below tell the story: incentive spending increased both absolutely and in comparison to program delivery costs, energy and capacity savings and program participation skyrocketed. Neither the predecessor program, Efficient Home Cooling in 2010, which is shown for comparison, nor the Efficient Home Program in 2011 had achieved a positive benefit-cost ratio; 2012 was cost-effective. DSM Program Incentive Spending Program Delivery Incentive: Delivery Ratio 2011 Efficient Home Program $192,614 $445,209 0.4 2012 Efficient Home Program $758,231 $391,485 1.9 2011-2012 TREND: 294% -12% 348% *2011 was impacted by pre-launch program start up and training costs 166 LEADERS OF THE PACK Program Capacity Savings MW Annual MWh Savings 2010 Efficient Home Cooling 0.06 115.88 1,738.27 2011 Existing Home Program 0.22 262.97 44,21.70 2012 Existing Home Program 1.55 2744.65 49,979.58 2011-2012 TREND: 590% 944% Lifetime MWh Savings 1030% NOTE: Net to gross ratio is 1 accounting for the effects of free ridership, attribution and spillover. Participation by Measure PY 2010 PY 2011 PY 2012 2011-12 TREND Air Sealing NA 14 155 1107% Duct Testing & Repair NA 11 109 991% Early Retirement 483 82 366 446% Replace on Burnout NA 46 90 196% Shade Screens NA 2 51 2550% Energy Audits NA 59 372 631% Totals 483 214 1,143 Impact evaluations are scheduled for mid-2013. UES Programs for Existing Home Retrofit Measures Measures Program Participants 2010 AC Rebate Program 483 483 2011 Efficient Home Program 214 188 2012 Efficient Home Program 1143 Gross MW Gross Annual MWh Gross Lifetime MWh 176 2918 0.22 263 4422 715 1.55 2745 49980 UES Programs for Existing Home Retrofit Measures Societal Benefits (w/o Externalities) Program Societal Cost Net Benefits Benefit Cost Ratio 2010 AC Rebate Program $214,792 $460,993 -$246,201 0.47 2011 Efficient Home Program $480,323 $719,042 -$238,719 0.67 $0.207 2012 Efficient Home Program $4,450,525 $1,482,061 $2,968,464 3.0 $0.026 167 CCE $/kWh LEADERS OF THE PACK © ACEEE Lessons Learned The program team continues to learn lessons almost daily but recognizes the following lessons as important factors in turning this program around: Analyze the service territory demographics for clues as to what level of absorption you can expect for non-urgent retrofit measures. Look at the number of HVAC units that should turn over in your service territory due to aging and develop a plan to directly access that market potential. Invite your top contractors in on the design process and give what they have to say serious consideration. Keep the focus on measure proliferation without compromising on quality and cost effectiveness will follow. Bring a trusted insider on board. The team hired a well-regarded local contractor to provide field mentoring and contractor participation tripled within months. Program at a Glance Program name Efficient Home Program (BrightSave Home) Targeted Customer Segment 80,000 residential customers Program Start Date May 2011 Annual Energy Savings Achieved 2,745 Annual MWh Peak Demand (Summer) Savings Achieved: 1.55 MW (2012 program year) Other Measures of Program Results to Date: Cost of Conserved Energy $0.026/kWh Budget for most recent year (and next budget cycle if available): $1,000,000 Funding Sources (name and description): Ratepayer funded through PUC order Website: www.uesaz.com/efficiency/home/electric/bright Best Person to Contact for Information about the Program: Name Mike Baruch Position Program Manager Organization UNS Energy Phone number (520) 918-8253 Email address [email protected] 168 LEADERS OF THE PACK RESIDENTIAL WHOLE HOME — EXEMPLARY MASSSAVE HOME ENERGY SERVICES (“HES”) PROGRAM BERKSHIRE GAS, CAPE LIGHT COMPACT, COLUMBIA GAS, NATIONAL GRID, NEW ENGLAND GAS, NSTAR, WMECO, AND UNITIL, PROGRAM ADMINISTRATORS CENTER FOR ECOTECHNOLOGY, CONSERVATION SERVICES GROUP, HONEYWELL UTILITY SERVICES, AND RISE ENGINEERING, IMPLEMENTERS Program Overview The Mass Save HES Program provides comprehensive information, home energy assessments, and energy efficiency incentives and financing options to assist customers in retrofitting existing homes with cost-effective energy efficient measures. The program is implemented using a fuel-blind approach; all end uses are examined regardless of the heating fuel used. HES serves residential customers in 1-4 unit dwellings on standard rates with measures to address the end uses of lighting, appliances, weatherization, heating systems, controls, domestic hot water, HVAC/mechanical systems. The customer path starts with one single comprehensive assessment, called the Home Energy Assessment (“HEA”), which is offered at no cost. This assessment is an in-home visit designed to provide general information and education about energy efficiency and identify opportunities and challenges for energy saving installations. With the customer’s permission, Compact Fluorescent Lights (“CFLs”) are installed at no cost in all appropriate locations, as are low-flow shower heads, faucet aerators and programmable thermostats (as needed and qualified). The instant energy savings realized during the Home Energy Assessment are intended, on average, to exceed the expected average cost to deliver this visit. Additionally, during this visit, customers’ specific needs will be evaluated, and opportunities for subsequent direct installation measures may be identified. Customers will be directed to other energy-efficiency resources as appropriate. The Home Energy Assessment also includes a variety of diagnostic techniques such as infrared scanning, temperature permitting. Wherever feasible, full installation of targeted cost-effective air sealing is provided at no cost to the customer. In all cases where the customer elects the fully subsidized air sealing offer, or installation of insulation, a blower door test and combustion safety test will be performed pre- and post- installation to maximize air leakage reduction and maintain combustion safety standards. If specific energy-efficient improvements require professional contractors, or a customer contribution, the Energy Specialist explains the contractor services required to install recommended measures, as well as all available energy efficiency financial incentives. The program is offered jointly by all electric and gas utilities and energy efficiency providers in the state, known as the Program Administrators (PAs). Lead vendors selected through a competitive bidding process administer the program on the PAs’ behalf. Lead 169 LEADERS OF THE PACK © ACEEE vendors are responsible for managing and training market based participants such as participating Independent Insulation Contractors and Home Performance Contractors. Additional lead vendor responsibilities include: consistent statewide contractor training, data reporting, achieving aggressive savings, customer satisfaction, quality control standards, scheduling requirements, technical assistance, and maintenance and reporting of health and safety information. Two groups of Mass Save Participating Contractors, the Home Performance Contractors (“HPCs”) and the Independent Installation Contractors (“IICs”), complete customer weatherization projects under agreement with the Lead Vendor. All Participating Contractors must meet program eligibility and requirements. HPCs independently recruit customers, provide Home Energy Assessments, and implement weatherization measures. IICs provide installation of weatherization measures for those customers who received a Home Energy Assessment from the lead vendor. IICs also have the opportunity to independently recruit customers and refer them to the lead vendor for the Home Energy Assessment. To ensure all work is completed to the PAs’ standards, the Quality Assurance Visit allows all work to be inspected. This may be done through a combination of methods, including a phone survey, postcard, e-mail or actual site visit by the lead vendor and/or a third-party PA-approved vendor. Quality inspections are performed to ensure that contractor-installed measures are accurate, professional, and safely installed based on initiative standards, as well as to ensure savings. All participating customers may receive a no cost home energy assessment as well as no cost efficient lighting, smart strips, low flow shower heads, and faucet aerators at the time of assessment. Qualified customers are also eligible for financial assistance up to $300 to remediate common pre-weatherization barriers, no-cost targeted air sealing, incentives of 75% up to $2000 off of the cost of insulation, no cost electric thermostats, and varied rebates on heating and hot water systems. Finally, qualified customers may utilize a 0% HEAT loan of from $500 up to $25,000 for a term of two to seven years to cover their portion of project costs. The MassSave Home Energy Services Program has been available to Massachusetts residents since 1980. While initially instituted as a residential education initiative to stimulate independent customer action, the program was restructured in 2001 to provide direct assistance to customers -- in the form of turnkey services and financial incentives -- to encourage energy efficiency improvements that were identified through an in-home energy assessment. The model was redesigned again in 2010 in response to groundbreaking legislation that was passed in 2008, the Green Communities Act (GCA). The GCA provided an opportunity to expand upon the successes of the 2001 design by mandating that the PAs secure ALL energy efficiency resources that are cost-effective or less expensive than supply; this was a significant change from the historical constraints of limited funding for energy efficiency. A new market model was designed to help support an exponential expansion of the HES Program to serve more customers and save more energy and also provide more job opportunities to residents of the Commonwealth. The new market model is consistent 170 LEADERS OF THE PACK across all sponsoring PAs to minimize the potential market confusion that can be associated with program expansion. Program Performance Electric Year Spend Net Annual Savings (MWh) Net Lifetime Savings (MWh) Annual Peak Demand Savings (Summer KW) Participants CCE ($ per lifetime kWh) 2010 $33,659,148 35,679 319,427 10,016 32,137 $0.11 2011 $41,514,926 35,468 283,922 3,557 39,296 $0.15 2012 $24,860,336 19,390 189,907 2,005 18,182 $0.13 *2012 results are preliminary and will be finalized by August 2013. Additionally, Massachusetts utilizes the Total Resource Cost test, but TRC and B/C ratios are only calculated at the residential sector level for statewide reporting. Gas** Year 2010 2011 2012 Spend $14,035,679 $18,199,324 $20,301,217 Net Savings (Annual therms) 1,286,771 1,554,555 1,998,230 Net Savings (lifetime therms) Participants CCE ($ per lifetime therm) 18,757,671 Assessments: 10,030 Weatherization Jobs: 6,811 $0.56 32,521,751 Assessments: 20,598 Weatherization Jobs: 8,331 $0.39 43,130,438 Assessments: 20,847 Weatherization Jobs: 10,872 $0.36 ** In contrast to the electric program, the gas budgets, plans, and savings are traditionally filed as separate line items with the DPU, hence the distinct participation counts. Additionally, as noted in the descriptions above, on the gas side, the requirement to have an assessment before weatherization work was not completely phased in until May 2011. An impact evaluation of the program was conducted in 2011 and may be found at the following link: http://www.maeeac.org/docs/2011%20to%202012%20EMV/Residential/MA%20RRLI%20%20HES%202011%20Impact%20Evaluation%20Report_FINAL_04SEPT2012.pdf 171 LEADERS OF THE PACK © ACEEE Lessons Learned Establishing a statewide fuel-blind program provides the most available incentives to customers and helps reduce customer and contractor confusion. Broad-based statewide marketing such as billboards and radio can drive recognition and participation in programs. Establishing regular working groups for Program Administrators, state agents, contractors, community groups, and others has ensured the program progresses in areas that meet all stakeholder needs. For instance, a statewide committee was setup to ensure fair and equitable pricing was available for participating contractors in the program. Continuous “Test-and-Learn” is necessary to improve participation among all customer demographics and increase savings through new technologies. Offering short term incentives to contractors or customers above and beyond standard program offers can help stimulate additional participation and savings. While not directly increasing savings, assisting customers to overcome preweatherization barriers such as knob and tube wiring is a priority in territories with older housing stock or lower incomes, and can ultimately improve close rates. The various paths into the program provide customers with more options to participate, while providing an opportunity to increase the green workforce within the state. Program at a Glance Program name Mass Save Home Energy Services Targeted Customer Segment Residential customers in 1-4 unit dwellings on standard rates. Program Start Date 1980 Annual Energy Savings Achieved 2011 Electric: 36,468 MWh (net) 2011 Gas: 155,455 MMBTU (net) Annual Peak Demand (Summer) Savings Achieved: 2011: 3,557 Summer KW Other Measures of Program Results to Date* *2012 results available early February 2013 2011 electric and gas participants: 59,894 Budget for most recent year (and next budget cycle if available)* *2013-2015 statewide budgets not filed at program level. 2011 Electric : $44,803,539 2011 Gas: $18,862,155 2012 Electric: $61,907,753 2012 Gas: $16,997,068 Funding Sources (name and description) Systems Benefit Charge, Forward Capacity Market Proceeds, Energy Efficiency Reconciliation Factor 172 LEADERS OF THE PACK Website www.masssave.com Best Person to Contact for Information about the Program: Name Monica Tawfik Position Senior Program Manager Organization National Grid Phone number 781-907-1587 Email address [email protected] RESIDENTIAL NATURAL GAS — EXEMPLARY WARMCHOICE PROGRAM COLUMBIA GAS OF OHIO (COLUMBIA), PROGRAM ADMINISTRATOR CORPORATION FOR OHIO APPALACHIAN DEVELOPMENT (COAD), GROUND LEVEL SOLUTIONS (GLS), MID-OHIO REGIONAL PLANNING ASSOCIATION (MORPC), AND NEIGHBORHOOD HOUSING SERVICES OF TOLEDO (NHST) Program Overview Columbia Gas of Ohio’s WarmChoice program serves low-income households whose income is at or below 150% of the federal poverty guidelines (FPG). Within the sector, the program targets high natural gas usage households and households that have accumulated high arrearages under Ohio’s Percentage of Income Payment Plan (PIPP). High-use households have higher bills and greater savings opportunities; and PIPP participants will experience slower growth of arrearages. The program provides a wide range of natural gas saving energy efficiency measures (EEMs) that are determined through a comprehensive diagnostic home energy inspection. A complete list of potential EEMs is listed below: Insulation Attic insulation Wall insulation Floor insulation over unconditioned spaces Duct insulation for ducts in unconditioned spaces Natural gas water heater insulation Water pipe insulation Strategic air and duct leakage sealing Natural Gas Heating Systems Repair of defective or inoperable heating systems 173 LEADERS OF THE PACK © ACEEE Replacement of systems that cannot be repaired. High efficiency equipment is installed when possible. Natural Gas Water Heaters Repair of defective or inoperable domestic hot water systems Chimney lining when water heater is orphaned due to high efficiency equipment upgrade Repair of water leaks Replacement of systems that cannot be repaired Replacement of systems that cannot achieve acceptable draft when heating systems are upgraded. Energy efficient showerheads Ventilation of homes that are tightened at or below the building tightness limit (BTL) through proper air sealing and insulation. Repair of natural gas cook stoves that are producing high levels of carbon monoxide. Columbia provides lists of potentially eligible customers with normalized annual consumption to implementation contractors. These contractors provide a comprehensive diagnostic home energy inspection to determine what EEMs should be installed. The inspection process integrates combustion analysis, draft testing, and combustion appliance zone tests to determine that combustion equipment is operating safely and efficiently. Air leakage testing is performed using a blower door. Insulation levels are determined through visual inspection and the use of infrared thermography. Data collected during the inspection process is entered into the contractor information management system for tracking purposes and to create and issue comprehensive work orders for sub-contractors. After the inspection, sub-contractors install eligible energy efficiency measures and retest each home using the same technology used during the initial inspection process. Final inspections of work quality are completed on each household by program implementer personnel to verify installation of eligible measures and to verify the diagnostic test results. Columbia personnel perform Quality Assurance inspections of strategically -selected homes in order to identify continuous improvement opportunities for the program. The delivery approach frequently cost-shares weatherization services with the federal lowincome weatherization assistance program (WAP) and uses the same weatherization subcontractors as WAP to install the energy efficiency measures. WarmChoice uses Ohio’s WAP weatherization program standards for the inspection, installation, and quality assurance process, which Columbia helped to develop. Implementation contractors and subcontractors are reimbursed for program services based on a fee-for-service schedule. The data that is collected is used in the program evaluation process. Program services are provided at no cost to eligible households. Rental properties are eligible for the program. Unless also income eligible for the program, landlords must fund heating unit replacements. A rebate of $750 is available toward the replacement of the 174 LEADERS OF THE PACK heating unit if the landlord is not income eligible, but remaining program measures are provided at no cost. WarmChoice was established in 1987 as an outgrowth of Columbia Gas of Ohio’s lowincome Residential Conservation Service energy audit program offered from 1983-1985 and its low-cost weatherization program offered from 1985-1987. WarmChoice celebrated its 25th (silver) anniversary in 2012.Columbia and its implementation contractors learned from the company’s first two low-income programs that whole house weatherization would have a much greater impact on energy usage and bills of low-income households. Billing analysis based evaluations of Ohio’s Home Weatherization Assistance Program (HWAP) showed the need to focus more on insulation, effective air sealing of bypasses, and replacement of defective heating systems. WarmChoice was one of the first utility weatherization programs in the nation to partner with the low-income community-based organization weatherization network to provide services. While WarmChoice was originally designed as a stand-alone service, in 1994 the program experimented with a cost-share (also referred to as “combo” or “piggyback”) approach in which the program could share resources with Ohio’s HWAP Program. Because of the similarity in EEMs and the eligible customer base, this model could easily be used by other utility programs in Ohio or throughout the nation to collaborate with the WAP or the low-income weatherization provider network. Dayton Power and Light and other utilities around the nation have used the WarmChoice fee-for-service schedule as a model for their own energy conservation programs. WarmChoice was one of the first weatherization programs in the nation to require combustion efficiency testing, blower door testing, and infrared thermography inspections of completed insulation and air sealing work. The program was among the first to allow installation of high-efficiency heating systems as part of the program design. The adoption of these technologies led to improved services to customers, and higher natural gas savings. WarmChoice has been heavily evaluated to determine program effectiveness. Between 1991 and 2003, the program had 14 evaluations completed. In 2004, Columbia worked with Michael Blasnik to automate the impact evaluation process. This process uses the Princeton Scorekeeping Method (PRISM) approach to billing analysis using customer usage data with matched comparison groups to determine both gross and net savings. Program Performance The Program has a long history of superlative natural gas savings for customers, averaging approximately 320 ccf/home/year. Program spending actual (per year, most recent 3 years): Year Program Spending 2010 $ 7,156,269 2011 $ 7,007,278 2012 $ 9,750,921 175 LEADERS OF THE PACK © ACEEE Program savings (per year, most recent 3 years); (please indicate if these are net or gross savings. If both net and gross savings estimates are available, please provide both.): Year Gross ccf savings Net ccf savings Actual/Projected 2010 538,308 525,716 Actual 2011 540,160 Projected 2012 656,640 Projected Number of participants (per year, most recent 3 years): Year Households Served 2010 1,574 2011 1,688 2012 2,052 Evaluation reports are available from 2000-2010, and a sample evaluation reports for program years 2007, 2009 and 2010. Cost effectiveness: Utility Cost Test (UCT) $ 1.06 Total Resource Cost Test (TRC) $ 1.11 Lifetime cost of conserved energy (CCE) $ 1.20 Lessons Learned Using the Ohio WAP network to deliver program services reduced program start up and training costs, allowing the program to focus on quality assurance. Participating households begin to pay down past debt and/or avoid accumulating new debt. Energy savings persist over time, resulting in a long-term flow of program impacts. According to a WarmChoice persistence of savings study, homes served between 1990 and 2000 showed no deterioration in savings over the 11-year post-treatment years. Program savings improved over time due to on-going quality ssurance and evaluation efforts. Integration of combustion efficiency and safety testing, blower door testing, and infrared thermography improved program savings. Attic and sidewall insulation, air sealing and high efficiency furnaces provide the greatest natural gas savings. Homes treated by both WarmChoice and HWAP outperformed homes treated by either program individually by 2.5% and 19.2%, respectively. 176 LEADERS OF THE PACK Natural gas savings improved over time (13% in 1990 versus 29% in 2010); while preProgram normalized annual consumption (NAC) declined over the same period. Blower doors are an effective tool to measure pre and post treatment air leakage; air leakage levels were reduced from an average of 4350 CFM50pre to 2780 CFM50post. Pre-treatment normalized annual consumption is correlated with natural gas savings. Targeting higher usage households results in higher savings. The WarmChoice approach continues to deliver among the highest natural gas savings in the nation on a consistent basis for Columbia’s low-income customers. Over the past 10 years, savings per customer per year have averaged over 320 ccfs of natural gas. Program at a Glance Program Name: WarmChoice Targeted Customer Segment: Low-income Households, <=150% FPG Program Start Date: September 1987 Annual Energy Savings Achieved: Approximately 320 ccf/year/household, or 525,716 first year savings for 2010. Peak Demand (Summer) Savings Achieved: Electricity savings not measured Other Measures of Program Results to Date: $132MM invested; 57,539 low-income households served; ~50% of homes receive a replacement heating system due to health and safety reasons; 1,856,980 tons of CO2 avoided over the life of the measures in the program to date Budget for most recent year (and next budget cycle if available): 2012 Budget: $12,072,254 2013 Budget: $12,343,422 Funding Sources (name and description): Rate Case provides $7.1MM in funding annually, the Company’s DSM Rider provides approximately an additional $5MM+ annually through 2016. Website: www.columbiagasohio.com/WarmChoice Best Person to Contact for Information about the Program: Name Adrian Andrews Position Team Leader, WarmChoice Organization Columbia Gas of Ohio Phone number 614-460-4783 Email address [email protected] 177 LEADERS OF THE PACK © ACEEE RESIDENTIAL NATURAL GAS — EXEMPLARY VERMONT GAS SYSTEMS RESIDENTIAL EQUIPMENT REPLACEMENT PROGRAM VERMONT GAS SYSTEMS, INC., PROGRAM ADMINISTRATOR AND IMPLEMENTER Program Overview The Vermont Gas Residential Equipment Replacement Program is designed to encourage customers to purchase and install water and space heating equipment that exceeds both the current standards established by the National Appliance Energy Conservation Act (NAECA), and the de facto baselines in the region, IECC/DOE minimum efficiency guidelines, the Vermont Residential Building Standard and the Vermont Efficiency Appliance standards. These replacements typically occur when equipment has failed and can no longer be repaired, or has reached the end of its useful life; or when the fuel source for heating a home is being switched to natural gas. All Vermont Gas Systems residential customers, new and existing, who are replacing failed or end-of-life space and/or water heating equipment with new natural gas-fired equipment are eligible to participate. Customers receive cash rebates to offset some of the average incremental cost of purchasing and installing high-efficiency equipment. The simple payback on the customer's portion of the incremental cost will vary depending on the usage and equipment chosen. Fixed rebates have been established for equipment that has a societal benefit-to-cost ratio greater than one across a wide band of usage levels. Custom screenings are done for larger or staged heating systems that may be appropriate in applications where a single high-efficiency system cannot meet the load requirements. Incentives are provided based upon the Fixed Rebate Schedule table below: 178 LEADERS OF THE PACK Eligible Equipment (must be purchased new) Required Efficiency (as listed in GAMA) Rebate Hot Air Furnace 90% to 92% AFUE $100.00 Hot Air Furnace 92.1% to 93.9% AFUE $300.00 Hot Air Furnace 94%+ AFUE $400.00 Hot Water Boiler 87% to 91.9% AFUE $400.00 Hot Water Boiler (with outdoor air reset) 92%+ AFUE $600.00 Steam Boiler 82%+ AFUE $150.00 Water Heater 40/50 gal. .62 EF $100.00 Tankless Water Heater .82+ EF $100.00 Indirect-Fired Storage Tank Heated by 87+% AFUE boiler $100.00 Drain Water Heat Recovery Call for details $200.00 During Calendar year 2010, VGS provided $100 additional rebates for the highest tier furnaces, boilers, and tankless water heaters utilizing ARRA stimulus funds that were allocated to Vermont’s State Energy Program. The program has been offered to this customer group since December of 1992. Since then the program has continued to evolve with the addition of equipment financing for up to $10,000 in reduced-interest loans offered through a local credit union. The interest rates for these loans are bought down to zero, two, or four percent depending on the term. To qualify for this financing, a customer must have an older furnace or boiler which is near or at end of life and may have been red tagged by the VGS Service department for safety reasons. This financing is also extended to customers who are newly converting to natural gas. As mentioned above, Vermont Gas introduced supplemental $100 rebates for the highest tier efficiency furnaces, boilers, and tankless water heaters utilizing ARRA stimulus funds in 2010. This initiative resulted in higher participation rates for these tiers while the funds were available. Customers who had been waiting to install equipment were spurred to move forward with the additional rebate offerings and federal tax credits. Program Performance Vermont Gas has been successful in maintaining a consistent participation for this program by encouraging contractors and Vt. Gas service technicians to alert VGS customers that the program exists to encourage customers to install the highest efficiency equipment when making a long term decision to replace their hot water and heating equipment. They also encourage customers who participate in our Home Retrofit program to consider replacing inefficient or end of life equipment when they are considering upgrades to the thermal envelope of their home. Participant counts can include customers who may have installed more than one energy efficient appliance in the same home at different times of the year. 179 LEADERS OF THE PACK © ACEEE The net savings totals are based upon prescriptive savings assumptions for each of the pieces of equipment that were installed by the customer. Program spending Program savings (net Mcf) Participants 2011 $565,004 14,331 1,525 2010 $721,799 17,553 1,932 2009 $578,694 18,296 1,660 Recently released CY performance for 2012 indicates that 1,484 customers installed equipment that is expected to yield 13,564 annualized Mcf savings. Program costs were $614,000. Higher costs and lower savings for the program are indicative to a very mature program that adopts adjustments to higher efficiency baselines and the fact that in this past year customers opted to install equipment that rebates their efforts at the highest tier of the incentive schedule above. Vermont Gas Systems plans to revisit two areas on the incentive grid in the coming year to determine if incentive offerings for the 90 to 93.9% furnace market is truly transformed. Participation in this market continues to decrease as participation in the 94%+ furnace market continues to steadily increase. They will also explore providing incentives for the installation of .65+ EF tank style water heaters. Availability of such water heaters to wholesalers in their service territory has been very limited over the past two years. Formal evaluation has not been undertaken in the past five years. As of these edits, a final report of the Impact Evaluation study of the Residential Equipment Replacement and Residential Retrofit programs is scheduled to be released by our State regulators. Year8 Mcf9 Avg Lifetime 10 Lifetime savings11 Avg Cost per therm12 Lifetime Cost Savings13 2011 14,331 20 286,620 $ 1.38 $394,532 2010 17,553 19 333,507 $ 1.36 $452,969 2009 18,296 21 384,216 $ 1.40 $538,940 Calendar Year (Jan 1st to Dec 31st of reported year) Savings by program by calendar year 10 Average weighted lifetime by program by calendar year by end use for all measures reported 11 Lifetime Savings = Mcf savings [2]*Average Weighted lifetime [3] 12 The average cost per therm as reported by Vermont Gas Systems by residential or commercial in the reported Calendar Year 13 The cost savings = lifetime savings [4]* average rate [5] 8 9Mcf 180 LEADERS OF THE PACK Total Costs 16 Utility B/C17 Includes externalities Utility B/C (no externalities)18 Total Costs B/C19 Includes externalities Total Costs B/C 20 (no ext.) $565,004 $580,094 8.3 5.0 8.1 4.8 2010 $721,799 $740,089 7.7 4.6 7.5 4.5 2009 $578,694 $578,694 10.5 6.3 10.5 6.3 Year14 Utility Spending15 2011 Lessons Learned Vermont Gas Systems Residential Equipment Replacement Program has provided a consistent message encouraging high efficiency replacements to contractors, homeowners, and wholesalers without interruption over an eighteen year period. This has allowed the local market to view high efficiency not as a brief trend, but as a technology that has the backing of the largest area energy provider and one that is here to stay. Local contractors frequently use VGS' rebates as a sales tool, helping them to up-sell more costly equipment, despite the fact that rebate amounts have gradually decreased with time as high efficiency equipment has gained greater market acceptance. Many contractors report that they now offer high efficiency furnaces and boilers as their standard offering, raising awareness of homeowners and putting pressure on competing contractors to follow suit. Over time, VGS has simplified the rebate process by eliminating the requirement of an application form but still providing a courtesy inspection of the new equipment by a service technician at no cost to the customer. The success of the Equipment Replacement program has been supported by Vermont Gas' eighteen year history of successful delivery of residential new construction and retrofit programs. In order to meet the efficiency standards required for rebates in the new construction area, virtually all natural gas furnaces used in new construction are 90+% AFUE, and typical boiler efficiencies have increased from AFUE's in the low 80%'s to current standards of 87% or better. For the retrofit program, customers are encouraged as Calendar Year (Jan 1st to Dec 31st of reported year) The Utility Costs is all utility dollars spent by program by calendar year (does not include customer costs) 16 Total Costs is the Utility Savings [7] + customer costs (implementation costs minus rebates) 17 Utility Costs [7] Benefit to Cost ratio includes savings to society and energy benefit using avoided costs model as approved by PSB 18 Utility Costs [7] Benefit to Cost ratio without externalities or energy benefit using avoided cost model as approved by PSB 19 Total Costs [8] Benefit to Cost ratio includes savings to society and energy benefit using avoided costs model as approved by PSB 20 Total Costs [8] Benefit to Cost ratio without externalities or energy benefit using avoided cost model as approved by PSB 14 15 181 LEADERS OF THE PACK © ACEEE part of a comprehensive incentive package to install high efficiency equipment while undertaking insulation and air sealing measures to improve the home’s building envelope. This program has proven to be very popular with customers and contractors alike. Especially after the introduction of low interest financing, this financing helped customers move forward with installations when faced with planned or unplanned/emergency replacements. This tool enabled customers the ability to choose high efficiency equipment as the best replacement to install in their home. Program at a Glance Program name Vermont Gas Systems Residential Equipment Replacement Program Targeted Customer Segment New and existing residential Vermont Gas customers Program Start Date December 1992 Annual Energy Savings Achieved 148,640 Annualized Mcf since 1993 Peak Demand (Summer) Savings Achieved: 1,262 Peak day Mcf since 1993 Other Measures of Program Results to Date: 2,738,817 Lifetime savings since 1993 Budget for most recent year (and next budget cycle if available): 2011 CY projected: $460,510 2012 FY projected: $426,504 Funding Sources (name and description): Recovered entirely from rates Website: http://www.vermontgas.com/efficiency_programs/res_programs.h tml Best Person to Contact for Information about the Program: Name Scott Harrington Position Energy Services Manager Organization Vermont Gas System, Inc. Phone number 802-951-0372 Email address [email protected] RESIDENTIAL LOW INCOME EFFICIENCY VERMONT COMPREHENSIVE LOW INCOME SERVICES EFFICIENCY VERMONT, PROGRAM ADMINISTRATOR VERMONT ENERGY INVESTMENT CORPORATION, IMPLEMENTER 182 LEADERS OF THE PACK Program Overview The Vermont Energy Investment Corporation (VEIC) has been delivering low income energy efficiency initiatives to Vermonters for over 25 years, including implementing Efficiency Vermont programs since 2000. Their strategy to serve low income households has two main components: The first component is the leveraging of partnerships with non-profit service providers who have developed trusted relationships with low income households. The strength of these relationships is the foundation of their success, and includes: affordable housing providers, funders, and developers; Weatherization Assistance Providers; and the Vermont Foodbank. Efficiency Vermont has a high level of engagement with the architects, engineers, and contractors who serve the affordable housing community. The second component is implementing a range of initiatives that reach as many low income households as possible, address a variety of needs, and achieve Efficiency Vermont budget and performance obligations. In 2011, the five distinct initiatives comprising Efficiency Vermont’s low income services contributed to comprehensive services to 3,450 households and reached an additional estimated 86,000 additional households with efficient products. In total, Efficiency Vermont’s programs were designed and implemented to reach over 85% of households earning less than 80% of median income. Efficiency Vermont’s low income services budget for the 2009-2011 contract period included $7,500,000 for electrical efficiency measures and $1,050,000 for thermal measures (heating and process fuels) for a total of $8,550,000. 1. Multifamily New Construction and Major Rehabilitation Program (NCMR): VEIC originated the Multifamily NCMR in 1998, as a pilot for the Efficiency Vermont energy efficiency utility. Over the past 15 years, the program has developed strong, trustbased relationships with a state-wide assortment of affordable housing providers, funders, architects, engineers, and contractors to significantly raise the energy performance of Vermont’s affordable apartments. The foundation of the direct program activities includes a high-touch customer service approach, where Efficiency Vermont’s Energy Consultants collaborate with the project participants to: identify the customer’s energy goals for the project; recommend specific energy measures and design options to attain these goals; provide energy and cash flow analysis of measures; conduct plan and specification review; provide contractor engagement and training; perform interim and final site inspections and performance testing; ENERGY STAR certification; and finally, a per- unit financial incentive. In 2011, virtually 100% of Vermont’s NCMR affordable housing projects (approximately 300 units) were ENERGY STAR labeled and included 100% ENERGY STAR lighting, appliances, and heating equipment. Many projects exceeded program minimums by including high performance thermal envelopes, windows, air sealing, and solar hot water systems. 183 LEADERS OF THE PACK © ACEEE The success of this comprehensive service is reflective of Efficiency Vermont’s long term multi-faceted approach which engages complicated layers of project players, horizontally and vertically. Critical aspects include positioning energy efficiency measures to support the mission of the non-profit housing partners to deliver affordable housing, providing well-reasoned engineering analysis of benefits, strategic partnering with housing funders to incorporate Efficiency Vermont’s requirements in their underwriting criteria; and positioning Efficiency Vermont to design and construction teams as a project funder, with specific funding requirements, rather than an ‘energy program’ with voluntary metrics. 2. Weatherization Assistance Program (WAP) Add-On Started at the origination of Efficiency Vermont in 2000, the program provides funding and technical assistance to the State’s five WAP agencies to install electrical efficiency measures in their thermal retrofit projects. The program ‘adds-on’ to the core WAP thermal shell services, including retrofit to: ENERGY STAR qualified refrigerators; ENERGY STAR qualified clothes washers; lighting; ventilation fans; and smart power strips. Customers see the service as a single, seamless, and comprehensive approach to reducing energy consumption, delivered through a single trusted source (WAP implementation crews). In 2011, the WAP Add-On program served approximately 1,500 households. 3. Vermont Foodbank In 2009, Efficiency Vermont initiated a partnership with the Vermont Foodbank to distribute CFL’s to the State’s most vulnerable population. The program is successful due to the Foodbank’s central warehouse and distribution system, which operates in a similar fashion to a grocery chain store: two warehouse / distribution centers supply food and other necessities to partner agencies. This allowed VEIC to solicit bids from manufacturers for low-cost, high quality and high volumes (pallets) of CFL’s. The distribution system enabled products to be shipped directly from the manufacturer to the Foodbank and moved efficiently to the 280 partner food shelves and pantries across the state through their existing distribution network, including identifying and distributing products to locations where the demand is greatest or the need is highest. The food shelves and pantries are set up like a small retail store, with the clientele using shopping baskets and carts to select their items. Many of these food shelves have limits on the quantity of any individual item that can be taken, and they all have signage advising the clientele to take only what they need and can use. Due to the integration of the bulbs into the Foodbank’s product mix, Efficiency Vermont’s CFL promotion is effectively just another item on the shelf. This integration grounds the success of this program in that the bulbs distributed are only going to those individuals who can really use them. In 2011 the Foodbank served 86,000 households and distributed over 250,000 CFL’s. 4. Vermont Fuel Efficiency Partnership (VFEP) VFEP utilizes a collaboration of energy efficiency funding sources to incentivize “deep energy retrofits” in affordable multi-family housing statewide. The program provides technical assistance including: audits and analysis; project specifications; bid documentation; and project management. VFEP coordinates funding from a combination of sources including Efficiency Vermont’s Heating and Process Fuels funds, Weatherization 184 LEADERS OF THE PACK Assistance Programs, Regional Greenhouse Gas Initiative revenues, federal Energy Efficiency and Conservation Block Grants, ARRA funds, and others. Efficiency Vermont provides technical assistance, engineering analysis, and program funding to VFEP. VFEP provided comprehensive electrical and thermal improvements to 1,066 apartments between 2009 and 2011; Efficiency Vermont’s thermal efficiency program funding supported energy retrofits to 234 units in 2011. VFEP projects an average 45% reduction in energy consumption. 5. Major Appliance Rehabilitation Service (MARS) MARS originated in 2011 to deliver the suite of electrical efficiency retrofit services, offered by the WAP Add-On program, to non-WAP eligible households. The MARS program could serve households earning up to 80% of median income, compared with the 60% required of WAP. Additionally, where the Add-on program began in 2000 and the WAP program cannot revisit projects served after 1994, MARS is able to serve WAP households that were not originally served by the Add-on program. MARS was implemented through Efficiency Vermont’s partnership with the WAP agencies. In 2011, the MARS program served 529 households, resulting in 620 MWh of savings. The average savings per household was approximately 1,200 kWh, representing $190 per year, or 15% of annual electricity usage. Program Performance Efficiency Vermont’s entire portfolio of residential, multifamily, and commercial programs are verified annually by the Vermont Department of Public Service. The verification process includes performance metrics such as those in the table below. 2009 Total Spending 2010 2011 $1,740,719 $1,892,292 $3,510,354 Total kWh Savings Gross 3,221,695 4,941,686 6,472,843 Net 3,704,374 5,993,318 8,156,727 Total MMBtu Savings Gross 4,856 4,490 6,523 Net 4,821 4,403 6,510 3,460 4,242 3,835 Participants, Comprehensive Foodbank CFL Distribution: 21,359 47,784 255,253 Outside of the annual audit, there has not been an impact evaluation specifically on the low income programs. The Low Income Portfolio Program is cost effective under multiple benefit-cost tests, as shown in the table below: 185 LEADERS OF THE PACK © ACEEE Efficiency(EVT) Vermont Income Portfolio Program Performance21 Efficiency Vermont Low Low Income Program Utility Cost Test Lifetime Avoided Electric Costs, Energy and Capacity Total Program Costs 2009 $2,893,509 $1,740,719 2010 $3,834,143 $1,892,292 2011 $4,597,122 $3,510,354 Net Benefit: Benefit -Cost Ratio: $1,152,790 1.66 2009 $2,893,509 $876,275 $427,329 $824,800 $1,941,851 2.03 2010 $3,834,143 $1,554,655 $355,069 $1,914,500 $1,086,768 1.31 2011 $4,597,122 $1,893,592 $560,371 $2,963,231 Total Program Costs Participant Costs Third Party Costs $1,740,719 $624,395 $64,845 $1,892,292 $1,030,294 $22,350 $3,510,354 $394,766 $45,173 Net Benefit: Benefit -Cost Ratio: $2,591,954 2.07 2009 $1,740,719 42,483,584 $0.04 2009 $1,740,719 3,221,695 3,704,374 4,856 4,821 $4,713,430 2.60 2010 $1,892,292 63,474,936 $0.03 2010 $1,892,292 4,941,686 5,993,318 4,490 4,403 $6,064,023 2.54 2011 $3,510,354 73,464,344 $0.05 2011 $3,510,354 6,472,843 8,156,727 6,523 6,510 3,460 6,509 9,969 4,242 16,538 20,780 3,835 25,449 29,284 Total Resource Cost Lifetime Avoided Electric Costs, Energy and Capacity Lifetime Fossil Fuel Savings Lifetime Water Savings Lifetime O&M Savings Lifetime Cost/kWh: Total Program Costs Total Lifetime kWh Savings Cost per Lifetime kwh Savings Additional Data: (Section 5, Program Performance) Total Program Costs Total Gross kWh Savings Total Net kWh Savings Total Gross MMBtu Savings Total Net MMBtu Savings Low Income Participation (non-Foodbank) Foodbank Participation Total Participants Inflation Rates: 2009 to 2010 2009 to 2011 1.020 1.051 Lessons Learned Partnerships: Through partnerships with existing organizations serving Vermont’s low income population, Efficiency Vermont was able to leverage: o Pre-existing trust-based relationships between current programs and target customers o Access to qualified customers o The implementation resources of current programs Total Program Costs include Operating Costs, Incentive Costs and Technical. Inflation Rates are used to inflate Benefits (Avoided Cost of Electricity, Fossil Fuel savings, Water savings, O&M savings) all reported in 2009 $ in the Efficiency Vermont Annual Report. 21 186 LEADERS OF THE PACK Mission Alignment: To build and strengthen partnerships, research and align missions with partner organizations. Efficiency programs which can directly support the mission of program partners are the most successful. Program Portfolio: To reach broad based markets such as low income, offering a portfolio of services supports the broadest possible customer participation. The portfolio approach ensures customers have multiple opportunities to learn about and implement energy efficiency measures. Comprehensive Education: Educating end use customers is a critical component in developing demand and understanding of energy efficiency improvements. However, when program success is reliant on partnerships, comprehensive education must be provided to the supply chain as well (in the case of Efficiency Vermont’s Low Income portfolio: Foodbank staff, affordable housing advocates, housing managers, project design teams and contractors). Partnerships Create Advocates: When Efficiency Vermont’s partners wanted to install measures which did not pass Vermont’s cost effectiveness screening threshold, they became advocates petitioning the Vermont Public Service Board for adjustments to the State screening tool. The results included a 15% non-energy benefit adder for all projects, an additional 15% non-energy benefit adder for low income projects, and an adjustment to the discount rate. These adjustments allow Efficiency Vermont to support its partners in implementing deeper measures in low income projects. Their partners’ advocacy from their position of third party low income advocates was a strong voice which was well received by Vermont’s regulators. Program at a Glance Program name Efficiency Vermont Comprehensive Low Income Initiative Targeted Customer Segment Households earning < 80% median income Program Start Date 1998 Annual Energy Savings Achieved 2011: 8,156,727 Net KWh; 6,510 Net MMBtu Peak Demand (Summer) Savings Achieved: 2011, Gross: 210KW; Net: 229KW Other Measures of Program Results to Date: From 20092011, Efficiency Vermont’s portfolio of programs has comprehensively reached over 11,500 households, and additionally provided over 255,000 CFLs to low income households. Cumulatively, we have affected a significant proportion of Vermont’s 99,000 households earning less than 80% of median income. Virtually all rent restricted multifamily major renovation or new construction project participate in Efficiency Vermont’s programs. Working partnerships have created public advocates for energy efficiency generally, and Efficiency Vermont’s work specifically. Budget for most recent year (and next budget cycle if available): 2013: $2,720,000 ($2,000,000 Electrical + $720,000 Thermal) Funding Sources (name and description): Vermont Electric Systems Benefit Charge 187 LEADERS OF THE PACK © ACEEE Northeast Regional Greenhouse Gas Initiative Forward Capacity Market Website: www.efficiencyvermont.com www.veic.org Best Person to Contact for Information about the Program: Name Neil Curtis Position Strategic Planning, Low Income, Small Business, and Multifamily Organization Vermont Energy Investment Corporation Phone number 802-540-7612 Email address [email protected] RESIDENTIAL LOW INCOME — EXEMPLARY LOW INCOME RETROFIT PROGRAM NATIONAL GRID MASSACHUSETTS, PROGRAM ADMINISTRATOR ACTION INC., GLOUCESTER, MASSACHUSETTS, LEAD IMPLEMENTER Program Overview National Grid offers a variety of end uses and measures to its low income customers through the Low Income Retrofit Program, targeting residential electric and gas customers at 60% or below state median income. End uses addressed in all homes and buildings are lighting, appliances, weatherization, heating systems, controls, domestic hot water, and HVAC/mechanical systems. Eligible measures under the Low Income Retrofit Program, which are directly installed at no charge to the low-income customer include: comprehensive energy assessment, including customer education weatherization, including wall, attic, floor, and pipe and duct insulation, as well as air sealing (caulking, weather stripping, door and window hardware, window parting beads and stops), programmable thermostats blower door analysis heating system tune-up, repair, and replacement low-flow showerheads and faucet aerators minor building repairs, including glass replacement and adjustment of window meeting rails replacement of inefficient appliances, including refrigerators and clothes washers 188 LEADERS OF THE PACK installation of compact fluorescent lamps (CFLs) and LEDs (in some applications) health and safety measures such as wire inspection, ventilation, and the DOE leadfree protocol multi-family-building-specific measures, such as common area lighting fixtures, HVAC motors and controls and heating systems These are provided within a collaborative organizational and institutional framework. Action Inc. oversees the day to day operations, including scheduling, assessing and installing eligible measures in income eligible customers’ homes and buildings. In addition, Action Inc. leverages other federal and state funding sources to provide the most comprehensive energy efficiency projects possible. Action Inc. works primarily to offer cost effective energy saving projects in our territory. National Grid also collaborates with the other Massachusetts Program Administrators (PAs), consisting of seven other Massachusetts utilities and one energy efficiency service provider in Massachusetts. This collaboration provides customers in dual territories with comprehensive fuel-blind assessments and offerings to eligible customers across the Commonwealth, comprising a consistent statewide low income program. A statewide low income multi-family advisory committee reviews multi-family projects and distributes eligible facilities to each PA and their implementation vendors. The Massachusetts Low Income Energy Affordability Network (LEAN) coordinates with the PAs in a statewide best practices working group, in order to design and monitor best practices and new technologies to benefit customers who participate in the Program. Most important, LEAN provides implementation services of all publicly funded energy efficiency programs in the state. The delivery approach for this program is a comprehensive whole house/whole building assessment and measure implementation, all done with oversight by Action Inc. and its subcontractors. The delivery processes for the single family or “1-4” (one to four units) low income subsector and the multi-family low income subsector differ. For single family, the Low-Income Retrofit Program implements cost-effective, energy efficiency products and services directly for residential customers living in 1 to 4 unit dwellings in which at least 50 percent of the occupants are at or below 60 percent of the state median income level. The initiative leverages all applicable revenue streams and piggybacks on current DHCD Weatherization Assistance Program (WAP), consistent with a comprehensive, whole house approach. This initiative has no customer co-payment required. Once customers are deemed eligible, they receive an in-home energy assessment from their local CAP agency. The assessment evaluates the building shell, efficiency and appliance conditions, and home health and safety. The CAP agency, on behalf of National Grid and any other leveraged programs, arranges installation of measures by a qualified contractor. Additionally, about a third of Massachusetts low-income homes are heated by oil. Weatherization of these homes, as well as those heated by other non-utility fuels (mainly propane and wood) is funded using electric PA funds and leverages DOE funding. Thus, the single family program operates in a fuel-neutral manner. All applicable revenue 189 LEADERS OF THE PACK © ACEEE streams available for energy efficiency upgrades are leveraged to enhance services consistent with a whole-house approach. On behalf of the Program, the agencies perform 100 percent post-installation quality assurance inspection of projects to ensure that all work is performed in accordance with program guidelines. The agencies also perform a minimum of 50 percent in-process inspection of projects. National Grid employs an independent third-party vendor to perform quality assurance inspections for an additional degree of quality control. The primary form of energy efficiency education is verbal communication between the auditor and the client along with leave-behind materials. The Low Income Multi-Family (LIMF) Initiative services properties that have five or more units in which at least 50 percent of the occupants are at or below 60 percent of the state median income level. The LIMF initiative leverages all applicable revenue streams and provides cost-effective, residential energy efficiency improvements benefitting income-eligible occupants and owners of multi-family buildings. Energy efficiency products and services are implemented directly in the dwellings units as well as common area space. National Grid provides up to 100 percent of the cost-effective project costs. National Grid collaborates with other PAs in Massachusetts to provide whole building, comprehensive services, technologies, and measure offerings. Eligibility for LIMF measures and services is based on a cost-effectiveness test, which includes agreed upon non-energy benefits, and is not restricted by the rate class associated with the gas or electric meters in the buildings. Projects receive efficiency upgrades for buildings with high energy consumption while requiring that applicants participate in benchmarking of their building’s energy usage post-improvements. National Grid and the other PAs with LEAN, a Multi-Family Advisory Committee, DHCD, lead low income vendors, and CAP agencies to coordinate statewide on all aspects of the Low Income Multi-Family initiative, including planning, delivery, implementation, education, marketing, training, cost-effectiveness, evaluation, and quality assurance. The initiative is designed to ensure participants are provided with a “whole building”, fully integrated offering, targeting both gas and electric end use. Once a property is determined to be eligible, Action Inc. or one of its subcontractors conducts a no cost energy assessment. The assessment evaluates the building shell, efficiency and appliance conditions, as well as home health and safety. Action Inc. screens each project for cost effectiveness and then arranges, with approval of the customer, for all measures to be installed by qualified contractors. Action Inc. also provides quality control inspections on behalf of National Grid for every project. National Grid’s Electric Low Income Programs began in the early 1990’s, Beginning in 1994, the predecessor companies (Massachusetts Electric and Boston Gas Company) that eventually comprised National Grid, in collaboration with Action Inc., designed, piloted and eventually received statewide legislative action and Department of Public Utilities 190 LEADERS OF THE PACK approval for what now is a statewide all-utility run efficiency low income program. Ultimately, National Grid’s gas and electric low income programs became a model used by the other Program Administrators in Massachusetts when subsequently designing their low income programs. This program leverages federal Department of Energy (DOE) and Health and Human Services (HHS) funding and is operated through local Community Action Program (CAP) network. Action Inc. continues to provide all lead vendor management services for National Grid’s Low Income Retrofit Program, both gas and electric in Massachusetts. In 2008, the Governor of Massachusetts signed the Green Communities Act22. Designed to promote enhanced energy efficiency throughout the Commonwealth, the Green Communities Act requires gas and electric distribution companies and municipal aggregators (together referred to as Program Administrators or PAs) to develop energy efficiency plans that will provide for the acquisition of all available energy efficiency and demand reduction resources that are cost effective or less expensive than supply23. In addition, the Act required that at least 10% of electric energy-efficiency program funds and at least 20% of gas energy-efficiency program funds be spent on comprehensive, low income residential demand-side management (DSM) and education programs. As part of the Green Communities Act, National Grid and the other PAs designed and implemented a three year statewide energy efficiency plan (2010-2012). As part of the new plan, the PAs continued to manage their income eligible programs, using the long standing collaboration with LEAN (Low Income Energy Affordability Network) to implement the Low Income 1-4 family program. The new plan stated there would be a joint PA, statewide Multi-Family Low Income program. As of 2010, all PAs in the state, including National Grid, collaborate with LEAN as a statewide working group, to develop and implement a common process for multi-family low income properties across Massachusetts. As a result of efforts with LEAN, all eligible properties are benchmarked based on energy usage and reviewed by a statewide low income multi-family advisory committee, comprised of LEAN, Community Development Corporations, Department of Housing and Community Development (DHCD), and other non-profit owners of low income non-institutional multi-family housing, and Public Housing Authorities. The Committee is tasked with prioritizing low income multi-family projects for each PA. The Advisory Committee applies a degree of flexibility when prioritizing projects in order to accommodate unique needs of PAs and customers or potential participants. Under contract with National Grid to provide all low income retrofit implementation services, Action Inc. coordinates and implements measures at each multi-family project, including both gas and electric measures, as well as coordination with other PAs, when a building is located in shared electric and gas territories. 22 23 Massachusetts Green Communities Act of 2008 (G.L. c. 25, sec. 19(c) St. 2008, c. 169, sec. 11) http://www.ma-eeac.org/docs/DPU-filing/ElectricPlanFinalOct09.pdf 191 LEADERS OF THE PACK © ACEEE Program Performance Gas Program Year Spending Net Savings (Annual therms) Net Savings (lifetime therms) Participants CCE ($ per lifetime therm) LI 1 to 4 Family Retrofit 2010 $5,590,802 158,615 3,172,300 1,210 $1.76 LI Multifamily Retrofit 2010 $735,232 60,932 1,375,390 649 $0.53 LI 1 to 4 Family Retrofit 2011 $6,681,069 397,031 7,940,620 1,633 $0.84 LI Multifamily Retrofit 2011 $4,244,253 412,902 6,889,299 2,370 $0.62 LI 1 to 4 Family Retrofit 2012 * $9,645,154 482,057 9,641,140 1,967 $1.00 LI Multifamily Retrofit 2012 * $13,384,95 7 236,682 3,523,380 4,607 $3.80 Electric Program Year Spending Net Annual Savings (MWh) Net Lifetime Savings (MWh) Participants CCE ($ per lifetime kWH) Annual Peak Demand Savings (Summer KW) LI 1 to 4 Family Retrofit 2010 $7,445,762 4,102 54,597 3,669 $0.14 439 LI Multifamily Retrofit 2010 $2,828,533 2,239 38,305 3,172 $0.07 231 LI 1 to 4 Family Retrofit 2011 $9,402,303 4,730 62,183 4,318 $0.15 679 LI Multifamily Retrofit 2011 $3,095,892 2,542 40,573 4,289 $0.08 176 LI 1 to 4 Family Retrofit 2012* $14,737,385 5,745 67,441 4,877 $0.22 753 LI Multifamily Retrofit 2012* $3,799,623 3,977 56,938 5,625 $0.07 307 * 2012 results are preliminary for both Gas and Electric Programs An evaluation report for Low Income Single Family is available. A Low Income MultiFamily evaluation has not been conducted. 192 LEADERS OF THE PACK Lessons Learned Involving all appropriate sectors and stakeholders in the design and enhancements of the low income retrofit program not only brought statewide expertise to the program, it worked toward developing a one-stop, whole house, deeper retrofit program that offered benefits and energy savings to all income eligible customers throughout the Commonwealth of Massachusetts. The process established monthly Best Practices Meetings, and other relevant meetings, to discuss items such as new cost effective measures/technologies to add to programs, quality control protocols, technical staff trainings, and customer educational materials. The collaboration has proven to be successful, and will continue to be a source of stability in which to build on for future reliance of experience and talents that have the common goal of serving low income customers well. Program at a Glance Program name Low Income Retrofit Program Targeted Customer Segment Residential electric and natural gas customers at 60% or below state median income. Program Start Date 1994 Annual Energy Savings Achieved 2011 Electric - 7,272 annual MWh (net) 2011 Gas – 809,933 annual therms (net) Peak Demand (Summer) Savings Achieved: Annual Peak Demand Savings (Summer KW) 855 Other Measures of Program Results to Date: 2011 Electric participants 8,607 2011 Gas participants 4,003 Budget for most recent year (and next budget cycle if available): 2012 Electric(Single and Multi) $23,709,275 2012 Gas (Single and Multi) $17,537,083 *2013 Electric (proposed Single and Multi) $24,020,644 *2013 Gas (proposed Single and Multi) $17,790,151 Funding Sources (name and description): Electric - System Benefit Charge and Energy Efficiency Reconciliation Factor (EERF). Gas – The Energy Efficiency factor, which is a component of the Local Distribution Adjustment Factor (LDAF). Website: https://www1.nationalgridus.com/EligibleMA-MARES http://www.masssave.com/ http://leanmultifamily.org/ Best Person to Contact for Information about the Program: Name Michael Rossacci Position Senior Program Manager 193 LEADERS OF THE PACK © ACEEE Organization National Grid Phone number 781-907-1621 Email address [email protected] *pending regulatory approval. RESIDENTIAL LOW INCOME — EXEMPLARY LOW-INCOME MULTI FAMILY ENERGY RETROFITS: THE LOW-INCOME ENERGY AFFORDABILITY NETWORK (LEAN) MULTIFAMILY PROGRAM NSTAR, NATIONAL GRID, WESTERN MASSACHUSETTS ELECTRIC, UNITIL, COLUMBIA GAS, BERKSHIRE GAS, NEW ENGLAND GAS, BLACKSTONE GAS AND CAPE LIGHT COMPACT, PROGRAM ADMINISTRATORS ACTION FOR BOSTON COMMUNITY DEVELOPMENT (“ABCD”) AS LEAD VENDOR FOR NSTAR AND COLUMBIA GAS; ACTION, INC. GLOUCESTER AS LEAD VENDOR FOR NATIONAL GRID, IMPLEMENTERS Program overview The Low-Income Multi Family Energy Retrofits program is targeted at low-income multifamily properties owned by public housing authorities and non-profits in which at least 50% of the tenants have incomes at or below 60% of median income; for-profit organizations are eligible to apply for funds to improve the energy usage of their buildings. The program targets high-energy users, as determined by a benchmarking tool (WegoWise), and targets projects with opportunities to obtain cost-effective energy efficiency improvements. The program conducts building assessments to help determine cost effective energy efficiency work and provide owners information on the recommended energy efficiency upgrades. In some cases the assessments will be comprehensive audits that examine the building envelope, mechanical systems and motors, ventilation, lighting, etc. All measures that are cost-effective can be provided by the program. The program will provide grant funds for cost-effective energy efficiency work that may include: replacement or repair of heating systems and/or controls, replacement or repair of hot water heating systems, building envelope upgrades through air sealing and insulation, lighting upgrades, appliance upgrades, and ventilation upgrades. A full range of services are provided to customers, including access to the WegoWise benchmarking tool; energy audits; coordinating with the owner/manager in connection with delivery of the energy efficiency services (especially if the owner/manager is engaging in other, non-energy renovations at the same time); assigning a contractor to carry out the work (in some cases, the owner can use his own contractor, if fully qualified to do the work); and quality assurance. The program generally provides a grant that covers the full cost of the work so that the owner/manager incurs no direct costs. In some limited cases, a copay 194 LEADERS OF THE PACK is required. The LEAN Multifamily Program arose in response to concerns voiced around 2009 by a range of non-profit owners/managers (community development corporations and public housing authorities) that the existing energy efficiency programs offered by the Program Administrators had too many barriers. Property owners/managers were faced with having to apply separately to the local gas company and electric company, in order to have all needed measures addressed; sometimes had to apply to two (or more) electric companies or gas companies if their properties did not all lie within one company’s service territory; and often had to separately apply to commercial and residential programs if the building had both master meters and individual tenant meters. Moreover, program offerings and incentives varied from company to company, and many owners/managers could not afford the copays that were required. Many owners/managers found these barriers so confusing and daunting that they gave up on applying. In order to address these concerns, LEAN facilitated a series of meetings with interested multifamily stakeholders and Program Administrators, which clarified the concerns of those stakeholders and which ultimately resulted in the launching of the LEAN multifamily program. The program was launched in the summer of 2010. Between that launch and November 2011, the program served 140 projects with 7,000 individual units, and has since served several thousand additional units. The program offers building owners/managers a single point of contact through a web-based application; there is no longer the need to contact each individual utility company, even though those companies provide the financial support. Program Performance Program performance metrics demonstrate a strong track record of success, although no impact evaluations have been completed. In 2012, spending was approximately $25 million on the gas side and $25 M on the electric side. For 2011, spending was approximately $13 million on the gas side and $18 million on the electric side. 2012 annual savings were over 500,000 therms for gas and over 5 million kWh electric, down from 2011 annual savings of 700,000 therms gas and 10 million kWh electric. The number of participants per year has been correlated with spending and savings; in 2012, the program worked with 8,000 gas units and 16,000 units electric, whereas in 2011 it was 4,000 units gas and 14,000 units electric. To measure cost effectiveness, the Program Administrators generally use the “total resource cost” test; the LEAN Multifamily Program also considers benefit cost ratios. Lifetime cost of conserved energy (CCE) is $.07 according to National Gird (the data is not readily available for the other companies). CCE is highly variable on the gas side. National Grid reported $0.62 CCE ($ per lifetime therm) in 2011 and $3.80 in 2012. 195 LEADERS OF THE PACK © ACEEE Lessons Learned One key lesson learned is the importance of getting all of the interested stakeholders speaking with each other so that a program can be designed that meets the specific needs of owners/managers of affordable multifamily housing. In Massachusetts, this meant bringing together community development corporations, public housing authorities, advocates for low-income tenants, Program Administrators, and agencies that already deliver low-income energy efficiency programs. Another key lesson is the importance to owners/managers of having a single point-ofcontact or “one stop shopping”. This overcomes common barriers of having to apply to different utility companies (electric and gas); having to apply through different program “doors” (residential and commercial); and finding the array of program offerings and incentives bewildering. It was also very helpful to agree on a standard benchmarking tool (WegoWise) so that all properties can be evaluated on an equal footing and to allow the implementing organizations to prioritize the properties with the highest energy consumption per square foot. One of the challenges that must be overcome in some states is getting the utilities/Program Administrators to agree on integrating their programs so that it is possible to offer a true single point of contact. Even in Massachusetts, where this succeeded, there is still the problem that the amount of funding available, respectively, by the gas and electric companies is mismatched with the demand for energy efficiency services. Specifically, there is not enough funding on the gas side while there is fully adequate funding on the electric side. This means that in some of the multifamily properties, all of the electric efficiency needs can be meet, while not all of the gas efficiency needs may be addressed. Program at a Glance Program name LEAN Multifamily Program Targeted Customer Segment Low-income multifamily properties Program Start Date 2010 Annual Energy Savings Achieved 500,000 to 700,000 therms; 5 - 10 million kWh Peak Demand (Summer) Savings Achieved: Not readily available Other Measures of Program Results to Date: Budget for most recent year (and next budget cycle if available): $26 million Funding Sources (name and description): “Program Administrators” – all of the electric and gas distribution companies and the Cape Light Compact Website: http://leanmultifamily.org/ Best Person to Contact for Information about the 196 LEADERS OF THE PACK Program: Name John Wells Position Vice President for Property Services Organization Action for Boston Community Development Phone number 617 348-6410 Email address [email protected] MULTIFAMILY — EXEMPLARY PSE&G RESIDENTIAL MULTIFAMILY HOUSING PROGRAM PUBLIC SERVICE ELECTRIC AND GAS COMPANY (PSE&G), PROGRAM ADMINISTRATOR CONCORD ENGINEERING, NEXANT, MAGRANN ASSOCIATES, AND BIRDSALL SERVICES GROUP, IMPLEMENTERS Program Overview PSE&G’s Residential Multifamily Housing Program was designed to address market barriers and obstacles which often prevent or impede affordable multifamily housing from taking advantage of energy efficiency programs. The program provides participants with cost incentives, upfront payments to eliminate the building owner’s need to secure a loan to fund the capital investment in energy efficiency upgrades before the project begins, and onbill financing for the customer share of the program costs. The customer is able to afford the energy efficiency investment, while at the same time recognizing the associated energy efficiency benefits immediately upon installation, before repayments begin. The full cost of the energy efficiency upgrades (including engineering, the energy audit and the cost of construction), are covered through a combination of PSE&G’s buy-down incentive and zeropercent on-bill repayment/financing. The PSE&G on-bill payment option is a critical component to the success of the Multifamily Program. The program is delivered using a multi-faceted approach. PSE&G program managers provide full program oversight from project inception to conclusion, including the review of program applications and energy audit results. PSE&G utilizes third party vendors hired through a competitive bid process to perform the audit, project engineering, and site inspections. Currently the vendors performing program work include: Concord Engineering, Nexant, MaGrann Associates, and Birdsall Services Group. In 2010 PSE&G began offering the Residential Multifamily Housing Program to its customers located in PSE&G’s electric and/or natural gas service territory which includes many of New Jersey’s urban areas and has a high proportion of affordable multifamily 197 LEADERS OF THE PACK © ACEEE housing. PSE&G’s Multifamily Housing Program is designed to increase energy efficiency in multifamily housing developments. PSE&G’s program addresses a specific market sector with a “whole project” approach to energy efficiency. Building owners receive a free on-site energy audit of their building(s) at no cost, incentives, and up-front financing for the cost of eligible energy efficiency installations. The program provides a three-step payment process, called “progress payments”; to eliminate the building owner’s need to secure a loan to fund the capital investment in energy efficiency upgrades before the project begins. Customers repay their share of the program installation costs over time, on their PSE&G utility bill, interest free. The program was designed so that the owner’s share of the cost of the energy efficiency upgrades should be significantly offset by the cost-savings recognized as a direct result of the energy efficiency upgrades. Program services are provided through qualified audit and engineering professionals employed by PSE&G and hired through a competitive bid process. All cost-effective energy conservation measures (ECMs) identified by the energy audit as having a simple payback of 15 years or less may be eligible for installation under the program. The energy efficiency measures recommended by the energy audit may include energy efficient lighting/CFLs, low-flow aerators/showerheads, corridor/stairwell lighting, ventilation improvements, EnergyStar refrigerators, programmable thermostats, boiler upgrade, motors/vfd’s, energy recovery, heating/cooling upgrades, and air sealing. The program will buy down project costs by seven years, but to not less than two years. Multifamily projects that are New Jersey Housing and Mortgage Finance Agency (NJHMFA) funded (having mortgages through the NJHMFA), repay their share of the program costs over a period of ten years; non-NJHMFA projects repay over a period of five years. The multifamily housing facility must have five or more units and may be either master metered or individually metered for utility services. High rise and low-rise facilities, affordable and market rate housing in PSE&G’s service territory are eligible. Program delivery typically occurs in four steps: Step One: Audit of Multifamily Building(s). PSE&G assesses the required level of ASHRAE audit to perform based on the complexity of the facility and the potential ECMs. The PSE&G sub-program contractor(s) then perform a detailed, professional audit and prepare a customized audit report that includes a list of recommended ECM upgrade options. Step Two: Engineering Analysis of Project. Based on the audit results, an engineering analysis is performed, payback and project cost effectiveness screening are conducted, and a set of approved ECMs is selected for the project. The sub-program contractor then prepares bid-ready documents for the customer to facilitate the preparation of a project Scope of Work, which will be used by the customer to obtain contractor cost estimates for ECM installation. Step Three: Scope of Work/Contractor Bids. The project owner prepares a Scope of Work for contractor bids. PSE&G and the customer review the contractor bids/costs and select the contractor(s). Once the contractor bids are received, the proposed project is again screened for cost effectiveness. At this time, the first progress payment equal to approximately 30% of the estimated total project cost can be issued to the customer to initiate the project in order to ensure that building owners are able to pay their contractors on a timely basis. Step Four: 198 LEADERS OF THE PACK Measure Installation and Inspections. PSE&G monitors the project progress, verifies equipment ordering and receipt, and monitors project cash flows. The second progress payment can be a series of smaller, multiple payments timed to match the cash flow needs of the project. In total, the multiple payments will equal approximately 50% of the total project financial commitment. When the project is 100% complete, a final project true-up and final inspection takes place. If the inspection is successful and approved, the final progress payment based on the results of project true-up is determined and issued. The final progress payment to the customer will be approximately 20% of the total project financial commitment. The project is then complete and customer repayments begin. PSE&G partnered with the NJHMFA in the design and development of its Residential Multifamily Housing Program. The collaboration grew from a roundtable discussion between the New Jersey Governor’s staff, regulators, NJHMFA, and PSE&G, to address the unique needs of multifamily affordable housing projects. PSE&G and NJMHFA left that meeting with a commitment to work together to design a program tailored to a customer segment that often has deteriorated facilities, limited cash flow, and lacks capital for infrastructure improvements. NJHMFA’s primary goal in addressing energy efficiency opportunities in their financing portfolio was to relieve the continuous upward pressure on rental rates by reducing the operating costs associated with the housing projects. The run-up in energy prices, followed by the worst recession since the great depression, had forced building owners to defer basic maintenance in order to mitigate rental rate increases. In addition to lowering operating costs, NJHMFA wanted to ensure that addressing energy efficiency opportunities did not increase owner debt because the goal was to pay for the energy efficiency improvements with the energy savings. PSE&G’s service territory includes many of New Jersey’s urban areas and has a high proportion of multifamily housing units. These buildings typically face thin operating margins and constrained ability to increase rents which leads to deferred maintenance, poor building conditions, ongoing deterioration, and energy inefficiency which in turn further erodes operating margins and the ability to retrofit an inefficient building. In New Jersey as a whole, there are about 500,000 multifamily housing rental units representing approximately 16% of the total number of residential units in the State as well as 26% of all dwelling units in New Jersey’s central cities. Although there is significant opportunity for energy efficiency retrofits and energy savings in this building stock, this market sector consistently has been overlooked and underserved by existing energy efficiency programs. PSE&G’s Multifamily Housing Program was designed to address market barriers and obstacles which often prevent or impede affordable multifamily housing from taking advantage of energy efficiency programs. The affordable housing multifamily sector was targeted because of its relatively high energy usage, aging mechanical equipment, the facilities’ general lack of available capital for infrastructure improvements, and the need to preserve the affordability of these buildings and the housing they provide. Preserving and improving existing affordable housing is an essential step in addressing the State’s affordable housing needs while also promoting sustainability and sound land use planning. Affordable housing multifamily sector buildings exhibit some market barriers that are common to both residential and commercial rental buildings including the first cost bias 199 LEADERS OF THE PACK © ACEEE and the lack of access to capital. PSE&G incentives either eliminate or sharply reduce first cost premiums and the on-bill financing converts a capital cost into an expense item that can be paid for over time. Program Performance Program spending has been more than tripled in 2012 over previous years. o 2010 - $1,859,732.00 in program investment and $527,128.00 in program administration costs; Total $2,386,860.00 o 2011 - $2,486,164.00 in program investment and $299,033.00 in program administration costs; Total $2,785,197.00 o 2012 $12,949,980.00 in program investment and $1,092,477.00 in program administration costs; Total $14,042,457.00 The PSE&G Multifamily Program measures program savings on a per-project basis. The program has 21 projects from the first round of program funding that have been completed and are in the repayment phase, or are anticipated to complete in 2013. The energy savings for these projects are projected as follows: o More than 4.5 million kWh o 600 kW summer peak o More than 907,000 therms There are an additional 23 projects from the second round of program funding currently underway. One project is in the construction phase while the others are in other various stages pre-construction. The projected energy savings for these projects are as follows: o More than 5.2 million kWh o 713 kW summer peak o More than 1.6 million therms The program has modeled energy savings for years 2011 and 2012 as follows: Active Projects: o 2011 – 500,626 kWh Savings, 76 kW reduction and 87,001 Therm Savings o 2012 – 2,854,066 kWh Savings, 240 kW reduction and 648,175 Therm Savings Completed Projects: o 2011 – none o 2012 – 1,858,715 kWh Savings, 245 kW reduction and 351,676 Therm Savings The program cannot be measured by participants per year due to the project completion cycles and the way in which the program budget is structured. Program participation numbers are as follows: o More than 506 buildings having 16,258 individual apartments are enrolled/active in the program and an additional 105 buildings comprised of 5,115 living units are undergoing application review. o Since program inception, there have been approximately 130 program applicants representing more than 792 buildings having 21,783 individual dwelling units. 200 LEADERS OF THE PACK o Current program funding is expected to support approximately 50 projects that complete and enter the repayment phase. Program funding is nearly fully subscribed with a waiting list of projects in queue. Cost effectiveness: Utility Cost Test (UCT) – 2011 1.39 Total Resource Cost (TRC) – 2011 2.9 Lifetime cost of conserved energy (CCE) .5 cents per kWh PSE&G engaged an impact evaluation firm through a competitive bid process in October of 2012. The program impact evaluation is expected to continue through 2013. Results are not yet available. Lessons Learned Offer a flexible energy audit structure. The PSE&G program was initially designed using a full-blown investment grade audit (IGA). Based on program experience, PSE&G has found that in some cases for smaller or newer properties, an ASHRAE Level II audit would suffice. Similarly the cost differential between and ASHRAE Level II and III audit can also have an impact a project’s cost effectiveness and in some cases render the project ineligible for program participation. Providing simpler, less costly audits where appropriate also saves the program money and allows program funding to be utilized by a greater number of participants. Align the progress payments with the customer’s construction and cash flow schedules. In the initial round of program funding, PSE&G structured the progress payments in a series of three equal payments. From program implementation experience, the progress payment schedules were modified to provide payments commensurate with actual construction schedules as described in “Step Four: Measures Installation and Inspections” above. Not all audit-recommended ECMs are approved for financing. This is due to two factors: first, the total project cost must meet cost effectiveness screening criteria, and second, there may be structural or health and safety related conditions present in the building that prevent the installation of some ECMs. In the case of the latter, those conditions are cited in the audit report and are required to be addressed by the building owner prior to consideration for inclusion in PSE&G’s program. Project lifecycles can be long, sometimes up to 24 months. There can be long lag times between the time an audit is conducted and the customer decides to participate in the program. Even more significant is the time it may take for a customer to procure a contractor and negotiate a contract. While the PSE&G program’s design and results are highly effective; implementers need to understand potential project lifecycles and plan program resources accordingly. 201 LEADERS OF THE PACK © ACEEE Program at a Glance Program name PSE&G Residential Multifamily Housing Program Targeted Customer Segment Residential multifamily housing in PSE&G service territory with 5 or more living units Program Start Date 2010 Annual Energy Savings Achieved Phase I of funding: Over 4.5 million kWh Over 907,000 therms Phase II of funding: Over 5.2 million kWh Over 1.6 million therms Active Projects Modeled Energy Savings: 2011 – 500,626 kWh Savings, 76 kW reduction and 87,000 Therm Savings 2012 – 2,854,066 kWh Savings, 240 kW reduction and 648,175 Therm Savings Completed Projects Modeled Energy Savings: 2011 – none 2012 – 1,858,715 kWh Savings, 245 kW reduction and 351,676 Therm Savings Annual Peak Demand (Summer) Savings Achieved: Phase I of funding: 600 kW summer peak Phase II of funding: 713 kW summer peak Other Measures of Program Results to Date (such as number of participants, participation rates or market penetration). More than 506 buildings having 16,258 individual apartments are enrolled/active in the program and an additional 105 buildings comprised of 5,115 living units are undergoing application review. Budget for most recent year (and next budget cycle if available) Program Budgets are not planned on a per-year basis, but rather a lump sum as filed with the NJ Board of Public Utilities. The initial Program budget was $19M and an extension of the program provided another $20M in funding. PSE&G expects to propose additional program funding at significantly higher levels in the near future. Funding Sources (name and description) Rate Payer funded Website To be developed in 2013 Best Person to Contact for Information about the Program: Name Susan Lacey Ringhof Position Product Manager 202 LEADERS OF THE PACK Organization PSE&G Phone number 973-430-5784 Email address [email protected] MULTIFAMILY RESIDENTIAL — EXEMPLARY ENERGY SAVERS CNT ENERGY AND COMMUNITY INVESTMENT CORPORATION, PROGRAM ADMINISTRATORS AND IMPLEMENTERS Program Overview The Energy Savers program targets multifamily building owners in the seven-collar county Chicago region and City of Rockford. The delivery approach is a one-stop shop model that helps building owners improve energy efficiency and reduce operating costs in their buildings. The Energy Savers program is designed to improve energy efficiency in multifamily buildings and preserve high-quality, affordable rental housing in northern Illinois. To achieve this end, the Energy Savers team guides building owners through every step of the process, from finding the most cost-effective energy-saving investments to obtaining low-cost financing and utility rebates, overseeing construction, and ensuring reliable results. Each building receives recommendations for a comprehensive energy efficiency retrofit customized to the needs of individual facilities. Common measures targeted include insulation, air sealing, pipe insulation, high efficiency boilers, high efficiency hot water heaters, new boiler controls and high efficiency appliances. The Energy Savers program started in 2008 as a part of the Preservation Compact, an initiative aimed at preserving affordable rental housing in Cook County. Since that time, Energy Savers has expanded to serve the seven-county Chicago region and the City of Rockford. In the future, the success of this one-stop shop approach to energy efficiency could lead to the development of similar programs in the Midwest and other parts of the country. A breakdown of the services offered is as follows: Energy Assessment CNT Energy staff members conduct a complete energy assessment of the buildings that includes an examination of utility bills and a comprehensive building audit. The audit includes an interview with the building operator and a visual and diagnostic inspection of the building envelop, public areas, representative living spaces and the mechanical systems, including HVAC, hot water and lighting equipment. CNT Energy then provides a report detailing recommended energy efficiency improvements. 203 LEADERS OF THE PACK © ACEEE Financial Guidance The program provides financial guidance and offers access to a 3% fixed-rate, seven-year term loan through Community Investment Corporation (CIC), the financial partner. In addition, the Energy Savers team helps building owners obtain grants or rebates that may be available through utilities or other sources. Construction Support and Oversight The Energy Savers team assists building owners throughout the construction process, from developing a plan to inspecting installation work. Specific services include sending out bid proposals, reviewing bids, and assisting in implementing the recommended improvements by scheduling and monitoring. Energy Savers has a vetted contractor pool that can complete work according to highquality installation standards. These contractors also serve as referral sources. Monitoring, Education and Continuing Engagement The program team works with building owners to ensure that buildings are maintained and operated efficiently once the improvements are complete. The Energy Savers team trains building owners and maintenance staff in order to foster best practices for ongoing building management and ensure long-term savings. Building owners who complete retrofits receive annual reports showing how much energy and money they have saved as a result of participating in the program. This helps to keep building owners engaged in efforts to continue to maintain and operate their buildings efficiently. If a building does not perform as well as expected, the Energy Savers team works with the owner to perform a tune-up at no cost. These owners then will bring Energy Savers staff additional properties they own to evaluate. Once an owner buys in to the Energy Savers approach, and puts faith in our expertise, convincing them to do subsequent retrofits becomes much easier, and the whole implementation process is significantly streamlined. In addition to helping building owners change how they think about energy efficiency in their own buildings, CNT Energy also works with building owners to make them spokespeople and champions of energy efficiency in their professional circles. These trusted messengers are the biggest source of new referrals. Program Performance Actual program spending increased in 2011, then decreased in 2012. Total Exp. 2010 2011 2012 $6,383,622.19 $8,513,086.15 $5,269,093.88 The spending totals listed in the table above reflect program overhead, measures incentives, and the sum of private investment in the form of energy efficiency loans taken out. No other types of private investment are accounted for here. Please note an increase in 2011 due to an increase in incentives available through funding from the American Recovery and Reinvestment Act. 204 LEADERS OF THE PACK Energy savings has been variable from year to year, to some extent tracking program spending. Job Complete Gas therms saved kWh saved 2010 275,040 744,900 2011 1,126,320 3,050,450 2012 679,200 1,839,500 2010-12 TOTAL 2,080,560 5,634,850 Participation has been increasing each year: Audit Complete Buildings Units 2010 132 4,958 2011 181 6,066 2012 195 8,969 A December 2012 evaluation of CNT’s Multifamily Energy Savers program titled “Impact Evaluation of the Energy Savers Program for Multifamily Buildings,” was independently conducted by Navigant Consulting and completed in March 2013. The report states, “Navigant estimates that average natural gas savings were 19.8%, with savings reaching 26.1% during the heating season months of November through March, measured against comparable buildings that did not make efficiency improvements through the Energy Savers program.” Energy Savers is highly cost effective, with a total resource cost test for Peoples Gas’ portfolio by Green Energy Economics Group, Inc. in October 2009, using the DSM CostEffectiveness Calculator generated at TRC of 2.10 for the CNT Energy Savers Program. Lessons Learned Energy Savers’ success offers valuable insights into what works for energy efficiency program managers: Remove barriers to participation: The one-stop-shop model of Energy Savers is key. Creating a resource hub for technical assistance, financing, utility rebates, and construction oversight is crucial to the program’s high impact. The partnership with Community Investment Corporation, a trusted lending institution provides an effective entry point. Complex technical reports are not essential: Original assessment reports were 15 pages long and included great detail of building science and heat transfer. After significant input from a marketing consultant, our current report stands at four to five pages. There’s less discussion of U-factors and coefficients of performance, and a much greater focus on dollars and cents. 205 LEADERS OF THE PACK © ACEEE Importance of Relationship-building: The Energy Savers team works directly with existing trusted information sources such as builders groups, housing authorities, and professional associations for program outreach. Additionally, we work with building owners who have completed retrofit work to share their stories via case studies, building tours, and features in publications and communications pieces. Communications improves conversion rates: Energy Savers has consistently improved the percentage of audited buildings that move on to implement energy efficiency upgrades. Techniques include an assessment report that focuses on cost and savings projections for the proposed ECMs and carefully planned “close the deal” meetings. Staff also follows up with owners who disengage from the process; individual attention helps owners move forward with investment decisions. Program at a Glance Program name Energy Savers Targeted Customer Segment Multifamily building owners Program Start Date The first building audit was performed on April 3, 2007; the first building retrofit project was completed on May 20, 2008. Annual Energy Savings Achieved Avg. 693,520 gas therms/yr. Avg. 1,878,283 kWh/yr. Peak Demand (Summer) Savings Achieved: Not Available Other Measures of Program Results to Date: None Budget for most recent year (and next budget cycle if available): Not applicable; no individual program budget, see spending expenditures above. Funding Sources (name and description): John D. and Catherine T. MacArthur Foundation Peoples Gas Nicor Gas City of Chicago Illinois Department of Commerce and Economic Opportunity Website: Past funders include: Polk Bros Foundation Crown Family Philanthropies www.cntenergy.org/energysavers Best Person to Contact for Information about the Program: Name Dara Reiff Position Outreach Coordinator Organization CNT Energy Phone number 773.321.2668 Email address [email protected] 206 LEADERS OF THE PACK COMMUNITY BASED PROGRAMS — HONORABLE MENTION ENERGIZE PHOENIX AND ARIZONA PUBLIC SERVICE (APS) SOLUTIONS FOR BUSINESS APS MARKETING, ADMINISTRATOR KEMA SERVICES INC., IMPLEMENTER Program Overview Energize Phoenix is a local initiative aimed at changing energy-user behaviors and transforming the energy-use intensity of buildings along a 10-mile stretch of the Metro light rail system that serves the urban core of Phoenix. A collaborative of institutions leads the initiative, including the city of Phoenix, Arizona State University and Arizona Public Service (APS). The program operates with $25 million in ARRA funds as part of the DOE Better Buildings Neighborhood Program, which calls on local and state governments and partner organizations to find innovative solutions that address the energy efficiency challenge. Energize Phoenix was one of 41 initiatives in the country selected by the U.S. Department of Energy in 2010 to develop and test new strategies for improving energy efficiency in the built environment and, ultimately, serve as models for other communities. The city of Phoenix administers the Energize Phoenix program, while APS Marketing administers the Solutions for Business program. KEMA Services Inc. provides full-service implementation services for the APS program. Energize Phoenix’s commercial goals target small and large APS business customers located along a 10-mile stretch of the Phoenix Metro light rail corridor. The Energize Phoenix program leverages the APS Solutions for Business program that includes the Express Solutions program, an initiative that offers incentives for specific lighting and food refrigeration upgrades to small business customers using a contractor-driven approach to marketing the program. Businesses, governments and nonprofits with an average monthly per-meter demand of 400kW or less are eligible to participate, as is any size K-12 school in the utility’s territory. Solutions for Business is a comprehensive program that provides rebates for a wide range of prescriptive and custom energy conservation measures for nonresidential customers at any level of monthly demand. Energize Phoenix draws on a local workforce of trained contractors to market, sell and install energy equipment eligible for program rebates. Program-approved commercial contractors contact customers to perform free energy assessments from which they develop proposals showing estimated project cost and total energy savings for both APS and Energize Phoenix rebates. Energize Phoenix matches the APS rebate up to 100% of the incremental project cost of the energy conservation measures. Once the customer approves the project, and APS and Energize Phoenix approve the incentive estimates, the contractor installs the approved measures. The customer pays the contractor for the work, less the APS incentive. APS verifies the work and pays its incentive directly to the contractor; Energize Phoenix pays its matching rebate directly to the customer. 207 LEADERS OF THE PACK © ACEEE Promotion of Energize Phoenix relies heavily on a contractor base already established and trained in energy efficiency programs available through APS; however, the city also required those contractors to attend training in its program to ensure compliance with program guidelines and federal mandates. The city created a website to promote the program and worked closely with its partners, especially APS, in marketing to customers and contractors. The program team posts results of the commercial programs, including application status and energy reports, online using a dedicated SharePoint site. Partners meet regularly to address budget issues, goals and special offerings. Energize Phoenix seeks to eliminate up to 50,000 metric tons of carbon emissions a year and create as many as 2,000 green jobs. The project intends to accomplish its nonresidential energy goals by reducing commercial energy use by up to 18% for as much as 30 million square feet of commercial and industrial space. End uses and measures targeted include: Lighting HVAC Motors/VSDs Refrigeration Building Envelope IT and Data Equipment Controls Appliance APS rebates pay up to 75% of incremental projects costs and Energize Phoenix matches that rebate – and can pay additional rebates up to 100 percent of incremental project costs. Because that match may eliminate out-of-pocket costs for many customers who implement energy improvement projects, it makes a strong case for participation. In addition, the project leverages initial DOE and ARRA investments using a partnership with a local bank to create a revolving loan fund to provide capital and offer low, fixed-interest rate loans for participating commercial building owners. Energy use in the Phoenix green corridor is primarily electricity-fueled and cooling-driven, a common characteristic among warm-climate regions with growing populations. In Phoenix, that characteristic aligns with an established contractor workforce available to the weatherization and retrofit industry, thanks to a history of weatherization programs in Arizona and the existing APS energy efficiency programs. The APS partnership with Energize Phoenix offered immediate access to an established model for energy efficiency programs, an active and trained membership of contractors – or trade allies – and program expertise in marketing, outreach, contractor training and application processing. APS benefits from the partnership through an additional distribution channel for promotion of its Solutions for Business energy efficiency program and an uptick in energy savings through increased participation at no cost to its programs. 208 LEADERS OF THE PACK Program Performance By June 2012, 276 participants had participated in Energize Phoenix since program inception with projects at multiple building types — small and large office buildings, retail and convenience stores, small hotels and others. Nearly all were single end-use retrofit projects focused on lighting improvements. By June 2012, APS Solutions for Business had paid incentives totaling more than $2.8 million to customers participating in the Energize Phoenix program since 2011. Those projects represent a total savings of more than 25 GWh. As part of those savings, Express Solutions received and processed incentives applications representing more than 8 GWh in energy savings and more than $964,000 in incentives. Energize Phoenix anticipates achieving the targeted goal of retrofitting 30MM sq ft. of commercial space and reducing 18% of energy use by end of program. While numbers for program year two are not yet final, project administrators estimate completion of 272 commercial projects totaling more than 12 million square feet and had a pipeline of 265 additional projects. Energize Phoenix partners expect in year three to identify building factors most likely to influence savings in energy efficiency upgrades, successfully reach project goals for energy savings and number of retrofits, and claim creation of an energy efficiency mindset and behavior within the Energize Phoenix corridor. Performance 2011 2012 (as of June) Program spending actual $1,019,278 $1,879,464 Program savings 10,734,332 kWh’s (net) 14,341,425 kWh’s (net) No. of participants 97 179 Data on the cost effectiveness of the Solutions for Business energy efficiency measures installed in 2011 (2012 values are currently under development) show: Lifetime benefits of installed energy efficiency measures (societal benefits): $148 million Estimated societal effectiveness (benefit to cost): 3.0 Program cost per lifetime kWh saved: $0.00228 per kWh An impact evaluation of the program will be available at the end of the program, at the end of 2013. Lessons Learned As with the design of any new initiative, many lessons-learned resulted for energy efficiency partnerships among multiple stakeholders in the public and private sectors: Having APS deep knowledge and experience with energy efficiency programs contributed to success overall. While the utility’s regulatory mandates, customer privacy policies and market competition presented challenges during formation; 209 LEADERS OF THE PACK © ACEEE however, its energy efficiency expertise significantly enhanced the Energize Phoenix program design. Equally important, access to a trained contractor workforce saved tremendous time and resources. Involving experienced contractors early also contributed to program design success. Energy-improvement programs stimulate local green jobs, and local companies with local workers dominate the Energize Phoenix contractor workforce. Program at a Glance Program name Energize Phoenix and Arizona Public Service (APS) Solutions for Business Targeted Customer Segment APS nonresidential utility customers located along a 10mile stretch of the Phoenix Metro light rail corridor Program Start Date February 2011 Annual Energy Savings Achieved June 2012 – more than 25 GWh Peak Demand (Summer) Savings Achieved: N/A Other Measures of Program Results to Date: N/A Budget for most recent year (and next budget cycle if available): Energize Phoenix operates with $25 million in ARRA funds; APS Solutions for Business 2012: $29,400,000 Funding Sources (name and description): Energize Phoenix operates with $25 million in AARA funds; APS Solutions for Business is funded by utility base rates and Demand Side Management Adjustment Charge (DSMAC) Website: www.aps.com/businessrebates www.energizephx.com http://energizephx.com/programs Best Person to Contact for Information about the Program: Name Valerie Wynia Position Program Manager, Solutions for Business Organization Arizona Public Service (APS) Phone number 602-250-3249 Email address [email protected] 210 LEADERS OF THE PACK COMMUNITY BASED PROGRAMS — HONORABLE MENTION ENERGY LEADER PARTNERSHIP PROGRAM (ELPP) SOUTHERN CALIFORNIA EDISON, ADMINISTRATOR; SOUTHERN CALIFORNIA EDISON AND LOCAL GOVERNMENT PARTNERS, IMPLEMENTERS Program Overview SCE's Energy Leader Partnership Program (ELPP) provides support to local governments (“LG”s) to assist them in achieving a joint vision of energy efficiency and sustainability. SCE works closely with the partners to address key issues that act as barriers to achieving this vision, and to develop a long-term energy efficiency strategy. SCE Partnerships provides support to local governments to identify and address energy efficiency, demand response, and customer owned solar opportunities in municipal facilities, develop long-term energy and sustainability plans, and increase community awareness of demand side management (DSM) opportunities. In addition, through the Partnership, we are supporting cities in strategic initiatives and policy development in climate action planning, reach codes, benchmarking and other longer term objectives. The ELPP involves partnerships with local governments or groups of local governments working together with SCE to achieve demand side management goals. A single city or county can directly participate as a partner, while groups of cities, counties, and/or other jurisdictional entities can participate as a bundled partner as well. The comprehensive program has three major elements: Municipal Facilities Retrofits, Strategic Plan Support, and Core Program Coordination. The target audience is both the municipalities themselves as well as the residential and business communities they serve. Local governments often lack both the funds and the time to pursue energy efficiency opportunities. SCE’s ELPP has been designed to help local governments by providing integrated technical and financial assistance so that they can effectively address opportunities in: Increasing energy efficiency and the use of renewable energy Reducing GHG emissions Protecting air quality Creating green jobs; and Ensuring that their communities are more livable and sustainable. The Government Facilities element helps local governments lead by example, by identifying and implementing "clean energy" projects — using energy efficiency (EE), demand response (DR), and renewable energy (RE) — in municipal-owned facilities and operations. The full ranges of standard measures are available to local government partners. Program energy savings are derived from the energy efficiency retrofits and retrocommissioning of municipal facilities. Measures include comprehensive lighting and controls, HVAC, refrigeration, water heating, uninterruptible back-up power supplies, pumps and motors. 211 LEADERS OF THE PACK © ACEEE The specific EE measures for each local government depends on technical audits and assessments that identify all retrofit opportunities. Buildings targeted include libraries, fire stations, medical hospitals, correctional facilities, police stations, public works department facilities, streetlights, transit agencies, water and waste water agencies, sanitation districts, schools that are under the jurisdiction of the LG entity, and other public assets. The Government Facilities element works by: Conducting technical audits and assessments; Identifying potential projects; Implementing deep retrofits and retrocommissioning for existing facilities; Integrating cleaner energy design and technologies into new facilities; Supporting local governments with technical support needed to implement projects; Providing enhanced incentives, on-bill financing, and information about financing strategies being deployed by other local governments. The Strategic Plan Support element focuses on helping local governments to: Use their regulatory authority over local development, planning, and permitting to drive or motivate their communities to adopt cleaner energy design, technologies, and practices; Lead by example by developing policies, plans and ordinances that improve the energy efficiency and reduce GHG emissions in its own facilities; and Demonstrate energy leadership by influencing attitudes and actions of its citizens and businesses through a variety of forms, from public education to the development of policies and codes that address energy efficiency and sustainability. This effort provides local governments access to extensive peer networks and databases of best practices, tools and techniques, and code enforcement training, as well as best practices for “reach” codes and policies, goals, codes, standards, plans, and practices — "reach" meaning those that exceed statutory requirements approved by the California Energy Commission (CEC). Overall, the Strategic Plan Support effort will yield important outcomes such as completed climate and energy action plans, trained energy plan checkers and inspectors, installation of enterprise energy management systems to assist local governments with ongoing assessments of their energy efficiency opportunities, and new policies to promote energy efficiency for over 100 participating local governments. The Core Program Coordination element Focuses on partnering with the local government to deliver key co-branded IDSM messaging to the community through approaches that leverage the local government communication channels including bill inserts, cable television and direct mail. Helps create awareness in the community so that residents and businesses understand and leverage the full ranges of IDSM programs and services offered at SCE 212 LEADERS OF THE PACK Provides education opportunities for the community regarding IDSM strategies, technologies and opportunities. Improves understanding and access to programs such as small business direct-install programs, income-qualified programs, distributed-generation programs, and other energy offerings. Helps communities learn about and implement energy efficiency, demand response, and distributed generation, in order to reduce GHG emissions and their environmental footprint. The ELP program has 4 tier levels: Valued Partner, Silver, Gold and Platinum. All Partner levels receive SCE support consisting of marketing, education, outreach and training, technical assistance and direct implementation. To reward and motivate Partners to increase DSM efforts, the program offers increased incentives to offset project costs as Partners move progressively up the tiers. Ascending enhanced EE incentives (that is, greater than SCE standard incentives) are paid at progressively higher levels of achieved municipal energy savings (5%, 10% and 20%). Demand Response incentives are also provided at regular tariff rates for participating entities. Before 2002, SCE initiated a limited number of informal arrangements which helped develop stronger relationships with cities in order to address energy efficiency opportunities. In the 2002-2003 program cycle, third-party programs solicited by the CPUC worked with a select number of local government entities. Under this early model, third parties proposed specific activities, energy savings goals, deliverables, and program budgets, while the IOU performed direct administration and oversight. However, these third-party programs did not fully capture the spirit and intent of a partnership, were not coordinated, and varied significantly in incentive levels, approach, and expectations, resulting in many program inconsistencies. In the 2004-2005 program cycle, the CPUC program Decision encouraged IOU/Local Government Partnerships. The third-party model evolved into a rudimentary partnership model that retained much of the existing program design. This change enabled the IOUs to coordinate the Partnerships more effectively and to build consistency and efficiencies in incentives, processes, communications, and implementation. While many of the prior thirdparty Partnerships were continued, new Partnerships were also developed and added to the portfolio. In the 2006-2008 program cycle, SCE continued to improve overall effectiveness by refining Partnership implementation processes and improving program internal controls and communications. The Partnerships improved in consistency and cost-effectiveness. 213 LEADERS OF THE PACK © ACEEE Program Performance In 2009-2011, there were several significant changes to program design and implementation. Based on lessons learned, the Partnerships program was redesigned to capture key elements that were the most effective and compelling for the local government sector. The new model was designed to recognize local governments for taking progressively comprehensive actions in demonstrating IDSM leadership. The actions rewarded and recognized include both retrofits that achieve tangible energy and demand savings as well as longer term energy action planning to ensure a sustained focus on IDSM actions. Within this model, as local governments achieved milestones in energy savings through municipal retrofits, they are rewarded with higher incentives to drive to deeper, more comprehensive retrofits. The new model includes demand response initiatives as well as a requirement for developing and adopting longer term energy action plans to ensure a sustained focus on energy efficiency within the local government policies. During this time, program spending almost doubled, from 2010 $7.32 million reported to $13.43 million in 2011 reported. Preliminary figures indicate spending has tripled in 2012 to $23.21 million. Annual savings, shown in the table below, have not tracked annual spending, however, dropping in 2011 over 2010. This dynamic may have changed, as preliminary savings for 2012 point to a dramatic increase. Savings (GWh) Savings (MW) Cost Effectiveness 2010 Reported* 16.76 2.69 2010 Adjusted* 15.48 2.57 2011 Reported* 12.16 1.76 2011 Adjusted* 13.44 1.88 Cumulative for 2010 and 2011 results: UCT (PAC): 0.70 TRC: 0.49 $/kWh: $0.75 2012 Preliminary 22.47 4.58 *In July of 2011, the CPUC adopted the final 2010-12 ex ante assumptions, and retroactively applied them to January 1, 2010. As a result, the 2011 reported activity is derived as the difference between the adjusted cumulative 2010-11 performance and SCE's 2010 EE Annual Report. Over 112 cities and counties are included in SCE’s ELP Program. Customers in these jurisdictions are also served by the partnerships. No specific impact evaluation report is available at this time for ELP. Lessons Learned Advice for utility program managers working in partnership with local governments to be gleaned from SCE’s Energy Leader Partnership Program experience centers around the relationship, coordination, and mutual awareness of organizational needs and strengths: 214 LEADERS OF THE PACK Importance of having engagement and participation from various parts of the LG. For example, participation from the facilities manager is critical for municipal retrofits, while input from an energy champion from another department may be the right individual for coordinating community events. Recognize local governments for their IDSM achievements. This public recognition proved to be very important to local governments. Early planning for community outreach efforts to ensure that the Partnership does not miss key community events that typically occur in the community. Co-branding materials between SCE and the LG provides a more compelling message to the community. Technical support services typically need to be provided to assist LGs in identifying retrofit opportunities and justify payback to senior city leadership. Projected project costs need to be determined early enough for inclusion in annual LG budgeting process. Need for Expanded Professional Services Program at a Glance Program name Energy Leader Partnership Targeted Customer Segment Local Government Program Start Date 2009 Annual Energy Savings Achieved 2010 Reported*: 16.76 GWh 2011 Reported*: 12.16 GWh 2012 Preliminary: 22.47 GWh Peak Demand (Summer) Savings Achieved: 2010 Reported*: 2.69 MW 2011 Reported*: 1.76 MW 2012 Preliminary: 4.58 MW Other Measures of Program Results to Date: 3-Reach Codes 2-Green Building Programs 1-Point of Sale Program 1-On-line Permitting System 10-Education Programs for Elected Officials, and City/County Staff 74-Local Govts: Code Enforcement Training 6-Benchmarking Policy 3-Utility Manager Systems 6-CAP/EAP 2-LEED, Energy Star Rating Policies for Municipal Facilities 2-Revolving EE funds 5-Cx/RCx policies 4-Regional Templates for CAP/EAP 1-Community CAP/EAP 215 LEADERS OF THE PACK © ACEEE 4-GHG Inventory savings analysis Numerous marketing and outreach events to build awareness for energy efficiency and savings. Numerous community events including energy walks, small business direct install, lamp exchanges, multi-family housing EE retrofits and other events where local government partners co-brand, SCE standard programs and deliver them to their communities. Budget for most recent year (and next budget cycle if available): 2012 Authorized Budget of $28.7M, Operating Budget (rate reduction) of $26.7M 2013-14 Cycle Budget of $29.1M Funding Sources (name and description): Ratepayers Website: http://www.sce.com/business/energy-solutions/energy-efficiencypartnerships.htm Best Person to Contact for Information about the Program: Name Nancy Jenkins, P.E. Position Manager, Energy Efficiency Partnership Program Organization Southern California Edison Phone number 626-302-0655 Email address [email protected] COMMUNITY BASED PROGRAMS — HONORABLE MENTION FRESNO ENERGY WATCH PACIFIC GAS AND ELECTRIC COMPANY, PROGRAM ADMINISTRATOR AND IMPLEMENTER Program Overview In 2005, PG&E began programs with several local governments throughout its service area, including the City of Fresno, to leverage local relationships, staff, and know-how in efforts to increase the energy efficiency of local government facilities, small businesses, and homes. Based on the success of these efforts, the program with Fresno, called the Fresno Energy Watch, was expanded in 2007 to include all of Fresno County. The region’s profile makes this area a particularly important target for energy efficiency partnerships. The Fresno metropolitan area, home to some 900,000 people, is the fifth largest 216 LEADERS OF THE PACK city in California. Located in Climate Zone 13, a zone characterized by extreme temperature swings, the region has high cooling and heating loads. In fact, PG&E customers in Fresno used more than 3.3 billion kWh of electricity and 163 million therms of natural gas in 2009, and Fresno has the highest residential electricity use per capita within PG&E’s service area. Lowering this energy use—and the associated costs—is particularly important because this region has the highest concentration of poverty in the United States and has suffered from double-digit unemployment for 30 years. Fresno Energy Watch targets the customer sectors of small and medium business, municipal facilities, and homeowners. Energy efficiency measures in the program include T-8 to T-5 light conversions, room sensors, and high bay lights. Services offered are energy audits, small business assessments, and educational programs for municipal staff as well as the contractor community. Most of the incentives are centered on low- or no-cost lighting solutions. The value of an average home energy assessment was $700 per home (HERS II level). Recognizing the importance of reducing energy use and customer bills, PG&E , City and County of Fresno, and the Economic Development Corporation serving Fresno County collaborated extensively during PG&E’s 2010-2012 Energy Efficiency Portfolio cycle on a number of energy efficiency solutions. The partnership has led to dozens of projects, large and small, that have increased energy efficiency throughout the region. Examples of large high-profile projects include a Fresno City Hall chiller upgrade that is saving 973,000 kWh and $126,490 annually, as well as a Fresno Police Department chiller upgrade that is saving 290,000 kWh and $37,700 annually. Smaller municipal projects include an arena boiler upgrade that is saving 2,700 therms and $2,160 annually and an upgrade of runway lights at Fresno Yosemite International Airport that is saving 34,451 kWh and $4,478 annually. An innovation of particular note in the 2010-2012 program is an effort to more efficiently and cost-effectively serve residential and small business customers by using PG&E customer data to analyze community-wide energy use and package energy efficiency audits, incentives, and financing tools to move the market. (Use of customer data for this purpose followed all regulatory rules and laws to safeguard customer privacy.) Two examples highlight the value of this approach. In 2011, the City of Fresno applied PG&E data to identify areas of highest energy opportunity to improve delivery of its Home Tune-Up Program (HET). The City initiated HET in 2009 to provide residential customers with HERS II-certified energy audits, which include recommendations for home energy-efficiency upgrades, as well as information on upgrade resources, such as rebates and financing options. PG&E’s data melded information from PG&E and Fresno to create a map that identified areas of higher energy opportunity per household. This map showed a near-perfect match with historic information on areas with strong demand for HET, validating the data and confirming the City’s plans to target outreach efforts in neighborhoods most likely to participate in the future. Results have been extremely positive. Demand is increasing, with 250-300 residential customers requesting surveys each month. A recent poll showed that 37% of homeowners plan to or have performed upgrades after receiving survey results, and that 44% used PG&E 217 LEADERS OF THE PACK © ACEEE rebates. The upgrades typically reduce energy use by 10-30+ percent, with associated costs savings of $300-$2,400+ annually. A phone poll showed typical retrofit projects cost from $600-$40,000, with investments in some projects exceeding $100,000. In addition to increasing customer response, use of the data enhances program delivery efficiency. With the data, local governments can create realistic plans with actual reduction goals and targets that can be easily monitored and reported on. Given this success, PG&E is looking to replicate this approach with government partners seeking to achieve deeper energy savings. In addition, to sustain momentum in Fresno, PG&E agreed to bridge-fund the program through the end of 2012 with an additional $575,000 after federal and state funding was exhausted, and plans to continue and expand the program in coming years. In August 2012, Fresno Energy Watch again turned to PG&E for data support in a highprofile effort to boost local economies though promoting energy efficiency: the Five-Cities, Five-Days Campaign. Fresno Energy Watch canvassed five cities in five days in economically depressed western Fresno County and completed installations of free and low-cost energy-efficient products for 24 small businesses and municipal facilities—an effort that garnered much media activity and public attention. Use of the PG&E data greatly reduced the effort needed to complete this major undertaking—making the process much more efficient for Fresno Energy Watch and more convenient for the customers receiving the measures. From a logistics standpoint, the data helped increase the number of visits the Energy Watch installer could make during each day and reduced the driving time between locations—both providing significant cost savings. Equally important, the data reduced the number of cold calls, improving the conversion rate by 35% compared to that achieved through the normal referral process. Program Performance The program exceeded all energy savings goals set by PG&E. The strong relationships and high level of cooperation between PG&E and the City and County of Fresno is a program element worthy of replication into other regions. PG&E coordinates regularly with the City of Fresno Energy Watch manager and staff to provide detailed data to explore new community-wide energy-saving opportunities. Further, PG&E officers have met with Fresno leadership to discuss a number of energy and economic development issues and examine potential projects from a high level, efforts that are yielding more beneficial and innovative projects. For example, Fresno and PG&E are now examining the reductions in city operational costs of facility energy efficiency upgrades that may be possible with a cofunding contract with General Services Administration. Program spending actual for 2012 was $2,700,000; for the 2010-12 program cycle, it was $6,000,000. Partners get 3-yr. contracts and attempt to spend equally over the cycle. However, this program added dollars due to the Home Tune Up program and other special contracts. Approximate breakdown: 2010: $1,120,000; 2011: $1,140,000; 2012: $2,060,000. Also in 2012, Third Party opened the RHA Energy Fitness Program to Fresno County where an estimated $660,000 was invested into the SMB market. 218 LEADERS OF THE PACK Program savings (per year, most recent 3 years); Net saving - MW = 0.661 GWh = 3.344 Number of participants (per year, most recent 3 years): The 1200 participants number, is this an average or total? Can we break out by year? Approximately: 2010: 240, 2011: 240, 2012: 760 (larger number due to Home Energy Tune-Up residential program. Evaluations are not available at this time. Lessons Learned The Fresno Energy Watch is particularly valuable in its ability to spread energy savings throughout different market sectors. The small business segment, which typically places low priority on energy efficiency, has provided immediate energy and cost benefits. The FiveCities, Five-Days campaign specifically target economically depressed business areas. The residential sector, which accounts for about 40% of all energy use in the region, receives information and resources that have provided significant energy and bill reductions, while increasing home comfort and value. Moreover, the residential program has expanded into additional counties, thereby making energy efficiency a more important concern in a greater portion of the region. Program at a Glance Program name Fresno Energy Watch Targeted Customer Segment Residential, Small/Medium Business, Muni Program Start Date 1/1/2012 Annual Energy Savings Achieved MW .22 GWh 1.1 Budget for most recent year (and next budget cycle if available): $2,700,000 (2012) Funding Sources (name and description): Pacific Gas and Electric Website: www.fresnoenergywatch.com Best Person to Contact for Information about the Program: Name Steve Newvine Position Senior Program Manager Organization Pacific Gas and Electric Phone number 209-384-4918 Email address [email protected] 219 LEADERS OF THE PACK © ACEEE COOPERATIVES AND PUBLIC POWER RESIDENTIAL — EXEMPLARY GREEN HOME HOUSE CALL BURBANK WATER AND POWER (BWP), PROGRAM ADMINISTRATOR; MULTIPLE IMPLEMENTERS Program overview BWP has been operating energy efficiency programs since 1996; historically, their most popular program has been Home Rewards which provides rebates for ENERGY STAR appliances and other efficient products. However, they were missing a comprehensive whole home program that would transform the market for residential efficiency. BWP wanted a program that would also address the energy-water nexus, especially given the peak demand and water supply shortage issues in California. BWP designed the Green Home House Call program in order to fill this niche, as well as reduce market barriers and instill resource efficiency for residential customers. They introduced the program in November 2009. Programs must typically address all aspects of the energy efficiency three-legged stool – attractiveness, awareness, and availability. First, the primary barrier to developing an efficient home is typically financial attractiveness. Given a choice, most customers would rather remodel rooms in their home for cosmetic reasons than make a home more efficient. With current economic conditions many customers no longer have money available for efficiency upgrades. Having separate incentives for water, gas, and electric is cumbersome to the customer and contradictory to the message often given to customers to treat their whole house as a system. BWP consolidation of funding provides a greater level of customer convenience. The average Green Home House Call service would cost homeowners about $2,300 if they were to conduct these services on their own. BWP provides these services for free, and the cost savings represent much needed cash back into consumers’ pockets during difficult economic conditions. A second barrier is lack of awareness. Customers may not have the time, inclination, or resources to investigate efficient upgrades and technologies. Therefore, BWP decided to address both cost and education barriers by making this a direct install program that is free to homeowners and renters alike. They addressed the third barrier, availability, by utilizing a contract with the Southern California Public Power Authority (SCPPA), a joint powers authority created to increase purchasing power for Southern California’s municipal utilities. This contract resulted in a request for proposals that ensured the participation of highly qualified contractors and best pricing. BWP’s direct install residential program addresses all major residential end uses, including lighting, water use, HVAC equipment and operations, and the building shell. Green Home 220 LEADERS OF THE PACK House Call is designed to take advantage of operational efficiencies and minimize customer inconvenience by having as much of the work done at one time by one contractor as possible. BWP is responsible for program design, day to day and long-term planning, some program implementation, management of program subcontractors and partners, and evaluation. KEMA Services processes participant sign-ups, schedules and installs CFL, LED and water measures, assesses the need for weatherization, and reports results. Sierra Weatherization schedules and processes weatherization measures, including attic insulation and venting, Central Air Conditioning tune-ups, and duct sealing measures. Southern California Gas Company (SoCalGas) provides additional funding for measures that reduce natural gas usage. Metropolitan Water District of Southern California (MWD) reimburses BWP for any landscape audits or irrigation system work completed through the program. The workings of the program typically go in the following sequence. When the KEMA Services contractor arrives for the initial home visit, they do an inside survey with the customer, reviewing the customer’s annual energy and water consumption. One of the contractors then checks the temperature of the home’s water heater, refrigerator and freezer, and also checks the home’s faucets, showerheads, and toilets for efficient settings. The contractor proceeds to install efficient showerheads and aerators, along with up to six CFLs and one LED in high use lighting areas. The contractor next verifies the existence of central air conditioning and checks the customer’s attic insulation levels in order to assess whether the customer qualifies for R-30 level attic insulation, attic venting, duct sealing, and air conditioner tune-up. Customers with attic insulation less than R-11 receive all of the above mentioned services; customers with greater levels of insulation receive the duct seal and air conditioner tune-up, performed by Sierra Weatherization, during a separate appointment. Following the indoor survey, the contractor will then go outside with the customer and investigate the sprinkler system, irrigation controller, and pool pump, if applicable, to ensure efficient operation. As needed and agreed to by homeowners, these devices are reprogrammed to more efficient settings. BWP designed the program with customer convenience and comfort in mind. After the contractor schedules the initial appointment, the customer is provided with both a reminder post card and a day before courtesy phone call reminder of their appointment. The sequence of the initial visit is to always start the indoor survey first and then go outside to address the outdoor water equipment, in order to avoid bringing outside dirt inside the customer’s home. BWP has adapted the concept of the three-legged stool for their own operations, too. In this case, the three legs of the stool represent reliability, sustainability and affordability. They have designed the Green Home House Call with this in mind – a free, comprehensive efficiency program provided to all residential customers by a trusted community utility, producing long term durable resource savings. 221 LEADERS OF THE PACK © ACEEE At the state level, the California Investor-Owned Utilities have moved toward offering a whole house approach and introduced the Energy Upgrade California program. At the federal level the whole house approach is used in the Home Performance with ENERGY STAR program. However, these programs require investment by the homeowner. BWP, in cooperation with SoCalGas, recently began to offer air sealing with verification using a blower door test to reach ACH natural levels in accordance with ASHRAE. With this new service introduced in the fall of 2012, the program claims to equal the “Basic” service of Energy Upgrade California – with no expenses required by the customer. Program Performance Even with three successful years of program operation, BWP is constantly evaluating and improving the program as a whole. The program was designed to be simple in its initial deployment, but flexible enough to incorporate additional measures and services based on evaluation or customer demand. After the first full year of operation, an internal evaluation showed that residential participation in the air conditioning tune-up incentive program was low. BWP worked with the contractor to become certified to provide air conditioning tuneups as a service, given that most homes in Burbank have central air conditioning. The air conditioning tune up service, introduced in July 2011, is verified by a third party engineering firm, Proctor Engineering Group, ensuring customers receive a quality service. In addition, the tune-up service complements the duct sealing service, and helps increase the efficiency of the HVAC system. Since inception, Green Home House Call has been increasing program spending, gross savings, and net savings. FY 09-10 FY 10-11 FY 11-12 Total Program Spending $420,682 $695,435 $664,206 $1,780,324 Gross Savings kWh 764,170 901,407 1,047,540 2,713,117 Net Savings - kWh 611,336 744,860 874,521 2,230,717 Participants 1,044 1,120 834 3,472 UCT / PAC test 1.81 TRC test 1.81 CCE - $ per kWh $0.12 Note: BWP’s Fiscal Year begins July 1 and ends June 30 of the following year. An impact evaluation of the Green Home House Call program is in the preliminary stages of development and is not available at this time. 222 LEADERS OF THE PACK Lessons Learned Four recommendations for how to design a successful whole home program come from Green Home House Call: Design the program such that customer convenience is maximized. BWP designed the program to be free because customers have lots of choices of how to spend their money and energy efficiency is not always on the list. In addition, BWP designed the program to be direct install, thereby ensuring quality and consistency. Leverage other funding and resources to achieve comprehensive savings. BWP leveraged its existing relationship with the Metropolitan Water District to gain greater water savings, and established an expanded relationship with SoCalGas to achieve natural gas savings. Use a variety of promotional approaches to build participation in the program. BWP markets the program through their Customer Call Center, bill inserts, and newsletters, which together accounts for 60 percent of sign-ups. An additional 25 percent of sign-ups are through community events. However, perhaps the most effective method of marketing is the quality of the program itself – 15 percent of sign-ups occurs through word-of-mouth from satisfied customers. Design the program to be flexible for future growth. The program has grown for two reasons – the incorporation of new services such as AC tune-ups and air sealing, and the addition of income qualified households to expand the reach of the program. In addition, BWP continually evaluates the program for enhancements and improvements. Program at a Glance Program name: Green Home House Call Targeted Customer Segment: Residential – single family, multi family, low income Program Start Date: November 2009 Annual Energy Savings Achieved: 875,000 kWh FY 11-12 2,231,000 kWh since inception Peak Demand (Summer) Savings Achieved: 734 kW FY 11-12 Other Measures of Program Results to Date: 3,472 participants through December 2012 1,000,000 square feet of insulation installed 8,300 CFLs and LEDs installed 1,300 duct sealing jobs 700 AC tune-ups completed 2,100 landscape audits completed 2,700 low flow showerheads installed 3,800 kitchen and bath aerators installed Budget for most recent year (and next budget cycle if available): $664,000 expended in FY 11-12 $950,000 budgeted for FY 12-13 Funding Sources (name and description): Primarily funded through BWP public benefits charge 223 LEADERS OF THE PACK © ACEEE Additional funding for gas measures from the Southern California Gas Company, and water measures from the Metropolitan Water District of Southern California Website: http://www.burbankwaterandpower.com/incentivesfor-residents/green-home-house-call Best Person to Contact for Information about the Program: Name Joe Flores Position Conservation Program Manager Organization Burbank Water and Power Phone number 818-238-3773 Email address [email protected] COOPERATIVES AND PUBLIC POWER RESIDENTIAL — HONORABLE MENTION HELP MY HOUSE PROGRAM ADMINISTRATOR: CENTRAL ELECTRIC POWER COOPERATIVE (CENTRAL), THE ELECTRIC COOPERATIVES OF SOUTH CAROLINA (ECSC) AND ECOVA EIGHT RURAL ELECTRIC COOPERATIVES (AIKEN ELECTRIC, BLACK RIVER ELECTRIC, BROAD RIVER ELECTRIC, HORRY ELECTRIC, PALMETTO ELECTRIC, PEEDEE ELECTRIC, SANTEE ELECTRIC AND TRI-COUNTY ELECTRIC), IMPLEMENTERS, WITH KW SAVINGS, NOT-FOR-PROFIT IMPLEMENTER Program overview Central Electric Power Cooperative, the wholesale power provider for the state's 20 distribution cooperatives, is interested in energy efficiency as a cost-effective strategy to help meet growing electrical demand. Central Electric estimated, before this pilot began, that a full-scale program for all 20 co-ops in the state could cut electric use by $270 million per year and produce up to 1500 new jobs within one year of implementation. In an effort to demonstrate to their member co-ops that a full-scale program was feasible, Central and ECSC proposed the Help My House Loan Pilot Program. They were supported by three developments: 1. A South Carolina law passed in 2010 allows co-ops and other utilities to offer homeowners easy loan repayment via their monthly utility bills and disconnect for non- payment 224 LEADERS OF THE PACK 2. The US Department of Agriculture's Rural Utility Service (RUS) provided a first-ofits-kind loan so that the pilot could offer 2.5% financing for energy efficiency measures. 3. The Environmental and Energy Study Institute (EESI) in Washington, DC received funding from the Doris Duke Charitable Foundation to assist with program design and outreach and provide a report to key stakeholders, including Congress and state and national opinion leaders. Central Electric and ECSC developed an initial plan and hired Ecova, a firm that implements energy efficiency programs for utilities around the country, to assist with program planning, management and analysis. Ecova partner Integral Analytics applied their expertise in energy efficiency and demand response to analyze cost-effectiveness. Carton Donofrio Partners, a market research firm, was contracted to help develop training and marketing materials, conduct surveys and report on the views of program participants. Two other organizations played key roles. 1st Cooperative Federal Credit Union prepared and processed loan documents and KW Savings, a new not-for-profit created by Central Electric and ECSC, supported co-ops, facilitated program processes, managed quality control measures, paid contractors and tracks loan repayments. The eight participating rural electric cooperatives (Aiken Electric, Black River Electric, Broad River Electric, Horry Electric, Palmetto Electric, Pee Dee Electric, Santee Electric and Tricounty Electric) worked together with the program team from Central, ECSC, KW Savings and Ecova to develop a program plan for retrofitting 100 homes and collecting data on the costs and savings of efficiency measures such as insulation, heat pumps, air sealing and duct sealing. The co-ops also provided staff to market the program, conduct initial home inspections, sign up consumers and set up the loan repayments. Independent auditors certified by the Building Performance Institute (BPI) were selected and then trained to use consistent procedures and modeling software. Co-ops began conducting outreach and screening participants, seeking homes with higher than average energy bills. A co-op energy adviser conducted a walk-through energy audit. Finally, a comprehensive energy audit using BPI standards was conducted to qualify projects in which predicted energy savings exceeded the loan repayments. The select group of contractors qualified after program training, background screenings and signing program agreements, competed to win bids and install efficiency measures in homes. Loans were approved and efficiency measures were installed in 125 homes. Energy auditors returned to each site after the retrofits to ensure that measures were installed correctly. Carton Donofrio Partners conducted a survey of both participants and co-op members who knew of the pilot but did not participate. The survey revealed that the vast majority of coop members contacted about the pilot had the same or higher satisfaction (92 percent) with their co-op as a result of being contacted. Nearly all (96 percent) participants were satisfied with the installation of the efficiency measures and the same percentage responded that they believe that their homes were more comfortable after the improvements. 225 LEADERS OF THE PACK © ACEEE Contractors were asked to provide feedback, and 14 of the 16 contractors who did any work on the pilot attended a debriefing meeting at Central. They stressed the value of the co-op serving as “trusted adviser” and asked that co-ops continue playing this role and convert the pilot to an ongoing energy efficiency loan program. They also offered useful ideas on how to streamline the process. The eight participating co-ops provided very detailed feedback to the implementation team via in-person presentations. Six saw a need for an on-bill financing loan program and four expressed an interest in launching similar programs locally. The co-ops praised the contractors for their constructive and positive reaction to quality assurance visits and noted that contractors routinely went above and beyond the scope of work without additional compensation. All of the co-ops recommended streamlining the process to save money and expedite projects. Perhaps the most telling result is the participating co-ops’ change in perspective on on-bill financing (OBF) programs. As the pilot began, none of the co-ops involved had expressed any intention to offer an ongoing OBF program. However, at the pilot’s end, four co-ops were already making plans to launch their own OBF programs in 2012. They were joined by three co-ops that had not participated in the pilot. Program Performance The last of the installations were completed in February 2012. More than 350 data fields were collected on each home. An interim analysis showed that homes selected for the pilot provided an ample supply of efficiency opportunities. HVAC upgrades were installed in 84 percent of the homes, often replacing electric resistance heat with highly efficient heat pumps. More than 90 percent of the homes required attic insulation – 89 homes had R11 or less (R38 is commonly recommended). More than 90 percent of homes needed air sealing, duct sealing and attic insulation. The average loan was more than $7200. Projected Savings from Average Pilot Program Home Monthly Annual Electric Savings (kWh) 933 11,191 $ Savings $103 $1,240 Loan Repayment $73.22 $878.64 Net (Savings - Loan) $33.62 $403.44 These results are preliminary. Actual energy use was monitored carefully through the end of 2012, and a final report produced by Integral Analytics is pending. It will be available sometime in March 2013. Lessons Learned This program provided some answers to questions it was designed to answer, and provided some additional lessons relevant to the original goals of the program sponsors. 226 LEADERS OF THE PACK There is an ample supply of cost-effective (positive cash flow with a 10-year, 2.5% interest loan) energy efficiency opportunities in the homes of South Carolina co-op members. Participants were happy with the program. The vast majority (96%) of participants were satisfied or very satisfied with the work performed. The pilot has already served as a model for national policy in one respect, as the first program to access REDLG loan money for an on-bill financing program. There is substantial interest around the country – the CEO’s from both Central and ECSC have received inquiries from policymakers in D.C. and invitations to speak about the pilot. The most telling result may be the actions of the participating cooperatives. As the pilot began, co-ops were skeptical about the viability of an ongoing program. At the end of the pilot, however, seven co-ops expressed interest in managing a program under the Help My House brand. Five co-ops are currently doing so. Home energy contactors were extremely pleased with the program and said that they would expand their businesses if the program was scaled-up significantly. Post-audits greatly improved overall program accountability, quality, and customer satisfaction. The need to call back contractors to do additional work on homes dropped as the pilot progressed and contractors became more familiar with the program’s expectations. Program at a Glance Program name Help My House Targeted Customer Segment Members of South Carolina rural electric cooperatives Program Start Date Annual Energy Savings Achieved Pending (1.4 million kWh projected) Peak Demand (Summer) Savings Achieved: Pending Other Measures of Program Results to Date: Electric savings per home are projected to be approximately 35 percent of annual use Budget for most recent year (and next budget cycle if available): 2011 budget includes about $740,000 in loan funds from REDLG and more than $1,000,000 from Central Funding Sources (name and description): Primary sources of funding came from Central and from USDA’s Rural Economic Development Loan and Grant (REDLG) Program Website: Best Person to Contact for Information about the Program: Name Lindsey Smith Position Director of Public and Member Relations Organization The Electric Cooperatives of South Carolina Phone number 803-739-3046 227 LEADERS OF THE PACK © ACEEE Email address [email protected] COOPERATIVES AND PUBLIC POWER RESIDENTIAL— HONORABLE MENTION ENERGYRIGHT SOLUTIONS® IN-HOME ENERGY EVALUATION (IHEE) PILOT PROGRAM TENNESSEE VALLEY AUTHORITY (TVA), PROGRAM ADMINISTRATOR TENNESSEE VALLEY AUTHORITY’S ENERGY EFFICIENCY AND DEMAND RESPONSE (EEDR) ORGANIZATION, IMPLEMENTER Program Overview The In-Home Energy Evaluation Pilot was designed and implemented in 2009 to encourage the installation of energy-efficiency Improvements in existing single-family dwellings throughout the Tennessee Valley. This Pilot is available to qualifying residential homeowners served by local power companies that participate in the In-Home Energy Evaluation Pilot Program. Qualifying participants have an onsite evaluation of their homes’ potential for energy efficiency improvements. Participants receive a customized home energy report listing prioritized recommendations, based on an estimated return of investment to the customer. The report provides recommended Improvements, such as upgrades in appliances, insulation, ventilation, doors and windows, heating and cooling systems, infiltration reduction/weatherization, lighting, rehabilitation (repairs), or other energy related applications in the home. Completing the recommendations may be as simple as changing a light bulb or changing participant behavior. However, recommendations with best returns are likely to require installation, repair, or maintenance services. The on-site evaluation is performed for a standard $150 fee (can vary during promotions at times in certain local power company areas) that is refundable if the homeowner spends at least $150 on eligible recommended improvements. Participants have a 90-day window to complete the improvements to qualify for incentives and a refund of their $150 fee. Participants are encouraged to complete as many recommendations as possible. Incentives are available for those recommendations that have been pre-approved for either cash reimbursements and/or financing when installed in accordance with the Pilot’s standards and requirements. The maximum cash reimbursement per household is $500 for all work completed. Some improvements have lower maximum amounts, and some options may be limited based on the local power company selection. Participants are given a list of installation contractors that are approved to complete work and all final work is subject to inspection or verification as required in the Plan’s guidelines. Self-installation for measures may be permitted in some areas; otherwise a Quality Contractor Network (QCN) member is required for recommended improvements to be incentivized. 228 LEADERS OF THE PACK This QCN Network arrangement between TVA, local power companies, and local contractors joins three entities committed to the design, installation, servicing, and promotion of energy efficient products throughout the Tennessee Valley. TVA manages a master list of eligible contractors that have met the qualifications for QCN membership. Each local power company then selects contractors from the master list for its individual member list. That list is provided to end-use participants who choose to have recommended improvements made. The benefits of the IHEE Pilot may be most accurately reflected from the viewpoint of the QCN membership. These companies are able to leverage this relationship to serve residents in their quest to become more energy efficient and, in doing so, improving the QCN member’s business. One of TVA’s missions is to benefit economic development in the Tennessee Valley and this program certainly aids that goal. Low-interest, fixed-rate, on-bill financing is offered by some local power companies for participants of the IHEE Pilot. Financing, which can go up to $20,000, can cover heat pump equipment and/or weatherization improvements. All loans are subject to credit approval before work can be performed. Two program models are available for local power companies to offer their end-use customers. First, the turnkey option provides a 3rd party company to administer the IHEE Pilot in their service territory. Currently, Conservation Services Group (CSG) operates as the 3rd party administrator. Second, local power companies have the option of operating the pilot with their own staff. Of TVA’s 155 local power company customers, 144 are participating in the In-Home Energy Evaluation Pilot. Of the 144 participating local power companies, 108 of these utilize the turnkey model option, whereas 36 administer the program themselves. Only single-family homes that have had electric service for a minimum of one year are eligible to have an in-home evaluation conducted on their premises. All in-home energy evaluations are required to be conducted by a TVA-certified Evaluator. This evaluator is trained in building science curricula and certified by TVA as being adequately knowledgeable and capable of performing in-home energy evaluations. The IHEE Pilot is also an effective customer service tool for TVA and the local power companies. This touch point, which many times, creates a benefit to the end-use customer’s bottom line is strengthening local power company/customer relationships throughout the Tennessee Valley. Program Performance As of the end of the fiscal year 2012 (September 30, 2012), TVA and their local power companies have performed an industry-standard of over 46,000 program evaluations in homes throughout the Tennessee Valley. That staggering number of evaluations performed in a 3.5 year period is one that very few utilities can attest to. A snapshot of the program at the end of fiscal year 2012 revealed the implementation rate of the IHEE Pilot to be around 70%. This means that roughly 70% of participants (outside of the 90-day window in which work is required to be completed) requested a rebate for at least one recommended IHEE 229 LEADERS OF THE PACK © ACEEE improvement measure after an evaluation of their home. The implementation rate is confirmed since 100% of participant homes require post-inspections. From an internal standpoint, the IHEE Pilot has also contributed a substantial kWh savings for TVA. This program yields an annual savings of 1,374 kWh per installation. That equates to a 3- year program savings of 50,561,529 kWh, or 50.8 GWh, achieved. When reviewing the performance of TVA’s In-Home Energy Evaluation Pilot Program, one key thing to note is the steady increase in program spending as the program continued to gain market traction. TVA’s In-Home Energy Evaluation Pilot Program Program Spending Program Savings (kWh) Program Savings (KW) Number of Participants 2010 $ 8,626,634 8,843,464 5,657 9,428 2011 $ 13,962,561 16,355,993 10,305 17,144 2012 $ 16,372,031 25,681,104 7,319 17,861 In Fiscal Year 2010, over 9,000 participants took advantage of the IHEE program and TVA spent $8,626,634 on the program. In Fiscal Year 2011, the participant number nearly doubled to a number above 17,000, and the program spend increased to nearly $14,000,000. In Fiscal Year 2012, the number increased slightly to 17,861, however the program spend continued to rise to a total above $16,000,000 due to increasing number of customers making improvements (higher incentives). Program energy savings for the In-Home Energy Evaluation Pilot Program has increased by a significant amount every year. Kilowatt-hour (kWh) savings increased from 8,843,464 kWh in Fiscal Year 2010, to 16,355,993 kWh in Fiscal Year 2011, to a high of 25,681,104 kWh in Fiscal Year 2012. The Kilowatt (KW) savings increased from 5,657 kW in Fiscal Year 2010, to 10,305 kW in Fiscal Year 2011, and settled into a savings of 7,319 kW in Fiscal Year 2012. The cost effectiveness test of choice within TVA for the In-Home Energy Evaluation Pilot Program is the Total Resource Cost (TRC) test. In Fiscal Year 2012, this pilot yielded a TRC of 0.28. This number is an area of improvement for the IHEE Pilot and is a key consideration in the design of the new residential existing homes program option that will go to market in the near future. In addition, the lifetime estimated cost of the IHEE Pilot is roughly $0.055 per kilowatt-hour. Lessons Learned There have been many lessons learned over the lifetime of the In-Home Energy Evaluation Pilot Program. The key lesson learned is the steady expense of running an effective program of this magnitude. The IHEE pilot has been a rousing success for homeowners, contractors, and local power companies, however, the current design is not financially sustainable longterm. 230 LEADERS OF THE PACK A second lesson learned is the need for an extended customer relationship tool with the end-use customer. For example, the IHEE Pilot was designed as a one-time option for the consumer where they file for rebates after an evaluation on eligible recommended improvements. Going forward, we have identified a need for an ongoing relationship where the consumer can continue to receive incentives for recommended improvements for an extended period of time. This has been noted as an improvement opportunity in the new program option. Finally, TVA learned that beyond the initial marketing campaign, not a lot of additional mass marketing is needed. The Quality Contractor Network membership has continued to drive this program, even though no widespread marketing initiative has been undertaken by TVA since 2011. Program at a Glance Program name EnergyRight Solutions In-Home Energy Evaluation (IHEE) Pilot Program Targeted Customer Segment Residential Single Family Homeowners Program Start Date 2009 Annual Energy Savings Achieved 25 GWh in FY2012, 23.4 GWh goal in FY2013 Peak Demand (Summer) Savings Achieved: .41 kW per Install in FY 2012 Other Measures of Program Results to Date: Lifetime estimated $/kWh of $0.055 Budget for most recent year (and next budget cycle if available): $16,372,031 spent in FY2012. $14,350,000 budget in FY2013 Funding Sources (name and description): TVA Annual Internal Budget Website: www.energyright.com Best Person to Contact for Information about the Program: Name Ginger Lawyer Position Product Manager Organization Tennessee Valley Authority Phone number 615-232-6684 Email address [email protected] 231 LEADERS OF THE PACK © ACEEE COOPERATIVES AND PUBLIC POWER, BUSINESS — EXEMPLARY ENERGY EFFICIENT CITIES ROCHESTER PUBLIC UTILITIES (ELECTRIC MUNICIPAL UTILITY), MINNESOTA ENERGY RESOURCES (INVESTOR-OWNED GAS UTILITY IN ROCHESTER), AUSTIN UTILITIES (GAS AND ELECTRIC MUNICIPAL UTILITY), AND OWATONNA PUBLIC UTILITIES (GAS AND ELECTRIC MUNICIPAL UTILITY), PROGRAM ADMINISTRATORS CENTER FOR ENERGY AND ENVIRONMENT AND GREG ERNST AND ASSOCIATES, IMPLEMENTERS Program overview Implementing a comprehensive whole-house residential program (with both gas and electric savings) presents unique challenges, as well as unique opportunities, for small to mid-sized municipal utilities. A major challenge is that these comprehensive programs can be complex to design, implement and coordinate without large economies of scale, especially if the gas and electric utilities are different. However, in smaller communities there is also greater potential to effectively use community-based approaches for recruitment and to encourage greater uptake of efficiency measures, as well as to coordinate these efforts among cities in close proximity to each other. The Energy Efficient Cities program is a highly collaborative and effective partnership for implementing a comprehensive residential program, featuring community-based recruitment methods. Beginning in late 2009, three municipal utilities in southern Minnesota (Rochester Public Utilities, Austin Utilities, and Owatonna Public Utilities – collectively referred to as “The Triad”) along with the gas utility in Rochester, Minnesota Energy Resources (MERC), teamed up to deliver a residential energy efficiency program that used new approaches to unleash the potential for energy efficiency in homes. These new approaches created a “onestop shop” integrated approach to make adoption of energy efficiency actions as easy as possible for the homeowner, while maximizing participation and energy saving opportunities. Along with several other cities in Minnesota, these efforts were collectively referred to as “Energy Efficient Cities,” but each city had its own brand name for the program. The Center for Energy and Environment (CEE), a non-profit, designed the programs and helped implement the marketing for these programs. The cornerstone of the “Conserve and Save House Call Program” (Owatonna and Austin) and the “Neighborhood Energy Challenge” (Rochester) was community-based marketing strategies that created a social norm for saving energy. More than economic drivers, the establishment of energy efficiency as a community norm is what drove program participation and ultimate energy savings in these three communities. Extensive community outreach brought homeowners to workshops, where they learned about the energy efficiency offerings and could sign up there for a home visit. This recruitment technique proved effective in getting homeowners interested and willing to 232 LEADERS OF THE PACK take the next easy step. Workshops prepared homeowners for the home visit, including setting expectations that doing major upgrades is an important part of a home’s energy efficiency. At the home visit (conducted by Greg Ernst and Associates, a local home performance auditing company), homeowners received personalized assistance and recommendations from energy efficiency experts. These visits involved diagnostics to determine the need for insulation and air sealing, typically with a blower door test. The heating systems were checked for safety and level of efficiency. To maximize energy savings potential, low-cost materials were installed during the home visit, including CFLs, low-flow showerheads and pipe wrap. At the end of the visit, homeowners were presented with any recommendations for major upgrades like insulation, air sealing and heating system replacement. A quality assurance program for insulation contractors helped to give homeowners confidence that the job would be done. Well-designed feedback reports were an integral part of the program, and these three municipal utilities contracted with OPOWER. Having a score that provided context for homeowners helped to encourage actions after the home visit, and helped sustain interest in taking energy saving actions. In addition, homeowners received assistance in selecting contractors, tapping into utility incentive programs, and help with financing if needed. Follow-up phone calls and emails from CEE helped homeowners answer additional questions and remind them of opportunities to take actions (rebate offers, etc.). Energy-saving measures and end uses targeted by the program included the following: Low or no-cost actions defined and hyped at the workshops, as well as at the audit (wash clothes in cold water, turn off lights behind you, set back your thermostat, change computer power management settings, etc.); Installation of CFLs, given out at the workshops, and installed at the audit; Installation of showerheads and pipe insulation; Wall, attic, and rim-joist insulation, encouraged through rebates of $150 - $600; and HVAC replacement, encouraged through rebates of $100 – $350. Program Performance The program has performed well, as evidenced by increasing participation, cost effectiveness, and participant satisfaction. A program evaluation was conducted for program performance through June 2011, and is available at: http://www.mncee.org/Innovation-Exchange/Resources/Energy-Efficient-Cities--Usinga-Community-Based-A/ This evaluation shows the conversion rate (percent of households completing an upgrade) to be 32 percent for all three cities. Although full performance numbers are not yet available for 2012, the program has continued to be popular, with higher participation than ever (over 500 households). 233 LEADERS OF THE PACK © ACEEE In addition, a survey of program participants was conducted in 2012, with 69 homeowners responding. 98.5% of these respondents reported being either “satisfied” or “very satisfied” with their experience with the program, and 100% of respondents would recommend to a friend. These are very high satisfaction rates for a home performance program. The following table summarizes program performance for all three cities. Electric savings and budget were generally not tracked separately, so the benefit-cost ratios are for gas only, and the electric-only budget is only an estimate. As the program did not start until November 2009, and full 2012 numbers are not yet available, only 2010 and 2011 are reported. 2010 2011 Program cost $235,000 $255,000 Program cost, gas only (est.) $193,000 $236,000 Number of participants 493 394 Gas savings (Dth, gross annual) 4,166 4,325 Electric savings (kWh, gross annual) 113,092 87,512 Lifetime gas savings (Dth) 51,283 60,888 Lifetime electric savings (kWh) 1,063,061 822,617 Lifetime cost of saved energy ($/therm) $0.38 $0.39 Utility Cost Test (UCT) (gas) - 2.32 Societal ben-cost ratio (gas) - 1.12 The benefit-cost ratios are as reported for the program by MERC, the gas utility serving Rochester only (and the largest of the three cities). Ben-costs for Austin and Owatonna were not available. Budget numbers provided include program administration, as well as incentive costs. Lessons Learned The program report from 2011 contained the following lessons learned: Community-based marketing combined with traditional marketing can be an effective approach. Workshops were found to be a highly effective way to jumpstart participation in residential programs, as well as improve program results. However, it is recognized that those willing to take time away from evening and weekend activities to attend a workshop represent only a segment of the population. To reach deeper participation, future efforts may need to evolve to a program model that goes beyond workshops as a main recruitment method. Combining low-cost measures with insulation measures can increase savings beyond that achieved by separate strategies. Combining these direct install measures with an effective pathway for the homeowner to install major upgrades (in particular, insulation and air sealing) increases the overall cost-effectiveness of the 234 LEADERS OF THE PACK program, eliminates the need for multiple visits to the home, and maximizes all opportunities for energy efficiency through a comprehensive approach. Quality control and contractor training is important to achieving savings and homeowner confidence. In initial quality-assurance visits, CEE found that even some experienced insulation contractors were not properly completing jobs, particularly air sealing. Insufficient air sealing, as discussed above, not only results in less energy savings, but can create other problems for the homeowner. Incorporating quality assurance into the program design not only forestalls these problems, but serves as a major selling point for the program. Motivating homeowners to complete upgrades is critical. The program design of Energy Efficient Cities lends itself to maximizing the number of households that complete upgrades. This includes an orientation toward homeowner engagement and persuasion from the very beginning of the program, an easy pathway for homeowners to find reliable contractors, and a process for following up with homeowners after the home energy visit. This hand-holding approach is necessary to keep homeowners engaged in the process. Program at a Glance Program name Energy Efficient Cities Targeted Customer Segment Residential homeowners Program Start Date November, 2009 Annual Energy Savings Achieved (Dth) 4,246 Peak Demand (Summer) Savings Achieved: n/a Other Measures of Program Results to Date: 32% conversion rate for major upgrades Budget for most recent year (and next budget cycle if available): $255,000 Funding Sources (name and description): Initially with state start-up grant, now entirely utilityfunded Website: http://www.rpu.org/your-home/rebatesprograms/energy-audits.html Best Person to Contact for Information about the Program: Name Carl Nelson Position Manager of Residential Programs Organization Center for Energy and Environment Phone number 612-335-5871 Email address [email protected] 235 LEADERS OF THE PACK © ACEEE COOPERATIVES AND PUBLIC POWER, BUSINESS — EXEMPLARY ENERGYRIGHT® SOLUTIONS FOR BUSINESS AND INDUSTRY TENNESSEE VALLEY AUTHORITY, ADMINISTRATOR NEXANT, IMPLEMENTER Program Overview EnergyRight Solutions for Business and Industry (ERSB/ERSI) are retrofit programs for all commercial, municipal and state accounts regardless of demand and industrial accounts with demand less than 5 MW in the Tennessee Valley Authority (TVA) seven state service area. TVA administers and funds the program from power sales and offers the programs through the 155 local power companies (LPC) served by TVA. Nexant is the program implementer. The program first targeted the commercial sector because it had the greatest influence on TVA’s peak with a focus on lighting and HVAC. Four different facility types were identified: large offices, schools, hospitals and warehouses. Based on these facility types, commercial segments were targeted including: municipals, universities and schools, healthcare, real estate and warehouses. Manufacturing from the industrial sector was added soon after the program launch. The program offers high quality advice including unbiased savings estimates, facility assessment (if needed), a vetted Preferred Provider Network (PPN) listing of contractors, manufacturer reps, designers and engineering consultants with up-to-date credentials, and cash incentives for equipment change outs. Incentives are paid based on targeted measures which account for the greatest electricity use and are ubiquitous across the targeted sectors. Lighting, including solid state lighting, HVAC (DX), motors, and commercial food service equipment are the targeted measures that are handled through the Standard Rebate offering. ERSB/ERSI is delivered with a geographically oriented delivery structure. Significant climate differences exist within the TVA service area which ranges from the Appalachian Mountains to near the Mississippi Delta region. The program delivery structure includes one TVA engineer and one TVA relationship manager for each of seven geographic regions. The engineer is responsible for project co-ordination including managing the process from application to implementation and measurement for settlement of incentives. The relationship manager in each region co-ordinates communications with the local power companies' staffs, markets the program within the region. Project applications are submitted by the end use customer, PPN members, non-PPN contractors and by LPC accounts directly. Nexant staff manages the back office operations and measurement of savings for incentive settlement once a project is complete. 236 LEADERS OF THE PACK Cash incentives are paid at $0.10/kWh annual savings during the first year following project completion, for Custom projects, with incentives presently capped at 70 percent of project cost whichever is less. Prescriptive rebates are also available for common equipment changes. These are favored by accounts who know what types of changes need to be made and who do not require advice. To be eligible for a Custom incentive or Standard rebate, a project application must be submitted and approved before purchase orders are issued for new equipment or work begins. Efficiency projects that involve fuel switching are not eligible for this program. The history of efficiency programs at TVA reflects a transition with changing economic and competitive pressures. Two of TVA's key points of focus since the agency's creation in 1933 have been to improve the quality of life of residents and the economic viability of businesses in the service area. These are both natural outcomes of efficiency programming. TVA also benefits since energy efficiency is another generation resource that helps to postpone additional generation asset construction and deployment while helping to prepare for the potential elimination of older generation assets. In turn, this also helps to keep the delivered cost of power low. Key recent events in TVA efficiency programs began with the adoption of a strategic plan recognizing the need for a comprehensive approach to meet future electricity needs through demand-side management (DSM). TVA recognized that improving peak reduction in a costeffective way could only be achieved through a broad cooperative effort with strong support from TVA’s customers' (Local Power Companies and large industrial accounts), stakeholders, and market actors. TVA focused on efficiency as a means to demand reduction by restructuring the entire marketing organization with a realignment to identify efficiency opportunities that would reduce demand for the 700,000 commercial and industrial accounts served by the LPCs that purchase electricity from TVA. ERSB/ERSI was designed using a consumer goods product design model. Interviews were conducted with a variety of market actors and stakeholders including equipment installers, suppliers, and manufacturers to determine the best opportunities and needs for efficiency assistance. Teams of LPC and TVA staff participated in the program design to capture the expressed requirements. Findings revealed that accounts were diverse, viewed electricity as a fixed cost, some needed assistance in sifting through competing offers and in assessing energy savings claims, and some wanted to remain autonomous by being able to self-install equipment or use trusted partners with whom they had relationships. Research also revealed that TVA and LPCs were trusted sources of unbiased information. Equipped with the knowledge gained and the new program design process, a program to address the Commercial sector, Commercial Efficiency Advice and Incentives program (CEAI), was designed in 2008 to capture the requirements expressed with emphasis on flexibility in program access while retaining high standards of savings calculation and attribution. Program entry was initially based on three different types of energy audits. The customer’s electricity use and savings potential determined the type of assessment required. The CEAI program was launched in January 2009 and transitioned to EnergyRight Solutions for Business and EnergyRight Solutions for Industry with the creation of this TVA corporate efficiency program umbrella. 237 LEADERS OF THE PACK © ACEEE The PPN and vetted lighting equipment lists are valued program resources. Solid-state lighting, LEDs, that are Energy Star, listed on the DesignLights Consortium Qualified Products List, or noted on the Lighting Design Lab Design Lamp List are eligible for incentives. Using these lighting resources ensures appropriate testing using IESNA and ASHRAE standards, appropriate product life, efficacy, warranty, and provides information about other significant lighting factors. TVA found that, rather than an energy assessment, most of the LPC customers simply needed help in identifying contractors with the appropriate credentials. The audit requirement was dropped, although it still remains a viable resource for customers, as the PPN was developed and trained in program requirements. The PPN list of contractors provides options for accounts without a trusted ally with whom they work. TVA staff managed the trade ally network design and initial development transferring this operational responsibility to Nexant during 2012. Initially incentives were based solely on estimated coincident peak demand savings, $200 per kW. This incentive proved to be problematic since it was difficult to explain, difficult for end-users to understand, and viewed with suspicion by some. In April 2011, the demand incentive was eliminated with the transition to $0.05/kWh estimated annual savings. The suspicion that the new incentive was too low was confirmed by a low program participation level. Six months later the incentive was increased to $0.10 per kWh saved. Although no longer incentivized, summer peak demand savings continue to be tracked for system planning purposes and are used to identify targeted measures. Program Performance EnergyRight Solutions for Business and Industry (ERSB/ERSI) has grown rapidly since first implemented in January 2009 as CEAI. This was a challenging time to launch an efficiency program given TVA's limited program infrastructure and the significant economic downturn. Today the program has achieved substantial energy savings and provides benefits to local power company customers of all sizes. This high performing program is a significant contributor to TVA’s growing demand–side resource. The program year is based on TVA’s fiscal year which begins October 1 and ends the following September. Program costs have averaged $10.2 million for full program years 2010 – 2012. During this time program spending has increased from $3.6 million in 2010 to $7.5 million in 2011 and rising to $19.2 million in 2012 as participation and savings have also risen. The 2013 program budget is $19.6 million, which is the anticipated level of program costs for the next few years. Gross savings of 352.5 GWh have been achieved in the past three years as shown in the table below. This savings would power 22,000 Tennessee Valley homes for a full year. Total summer peak savings of 62.4 MW have also been achieved: 12.0 MW in 2010, 18.7 in 2011, and 31.7 in 2012. This savings have been achieved at a benefit-to-cost ratio of 1.1 – 1.6, total resource cost, and utility cost test of 2.3 to 2.4 depending on the program component. Participation has also increased over this timeframe: 200 projects in 2010, 831 in 2011, and 1914 in 2012. For first quarter 2013 overall GWh savings are 380% of the quarter goal or 56.5% of the annual GWh goal. Similarly, MW savings for the first quarter are 47.3% of the 238 LEADERS OF THE PACK annual goal with expenditures of 52.6% of the annual budget. For the first time, a waiting list may be required. 2010 2011 2012 Program Expenditures ($ million) $3.6 $7.5 $19.2 Gross Energy Savings (GWh) 43.1 120.5 198.9 Gross Demand Savings (MW) 12.0 19.0 32.0 While costs appear to be escalating per savings measure and participant, this increase is greatly overstated. Research and design costs for program components to be added in the current and future years are included in the program total spend. This ensures that all program costs are budgeted and accounted for. During 2013, a small business direct install pilot will be implemented. New construction/major renovation (including commissioning) and retro-commissioning will be added in future years. These additions will move more offerings under the ERSB/ERSI program umbrella developing a comprehensive full service offering for all C&I segments. No impact evaluation has been completed for the program but one is currently in process in 2013. Program costs effectiveness tests are determined based on program component and not for the program as a whole. This provides a greater level of understanding of the costs of program components. Overall the cost effectiveness has been acceptable with lifetime costs per kWh resulting in a program that provides a very cost effective generation source. Lifetime costs of conserved energy for 2010 – Q1 2013 average $0.0063/kWh. Lessons Learned Taking action as a result of lessons learned had to start with incentive changes and modifications to keep the process as simple and hassle-free as possible. These hassles were primarily due to lack of account understanding of peak demand charges. The many potential program changes from lessons learned include: The industrial and manufacturing sector was incorporated to provide a more comprehensive offer, and to access the energy-saving potential of this sector. Assessments are no longer required, but are still available if needed. Assessments increase costs significantly, however, the customer’s need for information is not necessarily for information in the form of an energy audit – it could be simply giving them equipment and contractor lists. Significant savings have been attained and considerable potential hassle removed by automating the enrollment and back-office processes. The EnergyRight name, used to market TVA residential efficiency programs for a number of years, transitioned to EnergyRight Solutions for all customer classes and sectors provided a consistent corporate program identity across all sectors. Preferred Partner Network, the trade ally network, is a valuable part of the program. 239 LEADERS OF THE PACK © ACEEE Management of the PPN has transferred from TVA to Nexant to foster growth and to facilitate turnaround time for applicants. Greatly simplified the measurement and valuation, which participants early on found to be cumbersome. Important opportunities to leverage resources and maximize benefits have been seized, such as accepting offerings by the Federal and state governments and others. ERSB/ERSI program staff realizes that a robust data system is essential to successful program management. Providing special attention to small accounts has addressed the limited participation by small business. Program at a Glance Program name EnergyRight Solutions for Business/ EnergyRight Solutions for Industry Targeted Customer Segment Municipals, universities and schools, healthcare, real estate, warehouses and manufacturing Program Start Date January 2009 Annual Energy Savings Achieved 132.8 annual average GWh 2010-Q12013, 198.9 in 2012 Annual Peak Demand (Summer) Savings Achieved 22.45 MW annual average 2010-Q12013, 31.7 in 2012 Other Measures of Program Results to Date (such as number of participants, participation rates or market penetration) 1429 participants annual average 2010-Q12013, 1914 in 2012 Budget for most recent year (and next budget cycle if available) $ 19,221,684 2012 and $ 19,592,303 Funding Sources (name and description) TVA Power Sales Website www.energyright.com Best Person to Contact for Information about the Program: Name Jeromy Cotten Position Program Administrator Organization TVA Phone number 615-232-6823 Email address [email protected] 240 LEADERS OF THE PACK COOPERATIVES AND PUBLIC POWER BUSINESS — HONORABLE MENTION LPEA COMMERCIAL LIGHTING RETROFITS LA PLATA ELECTRIC ASSOCIATION (LPEA), PROGRAM ADMINISTRATOR AND IMPLEMENTER Program Overview When the announcement came that T-12 fluorescent light bulbs were effectively being phased out due to new federal lighting efficiency standards, LPEA, as a rural electric cooperative, owned by its member-customers, sought to both communicate the change in lighting technology and assist its commercial customers (local businesses) with understanding the new energy efficient options. Ultimately, the move toward more energy efficiency would help LPEA’s commercial member-customers lower their overhead and better their bottom line, while also reducing the need for extra electricity generation. LPEA marketed energy efficient lighting retrofit benefits to its members through radio and print advertising, news releases and articles, flyers and workshops. Messages included: Reduce energy use by 10-30% (thus decreasing energy bills) Heat reduction Improved lighting quality Realize return on investment in less than three years Prior to meeting with a business owner, LPEA’s project specialist researches the location’s energy usage and history. All businesses are eligible, including large and small, commercial and industrial. At the site visit, he walks through the facility with the owner, not only viewing the lighting, but also learning about the business’ needs and type of lighting desired. The site visit also allows LPEA to offer the business suggestions (energy assessment) on additional energy efficiency opportunities beyond lighting. The initial financial incentive, in addition to energy and dollars saved from the retrofit, comes in the form of a rebate from Tri-State Generation & Transmission, LPEA’s wholesale power supplier. Tri-State offers $250 per kW reduced. (This is gross reduction, based on the total existing (pre) wattage for the lighting electrical load versus the replacement (post) wattage). In addition, in 2010 LPEA received a grant from the Colorado Governor’s Energy Office for the Main Street Energy Initiative designed to help utilities launch energy efficiency programs with its local community businesses. LPEA was thus able to offer businesses that qualified an additional $1200 each. Recently, Tri-State has also added a rebate for installation of LED bulbs (up to $10 per qualified bulb purchased), which gives LPEA an additional lighting option and is more attractive to retail-type operations, as opposed to office and warehouse buildings that tend to have overhead fluorescents. Once a business has completed the lighting retrofit, LPEA continues to monitor the electric bills, providing the business, over time, with updates on the amount of electricity and 241 LEADERS OF THE PACK © ACEEE dollars saved. The rebate checks are delivered in person to provide additional customer service and follow-up. LPEA’s team continues to meet with suppliers, attend conferences and conduct on-going research to keep up with the rapidly changing lighting technology that will, in turn, be passed on to businesses. Program Performance Since beginning the program in 2010, LPEA’s Commercial Light Program has been embraced by the business community and proven extremely popular. LPEA has, as of this writing, helped more than 170 businesses within its service territory reduce both its energy usage and their electric bill. Combined, these businesses have lowered the demand by 700 kW or 2,000,000 kilowatt hours saved annually. This translates to approximately $200,000 saved annually on the electric bill. Members have received $200,000 in rebates from Tri-State. Also, in 2010, 32 businesses received an extra $40,000 (energy efficient lighting rebate of $1200 each) by participating in the Colorado Governor’s Energy Office Main Street Efficiency Initiative grant administered by LPEA. For 2011 and 2012, LPEA partnered with local businesses to review energy efficient lighting options and savings. This effort was enhanced by LPEA utilizing two additional grants: the USDA Rural Energy for America Program and the EPA Climate Showcase Communities Grant Resource Smart Business Program. Given the jobs generated for the lighting retrofits (electricians, lighting consultants, bulb distributors), LPEA has calculated local economic stimulus during the 2.5 years of employing the program at $1,100,000. LPEA’s business members’ response has been tremendous. In essence LPEA no longer needs to market the program, as the publicity and word-of-mouth have new businesses calling the project team every day. In 2010, LPEA reflected that it had been “The Year of the Lights,” but it proved the same in 2011 and was even more successful in 2012. Year Program Spending # of Participants 2010 $115,000 16 2011 $150,000 2012 Total Cumulative kWh Saving Cumulative kW Savings Cumulative kWh $ Savings 595,764 201 $ 62,555 75 1,375,000 474 $144,375 $160,000 80 2,181,000 796 $229,005 $425,000 170 4,151,764 $435,935 Program $ Spending includes rebates and administration salary. Savings are estimates based on average 9.5 hours of operation a day, 6 days per week. Cumulative savings include the linear sum of the continuing impact from previous years. Utility Cost Test ratio: 3.01 Cost of Program $425,000 Benefits of Program $1,280,725 Benefits include lifetime kWh savings at a fixed $.07 per kWh. This is the avoided supply cost of energy. 242 LEADERS OF THE PACK Lifetime (ten yrs) cost of conserved energy ($/kWh): $0.0232 Lessons Learned LPEA’s Commercial Lighting Retrofit program has proven that providing customers with a little financial incentive in addition to one-on-one customer service prompts change. Further benefits have come from partnerships with organizations like the Governor’s Energy Office, the Durango Business Improvement District, and more, to secure additional funding, as well as spread awareness of the program and the benefits provided to business owners from the energy savings resulting from participation in the program. While traditional marketing tools initially got the word out, possibly the most effective effort for prompting customers to take action was the series of lighting workshops that enabled those attending to truly understand the new technology and the benefits to their businesses. Another successful activity has been publishing written profiles of businesses that have changed out their lights in LPEA’s monthly newsletter and on the web site. The businesses garner additional publicity and shine in the eyes of their peers who read about their efforts. Perhaps the only caution to others launching such as program is that LPEA did not fully anticipate the amount of interest from businesses, and in hindsight would have benefitted from a doing a full analysis of staffing needs prior to initiating the marketing effort. Staff duties were realigned as the program took hold, and today one member of the Corporate Services team devotes his time exclusively to working with businesses on their lighting retrofits. Support for the program also comes from other team members for marketing, administration and research. Program at a Glance Program name LPEA Commercial Lighting Retrofits Targeted Customer Segment Businesses / Schools / Government Facilities Program Start Date January 2010 Annual Energy Savings Achieved 4,152 MWh Peak Demand (Summer) Savings Achieved: 796 kW Other Measures of Program Results to Date: 170 Commercial Lighting Retrofit Projects Budget for most recent year (and next budget cycle if available): 2012 Budget $160,000 2013 Budget $220,000 Funding Sources (name and description): In 2012: Tri-State G & T Rebates Website: www.lpea.coop www.lpea.coop/rebates_credits/commercial_lighting.html Best Person to Contact for Information about the Program: 243 LEADERS OF THE PACK © ACEEE Name Mark Schwantes Position LPEA Manager of Corporate Services Organization La Plata Electric Association Phone number 970-382-3511 Email address mschwantes@ lpea.coop ON-BILL FINANCING — EXEMPLARY ON-BILL FINANCING FOR NONRESIDENTIAL CUSTOMERS SAN DIEGO GAS AND ELECTRIC, SOUTHERN CALIFORNIA GAS COMPANY, SOUTHERN CALIFORNIA EDISON, AND PACIFIC GAS AND ELECTRIC, ADMINISTRATORS AND IMPLEMENTERS Program Overview Utility-based energy efficiency financing for non-residential customers and using the utility bill as a repayment mechanism began as a pilot at the Sempra utilities (San Diego Gas and Electric and Southern California Gas) in 2005 at the urging of Small Business California and a commissioner from the California Public Utilities Commission. Southern California Edison initiated a pilot in 2006, and Pacific Gas and Electric began offering temporary “offbill” loan program in July 2010 before fully launching an on-bill financing program in late 2011. The On-Bill Financing (OBF) Program enables non-residential customers to access energy efficiency upgrades with no out of pocket costs, instead tying monthly loan repayment to the lowered monthly utility bills. Loans are 0% interest and are $5,000 – $100,000 per meter with a 3-5 year maximum payback for commercial customers and $5,000-250,000 for taxpayer funded customers with a 10-year maximum payback (and up to $1 million for state agencies). The program is layered on top of other energy efficiency rebates and incentives. Most OBF elements are uniform across the four California investor owned utilities (IOUs) (San Diego Gas and Electric, Southern California Gas Company, Southern California Edison, and Pacific Gas and Electric). These elements include bill neutrality, 0% interest, ability to disburse loan proceeds directly to the customer or their vendor, repayment through the utility bill, customer account history requirements, maximum loan terms and caps, the California Department of Corporations’ (DoC) exemption (for insurance requirements), disconnection for non-payment or partial payment of energy and loan charges, and the program’s non-resource status. As of the end of 2012, elements which differ amongst the utilities are OBF lending account structure and fund allocation approach, loan tracking systems, the most prevalent delivery 244 LEADERS OF THE PACK channel, and how applications are processed. The California IOUs are aligning their programs, thereby minimizing any differences, for the 2013-2014 program cycle. The four IOUs use two different OBF delivery channels. SoCalGas and PG&E have assigned account executives to introduce the OBF mechanism to customers and help them with the application process; SDG&E and SCE rely much more on vendors, but their account executives also do some marketing. PG&E has recently begun to work with vendors, but most of its applications still come from account executives. OBF processes are built upon existing incentive program processes and application requirements, which means processing times and inspection requirements are dictated by the underlying programs. Adding OBF to a project may increase the overall project processing time. There are two steps in the application process when a customer or project can be disqualified: when customer creditworthiness and eligibility are assessed, and when the payback and other loan calculations are performed. The utilities require pre- and post– installation inspections on all OBF projects; no loan will be issued for equipment installed prior to the first inspection or for projects that do not meet savings requirements. There is also a true-up step at the end to ensure qualifications reflect final project scope. Program Performance The total number of loans and loan amounts for the On-Bill Financing Program for Nonresidential Customers are provided in the table below. Energy savings for the program have not been calculated but will be in 2013. On Bill Finance Participation - From Inception to November 1, 2012 Institutional # Loans Loan Amount Commercial, Non-institutional # Loans Loan amount TOTAL # Loans Loan amount PG&E 26 $2,570,000 99 $3,210,000 125 $5,780,000 SDGE 129 $6,400,000 954 $21,360,000 1,083 $27,760,000 SCE 63 $3,340,000 173 $5,150,000 236 $8,490,000 SCG 4 $145,000 34 $1,230,000 38 $1,375,000 Total 222 $12,455,000 1,260 $30,950,000 1,482 $43,405,000 A process evaluation of the program was published in 2010 (California 2010-2012 On-Bill Financing Process Evaluation and Market Assessment, Final Report, March 2012). Lessons Learned 245 LEADERS OF THE PACK © ACEEE Both design and implementation elements help make OBF successful. Customers, vendors, and utility staff members all commented that OBF removes upfront costs, enabling customers to complete energy-efficiency projects they otherwise would not have pursued. Zero percent interest, the loan installment on the bill, and bill neutrality also contribute to OBF’s success at attracting customers. There are two potential definitions of a “successful” OBF participant: one that qualifies for and is able to develop a project that would not otherwise have been done and one that has completed the process and repaid the loan in full. For the former, OBF has drawn customers from all eligible segments, including government and institutional (G&I), small commercial/industrial/ agriculture (CIA), and large CIA. No utility reported that OBF is meant to target one customer group over others, nor did evaluation research indicate that one customer segment would be better suited for OBF than another. Both SCE and PG&E expect to loan most of their 2010-2012 money to G&I customers, while SDG&E’s program started by loaning money to smaller customers and was then expanded to larger customers. SDG&E’s program has the most experience with loan performance, where a significant number of loans have been paid off. SDG&E’s defaults have been less than 1% over the life of the program. Program at a Glance Program name On-Bill Financing Program for Nonresidential Customers Targeted Customer Segment Non-residential Program Start Date The program began as a pilot at San Diego Gas and Electric in 2005. Southern California Gas and Southern California Edison initiated pilots in 2006. Pacific Gas and Electric began offering temporary “off-bill” loan program in July 2010 before fully launching an on-bill financing program in late 2011. Annual Energy Savings Achieved n/a Peak Demand (Summer) Savings Achieved n/a Other Measures of Program Results to Date More than 1,400 loans, worth $43 million, have been made to date. Budget for most recent year (and next budget cycle if available) 2012: approximately $50 million 2013: $56 million 2014: $56 million Funding Sources (name and description) Ratepayers Website http://www.sdge.com/save-money/solutions-yourbusiness/bill-financing http://www.socalgas.com/for-yourbusiness/rebates/zero-interest.shtml http://www.sce.com/business/onbill/on-bill- 246 LEADERS OF THE PACK financing.htm http://www.pge.com/mybusiness/energysavingsreb ates/rebatesincentives/taxcredit/onbillfinancing/ Best Person to Contact for Information about the Program: Name Frank Spasaro Organization Southern California Gas Company Phone number (213) 244-3648 Email address [email protected] ON BILL FINANCING — EXEMPLARY ON-BILL RECOVERY FINANCING NEW YORK STATE ENERGY RESEARCH AND DEVELOPMENT AUTHORITY, ADMINISTRATOR AND IMPLEMENTER Program Overview The On-Bill Recovery (OBR) Financing, administered and implemented by the New York State Energy Research and Development Authority (NYSERDA), targets residential (1-4 family), small businesses (<=100 employees), not-for-profits, and multifamily buildings for comprehensive cost-effective energy efficiency upgrades. The program allows homeowners, small businesses, not-for-profits, and multifamily building owners to finance energy efficiency improvements and the convenience of repaying the investment through a charge on their utility bill. In order to participate, an applicant must be named on the utility account of one of the participating utilities (one of the state’s six investor-owned utilities or the Long Island Power Authority). In addition, for residential loans, the applicant must be the owner of the property; loans for small businesses, not-for-profits, and multifamily are allowed for tenants with the consent of the property owner (since the property owner could be responsible for the charges on the bill after the end of the lease period). Following are some of the key terms and conditions of the program: For residential customers, the improvements must be installed by, and based on a comprehensive energy assessment (audit) conducted by a contractor accredited by the Building Performance Institute (BPI) through the Home Performance with ENERGY STAR program. Approved loans are repaid through a loan installment charge on the customer’s utility bill. The loan installment charge is a tariffed charge, approved by the Public 247 LEADERS OF THE PACK © ACEEE Service Commission, and is billed and collected as other utility service charges. This includes subjecting the customer of disconnection of service for nonpayment, provided that normal regulatory processes are followed by the utility, including notice of termination of service, limitations on when accounts may be terminated, and the ability for the customer to enter into a deferred payment arrangement. Partial payments on accounts are applied towards utility charges before being applied towards the loan installment charge. Loans may finance energy efficiency improvements deemed eligible by NYSERDA, and includes electric savings measures and all heating fuel types (natural gas, oil, or propane). Participants are also eligible to receive NYSERDA or utility incentives for eligible measures. The loan installment charge may not exceed 1/12th of the estimated annual energy savings from all fuel sources. In instances where the customer has a different electric utility provider than its natural gas, the installment charge appears on the electric utility bill unless the majority of energy savings are derived from natural gas improvements, in which case the charge is collected on the natural gas utility bill. The loan repayment charge may, but is not required to, survive change in property ownership. A seller must provide notice to a prospective purchaser prior to accepting a purchase offer on the property. In addition, the customers signs a Program Declaration, filed by NYSERDA in the county/city recording office in the same manner as a mortgage. The Declaration does not place a lien on the property and cannot be used to enforce payment of the loan, but ensures that a purchaser is provided notice of the existence of the loan through a title search process. Unless the remaining obligation is satisfied prior to sale or transfer, the remaining loan installment obligations will be charged on the utility account of the purchaser; any arrears up to the date of the sale or transfer remain the responsibility of the original borrower. Loans are limited to $25,000 for residential and $50,000 for small business/not-forprofits. Loan terms are offered for 5, 10, and 15 years. The interest rate is 2.99% for residential and 2.75% for small business/not-for-profit (subject to change). Loans for residential applicants are originated by Energy Finance Solutions, and for small business/not-for-profit applicants by participating lenders using loan underwriting standards established by NYSERDA. For residential applicants, this includes a minimum credit score (or alternatively satisfactory utility payment and mortgage payment history, maximum debt-to-income ratio, no prior bankruptcies, and no outstanding judgments. The loan originator is paid a loan origination fee for completed loans. NYSERDA’s master loan servicer, Concord Servicing Corporation, reviews loan originations, and coordinates communication and collections with each utility for all loans issued with each utility. Concord transmits data files to and from each utility on new loans, collections and remittances, customer prepayments (which must be paid directly to Concord), transfer of the loan in the event of property transfer, and becomes responsible for direct billing to the property owner upon termination or cancellation of the utility account. 248 LEADERS OF THE PACK The utilities are paid a fee to offset costs of billing system modifications and administrative costs of $100 per loan and 1% of the amount of each loan. Loans issued are initially funded from a revolving loan fund established through the Green Jobs-Green New York program, funded with approximately $51 million in funding from the sale of emission allowances under the Regional Greenhouse Gas Initiative (RGGI), and also supported by $9 million in loan loss reserve funding allocated through NYSERDA’s U.S. DOE Better Buildings (ARRA) grant. For residential loans, NYSERDA will pledge loan repayments for bonds issued by NYSERDA to allow the bond proceeds to replenish the revolving loan fund to support additional loan issuance. NYSERDA is currently working on its first bond issue, which will be a publicly issued rated (Fitch) bond. The bonds will be issued using as federally-subsidy Qualified Energy Conservation Bonds (QECBs) using the State’s QECB allocation of up to $24.36 million. Under Governor Andrew Cuomo’s leadership and strong support, the program was authorized through legislation enacted in August 2011 and the loan program was launched on January 31, 2012. Although the legislation required the program to be implemented not later than May 2012, at the Governor’s request the program implementation was accelerated and financing for residential homeowners was launched on January 31, 2012 (but provided that repayment charges would not commence until utility bills generated after June 2012 to allow the utilities to complete billing system modifications). On-bill recovery financing for the small business/not-for-profit sector was launched in November 2012 and financing for multifamily buildings is being finalized and should be launched in 2013. Program Performance The program completed its first year of operation in January 2013. During the first year, 537 OBR loans were issued ($5,671,819), 276 loans were approved awaiting project completion ($3,064,607), and 440 loans were preapproved (est. $4,048,000) for a total of 1,253 loans ($12,784,425). Nine percent of the loans issued are using alternative/Tier 2 loan underwriting standards resulting in financing being offered to consumers not qualifying for traditional financing For the loans issued to date, the projects have provided 434,067 kWh savings, 293 kW savings and 287,923 therm savings. Lessons Learned Governor Cuomo’s leadership and support was critical to getting the program implemented and overcoming previous barriers and concerns with offering on-bill financing to consumers. Implementation of the program required considerable input from utilities and Department of Public Service staff, which was critical to ensure that program processes were established to handle a variety of issues related to the management and collection of installment charges through the utility billing system. The program planning process required weekly meetings over a period of about 5 months to fully work through these issues. 249 LEADERS OF THE PACK © ACEEE NYSERDA has learned that timeliness in loan application processing and decisions is critical for the ability of contractors to engage consumers in making decisions to invest in energy efficiency. Contractors play an active and necessary role in helping consumers through the full loan process – from credit application to loan agreement execution. The loan approval processes are also inextricably linked to processes for program quality assurance and approval of contractor project cost and energy savings information. NYSERDA is currently working on a web-based platform tie link together loan approval information with project approval information in one system which is accessible by consumers, contractors, the program implementation/oversight contractor, NYSERDA’s loan originator, and NYSERDA staff. Implementation of this system will be critical to reducing processing time and the costs to contractors for customer acquisition. Program at a Glance Program name On-Bill Recovery Financing Targeted Customer Segment Residential (1-4 family), small business, not-forprofits Program Start Date January 31, 2012 Annual Energy Savings Achieved For loans issued to date: 434,067 kWh; 287,923 therms Peak Demand (Summer) Savings Achieved For loans issued: 293 kW Budget for most recent year (and next budget cycle if available) There is no “annual” budget for the program. Initial funding of revolving loan funds allows loans to be issued and pledged to repay bond debt service, allowing proceeds to replenish revolving loan fund and support additional loan issuance. Funding Sources (name and description) Revolving loan fund funded with proceeds from Regional Greenhouse Gas Initiative, with ultimate funding through secondary markets capital Website http://www.nyserda.ny.gov/en/StatewideInitiatives/On-Bill-Recovery-Financing-Program.aspx Best Person to Contact for Information about the Program: Name Jeff Pitkin Position Treasurer Organization NYSERDA Phone number 518-862-1090 x3223 Email address [email protected] 250 LEADERS OF THE PACK MARKET TRANSFORMATION — EXEMPLARY LED ACCELERATOR PACIFIC GAS & ELECTRIC COMPANY (PG&E), PROGRAM ADMINISTRATOR ENERGY SOLUTIONS, IMPLEMENTER Program Overview In 2010, Energy Solutions and Pacific Gas and Electric (PG&E) launched the 3rd party LED Accelerator Program (LEDA) targeting LED retrofits in the retail and grocery market sectors. Targeted LED measures included LED reflector lamps (PARs), LED low-voltage spot lights (MRs), and to a smaller extent LED refrigerated case lights and exterior LED lighting. LEDA offers customers tiered incentives to retrofit their lighting with more efficacious and higher quality LEDs. It set the bar three tiers higher than Energy Star’s for its technical specifications. LEDA works with large and/or multisite commercial customers, PG&E, distributors and manufacturers to drive the market toward leading edge LEDs. LEDA’s program staff also provides customized services in the form of lighting energy audits, economic analysis, product demonstration, LED product selection and project specific approvals of various LED products. LEDA’s incentive levels and technical services, coupled with leading manufacturer’s LED lighting products are supporting high quality lighting retrofits and establishing a program model that promotes high quality products in a manner that supports early commercialization. LEDA was initially designed to incentivize the newest and most energy efficient LED technologies available. During the program design phases, Energy Solutions analyzed the United States Department of Energy’s (DOE’s) past trends and future projections of LED efficacy and designed the LEDA program to target DOE’s higher projected efficacy levels. The goal was to increase those levels each year to keep pace with, and promote, the most innovative LED technologies. LEDA offered three different incentive levels: Tier 1 was $600 per peak kW reduced, Tier 2 was $1,000 per kW reduced and Tier 3 was $1,400 per kW reduced. Tier 3 was offered to incentivize manufacturers to design their lighting products to attract the attention of large purchasers of products as DOE information suggested no products were in the Tier 3 category at the time. This strategy created desired impacts. One of the first participants -Macy’s relayed LEDA specifications and committed to the manufacturer that could take advantage of LEDA’s Tier 2 or 3 levels. Once evident that such a qualifying product and incentives levels could be attained, Macy’s would retrofit all their stores in California and even across the country. This leverage influenced manufacturers to not only improve the energy efficiency of their LEDs but also increase the quality of their lighting products to meet the LEDA performance specifications. Macy’s influenced manufacturers as well as other utilities. Realizing the value of LEDA, Macy’s met with staff at Southern California Edison and convinced them to offer a program similar to PG&E’s LEDA program. The impact of Macy’s projects alone in PG&E and SCE were 2.2 MWs and 8.9 GWh saved and Macy’s received $1.2 million dollars in incentives. The energy savings does not count other projects that resulted from SCE’s LED program or what 251 LEADERS OF THE PACK © ACEEE influence they might have had with other utilities across the nation. PG&E is developing a Macy’s Case Study, which will in turn influence other projects to implement similar energy efficient LED retrofits. Jeff Larsen, Macy’s Regional Facilities Manager had this to say about the LEDA program: “The LEDA program provided the first rebates that were sufficient for us to justify the expenditure … and the program was so successful that we took the idea to other utilities around the country… LEDA is the impetus that has enabled us to leverage our LED program nationally.” LEDA has also approached manufacturers showing them LEDA specifications and the associated incentive rates. One leading manufacturer Energy Solutions worked with at the inception of the program showed LEDA specifications to their engineers and in turn designed LEDs to meet LEDA’s highest tier, thus enabling customers to benefit from the utility’s most valuable incentives. This manufacturer has been very successful and has several products on LEDA’s qualified LED products list. They have been ahead of the game in their LED testing, innovative LED product designs and with LEDA’s incentives, have been able to price their LED troffers at amazingly competitive rates, enabling them to get their products out into the market much faster. LEDA also worked with lighting distributors to educate them about higher quality and more efficient LEDs. Showing distributors LEDA specifications and incentives has led to distributors recommending LEDA qualifying LEDs to their customers in order to reduce first costs and the payback period. One distributor indicated one LEDA qualifying LED would be their “Go To” light when specifying lighting retrofit projects. When distributors include the LEDA incentive in their quotes and maintenance costs are considered several distributors have said the retrofit becomes “a no-brainer”. LEDA also worked directly with large customers. Fry’s Electronics engaged the program wanting to retrofit every light in their retail store and corporate office with LEDs. Although they were not able to find an acceptable LED high bay, they were able to retrofit almost every light with an LED in their retail store and office. Energy Solutions pre-audited the site to verify baseline fixtures and educated Fry’s about additional LED products they might retrofit. Energy Solutions and PG&E worked diligently on approving LEDs for the project well before the LEDs were certified by Energy Star or the Design Lights Consortium. Energy Solutions worked relentlessly on economic analysis for various LEDs as well as paybacks for all of their stores in the PG&E area. Fry’s LED retrofit saved 350 kW, 1.5 MWh and they received $360,000 in incentives. Phase 2 in 2013, Fry’s will begin retrofitting their parking lots, other stores in California as well as stores in other states. PG&E is performing an Emerging Technologies Study on a “Whole Store LED Retrofit” approach and will issue a Case Study on Fry’s. This study will educate other commercial businesses about the comprehensive benefits of whole building LED retrofits. Although LEDA was able to conduct outreach successfully to manufacturers, distributors and customers there were problems that did crop up. The most significant one was that the LED market was not in stride with DOE’s efficacy projections and the program was designed around these projections. Therefore, LEDA’s increasing efficacy specification was 252 LEADERS OF THE PACK too far ahead of the LED efficacy curve causing early-stage program participation to struggle. The second year, just as manufacturers were better understanding LED testing requirements, completing the lengthy Energy Star testing process and starting to meet LEDA’s specifications, LEDA’s lighting specifications were increased and no LEDs qualified for incentives; customers and distributors were also confused. Distributor quotes were no longer valid and they had a difficult time getting the customer back on board. PG&E did delay the second year specification increase but even with the delay, it still took time for the market to catch up. Manufacturers also had a difficult time meeting the total harmonic distortion (THD) specification requirement, set below 20%. This was the most daunting for PAR lamps and is still problematic for MR16s to meet. Manufacturers have been designing LED lamps to meet residential Energy Star specifications, which have no minimum THD requirements. 2013 LEDA will use a more appropriate THD specification for PAR and MR LEDs and base it on an ANSI standard. Program Performance Given that LEDs are 5-7 times more efficient than halogen incandescent lights and their lifetime is 8-11 times as long, the potential market and efficiency impacts of widespread LED adoption is significant. For example, LEDA’s incentives have enabled PAR38 LEDs to achieve less than a 6 month payback. Without incentives, the first costs of LEDs are more often than not difficult to overcome and LED projects fail to receive corporate approval. Performance measures are summarized in the table below: LEDA 2010-2012 Impacts Impact Total Spending Gross kW Savings Gross kWh Savings $/kW $/kWh Participants Facilities TRC $ $ $ 2010 1,049,467 $ 775 3,010,143 1,354 $ 0.35 $ 1 19 2011 455,618 $ 466 1,730,997 978 $ 0.26 $ 4 5 2012 2010-2012 937,226 $ 2,442,311 821.67 2,063 3,725,878 8,467,018 1,141 $ 1,184 0.25 $ 0.29 11 16 163 187 TBD LEDA’s estimated TRC for an emerging technology ranges from a low 1.0 to multiples of 1 depending on project specifics including the incremental cost and assumed NTG. With much higher rated life of products contributing towards greater savings and in many cases lower lifecycle costs due to maintenance and energy savings, LEDA has shown how new technology can be a great addition to PG&E’s savings portfolio. Lessons Learned LEDA 2013-2014 now has two tiers (Tier 1 is $600/kW and Tier II is $1000/kW) and LED efficacy requirements will not change over the program cycle which gives customers, distributors, and manufacturers more assurance in the economic benefits of the projects 253 LEADERS OF THE PACK © ACEEE going forward. LED specifications are now tailored for different LED types because the performance of each is vastly different. For example, there is a wide chasm between the performance of an MR16 and an LED troffer. At the end of 2012, the efficacy for MR16s and LED troffers was 60 lumens per watt. However, now Tier II levels are 50 lumens per watt for MR16s and 90 lumens per watt for LED troffers. Having specifications for various LED types set the bar more appropriately for manufacturers and should move the market more quickly instead of relying on an average specification for all LED types. In addition, total harmonic distortion requirements have been eased and are designed to meet ANSI C82.772002 requirements, which are more appropriate for LED replacement lamps. This has created participant traction that we originally anticipated in the program. Currently, the program in its first month has interest in over 1 MW of projects. One might consider the following points when designing a program similar to LEDA: Since program is early adoption program, goals should be based on participation instead of hard set savings goals as market transformation takes time and strategies may need revision Let distributors know changes well ahead of time so they don’t give inaccurate quotes to customers when they include incentives. Program design predicted large grocery store participation. Large savvy grocery chain stores can take up to 5 years to select products and obtain capital funding. Low participation resulted in lower kWh savings. Large retailer will retrofit 150 stores in CA in 2013. Design program specification requirements around parameters that market and utilities fully understand (THD with LED lamps not well understood) Don’t change program requirements too frequently as it confuses market. Program at a Glance Program name LED Accelerator Targeted Customer Segment Large, Multi-site Retail and Grocery Program Start Date January 1, 2010 – December 31, 2012 January 1, 2013 – December 31, 2014 Annual Energy Savings Achieved 6,594,697 Annual Peak Demand (Summer) Savings Achieved: 1,650 Other Measures of Program Results to Date (such as number of participants, participation rates or market penetration). 187 facilities 16 Customers Budget for most recent year (and next budget cycle if available) 2010-2013 $3,415,800 2013-2014 $1,800,000 Funding Sources (name and description) CA Public Purpose Programs Website www.ledaccelerator.com 254 LEADERS OF THE PACK Best Person to Contact for Information about the Program: Name Pam Molsick / Elisa Brossard Position Senior Project Manager / Program Manager Organization Energy Solutions / PG&E Phone number (510) 482-4420 ext. 276 / (415) 973-1319 Email address [email protected] /[email protected] MARKET TRANSFORMATION — EXEMPLARY NW DUCTLESS HEAT PUMP PROJECT NORTHWEST ENERGY EFFICIENCY ALLIANCE (NEEA), ADMINISTRATOR FLUID MARKET STRATEGIES, ECOTOPE, EVERGREEN ECONOMICS, AND RESEARCH INTO ACTION, IMPLEMENTERS Program Overview The NW Ductless Heat Pump Project works to accelerate the adoption of ductless heating and cooling systems in existing electrically-heated homes to displace electric heat. The Northwest Energy Efficiency Alliance24 (NEEA)’s Northwest Ductless Heat Pump Project began in 2010, following a Pilot phase that launched in October of 2008 and continued through 2009. Both the Pilot and the initiative share the goal of accelerating the adoption of inverter-driven ductless heating and cooling systems in existing electrically heated, singlefamily homes to displace electric heat. More than 100 public and investor-owned utilities support the project by funding NEEA as an organization. Of those, 94 actively participate in the Project to support their localized and regional energy efficiency programs. Through the NW Ductless Heat Pump Initiative, NEEA worked with Northwest utilities to develop an incentive platform for utility incentives to help offset upfront costs of the product. The project promoted these incentives and government tax credits in consumer marketing and messaging, promoting savings up to 60% off the cost of installation. Depending on the particular rebate and incentive, a homeowner could potentially save $1,500-2,500 toward a $4,000 - 5,000 installation. NEEA is a non-profit organization that uses the market power of the region to accelerate the innovation and adoption of energy-efficient products, services and practices. Since 1997, NEEA and its partners have saved enough energy to power almost 600,000 homes each year. NEEA is supported by and works in collaboration with the Bonneville Power Administration, Energy Trust of Oregon and more than 100 Northwest utilities on behalf of more than 12 million energy consumers. 24 255 LEADERS OF THE PACK © ACEEE NEEA continually evaluates energy savings, consumer and market actor perceptions to identify opportunities to overcome barriers and accelerate market adoption. In 2008, the leading U.S. ductless manufacturers reported that the technology was perceived as a solution for problem zones and manufacturers were not promoting ductless systems as an alternative to zonal electric heat or an energy efficiency measure. Pre-pilot meetings with manufacturers and distributors revealed that many DHP distributors warehoused an extremely limited number of units, which were reportedly difficult to move. Much like manufacturers, HVAC contractors viewed DHPs as solely application specific rather than an efficient alternative to zonal electric heat. Contractors reported a lack of access to product training and reported a desire for more manufacturer-sponsored training and educational opportunities to increase their proficiency installing DHPs. Prior to launching the Project Pilot, the domestic residential ductless market was characterized by low market penetration and a lack of consumer awareness. Ductless heat pumps constituted roughly 1% of the residential and commercial HVAC market and less than 5% had ever heard of the technology. 2010 market research indicates that general awareness around the technology grew from less than 5% to greater than 35% with steady and rapid growth in awareness; the Project is developing delivery and implementation strategies that go beyond awareness building and create consumer pull and demand. Based on the characteristics of the market pre-launch, the Project was designed to demonstrate the opportunity and savings potential of ductless heat pumps and to build an infrastructure that sustains and accelerates market growth ultimately leading to market transformation. To pave the way to market transformation, the Project engages regional market and utility partners, provides industry education, partner marketing support, generates consumer awareness, promotes quality installations, supports evaluation efforts and communicates findings to partners. To launch the nation’s largest Ductless Heat Pump (DHP) Pilot Project for the residential market, NEEA partnered with Northwest utilities, DHP manufacturers and HVAC contractors and targeted single-family homes currently using inefficient electric-resistance heat and sought to “displace” this heating source with DHPs. To accomplish this goal, NEEA and the region’s utilities had to overcome many barriers, including a general lack of awareness of DHPs as a viable heating and cooling solution among consumers, builders and HVAC installers. Other barriers included initial up-front cost of the units, consumer wariness of DHP aesthetics, lack of training for HVAC installers and minimal distribution channels throughout the Northwest. The Pilot consumer marketing efforts primarily leverage utility communication channels and utility credibility to deliver end consumer marketing. The Project developed a consumer-facing website, www.GoingDuctless.com, providing utilities with an alternative to devoting utility resources to managing customer interest and established third party creditability for market actors. The website provides consumers with education on the features and benefits of the technology and directs them to qualified Project contractors. 256 LEADERS OF THE PACK By the end of the pilot’s first, year, the region exceeded the goal of 2,500 installations by 40%. Because of the significant energy savings, more than 90 utilities are now offering incentives to homeowners to install DHPs, increasing the demand for these cutting edge heating and cooling systems. In 2010, efforts focused on overcoming cost barriers and influencing supply chain marketing efforts. The Project leveraged market-based financial incentives and tax credits for consumer marketing and messaging promoting savings up to 60% off the cost of installation with utility rebates and tax incentives. The Project achieved 5,567 approved installations by yearend and increased the number of utility participants by 27% from 2009. The Project increased consumer awareness for ductless systems and delivered quality leads to contractors through a variety of marketing tactics and tools and launched a cooperative marketing program. In addition, the team worked upstream with manufacturers to influence single-zone application positioning within their marketing collateral to maximize sales opportunities for contractors and cost-effective solutions for consumers. Manufacturer engagement efforts focused on increasing regional market capacity through stronger distribution channels, increased contractor adoption and quality installations. The Project continued to cultivate a robust contractor network by increasing the contractor base by 48% by year-end. The Project developed a Master Installer Program to offer a competitive advantage for champion installers across the region. Installation Best Practices resources were developed to influence regional consistency and to help contractors understand the technical nuances and protocols of installing ductless systems. QA inspections and contractor feedback emphasized the importance of promoting ductlessspecific tools and accessories to the contractor network to achieve quality installations. In 2011, the Project continued to enhance regional support and tools for utilities and market partners to increase their ductless efforts. Single-zone ductless system applications remained the most popular type of installation, representing 70% of the 4,789 installs in 2011 – demonstrating continued contractor adoption of the Displacement Approach and the Project’s ability to use training and messaging to influence the market. To reduce ductless systems cost barriers and increase consumer access to financing solutions that reduce the upfront costs, the Project partnered with lending institutions to promote attractive loan options for ductless system purchases. Developing alternative distribution channels to position ductless systems as a solution beyond the traditional supply chain channel was a new focus in 2011. The Project engaged the manufactured housing market and retail channel partners to position ductless heat pumps as the preferred heating and cooling system in new and existing homes. The 2011 Project marketing efforts worked to streamline the Project’s identity by combining websites, and increase consumer awareness to accelerate adoption by influencing “word of mouth” activities. A regional marketing campaign was launched that featured a $10,000 cash grand prize and sub-prizes to incentivize consumers to visit www.GoingDuctless.com or the campaign Facebook page to enter to win. While on the Facebook or campaign website page, creative and messaging helps consumers “Discover Ductless” and encourages them to help others discover ductless heating and cooling systems. 257 LEADERS OF THE PACK © ACEEE Program Performance Through effective collaboration between NEEA and Project implementers, innovative regional marketing campaigns, annual evaluations, data analyses, market channel support, and targeted utility support, this initiative is achieving and in many cases exceeding targets as evidenced by the following market transformation indicators: Market participation and investment continues to grow steadily year over year as the Project communicates and demonstrates opportunities to the market. Equipment availability, diversity and quality continue to improve as market partners close regional coverage gaps and deliver opportunities throughout urban, suburban and rural areas. Consumer awareness has increased significantly since the Project launch to the point where contractors in some regions are starting to see demand for the ductless solution. Top purchasing influencers have shifted from utility based information to word of mouth recommendations from satisfied ductless system owners to family and acquaintances. As general ductless technology awareness continues to build, the Project is confident ductless system sales growth within the retrofit residential market for electric resistance heat displacement will accelerate and anticipates a halo effect, driving growth and opportunity in other building stock and cost-effective applications. Program spending actual (per year, most recent 3 years): 2010: 2011: 2012: $1,140,000 $1,553,000 $1,622,000 Gross savings: 2010: 2011: 2012: 19,484,500 kWh 16,761,500 kWh 18,511,500kWh Number of participants (per year, most recent 3 years): 2010: 2011: 2012: 5,567 installations 4,789 installations 5,289 installations Impact evaluation reports of the program are available via the following links: 258 LEADERS OF THE PACK http://neea.org/resource-center/market-research-and-evaluationreports?topic=7c271551-f9a2-4193-8f52-dcd884029666&sort=PublicationDate+DESC Northwest Ductless Heat Pump Pilot Project, #1 Northwest Ductless Heat Pump #1 Northwest Ductless Heat Pump Pilot Project #2 Ductless Heat Pump Impact & Process Evaluation: Lab-Testing Report Ductless Heat Pump Impact & Process Evaluation: Field Metering Report Cost effectiveness: Utility Cost Test (UCT) 1.1 cents/kWh Total Resource Cost Test (TRC) 4.6 cents/kWh Lessons Learned Throughout the Pilot, four clear barriers were identified. First, consumers perceived the cost of DHP to be too high. Second, there was a general lack of awareness that DHPs are a viable heating and cooling solution among consumers, builders and HVAC installers, which ultimately led to a lack of investment in supply chain marketing. The final market barriers involved lack of training for installers, and minimal distribution channels in the Northwest. Marketing efforts that leveraged word of mouth advertising helped raise awareness in the market and helped consumers to overcome perceptions about cost barriers. With that, utility incentives, government tax credits and market-based financing programs also helped to jumpstart the market in the Northwest. The Project supported and trained trade allies and installers which increased quality installations and customer satisfaction among manufacturers and distributers in the region. A reduction of market barriers and added project support for supply chain management allows for easier entry into the market and more diversity among manufacturers and distributors while providing consumers with more choices. Project messaging was best delivered as a 1:1 application while explaining that DHPs are a solution to displace ERH in the primary living space of single-family homes for increased comfort and energy bill savings. Program at a Glance Program name NW Ductless Heat Pump Project Targeted Customer Segment Residential Program Start Date October 2008 Annual Energy Savings Achieved 2008: 423,500 kWh 2009: 13,646,500 kWh 2010: 19,484,500 kWh 259 LEADERS OF THE PACK © ACEEE 2011: 16,761,500 kWh 2012: 18,511,500 kWh Peak Demand (Summer) Savings Achieved: N/A Other Measures of Program Results to Date: 18,000 DHPs installed throughout Idaho, Montana, Oregon and Washington 700+ quality assurance inspections conducted 900+ contractors trained DHP awareness among the general public with electric heated homes in the region is up from less than 5% in 2009 to greater than 35% in 2012 95% satisfaction rate for those homeowners who have purchased and installed DHPs through a Project-oriented contractor Budget for most recent year (and next budget cycle if available): 2012: $1,650,000 2013: $1,400,000 Funding Sources (name and description): NEEA is supported by, and works in collaboration with, the Bonneville Power Administration, Energy Trust of Oregon and over 100 Northwest utilities on behalf of more than 12 million energy consumers. Website: http://neea.org/initiatives/residential/ductless-heatpumps http://goingductless.com/ Best Person to Contact for Information about the Program: Name Ty Stober Position Initiative Manager, Residential/Mass Markets Organization NEEA Phone number 503-688-5494 Email address [email protected] MARKET TRANSFORMATION — EXEMPLARY PG&E DISTRIBUTOR CHANNEL ENGAGEMENT PROGRAM PACIFIC GAS AND ELECTRIC COMPANY (PG&E), ADMINISTRATOR ENERGY SOLUTIONS – OAKLAND, CALIFORNIA, IMPLEMENTER 260 LEADERS OF THE PACK Program Overview The Distributor Incentive Program Model (the Model), formerly known as midstream or upstream, is an approach that has garnered national attention for delivering significant results compared to other traditional program models. By targeting Distributors and Manufacturers, that are at or near the initial stages of producing a good, the Model is able to mobilize a relatively small number of stakeholders to influence a large number of sales within the commercial and industrial (C&I) market. This archetypal program model can easily add new measures, equipment categories, and clients while achieving as much as 900 percent greater impacts (see figure 1). Today, PG&E and Energy Solutions use this delivery model for distributors and manufacturers that make and/or sell five commercial technologies: Food Service/Bottling Company Refrigerated Cases, HVAC, Motors, Lighting and Water Heaters. In 1998, the Model was piloted by PG&E to improve the overall efficiency of the stocked equipment, which directly influences the efficiency of the equipment that is purchased. For example, motors and packaged HVAC equipment are typically replaced in emergency burnout situations that are triggered by heavy use of old equipment. In the case of HVAC, it is the heavy use during hot weather, and in the case of motors is the continual operation of the equipment. In either case, the customer is not in a position to wait for high efficiency equipment if it is not in stock. Furthermore, in addition to having to wait for back ordered equipment, customers 1) had to be aware of the more energy efficient option, 2) be willing to wait four to six weeks for equipment, and 3) pay a price premium of approximately 20 percent. A new program approach was needed to address all three of these issues. With that in mind, the Commercial Distributor HVAC program targeted the 20-30 distributors that control the stocking decisions rather than trying to raise awareness and incentivize 400,000 C&I customers or 500-800 contractors. One significant benefit of providing incentives to distributors is that the price reduction to the customer is magnified by reducing two mark ups: (1) distributor to contractor, and (2) contractor to end-use customer. Thus, this approach allowed participating distributors to sell premium efficient HVAC and motors for the same price as standard equipment. Finally, in California, six distributors control approximately 80 percent of HVAC sales, therefore the remaining distributors are compelled to join the program to stay competitive, and not lose market share. The current motors standards have made Distributor motor rebate programs nearly obsolete; however, the tiered incentives of the current Distributor HVAC programs have enabled utilities to capture persistent energy and peak demand savings by promoting super-efficient packaged air conditioners, while introducing and offering prescriptive incentives for promising new technologies such as variable refrigerant flow (VRF) systems and water cooled chillers. Major Enhancements: In 2004, the program added a fully-automated online application processing system that enabled the program to rapidly scale its clients, measure offerings and equipment categories, while substantially reducing program administrative costs and participation barriers. Today, PG&E’s Distributor program has expanded to include food 261 LEADERS OF THE PACK © ACEEE service equipment, targeted commercial lighting, water heating equipment and several types of additional HVAC products. In 2009, PG&E and Energy Solutions targeted glass door refrigerator that are found in almost every grocery store across the country. Developing an incentive program that for this equipment posed a unique challenge because the business owners who operate the equipment do not own the equipment – the beverage companies do. As a result, the Distributor program provided the incentives to beverage distributors, like Coke and Pepsi. The rationale for this was that Coke and Pepsi own 80-90 percent of all the commercial glass door refrigerators, however they are not responsible for the energy costs of operating such equipment, hence they do not have reason to select more efficient units even with incentives – at face value. However, Coke and Pepsi engaged the program and showed their vendors goodwill by leveraging the programs incentives to improve the efficiency of the equipment in use. There are five services provided: technology assessments, establishing and defending savings claims, setting incentive levels, distributor outreach and training, and application processing. Technology assessments: The Program Implementer interfaces with industry representatives to identify and assess technologies that could be included in the program. This includes analyzing the market and energy saving characteristics and potential, assessing supply chain, and measuring cost effectiveness and the impact a new measure will have on the program’s cost effectiveness. Establishing and defending savings claims: The Program Implementer models savings using both full and part load performance data, thus relinquishing more accurate savings estimates that often justify greater savings and incentives that cover a greater portion of the incremental measure cost. While most programs base savings claims strictly on full load ratings, this more rigorous approach that prioritizes accuracy rather than conservatism has enabled the program to include and provide extremely valuable incentives for measures such as VRFs and water cooled chillers. Setting incentive levels: After modeling expected energy savings based on past sales, incentives are set based on sensitivity to Incremental Measure Cost (IMC), the delta of energy used by the efficient unit, and code baseline. The program’s tiered incentives that cover a significant portion of the IMC, do not confuse participating distributors because the rebate processing is automated and based on the equipment model number. Many other programs that have very similar cost effectiveness to PG&E’s Distributor program offer a fraction of the rebate that PG&E offers, and thus captures a fraction of the savings. As an example, PG&E’s Distributor HVAC program offers 60%-90% of the IMC for different units. Distributor outreach, training and education: The single most important service that both the Program Implementer and PG&E perform is distributor outreach, training and education. Distributors must understand that they are being paid to stock and upsell high efficiency equipment and that any attempt to not leverage the incentives will in fact cost 262 LEADERS OF THE PACK them market share because their competition is using the program incentives more effectively. For new distributors, it is important to spend significant time training them on the application processes and program requirements, whereas outreach initiatives to longtime program participants typically focus on reporting how they are performing in the program compared to other distributors, their past performance, and their stated goals. Through interfacing with distributors, the Program Implementer, PG&E and distributors are able to establish consensus about the products that are or should be included in the program, implications of new incentive tiers, and any improvements that can be addressed by the program delivery methods. Application processing The Program Implementer is responsible for processing applications and providing invoices to PG&E for payment and installation verification. The fully-automated, online application system connects with the utility payment system, making the entire process paperless and complete within 2 weeks. Program Performance The technologies incented through the Model have cost-effectively met the internal energy savings goals within the fixed incentive and implementation budgets. While still meeting internal energy savings goals, the Model’s performance has also been impacted by national code changes. In December 2011, the program’s efficiency requirement for motors (NEMA Premium) became national code. Thus, the code changes impacted the performance of the motors program in 2012. In three years, the Program has proven success by cost-effectively incenting and educating just 175 distributors that have, in turn, sold efficient equipment to almost 25,000 customers. This level of customer touches and influence would likely not come to fruition if the Model did not intervene at the higher level of the supply chain - with Distributors and Manufacturers. This Model has enabled PG&E to further span their level impact on the marketplace by managing and collaborating with a smaller sub-set of market players, rather than working directly with the 25,000 customers that have been impacted by the incentives and support. 2010 2011 2012 2010-2012 Total cost $5,701,359 $9,417,008 $9,812,671 $ 24,931,039 kW 5,721 8,420 6,369 20,510 kWh 33,542,081 20,611,404 78,715,267 Therms 24,561, 782 141,329 497,662 974,373 1,613,364 $/kW $ 945 $1,039.08 $1,364.77 $1,114.00 $/kWh $ 0.22 $0.26 $0.42 $0.29 $/Thm $1.81 $1.29 $0.66 $1.23 # Applications/Customers 23,631 # Distributors/Program Participants 175 TRC (Commercial Deemed Programs) 1.6 263 LEADERS OF THE PACK © ACEEE *Cost and savings include combined results for Commercial Distributor HVAC, Lighting, Motors, Food Service and Water Heating *Total cost includes Energy Solutions Implementation budget + Incentives paid (does not include PG&E implementation budget) *Savings values are gross savings Impact evaluations for 2010-12 have not been completed. Lessons Learned The combined Program results substantiate that greater market impact can be realized when market actors are engaged in the process of deploying more efficient equipment into the market. Leveraging existing market place infrastructure, relationships and technical expertise can result in greater energy savings accomplishments and program participation than traditional approaches where the focus is directly with the end customer/user. This program delivery approach can be leveraged across many technologies to yield greater results than the traditional downstream paper application program design. Market actors will respond when there is rational benefit for their participation, whether it is increased sales and profitability, greater achievement towards sustainability, environmental stewardship or response to market demands for greater efficiency. The graph below illustrates an example of the difference in impact of the different program delivery types (downstream vs. upstream) for the PG&E Commercial HVAC Distributor Program: 264 LEADERS OF THE PACK Figure 1. Commercial HVAC Equipment Sales (tonnage) per year in comparison to Upstream (Distributor Model) and Downstream (End-User application) model. Program at a Glance Program name PG&E Distributor Channel Engagement Program Targeted Customer Segment Commercial, Industrial Program Start Date January 1, 2010 to December 31, 2012 Annual Energy Savings Achieved 78,715,267 kWh Peak Demand (Summer) Savings Achieved: 20,510 Peak kW Budget for most recent year (and next budget cycle if available): 2010-2012: $25,000,000 (~$8,000,000/year) 2013-2014: $15,000,000 (~7,500,000/year) Funding Sources (name and description): CA Public Purpose Programs Website: www.CAinstantrebates.com Best Person to Contact for Information about the Program: Name Terrance Pang Position Senior Director / Program Manager Organization Energy Solutions / PG&E 265 / Julie Colvin LEADERS OF THE PACK © ACEEE Phone number (510) 482-4420 x249 / 415.973.0901 Email address [email protected] / [email protected] MARKET TRANSFORMATION — HONORABLE MENTION ENERGY STAR PILOT PROGRAM FOR MANUFACTURED HOMES TENNESSEE VALLEY AUTHORITY & SYSTEMS BUILDING RESEARCH ALLIANCE, ADMINISTRATOR TENNESSEE VALLEY AUTHORITY’S ENERGY EFFICIENCY AND DEMAND RESPONSE ORGANIZATION, IMPLEMENTER Program Overview The ENERGY STAR Pilot Program for Manufactured Homes, housed within the Tennessee Valley Authority’s (TVA) EnergyRight® Solutions for the Home brand, has quickly become a shining star within the company’s Energy Efficiency and Demand Response (EEDR) sphere. This program, administered with the capable competencies of Systems Building Research Alliance (SBRA), has experienced a renaissance after several program tweaks pushed the program to new heights. Since 2008, SBRA has been the third-party administrator for TVA’s ENERGY STAR Pilot Program for Manufactured Homes. This program was designed to aid manufactured home energy consumers in the Tennessee Valley achieve energy savings by ensuring they have the ability to purchase an ENERGY STAR certified home with more efficient, cost-effective equipment than is typically found in Manufactured Homes to heat and cool their residences. Historically, there has been a large concentration of manufactured homes in areas of the Tennessee Valley. These homes, by and large, have been equipped with electric resistance heat that many times lacks in efficiency and can yield very high monthly bills for these enduse customers. By receiving an ENERGY STAR home with an all-electric heat pump, owners of these homes will save on average $50-$70/month on their electric bills, compared to standard manufactured homes (Source: SBRA), providing thousands of dollars in savings over the life of the home and increasing the potential resale value of the residence. In addition to the obvious bill savings yielded, this pilot program increases the overall efficiency of manufactured housing stock in the Tennessee Valley. While this increases the appraised value of these homes at the time of home sale, it also ensures the residence is more comfortable with better protection against heat, cold, and noise. At the beginning of the TVA-SRBA relationship (October 2007 - May 2011), the program was developed with a $400 incentive paid to the manufactured homes retailer, not the producer of these units. The program as designed achieved little traction: only 39 of the ENERGY 266 LEADERS OF THE PACK STAR Manufactured Homes sited in the Tennessee Valley came through the TVA pilot during this three-year period. Seeing little growth with the program as configured, and convinced it was feasible to move an industry based on uniform production up to ENERGY STAR levels en masse, TVA completely recast the program. In the spring of 2011, working with SBRA, TVA redesigned the program making two major changes. First the incentive was provided directly to the home producers. This had the advantage of applying funds to cover the wholesale costs of building ENERGY STARqualified homes. This step also effectively made the program less dependent on the retailer to sell the benefits of energy efficiency, a weakness of the original program. Second, the incentive was increased to $1,500 in June of 2011, $1,450 of which is passed on to the producer (SBRA retains a $50 administrative fee for each qualified home). The higher incentive covered a large portion of the incremental cost between a HUD and ENERGY STAR qualified home. Cost is a critical consideration for the most affordable segment of the housing market. Even a cost increase of a few thousand dollars can prevent a family from qualifying for a loan on a modestly priced manufactured home. The higher incentive made it possible for buyers that most benefit from the energy savings to afford an ENERGY STAR home and, armed with the confidence that the market would respond, allowed manufacturers to commit to high volume production of ENERGY STAR homes. This strategic change converted the Tennessee Valley market to ENERGY STAR nearly overnight. Although this incentive is available to all manufactured home producers who have a signed a memorandum of understanding with SBRA to participate, Clayton Homes has quickly changed their production process to take full advantage of the TVA incentive. Approximately 3,000 manufactured homes are sited in the Tennessee Valley region each year. Of that number, Clayton Homes represents about 75% of that market share. Because of incentives offered through TVA’s ENERGY STAR Manufactured Homes Program, Clayton was the first to make ENERGY STAR qualified homes a standard offering in the Tennessee Valley. Clayton made a commitment that every one of their homes produced and sited in the Tennessee Valley in Fiscal Year 2012 and going forward would be an ENERGY STAR home with an electric heat pump. Since the latest program change in mid-Fiscal Year 2011, 493 ENERGY STAR Manufactured Homes (12 homes in Fiscal Year 2011 and 481 homes in Fiscal Year 2012) have been reported through TVA’s ENERGY STAR Pilot Program for Manufactured Homes. Out of all the residential energy efficiency programs within TVA’s EnergyRight® Solutions for the Home brand, the ENERGY STAR Pilot Program for Manufactured Homes offers TVA the greatest kWh savings per installation (11,947 kWh as of Fiscal Year 2012). A savings of 5,746,507 kWh or 5.7 GWh was achieved in Fiscal Year 2012. The program also achieved a peak demand savings of 245 kW in Fiscal Year 2012. 267 LEADERS OF THE PACK © ACEEE Program Performance When reviewing the performance of ENERGY STAR Pilot Program for Manufactured Homes, one key thing to note is the increase in program spending since the agreement with Clayton Manufacturing in Fiscal Year 2012. 2010 2011 2012 Program Expenditures ($) $4,800 $25, 000 $766,000 Electric Savings (kWh) 73,745 252,840 5,746,907 Demand Savings (KW) 5 18 245 Number of Participants 7 24 481 In Fiscal Year 2010, TVA spent only $4,800 on the pilot due to a low take rate (7 homes) and the lower $400/home incentive. In Fiscal Year 2011, this amount climbed to nearly $25,000, partially due to a little larger take rate (24 homes), but also because of the rise of the incentive from $400/home to the current $1,500/home. Half of these 24 homes were incentivized at the $400 level, and the other half came in at the $1,500 incentive. In Fiscal Year 2012, due largely to the agreement with Clayton Manufacturing, the number of homes exploded from 24 to 481, and total program expenditures for 2012 reached $766,000. Program savings for the ENERGY STAR Pilot Program for Manufactured Homes obviously mirrored the volume expressed on the financials described above. Kilowatt-hour (kWh) savings went from 73,745 kWh in Fiscal Year 2010, to 252,840 kWh in Fiscal Year 2011, to a spike high of 5,746,907 kWh in Fiscal Year 2012. The Kilowatt (kW) savings went from 5 kW in Fiscal Year 2010, to 18 kW in Fiscal Year 2011, to 245 kW in Fiscal Year 2012. The cost effectiveness test of choice within TVA is the Total Resource Cost (TRC) test. Prior to Fiscal Year 2012, the ENERGY STAR Pilot Program and the Volume Heat Pump for Manufactured Homes Programs were not reported individually due to the low volume of ENERGY STAR homes; therefore there was not a stand-alone TRC value assigned. However, in Fiscal Year 2012, this pilot yielded a TRC of 4.8. In addition, the lifetime estimated cost of the ENERGY STAR Pilot Program for Manufactured Homes is less than $0.01 per kilowatt-hour. Lessons Learned There have been many lessons learned over the lifetime of the ENERGY STAR Pilot Program for Manufactured Homes. However, the key lesson learned is the difficulty of working directly with the retailers in this market as access to scaling up program participation. There is tremendous turnover in this specific market where everything from retailer buyouts, to name changes, to retailers going out of business occurs within the blink of an eye. That variable made it difficult to establish and/or maintain relationships with the retailer and gain any momentum moving these sellers to provide ENERGY STAR residences using the retailer approach. 268 LEADERS OF THE PACK For that reason along with the ease of administering a program with fewer variables, the upstream model of working with manufacturers has proven to be more effective. It became apparent that the only way to achieve market transformation was to move towards a uniform production model that could produce a large quantity of ENERGY STAR level homes in a timely fashion. Program at a Glance Program name ENERGY STAR Pilot Program for Manufactured Homes Targeted Customer Segment Manufactured Homes Producers Program Start Date 2008 Annual Energy Savings Achieved 5.7 GWh in FY2012, 7.0 GWh goal in FY2013 Peak Demand (Summer) Savings Achieved 245 kW in FY 2012, 300 kW goal in FY2013 Other Measures of Program Results to Date Lifetime estimated $/kWh of $0.009 Budget for most recent year (and next budget cycle if available) $766,000 spent in FY2012. $1,800,000 budget in FY2013 Funding Sources (name and description): TVA Annual Internal Budget Website www.energyright.com and www.researchalliance.org Best Person to Contact for Information about the Program: Name Lisa Haislip Position Program Manager Organization Tennessee Valley Authority Phone number 615-232-6910 Email address [email protected] NICHE/OTHER CATEGORY — EXEMPLARY ENERGY SERVICES FOR SCHOOLS PROGRAM NEW YORK POWER AUTHORITY, ADMINISTRATOR AND IMPLEMENTER Program Overview The New York Power Authority (NYPA) has been offering its Energy Services Program for 25 years. Between 1987 and 2012, NYPA financed and invested over $1.5 billion across 3,900 facilities within New York State. Governor Andrew M. Cuomo recently issued an Executive 269 LEADERS OF THE PACK © ACEEE Order directing state agencies to increase energy efficiency in state buildings by 20 percent in seven years - one of the most ambitious initiatives in the nation that will save millions of dollars for taxpayers and create thousands of jobs while significantly reducing greenhouse gas emissions. The Governor also launched "Build Smart NY," a plan to strategically implement the Executive Order by accelerating priority improvements in energy performance. NYPA’s Energy Services Program will play a critical role in assisting the State to meet these objectives. Under the Energy Services Program, NYPA provides services that include developing feasibility studies, engineering design, life-cycle cost analyses, procuring equipment, contractor labor, hazardous waste disposal, managing projects/construction, commissioning of equipment, training and financing projects. Measures include, but are not limited to: lighting retrofits, building envelop-related improvements, HVAC modernization, including energy-efficient chillers, boilers, and controls, high-efficiency motors, variablespeed drives, energy management systems, process controls, and distributed generation. These installations, and many more, have been performed throughout the NYPA customer base. New York State governmental entities, municipalities, school districts, public housing authorities, wastewater treatment plants, prisons, hospitals, museums, zoos, and public colleges are all continuing participants in the NYPA program. The NYPA Energy Services Program was developed to help program participants achieve deep energy savings by providing a single program implementation mechanism that took the participant from project beginning to end. This allows the participant to focus their resources on delivering the vital services and functions they are tasked with. In effect, they can use Authority staff as an expert extension of their own staff. Customer-tailored projectspecific offerings allow flexibility in the design of services that reduce participants’ energy costs while providing them with infrastructure improvements. Under the Energy Services Program, NYPA manages the work from start to finish. The projects are implemented complying with State and local codes and regulations. NYPA will integrate available rebate or incentive programs from the New York Energy and Research Development Authority (NYSERDA), the Long Island Power Authority (LIPA), and other investor-owned utilities (IOU) to help buy down the cost of the customer repayment. The incentives are funded from collections on utility bills as established by the New York Public Services Commission and administered by NYSERDA, LIPA, and the IOU’s. The remaining cost of the project is then financed by the New York Power Authority, with reliable and secure long-term and short-term financing. The NYPA Energy Services for Schools Program was originally introduced over 20 years ago, with participation from only a small number of schools within New York City. The program has since grown and expanded over the years, resulting in a cumulative project investment totaling more than $400 million. Originally known as the High Efficiency Lighting Program (HELP), participants received NYPA design, project management, and support in upgrading the lighting fixtures within the schools in NYC. Due to its success, it continued and expanded to include Upstate New York and Long Island. NYPA had opened the door to give public schools across the State 270 LEADERS OF THE PACK an effective and affordable avenue to decrease their electricity costs and overall energy used through HELP. The customers of the HELP initiative were so satisfied by the results and the realized savings that they began to ask NYPA for other energy efficiency offerings. The program was then revised to include replacement of motors, sensors, and controls within the schools. These new measures became part of their standard service offerings within the NYPA program. The next big task taken on by the NYPA Energy Services for Schools Program was the inclusion of converting coal-fired furnaces to dual-fuel boilers, burning No. 2 oil and natural gas. Starting as a pilot program, NYPA replaced coal-fired furnaces in twelve schools within the City of New York, Buffalo, and Long Island. The success of the initial $14 million project led to the inclusion and implementation of another 74 coal furnaces or heavy-oil boilers conversions funded under New York’s Clean Water/Clean Air Bond Act of 1996. The installation of the new gas-fired or dual-fuel boilers required significant investments in gas infrastructure and building upgrades. New gas lines needed to be installed, existing chimneys needed to be repaired, and new No. 2 oil tanks needed to be sited and buried. Working together with the New York City Department of Education, New York City School Construction Authority, and the local utilities, NYPA continued to upgrade the schools climate controls as well. The cumulative $171 million upgrade was focused in the areas of New York City with the highest rates of pediatric asthma. The NYPA Energy Services for Schools Program had grown from simply replacing lights, to the upgrading and installation of motors and sensors, to the removal and demolition of coalfired furnaces all across the State of New York. The Program still continues to evolve and grow, as the local laws and regulations continue to become more “green”. More recently, with the passing of Local Law 87 of the City of New York, all public buildings with more than 50,000 gross square feet are required to have Level II ASHRAE Audits performed every 10 years. Retro-commissioning is no longer encouraged; it is now mandatory and enforced by law. The Program now offers full retro-commissioning services and multiple levels of energy audits to participating schools. Program Performance The New York Power Authority’s mission is to “provide clean, low-cost and reliable energy consistent with our commitment to the environment and safety, while promoting economic development and job development, energy efficiency, renewables and innovation, for the benefit of our customers and all New Yorkers.” In keeping with its mission, the NYPA Energy Services Program, and more specifically the Schools Program, has played a key role in New York State’s efforts to achieve one of the most ambitious clean energy goals in the country. NYPA has been a leading agency when the Governor of New York and the Major of New York City announced increased energy efficiency initiatives across their jurisdictions. The Energy Services for Schools Program in New York City is currently focused on meeting PlaNYC 2030 regulations. Over 80 projects are planned, ranging from compliance of the 271 LEADERS OF THE PACK © ACEEE PlaNYC regulations to have energy audits performed and benchmarked, to retrocommissioning, to the removal and replacement of heavy-oil fired boilers and converting them to natural gas boilers. Across New York State, the Energy Services for Schools Program is helping to meet the Governor’s goal to meet 45% of New York’s electricity through improved energy efficiency and clean renewable energy by 2015. Over the last 3 years, 36 projects in 48 primary and secondary school facilities throughout New York State have been completed through the Energy Services for Schools Program. Totaling $36 million, these projects have yielded a cumulative estimated net savings of $2.5 million annually, or a 14.4 year simple payback. Coupled with NYPA’s unique ability to provide long-term and secure energy efficiency project financing, more and more schools are finding the program to be of significant value in their energy portfolios. NYPA Energy Services for Schools Program has reduced an estimated 2 MW of demand, 1300 MWh of energy usage, and saved 52,700 MMBtu per project per year. Program information for 2010-2012 is provided in the table below. 2010 2011 2012 Program Expenditures ($ million) $6,231,381 $18,542,610 $11,369,640 Gross Electric Savings (kWh) 3,914,000 5,556,000 942,000 Net Demand Savings (kW) 842 1,097 241 Number of Participants 14 28 6 Lessons Learned The NYPA Energy Services Program has faced the challenges of surviving through many different administrations on all levels of New York State Government over the years, and will continue to do so. NYPA’s success however has been the ability to provide program flexibility in its delivery approach as well as undertaking energy saving solutions among all fuel types. This flexibility has allowed NYPA to be recognized as a leader in supporting energy efficiency, renewable energy and clean transportation. Program at a Glance Program name New York Power Authority Energy Services for Schools Program Targeted Customer Segment Primary and secondary Public Schools across New York State Program Start Date 1992 Annual Energy Savings Achieved Over $36M Peak Demand (Summer) Savings Achieved Over 1300 kW Other Measures of Program Results to Date Over 179,000 tons greenhouse gases; over 509,000 barrels of oil; over 421,000 MMBTU saved annually 272 LEADERS OF THE PACK Budget for most recent year (and next budget cycle if available) $70M Funding Sources (name and description) The New York Power Authority currently works with customers to secure grants and incentives, if available. Sources may include federal government, NYSERDA and the NYS IOU’s (Con Edison, National Grid, and Iberdrola). The remaining cost of the project is then financed by the New York Power Authority, with reliable and secure long-term and short-term financing available. Website www.nypa.gov Best Person to Contact for Information about the Program: Name Eric Alemany Position Program Manager, Market Development & Customer Initiatives Organization New York Power Authority Phone number (914) 390-8223 Email address [email protected] NICHE/OTHER CATEGORY — EXEMPLARY CENTERPOINT ENERGY FOODSERVICE PROGRAM CENTERPOINT ENERGY MINNESOTA GAS: ADMINISTRATOR AND IMPLEMENTER Program Overview CenterPoint Energy’s Foodservice Program started in the mid-1950’s with an emphasis on educating end-use residential customers how to successfully cook with natural gas and the benefits of cooking with natural gas. At that time, customers had many electric cooking options, and CenterPoint Energy created a comprehensive program to engage customers about the usage of natural gas cooking in their homes. That emphasis shifted in the mid1990s to focus on how to efficiently use natural gas foodservice equipment in the commercial market with schools, healthcare and restaurants, since foodservice operations have higher energy intensity per square foot as compared to other commercial customers. There are also many commercial foodservice end-uses beyond ovens including broilers, fryers, and charbroilers, among others, which allows for more opportunity to influence a customer’s decision on the type of equipment purchased. With the shift in focus to commercial customers, the program became part of CenterPoint Energy’s ratepayer-funded Conservation Improvement Program (CIP). 273 LEADERS OF THE PACK © ACEEE Since the mid-1990s, the CenterPoint Energy Foodservice Program has promoted the use of efficient natural gas foodservice equipment by offering equipment rebates and providing training at the company’s Foodservice Learning Center. The program is delivered by CenterPoint Energy in partnership with approximately250 foodservice trade allies who do business within CenterPoint Energy’s Minnesota gas service territory. These trade allies promote the program to foodservice customers, making them aware of the benefits of highefficiency equipment and the availability of rebates, and also receive a trade ally incentive to encourage them to promote the program to their customers. The foodservice sector continues to be one of the fastest growing sectors of energy usage due to the continued trend of consumers dining out and purchasing prepared foods. Additionally, the growth of both the education and healthcare market segments continue to drive increased demand for foodservice equipment, and hence the need for energy efficient natural gas applications. Accordingly, CenterPoint Energy’s Foodservice Program has continually expanded to include incremental pieces of qualifying equipment for rebates when the program is reviewed and approved by the Minnesota Department of Commerce. For example, the 2000-2001 Conservation Improvement Program included four pieces of foodservice equipment while the approved 2013-2015 Conservation Program includes thirteen measures eligible for rebates through the program, including two new measures. The 2013 Foodservice Program rebate structure is as follows: Foodservice Equipment Customer Incentive Trade Ally Incentive Broilers – Infrared, Upright $600 $90 Charbroilers – Infrared $300 $45 Combi Ovens $1,500 $225 Convection Ovens $500 $75 Conveyor Ovens $750 $115 Fryers – High-Efficiency and Infrared $250 $40 Pasta Cookers $200 $30 Pre-Rinse Spray Valves 1.28 GPM or less $15 $0 Rotating Rack Ovens $500 $75 Rotisserie Ovens – Infrared $500 $75 Salamander Broilers – Infrared $150 $25 Kitchen Hood Demand Control Ventilation $0.30/CFM $150 Commercial Energy Star Dishwasher $125 $20 Understanding the varied market segments that foodservice operations include, it is important to promote the Foodservice Program with marketing resources, mailings, emails, and our website. It is just as, if not more important, to establish and maintain relationships with foodservice trade allies and end-use customers. Being an active member of the MN 274 LEADERS OF THE PACK foodservice associations and meeting with the foodservice trade allies on a regular basis are the means by which CenterPoint Energy is educating and delivering the Foodservice Program. Training at the Foodservice Learning Center includes education on energy, efficiency, and rebate opportunities. Program Performance Program spending ranged between $330,000 and $400,000 annually from 2009 through 2011. The program demonstrated gross first year savings between 33,461 and 43,103 MCF per year. 2009 2010 2011 Program Expenditures ($ million) $.33 $.40 $.35 Energy Savings (MCF) 38,458 43,103 33,461 Note: Minnesota’s utility efficiency programs report gross first-year savings. The program has achieved noteworthy participation in both rebates and training attendance offered at the company’s Foodservice Learning Center. Program Year Measures Rebated Foodservice Learning Center Attendees Total Participation 2009 400 507 907 2010 496 605 1,101 2011 425 654 1,079 Impact evaluations have not been performed for the Foodservice Program. Each measure rebated through the program is evaluated by CenterPoint Energy’s technical experts to verify savings calculations and cost-effectiveness. These calculations are reviewed and approved by the Minnesota Department of Commerce during the approval process for CenterPoint Energy’s Triennial CIP Plan. In recent years energy savings calculations have been based on the approved deemed savings methodology issued by the Minnesota Department of Commerce. Minnesota does not use the total resource cost test for utility conservation programs, but rather requires the societal test. Minnesota also requires utilities to provide the utility cost test, the participant cost test and the ratepayer impact test for utility-run conservation projects. The results of each required test are provided below, along with the lifetime cost of energy conserved (dollar per lifetime MCF saved) for the most recent three years of the Foodservice Program. 275 LEADERS OF THE PACK © ACEEE Program Year Utility Cost Test Societal Test Participant Test Ratepayer Impact Test Lifetime Cost of Conserved Energy ($/MCF) 2009 13.18 4.29 4.83 0.86 $2.15 2010 10.45 3.08 3.27 0.86 $3.38 2011 9.35 2.79 3.02 0.85 $3.73 Lessons Learned CenterPoint Energy believes that its foodservice equipment rebates are moving the market to higher efficiency natural gas foodservice equipment, and that is the most successful element of its program. CenterPoint Energy also believes that the key to a successful foodservice program is the relationship with the trade allies because they are so effective at reaching the end-users of the equipment and influencing their decision on which type of equipment will be installed at a facility. The combination of the rebates which buy down the higher first costs of efficient natural gas along with the relationships with the trade allies creates the program’s success. Additionally, the Foodservice Learning Center is invaluable to the overall Foodservice Program because it provides an opportunity to work with both trade allies and end-use customers to help educate them about the options of high efficiency natural gas foodservice equipment. Many customers are reluctant to change out existing cooking equipment for fear that new technologies will perform differently and affect the quality of their recipes. The Foodservice Learning Center allows these customers to get hands-on experience with new equipment before purchasing it, allowing them to become more comfortable with its performance characteristics. Program at a Glance Program name Foodservice Program Targeted Customer Segment Commercial Foodservice Operators: Schools, Healthcare, Restaurants and the like Program Start Date 1995 (as conservation program) Annual Energy Savings Achieved 2009: 38,458 MCF 2010: 43,103 MCF 2011: 33,461 MCF Peak Demand (Summer) Savings Achieved N/A Other Measures of Program Results to Date The Foodservice Program was named an Exemplary program in the ACEEE’s 2008 review of exemplary efficiency programs. Budget for most recent year (and next budget cycle if available) 2011 Spending: $345,294 2012 Budget: $581,304 2013 Budget: $508,737 276 LEADERS OF THE PACK Funding Sources CenterPoint Energy Commercial Rate Payers Website www.centerpointenergy.com/foodservice Best Person to Contact for Information about the Program: Name Ann Lovcik Position Foodservice Energy Efficiency Consultant Organization Sales and CIP Department Phone number 612-321-5470 Email address [email protected] NICHE/OTHER — HONORABLE MENTION ENERGY EFFICIENT POOLS AND SPAS PROGRAM NV ENERGY, ADMINISTRATOR ECOVA, IMPLEMENTER Program Overview The Energy Efficient Pools and Spas Program has been an important part of the NV ENERGY portfolio of energy efficiency programs since 2008. The program targets residential customers who own and operate in-ground swimming pools and spas in Southern Nevada. The program incentivizes customers to replace single-speed and two-speed pool pumps with modern, highly-efficient, variable-speed pool pumps. These modern pumps bring about energy savings through two means. They are highly efficient in their design, using either brushless, permanent magnet motors, or rare earth magnet units, which use an estimated 30% less energy when compared to traditionally wound electric induction pump motors. Additionally, these pumps may be programmed to operate at any selected speed, and taking advantage of the affinity for centrifugal pumps, consume far less electricity when operating at lower speeds. As an additional benefit, these modern pumps are sealed from outside elements and run at much lower operating temperatures, resulting in extended life of the pumps and less wear and tear on the pool filter and other system fittings and accessories. An added benefit, unrelated to energy savings, is that this new generation of pumps are “whisper quiet”, and unlike the units being replaced, may be operated at night time, or at other times when noisy, single-speed pumps may not be preferred. 277 LEADERS OF THE PACK © ACEEE The program design incentivizes customers to replace older pumps by offering an “instant rebate” at the time the new variable speed pump (VSP) is purchased. The program enlists local pool retailers, distributors, and other pool professionals who provide these instant price reductions to utility customers, and who are then re-reimbursed by the utility for the discount provided. These pool professionals receive ongoing training from the implementation contractor regarding pool hydraulics, variable-speed pump theory, marketing, and customer education. An essential element in program delivery is the training of pool professionals in correctly calibrating, or commissioning, these new pumps. Maximum energy efficiency is only achieved when these pumps are correctly calibrated. There have been several key points in the program’s history and evolution. Initially, these VSPs were installed, but not calibrated as part of the program delivery. It was discovered during the Evaluation, Measurement, and Vefification (EM&V) process that energy savings could be more than doubled by correctly commissioning (calibrating) these pumps. Additional savings measures were incentivized in the early years of the program, including seasonal set-back timers. These devices were designed to automatically set back pool pump run times during the winter, early spring, and late fall when pools are not typically under the same use rate. They were dropped from the program when they were determined to be unreliable, and also suffered from a higher than acceptable failure rate. Recent changes to the program include a “quality installation” requirement for program participation. This feature requires participants to purchase VSPs from authorized program participants who sell, install, and commission the pump. This requirement maximizes energy savings and streamlines program administration. Further program progression is built into the 2013 program as the implementation contractor will begin to introduce and train program partners in the benefits of programming the pumps to run only during off-peak hours, typically between the hours of three and six PM. Programming these efficient pumps to run only “off-peak” will be a requirement of program participation in 2014. Program Performance The table below summarizes the performance of the Energy Efficiency Pools and Spas Program for 2010-2012. 278 LEADERS OF THE PACK 2010 2011 Program Spending (actual millions) Program Savings (kWh) Ex Post Savings (kWh/pool) # of Participants $0.41 2,515,931 3,841 696 $1.22 5,967,128 3,827 1,702 Impact Evaluations Total Resource Cost Test www.puc.nv.gov 1.49 www.puc.nv.gov 1.02 2012 $0.98 5,091,254 3,521 1,630 **Pending Evaluation from Contractor** 1.11 Lessons Learned The lessons learned from the Energy Efficient Pools and Spas Program are: Commissioning, or calibrating these Variable Speed Pumps is essential to maximizing the energy savings the program achieves. The program should not endorse any single source energy savings device, i.e., the seasonal set-back timer. When the supplier went out of business, the program had to assume responsibility for repair and warranty issues. It is essential to use only licensed and insured pool professionals It is advisable to use a “quality installation” requirement which requires the same person who sells the VSP to install it and correctly calibrate it. Pool pump suppliers, distributors, and pool maintenance companies are essential program partners. A good working relationship between the program implementation contractor and the evaluation, measurement and verification evaluator is critical. Program at a Glance Program name Energy Efficient Pools and Spas Targeted Customer Segment Residential customers who own and operate inground swimming pools and spas in Southern Nevada. Program Start Date January 1, 2013 (current year) Annual Energy Savings Achieved 5,091,254 - kWh Program Year 2012 Peak Demand (Summer) Savings Achieved 845 kW – Program Year 2012 Other Measures of Program Results to Date Budget for most recent year (and next budget cycle if available) $1.5 M - Program Year 2013 Funding Sources NV ENERGY Website nvenergy.com Best Person to Contact for Information about the Program: 279 LEADERS OF THE PACK © ACEEE Name Douglas L. Eddie Position Project Leader Organization Energy Efficiency Phone number 702-402-5054 Email address [email protected] NICHE/OTHER — HONORABLE MENTION NONPROFIT ENERGY EFFICIENCY PROGRAM ENERGY OUTREACH COLORADO WITH XCEL ENERGY, ATMOS ENERGY, AND SOURCE GAS, PROGRAM ADMINISTRATORS ENERGY OUTREACH COLORADO, IMPLEMENTER Program Overview Energy Outreach Colorado (EOC) created the Nonprofit Energy Efficiency Project (NEEP) in 2007 as a result of increasing energy costs for the non-profit organizations that deliver EOC’s utility assistance programs. Nonprofits, like many of the low-income households they serve, can be adversely impacted by rising energy costs. As a result, many of our nonprofit partners were facing the difficult decision of whether to cut services or to charge a fee for services in order to offset their skyrocketing energy bills. The NEEP program supports nonprofit organizations in Colorado that serve vulnerable, low income populations with energy efficiency upgrades to their facilities and incorporates energy conservation education into their operations. EOC has determined that by targeting dollars toward energy efficiency upgrades in nonprofit organizations, the burden of energy costs can be reduced and more dollars can be allocated toward direct service toward their low-income clients. Organizations that offer 24-hour services, such as day shelters, safe houses and residential treatment centers have a 'high load factor' meaning they use energy every day around the clock. They cannot easily change their energy-use patterns and are most in need of energy efficiency improvements, such as HVAC replacement, higher efficiency appliances and lighting upgrades. NEEP works on a variety of building types throughout Colorado including women’s shelters, medical clinics, schools, community centers, homeless shelters, nonprofit administrative offices and food banks. Over the 5 years that EOC has been operating this program over $7.5 million has been spent on efficiency upgrades of 175 non-profit facilities. On average, each nonprofit realizes a 20% reduction in their utility costs. The savings on utility bills allows them to allocate less money to the operation of their facility and invest more into the valuable work they do for the low-income community. 280 LEADERS OF THE PACK EOC oversees the expenditure of Xcel Energy, Atmos Energy, and Source Gas low income rebate funds, City and County of Denver grant funding, and its own private funding to implement energy efficiency measures on non-profit facilities. Each funding source has established specific measures and targets to evaluate each NEEP project’s performance. The performance measures for our utility partners include: annual energy savings, percentage of allocated funds spent, and total resource cost test on each submitted project. Our goal is to make the NEEP program cost effective in terms of the TRC every year even though according to the rules of our Public Utility Commission, it is not a requirement of the program. The City of Denver requires EOC to address a certain number of facilities with their grant money, total annual energy savings, total leveraged funding, and demonstrate at least an 8 year payback for each project. Atmos and Source Gas run a custom analysis to see if the project passes their TRC test but they do not share those results with EOC. Applications for NEEP are accepted year round, reviewed three times a year and are reviewed based on the organization’s mission, need, and location. EOC partners with Group 14 Engineering to complete the energy audits and produces either an energy model or a deemed savings calculator developed by EOC and Xcel Energy to determine the most cost effective measures. The calculator was developed to ensure compliance with the technical assumptions Xcel must follow when evaluating custom DSM projects. Major rehab or new construction must still be analyzed in an energy model, but the use of the calculator allows EOC and Xcel Energy to move projects through the process faster if common energy efficiency upgrades are being addressed. After the utilities determine the rebate amounts for each project, EOC confirms the approved scope of work with the non-profit organization and measures are sent out to bid. EOC uses a general contractor for implementation of the measures to ensure a fair bid solicitation process is followed and subcontractors adhere to our bid specifications. EOC engineers perform all final inspections of the measures in order to ensure that energy savings are maximized and verify specifications were followed. EOC holds the philosophy that addressing occupant behavior through education is just as important to saving energy as the energy efficiency improvements to the building. The NEEP program delivers an education program that is effective in leading to sustained changes in energy-related behavior of staff and residents. Our approach includes teaching the organization how to interpret their utility bills, providing maintenance training, and establishing a green team to create a shared vision for how the organization will meet their energy savings goal. EOC then assist these organizations in targeting achievable and impactful behaviors, identifying and addressing obstacles to change, and follow through with results. EOC provides guidance on developing strategies for common barriers to behavior changes such as lack of motivation, lack of reminders and absence of social norms. However, the change has been most effective when the nonprofits champion this cause from within the organization. It’s very difficult to measure the impact of conservation education in our program since our equipment upgrades account for larger portion of the realized energy savings. We recently had a project delayed for 8 months that truly embraced our behavior change model that experienced $2,140 in savings on their electric bills solely due to 281 LEADERS OF THE PACK © ACEEE behavior change. The entire organization embraced the shared vision concept by equating saving energy to saving lives by pledging to offer more HIV tests to minority women with the additional operating income from the energy savings. Our approach also reflects the philosophy that education is most effective when the learner is expected to demonstrate what they have learned. Nonprofits are required to present their plan to the NEEP team and their peers prior to receiving approval for energy efficiency upgrades. At the end of the program, each nonprofit has the knowledge, skills and a comprehensive plan to improve their energy use reduction goals and to maximize potential savings. EOC tracks energy usage information in EnergyCAP and sends quarterly progress reports to all of the non-profits that have participated in the program that have reliable data to analyze in the software. If the organizations are not meeting the expected energy savings goals established at the beginning of the project, EOC plans a follow up analysis of the building to identify and address reasons for the building’s lower than expected performance. NEEP is unique in the fact that the program leverages funding from Xcel Energy Demand Side Management program against funds from the city of Denver and Energy Outreach Colorado to conduct deep retrofits of nonprofits across the state of Colorado that struggle to fund their own capital improvements. Nonprofit facilities will always choose to invest in their social programs rather than aging building equipment because of their limited budgets and the fear of reduced funds in the coming year. Therefore, EOC maximizes leveraging opportunity between funders, for example a project located in Denver using Xcel Energy services, in order to address most of the energy savings opportunities in the projects. Through this approach and EOC’s commitment with private dollars, the NEEP program most often requires no financial commitment from the property owner. Windows are on the top of every organization’s wish list and receive the least amount of rebate funding from the utilities, so often organizations will contribute to a window measure to ensure they are replaced. Program Performance The Non-Profit Energy Efficiency program exceeded the electric and gas savings goals and budgets in 2010. This was due to greater participation than anticipated. However, despite this strong performance, the gas component did not pass the Modified TRC Test. The reason the program did not pass was due to high rebate costs for projects that had a smaller gas savings than anticipated. The program went over budget in 2010 and therefore saw a decrease in the TRC Test. In 2011, the NEEP programs goals were increased and administration costs were lowered to drive the success of the program. As a result of a strong pipeline of projects identified and approved in 2010, many projects were implementing throughout 2011. The program exceeded the electric and gas savings goals in 2011. The engineering approval process to review and approve projects was enhanced to increase the responsiveness and turnaround time. 282 LEADERS OF THE PACK EOC and its utility partners have defined net and gross savings as one in the same. There are no free riders in this program or program spillover from the other incentive programs offered by the utilities, therefore, the net savings equal gross savings. 2009 2010 2011 2012 Reported Savings* $53,686 $129,230 $259,310 $136,265 Savings Actual (verified portion)** $26,850 $41,062 $93,277 No data yet Spending ($ million) $0.796 $1.381 $2.525 $1.188 Number of participants 20 40 41 31 * The savings reported captures all of the deemed savings determined by the utilities that program year for all NEEP projects and the actual savings reported are only a sample of projects that had reliable data that program year. ** Actual savings are calculated through the collection of utility data that is weather normalized through the program EnergyCAP. The analysis is only completed for a sample of the projects in each year. Reasons that a project might not be included in the analysis consist of: o the building is new to the nonprofit and therefore there are not any previous utility records to compare to, o utility billing includes too many errors to have a reliable analysis, o facilities have made major changes to the building during evaluation time period other than through our program that make it impossible to compare before and after in a reliable way o still working with utility vendors to provide data Colorado’s Public Utility Commission mandates each utility to implement a measurement and verification (M&V) plan to evaluate the actual performance of its DSM program. This includes evaluating the method of data analysis, free ridership, spillover, and the net-to-gross ratio among other program variables. Since every NEEP project undergoes an extensive custom analysis of each proposed measure and the net-to-gross ratio is 100%, the program has never been selected for a thorough comprehensive evaluation and has always generated realization rates of 100%. All of the cost effectiveness data comes from the strongest utility partner in the program, Xcel Energy, the largest investor owned utility in the state of Colorado. The following numbers have been cited from their DSM status reports filed with the Public Utility Commission every year. There is intensive upfront custom analysis that determines rebate amounts, attributable savings toward goals, and whether or not individual EE measures are passing the TRC test. Additionally, EOC inspects all installed measures and the program has zero free ridership. Xcel and the other natural gas utilities use deemed savings in the custom analysis but consistently use historical bill data to ensure they are not overestimating savings. Xcel has yet to compile the final achievement number for their DSM programs in 2012. 283 LEADERS OF THE PACK © ACEEE Xcel Energy Status Reports 2009 2010 2011 Electric TRC 2.82 1.13 1.33 Natural Gas TRC 0.68 0.87 1.11 The Non-Profit Energy Efficiency Program is very similar to most business energy efficiency programs with respect to the sales cycle for projects. There is a long lead-time to identify and complete a project. As a result, participation was limited in the first year. The engineering approval process to review and approve projects has been refined to increase the responsiveness as project opportunities developed which was an effort to improve the program in the future. Lessons Learned As the program has evolved, EOC has determined it prudent to always be sensitive to interrupting the services that non-profits provide to the low income community. Replacing hot water boilers in shelter that provides laundry and shower services everyday must be handled differently than any other retrofit projects. Temporary heat and hot water has been a necessary expense on many 24 hour facilities. EOC must be very sensitive to the organization’s mission and this can be as complex as monitoring construction crews in battered women’s shelters while the measures are being completed. Even though EOC did bid out each measure to get competitive pricing, it is often best for the operations and maintenance of the building to use contractors suggested by the organization. Design misunderstanding and maintenance concerns arise when one contractor installs the system and another maintains it. If the bids are close in price, EOC has selected contractors that have a longstanding maintenance contract or relationship with the organizations to ensure the longevity of energy savings from the retrofits. For several years, EOC contracted with engineering firms that provided subsidized commercial audits through Xcel Energy’s Onsite Assessment Program in order to have more administrative and incentive funding for the program. These assessments proved to be very prescriptive rebate based analysis of the buildings and lacked the necessary depth to achieve significant energy savings. Much of the predicted savings were highly inflated when compared one year later to the actual savings and the program was running the risk of misinforming organizations about realistic energy saving goals. EOC decided to invest in a more thorough analysis that would use a third party engineering firm to evaluate buildings in the program. We also developed a custom rebate tool with Xcel Energy to process rebate funding decisions faster and create a transparent analysis process between EOC, Xcel Energy, and the energy auditor. Recently, a non-profit facility built in 2009 applied to the NEEP program to deal with their excessively high utility bills. After conducting a retro-commissioning study and making some control and operational changes, the building’s utility expenditures were reduced by 32%. This organization was encouraged to apply in 2008 for energy design assistance through the NEEP program when planning and development of the project occurred. 284 LEADERS OF THE PACK Unfortunately, the organization turned down the services at that time and thus experienced the consequences of one year’s worth of lost opportunity. Program at a Glance Program name Nonprofit Energy Efficiency Program (NEEP) Targeted Customer Segment Commercial Nonprofits Program Start Date May 2007 Annual Energy Savings Achieved 2009 - $26,850 2010 - $41,062 2011 - $74,397 Peak Demand (Summer) Savings Achieved: Other Measures of Program Results to Date: # participants 2010 – 40 2011 – 41 2012 – 31 Budget for most recent year (and next budget cycle if available): 2012 – $1,999,671 2013 – $2,164,880 Funding Sources (name and description): Xcel Energy City and County of Denver Atmos Energy, Source Gas, United Power Website: www.energyoutreachcolorado.org/neep Best Person to Contact for Information about the Program: Name Luke Ilderton Position Director of Energy Efficiency Programs Organization Energy Outreach Colorado Phone number 303-226-5057 Email address [email protected] NICHE/OTHER — HONORABLE MENTION HOSPITAL EFFICIENCY PROGRAM PUBLIC SERVICE ELECTRIC & GAS, ADMINISTRATOR VARIOUS ENGINEERING AND ECM INSTALLATION CONTRACTORS, IMPLEMENTERS 285 LEADERS OF THE PACK © ACEEE Program Overview The PSE&G Hospital Efficiency Program was launched as a commitment to New Jersey’s Energy Master Plan of 2008 that, at the time, aimed to achieve reductions in State energy consumption of 20% by 2020. Hospitals were identified by PSE&G as a high energy-usage sector that faced unique challenges and market barriers that required more than traditional energy efficiency rebate program strategies to overcome. Since hospitals are limited in number and easily identified, they offered a unique opportunity to concentrate resources in an innovative sub-program design and to transform a complete customer sector within a targeted geographic area. Of the 73 full service hospitals operating within New Jersey, fiftytwo are located within PSE&G service territory. The Hospital Efficiency Program addresses financial barriers to the implementation of energy efficiency measures by providing funding for the total cost of energy efficiency projects during construction, and allowing the hospital to repay its portion of the total costs over time on its PSE&G utility bill. Hospitals pose a unique set of issues that must be dealt with in order to achieve the operational efficiencies necessary to reduce their overall costs and enable this sector to continue to provide significant economic and health benefits to the communities they serve and the State as a whole. Market barriers that impede hospitals and other healthcare organizations from implementing energy efficiency improvements include a lack of internal capital to fund projects and the inability to identify projects with a sufficient return on investment to meet their internal investment criteria. Key market barriers that have prevented the healthcare sector from fully implementing robust energy savings measures to its facilities include: Bias toward projects with lower first cost rather than projects that reduce operating costs. Energy efficiency measures often require a high initial capital investment. Financial constraints in the health care sector can make that unattractive in the short term. Healthcare sector’s general lack of capital for energy efficient infrastructure development and improvements; low profit margins and tight capital keep energy projects (viewed as "optional") from implementation. Further, the core mission of hospitals is health care so resources are prioritized accordingly. Planners may lack information or credible case studies. Decision makers may think researching and incorporating energy efficiency would be prohibitively time consuming. Operations resources are often consumed in repairing existing equipment on an ad hoc basis such that down time to explore options and educate as to solutions is very limited. Operations and management are an important part of an energy-efficiency strategy. Staff motivation or training may be needed to achieve and maintain maximum equipment efficiency. These market barriers have been exacerbated by the financial pressures faced by hospitals in today’s economic environment which contribute to the hospital sector’s general lack of capital for infrastructure improvements. The Hospital Efficiency Program addresses these financial barriers through its incentive structure and on-bill repayment option. In addition, the Program addresses barriers related to lack of 286 LEADERS OF THE PACK information and staff expertise by providing an unbiased source of energy efficiency information through the IGA, design assistance, consultation and technical assistance, and opportunities to improve system operations. The PSE&G Hospital Efficiency Program delivery typically occurs in four steps: Step One: Investment Grade Audit (IGA) of customer’s building. The PSE&G program contractors perform a detailed IGA and prepare a customized audit report that includes a list of recommended energy conservation measure (ECM) upgrade options. Measures include HVAC, humidification, building envelope, ventilation, motors, lighting, energy management systems and other energy consuming equipment. PSE&G reviews the potential ECM upgrades with the customer. ECMs identified by the audit with a simple payback of 15 years or less are targeted for retrofit opportunities. PSE&G ‘buys down’ the project’s payback by 7 years to not less than 2 years (e.g., projects with a 15-year payback will receive an incentive to reduce the payback to 8 years while Projects with a payback of 5 years will receive an incentive that will reduce the payback to 2 years). Step Two: Engineering Analysis of Project. Based on the IGA results, an engineering analysis is performed by the PSE&G engineering contractor, measures payback and project cost effectiveness screening is conducted, and a set of approved ECMs is selected for the project. The program contractor prepares bid-ready documents for the customer to facilitate the preparation of a project Scope of Work, which will be used by the customer to obtain contractor cost estimates for ECM installation. Step Three: Scope of Work/Contractor Bids. The customer prepares a Scope of Work for contractor bids. PSE&G, its engineering contractor and the customer review the contractor bids/costs and select the contractor(s). At this time, the first progress payment equal to approximately 30% of the estimated total project cost can be issued to the customer. As the work proceeds, PSE&G will pay the total cost of the measures. Customers will repay their share (interest free) over a 3-year period on their PSE&G bill commencing upon project completion. Step Four: Measures Installation and Inspections. PSE&G, with the help of its engineering contractor, monitors the project progress, verifies equipment ordering and receipt, monitors project cash flows, and may conduct an on-site inspection(s) throughout the project construction cycle. A series of payments timed to align the projects cash flow with project activities and based upon the appropriate monitoring and verification by the PSE&G program operations manager will be made. Upon verification of the project progress, a series of second progress payments up to 50% of total project commitment can be issued. When the project is 100% complete, a final project true-up and final inspection takes place. If the inspection is successful and approved, the final payment based on the results of project true-up is determined and issued. If the final costs are less than the estimated project commitment, the final payment will be adjusted down to reflect the actual costs. If the final costs are more than the estimated project commitment, the final payment will not be adjusted and will be paid according to the original estimate. Project is now complete and customer repayments begin. 287 LEADERS OF THE PACK © ACEEE NOTE: Progress payments for Energy Efficiency Economic Stimulus Initiative (EEE) funded programs were slightly different. Initial payment of 33%, second payment of 33% when the project is 50% complete and the final payment after the project has been completed. Program Performance Expenditures for the PSE&G Hospital Efficiency Program are summarized in the table below. Program budget ($millions) Carbon Abatement Filing (2008) $11 EEE Filing (2009) $68 EEE Extension Filing (2011) $50 Twenty hospital projects have been completed in the PSE&G Hospital Efficiency Program representing expenditures of $76.3 million. Based on the IGAs and the measures implemented to date, PSE&G estimates annual energy savings at $8.27 million. There are 5 active projects which represent another $5.7 million in investment and an additional 25 projects in queue with a potential of $44.3 million to be invested. The cost of conserved energy for the PSE&G Hospital Efficiency Program is estimated at $0.05/kWh. Lessons Learned Hospitals represent an excellent opportunity for a deep retrofit of energy conservation measures. They do, however, have certain limitations within which any energy efficiency program must work. Lighting represents approximately 40% of total energy consumption and is an obvious candidate, however, much of the opportunity lies within patient rooms, the primary source of revenue for the hospitals. Substantially more time must be allowed for patient room retrofits and, because of the granular nature, is probably better off being completed by the facilities staff of the hospital as rooms are available instead of 3rd party contractors. Hospitals must have redundant heating and cooling systems. As such, any improvements must maintain this redundancy in some manner; this can become very expensive (i.e. the cost of two systems but the energy efficiency of only one). In addition, seasonal timing of improvements becomes a dominant issue (i.e. replacement boilers in the summer at low use). Peer benchmarking of facilities is very helpful in delving into opportunities. Often, the staff becomes accustomed to their energy costs believing that savings can only be derived through better commodity purchases. In fact, energy efficiencies can produce very substantial savings if sought. Peer benchmarking provided a target to strive for in the investigation. 288 LEADERS OF THE PACK Because many facilities continue to use infrastructure designed for a previous era (i.e. high pressure boiler systems supporting laundry capabilities that are now provided offsite by 3rd parties), there exists unconventional opportunities such as reducing overall steam pressure or off-taking steam to other uses where possible. Other opportunities include upgraded controls for lighting, air handling, pumping energy and the like all aimed at better matching the demand within the facility to the infrastructure required to meet same. A prime example is programmed temperature and air volume setbacks in unoccupied spaces during nights and weekends. With respect to funding, the PSE&G Hospital Efficiency Program initially funded 1/3 of the capital at (i) project inception, (ii) 50% complete and (iii) upon completion. This mechanism became problematic as the time between payments presented cash flow issues for contractors. In thinking about the Program, PSE&G quickly realized that its primary role once the project commences is that of a lender. As such, PSE&G refined their process to provide funding in step with progress so as to present a stabilized cash flow pattern during the project. PSE&G accepted early on their fiduciary obligation to the rate payer; as such, PSE&G requires guarantees of project completion such as bonding from prime contractors so that they can realize the energy efficiencies and in so doing demonstrate program success. Finally, PSE&G learned early on that hospitals as a whole are cash-constrained. Infrastructure improvements are not at their core mission and as such are repaired/replaced on an ad hoc basis using crisis management rather than on a proactive basis. By providing funding for their infrastructure, hospitals are able to deploy their limited resources in properly maintaining new and functioning equipment rather than continuing expensive repairs to obsolete equipment. Program at a Glance Program name PSE&G Hospital Efficiency Program Targeted Customer Segment NJ Hospitals within PSE&G Service Territory Program Start Date 2008 Annual Energy Savings Achieved $8.27 million Budget for most recent year (and next budget cycle if available) $50 million Funding Sources (name and description) Interest free loan from the utility paid via customers’ utility bill Website www.pseg.com Best Person to Contact for Information about the Program: Name John W. Senkewicz Position Manager, Business Service Marketing Organization Public Service Electric & Gas (PSE&G) 289 LEADERS OF THE PACK © ACEEE Phone number 973-430-7512 Email address [email protected] 290


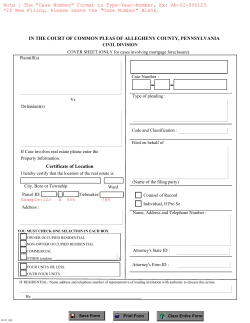


© Copyright 2026