
B J ’ S R E S T... 2 0 0 6 A N N U...
B J ’ S R E S T A U R A N T S, I N C.
2006 ANNUAL REPORT
B
J
’
S
R
E
S
T
A
U
R
A
N
T
S
,
I
N
C
.
fiscal year*
(in thousands, except per share)
2006
2005
2004
SELECTED
Total Revenues
$
238,928
$ 178,210
$
129,049
FINANCIAL
Net Income
$
9,845
$
8,351
$
6,265
HIGHLIGHTS:
Net Income Per Share:
Basic
$
0.42
$
0.38
$
0.32
Diluted
$
$
0.41
0.36
$
0.30
Total Assets
$
249,849
$ 163,958
$
100,866
Shareholders’ Equity
$
202,862
$ 129,899
$
78,780
* 2004
C O M PA N Y P R O F I L E
▼
i s a 5 3 - w e e k y e a r. A l l o t h e r y e a r s c o n s i s t o f 5 2 w e e k s .
IN 1978, TWO GUYS ARMED WITH A GREAT RECIPE FOR DEEP DISH PIZZA,
OPENED THE FIRST BJ’S CHICAGO PIZZERIA IN SANTA ANA, CALIFORNIA.
▼
THE PIZZA WAS AN INSTANT HIT
AND AS YEARS WENT BY, NEW BJ’S RESTAURANTS WERE OPENED IN BEACH CITIES ALONG SOUTHERN
CALIFORNIA’S COASTLINE.
▼
IN 1996, WITH SEVEN RESTAURANTS IN OPERATION FROM SAN DIEGO TO
LOS ANGELES, THE FIRST LARGE FORMAT BJ’S RESTAURANT AND BREWERY BEGAN OPERATIONS IN BREA,
CALIFORNIA.
▼
THE INTRODUCTION OF FINE, HANDCRAFTED BEER AND THE WIDE VARIETY AND GENEROUSLY
PORTIONED MENU ITEMS WERE WELCOMED BY GUESTS.
▼
TODAY WE OFFER APPROXIMATELY 100 MENU ITEMS
INCLUDING SPECIALTY SALADS, SOUPS, PASTA, SANDWICHES, ENTREES AND DESSERTS, INCLUDING OUR FAMOUS
PIZOOKIE® DESSERT, IN A HIGH ENERGY, FULL SERVICE CASUAL DINING ENVIRONMENT. OUR RESTAURANTS
OPERATE AS BJ’S RESTAURANT & BREWERY, BJ’S RESTAURANT & BREWHOUSE AND BJ’S PIZZA & GRILL.
▼
AT THE END OF FISCAL 2006, WE OWNED AND OPERATED 55 RESTAURANTS LOCATED IN CALIFORNIA, OREGON,
COLORADO, ARIZONA, TEXAS AND NEVADA.
▼
WE ALSO HAVE ONE LICENSED RESTAURANT IN MAUI, HAWAII.
▼
TO
F ISCAL 2006
MEASURE .
OUR
SHAREHOLDERS;
WAS A VERY PRODUCTIVE YEAR FOR OUR
N OT
ONLY DID WE OPEN
11
C OMPANY
SUCCESSFUL NEW
BJ’ S
ON ALMOST EVERY
RESTAURANTS A N D
A C H I E V E O U T S TA N D I N G C O N S O L I D AT E D F I N A N C I A L R E S U LT S F O R T H E Y E A R ,
we also accomplished several objectives that were designed to
casual dining restaurants during the last 15 years. Higher interest
continue the transition of the BJ’s concept to a “premium casual”
rates and gasoline prices, among other things, have impacted the
or “casual plus” positioning in every respect, and to continue the
discretionary incomes of many consumers that visit casual dining
steady transition of our Company from a “good restaurant company
restaurants. And, the challenging operating environment continues
that is growing” to a “restaurant growth company.” While we still
unabated as we enter 2007. It has been our observation over the
have much work left to accomplish in those respects, we are proud
years that the higher quality, more differentiated and more
of our accomplishments during the past fiscal year and the positive
“approachable” casual dining restaurants have a better opportunity
momentum that we carry forward from those achievements into
to do well in both favorable and challenging operating environments.
fiscal 2007.
We believe that consumers are more likely to cut back on their
patronage of the more mediocre “mass market” casual dining
During fiscal 2006, our revenues increased a strong 34% to
concepts before they change their dining behaviors for the higher
$238.9 million, driven by an approximate 24% increase in total
quality and more differentiated concepts that offer a better overall
restaurant operating weeks, coupled with a strong 5.8% increase
dining experience and value for the money. This continues to
in comparable restaurant sales. Our net income increased
be our unwavering strategic direction for the BJ’s concept as we
approximately 18% to $9.8 million and our earnings per share
move forward.
increased approximately 14% to $0.41. During the first quarter of
fiscal 2006, we adopted a new accounting pronouncement called
When we look back at 2006 for our business, it was a year in which
SFAS No. 123 (Revised), “Share-Based Payment.” SFAS No. 123R
we focused most of our key initiatives on strengthening BJ’s ability
requires the fair value measurement of all stock-based payments
to process an increasing amount of sales in a more productive,
to employees, including grants of stock options, and recognition of
efficient and leverageable manner, while simultaneously
those expenses in the Company’s results of operations. The results
improving the overall quality and differentiation of the BJ’s dining
for fiscal 2005 do not include the impact of SFAS No. 123R.
experience. After careful development and testing, we provided
If the impact of SFAS No. 123R was included on a pro-forma
our restaurant operators with two important technological toolsets
non-GAAP basis for all of fiscal 2005, then our net income and
during 2006 to help them achieve this objective: an automated
diluted net income per share for fiscal 2006 would have increased
kitchen display system (KDS) and a web-based automated labor
approximately 52% and 46%, respectively.
scheduling and analysis program. In connection with the rollout
of these toolsets, we modified certain operational systems and
Our outstanding financial results for 2006 were achieved in spite of
procedures in our restaurants to focus our restaurant operators on
one of the most challenging operating environments in general for
the delivery of “quality fast” execution. We believe these new
B
J
’
S
R
E
S
T
A
U
R
A
N
T
S
,
I
N
C
.
toolsets, coupled with the quality differentiation of the BJ’s
Last year, we invested additional resources in expanding the
concept and other improvements that we implemented to our food,
quality and depth of our restaurant manager recruitment and
service and facilities during the year, are the principal reasons
underlying the achievement of BJ’s 10th consecutive year of
training programs to support our planned future growth. We also
positive comparable sales comparisons during 2006. As we move
individually tailored for each restaurant manager as well as a more
into 2007, we will continue to further strengthen our capability in
comprehensive recognition program. And, to help us better attract
this respect by implementing a theoretical food cost system and
and retain the best hourly team members in our restaurants,
an automated front desk seating system, both of which we believe
we introduced a group health insurance program for qualified
will help our restaurants become even more productive,
team members.
designed and rolled out a career development roadmap that is
particularly during peak meal periods.
At the start of 2007, we introduced BJ’s Gold Standard Stock
Now that we are in a better position to correctly and consistently
Ownership Program (the “GSSOP”). The GSSOP is a tenure and
process all of the business being offered to us, we are ready to
performance-based equity incentive plan that currently consists
more aggressively drive for more sales.
of restricted stock unit grants to each
All of the great consumer growth
of our qualified restaurant general
companies are sales builders, first and
managers, executive kitchen
foremost, and that is our unwavering
managers, culinary training managers
focus here at BJ’s. As long as we have
and area/regional directors of
the sales, we will have the opportunity
operations. We believe the GSSOP
to optimize the bottom-line results of
will significantly enhance our ability
our business. By the fourth quarter of
to attract and retain the very best
fiscal 2007, we should be ready
restaurant management talent as we
to re-launch a more effective and
grow. Additionally, we believe the
productive off-premises sales program,
for which we believe is currently
B J’S S P I N ACH A N D A R T I CH O K E D I P
Company’s opportunity to sustain
and enhance its overall financial
under-delivered at BJ’s. Our off-premises sales channel is only
performance will be improved if our restaurant operational leaders
about 5% of our total restaurant sales, and we believe that a 10%
have a meaningful ownership stake in our business and think more
sales target for this channel is a realistic objective during the
like owners in their daily actions and behaviors.
next couple of years. Other 2007 sales-building initiatives include,
among other things, a small number of patio additions and
We achieved our capacity growth goal for 2006 by opening 11 new
enclosures; the introduction of certain “casual plus” operational
restaurants and thereby increased our total restaurant operating
and service enhancements; and the introduction of a national
weeks by approximately 24% during the year. And, we also set new
marketing plan that is focused on driving top-of-mind awareness
opening-week sales records along the way. Our primary growth goal
and company-wide seasonal beer promotions.
over the next few years is to increase our productive capacity by
20% to 25% each year as measured in total restaurant operating
Having a popular, high quality and differentiated restaurant
weeks. In order to facilitate the achievement of that goal, we plan
concept with state-of-the-art operational toolsets are clear
to open as many as 13 new restaurants during 2007, of which two
requisites to support a national expansion plan. However, there is
have already opened as of this date – in Tampa, Florida and
no substitute for the correct, consistent operational execution of
Columbus, Ohio – representing our first restaurants in the Eastern
our concept in every detail, on every shift. While we are fortunate
time zone. Initial sales results for these new restaurants have been
to have many highly qualified and motivated restaurant managers on
very encouraging. During the next couple of years, we currently
our team, we can only grow as fast as we can recruit, develop and
plan to open additional restaurants in the Ohio Valley and central
retain additional highly qualified restaurant managers. During 2006,
Florida markets. However, most of our planned growth for the next
we recruited 174 new restaurant managers to join our team, and in
few years will be in our “home court” state of California and within
2007 we will likely need 230-240 additional restaurant managers.
our current markets in the western United States, where we still
BJ’S BUFFALO CHICKEN DEEP DISH PIZ Z A
BJ’S RESTAURANT & BREWHOUSE, TEMECUL A, CALIFORNIA
“WOW”
I LOVE
THIS
PLACE!
B
J
’
S
R
E
S
T
A
U
R
A
N
T
S
,
I
N
C
.
have plenty of room to grow. Our new restaurant development plan
and economies of scale, compared to the “hub and spoke” and
will continue to be careful, disciplined and controlled.
larger-scale contract brewing models.
During 2007, we also plan to take advantage of the strong economies
In conclusion, BJ’s achieved very solid results for fiscal 2006 in
of scale that are offered by our new brewery in Reno, Nevada that
almost every key measure, in spite of the continuing challenges in
we opened in the fourth quarter of 2006. Our Reno brewery has
the general operating environment. Thanks to the hard work of
the estimated capacity to produce as many as 15,000 barrels of beer
all of our restaurant operators, we continue to enjoy strong sales for
annually, which is about three times the estimated annual
both our new restaurant openings and our established restaurants.
productive capacity of our current large breweries in California.
That doesn’t happen by itself – it is the result of a lot of hard work
After we gradually ramp up the production activities of the Reno
and a lot of things being executed correctly in our restaurants.
brewery during the first half of fiscal 2007, we plan to re-balance
Having said that, we can never be satisfied with our operational
all of our internal beer production activities among our remaining
execution in any aspect of our business. We can always surpass our
internal breweries to take full advantage of the economies of scale
previous best. Our leadership team remains highly confident of
offered by the Reno brewery, and to facilitate a meaningful
our ability to continue executing our national growth plan while,
reduction in the average production cost per barrel of beer to our
at the same time, executing all of our key initiatives and working
restaurants. In addition to optimizing all of our internal brewing
hard to achieve steadily increasing leverage in every aspect of our
activities during 2007, we will continue to aggressively focus on
business as we grow. That is the principal difference between a
expanded contract brewing and licensing arrangements that should
“good restaurant company that is growing” and a “restaurant growth
provide us with the necessary flexibility to offer our unique, high
company,” and we are committed to joining the ranks of the great
quality handcrafted beer in new restaurants in certain states where
growth companies in our industry. We would like to express our
legal restrictions make it difficult to sell the beer that we brew
deepest appreciation and thanks to our loyal guests, shareholders,
ourselves, unless we were to brew it in the restaurant locations
supplier partners and our almost 7,000 team members across the
themselves in those states. A “brewpub” beer production model
country for your confidence and support this past year. We strongly
does not offer many advantages in terms of product consistency
believe that the best years for BJ’s are yet to come.
BJ’S LE ADERSHIP TE AM
APRIL 2007
BJ’s Management Team : Jerry Deitchle, Jim Farman, Ray Martin, James Drake, Chris Pinsak, Michael Ferguson, Dave Youngberg, Mel Landuyt, Owen Williams, David Oberg, Monty Madison, Rob DeLiema, Marc Weber,
Dean Gerrie, Steve Mintzer, Roger Ortiz, Don Gardner Moe Robiglio, Bob Lombardo, John Allegretto, Tom Norton, Alex Puchner, Greg Lynds, Luis Ruvalcaba, Steve Demetor, Nanette McWhertor, Deb Chappell, Greg Levin,
Ame Kuyper, George Perez, Lyndon Robinson, Angel Mejia, Michele Maerz, John Oliver, Lon Ledwith, Sandy Habib, Dianne Scott, Melanie Bruno-Carbone, Loren Reynoso, Rana Schirmer, Brian Pearson
BJ’S RESTAURANT & BREWERY, RENO, NEVADA
BJ’S SANTA FE SPRING ROLLS
BJ’S RESTAURANT & BREWHOUSE, ARLINGTON, TEXAS
B
J
’
S
R
E
S
T
A
U
R
A
N
T
S
,
I
N
C
.
B J ’ S R E S T A U R A N T S O P E N E D O R W I T H S I G N E D L E A S E S A S O F M A Y 14, 2 0 0 7
ARIZONA
Natomas - The Promenade
N E VA D A
Chandler - Chandler Fashion Center
Oxnard - Esplanade Drive
Reno - The Summit
Mesa - Superstition Springs Boulevard
Palmdale - Antelope Valley Mall
Summerlin - Canyon Point Shopping Center
Phoenix - Desert Ridge Market Place
Rancho Cucamonga - 4th Street
Tucson - Oracle Road
Roseville - Roseville Parkway
OHIO
San Bernardino - Hub Shopping Center
Columbus - Polaris Mall
CALIFORNIA
San Bruno - Tanforan Shopping Center
Cincinnati - Tri-County Mall; 2008*
Arcadia - Huntington Drive
San Jose - Westfield Shoppingtown Oakridge
Bakersfield - Riverwalk
San Mateo - Bridgepoint Shopping Center
OKLAHOMA
Balboa - Main Street
Stockton - Stonecreek Village; 2007*
Norman - Ed Noble Parkway
Belmont Shore - Second Street
Temecula - Overland Center
Oklahoma City - Quail Springs Mall; 2007*
Brea - Brea Mall
Vacaville - Nut Tree Parkway
Burbank - 1st Street
Valencia - McBean Parkway
OREGON
Cerritos - 183rd Street
West Covina - Eastland Center Drive
Eugene - Coburg Road
Corona - The Crossings
Westlake Village - Thousand Oaks Boulevard
Portland - Center Avenue
Cupertino - DeAnza Boulevard
Westwood - Broxton Avenue
Portland - Weidler Street
Elk Grove - Laguna Point
Woodland Hills - Canoga Avenue
TEXAS
Folsom - Bidwell Street
Fresno - Fashion Fair Regional Mall
COLORAD O
Addison - Belt Line Road
Glendale - Glendale City Center; 2007*
Aurora - Aurora Town Center
Clear Lake - Bay Area Boulevard
Huntington Beach - Beach Boulevard
Boulder - Pearl Street Mall
East Plano - Collin Creek Shopping Center
Huntington Beach - Main Street
Westminster - The Shops at Walnut Creek
El Paso - Las Palmas
Irvine - Irvine Market Place
Lewisville - Stemmons Freeway
La Jolla - Village Center
FLORIDA
McAllen - Palms Crossing; 2007*
La Mesa - Grossmont Mall
Orlando - Millenia Mall
South Arlington - Arlington Highlands
Laguna Beach - Pacific Coast Highway
Tampa - Pinellas Park
Sugar Land - State Highway 6
Laguna Hills - Laguna Hills Mall
Tampa - Citrus Park; 2007*
Temple - Bird Creek Crossing; 2007*
Moreno Valley - Centerpoint Drive
Montebello - Montebello Town Center; 2007*
Willowbrook - FM 1960 Road West
H AWA I I
Maui- Lahaina (Licensed)
* Signed lease with an expected opening in the year noted.
B
J
’
S
R
E
S
T
c o r p o r a t e
A
U
R
A
N
T
S
,
I
N
C
.
i n f o r m a t i o n
BOARD OF DIRECTORS
Paul A. Motenko
Gerald W. Deitchle
Larry D. Bouts
John F. Grundhofer
Co-Chairman of the Board,
President & CEO,
Investor/Business Advisor;
Retired; Former Chairman, Chief Executive
Vice President and Secretary
BJ’s Restaurants, Inc.
Former Chairman & Chief Executive Officer
Officer and President of U.S. Bancorp
BJ’s Restaurants, Inc.
Six Flags Theme Parks
Peter A. Bassi
J. Roger King
Jeremiah J. Hennessy
Retired; Former Chairman & President of
Shann M. Brassfield
Retired; Former Senior Vice President,
Co–Chairman of the Board,
Yum! Restaurants International
President , Golden Resorts, Inc.
Human Resources of PepsiCo, Inc.
BJ’s Restaurants, Inc.
James A. Dal Pozzo
President, The Jacmar Companies
Gerald W. Deitchle
Lon F. Ledwith
Robert P. Lombardo
Christopher P. Pinsak
President & CEO
Senior Vice President, Restaurant Operations
Vice President, Development & Construction
Regional Vice President, Restaurant Operations
John D. Allegretto
Alexander M. Puchner
Raymond G. Martin
Michele M. Maerz
Chief Supply Chain Officer
Senior Vice President, Brewing Operations
Vice President, Culinary Development
Regional Vice President, Restaurant Operations
Gregory S. Levin
Melanie R. Bruno-Carbone
Nanette McWhertor
Steven M. Mintzer
Chief Financial Officer
Vice President, Marketing
Vice President, Operational Support
Regional Vice President, Restaurant Operations
& Restaurant Openings
Gregory S. Lynds
James A. Drake
Chief Development Officer
Vice President, Kitchen Operations
Brian W. Pearson
Vice President, Information Services
Thomas F. Norton
Rana G. Schirmer
Chief Human Resources Officer
Vice President, Accounting & Controller
S H A R E H O L D E R I N F O R M AT I O N
Corporate Offices
Common Stock
Investor Relations
Inquiries for stock transfer requirements, lost
BJ’s Restaurants, Inc.
The Company’s common stock is traded on
Inquiries from shareholders, analysts or
certificates and changes to addresses should
7755 Center Avenue, Suite 300
the NASDAQ stock market under the symbol
prospective investors should be directed to:
be directed to:
Huntington Beach, California 92647
“BJRI”.
Gregory S. Levin
U.S. Stock Transfer Corporation
Chief Financial Officer
1745 Gardena Avenue, 2nd Floor
Legal Counsel
(714) 500-2400 Ext. 2440
Glendale, California 91204
Jeffer, Mangels, Butler, & Marmaro, LLP
[email protected]
(818) 502-1404
(714) 500-2400
www.bjsrestaurants.com
Los Angeles, California
Independent Registered Public
Accounting Firm
Ernst & Young LLP
Irvine, California
Statements contained herein that are not historical facts are forward looking statements. Important factors which could cause the Company’s actual results to differ materially from those projected in, or
inferred by, forward looking statements are (but are not necessarily limited to) the following: (i) the Company’s ability to manage an increasing number of new restaurant openings, (ii) construction delays,
(iii) labor shortages, (iv) minimum wage increases, (v) food quality and health concerns, (vi) factors that impact California, where a significant amount of our restaurants are located, (vii) restaurant and
brewery industry competition, (viii) impact of certain brewery business considerations, including, without limitation, dependence upon suppliers and related hazards, (ix) consumer trends,
(x) potential uninsured losses and liabilities, (xi) fluctuating commodity costs including food and energy, (xii) trademark and servicemark risks, (xiii) government regulations, (xiv) licensing costs,
(xv) beer and liquor regulations, (xvi) loss of key personnel, (xvii) inability to secure acceptable sites, (xviii) limitations on insurance coverage, (xix) legal proceedings, and (xx) other general economic
and regulatory conditions and requirements.
Designed and produced by BJ’s Restaurants, Inc. / Design Group. Photography: AG Photography, Laurie Vogt Photography, Inc., Walter Urie Photography © Copyright 2007 BJ’s Restaurants, Inc.
LEADERSHIP TEAM
UNITED STATES
SECURITIES AND EXCHANGE COMMISSION
Washington, D.C. 20549
FORM 10-K
(Mark one)
È
ANNUAL REPORT PURSUANT TO SECTION 13 OR 15(d) OF THE SECURITIES
EXCHANGE ACT OF 1934
For the fiscal year ended January 2, 2007
OR
‘
TRANSITION REPORT PURSUANT TO SECTION 13 OR 15(d) OF THE SECURITIES
EXCHANGE ACT OF 1934
For the transition period from
to
Commission file number 0-21423
BJ’S RESTAURANTS, INC.
(Exact name of registrant as specified in its charter)
California
33-0485615
(State or other jurisdiction of
incorporation or organization)
(I.R.S. Employer
Identification Number)
7755 Center Avenue
Suite 300
Huntington Beach, California 92647
(714) 500-2400
(Address, including zip code, and telephone number, including
area code, of registrant’s principal executive offices)
Securities registered pursuant to Section 12(b) of the Act:
Title of Each Class
Name of each Exchange on Which Registered
Common Stock, No Par Value
NASDAQ Global Select Market
Securities registered pursuant to Section 12(g) of the Act:
None
Indicate by check mark whether the registrant is a well-known seasoned issuer, as defined in Rule 405 of the Securities
Act. YES ‘ NO È
Indicate by check mark if the registrant is not required to file reports pursuant to Section 13 or Section 15(d) of the
Act. YES ‘ NO È
Indicate by check mark whether the Registrant (1) has filed all reports required to be filed by Section 13 or 15(d) of the Securities
Exchange Act of 1934 during the preceding 12 months (or for such shorter period that the Registrant was required to file such
reports), and (2) has been subject to such filing requirements for the past 90 days. YES È NO ‘.
Indicate by check mark if disclosure of delinquent filers pursuant to Item 405 of Regulation S-K is not contained herein, and will
not be contained, to the best of Registrant’s knowledge, in definitive proxy or information statements incorporated by reference in
Part III of this Form 10-K or any amendment to this Form 10-K. È
Indicate by check mark whether the registrant is a large accelerated filer, an accelerated filer, or a non-accelerated filer. See
definition of “accelerated filer and large accelerated filer” in Rule 12b-2 of the Exchange Act. (Check one):
‘ Large accelerated filer È Accelerated filer ‘ Non-accelerated filer
Indicate by check mark whether the registrant is a shell company (as defined in Rule 12b-2 of the Act). YES ‘ NO È
The aggregate market value of the common stock of the Registrant (“Common Stock”) held by non-affiliates as of the last business
day of the second fiscal quarter, July 4, 2006, was $480,175,195, calculated based on the closing price of our common stock as
reported by the NASDAQ Global Select Market.
As of February 15, 2007, 26,061,366 shares of the common stock of the Registrant were outstanding.
DOCUMENTS INCORPORATED BY REFERENCE
Certain portions of the following documents are incorporated by reference into Part III of this Form 10-K: The Registrant’s Proxy
Statement for the Annual Meeting of Shareholders.
INDEX
PART I
BUSINESS . . . . . . . . . . . . . . . . . . . . . . . . . . . . . . . . . . . . . . . . . . . . . . . . . . . . . . . . . . . . . . . . . .
RISK FACTORS . . . . . . . . . . . . . . . . . . . . . . . . . . . . . . . . . . . . . . . . . . . . . . . . . . . . . . . . . . . . .
UNRESOLVED STAFF COMMENTS . . . . . . . . . . . . . . . . . . . . . . . . . . . . . . . . . . . . . . . . . . . .
PROPERTIES . . . . . . . . . . . . . . . . . . . . . . . . . . . . . . . . . . . . . . . . . . . . . . . . . . . . . . . . . . . . . . . .
LEGAL PROCEEDINGS . . . . . . . . . . . . . . . . . . . . . . . . . . . . . . . . . . . . . . . . . . . . . . . . . . . . . . .
SUBMISSION OF MATTERS TO A VOTE OF SECURITY HOLDERS . . . . . . . . . . . . . . . .
PART II
ITEM 5.
MARKET FOR REGISTRANT’S COMMON EQUITY RELATED SHAREHOLDER
MATTERS AND ISSUER PURCHASE OF EQUITY . . . . . . . . . . . . . . . . . . . . . . . . . . . . .
ITEM 6.
SELECTED CONSOLIDATED FINANCIAL DATA . . . . . . . . . . . . . . . . . . . . . . . . . . . . . . . .
ITEM 7.
MANAGEMENT’S DISCUSSION AND ANALYSIS OF FINANCIAL CONDITION AND
RESULTS OF OPERATIONS . . . . . . . . . . . . . . . . . . . . . . . . . . . . . . . . . . . . . . . . . . . . . . . .
ITEM 7A. QUANTITATIVE AND QUALITATIVE DISCLOSURES ABOUT MARKET RISK . . . . . .
ITEM 8.
FINANCIAL STATEMENTS AND SUPPLEMENTARY DATA . . . . . . . . . . . . . . . . . . . . . .
ITEM 9.
CHANGES IN AND DISAGREEMENTS WITH ACCOUNTANTS ON ACCOUNTING
AND FINANCIAL DISCLOSURE . . . . . . . . . . . . . . . . . . . . . . . . . . . . . . . . . . . . . . . . . . . .
ITEM 9A. CONTROLS AND PROCEDURES . . . . . . . . . . . . . . . . . . . . . . . . . . . . . . . . . . . . . . . . . . . . . .
ITEM 9B. OTHER INFORMATION . . . . . . . . . . . . . . . . . . . . . . . . . . . . . . . . . . . . . . . . . . . . . . . . . . . . . .
PART III
ITEM 10. DIRECTORS, EXECUTIVE OFFICERS AND CORPORATE GOVERNANCE . . . . . . . . . .
ITEM 11. EXECUTIVE COMPENSATION . . . . . . . . . . . . . . . . . . . . . . . . . . . . . . . . . . . . . . . . . . . . . . . .
ITEM 12. SECURITY OWNERSHIP OF CERTAIN BENEFICIAL OWNERS AND MANAGEMENT
AND RELATED STOCKHOLDER MATTERS . . . . . . . . . . . . . . . . . . . . . . . . . . . . . . . . . .
ITEM 13. CERTAIN RELATIONSHIPS AND RELATED TRANSACTIONS AND DIRECTOR
INDEPENDENCE . . . . . . . . . . . . . . . . . . . . . . . . . . . . . . . . . . . . . . . . . . . . . . . . . . . . . . . . . . . .
ITEM 14. PRINCIPAL ACCOUNTING FEES AND SERVICES . . . . . . . . . . . . . . . . . . . . . . . . . . . . . . .
PART IV
ITEM 15. EXHIBITS, FINANCIAL STATEMENT SCHEDULES . . . . . . . . . . . . . . . . . . . . . . . . . . . . . .
SIGNATURES . . . . . . . . . . . . . . . . . . . . . . . . . . . . . . . . . . . . . . . . . . . . . . . . . . . . . . . . . . . . . . . . . . . . . . . . .
INDEX TO CONSOLIDATED FINANCIAL STATEMENTS . . . . . . . . . . . . . . . . . . . . . . . . . . . . . . . . . . . .
ITEM 1.
ITEM 1A.
ITEM 1B.
ITEM 2.
ITEM 3.
ITEM 4.
2
11
19
19
20
21
22
24
25
36
37
37
37
39
40
40
40
40
40
41
44
45
BJ’S RESTAURANTS, INC.
PART I
Unless the context otherwise requires, when we use the words “BJ’s,” “the Company” “we,” “us” or “our” in
this Form 10-K, we are referring to BJ’s Restaurants, Inc., a California corporation, and its subsidiaries, unless
it is clear from the context or expressly stated that these references are only to BJ’s Restaurants, Inc.
Cautionary Factors That May Affect Future Results
(Cautionary Statements Under the Private Securities Litigation Reform Act of 1995)
This Form 10-K contains forward-looking statements and information that are based on the beliefs of our
management as well as assumptions made by and information currently available to us. When we use the words
“believe,” “plan,” “will likely result,” “expect,” “intend,” “will continue,” “is anticipated,” “estimate,” “project,”
“may,” “could,” “would,” “should,” “believe,” and “plan” and similar expressions in this Form 10-K, as they
relate to us or our management, we are intending to identify forward-looking statements. These statements reflect
our current views with respect to future events and are subject to certain risks, uncertainties and assumptions.
Should one or more of these risks or uncertainties materialize, or should underlying assumptions prove incorrect,
our actual results may vary materially from forward looking statements described in this document. These
forward-looking statements include, among others, statements concerning:
•
our business, its advantages and our strategy for continuing to pursue and grow our business;
•
anticipated growth plans and future restaurant development;
•
anticipated dates on which we will commence or complete development of new restaurants;
•
growth of the casual dining restaurant industry;
•
expectations as to our future revenue, margins, expenses and capital requirements; and
•
other statements of expectations, beliefs, future plans and strategies, anticipated developments and
other matters that are not historical facts.
These forward-looking statements are subject to risks and uncertainties, including financial, regulatory, consumer
behavior, demographic, industry growth and trend projections, that could cause actual events or results to differ
materially from those expressed or implied by the statements. The most important factors that could prevent us
from achieving our stated goals include, but are not limited to:
•
If we do not successfully expand our restaurant operations and maintain our historical restaurant level
economics, our growth rate and results of operations would be adversely affected.
•
Our ability to open new restaurants on schedule in accordance with our projected growth rate may be
adversely affected by delays or problems associated with securing suitable restaurant locations and
leases and by other factors, some of which are beyond our control and the timing of which is difficult
to forecast accurately.
•
Our future operating results may fluctuate significantly due to our limited number of existing
restaurants and the expenses required to open new restaurants, and the timing of new restaurant
openings.
•
Our expansion into new markets may present increased risks due to our unfamiliarity with the markets
and the unfamiliarity of consumers with our concept in these markets.
1
•
Labor shortages, both for hourly and restaurant management employees, or increases in labor costs
could slow our growth or adversely affect our business.
•
Our expansion into certain new markets may impact the leveragability of our handcrafted beer brewing
activities, based on certain regulatory and supply chain constraints in these markets.
These cautionary statements are to be used as a reference in connection with any forward-looking statements.
The factors, risks and uncertainties identified in these cautionary statements are in addition to those contained in
any other cautionary statements, written or oral, which may be made or otherwise addressed in connection with a
forward-looking statement or contained in any of our subsequent filings with the Securities and Exchange
Commission. Because of these factors, risks and uncertainties, we caution against placing undue reliance on
forward-looking statements. Although we believe that the assumptions underlying forward-looking statements
are reasonable, any of the assumptions could be incorrect, and there can be no assurance that forward-looking
statements will prove to be accurate. Forward-looking statements speak only as of the date on which they are
made. We do not undertake any obligation to modify or revise any forward-looking statement to take into
account or otherwise reflect subsequent events or circumstances arising after the date that the forward-looking
statement was made. For further information regarding the risks and uncertainties that may affect our future
results, please review the information set forth below under “ITEM 1A. RISK FACTORS.”
ASSUMPTIONS USED IN THIS REPORT
Throughout this report, our fiscal years ended January 2, 2007, January 3, 2006, January 2, 2005, December 28,
2003 and December 29, 2002 are referred to as fiscal years 2006, 2005, 2004, 2003 and 2002, respectively. Our
fiscal year consists of 52 or 53 weeks. In fiscal 2005, we changed our year end to the Tuesday closest to
December 31, from the Sunday closest to December 31. As such, fiscal 2005 included 52 weeks and two days.
Fiscal 2004 included 53 weeks. All other years were 52 weeks. All prior quarters consisted of 13 weeks except
for the third quarter of 2005, which consisted of 13 weeks and two days and the fourth quarter of 2004 which
consisted of 14 weeks.
ITEM 1. BUSINESS
GENERAL
BJ’s Restaurants, Inc. (the “Company” or “BJ’s”) owned and operated 55 restaurants at the end of fiscal 2006,
located in California, Oregon, Colorado, Arizona, Texas and Nevada. A licensee also operates one restaurant in
Lahaina, Maui. Each of our restaurants is operated either as a BJ’s Restaurant & Brewery ® which includes a
brewery within the restaurant, a BJ’s Restaurant & Brewhouse ® which receives the beer it sells from one of our
breweries or an approved third party craft brewer of our proprietary recipe beers (“contract brewer”), or a BJ’s
Pizza & Grill ® which is a smaller format, full service restaurant. Our menu features our BJ’s ® award-winning,
signature deep-dish pizza, our own hand-crafted beers as well as a wide selection of appetizers, entrees, pastas,
sandwiches, specialty salads and desserts including our unique Pizookie ® dessert. Our 12 BJ’s Restaurant &
Brewery restaurants feature in-house brewing facilities where BJ’s proprietary hand-crafted beers are produced
and sold.
The first BJ’s restaurant was opened in 1978 in Orange County, California and centered on bringing the unique
flavor of deep dish pizza to California. In 1991 our current Co-Chairmen assumed the operations of the
restaurants and in 1995 purchased the restaurants and concept from the founders. Our initial public offering of
common stock occurred in 1996. Over the years we expanded the BJ’s concept from its beginnings as a small
pizzeria to a full service, high energy casual dining restaurant with over 100 menu items, including specialty
salads, soups, pastas, sandwiches, entrees and desserts. In 1996 we introduced our own handcrafted beers through
our first BJ’s Restaurant & Brewery in Brea, California. Since that time we have opened additional BJ’s
Restaurants & Breweries where our handcrafted beers are manufactured for sale in many of our restaurants. The
differentiated, high-quality handcrafted beers have added a unique dimension to the BJ’s concept which further
2
distinguishes BJ’s from many other restaurant concepts. Over the years, our renowned beers have earned 19
medals at the Great American Beer Festival, including Gold, Silver and Bronze medals in 2006.
Our internet address is http://www.bjsrestaurants.com. Electronic copies of our annual report on Form 10-K,
quarterly reports on Form 10-Q and current reports on Form 8-K are available, free of charge, by visiting the
“Investor Relations” section of http://www.bjsrestaurants.com. These reports are posted as soon as reasonably
practicable after they are electronically filed with the Securities and Exchange Commission (SEC). We caution
you that the information on our website is not part of this or any other report we file with, or furnish to, the SEC.
RESTAURANT CONCEPT AND MENU
Our primary growth objective is to gradually expand BJ’s unique high energy, premium casual dining concept
nationwide by providing a genuine commitment to passionately connect with every guest, on every visit, through
flawless and relentless execution of every detail during every shift. We believe by providing this commitment to
our guests we should have the best opportunity to generate significant repeat business and generate our expected
return on our investments in new restaurants. To achieve these objectives we plan to increase our development of
the BJ’s Restaurant & Brewery and the BJ’s Restaurant & Brewhouse restaurants in new and existing markets in
a carefully controlled manner.
Our core product is our deep-dish differentiated Chicago-style pizza, which has been highly acclaimed since it
was originally developed in 1978. Approximately 16% of restaurant sales consist of deep-dish pizza. This unique
version of Chicago-style pizza is unusually light, with a crispy, flavorful crust, which we believe has a broader
appeal than other versions of deep-dish pizza. The pizza is topped with high-quality meats, fresh vegetables and a
blend of five cheeses, including mozzarella cheese. In the past, BJ’s pizza has been awarded “best pizza” honors
by restaurant critics and public opinion polls in Orange County, California, where the BJ’s concept originated.
In addition to our pizza, we have a broad menu with approximately 100 items featuring specialty salads, soups,
pastas, sandwiches, entrees and desserts. Examples of our other menu offerings include Santa Fe Spring Rolls,
BBQ Chicken Chopped Salad, Blackened New York Steak, Cajun Pasta, Halibut Fish Tacos and our famous BJ’s
Pizookie ® dessert. All of our menu items are prepared to order using high quality ingredients. This broad menu
is an important factor in our differentiation from the other casual dining competitors. Our entrees generally range
in price from $8.50 to $19.95 and our average guest check in 2006 was in the $10.50 to $11.50 range. This
extensive menu and moderate pricing allows BJ’s to appeal to a variety of guests and dining occasions, including
everyday lunch and dinner, special occasions, and late night business. We believe these unique attributes have
been a significant factor in our comparable restaurant sales increases of 5.8%, 4.6% and 3.8% for the fiscal years
ended 2006, 2005, and 2004, respectively.
Our large, flexible kitchens allow us to adapt to changing consumer tastes and trends. Generally we review our
menu appeal, pricing and menu mix twice a year and typically replace lower selling menu items with new menu
items. All new menu items are first evaluated by our internal menu development group and then tested in
selected restaurants before any roll-out to all of our restaurants.
All of our restaurants feature our award winning hand-crafted beers, which we believe not only differentiate us
from other restaurant concepts, but also makes a statement towards our approach to provide quality and
uniqueness to our guests in everything we do. Generally, we offer 6 standard beers along with a rotating selection
of seasonal handcrafted specialty beers. The majority of our beers are produced at breweries currently located in
12 of our restaurants and then distributed to all of our locations. We also have contract brewing arrangements
with qualified third-party craft brewers in which we utilize their excess capacity to produce our hand-crafted
beers under our proprietary recipes. During 2006, our breweries produced approximately 27,000 barrels of beer,
and contracted brewers produced approximately 5,300 barrels of beer.
3
RESTAURANT OPERATIONS
We believe our larger format brewery and brewhouse restaurants, on average, generate relatively high guest
counts compared to most other casual dining concepts. In order to effectively and efficiently serve our guests we
carefully select, train and supervise our employees. The typical management team for a BJ’s Restaurant &
Brewery and BJ’s Restaurant & Brewhouse consists of a general manager, a kitchen or executive kitchen
manager and four to five other managers depending on the sales volume for each restaurant. Additionally, each
restaurant typically has approximately 150 hourly employees, many of whom work part-time. The general
manager is responsible for the day to day operations of their restaurant, including hiring, training, and the
development of personnel, as well as operating results. The kitchen or executive kitchen manager is responsible
for product quality, purchasing, inventory, food cost and kitchen labor costs. The general manager of each
restaurant reports to a regional or area director, who reports to a regional vice president, who in turn reports to
our Senior Vice President of Restaurant Operations. We currently have eight regional or area directors and three
regional vice presidents. In addition we have a Vice President of Kitchen Operations and six culinary training
managers who help educate, coach and develop the kitchen personnel and oversee the food execution, which is
the essence of the BJ’s dining experience.
Excluding our BJ’s Pizza and Grill restaurants our typical restaurant hours of operations are generally from 11:00
a.m. to 12:00 a.m. Sunday through Thursday and 11:00 a.m. to 1:00 a.m. Friday and Saturday. Our restaurants
are typically open every day of the year except for Thanksgiving and Christmas.
Our policy is to staff our restaurants with qualified, trained and enthusiastic employees, who desire to be an
integral part of BJ’s fun, casual atmosphere. Prior experience in the restaurant industry is only one of the
qualities management looks for in our restaurant employees. Enthusiasm, motivation and the ability to interact
well with our customers and correctly execute our concept are the most important qualities for BJ’s management
and staff.
In order to maintain our high standards, all new restaurant management and hourly staff undergo formal training
from certified trainers at each restaurant. These certified trainers oversee the execution by position for each new
employee and are also utilized in new restaurant openings. Our hourly staff goes through a series of in-depth
interactive training for their positions and our management team goes through a comprehensive 10-week
management training program dedicated to all aspects of the business including food, hospitality and brewing.
Our management training program is closely monitored by our regional trainers and our Career Development
Department.
Our future growth and success is highly dependent upon our ability to attract, develop and retain qualified
employees to correctly operate our restaurants. We attempt to accomplish this by providing our employees
opportunities for increased responsibilities and advancement as well as performance based incentives based on
numerous financial and service metrics. We also support our employees by offering competitive wages,
competitive benefits, including a 401(k) plan with a company match, medical insurance and dining discounts.
Additionally, beginning in 2007 all of our general managers, executive kitchen managers, culinary training
managers and our area and regional directors are eligible for the Gold Standard Stock Ownership Program under
our 2005 Equity Incentive Plan. This program is a long term wealth building program based on restricted stock
units of the Company that is dependent on the participant’s extended service with us in their respective positions
and their achievement of certain agreed upon performance objectives during that service period (generally 5
years).
BREWERY OPERATIONS
Our brewery operations originated in 1996 with the opening of the first large format BJ’s Restaurant & Brewery
location in Brea, California. Over the years we have gradually increased the number of brewery locations as well
as enlisted qualified third party craft brewers to produce our proprietary beer for our growing restaurant needs for
4
high quality handcrafted beer. Today, our proprietary beer represents approximately 11% of revenues for us and
is an essential attribute of the BJ’s experience that further distinguishes BJ’s from many other restaurant
concepts. In 2006, our breweries produced approximately 27,000 barrels of beer and contracted craft brewers
produced approximately 5,300 barrels of beer. Our breweries are typically staffed with a chief brewer and an
assistant brewer, which report to a regional brewmaster. Production planning and quality control are monitored
by our corporate brewery department. Additionally, our breweries periodically send out samples of each batch of
BJ’s beer to a third party independent laboratory for monitoring and quality control.
In the fall of 2006, we constructed an additional brewery as part of our Reno, Nevada restaurant with estimated
capacity to produce 15,000 barrels each year. This new brewery, which has three times the productive capacity of
many of our existing breweries, should help us meet our beer demands for 2007 based on our current expansion
plans. Additionally, we believe that the economies of scale that can be achieved from this larger brewery are
significant and therefore during 2007 we intend to rebalance all of our brewery production with a goal to reduce
the delivered cost of beer to our restaurants. As part of this rebalancing effort, we may de-commission up to four
of our smaller, less efficient breweries and shift their brewery production to our Reno brewery location. The
de-commissioning of breweries may result in the disposal of brewery related assets.
As we continue to grow our restaurants we need to carefully manage our brewing capacity. Currently, we believe
the combination of our new Reno brewery, in addition to our other operating breweries, plus increased contract
brewing will provide us with the beer production capacity necessary to meet our restaurant growth for the near
future. However, we will continue to evaluate the benefits associated with brewery ownership versus contract
brewing and consider the variables such as availability of production capacity, brewery quality control
procedures, federal and state laws, consistency of corporate and brand strategy and the costs associated with
contract brewing versus the costs associated with brewery ownership. We may also seek to enter into strategic
brewing and distribution arrangements with other brewing entities.
SITE SELECTION AND EXPANSION OBJECTIVES
Our larger format, approximately 8,500 square-feet, BJ’s Restaurant & Brewhouse is expected to represent the
majority of our growth in the near term. We may also construct new BJ’s Restaurant & Breweries as necessary in
order to supply our restaurants with our hand-crafted beers. Over the next several years we expect to continue to
expand in both our existing markets and new markets. In 2007, we anticipate to open as many as 13 new BJ’s
Restaurant & Brewhouse locations. This approach allows us to better leverage costs associated with regional
supervision and enables us to increase our brand awareness and purchasing efficiencies. Based on information
currently available, we expect to open as many as two, four, three, and four new restaurants during the first
through fourth quarters of fiscal 2007, respectively. However, it is difficult for us to precisely predict the timing
of our new restaurant openings due to many factors that are outside of our control. As of February 15, 2007, we
have 10 signed letters of intent already in hand for potential 2008 openings.
We believe the locations of our restaurants are critical to our long-term success and, accordingly, we devote
significant time and resources to analyzing each prospective site. Since BJ’s has proven that it can be successful
in a variety of locations (urban or suburban shopping malls, retail strip centers, and entertainment centers—either
freestanding or in-line) and in a variety of income demographics, we can be highly selective and flexible in
choosing suitable locations. In general, we currently prefer to open our restaurants at high profile sites in areas
with dense populations.
We typically lease our locations for primary periods of 15 to 20 years. Our restaurants can either be freestanding
or in-line and therefore we may utilize both ground leases and built-to-suit leases. Our rent structures vary from
lease to lease, but generally provide for the payment of both minimum base rent and contingent (percentage) rent
based on restaurant sales. We are also generally responsible for our proportionate share of common area
maintenance (“CAM”), insurance, property tax and other occupancy-related expenses under our leases. We
expend cash for leasehold improvements and furnishings, fixtures and equipment (“FF&E”) to build out our
5
leased premises. We may also expend cash for structural additions that we make to leased premises. At times we
may have some of our leasehold improvement costs reimbursed to us by our landlords as construction
contributions pursuant to agreed-upon terms in our leases. If obtained, landlord construction contributions
usually take the form of up-front cash, full or partial credits against minimum or percentage rents otherwise
payable by us, or a combination thereof. However, there can be no assurance that such contributions will be
available for every potential location that we seek to develop into a new restaurant. Generally, the landlord will
charge us additional rent for any construction contributions provided. We may also purchase properties if they
become available.
NEW UNIT ECONOMICS
On average, we target a 1-to-1 sales-to-fully capitalized investment ratio and a 25% fully capitalized return on
investment or 30% return on our capital investment once our restaurants reach their mature level of operations.
Maturation periods vary from restaurant to restaurant, but generally range from two to four years. We target our
new restaurants to achieve sales of approximately $600 per productive square foot, or approximately $5.0 million
based on our prototype BJ’s Restaurant & Brewhouse of 8,500 square feet. However, these targets may vary
based on the capital investment requirements for the restaurant and the markets selected for development. In
2006, our restaurants that were open for the entire year achieved sales greater than our targeted $600 per
productive square foot target. Our investment costs for new restaurants vary significantly depending on
geography and type of restaurant (Brewery compared to Brewhouse). In general, our cash expenditure for
leasehold improvements and furniture, fixtures and equipment, excluding any improvement allowance we may
receive from the landlord, average $450 per square foot. The return-on-investment performance targets for our
restaurant operations do not consider field supervision and corporate support expenses; exclude non-cash items
such as depreciation expense; exclude income taxes; and do not represent a targeted return on an investment in
our common stock. Additionally, actual performance of any location may differ from its originally targeted
performance due to a variety of factors, many of which are outside of our control. There can be no assurance that
any new restaurant opened will have similar operating results to those of established restaurants. See
“Risk Factors” in Part I, Item 1A of this 10-K for a discussion of certain risks relating to the development and
operation of our restaurants.
MARKETING
Our marketing program is primarily focused on community-based promotions and customer referrals. Our
philosophy relating to the BJ’s restaurants has been to “spend our marketing dollars on the plate,” or use funds
that would typically be allocated to marketing to provide enhanced food, service and ambiance to our existing
guests. We believe this is the best way to protect and enhance our guest visit frequency. Our expenditures on
advertising and marketing were less than 1% of sales in both 2006 and 2005.
We focus on the local community and charitable causes, providing food and resources for many worthwhile
events, which has benefited us in our relations with our surrounding communities. Our commitment to
supporting worthwhile causes is exemplified by our “Cookies for Kids” program, which provides a donation to
the Cystic Fibrosis Foundation for each Pizookie sold. Our contributions under the “Cookies for Kids” program
was $250,000 in both fiscal 2006 and 2005. In addition, we donated pre-opening sales proceeds of $120,000
related to the 11 new restaurant openings in 2006 to the Cystic Fibrosis Foundation and approximately $106,000
to local charities.
INFORMATION SYSTEMS
We utilize an integrated information system to manage the flow of information within each restaurant and
between the restaurants and the corporate office. These systems includes a point-of-sale local area network, an
automated kitchen display system and a labor scheduling and productivity analyzer system. Our point of sale
system is used to record sales transactions and send the menu orders to our kitchen. Additionally, the point of
6
sale system is utilized to authorize, batch and transmit credit card transactions, to record employee time clock
information and to produce a variety of management reports. Our kitchen display system, which was
implemented in 2006, is integrated into our point of sales system and automates the timing of the firing of
different food items on the cook line. Additionally, in 2006 we implemented our web-based labor scheduler and
productivity analyzer which automates the labor scheduling for the managers and employees and produces a
number of different productivity reports for our management team. All of our systems provide information to our
corporate office on a daily basis, which enables our senior management to continually monitor our operating
results.
We anticipate continually updating both our restaurant information systems and our corporate office information
systems on annual basis. In 2007 we expect to implement a theoretical food cost system which will allow us to
better measure our product yields and product waste in our kitchens. Additionally, we anticipate implementing a
front desk table management system which will help automate the host position by mathematically calculating
wait times, seat availability and seating flow in our restaurants.
SUPPLY CHAIN MANAGEMENT
Our supply chain management department procures all of our food ingredients, products and supplies for our
restaurants and brewery operations. We seek to obtain the highest quality ingredients, products and supplies from
reliable sources at competitive prices. We continually research and evaluate various food ingredients, products
and supplies for consistency and compare them to our detailed specifications. In order to provide the high quality
ingredients and products, and to maximize operating efficiencies between purchase and usage, each restaurant’s
kitchen manager determines its daily usage requirements for food ingredients, products and supplies and places
all orders from approved vendors. The kitchen managers also inspect all deliveries daily to ensure that the items
received meet our quality specifications and negotiated prices. We have competitively priced, high quality
alternative manufacturers, vendors, growers and distributors available should the need arise.
We negotiate short-term and long-term contracts depending on demand for the commodities used in the
preparation of our products. These contracts generally average in duration from two to twelve months. The
majority of our most important items are contracted annually to stabilize prices and ensure availability. In 2006
we entered into a new three-year distribution agreement with a cooperative of multiple food distributors located
throughout the United States. We have a non-exclusive contract with this cooperative on terms and conditions
that we believe are consistent with those made available to similarly situated restaurant companies. Additionally,
in 2006 we entered into a separate national contract with the largest foodservice distributor of fresh produce in
the United States to distribute all of our produce and our beer, where legally permitted.
Jacmar Foodservice Distribution, a related party, is a member of our primary foodservice distributor cooperative
and is our primary distributor of our food and operating supplies for our California restaurants. See “Related
Party Transactions.”
COMPETITION
The restaurant industry is highly competitive. A great number of restaurants and other food and beverage service
operations compete both directly and indirectly with us in many aspects, including food quality and service, the
price-value relationship, beer quality and selection, atmosphere, suitable sites for new restaurants and qualified
personnel to operate our restaurants, among other factors. Many competitors with similar concepts to that of ours
have been in business longer than we have, have greater consumer awareness and often have substantially greater
capital and human resources.
Because the restaurant industry can be significantly affected by changes in consumer tastes, national, regional or
local economic conditions, demographic trends, traffic patterns, weather and the type and number of competing
restaurants, any changes in these factors could adversely affect us. In addition, factors such as inflation and
7
increased food, liquor, labor and other employee compensation costs could adversely affect us. We believe,
however, that our ability to offer high-quality food at moderate prices with superior service in a distinctive dining
environment provides us with substantial competitive advantages.
RELATED PARTY TRANSACTIONS
As of January 2, 2007, we believe that Jacmar Companies and their affiliates (collectively referred to herein as
“Jacmar”) owned approximately 16.9% of our outstanding common stock. Jacmar, through its specialty
wholesale food distributorship, is currently the Company’s largest supplier of food, beverage and paper products.
In 2004, Jacmar also acquired ownership of the Shakey’s pizza parlor chain. In July 2006, after an extensive
competitive bidding process, the Company entered into a three-year agreement with a national foodservice
distribution system whose shareholders are prominent regional foodservice distributors, of which Jacmar is one.
Jacmar will continue to service the Company’s restaurants in California, while other system distributors will
service our restaurants in all other states. We believe that Jacmar sells products to us at prices comparable to
those offered by unrelated third parties. Jacmar supplied us with $27.1 million, $24.8 million and $19.3 million
of food, beverage and paper products for fiscal 2006, 2005 and 2004, respectively, which represent 44.2%, 54.6%
and 57.1% of our total costs for these products, respectively. We had trade payables due to Jacmar related to
these products of $1.1 million and $2.3 million at January 2, 2007 and January 3, 2006, respectively.
GOVERNMENT REGULATIONS
We are subject to various federal, state and local laws, along with rules and regulations that affect our business.
Each of our restaurants are subject to licensing and regulation by a number of governmental authorities, which
may include alcoholic beverage control, building, land use, health, safety and fire agencies in the state or
municipality in which the restaurant is located. Difficulties obtaining or maintaining the required licenses or
approvals could delay or prevent the development of a new restaurant in a particular area or could adversely
affect the operation of an existing restaurant. We believe, however, that we are in compliance in all material
respects with all relevant laws, rules, and regulations. Furthermore, we have never experienced abnormal
difficulties or delays in obtaining the licenses or approvals required to open a new restaurant or to continue the
operation of our existing restaurants. Additionally, we are not aware of any environmental regulations that have
had or that we believe will have a materially adverse effect upon our operations.
Alcoholic beverage control regulations require each of our restaurants to apply to a federal and state authority
and, in certain locations, municipal authorities for a license and permit to sell alcoholic beverages on the
premises. Typically, licenses must be renewed annually and may be revoked or suspended for cause by such
authority at any time. Alcoholic beverage control regulations relate to numerous aspects of the daily operations
of our restaurants, including minimum age of patrons and employees, hours of operation, advertising, wholesale
purchasing, inventory control and handling, and storage and dispensing of alcoholic beverages. We have not
encountered any material problems relating to alcoholic beverage licenses or permits to date. The failure to
receive or retain, or a delay in obtaining, a liquor license in a particular location could adversely affect our ability
to obtain such a license elsewhere.
We are subject to “dram-shop” statutes in California and other states in which we operate. Those statutes
generally provide a person who has been injured by an intoxicated person the right to recover damages from an
establishment that has wrongfully served alcoholic beverages to such person. We carry liquor liability coverage
as part of our existing comprehensive general liability insurance which we believe is consistent with coverage
carried by other entities in the restaurant industry and will help protect us from possible claims. Even though we
carry liquor liability insurance, a judgment against us under a dram-shop statute in excess of our liability
coverage could have a materially adverse effect on us.
Various federal and state labor laws, along with rules and regulations, govern our relationship with our
employees, including such matters as minimum wage requirements, overtime and working conditions.
8
Significant additional governmental mandates such as an increased minimum wage, an increase in paid leaves of
absence, extensions in health benefits or increased tax reporting and payment requirements for employees who
receive gratuities, could negatively impact our restaurants.
Our restaurants and breweries are subject to “tied house laws” and the “three tier system” of liquor distribution,
both of which were introduced at the federal level after the repeal of Prohibition. These laws prohibit brewers
from holding retail licenses and require separate licensing for manufacturers, distributors and retailers. Over the
last 25 years, “brewpubs” have been legalized at the state level through the loosening of these laws. However,
brewpubs are generally licensed as retailers and do not have the same privileges as a microbrewery, and the
restrictions imposed on brewpubs vary from state to state. These restrictions may prevent us from operating both
brewpubs and restaurants in some states. We believe that we are currently in compliance with the brewpub
regulations in the states where we hold licenses. However, there is some risk that a state’s brewpub regulations or
the interpretation of these regulations will change in a way that might impact our current model of manufacturing
beer and/or supplying beer to our restaurants in that state.
TEAM MEMBERS
At February 15, 2007, we employed 6,438 employees at our 55 restaurants, who we refer to as team members.
Most of these employees were part-time employees. We also employed 108 administrative and field supervisory
personnel at our corporate offices. We believe that we maintain favorable relations with our employees, and
currently no unions or collective bargaining arrangements exist.
INSURANCE
We maintain workers’ compensation, general liability, property insurance and other insurance coverage with
deductibles and limits that we believe are currently appropriate for our operations. However, there is no
assurance that any insurance coverage maintained by us will be adequate or that we will not experience claims in
excess of our coverage limits, or that we can continue to obtain and maintain such insurance at all or that our
premium costs will not rise to an extent that they adversely affect our ability to economically obtain or maintain
such insurance.
TRADEMARKS AND COPYRIGHTS
Our registered trademarks and service marks include, among others, the word mark “BJ’s Chicago Pizzeria”, and
our stylized logo, which includes the words “BJ’s Pizza, Grill, Brewery”. In addition, we have registered the
word marks “BJ’s Restaurant & Brewery,” “BJ’s Restaurant & Brewhouse” and “BJ’s Pizza & Grill,” for our
restaurant services and “BJ’s Tatonka” and “Harvest Hefeweizen” for our proprietary beer and “Pizookie” for our
proprietary dessert. We have registered all of these marks with the United States Patents and Trademark Office.
We believe that the trademarks, service marks and other proprietary rights have significant value and are
important to our brand-building effort and the marketing of our restaurant concepts. However, there are other
restaurants using the name BJ’s throughout the United States. We have in the past, and expect to continue to,
vigorously protect our proprietary rights. We cannot predict; however, whether steps taken by us to protect our
proprietary rights will be adequate to prevent misappropriation of these rights or the use by others of restaurant
features based upon, or otherwise similar to, our concept. It may be difficult for us to prevent others from
copying elements of our concept and any litigation to enforce our rights will likely be costly.
9
EXECUTIVE OFFICERS
The following table sets forth certain information concerning our executive officers and senior management
employees:
Name
Age
Position
Paul A. Motenko . . . . . . . . . . . . . . . . . . . .
Jeremiah J. Hennessy . . . . . . . . . . . . . . . .
Gerald W. Deitchle . . . . . . . . . . . . . . . . . .
Gregory S. Levin . . . . . . . . . . . . . . . . . . . .
R. Dean Gerrie . . . . . . . . . . . . . . . . . . . . .
Gregory S. Lynds . . . . . . . . . . . . . . . . . . .
John D. Allegretto . . . . . . . . . . . . . . . . . . .
Thomas F. Norton . . . . . . . . . . . . . . . . . . .
Alexander M. Puchner . . . . . . . . . . . . . . .
Lon F. Ledwith . . . . . . . . . . . . . . . . . . . . .
52
48
55
39
55
45
43
36
44
49
Co-Chairman of the Board, Vice President and Secretary
Co-Chairman of the Board
President, Chief Executive Officer
Chief Financial Officer
Chief Design Officer
Chief Development Officer
Chief Supply Chain Officer
Chief Human Resource Officer
Senior Vice President of Brewing Operations
Vice President of Operations
PAUL A. MOTENKO (Co-Founder) has been Co-Chairman of the Board since February 2005. Since the
Company’s inception in 1991, Mr. Motenko was the Chief Executive Officer, Co-Chairman of the Board, Vice
President and Secretary. Prior to assuming operations for the Company, Mr. Motenko was a founding partner in
the firm Motenko, Bachtelle & Hennessy from 1980 to 1991. In this capacity, Mr. Motenko provided accounting
and consulting services to several restaurant companies, including BJ’s Chicago Pizzeria. From 1976 to 1980,
Mr. Motenko was employed as an accountant and consultant for several accounting firms, including Kenneth
Leventhal and Company and Peat, Marwick, Main.
JEREMIAH J. HENNESSY (Co-Founder) has been Co-Chairman of the Board since February 2005. Since the
Company’s inception in 1991, Mr. Hennessey was the President, Chief Operating Officer and a Director. Prior to
assuming operations for the Company, Mr. Hennessy was a partner in the firm Motenko, Bachtelle & Hennessy
from 1988 to 1991 where he was extensively involved with food service and restaurant clientele. Prior to that,
Mr. Hennessy served as a controller for a large Southern California construction company. Mr. Hennessy has
also worked for various restaurant concepts, including Marie Callender’s and Knott’s Berry Farm.
GERALD (“JERRY”) W. DEITCHLE has been President and Chief Executive Officer of the Company since
February 2005 and a member of the Company’s Board of Directors since November 2004. From April 2004 to
January 2005, Mr. Deitchle served as President, Chief Operating Officer and a director of Fired Up, Inc., a
privately held company that owns, operates and franchises the Johnny Carino’s Italian restaurant concept. From
1995 to 2004, he was a member of the executive management team at The Cheesecake Factory Incorporated, a
publicly held operator of upscale casual dining restaurants with his last position as corporate President. From
1984 to 1995, he was employed by the parent company of Long John Silver’s restaurants, with his last position as
Executive Vice President.
GREGORY S. LEVIN has been the Chief Financial Officer of the Company since September 2005. From
February 2004 to August 2005, Mr. Levin served as Chief Financial Officer and Secretary of SB Restaurant
Company, a privately held company that operates the Elephant Bar Restaurants. From 1996 to 2004, Mr. Levin
was employed by publicly-held California Pizza Kitchen, Inc., operator and licensor of casual dining restaurants,
with his last position as Vice President, Chief Financial Officer and Secretary. Earlier in his career, he served as
an audit manager with Ernst & Young LLP.
R. DEAN GERRIE has been the Chief Design Officer of the Company since 2002 and as Senior Vice President
of Design and Marketing since January 1997. From 1989 to 1997 Mr. Gerrie served as principal of Dean Gerrie
Design, a corporate identity and marketing consultancy. Prior to that from 1980 to 1989, Mr. Gerrie served as
President/Creative Director with Guzman Gerrie Advertising. Mr. Gerrie has maintained a leadership role in the
10
Southern California design community as founder of the Orange County Chapter of the American Institute of
Graphic Arts and has taught design and marketing as an associate professor at University of California, Irvine
Extension and at the Southern California Institute of the Arts.
GREGORY S. LYNDS has been the Chief Development Officer since July 2003. Prior to joining the Company,
Mr. Lynds served as the Director of Real Estate of Darden Restaurants, Inc., the largest casual dining company in
America. Prior to joining Darden, Mr. Lynds served as Vice President of Real Estate and Development for
Wilshire Restaurant Group (Marie Callender’s and East Side Mario’s) and was a Partner responsible for
expanding the Mimi’s Café brand.
JOHN D. ALLEGRETTO has been the Chief Supply Chain Officer since July 2005. From March 2003 to June
2005, Mr. Allegretto served as the Vice President of Supply Chain Management for Pick Up Stix Restaurants and
Cal-International, Foods, Inc. Prior to that, Mr. Allegretto was the Director for The Walt Disney Company’s
Strategic Sourcing group from October 1997 to February 2003.
THOMAS F. NORTON has been the Chief Human Resource Officer of the Company since September 2006.
Mr. Norton joined the Company from American Golf Corporation. During the past three years, Mr. Norton
served as American Golf’s Senior Vice-President of Human Resources. American Golf Corporation is one of the
largest course management firms in the world with about 170 public, private, and resort courses under
management, and with over 10,000 employees in 28 states. In 1992, Mr. Norton started his business career at
American Golf in operations and later transitioned to the company’s human resources organization, serving as
director of management recruiting/training and as Vice President of Human Resources.
LON F. LEDWITH has been the Senior Vice President of Restaurant Operations since April 2006 and as Vice
President of Restaurant Operations since February 2004. From July 1981 to November 2003, Mr. Ledwith was
employed by Brinker International, Inc., owner, operator and franchisor of various restaurant brands (Chili’s,
Macaroni Grill, Maggiano’s, Corner Bakery and On The Border), with his last position as a Regional Vice
President of Chili’s Grill & Bar.
ALEXANDER M. PUCHNER has been the Senior Vice President of Brewing Operations for the Company since
1996. From 1993 to 1995, Mr. Puchner was a founder and brewmaster for Laguna Beach Brewing Co.,
Huntington Beach Beer Co., Newport Beach Brewing Co. and Westwood Brewing Co. From 1988 to 1993,
Mr. Puchner served as Product Manager for Aviva Sports/Mattel Inc. and Marketing Research Manager for
Mattel Inc. Mr. Puchner has been a nationally certified beer judge since 1990.
ITEM 1A.
RISK FACTORS
If we do not successfully expand our restaurant operations, our growth rate and results of operations would be
adversely affected.
A critical factor in our future success is our ability to expand our restaurant operations successfully, which will
depend in large part on our ability to open new restaurants on schedule and in a profitable manner. We anticipate
that our new restaurants will generally take three to four months or longer to reach planned operating levels due
to inefficiencies typically associated with new restaurants, including lack of market awareness, the need to hire
and train sufficient management and restaurant personnel and other factors. We cannot assure you that any
restaurant we open will obtain operating results similar to those of our existing restaurants. If we are unable to
open and operate new restaurants successfully, our growth rate and our results of operations would be adversely
affected.
11
Our ability to open new restaurants on schedule in accordance with our projected growth rate may be
adversely affected by delays or problems associated with securing suitable restaurant locations and leases and
by other factors, some of which are beyond our control and the timing of which is difficult to forecast
accurately.
In order to achieve our projected rate of new restaurant growth, we must identify suitable restaurant locations and
successfully negotiate and finalize the terms of restaurant leases at a number of these locations. Due in part to the
unique nature of each proposed restaurant location, we cannot predict the timing or ultimate success of our site
selection process or these lease negotiations. Delays encountered in negotiating, or our inability to finalize to our
satisfaction, the terms of a restaurant lease may delay our actual rate of new restaurant growth and cause a
significant variance from our projected growth rate. In addition, our scheduled rate of new restaurant openings
may be adversely affected by other factors, some of which are beyond our control, including the following:
•
the availability and cost of suitable restaurant locations for development;
•
our ability to compete successfully for suitable restaurant locations;
•
the availability of adequate financing;
•
the timing of delivery of leased premises from our landlords so we can commence our build-out
construction activities;
•
construction and development costs;
•
any labor shortages or disputes experienced by our landlords or outside contractors;
•
any unforeseen engineering or environmental problems with the leased premises;
•
our ability to hire, train and retain additional management and restaurant personnel;
•
our ability to secure governmental approvals and permits, including liquor licenses;
•
successfully promoting our new restaurants and competing in the markets in which our new restaurants
are located;
•
our continued development and implementation of management information systems;
•
weather conditions or natural disasters; and
•
general economic conditions.
Our growth may strain our infrastructure and resources, which could slow our development of new
restaurants and adversely affect our ability to manage our existing restaurants.
We plan to accelerate the pace of new restaurant openings by opening as many as 13 new restaurants in 2007.
This expansion and our future growth will increase demands on our management team, restaurant management
systems and resources, financial controls and information systems. These increased demands may adversely
affect our ability to open new restaurants and to manage our existing restaurants. If we fail to continue to
improve our infrastructure or to manage other factors necessary for us to meet our expansion objectives, our
growth rate and operating results could be adversely affected.
Our expansion into new markets may present increased risks due to our unfamiliarity with the areas and also
due to consumer unfamiliarity with our concept.
As part of our expansion strategy, we plan to open new restaurants in markets in which we have no prior
operating experience. New markets anticipated during 2007 will be Florida, Ohio and Oklahoma. These new
markets may have different competitive conditions, consumer tastes and discretionary spending patterns than
restaurants in our existing markets, and there also may be little or no market awareness of our brands in these
new markets. Due to these factors, sales at restaurants opening in new markets usually take longer to achieve
12
sales levels that are comparable with our existing restaurants, if at all. In addition, we may incur costs related to
the opening, operation and promotion of these new restaurants that are greater than those incurred in existing
markets.
You should not rely on past increases in our average restaurant revenues or our comparable restaurant sales
as an indication of future operating results because they may fluctuate significantly.
A number of factors historically have affected, and are likely to continue to affect, our average restaurant
revenues and/or comparable restaurant sales, including, among other factors:
•
our ability to execute our business strategy effectively;
•
our menu pricing strategy;
•
initial sales performance by new restaurants;
•
the timing of new restaurant openings and related expenses;
•
changing consumer tastes or discretionary spending;
•
levels of competition in one or more of our markets; and
•
general economic conditions and consumer confidence.
Additionally, our average restaurant revenues and comparable restaurant sales may not increase at rates achieved
over recent periods. Changes in our average restaurant revenues and comparable restaurant sales could cause the
price of our common stock to fluctuate significantly.
Our future operating results may fluctuate significantly due to our limited number of existing restaurants and
the expenses required to open new restaurants.
As of February 15, 2007, we operated 55 restaurants, 11 of which opened during 2006. The capital resources
required to develop each new restaurant are significant. We estimate that the gross cash outlay to open a new
BJ’s restaurant on leased ground, excluding any tenant allowance in which we may or may not obtain depending
on each new restaurant project, currently ranges from $4.0 million to $5.0 million, inclusive of pre-opening
expenses, which average approximately $450,000 to $475,000 including pre-opening rent. Actual costs may vary
significantly depending upon a variety of factors, including the site, type of restaurant (brewery compared to
brewhouse) and size of the restaurant and conditions in the local real estate and employment markets. The
combination of our relatively small number of existing restaurants, the significant investment associated with
each new restaurant and the average restaurant revenues of our new restaurants may cause our results of
operations to fluctuate significantly. Moreover, poor operating results at any one restaurant or a delay or
cancellation in the planned opening of a restaurant could adversely affect our business, making the investment
risks related to any one location much greater than those associated with many other restaurants.
Our inability to renew existing leases on favorable terms may adversely affect our results of operations.
As of February 15, 2007, 51 of our 55 restaurants are located on leased premises and are subject to varying leasespecific arrangements. For example, some of the leases require base rent, subject to regional cost-of-living
increases, and other leases include base rent with specified periodic increases. Other leases are subject to renewal
at fair market value, which could involve substantial increases. Additionally, many leases require contingent rent
based on a percentage of gross sales. In addition, certain of our leases will expire without an automatic renewal
or option to renew. No assurance can be given that such leases can be renewed or, if renewed, that rents will not
increase substantially.
13
A significant number of our restaurants are concentrated in California, which makes us particularly sensitive
to economic, regulatory, weather and other conditions in that state.
As of February 15, 2007, 35 of our 55 restaurants were located in California. If our restaurants in California are
adversely affected by changes in economic, regulatory, such as changes to California’s minimum wage rates or
mandatory healthcare proposals and other conditions specific to California, our consolidated sales, financial
condition and results of operations may decline.
We are dependent upon consumer trends and upon high visitor rates at the sites where our restaurants are
located, and any adverse change in such consumer trends or visitor rates could adversely affect our business,
revenues and results of operations.
Due to the nature of the restaurant industry, we are dependent upon consumer trends with respect to the public’s
tastes, eating habits, public perception toward alcohol consumption and discretionary spending priorities, all of
which can shift rapidly. We also are dependent upon high visitor rates at the sites surrounding our restaurants,
which are primarily located in high-activity areas such as urban, retail, mixed-use and lifestyle centers, to attract
guests to our restaurants. In general, such consumer trends and visitor rates are significantly affected by many
factors, including national, regional or local economic conditions, changes in area demographics, public
perception and attitudes, increases in regional competition, food, liquor and labor costs, traffic and shopping
patterns, weather, natural disasters, interest rates and the availability and relative cost of gasoline. Our success
will depend, in part, on our ability to anticipate and respond to such changing consumer preferences, tastes,
eating and purchasing habits, as well as other factors affecting the restaurant industry, including new market
entrants and demographic changes. Any adverse change in any of the above factors and our inability to respond
to such changes could cause our restaurant volumes to decline and adversely affect our business, revenues and
results of operations.
Our success depends on our ability to compete effectively in the restaurant industry.
The restaurant industry is highly competitive. We compete on the basis of the taste, quality and price of food
offered, guest service, brand name identification, beer quality and selection, attractiveness of the facilities,
restaurant location, atmosphere and overall dining experience. Our competitors include a large and diverse group
of restaurant chains and individual restaurants that range from independent local operators that have opened
restaurants in various markets to well-capitalized national restaurant companies. In addition, we compete with
other restaurants and with retail establishments for real estate. Many of our competitors are well established in
the upscale casual dining market segment and some of our competitors have substantially greater financial,
marketing and other resources than we do.
New information or attitudes regarding diet and health could result in changes in regulations and consumer
eating habits that could adversely affect our results of operations.
Regulations and consumer eating habits may changes as a result of new information or attitudes regarding diet
and health. Such changes may include regulations that impact the ingredients and nutritional content of the food
and beverages offered by us. For example, the New York City Board of Health has approved restrictions on the
use of trans fats by restaurants. The success of our restaurant operations is dependent, in part, upon our ability to
effectively respond to changes in any consumer health regulations and our ability to adapt our menu offerings to
trends in food consumption. If consumer health regulations or consumer eating habits change significantly, we
may be required to modify or delete certain menu items. To the extent we are unable to respond with appropriate
changes to our menu offerings, it could materially affect customer demand and have an adverse impact on our
results of operations.
14
Negative publicity surrounding our restaurants or the consumption of beef, seafood, poultry/produce, beer or
alcoholic beverages generally could adversely affect the popularity of our restaurants, our revenues and our
results of operations.
The popularity of our restaurants, in general, and our menu offerings, in particular, are key factors to the success
of our business. Incidents that occur at any of our restaurants may result in negative publicity, which could
adversely affect our popularity. In addition, negative publicity resulting from poor food quality, illness, injury or
other health concerns, whether related to one of our restaurants or to the restaurant, industry, beef, seafood,
poultry or produce industries in general (such as negative publicity concerning the accumulation of carcinogens
in seafood, e-coli, Hepatitis A and other food-borne illnesses), or operating problems related to one or more of
our restaurants, could make our brand and menu offerings less appealing to consumers.
Our operations are susceptible to changes in food and supply costs, which could adversely affect our margins.
Our profitability depends, in part, on our ability to anticipate and react to changes in food and supply costs. Our
purchasing staff negotiates prices for all of our ingredients and supplies through either contracts (terms of one
month up to one year) or commodity pricing formulas. Furthermore, various factors beyond our control,
including adverse weather conditions and governmental regulations, could also cause our food and supply costs
to increase. We cannot predict whether we will be able to anticipate and react to changing food and supply costs
by adjusting our purchasing practices. A failure to do so could adversely affect our operating results or cash
flows.
If our distributors or suppliers do not provide food and beverages to us in a timely fashion, particularly our
ingredients for our beer, we may experience short-term supply shortages, increased food and beverage costs
and quality control problems.
We currently depend on regional food distribution service companies to provide food and beverage products to
all of our restaurants. We also rely on contract brewers to provide us with beer in certain markets. If these
regional distributors, or other distributors or suppliers, cease doing business with us, or cannot make a scheduled
delivery to us because of weather or other issues, we could experience short-term supply shortages in some or all
of our restaurants and could be required to purchase food and beverage products at higher prices until we are able
to secure an alternative supply source. If these alternative suppliers do not meet our specifications, the
consistency and quality of our food and beverage offerings, and thus our reputation, guest patronage, revenues
and results of operations, could be adversely affected. In addition, any delay in replacing our suppliers or
distributors on acceptable terms could, in extreme cases, require us to remove temporarily items from the menus
of one or more of our restaurants, which also could adversely affect our business.
Failure to protect our trademarks, service marks, trade secrets or other intellectual property could adversely
affect our business.
Our business prospects depend in part on our ability to develop favorable consumer recognition of our brands,
including the BJ’s Restaurants name in particular. Although BJ’s is a federally registered trademark, there are
other restaurants using the name “BJ’s” throughout the United States and our trademarks, service marks, trade
dress, trade secrets or other intellectual property could be imitated or appropriated in ways that we cannot
prevent. Alternatively, third parties may attempt to cause us to change our trademarks, service marks or trade
dress or not operate in a certain geographic region or regions if our names are deemed confusingly similar to
their prior trademarks, service marks or trade dress. In addition, we rely on trade secrets, proprietary know-how,
concepts and recipes. Our methods of protecting this information may not be adequate. Moreover, we may face
claims of misappropriation or infringement of third parties’ rights that could interfere with our use of this
information. Defending these claims may be costly and, if unsuccessful, may prevent us from continuing to use
this proprietary information in the future and may result in a judgment or monetary damages. We do not maintain
confidentiality and non-competition agreements with all of our employees or suppliers. Moreover, even with
15
respect to the confidentiality and non-competition agreements we have, we cannot assure you that those
agreements will not be breached, that they will provide meaningful protection or that adequate remedies will be
available in the event of an unauthorized use or disclosure of our proprietary information. If competitors
independently develop or otherwise obtain access to our trade secrets, proprietary know-how or recipes, the
appeal of our restaurants could be reduced and our business could be harmed.
Federal, state and local beer, liquor and food service regulations may have a significant adverse impact on our
operations.
We are required to operate in compliance with federal laws and regulations relating to alcoholic beverages
administered by the Alcohol and Tobacco Tax and Trade Bureau of the U.S. Department of Treasury, as well as
the laws and licensing requirements for alcoholic beverages of states and municipalities where our restaurants are
or will be located. In addition, each restaurant must obtain a food service license from local authorities. Failure to
comply with federal, state or local regulations could cause our licenses to be revoked and force us to cease the
brewing or sale of alcoholic beverages, or both, at our restaurants. Additionally, state liquor laws may prevent or
impede the expansion of our restaurants into certain markets. The liquor laws of certain states prevent us from
selling at wholesale the beer brewed at our restaurants. Any difficulties, delays or failures in obtaining such
licenses, permits or approvals could delay or prevent the opening of a restaurant in a particular area or increase
the costs associated therewith. In addition, in certain states, including states where we have existing restaurants
or where we plan to open a restaurant, the number of liquor licenses available is limited, and licenses are traded
on the open market. Liquor, beer and wine sales comprise a significant portion of our revenues; therefore, if we
are unable to maintain our existing licenses, or if we choose to open a restaurant in those states where the number
of licenses available is limited, the cost of a new license could be significant.
Our restaurants and on-site breweries operate pursuant to exceptions to the “tied house laws,” which created the
“three tier system” of liquor distribution. These tied house laws were adopted by all of the states after the repeal
of prohibition and, generally, prohibit brewers from holding retail licenses and prohibit vertical integration in
ownership and control among the three tiers. Brewery restaurants and brewpubs operate under an exception to
these general prohibitions. Over the last 25 years, all of the states have adopted laws and regulations permitting
brewery restaurants and brewpubs; however, the privileges and restrictions for brewpubs and brewery restaurants
vary from state to state. Generally, our brewery restaurants are licensed as retailers with limited privileges to
brew beer on the restaurant premises, and we do not have the same privileges as a microbrewery. Other
restrictions imposed by law may prevent us from operating both brewery restaurants and non-brewery restaurants
in some states. We are at risk that a state’s regulations concerning brewery restaurants or the interpretation of
these regulations may change. Any such change may adversely impact our current model of brewing beer or
supplying beer, or both, to our restaurants in that state.
We may not be able to produce or secure enough of our proprietary beer to meet our restaurant and consumer
demand.
Our signature beer is a key factor in the success of our business. Each year our brewery department forecasts our
annual beer requirements based on our current restaurant requirements and expansion plans and determines our
brewery production. Additionally, in certain states we have chosen to contract our beer using our recipes and
quality assurance with established, high quality craft brewers. If these craft brewers cease doing business with us,
or cannot make a scheduled delivery to us because of manufacturing or other issues, or if we cannot meet our
internal brewing requirements, we could experience short-term supply shortages in some or all of our restaurants
which may result in a loss of revenue. Additionally, if these craft brewers cease doing business with us we could
be required to purchase or brew our own beer at higher prices until we are able to secure an alternative supply
source. If these alternative suppliers do not meet our specifications, the consistency and quality of beer offerings,
and thus our reputation, guest patronage, revenues and results of operations, could be adversely affected.
16
Other government laws and regulations affecting the operation of our restaurants could increase our
operating costs and restrict our growth.
Our development and construction of additional restaurants must comply with applicable zoning, land use and
environmental regulations. More stringent and varied requirements of local government bodies with respect to
zoning, land use and environmental factors could delay construction of new restaurants and add to their cost in
the future. In addition, difficulties or failure in obtaining the required licenses and approvals could delay, or
result in our decision to cancel, the opening of new restaurants.
In addition, various federal and state labor laws govern our relationship with our employees and affect our
operating costs. These laws include minimum wage requirements, overtime pay, unemployment tax rates,
workers’ compensation rates, citizenship requirements and sales taxes. A number of factors could adversely
affect our operating results and thus restrict our growth, including additional government-imposed increases in
minimum wages, overtime pay, paid leaves of absence and mandated health benefits, increased tax reporting and
tax payment requirements for employees who receive gratuities, a reduction in the number of states that allow
tips to be credited toward minimum wage requirements and increased employee litigation, including claims
relating to the Fair Labor Standards Act.
The Americans with Disabilities Act of 1990 prohibits discrimination on the basis of disability in public
accommodations and employment. Although our restaurants are designed to be accessible to the disabled, we
could be required to make modifications to our restaurants to provide service to, or make reasonable
accommodations for, disabled persons. Non-compliance with this law and related laws enacted at the state or
local level could result in the imposition of fines or an award of damages to private litigants.
Limitations in our insurance coverage or rising insurance costs could adversely affect our business or
financial condition in certain circumstances.
We purchase comprehensive insurance coverage, including workers’ compensation, general liability employment
practices, fire and extended coverage and property insurance. However, such insurance is subject to limitations,
including deductibles, exclusions and maximum liabilities covered. Moreover, there are certain types of losses
that may be uninsurable or not economically insurable. Such hazards may include earthquake, hurricane and
flood losses and certain employee practices. If such a loss should occur, we would, to the extent that we are not
covered for such loss by insurance, suffer a loss of the capital invested in, as well as anticipated profits and cash
flow from, such damaged or destroyed properties. Punitive damage awards are generally not covered by
insurance; thus, any awards of punitive damages as to which we may be liable could adversely affect our ability
to continue to conduct our business, to expand our operations or to develop additional restaurants. There is no
assurance that any insurance coverage we maintain will be adequate, that we can continue to obtain and maintain
such insurance at all or that the premium costs will not rise to an extent that they adversely affect us or our ability
to economically obtain or maintain such insurance.
Labor shortages or increases in labor costs could slow our growth or adversely affect our business.
Our success depends in part on our ability to attract, motivate and retain a sufficient number of qualified
employees, including restaurant general managers and kitchen managers, necessary to continue our operations
and keep pace with our growth. If we are unable to recruit and retain a sufficient number of qualified individuals,
our business and our growth could be adversely affected. Competition for qualified employees could require us to
pay higher wages and benefits, which would result in higher labor costs. In addition, we have a substantial
number of hourly employees who are paid the federal or state minimum wage and who rely on tips for a
significant portion of their income. Government-mandated increases in minimum wages or decreases in tip
credits would increase our labor costs. We may be unable to increase our prices in order to pass these increased
labor costs on to our guests, in which case our profitability would be adversely affected.
17
Litigation could have a material adverse effect on our business.
From time to time, we may be the subject of complaints or litigation from guests alleging food-borne illness,
injury or other food quality, health or operational concerns. We are also subject to a variety of other claims
arising in the ordinary course of our business, including personal injury claims, contract claims and claims
alleging violations of federal and state law regarding workplace and employment matters, discrimination and
similar matters. We may also be subject to complaints or allegations from former, existing or prospective
employees from time to time. The restaurant industry has also been subject to a growing number of claims that
the menus and actions of restaurant chains have led to the obesity of certain of their guests. In addition, we are
subject to state “dram shop” laws and regulations, which generally provide that a person injured by an
intoxicated person may seek to recover damages from an establishment that wrongfully served alcoholic
beverages to the intoxicated person. Recent litigation against restaurant chains has resulted in significant
judgments, including punitive damages, under such “dram shop” statutes. While we carry liquor liability
coverage as part of our existing comprehensive general liability insurance, we may still be subject to a judgment
in excess of our insurance coverage, and we may not be able to obtain or continue to maintain such insurance
coverage at reasonable costs, if at all. Regardless of whether any claims against us are valid or whether we are
liable, we may be adversely affected by publicity resulting from such claims. We also are subject to claims and
disputes from landlords under our leases, which could lead to litigation or a threatened or actual lease
termination. Litigation of any nature may be expensive to defend and may divert money and management’s
attention from our operations and adversely affect our financial condition and results of operations.
Our ability to raise capital in the future may be limited, which could adversely affect our business.
Changes in our operating plans, acceleration of our expansion plans, lower than anticipated revenues, increased
expenses or other events, including those described in this Form 10-K, may cause us to seek additional debt or
equity financing on an accelerated basis in the event our cash flow is insufficient. Financing may not be available
on acceptable terms, or at all, and our failure to raise capital when needed could adversely affect our growth and
other plans as well as our financial condition. Additional equity financing, if available, may be dilutive to the
holders of our common stock. Debt financing, if available, may involve significant cash payment obligations,
covenants and financial ratios that restrict our ability to operate and grow our business, and would cause us to
incur additional interest expense and financing costs.
The occurrence or threat of extraordinary events, including terrorist attacks, could cause consumer spending
to decline, which would adversely affect our sales and results of operations.
The occurrence or threat of extraordinary events, including future terrorist attacks and military and governmental
responses and the prospect of future wars, may result in negative changes to economic conditions. When
economic conditions worsen, our guests may reduce their level of discretionary spending. We believe that a
decrease in discretionary spending could impact the frequency with which our guests choose to dine out or the
amount they spend on meals while dining out, thereby adversely affecting our sales and results of operations.
Additionally, a decrease in discretionary spending could adversely affect our ability to price our menu items at
favorable levels and decrease our profitability.
Future changes in financial accounting standards may cause adverse unexpected operating results and affect
our reported results of operations.
A change in accounting standards can have a significant effect on our reported results and may affect our
reporting of transactions before the change is effective. New pronouncements and varying interpretations of
pronouncements have occurred and may occur in the future. Changes to existing accounting rules or the
questioning of current accounting practices may adversely affect our reported financial results.
18
The market price of our common stock could be subject to significant fluctuations. Among the factors that
could affect our stock price are:
•
actual or anticipated variations in restaurant comparable sales or operating results;
•
changes in financial estimates by research analysts;
•
actual or anticipated changes in economic, political or market conditions, such as recessions or
international currency fluctuations;
•
changes in the consumer spending environment;
•
changes in the market valuations of other restaurant companies;
•
announcements by us or our competitors of significant acquisitions, strategic partnerships, divestitures,
joint ventures or other strategic initiatives; and
•
a loss of a key member of management.
In addition, we cannot assure you that an active trading market for our common stock will continue which could
affect our stock price and the liquidity of any investment in our common stock.
The stock markets in general have experienced substantial volatility that has often been unrelated to the operating
performance of individual companies. These broad market fluctuations may adversely affect the trading price of
our common stock.
In the past, following periods of volatility in the market price of a company’s securities, stockholders have often
instituted class action securities litigation against those companies. Such litigation, if instituted, could result in
substantial costs and a diversion of management attention and resources, which would significantly harm our
profitability and reputation.
ITEM 1B.
UNRESOLVED STAFF COMMENTS
None.
ITEM 2. PROPERTIES
RESTAURANT LOCATIONS AND EXPANSION PLANS
As of February 15, 2007, we own and operate seven BJ’s Pizza & Grill restaurants, 36 BJ’s Restaurant &
Brewhouses and 12 BJ’s Restaurant & Brewery’s in six states as follows:
BJ’s Pizza
& Grill
Arizona . . . . . . . . . . . . . . . . . . . . . . .
California . . . . . . . . . . . . . . . . . . . . . .
Colorado . . . . . . . . . . . . . . . . . . . . . .
Nevada . . . . . . . . . . . . . . . . . . . . . . . .
Oregon . . . . . . . . . . . . . . . . . . . . . . . .
Texas . . . . . . . . . . . . . . . . . . . . . . . . .
—
6
—
—
1
—
7
19
BJ’s Restaurant
& Brewhouse
BJ’s Restaurant
& Brewery
Total
3
23
2
1
—
7
1
6
1
1
2
1
4
35
3
2
3
8
36
12
55
The average square footage is as follows:
BJ’s Pizza
& Grill
BJ’s Restaurant
& Brewhouse
BJ’s Restaurant
& Brewery
Arizona . . . . . . . . . . . . . . . . . . . . . . . . . . . . . .
California . . . . . . . . . . . . . . . . . . . . . . . . . . . .
Colorado . . . . . . . . . . . . . . . . . . . . . . . . . . . . .
Nevada . . . . . . . . . . . . . . . . . . . . . . . . . . . . . .
Oregon . . . . . . . . . . . . . . . . . . . . . . . . . . . . . . .
Texas . . . . . . . . . . . . . . . . . . . . . . . . . . . . . . . .
—
2,757
—
—
4,350
—
7,700
8,162
8,150
8,110
—
7,901
8,800
10,788
5,500
13,300
6,135
10,710
Total Weighted Average . . . . . . . . . . . . . . . . .
2,984
8,071
9,609
ITEM 3. LEGAL PROCEEDINGS
Restaurants such as those operated by us are subject to customer litigation in the ordinary course of business,
most of which we expect to be covered by our general liability insurance, subject to certain deductibles and
coverage limits. Punitive damages awards and employee unfair practice claims, however, are not covered by our
general liability insurance. To date, we have not paid punitive damages with respect to any claims, but there can
be no assurance that punitive damages will not be awarded with respect to any future claims, employee unfair
practice claims or any other actions. We could be affected by the adverse publicity resulting from allegations,
regardless of whether or not such allegations are valid or whether we are determined to be liable.
The following paragraphs describe certain legal actions recently settled or pending:
Labor Related Matters
On February 5, 2004, a former employee of ours, on behalf of herself, and allegedly other employees, filed a
class action complaint in Los Angeles County, California Superior Court, Case Number BC310146, and on
March 16, 2004, filed an amended complaint, alleging causes of action for: (1) failure to pay reporting time
minimum pay; (2) failure to allow meal breaks; (3) failure to allow rest breaks; (4) waiting time penalties;
(5) civil penalties; (6) reimbursement for fraud and deceit; (7) punitive damages for fraud and deceit; and
(8) disgorgement of illicit profits. On June 28, 2004, the plaintiff stipulated to dismiss her second, third, fourth
and fifth causes of action. During September 2004, the plaintiff stipulated to binding arbitration of the
action. The parties have scheduled a mediation settlement meeting, on a non binding basis, during 2007. The
outcome of this matter cannot be ascertained at this time.
On June 10, 2005, a former employee filed a complaint against us in Los Angeles County, California, Superior
Court, Case Number BC 336317. The allegations of this complaint were described in our Form 10-K for the
fiscal year ended January 3, 2006. The same plaintiff filed a separate individual complaint on July 11, 2005, in
another Los Angeles County, California, Superior Court alleging that he was wrongfully terminated in violation
of public policy and was discriminated against because of his alleged disability. The same plaintiff filed a claim
with the Workers’ Compensation Appeals Board alleging injuries of stress, strain and harassment. In 2006, the
parties settled the cases, including the workers’ compensation claim, without any admission of liability by us.
On February 16, 2006, a former employee filed a lawsuit in Orange County, California, Superior Court, Case
Number 06CC00030, on behalf of herself and allegedly other employees, for alleged failure to provide rest
periods and meal periods and violation of California Business and Professions Code Section 17200. We have
answered the complaint, denying the allegations and raising various additional defenses. The outcome of this
matter cannot be ascertained at this time.
On March 15, 2006, a former employee filed a lawsuit in Los Angeles County, California, Superior Court, Case
Number BC 349038, and on June 9, 2006, filed an amended complaint, on behalf of himself and allegedly others
20
employed by us as servers, alleging unlawful tip pooling distribution and unfair competition under California
law. The lawsuit asked for return of tips in an unspecified amount, an injunction requiring proper tip pool
distribution, restitution of an unspecified amount, and statutory penalties for each employee required to tip pool
contrary to law in an undetermined amount. We filed a demurrer, stating the plaintiff’s lawsuit had no legal
merit, and other pleadings contesting plaintiff’s lawsuit. The Court ruled in our favor, sustaining the demurrer on
all causes of action, and the case was dismissed. The time period in which the plaintiff may appeal this ruling
will expire within the first quarter of 2007.
ITEM 4. SUBMISSION OF MATTERS TO A VOTE OF SECURITY HOLDERS
None.
21
PART II
ITEM 5. MARKET FOR REGISTRANT’S COMMON EQUITY RELATED SHAREHOLDER
MATTERS AND ISSUER PURCHASE OF EQUITY
Market Information
Our common stock (symbol BJRI) trades on The NASDAQ Global Select Market. All stock prices are closing
prices per The NASDAQ Global Select Market. On February 15, 2007, the closing price of our Common Stock
was $19.99 per share. The table below shows our high and low common stock closing sales prices as reported by
the NASDAQ Global Select Market.
Common Stock
High
Low
Fiscal year ended January 2, 2007
First Quarter . . . . . . . . . . . . . . . . . . . . . . . . . . . . . . . . . . . . . . . . . . . . . . .
Second Quarter . . . . . . . . . . . . . . . . . . . . . . . . . . . . . . . . . . . . . . . . . . . . .
Third Quarter . . . . . . . . . . . . . . . . . . . . . . . . . . . . . . . . . . . . . . . . . . . . . . .
Fourth Quarter . . . . . . . . . . . . . . . . . . . . . . . . . . . . . . . . . . . . . . . . . . . . . .
Fiscal year ended January 3, 2006
First Quarter . . . . . . . . . . . . . . . . . . . . . . . . . . . . . . . . . . . . . . . . . . . . . . .
Second Quarter . . . . . . . . . . . . . . . . . . . . . . . . . . . . . . . . . . . . . . . . . . . . .
Third Quarter . . . . . . . . . . . . . . . . . . . . . . . . . . . . . . . . . . . . . . . . . . . . . . .
Fourth Quarter . . . . . . . . . . . . . . . . . . . . . . . . . . . . . . . . . . . . . . . . . . . . . .
$27.19
$27.33
$22.87
$22.86
$23.53
$20.30
$17.77
$19.04
$20.00
$22.25
$24.26
$24.50
$13.24
$17.65
$19.11
$19.10
As of February 15, 2007 we had approximately 150 shareholders of record and we estimate that there were
approximately 2,700 beneficial shareholders.
Stock Performance Graph
Set forth below is a line graph comparing the cumulative total shareholder return on our Common Stock against
the cumulative return of the Standard & Poor 500 Stock Index and the Hemscott Industry Group Index (formerly
known as the Media General Restaurant Group Index) for the past five years ended January 2, 2007. The graph
assumes that $100 was invested at inception in our Common Stock and in each of the indices that all dividends
were reinvested.
D
O
L
L
A
R
S
500
450
400
350
300
250
200
150
100
50
0
2001
2002
BJ’S RESTAURANT INC.
2003
2004
HEMSCOTT GROUP INDEX
22
2005
2006
S&P 500 INDEX
Equity Compensation Plan Information
We have two equity compensation plans – the 2005 Equity Incentive Plan and the 1996 Stock Option Plan—
under which we may issue shares of our common stock to employees, officers, directors and consultants. Upon
effectiveness of the 2005 Equity Incentive Plan, the 1996 Stock Option Plan was closed for purposes of new
grants. Both of these plans have been approved by our stockholders. The following table provides information
about the shares of our common stock that may be issued upon exercise of awards under these two plans as of
January 2, 2007 (share numbers in thousands).
Plan Category
Equity compensation plans approved by
stockholders . . . . . . . . . . . . . . . . . . . . . . . . . .
Equity compensation plans not approved by
stockholders . . . . . . . . . . . . . . . . . . . . . . . . . .
Number of securities
to be issued upon
exercise of
outstanding options,
warrants and rights
Weighted average
exercise price of
outstanding options,
warrants and rights
Number of securities
remaining available for
future issuance under
equity compensation plans
2,337
$12.04
2,872
—
$ —
—
Dividend Policy
We have not paid any dividends since our inception and have currently not allocated any funds for the payment
of dividends. Rather, it is our current policy to retain earnings, if any, for expansion of our operations,
remodeling of existing restaurants and other general corporate purposes. We have no plans to pay any cash
dividends in the foreseeable future. Should we decide to pay dividends in the future, such payments would be at
the discretion of the Board of Directors.
23
ITEM 6. SELECTED CONSOLIDATED FINANCIAL DATA
The following selected consolidated financial and operating data for each of the five fiscal years in the period
ended January 2, 2007 are derived from our audited consolidated financial statements. This selected consolidated
financial and operating data should be read in conjunction with the consolidated financial statements and
accompanying notes, “Management’s Discussion and Analysis of Financial Condition and Results of Operations”
and other financial information included elsewhere in this report.
Beginning in 2005, to conform to casual dining practices, we reclassified certain non food related items from cost
of sales to operating and occupancy expenses and manager-in-training salaries from restaurant labor to general
and administrative expenses. In 2005, these reclassifications were made to the prior years’ financial statements to
conform to our current reporting standards. As such, we reclassified $1.6 million, $1.3 million, and $879,000
from cost of sales to operating and occupancy expenses for 2004, 2003, and 2002, respectively. We also
reclassified $555,000 and $457,000 from labor and benefits to general and administrative expenses for 2004 and
2003, respectively. These reclassifications had no effect on operating income, net income or earnings per share.
2006
Consolidated statements of income data:
Revenues . . . . . . . . . . . . . . . . . . . . . . . . . . . . . . . . . . . .
Costs and expenses:
Cost of sales . . . . . . . . . . . . . . . . . . . . . . . . . . . . . . . . . .
Labor and benefits . . . . . . . . . . . . . . . . . . . . . . . . . . . . .
Occupancy & operating Expenses . . . . . . . . . . . . . . . . .
General and administrative . . . . . . . . . . . . . . . . . . . . . .
Depreciation and amortization . . . . . . . . . . . . . . . . . . . .
Restaurant opening expense . . . . . . . . . . . . . . . . . . . . . .
Gain on sale of Pietro’s restaurants . . . . . . . . . . . . . . . .
Total costs and expenses . . . . . . . . . . . . . . . . . . . . . . . .
Income from operations . . . . . . . . . . . . . . . . . . . . . . . . .
Other income (expense):
Interest income (expense), net . . . . . . . . . . . . . . . . . . . .
Other income (expense), net (1) . . . . . . . . . . . . . . . . . . .
Total other income (expense) . . . . . . . . . . . . . . . . . . . . .
Income before taxes . . . . . . . . . . . . . . . . . . . . . . . . . . . .
Income tax expense (2) . . . . . . . . . . . . . . . . . . . . . . . . .
Net income . . . . . . . . . . . . . . . . . . . . . . . . . . . . . . . . . . .
Fiscal Year (3)
2005
2004
2003
(in thousands, except per share data)
$238,928
$178,210
61,420
83,292
46,198
19,832
9,983
5,253
—
225,978
12,950
45,458
63,867
33,987
13,290
6,984
3,520
—
167,106
11,104
1,690
39
1,729
14,679
4,834
$ 9,845
1,119
149
1,268
12,372
4,021
$ 8,351
Net income per share:
Basic . . . . . . . . . . . . . . . . . . . . . . . . . . . . . . . . . . . .
$
0.42
$
Diluted . . . . . . . . . . . . . . . . . . . . . . . . . . . . . . . . . .
$
0.41
$
$129,049
2002
$102,959
$75,705
25,936
36,371
21,014
8,954
3,928
1,467
—
97,670
5,289
18,362
28,057
15,210
7,774
2,714
1,717
—
73,834
1,871
32,193
45,775
25,242
11,365
5,249
2,918
(1,658)
121,084
7,965
$
421
165
586
8,551
2,286
6,265
376
262
(228)
414
148
676
5,437
2,547
1,844
880
3,593 $ 1,667
$
0.38
$
0.32
$
0.18
$
0.10
0.36
$
0.30
$
0.18
$
0.09
Weighted average shares outstanding:
Basic . . . . . . . . . . . . . . . . . . . . . . . . . . . . . . . . . . . .
23,287
22,134
19,498
19,422
17,273
Diluted . . . . . . . . . . . . . . . . . . . . . . . . . . . . . . . . . .
24,131
23,381
20,570
20,482
18,775
Consolidated balance sheets data (end of period):
Cash and cash equivalents . . . . . . . . . . . . . . . . . . . . . . .
Investments . . . . . . . . . . . . . . . . . . . . . . . . . . . . . . . . . . .
Total assets . . . . . . . . . . . . . . . . . . . . . . . . . . . . . . . . . . .
Total long-term debt (including current portion) . . . . . .
Shareholders’ equity . . . . . . . . . . . . . . . . . . . . . . . . . . . .
$ 51,758
32,895
249,849
—
202,862
4,899
22,041
83,705
153
71,051
$28,440
3,681
77,849
561
66,616
$
8,144
41,703
163,958
—
129,899
$
3,766
15,775
100,866
—
78,780
$
(1) Fiscal 2002 includes increased lottery earnings from our Pietro’s Pizza locations and license fee income from
our interest in the BJ’s Lahaina, Maui, Hawaii location. Fiscal 2003 includes a $950,000 charge related to our
meals & rest period settlement, partially offset by a $250,000 benefit related to other settlement proceeds.
(2) Fiscal 2004 includes a $298,000 benefit for the elimination of the net deferred tax asset valuation allowances.
(3) Fiscal 2005 consists of 52 weeks and two days, fiscal 2004 consists of 53 weeks and all other fiscal years
consist of 52 weeks.
24
ITEM 7. MANAGEMENT’S DISCUSSION AND ANALYSIS OF FINANCIAL CONDITION AND
RESULTS OF OPERATIONS
GENERAL
As of February 15, 2007 we owned and operated 55 restaurants located in California, Oregon, Colorado, Arizona,
Texas and Nevada. In addition we have one licensed restaurant in Lahaina, Maui. Each of our restaurants is
operated either as a BJ’s Restaurant & Brewery, a BJ’s Restaurant & Brewhouse, or a BJ’s Pizza & Grill
restaurant. Our menu features our award-winning, signature deep-dish pizza, our own handcrafted beers as well
as a wide selection of appetizers, entrees, pastas, sandwiches, specialty salads and desserts.
The first BJ’s restaurant was opened in Orange County, California in 1978 as a small full service restaurant
focusing on Chicago style deep-dish pizza. In 1991 our current Co-Chairmen assumed the operations of the
restaurants and in 1995 purchased the restaurants from the original founders. In 1996, the Company opened its
first large format restaurant and brewery in Brea, California and began to expand the menu to include appetizers,
entrees, pastas, sandwiches, specialty salads and desserts.
As of February 15, 2007, we operated 12 BJ’s Restaurant & Brewery restaurants that manufacture our beer for
our restaurants, 36 BJ’s Restaurant & Brewhouse restaurants, which are identical to our brewery restaurants
except that they do not manufacture their own beer and seven BJ’s Pizza & Grill restaurants, which are primarily
our original legacy restaurants. Our growth will focus on our BJ’s Restaurant & Brewhouse; however, we may
continue to build additional BJ’s Restaurant & Brewery locations in certain areas where we believe it may be
more appropriate to brew our own beer. We also have contract brewing arrangements in which we utilize the
excess capacity of other highly qualified craft brewers to produce our hand-crafted beers under our proprietary
recipes.
In 1996 we purchased 19 additional restaurants in Oregon and Washington from Pietro’s Corp (“Pietro’s”) to
expand our presence in the Northwest. The Pietro’s restaurants primarily served thin-crust pizza in a very casual
counter-service environment. Over the next eight years we closed 13 of the Pietro’s restaurants and converted
three restaurants to BJ’s locations. On March 15, 2004, we sold the remaining three Pietro’s restaurants to
employees of those restaurants.
We intend to continue developing BJ’s restaurants in high profile locations within densely populated areas in
both existing and new markets. Since most of our established restaurants currently operate close to full capacity
during the peak demand periods of lunch and dinner, and given our relatively high average sales per productive
square foot, we generally do not expect to achieve increases in comparable sales other than our effective menu
price increases for our mature restaurants. Therefore, we expect that the majority of our year-over-year revenue
growth will come from new restaurant openings.
Newly opened restaurants experience higher cost of sales, labor and direct operating and occupancy costs for
approximately their first 90 to 120 days of operations in both percentage and dollar terms when compared with
our mature restaurants. Accordingly, the volume and timing of newly opened restaurants has had, and is expected
to continue to have, an impact on restaurant opening expenses, cost of sales, labor and occupancy and operating
expenses.
Our revenues are comprised of food and beverage sales at our restaurant. Revenues from restaurant sales are
recognized when payment is tendered at the point of sale. Revenues from our gift cards are recognized upon
redemption in our restaurants. Until the redemption of gift cards occurs, all outstanding balances on such cards
are included as a liability in our consolidated balance sheets.
Cost of sales is comprised of food and beverage supplies. The components of cost of sales are variable and
typically fluctuate with sales volumes. Labor costs include direct hourly and management wages, bonuses and
payroll taxes and fringe benefits for restaurant employees.
25
Occupancy and operating expenses include restaurant supplies, credit card fees, marketing costs, fixed rent,
percentage rent, common area maintenance charges, utilities, real estate taxes, repairs and maintenance and other
related restaurant costs. Occupancy and operating expenses generally increase with sales volume but decline as a
percentage of restaurant sales.
General and administrative costs include all corporate, field supervision and administrative functions that support
existing operations and provide infrastructure to facilitate our future growth. Components of this category
include management, supervisory and staff salaries and related employee benefits, travel and relocation costs,
information systems, training, corporate rent and professional and consulting fees. Depreciation and amortization
principally include depreciation on capital expenditures for restaurants. Restaurant opening expenses, which are
expensed as incurred, consist of the costs of hiring and training the initial work force for each new restaurant,
travel, the cost of food used in training, marketing costs, the cost of the initial stocking of operating supplies and
other direct costs related to the opening of a restaurant.
In calculating comparable company-owned restaurant sales, we include a restaurant in the comparable base once
it has been open for 18 months.
RESULTS OF OPERATIONS
The following table sets forth, for the years indicated, our Consolidated Statements of Income expressed as
percentages of total revenues.
2006
2005
Fiscal Year
2004
2003
2002
Consolidated statements of income Data:
Revenues . . . . . . . . . . . . . . . . . . . . . . . . . . . . . . . . . . . . . . . . . . . . . . . . . . 100.0% 100.0% 100.0% 100.0% 100.0%
Costs and expenses:
Cost of sales . . . . . . . . . . . . . . . . . . . . . . . . . . . . . . . . . . . . . . . . . . . . . . . .
25.7
25.5
24.9
25.2
24.3
Labor and benefits . . . . . . . . . . . . . . . . . . . . . . . . . . . . . . . . . . . . . . . . . . .
34.9
35.8
35.5
35.3
37.1
Occupancy & operating Expenses . . . . . . . . . . . . . . . . . . . . . . . . . . . . . . .
19.3
19.1
19.6
20.4
20.1
General and administrative . . . . . . . . . . . . . . . . . . . . . . . . . . . . . . . . . . . .
8.3
7.5
8.8
8.7
10.3
Depreciation and amortization . . . . . . . . . . . . . . . . . . . . . . . . . . . . . . . . . .
4.2
3.9
4.1
3.8
3.6
Restaurant opening expense . . . . . . . . . . . . . . . . . . . . . . . . . . . . . . . . . . . .
2.2
2.0
2.3
1.4
2.3
Gain on sale of Pietro’s restaurants . . . . . . . . . . . . . . . . . . . . . . . . . . . . . .
—
—
(1.3) —
—
Total costs and expenses . . . . . . . . . . . . . . . . . . . . . . . . . . . . . . . . . . . . . .
94.6
93.8
93.9
94.8
97.7
Income from operations . . . . . . . . . . . . . . . . . . . . . . . . . . . . . . . . . . . . . . .
Other income (expense):
Interest income (expense), net . . . . . . . . . . . . . . . . . . . . . . . . . . . . . . . . . .
Other income (expense), net . . . . . . . . . . . . . . . . . . . . . . . . . . . . . . . . . . . .
5.4
6.2
6.1
5.2
2.3
0.7
0.0
0.6
0.1
0.3
0.1
0.4
(0.2)
0.3
0.5
Total other income (expense) . . . . . . . . . . . . . . . . . . . . . . . . . . . . . . . . . . .
0.7
0.7
0.4
0.2
0.8
Income before taxes . . . . . . . . . . . . . . . . . . . . . . . . . . . . . . . . . . . . . . . . . .
6.1
6.9
6.5
5.4
3.1
Income tax expense . . . . . . . . . . . . . . . . . . . . . . . . . . . . . . . . . . . . . . . . . .
2.0
2.3
1.8
1.8
1.2
Net income . . . . . . . . . . . . . . . . . . . . . . . . . . . . . . . . . . . . . . . . . . . . . . . . .
4.1%
4.6%
4.7%
3.6%
1.9%
FISCAL YEAR 2006 (52 WEEKS) COMPARED TO FISCAL YEAR 2005 (52 WEEKS)
Revenues. Total revenues increased by $60.7 million, or 34.1%, to $238.9 million during the 52 weeks ended
January 2, 2007 from $178.2 million during the comparable 52 week period of 2005. The $60.7 million increase
in revenues consisted of an approximate $51.9 million increase in restaurant sales from new restaurants not in our
26
comparable sales base for the prior period, and an approximate $8.6 million or 5.8% increase from comparable
restaurant sales, offset by $705,000 of additional revenues in fiscal 2005 due to the two additional operating days
in that year. The increase in comparable restaurant sales benefited from a menu price increase of approximately
2.4% with the rest due to increased customer counts and menu mix shifts.
Cost of Sales. Cost of sales increased by $15.9 million, or 35.1%, to $61.4 million during the 52 weeks ended
January 2, 2007 from $45.5 million during the comparable 52 week period of 2005. As a percentage of revenues,
cost of sales increased to 25.7% for the current 52 week period from 25.5% for the prior year comparable 52
week period. This increase is primarily a result of increased costs for seafood and produce, partially offset by the
impact of menu price increases.
Additionally, in our new restaurants, our cost of sales will typically be higher during the first 90-120 days of
operations versus our mature restaurants, as management teams become accustomed to optimally predicting,
managing and servicing sales volumes we expect at our restaurants.
We provide our customers a large variety of menu items and therefore we are not overly dependent on a single
group of commodities. We continue to work with our suppliers to control food costs; however, there can be no
assurance that future supplies and costs for commodities used in our restaurants will not fluctuate due to weather
and other market conditions outside of our control.
Labor and Benefits. Labor and benefit costs for our restaurants increased by $19.4 million, or 30.4%, to $83.3
million during the 52 weeks ended January 2, 2007 from $63.9 million during the comparable 52 week period of
2005. This increase was primarily due to the opening of 11 new restaurants since the 52 weeks ended January 3,
2006. As a percentage of revenues, labor and benefit costs decreased to 34.9% for the current 52 week period
from 35.8% for the prior year comparable 52 week period. This percentage decrease is primarily due to increased
leverage of the fixed component of our labor costs resulting from higher sales, coupled with improved hourly
labor productivity which we believe resulted from our new web-based labor scheduling and analysis system that
was introduced during the first half of 2006.
For new restaurants, labor expenses will typically be higher than normal during the first 90-120 days of
operations until our management team at each new restaurant becomes more accustomed to optimally predicting,
managing and servicing the sales volumes expected at our restaurants.
Beginning in fiscal 2007, we implemented a performance-based equity incentive plan, BJ’s Gold Standard Stock
Ownership Plan, for our restaurant general managers, executive kitchen managers and field supervision
personnel. The new equity incentive plan consists of awards of restricted stock units that will require five-year
service and performance commitments. The annualized non-cash pre-tax compensation expense associated with
these awards is estimated to be approximately $900,000 for fiscal 2007.
Occupancy and Operating Expenses. Occupancy and operating expenses increased by $12.2 million, or 35.9%, to
$46.2 million during the 52 weeks ended January 2, 2007 from $34.0 million during the comparable 52 week
period of 2005. The increase reflects additional operating and occupancy expenses related to the 11 new
restaurants we opened since the 52 weeks ended January 3, 2006. As a percentage of revenues, occupancy and
operating expenses increased to 19.3% for the 52 week period from 19.1% for the prior year comparable 52 week
period. This increase is primarily due to higher energy costs and increased dining and kitchen supplies partially
offset by our ability to leverage the fixed nature of many of these costs as a result of higher comparable sales.
General and Administrative Expenses. General and administrative expenses increased by $6.5 million, or 49.2%,
to $19.8 million during the 52 weeks ended January 2, 2007 from $13.3 million during the comparable 52 week
period of 2005. Included in general and administrative costs for the 52 weeks ended January 2, 2007 is
$1.6 million of stock-based compensation expense related to the adoption of Statement No. 123(R), Share-Based
Payment in January 2006. Excluding this amount, general and administrative costs increased $4.9 million, or
27
36.8%. This increase was the result of our planned investments in field supervision and corporate infrastructure
to support our growth coupled with higher restaurant management recruiting and training costs. As a percentage
of revenues, general and administrative expenses increased to 8.3% for the 52 week period from 7.5% for the
prior year comparable 52 week period. Approximately 70 basis points of this percentage increase is the result of
stock-based compensation due to the adoption of Statement No. 123(R) in January 2006, with the remaining 10
basis points increase being due primarily to the factors noted above.
Beginning in fiscal 2007, we relocated our corporate office to a larger leased facility to support our future
growth. In connection with this relocation, we will incur approximately $410,000 of additional rent expense in
fiscal 2007.
Depreciation and Amortization. Depreciation and amortization increased by $3.0 million, or 42.9%, to
$10.0 million during the 52 weeks ended January 2, 2007 from $7.0 million during the comparable 52 week
period of 2005. The increase was primarily due to our acquisition of restaurant equipment, furniture, leasehold
improvements and brewery equipment related to new restaurant development. As a percentage of revenues,
depreciation and amortization increased to 4.2% for the 52 week period from 3.9% for the prior year comparable
52 week period. This increase is primarily due to increased construction costs for new restaurants and
depreciation on our new operating systems.
Restaurant Opening Expense. Restaurant opening expense increased by $1.7 million, or 49.2%, to $5.3 million
during the 52 weeks ended January 2, 2007 from $3.5 million during the comparable 52 week period of 2005.
During the 52 weeks ended January 2, 2007 and January 3, 2006, we opened 11 and nine restaurants,
respectively. This increase is primarily due to additional restaurants compared to prior year end and construction
rent expensed in the more recent period as a result of our adoption of FASB Statement of Position No. 13-1
(FSP 13-1), Accounting for Rental Costs Incurred During a Construction Period effective January 2006. Our
opening costs will fluctuate from period to period, depending upon, but not limited to, the number of restaurant
openings, the size and concept of the restaurants being opened, the location of the restaurants, the rental costs of
the restaurants and the complexity of the staff hiring and training process.
Interest Income, Net. Net interest income increased by $571,000, or 51.0%, to $1.7 million during the 52 weeks
ended January 2, 2007 from $1.1 million during the comparable 52 week period of 2005. This increase is
primarily due to increased investments after the completion of our private placements in March 2005 and
November 2006 coupled with higher interest rates this year compared to last year.
Other Income, Net. Net other income decreased to $39,000 during comparable 52 weeks ended January 2, 2007
from $149,000 during the comparable 52 week period of 2005, a decrease of $110,000. This decrease is primarily
due to our decision to discontinue lottery ticket sales in our Oregon restaurants.
Income Tax Expense. Our effective income tax rate for the 52 weeks ended January 2, 2007 was 32.9% compared
to 32.5% for the comparable 52 week period of 2005. The effective income tax rate for the 52 weeks ended
January 2, 2007 differs from the statutory income tax rate primarily due to FICA tip credits and the
non-deductibility of incentive stock options. We currently estimate our effective tax rate to be approximately
34.0% to 35.0% for fiscal 2007. However, the actual effective tax rate for fiscal 2007 may be different than our
current estimate due to actual revenues, pre-tax income and tax credits achieved during the year.
FISCAL YEAR 2005 (52 WEEKS) COMPARED TO FISCAL YEAR 2004 (53 WEEKS)
Revenues. Total revenues increased by $49.2 million, or 38.1%, to $178.2 million during the 52 weeks ended
January 3, 2006 from $129.0 million during the 53 week period of 2004. The $49.2 million increase in revenues
consisted of an approximate $47.6 million increase in restaurant sales from the opening of new restaurants, and
an approximate $5.1 million or 4.6% increase from comparable restaurant sales. The comparable restaurant sales
benefited from a menu price increase of approximately 1.2% with the majority of the increase due to increased
28
customer counts. These revenue increases were partially offset by approximate $1.6 million of restaurant sales
related to our three Pietro’s restaurants and our Seal Beach BJ’s Pizza & Grill restaurant, which were closed on
March 15, 2004 and January 3, 2005, respectively.
Cost of Sales. Cost of sales increased by $13.3 million, or 41.2%, to $45.5 million during the 52 weeks ended
January 3, 2006 from $32.2 million during the 53 week period of 2004. As a percentage of revenues, cost of sales
increased to 25.5% for the current 52 week period from 24.9% for the prior-year 53 week period. This increase is
primarily a result of increased costs for meat, produce, seafood, general grocery items and fuel surcharges from
our distributors partially offset by a reduction in poultry and cheese costs and the impact of menu price increases.
Labor and Benefits. Labor and benefit costs for our restaurants increased by $18.1 million, or 39.5%, to $63.9
million during the 52 weeks ended January 3, 2006 from $45.8 million during the 53 week period of 2004. This
increase was primarily due to the opening of nine new restaurants, partially offset by the closing of our Pietro’s
and Seal Beach restaurants. As a percentage of revenues, labor and benefit costs increased to 35.8% for the
current 52 week period from 35.5% for the prior-year 53 week period. This percentage increase is primarily due
to higher management labor as a result of our decision to improve our management staffing levels and
inefficiencies experienced with the nine new restaurants we opened in 2005 compared to the seven new
restaurants we opened in the in 2004.
Occupancy & Operating Expenses. Occupancy & operating expenses increased by $8.8 million, or 34.6%, to
$34.0 million during the 52 weeks ended January 3, 2006 from $25.2 million during the 53 week period of 2004.
The increase reflects additional operating & occupancy expenses related to the nine new restaurants we opened in
2005, partially offset by the decrease in costs associated with our three Pietro’s restaurants that were sold on
March 15, 2004 and the closure of our Seal Beach BJ’s Pizza & Grill restaurant on January 3, 2005. As a
percentage of revenues, occupancy & operating expenses decreased to 19.1% for the 52 week period from 19.6%
for the prior-year 53 week period. This decrease is primarily due to lower rent payments as a result of two land
purchases in which we therefore pay no rent and a higher mix of ground-leased locations (versus both ground and
building-leased locations).
General and Administrative Expenses. General and administrative expenses increased by $1.9 million, or 16.9%,
to $13.3 million during the 52 weeks ended January 3, 2006 from $11.4 million during the 53 week period of
2004. This increase was the result of planned investments in our field supervision and corporate support
infrastructure to support our growth. During 2006, we expect to continue to add resources to the corporate
support and field supervision activities in preparation for the planned openings of as many as 11 new restaurants.
As a percentage of revenues, general and administrative expenses decreased to 7.5% for the 52 week period from
8.8% for the prior-year 53 week period. This percentage decrease is primarily the result of our continued ability
to leverage the fixed nature of many of these costs over our increased revenues and the absence of severance
payments to three corporate employees which were expensed during 2004.
Depreciation and Amortization. Depreciation and amortization increased by $1.7 million, or 33.1%, to
$7.0 million during the 52 weeks ended January 3, 2006 from $5.2 million during the 53 week period of 2004.
The increase was primarily due to our acquisition of restaurant equipment, furniture, leasehold improvements and
brewery equipment related to new restaurant development.
Restaurant Opening Expense. Restaurant opening expense increased by $0.6 million, or 20.6%, to $3.5 million
during the 52 weeks ended January 3, 2006 from $2.9 million during the 53 week period of 2004. This increase is
primarily due to opening costs related to nine restaurant openings and four restaurants in-progress during the 52
weeks ended January 3, 2006, as compared to seven restaurant openings and two restaurants in progress during
the 53 week period of 2004.
Gain on Sale of Pietro’s Restaurants. In fiscal 2004, we sold our three Pietro’s restaurants resulting in a $1.7
million pre-tax gain.
29
Interest Income, Net. Net interest income increased by $698,000, or 165.8%, to $1.1 million during the 52 weeks
ended January 3, 2006 from $421,000 during the 53 week period of 2004. This increase is primarily due to
increased investments after the completion of our private placement on March 11, 2005 coupled with higher
interest rates.
Other Income, Net. Net other income decreased to $149,000 during 53 weeks ended January 3, 2006 from
$165,000 during the 53 week period of 2004, a decrease of $16,000. This decrease is primarily due to the loss of
gaming income from our Pietro’s restaurants, which we sold on March 15, 2004.
Income Tax Expense. Our effective income tax rate for the 52 weeks ended January 3, 2006 was 32.5% compared
to 26.7% for the 53 week period of 2004. The effective income tax rate for the 52 weeks ended January 3, 2006
differs from the statutory income tax rate primarily due to FICA tip credits.
LIQUIDITY AND CAPITAL RESOURCES
Our capital requirements are principally related to our restaurant growth plans. While our ability to achieve our
growth plans is dependent on a variety of factors, many of which are outside of our control, our primary growth
objective is to achieve a 20% to 25% increase in total restaurant operating weeks during each of fiscal 2007 and
2008 from the development and opening of new restaurants. Our base of established restaurant operations is not
yet large enough to generate enough free cash flow from operations to totally fund our planned expansion.
Similar to many restaurant chains, we typically utilize operating lease arrangements (principally ground leases)
for substantially all of our restaurant locations. However, from time to time, we may be required to purchase the
underlying land for a new restaurant if that is the only way to secure a highly desirable site. We are typically
required to expend cash to perform certain site–related work and to construct and equip our restaurant buildings.
We opened 11 new restaurants during fiscal 2006 and we currently expect to open as many as 13 new restaurants
during fiscal 2007. We believe that our operating lease arrangements continue to provide appropriate leverage for
our capital structure in a financially efficient manner. However, we are not limited to the use of lease
arrangements as our only method of opening new restaurants. While our operating lease obligations are not
currently required to be reflected as indebtedness on our consolidated balance sheets, the minimum rents and
other related lease obligations, such as common area expenses, under our lease agreements must be satisfied by
cash flows from our ongoing operations. Accordingly, our lease arrangements reduce, to some extent, our
capacity to utilize funded indebtedness in our capital structure. We also require capital resources to maintain our
existing base of restaurants and brewery operations and to further expand and strengthen the capabilities of our
corporate and information technology infrastructures. Our requirement for working capital is not significant since
our restaurant guests pay for their food and beverage purchases in cash or credit cards at the time of the sale.
Thus, we are able to sell many of our inventory items before we have to pay our suppliers for such items.
Our cash flows from operating activities, as detailed in the consolidated statements of cash flows, provided $31.9
million of net cash during the 52 weeks ended January 2, 2007, a $4.2 million increase from the $27.7 million
generated during the 52 week period of 2005. The increase in cash from operating activities for the 52 weeks
ended January 2, 2007, in comparison to 52 weeks ended January 3, 2006, is primarily due to the timing of
payments to vendors included in accounts payable and accrued expenses, increased net income, higher
depreciation expense due to more restaurants, and non-cash stock-based compensation expense, partially offset
by the change in deferred taxes and the timing of prepaid expenditures.
For the 52 weeks ended January 2, 2007, total capital expenditures were $58.3 million of which expenditures for
the acquisition of land, restaurant and brewery equipment and leasehold improvements to construct new
restaurants were $48.6 million. These expenditures were primarily related to the construction of our 11 new
restaurants opened by the end of the fiscal year as well as approximately $12.2 million of expenditures related to
six additional restaurants expected to open in the first and second quarters of 2007. In addition, total capital
expenditures related to the maintenance of existing restaurants and expenditures related to restaurant and
corporate systems were $5.2 million and $4.8 million, respectively.
30
On November 16, 2006, we sold 3,075,000 shares of common stock at a purchase price of $20.00 per share for
$58.3 million (net of approximately $3.2 million in related fees and expenses); and, on March 11, 2005, we sold
2,750,000 shares of common stock at a purchase price of $15.50 per share for $40.3 million (net of
approximately $2.2 million in related fees and expenses). These proceeds are currently being utilized to fund the
expansion of our restaurant operations and general corporate purposes.
On December 15, 2005, we established a $10 million unsecured revolving line of credit (the “Line of Credit”)
which expires on December 31, 2008. Availability under the Line of Credit is reduced by outstanding letters of
credit primarily supporting our self insurance programs. As of January 2, 2007, there were no funded borrowings
outstanding under the Line of Credit; however there was $2.3 million outstanding in letters of credit. Borrowings
under the Line of Credit will bear interest at 1% per annum in excess of the applicable LIBOR rate.
Prior to the March 2005 equity offering, we funded our capital requirements primarily through cash flows from
operations and proceeds received from the exercise of redeemable warrants during 2002. As of February 15,
2007, we have entered into 10 signed leases or purchase agreements, of which the restaurants have not yet began
operations, and we expect to enter into additional leases for new restaurant locations. Our capital requirements
related to opening additional restaurants will continue to be significant. We currently anticipate our capital
expenditures for 2007 to be approximately $60-$65 million related to the construction of our new restaurants,
one land purchase for restaurant development, and the reinvestment in some of our older restaurants as well as
normal maintenance capital expenditures and the investment in our restaurant toolsets. We expect to fund these
expenditures with our current cash and investment balances and our cash flow from operations.
Our future cash requirements and the adequacy of available funds will depend on many factors, including the
pace of expansion, real estate markets, site locations and the nature of the lease and associated financing
arrangements negotiated with landlords. Based upon our current expansion plan, we believe that our current cash
flow and our cash and investments balances together with anticipated cash flows from operations should be
sufficient to satisfy our working capital and capital expenditure requirements through at least fiscal 2008. We
may seek additional funds to finance our future growth and operations. There can be no assurance that such funds
will be available when required or available on terms acceptable to us.
SALE OF PIETRO’S RESTAURANTS
In February 2004, we executed an agreement to sell our three Pietro’s restaurants effective on March 15, 2004,
resulting in a $1.7 million pre-tax gain. The buyers, formerly employees, purchased the restaurant assets and
related trademarks for the Pietro’s brand. The $2.2 million sales price includes cash proceeds of $1.3 million and
two notes receivable from the buyers totaling $950,000, with terms of five and ten years. The ten-year note is in
the amount of $700,000, bears interest at prime plus one percent with a minimum interest rate of 5% and a
maximum interest rate of 7% and requires fixed monthly payments of principal and interest over the ten-year
term. The five-year note is in the amount of $250,000, bears interest at prime plus one percent and requires fixed
monthly payments of principal and interest over the five-year term. Our notes are subordinated to the buyer’s
SBA loan. Principal payments to the Company on both notes were prohibited for the first six months by the
buyer’s SBA loan.
For these three Pietro’s restaurants sold, sales were $644,000 and $767,000 and pre-tax income was $111,000
and $154,000 for the thirteen weeks ended March 28, 2004 and March 30, 2003, respectively. The net book value
of the assets sold as of March 28, 2004 was $500,000.
OFF-BALANCE SHEET ARRANGEMENTS
We do not participate in transactions that generate relationships with unconsolidated entities or financial
partnerships, such as entities often referred to as structured finance or variable interest entities (“VIEs”), which
would have been established for the purpose of facilitating off-balance sheet arrangements or other contractually
narrow limited purposes. As of January 2, 2007, we are not involved in any unconsolidated VIE transactions.
31
IMPACT OF INFLATION
The impact of inflation on food, labor, energy and occupancy costs can significantly affect our operations. Many
of our employees are paid hourly rates related to Federal and State minimum wage laws. Minimum wages have
been increased numerous times and remain subject to future increases.
While we have been able to react to inflation and other changes in our costs of key operating expenses by
gradually increasing prices for our menu items, combined with reduced purchasing costs, and greater economies
of scale, there can be no assurance that we will be able to continue to do so in the future. Competitive conditions
could limit our menu pricing flexibility. We cannot guarantee that all future cost increases can be offset by
increased menu prices or that increased menu prices will be fully absorbed by our restaurant guests without any
resulting changes in their visit frequencies or purchasing patterns. Many of the leases for our restaurants provide
for contingent rent obligations based on a percentage of sales. As a result, rent expense will absorb a
proportionate share of any menu price increases in our restaurants. There can be no assurance that we will
continue to generate increases in comparable restaurant sales in amounts sufficient to offset inflationary or other
cost pressures.
SEASONALITY AND ADVERSE WEATHER
Our results of operations have historically been impacted by seasonality, which directly impacts tourism at our
coastal California locations. The summer months (June through August) have traditionally been higher volume
periods than other periods of the year. Quarterly results have been and will continue to be significantly impacted
by the timing of new restaurant openings and their associated restaurant opening costs. As a result of these and
other factors, our financial results for any given quarter may not be indicative of the results that may be achieved
for a full fiscal year.
CRITICAL ACCOUNTING POLICIES
Critical accounting policies require the greatest amount of subjective or complex judgments by management and
are important to portraying our financial condition and results of operations. Judgments or uncertainties
regarding the application of these policies may result in materially different amounts being reported under
different conditions or using different assumptions. We consider the following policies to be the most critical in
understanding the judgments that are involved in preparing our consolidated financial statements.
Property and Equipment
We record all property and equipment at cost. Property and equipment accounting requires estimates of the
useful lives for the assets for depreciation purposes and selection of depreciation methods. We believe the useful
lives reflect the actual economic life of the underlying assets. We have elected to use the straight-line method of
depreciation over the estimated useful life of an asset or the primary lease term of the respective lease, whichever
is shorter. Renewals and betterments that materially extend the useful life of an asset are capitalized while
maintenance and repair costs are charged to operations as incurred. Judgment is often required in the decision to
distinguish between an asset which qualifies for capitalization versus an expenditure which is for maintenance
and repairs.
We review property and equipment (which includes leasehold improvements) and intangible assets with finite
lives for impairment when events or circumstances indicate these assets might be impaired. We test impairment
using historical cash flows and other relevant facts and circumstances as the primary basis for our estimates of
future cash flows. The analysis is performed at the restaurant level for indicators of impairment. If impairment
indicators were identified, then assets would be recorded at fair value. This process requires the use of estimates
and assumptions, which are subject to a high degree of judgment. If these assumptions change in the future, we
may be required to record impairment charges for these assets. As of January 2, 2007, no impairment indicators
have been identified.
32
Self Insurance
We are self-insured for a portion of our employee workers’ compensation program. We maintain coverage with a
third party insurer to limit our total exposure for this program. The accrued liability associated with this program
is based on our estimate of the ultimate costs to settle known claims as well as claims incurred but not yet
reported to us (“IBNR claims”) as of the balance sheet date. Our estimated liability is not discounted and is based
on information provided by our insurance broker and insurer, combined with our judgments regarding a number
of assumptions and factors, including the frequency and severity of claims, our claims development history, case
jurisdiction, related legislation, and our claims settlement practice. Significant judgment is required to estimate
IBNR claims as parties have yet to assert such claims. If actual claims trends, including the severity or frequency
of claims, differ from our estimates, our financial results could be significantly impacted.
Income Taxes
We provide for income taxes based on our estimate of federal and state tax liabilities. Our estimates include, but
are not limited to, effective state and local income tax rates, allowable tax credits for items such as FICA taxes
paid on reported tip income and estimates related to depreciation expense allowable for tax purposes. We usually
file our income tax returns several months after our fiscal year-end. We file our tax returns with the advice and
compilation of tax consultants. All tax returns are subject to audit by federal and state governments, usually years
after the returns are filed, and could be subject to differing interpretation of the tax laws.
Deferred tax accounting requires that we evaluate net deferred tax assets to determine if these assets will more
likely than not be realized in the foreseeable future. This test requires projection of our taxable income into future
years to determine if there will be taxable income sufficient to realize the tax assets (future tax deductions and
FICA tax credit carryforwards). The preparation of the projections requires considerable judgment and is subject
to change to reflect future events and changes in the tax laws.
Leases
We lease the majority of our restaurant locations. We account for our leases under the provisions of FASB
Statement No. 13, Accounting for Leases (SFAS 13) which require that our leases be evaluated and classified as
operating or capital leases for financial reporting purposes. The term used for this evaluation includes renewal
option periods only in instances in which the exercise of the renewal option can be reasonably assured and failure
to exercise such option would result in an economic penalty. All of our restaurant leases are classified as
operating leases pursuant to the requirements of SFAS 13. We disburse cash for leasehold improvements,
furniture and fixtures and equipment to build out and equip our leased premises. We may also expend cash for
permanent improvements that we make to leased premises that may be reimbursed to us by our landlords as
construction contributions (also known as tenant improvement allowances) pursuant to agreed-upon terms in our
leases. Landlord construction contributions can take the form of up-front cash, full or partial credits against
minimum or percentage rents otherwise payable by us or a combination thereof. All tenant improvement
allowances received by us are recorded as a deferred rent obligation and amortized over the term of the lease.
The lease term used for straight-line rent expense is calculated from the date we obtain possession of the leased
premises through the lease termination date. Prior to January 4, 2006, we capitalized rent expense from
possession date through construction completion and reported the related asset in property and equipment.
Capitalized rent was amortized through depreciation and amortization expense over the estimated useful life of
the related assets limited to the lease term. Straight-line rent recorded during the pre-opening period (construction
completion through restaurant open date) was recorded as pre-opening expense. Beginning January 4, 2006, we
expense rent from possession date through restaurant open date as pre-opening expense, in accordance with
FASB Staff Position No. 13-1, Accounting for Rental Costs Incurred During a Construction Period. Once a
restaurant opens for business, we record straight-line rent over the lease term plus contingent rent to the extent it
exceeded the minimum rent obligation per the lease agreement.
33
There is potential for variability in the rent holiday period, which begins on the possession date and ends on the
store open date, during which no cash rent payments are typically due under the terms of the lease. Factors that
may affect the length of the rent holiday period generally relate to construction related delays. Extension of the
rent holiday period due to delays in store opening will result in greater pre-opening rent expense recognized
during the rent holiday period and lesser occupancy expense during the rest of the lease term (post-opening).
For leases that contain rent escalations, we record the total rent payable during the lease term, as determined
above, on the straight-line basis over the term of the lease (including the rent holiday period beginning upon our
possession of the premises), and record the difference between the minimum rents paid and the straight-line rent
as a lease obligation. Certain leases contain provisions that require additional rental payments based upon
restaurant sales volume (“contingent rentals”). Contingent rentals are accrued each period as the liabilities are
incurred, in addition to the straight-line rent expense noted above. This results in some variability in occupancy
expense as a percentage of revenues over the term of the lease in restaurants where we pay contingent rent.
Management makes judgments regarding the probable term for each restaurant property lease, which can impact
the classification and accounting for a lease as capital or operating, the rent holiday and/or escalations in
payments that are taken into consideration when calculating straight-line rent and the term over which leasehold
improvements for each restaurant are amortized. These judgments may produce materially different amounts of
depreciation, amortization and rent expense than would be reported if different assumed lease terms were used.
Stock-Based Compensation
We have two stock-based compensation plans—the 2005 Equity Incentive Plan and the 1996 Stock Option
Plan—under which we may issue shares of our common stock to employees, officers, directors and consultants.
Upon effectiveness of the 2005 Equity Incentive Plan, the 1996 Stock Option Plan was closed for purposes of
new grants. Both of these plans have been approved by our shareholders.
Prior to January 4, 2006, we accounted for those plans under the recognition and measurement provisions of APB
Opinion No. 25, Accounting for Stock Issued to Employees, and related Interpretations, as permitted by FASB
Statement No. 123, Accounting for Stock-Based Compensation (Statement No. 123). No stock-based employee
compensation cost was recognized in our Statement of Income for fiscal years 2005, 2004, 2003 and 2002 as all
options granted under our plans had an exercise price equal to the market value of the underlying common stock
on the date of grant. Effective January 4, 2006, we adopted the fair value recognition provisions of FASB
Statement No. 123(R), Share-Based Payment (Statement No. 123(R)), using the modified-prospective-transition
method. Under that transition method, compensation cost recognized in fiscal 2006 includes; (a) compensation
cost for all share-based payments granted prior to, but not yet vested as of January 4, 2006, based on the grant
date fair value estimated in accordance with the original provisions of Statement No. 123, and (b) compensation
cost for all share-based payments granted subsequent to January 4, 2006, based on the grant date fair value
estimated in accordance with the provisions of Statement No. 123(R). Results for prior periods have not been
restated.
Statement No 123(R) requires us to make certain assumptions and judgments regarding the grant date fair value.
These judgments include expected volatility, risk free interest rate, expected option life, dividend yield and
vesting percentage. These estimations and judgments are determined by us using many different variables that, in
many cases, are outside of our control. The changes in these variables or trends, including stock price volatility
and risk free interest rate, may significantly impact the grant date fair value resulting in a significant impact to
our financial results.
Prior to the adoption of Statement No. 123(R), we presented all tax benefits of deductions resulting from the
exercise of stock options as operating cash flows in our Statement of Cash Flows. Statement No. 123(R) requires
the cash flows resulting from the tax benefits resulting from tax deductions in excess of the compensation cost
recognized for those options (excess tax benefits) to be classified as financing cash flows.
34
IMPACT OF RECENT ACCOUNTING PRONOUNCEMENTS
In September 2006, the FASB issued Statement No. 157, Fair Value Measurements, which defines fair value, the
methods used to measure fair value, and expands disclosures about fair value measurements. This Statement
applies to accounting pronouncements that require or permit fair value measurements. The adoption of this
Statement will be effective for financial statements issued for fiscal years beginning after November 15, 2007,
and interim periods within those fiscal years. We do not expect that the adoption of this Statement will have a
material impact on our financial statements.
In September 2006, the FASB issued Statement No. 158, Employers’ Accounting for Defined Benefit Pension
and Other Postretirement Plans. This Statement requires companies to recognize a net liability or asset and an
offsetting adjustment to accumulated other comprehensive income to report the funded status of defined benefit
pension and other postretirement benefit plans. The Statement requires prospective application, and the
recognition and disclosure requirements are effective for companies with fiscal years ending after December 15,
2006. Additionally, Statement No. 158 requires companies to measure plan assets and obligations at their
year-end balance sheet date. This requirement is effective for fiscal years ending after December 15, 2008. We
do not expect the impact of this Statement to have a material effect on our consolidated financial statements.
In September 2006, the SEC issued Staff Accounting Bulletin No. 108 (SAB 108), Considering the Effects of
Prior Year Misstatements when Quantifying Misstatements in Current Year Financial Statements, which
provides interpretive guidance regarding the consideration given to prior year misstatements when determining
materiality in current year financial statements. SAB 108 is effective for fiscal years ending after November 15,
2006 and had no impact on our consolidated financial statements.
In July 2006, the FASB issued FASB Interpretation No. 48 (FIN 48), Accounting for Uncertainty in Income
Taxes, an interpretation of FASB Statement No. 109, Accounting for Income Taxes, which is effective for fiscal
years beginning after December 15, 2006, and clarifies the accounting for uncertainty in tax positions. FIN 48
requires that we recognize the impact of a tax position in our financial statements if that position is more likely
than not of being sustained on audit, based on the technical merits of the position. The cumulative effect of the
change in accounting principle is recorded as an adjustment to opening retained earnings. We are currently
evaluating the impact of the adoption of FIN 48 on our financial statements.
In March 2006, the Emerging Issues Task Force (EITF) issued EITF Issue 06-03, How Taxes Collected from
Customers and Remitted to Governmental Authorities Should Be Presented in the Income Statement (That Is,
Gross versus Net Presentation). A consensus was reached that entities may adopt a policy of presenting sales
taxes in the income statement on either a gross or net basis. If taxes are significant, an entity should disclose its
policy of presenting taxes and the amounts of taxes. The guidance is effective for periods beginning after
December 15, 2006. We present revenues net of sales taxes. This issue will not impact the method for presenting
these sales taxes in our consolidated financial statements.
35
CONTRACTUAL OBLIGATIONS
The following table summarizes our future estimated cash payments under existing contractual obligations as of
January 2, 2007, including estimated cash payments due by period (in thousands).
Payments Due by Period
Less Than
1 Year
2-3 Years
4-5 Years
Total
After 5
Years
Contractual Obligations
Operating Leases (1) . . . . . . . . .
Purchase Obligations (2) . . . . . .
$145,290
8,833
$10,409
1,544
$21,224
2,971
$19,437
3,151
$94,220
1,167
Total . . . . . . . . . . . . . . . . . . . . .
$154,123
$11,953
$24,195
$22,588
$95,387
Other Commercial
Commitments
Standby Letters of Credit . . . . .
$
2,270
$ 2,270
$
—
$
—
$
—
$
2,270
$ 2,270
$
—
$
—
$
—
(1) For more detailed description of our operating leases, refer to note 5 in the accompanying Consolidated
Financial Statements.
(2) Amounts represent non-cancelable commitments for the purchase of goods and other services.
Additionally, we have entered into lease agreements related to future restaurants with commencement dates
subsequent to January 2, 2007. Our aggregate future commitment relating to these leases is $13.0 million and is
not included in operating leases above.
ITEM 7A.
QUANTITATIVE AND QUALITATIVE DISCLOSURES ABOUT MARKET RISK
Our market risk exposures are related to cash and cash equivalents and investments. We invest our excess cash in
highly liquid short-term investments with maturities of less than twelve months as of the date of purchase. These
investments are not held for trading or other speculative purposes. Changes in interest rates affect the investment
income we earn on our investments and, therefore, impact our cash flows and results of operations. For the 52
weeks ended January 2, 2007, the average interest rate earned on cash and cash equivalents and investments was
approximately 4.6%. As of January 2, 2007, our investment portfolio consisted primarily of fixed income
securities, excluding those classified as cash and cash equivalents, of approximately $32.9 million. Currently, the
carrying amount of these securities approximates fair market value. However, the fair market value of these
securities is subject to interest rate risk and would decline in value if market interest rates increased. If market
interest rates were to increase immediately and uniformly by 10% from the levels existing as of January 2, 2007,
the decline in the fair value of the portfolio would not be material to our financial position, results of operations
and cash flows. However, if interest rates decreased and securities within our portfolio matured and were
re-invested in securities with lower interest rates, interest income would decrease in the future.
We purchase food and other commodities for use in our operations, based upon market prices established with
our suppliers. Many of the commodities purchased by us can be subject to volatility due to market supply and
demand factors outside of our control. To manage this risk in part, we attempt to enter into fixed price purchase
commitments, with terms typically up to one year, for many of our commodity requirements. Dairy costs can also
fluctuate due to government regulation. We believe that substantially all of our food and supplies are available
from several sources, which helps to diversify our overall commodity cost risk. We also believe that we have the
ability to increase certain menu prices, or vary certain menu items offered, in response to food commodity price
increases. Some of our commodity purchase arrangements may contain contractual features that limit the price
paid by establishing certain price floors or caps. The Company does not use financial instruments to hedge
commodity prices, since our purchase arrangements with suppliers, to the extent that we can enter into such
arrangements, help control the ultimate cost that we pay.
36
ITEM 8. FINANCIAL STATEMENTS AND SUPPLEMENTARY DATA
See the Financial Statements and other data attached hereto beginning on page F-1 of this report.
ITEM 9. CHANGES IN AND DISAGREEMENTS WITH ACCOUNTANTS ON ACCOUNTING AND
FINANCIAL DISCLOSURE
None.
ITEM 9A. CONTROLS AND PROCEDURES
Evaluation of Disclosure Controls and Procedures
Under the supervision and with the participation of our management, including the Chief Executive Officer and
Chief Financial Officer, we have evaluated the effectiveness of our disclosure controls and procedures pursuant
to Rules 13a-15 and 15d-15 promulgated under the Securities Exchange Act of 1934 as amended, as of the end of
the period covered by this report. Based on that evaluation, the Chief Executive Officer and Chief Financial
Officer have concluded that these disclosure controls and procedures are effective.
Changes in Internal Control over Financial Reporting
There has not been any change in our internal control over financial reporting (as such term is defined in Rules
13a-15(f) and 15d-15(f) under the Exchange Act) during our fourth fiscal quarter that has materially affected, or
is reasonably likely to materially affect, our internal control over financial reporting.
Management’s Report on Internal Control Over Financial Reporting
Our management is responsible for establishing and maintaining adequate internal control over financial
reporting, as such term is defined in Exchange Act Rules 13a-15(f) and 15d-15(f). Under the supervision and
with the participation of our management, including our Chief Executive Officer and Chief Financial Officer, we
conducted an evaluation of the effectiveness of our internal control over financial reporting as of January 2, 2007
based on the framework in Internal Control—Integrated Framework issued by the Committee of Sponsoring
Organizations of the Treadway Commission (COSO). Based on that evaluation, our management concluded that
our internal control over financial reporting was effective as of January 2, 2007.
Management’s assessment of the effectiveness of our internal control over financial reporting as of January 2,
2007 has been audited by Ernst & Young LLP, an independent registered public accounting firm, as stated in
their report which is included as part of Item 9A of this annual report.
37
Report of Independent Registered Public Accounting Firm
To the Board of Directors and Shareholders
BJ’s Restaurants, Inc.
We have audited management’s assessment, included in the accompanying Management’s Report on Internal
Control Over Financial Reporting, that BJ’s Restaurants, Inc. maintained effective internal control over financial
reporting as of January 2, 2007, based on criteria established in Internal Control—Integrated Framework issued
by the Committee of Sponsoring Organizations of the Treadway Commission (the COSO criteria). BJ’s
Restaurants, Inc.’s management is responsible for maintaining effective internal control over financial reporting
and for its assessment of the effectiveness of internal control over financial reporting. Our responsibility is to
express an opinion on management’s assessment and an opinion on the effectiveness of the company’s internal
control over financial reporting based on our audit.
We conducted our audit in accordance with the standards of the Public Company Accounting Oversight Board
(United States). Those standards require that we plan and perform the audit to obtain reasonable assurance about
whether effective internal control over financial reporting was maintained in all material respects. Our audit
included obtaining an understanding of internal control over financial reporting, evaluating management’s
assessment, testing and evaluating the design and operating effectiveness of internal control, and performing such
other procedures as we considered necessary in the circumstances. We believe that our audit provides a
reasonable basis for our opinion.
A company’s internal control over financial reporting is a process designed to provide reasonable assurance
regarding the reliability of financial reporting and the preparation of financial statements for external purposes in
accordance with generally accepted accounting principles. A company’s internal control over financial reporting
includes those policies and procedures that (1) pertain to the maintenance of records that, in reasonable detail,
accurately and fairly reflect the transactions and dispositions of the assets of the company; (2) provide reasonable
assurance that transactions are recorded as necessary to permit preparation of financial statements in accordance
with generally accepted accounting principles, and that receipts and expenditures of the company are being made
only in accordance with authorizations of management and directors of the company; and (3) provide reasonable
assurance regarding prevention or timely detection of unauthorized acquisition, use, or disposition of the
company’s assets that could have a material effect on the financial statements.
Because of its inherent limitations, internal control over financial reporting may not prevent or detect
misstatements. Also, projections of any evaluation of effectiveness to future periods are subject to the risk that
controls may become inadequate because of changes in conditions, or that the degree of compliance with the
policies or procedures may deteriorate.
In our opinion, management’s assessment that BJ’s Restaurants, Inc. maintained effective internal control over
financial reporting as of January 2, 2007, is fairly stated, in all material respects, based on the COSO criteria.
Also, in our opinion, BJ’s Restaurants, Inc. maintained, in all material respects, effective internal control over
financial reporting as of January 2, 2007, based on the COSO criteria.
We also have audited, in accordance with the standards of the Public Company Accounting Oversight Board
(United States), the consolidated balance sheets of BJ’s Restaurants, Inc. as of January 2, 2007 and January 3,
2006, and the related consolidated statements of income, shareholders’ equity, and cash flows for each of the
three years in the period ended January 2, 2007 of BJ’s Restaurants, Inc. and our report dated March 8, 2007
expressed an unqualified opinion thereon.
/s/
Irvine, California
March 8, 2007
38
Ernst & Young LLP
Inherent Limitations on Effectiveness of Controls
Our management, including the CEO and CFO, does not expect that our disclosure controls or our internal
control over financial reporting will prevent or detect all error and all fraud. A control system, no matter how
well designed and operated, can provide only reasonable, not absolute, assurance that the control system’s
objectives will be met. The design of a control system must reflect the fact that there are resource constraints, and
the benefits of controls must be considered relative to their costs. Further, because of the inherent limitations in
all control systems, no evaluation of controls can provide absolute assurance that misstatements due to error or
fraud will not occur or that all control issues and instances of fraud, if any, within the company have been
detected. These inherent limitations include the realities that judgments in decision-making can be faulty and that
breakdowns can occur because of simple error or mistake. Controls can also be circumvented by the individual
acts of some persons, by collusion of two or more people, or by management override of the controls. The design
of any system of controls is based in part on certain assumptions about the likelihood of future events, and there
can be no assurance that any design will succeed in achieving its stated goals under all potential future
conditions. Projections of any evaluation of controls effectiveness to future periods are subject to risks. Over
time, controls may become inadequate because of changes in conditions or deterioration in the degree of
compliance with policies or procedures.
ITEM 9B. OTHER INFORMATION
None.
39
PART III
ITEM 10.
DIRECTORS, EXECUTIVE OFFICERS AND CORPORATE GOVERNANCE
We have adopted a Code of Business Ethics and a Code of Business Conduct to promote honest and ethical
conduct of our business, professional and personal relationships. The Code of Business Ethics covers all
executives, including our principal executive officer and principal financial and accounting officer. The Code of
Business Conduct is applicable to all directors, executives and other employees. A copy of both the Code of
Business Ethics and Code of Business Conduct is available on our website (www.bjsrestaurants.com). The
Company intends to post amendments to or waivers from its Code of Business Ethics and Code of Business
Conduct at this website location.
Information with respect to our executive officers is included in Part I, Item 1 of this report. Other information
required by this item is hereby incorporated by reference to the information contained in the Proxy Statement
relating to the Annual Meeting of Shareholders, which we expect to be filed with the Securities and Exchange
Commission no later than 120 days after the close of the year ended January 2, 2007.
ITEM 11.
EXECUTIVE COMPENSATION
The information required by this Item is incorporated herein by reference to the information contained in the
Proxy Statement relating to the Annual Meeting of Shareholders, which we expect to file with the Securities and
Exchange Commission no later than 120 days after the close of the year ended January 2, 2007.
ITEM 12.
SECURITY OWNERSHIP OF CERTAIN BENEFICIAL OWNERS AND MANAGEMENT
AND RELATED STOCKHOLDER MATTERS
The information required by this Item is incorporated herein by reference to the information contained in the
Proxy Statement relating to the Annual Meeting of Shareholders, which we expect to file with the Securities and
Exchange Commission no later than 120 days after the close of the year ended January 2, 2007.
ITEM 13.
CERTAIN RELATIONSHIPS AND RELATED TRANSACTIONS AND DIRECTOR
INDEPENDENCE
The information required by this Item is incorporated herein by reference to the information contained in the
Proxy Statement relating to the Annual Meeting of Shareholders, which we expect to file with the Securities and
Exchange Commission no later than 120 days after the close of the year ended January 2, 2007.
See Part II, Item 5—“Market for Registrant’s Common Equity, Related Stockholder Matters, and Issuer
Purchases of Equity Securities—Equity Compensation Plan Information” for certain information regarding our
equity compensation plans.
ITEM 14.
PRINCIPAL ACCOUNTING FEES AND SERVICES
The information required by this Item is incorporated herein by reference to the information contained in the
Proxy Statement relating to the Annual Meeting of Shareholders, which we expect to file with the Securities and
Exchange Commission no later than 120 days after the close of the year ended January 2, 2007.
40
PART IV
ITEM 15.
EXHIBITS, FINANCIAL STATEMENT SCHEDULES
(a) (1) CONSOLIDATED FINANCIAL STATEMENTS
The following documents are contained in Part II, Item 8 of this Annual Report on Form 10-K:
Report of Independent Registered Public Accounting Firm.
Consolidated Balance Sheets at January 2, 2007 and January 3, 2006.
Consolidated Statements of Income for each of the three fiscal years in the period ended January 2, 2007.
Consolidated Statements of Shareholders’ Equity for each of the three fiscal years in the period ended January 2,
2007.
Consolidated Statements of Cash Flows for each of the three fiscal years in the period ended January 2, 2007.
Notes to the Consolidated Financial Statements.
(2) FINANCIAL STATEMENT SCHEDULES
All schedules are omitted because they are not applicable or the required information is shown in the
Consolidated Financial Statements or notes thereto.
(3) EXHIBITS
Exhibit
Number
Description
3.1
Amended and Restated Articles of Incorporation of the Company, as amended, incorporated by
reference to Exhibit 3.1 to the Registration Statement on Form SB-2 filed with the Securities and
Exchange Commission on June 28, 1996, as amended by the Company’s Registration Statement on
Form SB-2/A filed with the Commission on August 1, 1996 and the Company’s Registration Statement
on Form SB-2A filed with the Commission on August 22, 1996 (File No. 3335182-LA) (as amended,
the “Registration Statement”).
3.2
Bylaws of the Company, incorporated by reference to Exhibits 3.2 of the Registration Statement.
3.3
Certificate of amendment of Articles of Incorporation incorporated by reference to Exhibit 3.3 of the
2004 Annual Report.
3.4
Amendment to Bylaws of the Company, incorporated by reference to Exhibit 3.4 of the 2004 Annual
Report.
4.1
Specimen Common Stock Certificate of the Company, incorporated by reference to Exhibit 4.1 of the
Registration Statement.
4.2
Form of Securities Purchase Agreement, dated November 16, 2006, incorporated by reference to
Exhibit 4.1 to the Form 8-K filed November 17, 2006.
4.3
Form of Registration Rights Agreement, dated November 16, 2006, incorporated by reference to
Exhibit 4.2 to the Form 8-K filed November 17, 2006.
10.1**
Summary of Compensation for Non-Employee Directors, incorporated by reference to the description
contained in Item 1.01 of the Form 8-K filed on July 14, 2006.
41
Exhibit
Number
Description
10.2
Loan Agreement, dated December 15, 2005, between the Company and Union Bank of California,
N.A., incorporated by reference to Exhibit 10.2 of the Company’s Form 10-K for the year ended
January 3, 2006
10.3**
Form of Indemnification Agreement with Officers and Directors, incorporated by reference to
Exhibit 10.6 of the Registration Statement.
10.4**
BJ’s Restaurants, Inc. Amended and Restated 1996 Stock Option Plan, incorporated by reference to
Exhibit 10.4 of the 2004 Annual Report.
10.5**
BJ’s Restaurants, Inc. 2005 Equity Incentive Plan, incorporated by reference to Exhibit 10.1 of the
Form 8-K filed June 17, 2005.
10.6**
Stock Option Agreement for Executive Officers and Employees under the 2005 Equity Incentive Plan,
incorporated by reference to Exhibit 10.3 of the Form 8-K filed July 1, 2005.
10.7**
Executive Officers and Employee Grant Notice under the 2005 Equity Incentive Plan, incorporated by
reference to Exhibit 10.4 of the Form 8-K filed July 1, 2005.
10.8**
Stock Option Agreement for Non-Employee Directors under the 2005 Equity Incentive Plan,
incorporated by reference to Exhibit 10.8 of the Company’s Form 10-K for the year ended January 3,
2006.
10.9**
Non-Employee Director Grant Notice under the 2005 Equity Incentive Plan, incorporated by reference
to Exhibit 10.9 of the Company’s Form 10-K for the year ended January 3, 2006.
10.10**
Amended and Restated Employment Agreement dated June 27, 2005 between the Company and Paul
A. Motenko, employed as Co-Chairman of the Board of Directors, Secretary & Vice President,
incorporated by reference to Exhibit 10.1 of the Form 8-K filed on July 1, 2005.
10.11**
Amended and Restated Employment Agreement dated June 27, 2005 between the Company and
Jeremiah J. Hennessy, employed as Co-Chairman of the Board of Directors, incorporated by reference
to Exhibit 10.2 of the Form 8-K filed on July 1, 2005
10.12**
Option Agreement dated December 20, 2000 between the Company and Paul A. Motenko to purchase
shares of the Company’s common stock, incorporated by reference to Exhibit 10.15 of the 2000
Annual Report.
10.13**
Option Agreement dated December 20, 2000 between the Company and Jeremiah J. Hennessy to
purchase shares of the Company’s common stock, incorporated by reference to Exhibit 10.16 of the
2000 Annual Report.
10.16**
Employment Agreement dated September 6, 2005 between the Company and Gregory S. Levin,
employed as Chief Financial Officer, incorporated by reference to Exhibit 10.1 of the Form 10-Q filed
on November 3, 2005.
10.17**
Form Restricted Stock Unit Agreement under the 2005 Equity Incentive Plan.
10.18**
Employment Agreement between the Company and Tom Norton, incorporated by reference to
Exhibit 10.1 of the Form 8-k filed on September 12, 2006
10.19**
Form of Employee Non-Qualified Stock Option Agreement under the 2005 Equity Incentive Plan,
incorporated by reference to Exhibit 10.1 to the Form 10-Q filed on October 31, 2006
10.20**
Summary of BJ’s Restaurants, Inc. Performance Incentive Plan.
42
Exhibit
Number
Description
10.24**
Employment Agreement dated January 12, 2005 between the Company and Gerald (Jerry) W.
Deitchle, employed as Chief Executive Officer, incorporated by reference to Exhibit 10.28 of the 2004
Annual Report.
10.25**
Employment Agreement dated August 10, 2005 between the Company and John D. Allegretto,
employed as Chief Supply Chain Officer, incorporated by reference to Exhibit 10.2 of the Form 10-Q
filed on November 3, 2005.
21
List of Subsidiaries
23.1
Consent of Independent Registered Public Accounting Firm.
31
Section 302 Certifications of Co-Chairman of the Board, Chief Executive Officer and Chief Financial
Officer.
32
Section 906 Certification of Co-Chairman of the Board, Chief Executive Officer and Chief Financial
Officer.
**
Management contracts or compensation plans or arrangements in which directors or executive officers are
eligible to participate.
43
SIGNATURES
Pursuant to the requirements of Section 13 or 15(d) of the Securities Exchange Act of 1934, the Registrant has
duly caused this report to be signed on our behalf by the undersigned, thereunto duly authorized.
BJ’S RESTAURANTS, INC.
By:
/s/
PAUL A. MOTENKO
Paul A. Motenko,
Co-Chairman of the Board, Vice President and Secretary
March 12, 2007
Pursuant to the requirements of the Securities and Exchange Act of 1934, this Report has been signed below by
the following persons on behalf of the Registrant and in the capacities and on the dates indicated.
Signature
By:
By:
/s/
/s/
PAUL A. MOTENKO
Capacity
Date
Co-Chairman of the Board of Directors,
Vice President and Secretary
March 12, 2007
Paul A. Motenko
JEREMIAH J. HENNESSY
Co-Chairman of the Board of Directors
March 12, 2007
Chief Executive Officer, President and
Director
March 12, 2007
Chief Financial Officer
March 12, 2007
Director
March 12, 2007
Director
March 12, 2007
Director
March 12, 2007
Director
March 12, 2007
Director
March 12, 2007
Director
March 12, 2007
Jeremiah J. Hennessy
By:
/s/
GERALD W. DEITCHLE
Gerald W. Deitchle
By:
/s/
GREGORY S. LEVIN
Gregory S. Levin
By:
/s/
PETER A. BASSI
Peter A. Bassi
By:
/s/
LARRY D. BOUTS
Larry D. Bouts
By:
/s/
SHANN M. BRASSFIELD
Shann M. Brassfield
By:
/s/
JAMES A. DAL POZZO
James A. Dal Pozzo
By:
/s/
JOHN F. GRUNDHOFER
John F. Grundhofer
By:
/s/
J. ROGER KING
J. Roger King
44
BJ’S RESTAURANTS, INC.
INDEX TO CONSOLIDATED FINANCIAL STATEMENTS
Page
Report of Independent Registered Public Accounting Firm . . . . . . . . . . . . . . . . . . . . . . . . . . . . . . . . . . . . . .
Consolidated Balance Sheets at January 2, 2007 and January 3, 2006 . . . . . . . . . . . . . . . . . . . . . . . . . . . . . .
Consolidated Statements of Income for Each of the Three Fiscal Years in the Period Ended January 2,
2007 . . . . . . . . . . . . . . . . . . . . . . . . . . . . . . . . . . . . . . . . . . . . . . . . . . . . . . . . . . . . . . . . . . . . . . . . . . . . . . .
Consolidated Statements of Shareholders’ Equity for Each of the Three Fiscal Years in the Period Ended
January 2, 2007 . . . . . . . . . . . . . . . . . . . . . . . . . . . . . . . . . . . . . . . . . . . . . . . . . . . . . . . . . . . . . . . . . . . . . .
Consolidated Statements of Cash Flows for Each of the Three Fiscal Years in the Period Ended January 2,
2007 . . . . . . . . . . . . . . . . . . . . . . . . . . . . . . . . . . . . . . . . . . . . . . . . . . . . . . . . . . . . . . . . . . . . . . . . . . . . . . .
Notes to Consolidated Financial Statements . . . . . . . . . . . . . . . . . . . . . . . . . . . . . . . . . . . . . . . . . . . . . . . . . .
45
F-1
F-2
F-3
F-4
F-5
F-6
REPORT OF INDEPENDENT REGISTERED PUBLIC ACCOUNTING FIRM
The Board of Directors and Shareholders
BJ’s Restaurants, Inc.
We have audited the accompanying consolidated balance sheets of BJ’s Restaurants, Inc. as of January 2, 2007
and January 3, 2006, and the related consolidated statements of income, shareholders’ equity and cash flows for
each of the three years in the period ended January 2, 2007. These financial statements are the responsibility of
the Company’s management. Our responsibility is to express an opinion on these financial statements based on
our audits.
We conducted our audits in accordance with the standards of the Public Company Accounting Oversight Board
(United States). Those standards require that we plan and perform the audit to obtain reasonable assurance about
whether the financial statements are free of material misstatement. An audit includes examining, on a test basis,
evidence supporting the amounts and disclosures in the financial statements. An audit also includes assessing the
accounting principles used and significant estimates made by management, as well as evaluating the overall
financial statement presentation. We believe that our audits provide a reasonable basis for our opinion.
In our opinion, the financial statements referred to above present fairly, in all material respects, the consolidated
financial position of BJ’s Restaurants, Inc. at January 2, 2007 and January 3, 2006, and the consolidated results
of its operations and its cash flows for each of the three years in the period ended January 2, 2007, in conformity
with U.S. generally accepted accounting principles.
We also have audited, in accordance with the standards of the Public Company Accounting Oversight Board
(United States), the effectiveness of BJ’s Restaurants, Inc. internal control over financial reporting as of
January 2, 2007, based on criteria established in Internal Control-Integrated Framework issued by the
Committee of Sponsoring Organizations of the Treadway Commission and our report dated March 8, 2007
expressed an unqualified opinion thereon.
As discussed in Note 1 to the consolidated financial statements, effective January 4, 2006, the Company adopted
the provisions of Statement of Financial Accounting Standards (SFAS) No. 123R, Share-Based Payments.
/s/
Irvine, California
March 8, 2007
F-1
Ernst & Young LLP
BJ’S RESTAURANTS, INC.
CONSOLIDATED BALANCE SHEETS
(In thousands)
January 2,
2007
January 3,
2006
ASSETS
Current assets:
Cash and cash equivalents . . . . . . . . . . . . . . . . . . . . . . . . . . . . . . . . . . . . . . . . . . . . . . .
Investments . . . . . . . . . . . . . . . . . . . . . . . . . . . . . . . . . . . . . . . . . . . . . . . . . . . . . . . . . .
Accounts and other receivables . . . . . . . . . . . . . . . . . . . . . . . . . . . . . . . . . . . . . . . . . . .
Inventories . . . . . . . . . . . . . . . . . . . . . . . . . . . . . . . . . . . . . . . . . . . . . . . . . . . . . . . . . . .
Prepaids and other current assets . . . . . . . . . . . . . . . . . . . . . . . . . . . . . . . . . . . . . . . . .
Deferred income taxes . . . . . . . . . . . . . . . . . . . . . . . . . . . . . . . . . . . . . . . . . . . . . . . . . .
$ 51,758
32,895
2,368
2,059
2,710
3,758
$
Total current assets . . . . . . . . . . . . . . . . . . . . . . . . . . . . . . . . . . . . . . . . . . . . . . . . . . . . . . . .
95,548
58,231
Property and equipment, net . . . . . . . . . . . . . . . . . . . . . . . . . . . . . . . . . . . . . . . . . . . . . . . . .
Goodwill . . . . . . . . . . . . . . . . . . . . . . . . . . . . . . . . . . . . . . . . . . . . . . . . . . . . . . . . . . . . . . . .
Notes receivable . . . . . . . . . . . . . . . . . . . . . . . . . . . . . . . . . . . . . . . . . . . . . . . . . . . . . . . . . .
Other assets, net . . . . . . . . . . . . . . . . . . . . . . . . . . . . . . . . . . . . . . . . . . . . . . . . . . . . . . . . . . .
148,395
4,673
786
447
99,773
4,673
853
428
Total assets . . . . . . . . . . . . . . . . . . . . . . . . . . . . . . . . . . . . . . . . . . . . . . . . . . . . . . . . . . . . . .
$249,849
$163,958
LIABILITIES AND SHAREHOLDERS’ EQUITY
Current liabilities:
Accounts payable . . . . . . . . . . . . . . . . . . . . . . . . . . . . . . . . . . . . . . . . . . . . . . . . . . . . .
Accrued expenses . . . . . . . . . . . . . . . . . . . . . . . . . . . . . . . . . . . . . . . . . . . . . . . . . . . . .
$ 11,946
24,481
$
Total current liabilities . . . . . . . . . . . . . . . . . . . . . . . . . . . . . . . . . . . . . . . . . . . . . . . . . . . . .
36,427
26,405
Deferred income taxes . . . . . . . . . . . . . . . . . . . . . . . . . . . . . . . . . . . . . . . . . . . . . . . . . . . . . .
Other liabilities . . . . . . . . . . . . . . . . . . . . . . . . . . . . . . . . . . . . . . . . . . . . . . . . . . . . . . . . . . .
2,399
8,161
1,961
5,693
Total liabilities . . . . . . . . . . . . . . . . . . . . . . . . . . . . . . . . . . . . . . . . . . . . . . . . . . . . . . . . . . .
Commitments and contingencies (Note 4)
Shareholders’ equity:
Preferred stock, 5,000 shares authorized, none issued or outstanding . . . . . . . . . . . . .
Common stock, no par value, 60,000 shares authorized and 26,061 and 22,742
shares issued and outstanding as of January 2, 2007 and January 3, 2006,
respectively . . . . . . . . . . . . . . . . . . . . . . . . . . . . . . . . . . . . . . . . . . . . . . . . . . . . . . . .
Capital surplus . . . . . . . . . . . . . . . . . . . . . . . . . . . . . . . . . . . . . . . . . . . . . . . . . . . . . . . . . . . .
Retained earnings . . . . . . . . . . . . . . . . . . . . . . . . . . . . . . . . . . . . . . . . . . . . . . . . . . . . . . . . .
46,987
34,059
164,592
7,380
30,890
105,295
3,559
21,045
Total shareholders’ equity . . . . . . . . . . . . . . . . . . . . . . . . . . . . . . . . . . . . . . . . . . . . . . . . . . .
202,862
129,899
Total liabilities and shareholders’ equity . . . . . . . . . . . . . . . . . . . . . . . . . . . . . . . . . . . . . . .
$249,849
$163,958
—
The accompanying notes are an integral part of these consolidated financial statements.
F-2
8,144
41,703
2,377
1,723
1,897
2,387
8,337
18,068
—
BJ’S RESTAURANTS, INC.
CONSOLIDATED STATEMENTS OF INCOME
(In thousands, except per share data)
2006
Revenues . . . . . . . . . . . . . . . . . . . . . . . . . . . . . . . . . . . . . . . . . . . . . . . . . . . . . . $238,928
Costs and expenses:
Cost of sales . . . . . . . . . . . . . . . . . . . . . . . . . . . . . . . . . . . . . . . . . . . .
61,420
Labor and benefits . . . . . . . . . . . . . . . . . . . . . . . . . . . . . . . . . . . . . . .
83,292
Occupancy & operating expenses . . . . . . . . . . . . . . . . . . . . . . . . . . .
46,198
General and administrative . . . . . . . . . . . . . . . . . . . . . . . . . . . . . . . .
19,832
Depreciation and amortization . . . . . . . . . . . . . . . . . . . . . . . . . . . . . .
9,983
Restaurant opening expense . . . . . . . . . . . . . . . . . . . . . . . . . . . . . . . .
5,253
Gain from sale of Pietro’s restaurants . . . . . . . . . . . . . . . . . . . . . . . .
—
Fiscal Year
2005
2004
$178,210
$129,049
45,458
63,867
33,987
13,290
6,984
3,520
—
32,193
45,775
25,242
11,365
5,249
2,918
(1,658)
Total costs and expenses . . . . . . . . . . . . . . . . . . . . . . . . . . . . . . . . . . . . . . . . . .
225,978
167,106
121,084
Income from operations . . . . . . . . . . . . . . . . . . . . . . . . . . . . . . . . . . . . . . .
12,950
11,104
7,965
Other income:
Interest income, net . . . . . . . . . . . . . . . . . . . . . . . . . . . . . . . . . . . . . . . . . . . . . .
Other income (expense), net . . . . . . . . . . . . . . . . . . . . . . . . . . . . . . . . . . . . . . . .
1,690
39
1,119
149
421
165
Total other income . . . . . . . . . . . . . . . . . . . . . . . . . . . . . . . . . . . . . . . . . . . . . . .
1,729
1,268
586
Income before income taxes . . . . . . . . . . . . . . . . . . . . . . . . . . . . . . . . . . . .
Income tax expense . . . . . . . . . . . . . . . . . . . . . . . . . . . . . . . . . . . . . . . . . . . . . .
14,679
4,834
12,372
4,021
8,551
2,286
Net income . . . . . . . . . . . . . . . . . . . . . . . . . . . . . . . . . . . . . . . . . . . . . . . . . . . . .
$
9,845
$
8,351
$
6,265
Net income per share:
Basic . . . . . . . . . . . . . . . . . . . . . . . . . . . . . . . . . . . . . . . . . . . . . . . . . . . . . . . . . .
$
0.42
$
0.38
$
0.32
Diluted . . . . . . . . . . . . . . . . . . . . . . . . . . . . . . . . . . . . . . . . . . . . . . . . . . . . . . . .
$
0.41
$
0.36
$
0.30
Weighted average number of shares outstanding:
Basic . . . . . . . . . . . . . . . . . . . . . . . . . . . . . . . . . . . . . . . . . . . . . . . . . . . . . . . . . .
23,287
22,134
19,498
Diluted . . . . . . . . . . . . . . . . . . . . . . . . . . . . . . . . . . . . . . . . . . . . . . . . . . . . . . . .
24,131
23,381
20,570
The accompanying notes are an integral part of these consolidated financial statements.
F-3
BJ’S RESTAURANTS, INC.
CONSOLIDATED STATEMENTS OF SHAREHOLDERS’ EQUITY
(In thousands)
Common Stock
Shares
Amount
Capital
Surplus
Retained
Earnings
Total
Balance, December 28, 2003 . . . . . . . . . . . . . . . . . . . . . . . . .
Exercise of stock options, net . . . . . . . . . . . . . . . . . . . . . . . . .
Tax benefit from stock option exercises . . . . . . . . . . . . . . . .
Net income . . . . . . . . . . . . . . . . . . . . . . . . . . . . . . . . . . . . . . .
19,649
164
—
—
$ 62,513
867
—
—
$2,109
—
597
—
$ 6,429
—
—
6,265
$ 71,051
867
597
6,265
Balance, January 2, 2005 . . . . . . . . . . . . . . . . . . . . . . . . . . . .
Exercise of stock options, net . . . . . . . . . . . . . . . . . . . . . . . . .
Sale of common stock, net . . . . . . . . . . . . . . . . . . . . . . . . . . .
Tax benefit from stock option exercises . . . . . . . . . . . . . . . .
Net income . . . . . . . . . . . . . . . . . . . . . . . . . . . . . . . . . . . . . . .
19,813
179
2,750
—
—
63,380
1,621
40,294
—
—
2,706
—
—
853
—
12,694
—
—
—
8,351
78,780
1,621
40,294
853
8,351
Balance, January 3, 2006 . . . . . . . . . . . . . . . . . . . . . . . . . . . . 22,742
Exercise of stock options, net . . . . . . . . . . . . . . . . . . . . . . . . .
244
Stock-based compensation expense . . . . . . . . . . . . . . . . . . . .
—
Tax benefit from stock option exercises . . . . . . . . . . . . . . . .
—
Sale of common stock, net . . . . . . . . . . . . . . . . . . . . . . . . . . .
3,075
Net income . . . . . . . . . . . . . . . . . . . . . . . . . . . . . . . . . . . . . . .
—
105,295
982
—
—
58,315
—
3,559
—
1,951
1,870
21,045
—
—
—
—
9,845
129,899
982
1,951
1,870
58,315
9,845
$164,592
$7,380
$30,890
$202,862
Balance, January 2, 2007 . . . . . . . . . . . . . . . . . . . . . . . . . . . .
26,061
The accompanying notes are an integral part of these consolidated financial statements.
F-4
BJ’S RESTAURANTS, INC.
CONSOLIDATED STATEMENTS OF CASH FLOWS
(In thousands)
2006
Cash flows from operating activities:
Net income . . . . . . . . . . . . . . . . . . . . . . . . . . . . . . . . . . . . . . . . . . . . . . . . . . . . .
Adjustments to reconcile net income to net cash provided by operating
activities:
Depreciation and amortization . . . . . . . . . . . . . . . . . . . . . . . . . . . . . . . . . . . . . .
Deferred income taxes . . . . . . . . . . . . . . . . . . . . . . . . . . . . . . . . . . . . . . . . . . . .
Stock-based compensation expense . . . . . . . . . . . . . . . . . . . . . . . . . . . . . . . . . .
Gain on sale of Pietro’s restaurants . . . . . . . . . . . . . . . . . . . . . . . . . . . . . . . . . .
Changes in assets and liabilities:
Accounts and other receivables . . . . . . . . . . . . . . . . . . . . . . . . . . . . . . . . .
Inventories . . . . . . . . . . . . . . . . . . . . . . . . . . . . . . . . . . . . . . . . . . . . . . . . .
Prepaids and other current assets . . . . . . . . . . . . . . . . . . . . . . . . . . . . . . . .
Other assets, net . . . . . . . . . . . . . . . . . . . . . . . . . . . . . . . . . . . . . . . . . . . . .
Accounts payable . . . . . . . . . . . . . . . . . . . . . . . . . . . . . . . . . . . . . . . . . . . .
Accrued expenses . . . . . . . . . . . . . . . . . . . . . . . . . . . . . . . . . . . . . . . . . . . .
Other liabilities . . . . . . . . . . . . . . . . . . . . . . . . . . . . . . . . . . . . . . . . . . . . . .
Landlord contribution for tenant improvements . . . . . . . . . . . . . . . . . . . .
$ 9,845
Net cash provided by operating activities . . . . . . . . . . . . . . . . . . . . .
Fiscal Year
2005
$
8,351
2004
$ 6,265
9,983
(933)
1,665
—
6,984
(346)
—
—
5,249
952
—
(1,658)
9
(336)
(813)
(23)
3,609
6,413
(759)
3,227
(75)
(429)
1,467
24
2,141
5,662
(699)
4,650
(436)
(335)
(2,200)
18
3,398
3,758
(178)
938
31,887
27,730
15,771
Cash flows from investing activities:
Purchases of property and equipment . . . . . . . . . . . . . . . . . . . . . . . . . . . . . . . .
Proceeds from investments sold . . . . . . . . . . . . . . . . . . . . . . . . . . . . . . . . . . . . .
Purchases of investments . . . . . . . . . . . . . . . . . . . . . . . . . . . . . . . . . . . . . . . . . .
Collection of notes receivable . . . . . . . . . . . . . . . . . . . . . . . . . . . . . . . . . . . . . .
Proceeds from sale of Pietro’s restaurants . . . . . . . . . . . . . . . . . . . . . . . . . . . . .
Net cash used in investing activities . . . . . . . . . . . . . . . . . . . . . . . . .
(58,315)
50,701
(41,893)
67
—
(49,440)
(40,264)
129,316
(155,244)
72
—
(66,120)
(25,758)
31,301
(25,035)
25
1,250
(18,217)
Cash flows from financing activities:
Excess tax benefit from stock-based compensation . . . . . . . . . . . . . . . . . . . . . .
Proceeds from sale of common stock . . . . . . . . . . . . . . . . . . . . . . . . . . . . . . . . .
Proceeds from exercise of stock options . . . . . . . . . . . . . . . . . . . . . . . . . . . . . .
Payments on notes payable to related parties . . . . . . . . . . . . . . . . . . . . . . . . . . .
Net cash provided by financing activities . . . . . . . . . . . . . . . . . . . . .
Net increase (decrease) in cash and cash equivalents . . . . . . . . . . . .
1,870
58,315
982
—
61,167
43,614
853
40,294
1,621
—
42,768
4,378
597
—
867
(151)
1,313
(1,133)
Cash and cash equivalents, beginning of year . . . . . . . . . . . . . . . . . . . . . . . . . .
Cash and cash equivalents, end of year . . . . . . . . . . . . . . . . . . . . . . . . . . . . . . .
8,144
$ 51,758
$
3,766
8,144
Supplemental disclosure of cash flow information:
Cash paid for interest . . . . . . . . . . . . . . . . . . . . . . . . . . . . . . . . . . . . . . . . . . . . .
$
$
—
Cash paid for income taxes . . . . . . . . . . . . . . . . . . . . . . . . . . . . . . . . . . . . . . . .
$ 4,698
$
1,144
—
4,899
$ 3,766
$
$ 2,876
Supplemental disclosure of non-cash financing activity:
For the 52 weeks ended January 2, 2007, $286 stock-based compensation was capitalized related to the
development and construction of our new restaurants in accordance with Statement No. 123(R), Share-Based
Payment.
The accompanying notes are an integral part of these consolidated financial statements.
F-5
2
BJ’S RESTAURANTS, INC.
NOTES TO CONSOLIDATED FINANCIAL STATEMENTS
1. The Company and Summary of Significant Accounting Policies
Description of Business
BJ’s Restaurants, Inc. (the “Company” or “BJ’s”) was incorporated in California on October 1, 1991. The
Company owns and operates 55 restaurants at the end of fiscal 2006, located in California, Oregon, Colorado,
Arizona, Texas and Nevada and licenses one restaurant to another entity in Lahaina, Maui. Each of the
restaurants is operated as a BJ’s Restaurant & Brewery, BJ’s Restaurant & Brewhouse, or BJ’s Pizza & Grill.
During 2006, the Company opened 11 new restaurants. The Company’s BJ’s Restaurants & Brewery locations
manufacture the Company’s signature, proprietary BJ’s beer along with other third party craft brewers for its
restaurants.
In 1996 we purchased 19 restaurants in Oregon and Washington from Pietro’s Corp (Pietro’s) to expand our
presence in the Northwest. Over the next eight years, we closed 13 of the Pietro’s;s restaurants and converted
three restaurants to BJ’s locations. On March 15, 2004, we sold the remaining three Pietro’s restaurants.
Additionally, the Company closed its Seal Beach Pizza & Grill restaurant on January 3. 2005 upon the expiration
of its lease.
Basis of Presentation
The accompanying consolidated financial statements include the accounts of BJ’s Restaurants, Inc. and its
wholly owned subsidiaries. All intercompany transactions and balances have been eliminated in consolidation.
The preparation of financial statements in conformity with U.S. generally accepted accounting principles requires
management to make estimates and assumptions for the reporting period and as of the financial statement date.
These estimates and assumptions affect the reported amounts of assets and liabilities, the disclosure of contingent
assets and liabilities, and the reported amounts of revenues and expenses. Actual results could differ from those
estimates.
To conform to casual dining practices, we reclassified certain non food related items from cost of sales to
operating and occupancy expenses and manager-in-training salaries from restaurant labor to general and
administrative expenses beginning in fiscal year 2005. These reclassifications have been made to the prior years’
financial statements to conform to the current year.
Effective the fiscal third quarter of 2005, the Company changed its fiscal week-end from Sunday to
Tuesday. This change was completed to facilitate operational efficiencies by transferring certain administrative
tasks away from the weekends when its restaurants are busiest. Accordingly, fiscal 2005 contains two additional
days, 366 days, and ended on Tuesday, January 3, 2006 as compared to fiscal 2004, which contained 53 weeks
(371 days), and ended on Sunday, January 2, 2005 and fiscal 2006, which contained 52 weeks (364 days).
Segment Disclosure
Statement of Financial Accounting Standard No. 131, Disclosures about Segments of an Enterprise and Related
Information, established standards for disclosures about products and services, geographic areas and major
customers. We currently operate in one operating segment: the restaurant industry, which includes casual dining
restaurants, some with mircrobreweries which produce and distribute BJ’s critically acclaimed handcrafted beers
throughout all of our restaurants. Additionally, we operate in one geographic area: the United States of America.
F-6
Cash and Cash Equivalents
Cash and cash equivalents consist of highly liquid investments, money market funds and certificates of deposit
with an original maturity of three months or less when purchased. Cash and cash equivalents are stated at cost,
which approximates fair market value.
Investments
All investments are classified as held-to-maturity and are reported at amortized cost and realized gains and losses
are reflected in earnings.
Investments consist of the following (in thousands):
January 2,
2007
January 3,
2006
U.S. and government agency securities . . . . . . . . . . . . . . . . . . . . . . .
U.S. corporate notes and bonds . . . . . . . . . . . . . . . . . . . . . . . . . . . . .
$ 2,466
30,429
$
Total Investments . . . . . . . . . . . . . . . . . . . . . . . . . . . . . . . . . . . . . . . .
$32,895
$41,703
982
40,721
Average maturity for the Company’s total investment portfolio as of the end of fiscal year 2006 and 2005 was
approximately three months. All short term investments are investment grade securities.
Inventories
Inventories are comprised primarily of food and beverage products and are stated at the lower of cost (first-in,
first-out) or market.
Property and Equipment
Property and equipment are recorded at cost and depreciated over their estimated useful lives. Leasehold
improvements are amortized over the estimated useful life of an asset or the primary lease term of the respective
lease including exercised options, whichever is shorter. Renewals and betterments that materially extend the life
of an asset are capitalized while maintenance and repair costs are expensed as incurred. When property and
equipment are sold or otherwise disposed of, the asset account and related accumulated depreciation and
amortization accounts are relieved, and any gain or loss is included in earnings.
Depreciation and amortization are recorded using the straight-line method over the following estimated useful lives:
Furniture and fixtures . . . . . . . . . . . . . . . . . . .
10 years
Equipment . . . . . . . . . . . . . . . . . . . . . . . . . . .
5-10 years
Brewery Equipment . . . . . . . . . . . . . . . . . . . .
20 years
Leasehold improvements . . . . . . . . . . . . . . . . the shorter of the useful life or the lease term
Intangible Assets
Management performs impairment testing annually and more frequently if factors and circumstances indicate an
impairment may have occurred. Intangible assets with finite lives will continue to be amortized over their
estimated useful lives. Management has performed its impairment testing and believes that no impairments
existed as of January 2, 2007.
Included in other assets are trademarks and covenants not to compete. Trademarks are amortized over 10 years
and covenants not to compete are amortized over periods ranging from three to five years.
F-7
Long-Lived Assets
Management reviews the Company’s long-lived assets for impairment whenever events or changes in
circumstances indicate that the carrying amount of an asset may not be recoverable. Management believes that no
impairment of the carrying value of the Company’s long-lived assets existed at January 2, 2007 or January 3,
2006.
Revenue Recognition
Revenues from food and beverage sales at restaurants are recognized when payment is tendered at the point of
sale. Revenues from the sale of gift cards are deferred and recognized upon redemption. Deferred gift card
revenue included in accrued expenses on the accompanying balance sheets was $2.9 million and $1.8 million as
of January 2, 2007 and January 3, 2006, respectively.
Sales Taxes
Revenues are presented net of sales taxes. The obligation is included in other accrued expenses until the taxes are
remitted to the appropriate taxing authorities.
Advertising Costs
Advertising costs are expensed as incurred. Advertising expense for fiscal 2006, 2005, and 2004 was
approximately $1.4 million, $1.1 million and $1.1 million, respectively.
Income Taxes
The Company utilizes the liability method of accounting for income taxes as set forth in Statement of Financial
Accounting Standard (SFAS) No. 109 Accounting for Income Taxes.
Deferred income taxes are recognized based on the tax consequences in future years of differences between the
tax basis of assets and liabilities and their financial reporting amounts at each year-end based on enacted tax laws
and statutory tax rates applicable to the periods in which differences are expected to affect taxable income.
Valuation allowances are established, when necessary, to reduce deferred tax assets to the amount expected to be
realized. The provision for income taxes represents the tax payable for the period and the change during the
period in deferred tax assets and liabilities.
Restaurant Opening Expense
Restaurant payroll, supplies, other start-up costs and rental expense incurred prior to the opening of a new
restaurant are expensed as incurred.
Leases
We lease the majority of our restaurant locations. We account for our leases under the provisions of FASB
Statement No. 13, Accounting for Leases (SFAS 13) which require that our leases be evaluated and classified as
operating or capital leases for financial reporting purposes. The term used for this evaluation includes renewal
option periods only in instances in which the exercise of the renewal option can be reasonably assured and failure
to exercise such option would result in an economic penalty. All of our restaurant leases are classified as
operating leases pursuant to the requirements of SFAS 13. We disburse cash for leasehold improvements,
furniture and fixtures and equipment to build out and equip our leased premises. We may also expend cash for
permanent improvements that we make to leased premises that may be reimbursed to us by our landlords as
construction contributions (also known as tenant improvement allowances) pursuant to agreed-upon terms in our
F-8
leases. Landlord construction contributions can take the form of up-front cash, full or partial credits against
minimum or percentage rents otherwise payable by us or a combination thereof. All tenant improvement
allowances received by us are recorded as a deferred rent obligation and amortized over the term of the lease.
The lease term used for straight-line rent expense is calculated from the date we obtain possession of the leased
premises through the lease termination date. Prior to January 4, 2006, we capitalized rent expense from
possession date through construction completion and reported the related asset in property and equipment.
Capitalized rent was amortized through depreciation and amortization expense over the estimated useful life of
the related assets limited to the lease term. Beginning January 4, 2006, we expense rent from possession date
through restaurant open date as pre-opening expense, in accordance with FASB Staff Position No. 13-1,
Accounting for Rental Costs Incurred During a Construction Period. Once a restaurant opens for business, we
record straight-line rent over the lease term plus contingent rent to the extent it exceeded the minimum rent
obligation per the lease agreement.
There is potential for variability in the rent holiday period, which begins on the possession date and ends on the
restaurant open date, during which no cash rent payments are typically due under the terms of the lease. Factors
that may affect the length of the rent holiday period generally relate to construction related delays. Extension of
the rent holiday period due to delays in restaurant opening will result in greater pre-opening rent expense
recognized during the rent holiday period and lesser occupancy expense during the rest of the lease term (postopening).
For leases that contain rent escalations, we record the total rent payable during the lease term, as determined
above, on the straight-line basis over the term of the lease (including the rent holiday period beginning upon our
possession of the premises), and record the difference between the minimum rents paid and the straight-line rent
as a lease obligation. Certain leases contain provisions that require additional rental payments based upon
restaurant sales volume (“contingent rentals”). Contingent rentals are accrued each period as the liabilities are
incurred, in addition to the straight-line rent expense noted above. This results in some variability in occupancy
expense as a percentage of revenues over the term of the lease in restaurants where we pay contingent rent.
Management makes judgments regarding the probable term for each restaurant property lease, which can impact
the classification and accounting for a lease as capital or operating, the rent holiday and/or escalations in
payments that are taken into consideration when calculating straight-line rent and the term over which leasehold
improvements for each restaurant are amortized. These judgments may produce materially different amounts of
depreciation, amortization and rent expense than would be reported if different assumed lease terms were used.
Fair Value of Financial Instruments
The carrying value of cash and cash equivalents, investments, accounts receivable, and current liabilities
approximate fair values due to the short-term maturity of these instruments.
Net Income Per Share
Basic net income per share is computed by dividing the net income attributable to common shareholders by the
weighted average number of common shares outstanding during the period. Diluted net income per share reflects
the potential dilution that could occur if stock options issued by the Company to sell common stock at set prices
were exercised. The financial statements present basic and diluted net income per share. Common share
equivalents included in the diluted computation represent shares issuable upon assumed exercises of outstanding
stock options using the treasury stock method.
F-9
The following table presents a reconciliation of basic and diluted earnings per share (EPS) computations and the
number of dilutive securities (stock options) that were included in the dilutive EPS computation (in thousands).
2006
Fiscal Year
2005
2004
Numerator:
Net income for basic and diluted earnings per share . . . . . . . . .
$ 9,845
$ 8,351
$ 6,265
Denominator:
Weighted-average shares outstanding—basic . . . . . . . . . . . . . .
Effect of dilutive common stock options . . . . . . . . . . . . . . . . . .
23,287
844
22,134
1,247
19,498
1,072
Weighted-average shares outstanding—diluted . . . . . . . . . . . . .
24,131
23,381
20,570
At January 2, 2007, January 3, 2006 and January 2, 2005 there were approximately 295,000, 203,000 and 87,000
stock options outstanding, respectively, whereby the exercise price exceeded the average common stock market
value. The effects of the shares which would be issued upon the exercise of these options have been excluded
from the calculation of diluted earnings per share because they are anti-dilutive.
Stock-based Compensation
Prior to January 4, 2006, the Company accounted for its employee stock options under the recognition and
measurement provisions of APB Opinion No. 25, Accounting for Stock Issued to Employees, and related
Interpretations, as permitted by FASB Statement No. 123, Accounting for Stock-Based Compensation (Statement
No. 123). No stock-based compensation cost was recognized in our Statement of Income for the fiscal years 2005
and 2004, respectively, as all options granted under our plans had an exercise price equal to the market value of
the underlying common stock on the date of grant. Effective January 4, 2006, we adopted the fair value
recognition provisions of FASB Statement No. 123(R), Share-Based Payment (Statement No. 123(R)), using the
modified-prospective-transition method. Under that transition method, compensation cost recognized in the
thirteen and 52 weeks ended January 2, 2007 includes; (a) compensation cost for all share-based payments
granted prior to, but not yet vested as of January 4, 2006, based on the grant date fair value estimated in
accordance with the original provisions of Statement No. 123, and (b) compensation cost for all share-based
payments granted subsequent to January 4, 2006, based on the grant date fair value estimated in accordance with
the provisions of Statement No. 123(R). Results from prior years have not been restated.
Prior to the adoption of Statement No. 123(R), we presented all tax benefits of deductions resulting from the
exercise of stock options as operating cash flows in our Statement of Cash Flows. Statement No. 123(R) requires
the cash flows from the tax benefits resulting from tax deductions in excess of the compensation cost recognized
for those options (excess tax benefits) to be classified as financing cash flows. Accordingly, for each of the three
fiscal years ended January 2, 2007, the excess tax benefit from stock-based compensation has been classified as
financing cash inflow.
F-10
The following table illustrates the effect on net income and net income per share if we had applied the fair value
recognition provisions of Statement No. 123(R) to all periods presented. For the purposes of this pro forma
disclosure, the value of the options for fiscal 2005 and 2004 are estimated using a Black-Scholes option-pricing
formula and amortized to expense over the options’ vesting periods. Management believes that the adjusted
presentation may be useful to investors to permit them to compare the Company’s results using consistent
assumptions regarding stock-based compensation.
Fiscal Year
2006
(As Reported)
2005
(Pro Forma)
2004
(Pro Forma)
Net income before stock based compensation . . . . . . . . . . .
Stock based compensation:
Labor and benefits . . . . . . . . . . . . . . . . . . . . . . . . . . . .
General and administrative . . . . . . . . . . . . . . . . . . . . .
Tax benefit of stock based compensation . . . . . . . . . .
$10,934
$ 8,351
$6,265
Net income . . . . . . . . . . . . . . . . . . . . . . . . . . . . . . . . . . . . . .
$ 9,845
$ 6,486
$5,786
Basic net income per share:
Net income before stock based compensation . . . . . . .
Stock based compensation, net . . . . . . . . . . . . . . . . . .
$
0.47
(0.05)
$ 0.38
(0.09)
$ 0.32
(0.02)
Basic net income per share . . . . . . . . . . . . . . . . . . . . .
$
0.42
$ 0.29
$ 0.30
Diluted net income per share:
Net income before stock based compensation . . . . . . .
Stock based compensation, net . . . . . . . . . . . . . . . . . .
$
0.46
(0.05)
$ 0.36
(0.08)
$ 0.30
(0.02)
Diluted net income per share . . . . . . . . . . . . . . . . . . . .
$
0.41
$ 0.28
$ 0.28
(36)
(1,628)
575
(30)
(2,884)
1,049
(68)
(680)
269
The fair value of each option grant issued is estimated at the date of grant using the Black-Scholes option-pricing
model with the following weighted average assumptions:
Fiscal Year
2006
Expected volatility . . . . . . . . . . . . . . . . . . . . . . . . . . . . . .
Risk free interest rate . . . . . . . . . . . . . . . . . . . . . . . . . . . .
Expected option life . . . . . . . . . . . . . . . . . . . . . . . . . . . . .
Dividend yield . . . . . . . . . . . . . . . . . . . . . . . . . . . . . . . . . .
Fair value of options granted . . . . . . . . . . . . . . . . . . . . . .
2005
2004
38.56%
40.94%
40.70%
4.50%
3.81%
3.32%
5 years
5 years
5 years
0%
0%
0%
$ 9.48
$ 7.28
$ 5.48
Statement No. 123(R) requires us to make certain assumptions and judgments regarding the grant date fair value.
These judgments include expected volatility, risk free interest rate, expected option life, dividend yield and
vesting percentage. These estimations and judgments are determined by us using many different variables that, in
many cases, are outside of our control. The changes in these variables or trends, including stock price volatility
and risk free interest rate, may significantly impact the grant date fair value resulting in a significant impact to
our financial results.
Concentration of Credit Risk
Financial instruments which potentially subject the Company to a concentration of credit risk principally consist
of cash and cash equivalents and investments. The Company maintains its cash accounts at various banking
institutions. At times, cash and cash equivalent balances may be in excess of the FDIC insurance limit.
F-11
Recent Accounting Pronouncements
In September 2006, the FASB issued Statement No. 157, Fair Value Measurements, which defines fair value, the
methods used to measure fair value, and expands disclosures about fair value measurements. This Statement
applies to accounting pronouncements that require or permit fair value measurements. The adoption of this
Statement will be effective for financial statements issued for fiscal years beginning after November 15, 2007,
and interim periods within those fiscal years. We do not expect that the adoption of this Statement will have a
material impact on our financial statements.
In September 2006, the FASB issued Statement No. 158, Employers’ Accounting for Defined Benefit Pension
and Other Postretirement Plans. This Statement requires companies to recognize a net liability or asset and an
offsetting adjustment to accumulated other comprehensive income to report the funded status of defined benefit
pension and other postretirement benefit plans. The Statement requires prospective application, and the
recognition and disclosure requirements are effective for companies with fiscal years ending after December 15,
2006. Additionally, Statement No. 158 requires companies to measure plan assets and obligations at their
year-end balance sheet date. This requirement is effective for fiscal years ending after December 15, 2008. We
do not expect the impact of this Statement to have a material effect on our consolidated financial statements.
In September 2006, the SEC issued Staff Accounting Bulletin No. 108 (SAB 108), Considering the Effects of
Prior Year Misstatements when Quantifying Misstatements in Current Year Financial Statements, which
provides interpretive guidance regarding the consideration given to prior year misstatements when determining
materiality in current year financial statements. SAB 108 is effective for fiscal years ending after November 15,
2006 and had no impact on our consolidated financial statements.
In July 2006, the FASB issued FASB Interpretation No. 48 (FIN 48), Accounting for Uncertainty in Income
Taxes, an interpretation of FASB Statement No. 109, Accounting for Income Taxes, which is effective for fiscal
years beginning after December 15, 2006, and clarifies the accounting for uncertainty in tax positions. FIN 48
requires that we recognize the impact of a tax position in our financial statements if that position is more likely
than not of being sustained on audit, based on the technical merits of the position. The cumulative effect of the
change in accounting principle is recorded as an adjustment to opening retained earnings. We are currently
evaluating the impact of the adoption of FIN 48 on our financial statements.
In March 2006, the Emerging Issues Task Force (EITF) issued EITF Issue 06-03, How Taxes Collected from
Customers and Remitted to Governmental Authorities Should Be Presented in the Income Statement (That Is,
Gross versus Net Presentation). A consensus was reached that entities may adopt a policy of presenting sales
taxes in the income statement on either a gross or net basis. If taxes are significant, an entity should disclose its
policy of presenting taxes and the amounts of those taxes. The guidance is effective for periods beginning after
December 15, 2006. We present revenues net of sales taxes. This EITF will not impact our method for presenting
these sales taxes in our consolidated financial statements.
F-12
2. Property and Equipment
Property and equipment consisted of the following (in thousands):
Land . . . . . . . . . . . . . . . . . . . . . . . . . . . . . . . . . . . . . . . . . . . . . . . . . . . . . . . . . .
Furniture and fixtures . . . . . . . . . . . . . . . . . . . . . . . . . . . . . . . . . . . . . . . . . . . .
Equipment . . . . . . . . . . . . . . . . . . . . . . . . . . . . . . . . . . . . . . . . . . . . . . . . . . . . .
Leasehold improvements . . . . . . . . . . . . . . . . . . . . . . . . . . . . . . . . . . . . . . . . . .
January 2,
2007
January 3,
2006
$
$
6,533
14,662
41,242
107,420
3,502
9,453
28,081
72,855
Less accumulated depreciation and amortization . . . . . . . . . . . . . . . . . . . . . . .
169,857
(35,084)
113,891
(25,106)
Construction in progress . . . . . . . . . . . . . . . . . . . . . . . . . . . . . . . . . . . . . . . . . .
134,773
13,622
88,785
10,988
$148,395
$ 99,773
January 2,
2007
January 3,
2006
$ 7,579
4,951
2,900
2,453
2,054
994
678
2,872
$ 4,915
3,221
1,837
1,907
1,545
613
1,469
2,561
$24,481
$18,068
3. Accrued Expenses
Accrued expenses consisted of the following (in thousands):
Payroll related . . . . . . . . . . . . . . . . . . . . . . . . . . . . . . . . . . . . . . . . . . . . . . . . . .
Accrued rent and related . . . . . . . . . . . . . . . . . . . . . . . . . . . . . . . . . . . . . . . . . .
Deferred revenue from gift cards . . . . . . . . . . . . . . . . . . . . . . . . . . . . . . . . . . . .
Workers compensation . . . . . . . . . . . . . . . . . . . . . . . . . . . . . . . . . . . . . . . . . . . .
Sales taxes . . . . . . . . . . . . . . . . . . . . . . . . . . . . . . . . . . . . . . . . . . . . . . . . . . . . .
Other taxes . . . . . . . . . . . . . . . . . . . . . . . . . . . . . . . . . . . . . . . . . . . . . . . . . . . . .
Income tax payable . . . . . . . . . . . . . . . . . . . . . . . . . . . . . . . . . . . . . . . . . . . . . .
Other . . . . . . . . . . . . . . . . . . . . . . . . . . . . . . . . . . . . . . . . . . . . . . . . . . . . . . . . . .
4. Commitments and Contingencies
Leases
The Company leases its restaurant and office facilities under noncancelable operating leases with remaining
terms ranging from approximately 1 to 20 years with renewal options ranging from 5 to 20 years. Rent expense
for fiscal 2006, 2005, and 2004 was $10.6 million, $8.7 million, and $7.1 million, respectively.
The Company has certain operating leases, which contain fixed escalation clauses. Rent expense for these leases
has been calculated on the straight-line basis over the term of the leases, resulting in deferred rent of
approximately $4.0 million and $2.5 million at January 2, 2007 and January 3, 2006, respectively. The deferred
rent is included in accrued expenses on the accompanying balance sheet and will be amortized to rent expense
over the life of the leases.
A number of the leases also provide for contingent rentals based on a percentage of sales above a specified
minimum. Total contingent rentals, included in rent expense, above the minimum, for fiscal 2006, 2005, and
2004 were approximately $2.5 million, $2.0 million, and $1.7 million, respectively.
F-13
Future minimum annual rental payments under noncancelable operating leases are as follows (in thousands):
2007 . . . . . . . . . . . . . . . . . . . . . . . . . . . . . . . . . . . . . . . . . . . . . . . . . . . . . . . . . . . .
2008 . . . . . . . . . . . . . . . . . . . . . . . . . . . . . . . . . . . . . . . . . . . . . . . . . . . . . . . . . . . .
2009 . . . . . . . . . . . . . . . . . . . . . . . . . . . . . . . . . . . . . . . . . . . . . . . . . . . . . . . . . . . .
2010 . . . . . . . . . . . . . . . . . . . . . . . . . . . . . . . . . . . . . . . . . . . . . . . . . . . . . . . . . . . .
2011 . . . . . . . . . . . . . . . . . . . . . . . . . . . . . . . . . . . . . . . . . . . . . . . . . . . . . . . . . . . .
Thereafter . . . . . . . . . . . . . . . . . . . . . . . . . . . . . . . . . . . . . . . . . . . . . . . . . . . . . . . .
$ 10,409
10,761
10,463
9,921
9,516
94,220
$145,290
Additionally, the Company has entered into lease agreements related to the construction of future restaurants
with commencement dates subsequent to January 2, 2007. Our aggregate future commitment relating to these
leases is $13.0 million.
Legal Proceedings
Restaurants such as those operated by us are subject to litigation in the ordinary course of business, most of
which we expect to be covered by our general liability insurance, subject to certain deductibles and coverage
limits. Punitive damages awards and employee unfair practice claims, however, are not covered by our general
liability insurance. To date, we have not paid punitive damages with respect to any claims, but there can be no
assurance that punitive damages will not be awarded with respect to any future claims, employee unfair practice
claims or any other actions. We could be affected by the adverse publicity resulting from allegations, regardless
of whether or not such allegations are valid or whether we are determined to be liable.
The following paragraphs describe certain legal actions recently settled or pending:
Labor Related Matters
On February 5, 2004, a former employee of ours, on behalf of herself, and allegedly other employees, filed a
class action complaint in Los Angeles County, California Superior Court, Case Number BC310146, and on
March 16, 2004, filed an amended complaint, alleging causes of action for: (1) failure to pay reporting time
minimum pay; (2) failure to allow meal breaks; (3) failure to allow rest breaks; (4) waiting time penalties;
(5) civil penalties; (6) reimbursement for fraud and deceit; (7) punitive damages for fraud and deceit; and
(8) disgorgement of illicit profits. On June 28, 2004, the plaintiff stipulated to dismiss her second, third, fourth
and fifth causes of action. During September 2004, the plaintiff stipulated to binding arbitration of the
action. The parties have scheduled a mediation settlement meeting, on a non binding basis, during 2007. The
outcome of this matter cannot be ascertained at this time.
On June 10, 2005, a former employee filed a complaint against us in Los Angeles County, California, Superior
Court, Case Number BC 336317. The allegations of this complaint were described in our Form 10-K for the
fiscal year ended January 3, 2006. The same plaintiff filed a separate individual complaint on July 11, 2005, in
another Los Angeles County, California, Superior Court alleging that he was wrongfully terminated in violation
of public policy and was discriminated against because of his alleged disability. The same plaintiff filed a claim
with the Workers’ Compensation Appeals Board alleging injuries of stress, strain and harassment. In 2006, the
parties settled the cases, including the workers’ compensation claim, without any admission of liability by us.
On February 16, 2006, a former employee filed a lawsuit in Orange County, California, Superior Court, Case
Number 06CC00030, on behalf of herself and allegedly other employees, for alleged failure to provide rest
periods and meal periods and violation of California Business and Professions Code Section 17200. We have
answered the complaint, denying the allegations and raising various additional defenses. The outcome of this
matter cannot be ascertained at this time.
F-14
On March 15, 2006, a former employee filed a lawsuit in Los Angeles County, California, Superior Court, Case
Number BC 349038, and on June 9, 2006, filed an amended complaint, on behalf of himself and allegedly others
employed by us as servers, alleging unlawful tip pooling distribution and unfair competition under California
law. The lawsuit asked for return of tips in an unspecified amount, an injunction requiring proper tip pool
distribution, restitution of an unspecified amount, and statutory penalties for each employee required to tip pool
contrary to law in an undetermined amount. We filed a demurrer, stating the plaintiff’s lawsuit had no legal
merit, and other pleadings contesting plaintiff’s lawsuit. The Court ruled in our favor, sustaining the demurrer on
all causes of action, and the case was dismissed. The time period in which the plaintiff may appeal this ruling
will expire within the first quarter of 2007.
Letters of Credit
The Company has irrevocable standby letters of credit outstanding as required under the Company’s workers’
compensation policy that total $2.3 million as of January 2, 2007. The standby letters of credit have been issued
under the Company’s $10 million line of credit and therefore reduce the amount available for borrowing under
the credit facility.
5. Long Term Debt
Line of Credit
On December 15, 2005, we established a $10 million unsecured revolving line of credit (the “Line of Credit”)
which expires on December 31, 2008. Availability under the line of credit is reduced by outstanding letters of
credit. As of January 2, 2007, there were no borrowings outstanding under the line of credit. Borrowings under
the line of credit will bear interest at 1% per annum in excess of the applicable LIBOR rate.
6. Shareholders’ Equity
Preferred Stock
The Company is authorized to issue five million shares in one or more series of preferred stock and to determine
the rights, preferences, privileges and restrictions to be granted to, or imposed upon, any such series, including
the voting rights, redemption provisions (including sinking fund provisions), dividend rights, dividend rates,
liquidation rates, liquidation preferences, conversion rights and the description and number of shares constituting
any wholly unissued series of preferred stock. No shares of preferred stock were issued or outstanding at
January 2, 2007 or January 3, 2006. The Company currently has no plans to issue shares of preferred stock.
Common Stock
Shareholders of the Company’s outstanding common stock are entitled to receive dividends if and when declared
by the Board of Directors. Shareholders are entitled to one vote for each share of common stock held of record.
Pursuant to the requirements of California law, shareholders are entitled to accumulate votes in connection with
the election of directors.
On November 16, 2006, the Company sold 3,075,000 shares of common stock at a purchase price of $20.00 per
share for $58.3 million (net of approximately $3.2 million in related fees and expenses); and, on March 11, 2005,
the Company sold 2.75 million shares of common stock at a purchase price of $15.50 per share for $40.3 million
(net of approximately $2.2 million in related fees and expenses). These proceeds are currently being utilized to
fund the expansion of the Company’s restaurant operations and general corporate purposes.
F-15
7. Income Taxes
The income tax expense consists of the following for the last three fiscal years (in thousands):
Current:
Federal . . . . . . . . . . . . . . . . . . . . . . . . . . . . . . . . . . . . . . . . . . . . . . .
State . . . . . . . . . . . . . . . . . . . . . . . . . . . . . . . . . . . . . . . . . . . . . . . . .
Deferred:
Federal . . . . . . . . . . . . . . . . . . . . . . . . . . . . . . . . . . . . . . . . . . . . . . .
State . . . . . . . . . . . . . . . . . . . . . . . . . . . . . . . . . . . . . . . . . . . . . . . . .
Provision for income taxes . . . . . . . . . . . . . . . . . . . . . . . . . . . . . . . . . . . .
2006
Fiscal Year
2005
2004
$4,462
1,306
$3,293
1,074
$ 747
587
5,768
4,367
1,334
(740)
(194)
(204)
(142)
900
52
(934)
(346)
952
$4,834
$4,021
$2,286
The provision for income taxes differs from the amount that would result from applying the federal statutory rate
as follows for the last three fiscal years:
2006
Income tax at statutory rates . . . . . . . . . . . . . . . . . . . . . . . . . . . . . . . . . . . . . . . .
Non-deductible expenses . . . . . . . . . . . . . . . . . . . . . . . . . . . . . . . . . . . . . . . . . . .
State income taxes, net of federal benefit . . . . . . . . . . . . . . . . . . . . . . . . . . . . . .
Change in valuation allowance . . . . . . . . . . . . . . . . . . . . . . . . . . . . . . . . . . . . . .
Income tax credits . . . . . . . . . . . . . . . . . . . . . . . . . . . . . . . . . . . . . . . . . . . . . . . .
Reduction of estimated tax liabilities . . . . . . . . . . . . . . . . . . . . . . . . . . . . . . . . . .
Other, net . . . . . . . . . . . . . . . . . . . . . . . . . . . . . . . . . . . . . . . . . . . . . . . . . . . . . . .
Fiscal Year
2005
2004
35.0%
1.0
4.9
—
(7.9)
—
(0.1)
34.0%
0.3
5.0
—
(6.0)
(0.4)
(0.4)
34.0%
0.2
4.9
(3.5)
(5.5)
(2.4)
(1.0)
32.9% 32.5% 26.7%
The components of the deferred income tax asset (liability) consist of the following (in thousands):
January 2,
2007
January 3,
2006
Property and equipment . . . . . . . . . . . . . . . . . . . . . . . . . . . . . . . . . . .
Goodwill . . . . . . . . . . . . . . . . . . . . . . . . . . . . . . . . . . . . . . . . . . . . . . .
Accrued expense and other liabilities . . . . . . . . . . . . . . . . . . . . . . . .
Income tax credits . . . . . . . . . . . . . . . . . . . . . . . . . . . . . . . . . . . . . . .
Other . . . . . . . . . . . . . . . . . . . . . . . . . . . . . . . . . . . . . . . . . . . . . . . . . .
$(1,117)
(1,357)
4,392
583
(1,142)
$ (921)
(1,196)
2,382
1,018
(857)
Net deferred income taxes . . . . . . . . . . . . . . . . . . . . . . . . . . . . . . . . .
$ 1,359
$
426
At January 2, 2007, the Company has federal income tax credit carryforwards of approximately $583,000,
consisting primarily of the credit for FICA taxes paid on reported employee tip income. The FICA tax credits
will begin to expire in 2025.
The Company has deferred tax assets that are subject to periodic recoverability assessments. The Company
believes that it is more likely than not that the net deferred tax asset will be realized. Accordingly, no valuation
allowance was recorded at January 2, 2007.
F-16
8. Stock Option Plans
The Company adopted the 1996 Stock Option Plan as of August 7, 1996 which provided for the granting of
options to purchase up to 600,000 shares of common stock. The Plan was amended on September 28, 1999 and
June 19, 2004, increasing the total number of shares under the plan to 2.2 million. The 1996 Stock Option Plan
provided for options to be issued as either incentive stock options or non-statutory stock options as defined under
Section 422A of the Internal Revenue Code. The 1996 Stock Option Plan expires on June 19, 2013 unless
terminated earlier.
In June 2005, the Company’s shareholder’s approved the 2005 Equity Incentive Plan (“the Plan”) which provides
for the grant of incentive and non statutory stock options as well as stock appreciation rights, restricted stock,
restricted stock units, and other stock-based awards. Awards other than incentive stock options generally may be
granted only to employees, directors and consultants of the Company, or certain related entities or designated
affiliates. A total of 3,500,000 shares of common stock have been reserved for issuance under the Plan of which
approximately 2.9 million were available to be granted as of January 2, 2006. Shares subject to stock options and
stock appreciation rights are charged against the Plan share reserve on the basis of one share for each one share
granted while shares subject to other types of awards are charged against the Plan share reserve on the basis of
two shares for each one share granted. The Plan also contains other limits with respect to the terms of different
types of incentive awards and with respect to the number of shares subject to awards that can be granted to an
employee during any fiscal year. All options granted under the Plan expire within 10 years of their date of grant.
The exercise price of the shares under the Plan shall be equal to or exceed 100% of the fair market value of the
shares at the date of option grant. The options generally vest over a three to five-year period. In addition to shares
authorized under the Plan, options granted pursuant to employment agreements with two of the Company’s
officers provided for the grant of options to purchase up to 661,000 shares of common stock.
Options Outstanding
Shares
(in thousands)
Weighted
Average
Exercise
Price
Outstanding options at December 28,
2003 . . . . . . . . . . . . . . . . . . . . . . . .
Granted . . . . . . . . . . . . . . . . . . . . . . . .
Exercised . . . . . . . . . . . . . . . . . . . . . .
Forfeited . . . . . . . . . . . . . . . . . . . . . . .
1,726
302
(164)
(64)
Outstanding options at January 2,
2005 . . . . . . . . . . . . . . . . . . . . . . . .
Granted . . . . . . . . . . . . . . . . . . . . . . . .
Exercised . . . . . . . . . . . . . . . . . . . . . .
Forfeited . . . . . . . . . . . . . . . . . . . . . . .
Options Exercisable
Shares
(in thousands)
Weighted
Average
Exercise
Price
$ 4.95
13.59
5.28
7.64
1,078
$3.09
1,800
872
(179)
(90)
6.25
17.52
9.06
7.67
1,109
3.55
Outstanding options at January 3,
2006 . . . . . . . . . . . . . . . . . . . . . . . .
Granted . . . . . . . . . . . . . . . . . . . . . . . .
Exercised . . . . . . . . . . . . . . . . . . . . . .
Forfeited . . . . . . . . . . . . . . . . . . . . . . .
2,403
245
(244)
(67)
10.09
22.46
4.01
9.41
1,301
5.50
Outstanding options at January 2,
2007 . . . . . . . . . . . . . . . . . . . . . . . .
2,337
$12.04
1,230
$7.09
F-17
Information relating to significant option groups outstanding at January 2, 2007 are as follows (shares in
thousands):
Options Outstanding
Range of
Exercise Prices
Amount
Outstanding
as of
January 2, 2007
$0.00 – $3.00
3.01 – 7.00
7.01 – 11.00
11.01 – 15.00
15.01 – 19.00
19.01 – 23.00
23.01 – 26.00
$0.00 – $26.00
Options Exercisable
Weighted
Average Remaining
Contractual Life
Weighted
Average
Exercise Price
645
123
141
661
158
317
292
3.68
4.64
5.78
7.59
8.62
8.57
8.89
$ 2.63
4.03
8.74
13.53
16.45
19.86
23.49
645
122
103
250
—
90
20
$ 2.63
4.01
8.58
13.63
—
19.68
23.47
2,337
6.61
$12.04
1,230
$ 7.09
Number
Exercisable
Weighted
Average
Exercise Price
9. Employee Benefit Plan
The Company maintains a voluntary, contributory 401(k) plan for all eligible employees. Employees may elect to
contribute up to 15% of their earnings, up to a maximum of $15,000, to the plan each year. Employee
contributions are matched by the Company at a rate of 33% for the first $6,000 of deferred income. Contributions
by the Company were approximately $65,000, $110,000 and $76,000 in fiscal 2006, 2005 and 2004, respectively.
10. Related Party Transactions
As of January 2, 2007, we believe that Jacmar Companies and their affiliates (collectively referred to herein as
“Jacmar”) owned approximately 16.9% of our outstanding common stock. Jacmar, through its specialty
wholesale food distributorship, is currently the Company’s largest supplier of food, beverage and paper products.
In 2004, Jacmar also acquired ownership of the Shakey’s pizza parlor chain. In July 2006, after an extensive
competitive bidding process, the Company entered into a three-year agreement with a national foodservice
distribution system whose shareholders are prominent regional foodservice distributors, of which Jacmar is one.
Jacmar will continue to service the Company’s restaurants in California, while other system distributors will
service our restaurants in all other states. We believe that Jacmar sells products to us at prices comparable to
those offered by unrelated third parties. Jacmar supplied us with $27.1 million, $24.8 million and $19.3 million
of food, beverage and paper products for fiscal 2006, 2005 and 2004, respectively, which represent 44.2%, 54.6%
and 57.1% of our total costs for these products, respectively. We had trade payables due to Jacmar related to
these products of $1.1 million and $2.3 million at January 2, 2007 and January 3, 2006, respectively.
F-18
11. Selected Consolidated Quarterly Financial Data (Unaudited)
Summarized unaudited consolidated quarterly financial data for the Company is as follows (in thousands, except
per share data):
Total revenues . . . . . . . . . . . . . . . . . . . . . . . . . . . . . . .
Income from operations . . . . . . . . . . . . . . . . . . . . . . . .
Net income . . . . . . . . . . . . . . . . . . . . . . . . . . . . . . . . . .
Diluted net income per share . . . . . . . . . . . . . . . . . . . .
Total revenues . . . . . . . . . . . . . . . . . . . . . . . . . . . . . . .
Income from operations . . . . . . . . . . . . . . . . . . . . . . . .
Net income . . . . . . . . . . . . . . . . . . . . . . . . . . . . . . . . . .
Diluted net income per share . . . . . . . . . . . . . . . . . . . .
April 4,
2006
July 4,
2006
October 3,
2006
January 2,
2007
$53,356
$ 3,070
$ 2,311
$ 0.10
$57,843
$ 3,216
$ 2,340
$ 0.10
$61,796
$ 3,261
$ 2,372
$ 0.10
$65,933
$ 3,403
$ 2,822
$ 0.11
April 3,
2005
July 3,
2005
October 4,
2005
January 3,
2006
$37,393
$ 2,299
$ 1,666
$ 0.08
$43,985
$ 2,683
$ 2,061
$ 0.09
$47,578
$ 3,053
$ 2,309
$ 0.10
$49,254
$ 3,069
$ 2,315
$ 0.10
Diluted net income pre share calculations for each quarter are based on the weighted average diluted shares
outstanding for that quarter and may not total to the full year amount.
12. Subsequent Events (Unaudited)
During the first quarter of fiscal 2007, the Company may record a one-time pretax charge of approximately $1.9
million (net of related taxes of approximately $646,000), or approximately $0.05 per diluted share, related to:
(a) the rebalancing of the Company’s internal brewing activities associated with the commencement of Reno’s
brewery operations, which resulted with the de-commission of four of its older, smaller and inefficient “legacy”
breweries; (b) restaurant facility image enhancements, including the replacement of more contemporary china/
silverware and glassware; and (c) the relocation of its home office support activities to a larger leased facility to
accommodate the Company’s planned future expansion which resulted with the disposal of certain nonproductive
support-related assets and associated relocation costs.
F-19
B J’S W HI T E CH O CO L AT E M AC A DA M I A NU T P I ZO O K IE
FRO N T COV ER : B J’S RESTAUR A N T & BRE W H O US E, AURO R A , CO LO R A D O ;
INS ID E FRO N T COV ER : B J’S RESTAUR A N T & BRE W ERY, REN O, NE VA DA ; B ACK COV ER : B J’S S A N TA FE S A L A D
B J ’ S R E S T A U R A N T S, I N C.
7 755
C E N T E R
AV E N U E
▼
S U I T E
30 0
▼
H U N T I N GTO N
B E A C H
W W W. B J S R E S T A U R A N T S . C O M
▼
C A L I F O R N I A
9 26 4 7
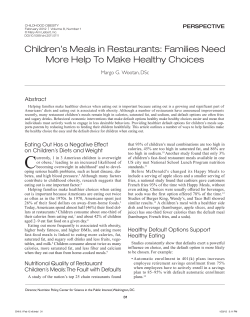
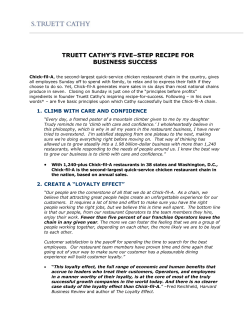


© Copyright 2026