
COMBINING TO CREATE A LEADING GLOBAL HEALTHCARE
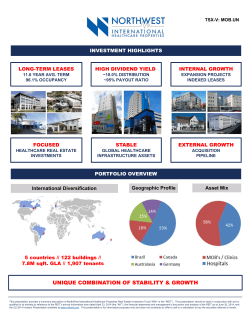
COMBINING TO CREATE A LEADING GLOBAL HEALTHCARE REIT March 12, 2015 DISCLAIMER This presentation contains information about the proposed combination of NorthWest Healthcare Properties Real Estate Investment Trust (“NWH”) and NorthWest International Healthcare Properties Real Estate Investment Trust (“NWI”), including forward-looking statements about the entity that will result from their combination. Forward-looking statements are typically identified by words such as “expect”, “anticipate”, “believe”, “foresee”, “could”, “estimate”, “goal”, “intend”, “plan”, “seek”, “strive”, “will”, “may”, “potential” and “should” and similar expressions. Forward-looking statements reflect current estimates, beliefs and assumptions which are based on NWH’s and NWI ’s perception of historical trends, current conditions and expected future developments, as well as other factors management believes are appropriate in the circumstances. NWH’s and NWI’s estimates, beliefs and assumptions are inherently subject to significant business, economic, competitive and other uncertainties and contingencies regarding future events and, as such, are subject to change. NWH and NWI can give no assurance that such estimates, beliefs and assumptions will prove to be correct. This presentation contains forward-looking statements concerning: the extent to which the transaction is accretive; the combined REIT’s financial position, property portfolio, cash flow and growth prospects; in place and contracted run rates, payout ratios, certain strategic benefits, and operational, competitive and cost synergies; management of the combined REIT; the proposed timing of the transaction; the anticipated tax treatment of the transaction and NWH’s and NWI’s anticipated future results. Such information should not be considered to be what the actual financial position or other results of operations would have necessarily been had NWH and NWI operated as the combined REIT. Numerous risks and uncertainties could cause actual results to differ materially from the estimates, beliefs and assumptions expressed or implied in the forward-looking statements, including, but not limited to: economic and market factors specific to the healthcare real estate industry; general economic and market factors; local real estate conditions; interest rates; the availability of equity and debt financing to the combined REIT; efficiencies and operating costs; tax related matters; reliance on key personnel of NWI, NWH and the combined REIT; increases or decreases in the prices of real estate; the combined REIT’s future stability and growth prospects; the combined REIT’s future profitability and capital needs, including capital expenditures; development and operating risks; currency risk; project development, expansion targets and operational delays; marketability; additional funding requirements; governmental regulations, licenses and permits; environmental regulation and liability; competition; uninsured risks; contingent liabilities and guarantees; litigation; health and safety; trustees’ and officers’ conflicts of interest; the failure to satisfy conditions precedent to the completion of the transaction; the ability of the combined REIT to integrate the operations of NWI and its subsidiaries and; the ability of NWI, NWH and the combined REIT to continue to develop and grow and management of the combined REIT’s success in anticipating and managing the foregoing factors. Readers are cautioned that the foregoing list of factors is not exhaustive. Other risks and uncertainties not presently known to NWH and NWI or that NWH and NWI presently believe are not material could also cause actual results or events to differ materially from those expressed in its forward-looking statements. Additional information on these and other factors that could affect the operations or financial results of NWH or NWI are included in reports filed by NWH and NWI with applicable securities regulatory authorities and may be accessed through the SEDAR website (www.sedar.com). This presentation is qualified in its entirety by the disclosure in such reports. There can be no assurance that the proposed combination will occur or that the anticipated strategic benefits and operational, competitive and cost synergies will be realized. The proposed combination is subject to various regulatory approvals and the fulfillment of certain other conditions, including unitholder approvals, and there can be no assurance that any such approvals will be obtained and/or any such conditions will be met. The proposed combination could be modified, restructured or terminated. Readers are cautioned not to place undue reliance on these forward-looking statements, which reflect NWH’s and NWI’s expectations only as of the date of this presentation. NWH, NWI and the combined REIT disclaim any obligation to update or revise any forward-looking statements, whether as a result of new information, future events or otherwise, except as required by law. This presentation for contains information provided by each of NWH and NWI. The information concerning each of NWH and NWI contained in this presentation has been provided by NWH and NWI, as applicable. Although neither NWI nor NWH has knowledge that would indicate that any of information about the other is untrue or incomplete, neither NWI nor NWH assumes any responsibility for the accuracy or completeness of information about the other. Certain information concerning Vital Healthcare Property Trust contained in this press release has been taken from, or is based upon, publicly available documents and records on file with regulatory bodies. Although NWI and NWH have no knowledge that would indicate that any of such information is untrue or incomplete, neither NWI nor NWH was involved in the preparation of any such publicly available documents and neither NWI, NWH, nor any of their officers or trustees, assumes any responsibility for the accuracy or completeness of such information or the failure by Vital Healthcare Property Trust to disclose events which may have occurred or may affect the completeness or accuracy of such information but which are unknown to NWI and NWH. This presentation includes references to funds from operations (“FFO”), adjusted funds from operations (“AFFO”) and net operating income (“NOI”). FFO, AFFO and NOI are not measures recognized under IFRS and do not have standardized meanings prescribed by IFRS and therefore may not be comparable to similarly titled measures presented by other publicly traded companies. 1 COMBINING TO CREATE A LEADING GLOBAL HEALTHCARE REIT “NWI” Large portfolio of hospitals and MOBs with ~$850mm in assets(1) High growth international markets (Brazil, Germany, Australasia) Core infrastructure for the provision of acute and non-acute care Compelling portfolio metrics with occupancy of 98.3% and WALE of ~15.1 years Manager and 24% majority unitholder in Vital Healthcare Property Trust (NZE:VHP) “NWH” Largest landlord of MOBs in Canada with ~$1.2bn in assets(1) Unique portfolio with critical mass not replicable Core infrastructure for the provision of non-acute care Growing yet defensive asset class owing to necessity based, high retention tenancies Well diversified tenant base National platform focused on major markets Global platform of core healthcare real estate infrastructure with ~$2.4bn in total assets(2) Combines stable Canadian portfolio with high growth international assets 122 properties with total GLA of ~6.6mm square feet in Canada, Brazil, Germany, Australia and New Zealand(2) Compelling portfolio metrics with occupancy of ~93.9% and WALE of ~7.9 years 68% MOB / 32% hospital asset mix on NOI basis Significant growth opportunities at compelling yields Enhanced capital markets profile – scale, float, liquidity Simplified, internally managed corporate structure 1. Total assets as of December 31, 2014 (IFRS) 2. Includes assets of Vital Healthcare Property Trust (“VHP”) on a 100% basis 2 SIGNIFICANT TRANSACTION BENEFITS TO UNITHOLDERS COMBINING THE STABILITY OF NWH’S CANADIAN PORTFOLIO WITH NWI’S HIGH GROWTH, CORE INFRASTRUCTURE INTERNATIONAL PORTFOLIO PROVIDES A COMPELLING INVESTMENT VEHICLE BENEFITS TO NWH UNITHOLDERS Enhances scale and provides exposure to high growth, international, core infrastructure assets Improves portfolio characteristics including average age of buildings, same property NOI growth, WALE and geographic diversification Enhances prospects for growth in international markets where NWI has local operating experience and well established partnerships Diversifies into international markets including Brazil, Germany, Australia and New Zealand Immediately accretive to AFFO per unit BENEFITS TO NWI UNITHOLDERS Enhances scale and increases exposure to NWH’s large and stable Canadian portfolio Enhances access to capital to pursue value enhancing growth opportunities Stability of NWH’s Canadian portfolio of high quality healthcare real estate when combined with NWI’s portfolio in Brazil, Germany, Australia and New Zealand provides significant diversification benefits Reduces overall leverage and enhances balance sheet flexibility MUTUAL BENEFITS Improves operating characteristics due to highly complementary real estate portfolios Enhances capital markets presence due to larger scale, portfolio diversification and growth prospects Unifies platform combining management and operating platforms of NWH and NWI Immediately streamlines costs inherent in managing two separate publicly traded REITs Larger float expected to improve trading liquidity 3 GLOBAL HEALTHCARE REAL ESTATE INFRASTRUCTURE COMBINED PORTFOLIO PORTFOLIO SUMMARY COMPRISES 122 PROPERTIES TOTALING GLA OF 6.6MM SQUARE Number of Properties FEET IN FIVE COUNTRIES STRONG OPERATING FUNDAMENTALS WITH OCCUPANCY OF ~93.9%, WALE OF ~7.9 YEARS AND 68%/32% MOB/HOSPITAL MIX Canada Brazil Germany Australasia(1) Combined Platform 73 5 19 25 122 100% MOB 100% Hospital 100% MOB 15% MOB / 85% Hospital 68% MOB / 32% Hospital 4.5 1.0 0.7 1.6 6.6 Gross Assets (3) $1,245 $386 $138 $580 Occupancy 91.9% 100.0% 95.2% 99.5% 93.9% WALE (Years) 4.5 22.2 4.6 15.2 7.9 Average Building Age (Years) ~32 ~11 ~15 ~15 ~26 Weighted Average Cap Rate (5) 6.8% 9.4% 6.4% 9.0% 7.5% Asset Mix (2) GLA (Million Square Feet) 1. Shown on a 100% basis. NWI owns a 24% interest in VHP 2. Based on proportionally consolidated NOI 3. Total assets (IFRS) as of December 31, 2014 4. Based on total assets of NWI , NWH and VHP on a 100% basis, including corporate assets, adjusted for NWI equity interest in NWH and VHP; $1.9 billion in proportionate ownership 5. Per IFRS financial statements as of December 31, 2014 4 $2,415 (4) PORTFOLIO DIVERSIFICATION DIVERSIFIED PORTFOLIO IN STRATEGIC INTERNATIONAL MARKETS AND STABLE, CORE HEALTHCARE REAL ESTATE ASSET CLASSES PRO FORMA NOI DIVERSIFICATION BY GEOGRAPHY PRO FORMA TOP 10 TENANTS BY GROSS RENT Tenant Australasia 10% Germany 7% Region % of Gross Rent (1) 1 Brazil 23% Rede D'Or SL 15.2% Bantrel Corporation 3.4% CLSC / CSSS 2.7% Sabara 2.0% Healthe Care 1.9% Shoppers Drug Mart 1.9% Lawtons Drugs 1.6% Alberta Health Services 1.5% Province of Ontario 1.4% Centric Health 1.0% Top 10 Tenants 32.5% 2 3 DIVERSIFIED TENANT BASE WITH STRATEGIC PARTNERSHIPS WITH LEADING HEALTHCARE OPERATORS IN LOCAL MARKETS 4 5 Canada 60% PRO FORMA NOI DIVERSIFICATION BY ASSET MIX 6 7 8 Hospitals 32% 9 10 MOBs 68% 1. VHP shown at a proportionally consolidated basis 5 CANADA: LARGEST PORTFOLIO OF MOB ASSETS INVESTMENT AND MARKET OVERVIEW YT NT NU AB BC NL SK Spruce Grove (1) Edmonton (4) MB QC Airdrie (1) Kamloops (1) ON Calgary (7) PE Winnipeg (2) NB Canada’s largest non-government owner/manager of MOBs and healthcare related facilities Portfolio of 73 properties comprising GLA of 4.5 million sf and ~1,500 tenants 91.9% occupancy and ~4.5 year WALE High quality real estate with stable cash flow underpinned by tenancies supported by the Canadian publicly funded healthcare system Provides stability and diversification to a broader international healthcare real estate portfolio NS QC ON CANADA Quebec City (4) Levis (1) Sudbury (2) Joliette (1) Laval (1) Lachenaie (1) Longueuil (2) Ottawa (1) Richelieu (1) PE NB Sydney (2) Moncton (1) New Glasgow (1) Fredericton (1) Lower Sackville (1) Dartmouth (1) Halifax (2) NS Saint Hubert (1) Lindsay (1) Montreal (2) Orillia (1) Vaudreuil-Dorion (1) Midland (1) Peterborough (1) Collingwood (1) Port Hope (1) Whitby (1) Mississauga (1) Toronto (10) Guelph (2) Oakville (1) Cambridge (1) Hamilton (3) London (2) Le Carrefour Medical Laval, QC St. Thomas (1) Chatham (1) Windsor (2) 6 Dundas-Edward Centre Toronto, ON BRAZIL: NEWLY BUILT PRIVATE PAY HOSPITAL ASSETS INVESTMENT AND MARKET OVERVIEW RORAIMA AMAPÁ Belem Manaus Fortaleza AMAZONAS PARA CEARA MARANHÃO RIO GRANDE DO NORTE Natal Institutional quality, core healthcare infrastructure assets in strategic markets including Sao Paulo, Brasilia and Rio de Janiero 100.0% occupancy and ~22.2 year WALE Stable cash flow with long-term, triple-net, inflation-indexed leases, providing consistent organic growth Long-term relationship with one of the country’s leading hospital operators Rede D’Or Sao Luiz S.A. (S&P National Rating: A-) PIAUI PERNAMBUCO ACRE Recife ALAGOAS Macieo TOCANTINS RONDÔNIA BAHIA FEDERAL DISTRICT Salvador Santa Luzia Coração Brasilia GOIAS MINAS GERAIS MATO GROSSO DO SUL SAO PAULO Hospital Sabará Hospital Brasil RIO DE JANEIRO Caxias Rio De Janeiro Sao Paulo PARANÁ SANTA CATARINA RIO GRANDE DO SUL Port Alegre Hospital Infantil Sabara Sao Paulo 7 Hospital Caxias D’Or Rio de Janeiro GERMANY: STRATEGICALLY LOCATED MOB ASSETS INVESTMENT AND MARKET OVERVIEW SCHLESWIGHOLSTEIN High quality MOB assets located in the major markets including Berlin, Frankfurt, Ingolstadt and Leipzig 95.2% occupancy and ~4.6 year WALE MECKLENBURG-VORPOMMERN HAMBURG BREMEN BERLIN NIEDERSACHSEN Polimedica Hohenschoen 1 4 Berlin 1 Portfolio Highly fragmented MOBs market in Germany presents a unique opportunity to consolidate healthcare infrastructure assets accretively Fully integrated property management and asset management capabilities allow efficient operation and deal sourcing BRANDENBURG SAXONY-ASPHALT NORDRHEIN-WESTFALEN SACHSEN Fulda 1 11 THURINGIA Leipzig Portfolio HESSEN RHINELAND-PFALZ Adlershof 1 Berlin Polimedica Berlin Berlin Neukolln Berlin Hollis Centre Ingolstadt SAARLAND BAYERN BADEN-WÜRTTEMBERG 1 Hollis 8 AUSTRALASIA: STRATEGIC INVESTMENT IN VHP INVESTMENT AND MARKET OVERVIEW AUSTRALIA NORTHERN TERRITORY QUEENSLAND Manager and 24% strategic shareholder of Vital Healthcare Property Trust (NZE:VHP), Australasia’s largest healthcare real estate owner with 18 private hospitals and 7 MOBs 99.5% occupancy and ~15.2 year WALE Stable and growing cash flows underpinned by tenancies of high quality hospital and healthcare operators with long-term, inflationindexed leases 4 WESTERN AUSTRALIA 1 SOUTH AUSTRALIA 1 NEW SOUTH WALES 6 VICTORIA 6 NEW ZEALAND TASMANIA 1 Epworth Eastern Medical Centre Melbourne, AU Marian Centre Perth, NZ Epworth Eastern Hospital Melbourne, AU Ascot Hospital Auckland, NZ 6 9 GROWTH STRATEGY OFFERING COMPELLING OPPORTUNITIES A CANADA “PLUS” STRATEGY THAT BUILDS ON THE STABLE CANADIAN PORTFOLIO TO PURSUE ATTRACTIVE INTERNATIONAL GROWTH INITIATIVES Target Market Organic Growth VARIOUS ACTIONABLE NEAR TERM GROWTH OPPORTUNITIES IDENTIFIED Corporate Focus on asset management and asset harvesting Focus on new and renewal leasing program Rental rate indexation linked to inflation (Q4-14 run-rate of ~6% a year) Strategic relationship with Rede D’Or SL provides significant expansion opportunities at attractive yields External Growth Rental rate indexation linked to inflation (Q4-14 run-rate ~1% a year) Focus on revenue enhancing activities (ie. Parking, expense recoveries) and enhancement of assets Develop new format MOB facilities Potential to invest in core hospitals and ancillary facilities over time Opportunity for acquisition and development of hospitals Potential to partner with clinics, labs and /or pharmacy consolidator and establish a MOB segment in Brazil Continued incremental acquisitions focused on MOBs and clinics Rental rate indexation linked to inflation (Q4-14 run-rate ~3% a year) ~A$68.8mm commitment to 5 new expansion projects at ~9% Continued incremental acquisitions of regional hospitals, clinics and MOBs Forecast pipeline of ~A$25mm in the next 24 months Optimize balance sheet to lower cost of capital Potential for additional capital sources 10 M&A / investments Strategic partnerships ACCRETIVE COMMITTED EXPANSION OPPORTUNITIES # of Projects Projects Development Opportunity Project Cost (C$M) Expected Rental Yield Size 2 Developments Barrie and Toronto Medical Office Buildings ~$45mm ~8% 107k sq. ft. # of Projects 2 Expansion Projects HMB Coracao Projects Development Opportunity Hospital expansion Parking expansion Project Cost (C$M) ~$60mm Expected Rental Yield Size ~11.5% 240k sq. ft. for 150 beds 92k sq. ft. for 316 parking stalls # of Projects Projects Development Opportunity Project Cost (C$M) Expected Rental Yield Size 5 Expansion Projects Belmont, Hurstville, Marian, Maitland, and Lingard Hospital expansions ~$68mm ~9% ~150 new beds Start Date Sept 2015 – Jan 2016 Start Date June 2015 Start Date In Progress Duration 14 – 18 months Duration 12 - 24 months Duration 2 - 8 months 11 REPRESENTATIVE INVESTMENTS Dundas-Edward Centre Assets Size Tenants MOB + Hospital Admins / Traditional Office ~410k Square Feet Province of Ontario, Sick Kids Hospital, and other medical tenancies Rede D’Or Hospital Portfolio Assets Size Tenants German MOB Portfolio 3 Hospitals Assets 446 Beds / ~573k Square Feet Size Hospital Operator Rede D’Or S.L. S&P “A-” Rated Tenants 14 MOBs ~410k Square Feet ~200 Medical Practitioners & Related Services Marian Health Centre Assets Size Tenants 1 Hospital 31 beds / To expand to 66 beds during 2015 Healthe Care Cap Rate (1) ~6.0% Cap Rate (1) ~9.4% Cap Rate (1) ~6.6% Cap Rate (1) ~8.5% Occ. ~94% Occ. 100% Occ. ~95% Occ. 100% Lease Term Rental Increase Acquisition Date ~6 Years Contract Rents Jan 2011 Lease Term Rental Increase Acquisition Date ~25 Years Lease Term Annual Inflation Index Dec 2013 1. IFRS cap rate as at December 31, 2014 12 ~5 Years Lease Term Rental Increase Annual Inflation Index Rental Increase Acquisition Date Jun 2014 & Aug 2014 Acquisition Date ~20 Years Annual Inflation Index Aug 2014 GLOBAL PLATFORM WITH REGIONAL CAPABILITY AND EXPERTISE HIGHLY EXPERIENCED AND ALIGNED EXECUTIVE MANAGEMENT TEAM FULLY ESTABLISHED, SCALABLE REGIONAL TEAMS WITH EXPERTISE IN PROPERTY MANAGEMENT, ACQUISITIONS AND DEVELOPMENT LOCAL MARKET KNOWLEDGE AND STRONG RELATIONSHIPS WITH LEADING HEALTHCARE PROVIDERS OVER 180 PROFESSIONALS ACROSS 9 OFFICES IN 5 COUNTRIES MANAGEMENT – COMBINED REIT Paul Dalla Lana Chairman & CEO REGIONAL OPERATING PLATFORM AND EXPERTISE Founder of NorthWest REITs Largest unitholder of NWI Peter Riggin President – Canada Vincent Cozzi President and CIO Teresa Neto CFO Mike Brady EVP, General Counsel and Secretary Current President and CIO of NWI REIT Previously Senior Vice President, Acquisitions at Ventas Current CFO of NWI REIT Previously CFO of KEYreit and Retrocom REIT Chartered Accountant Current EVP, General Counsel and Secretary of NWH Previously a Partner at Baker & McKenzie LLP and McLean & Kerr LLP 13 Gerson Amado Managing Director Jan Krizan Managing Director 139 professionals Leading healthcare real estate asset management platform Relationships with hospital operators Rede D’Or SL and Sabara 2 professionals Established platform with full property management and asset management capabilities Office in Berlin 19 professionals David Carr CEO – VHP HQ in Toronto plus five regional offices President Australasia Fully integrated real estate owner and operator Fully integrated property management and asset management Offices in Auckland and Melbourne 12 professionals BOARD OF TRUSTEES EQUAL BOARD REPRESENTATION COMPRISED OF MAJORITY INDEPENDENT TRUSTEES HIGHLY EXPERIENCED BOARD OF TRUSTEES BOARD OF TRUSTEES Paul Dalla Lana Chairman & CEO Martin Barkin Trustee Independent Robert Baron Trustee Independent Bernard Crotty Trustee Colin Loudon Trustee Independent David Naylor Trustee Independent Brian Petersen Trustee Independent 14 Founder of NorthWest REITs Largest unitholder of NWI Director of Viventia Biotech and Viable healthworks Member of the Faculty of Medicine at the University of Toronto Current Trustee at NWI; Former Trustee of NWH Principal and founder of BCGI Baron Consulting Current Trustee at NWI, NWH and VHP Principal at Silver and White Management EVP, Strategy at Oxford Properties Group Chartered Accountant and Chartered Business Valuator President emeritus and professor of medicine at the University of Toronto Director of Barrick Gold and current trustee at NWI Independent financial consultant and merchant banker Previous Managing Director at RBC Capital Markets FINANCIAL PROFILE – MERGECO RUN RATE FY 2014 (1) In Place Run Rate Contracted Run Rate NOI $39.4 $80.8 $123.8 $134.2 FFO $14.9 $46.3 $55.4 $62.6 AFFO $33.2 $38.8 $63.1 $70.3 AFFO / Unit $0.21 $0.83 $0.88 $0.94 AFFO / Unit Accretion n.a. n.a. ~5% ~12% Payout Ratio 105.2% 95.9% 91.3% 85.4% LTV (Incl. Converts) 60.1% 55.3% 59.8% 59.5% MERGER ASSUMPTIONS MergeCo IN PLACE RUN RATE Exchange ratio of 0.208 for NWH to NWI units Cancellation of 11.9mm NWH units currently held by NWI Excess liquidity of ~$29mm used to reduce near term debt obligations Full year effect of acquisitions, dispositions and changes in capital structure during 2014 Reflect subsequent events, including: 1. For the year ended December 31, 2014 Elimination of 2014 non-recurring items (i.e. interest rate subsidy, interest income and F/X adjustments) Synergies of ~$1.5mm CONTRACTED RUN RATE NWI: management internalization and acquisition of Vital Management NWI: Brazilian refinancing and rental indexation NWH: Owen Sound acquisition and Polyclinique disposition NWH: $70.1mm mortgage refinancing at 3.1% Temporary increase to NWH CAPEX costs of $1.5M per annum to fund non-recurring deferred maintenance 15 Reflect contracted development and expansion projects in Canada, Brazil and VHP on a leverage neutral basis, which are expected to complete over the next 24 months Commitments are funded regionally with local financing including headroom on existing revolving facilities. Assumes issuance of 3.0mm units to fund equity requirement of ~$29mm FINANCIAL PROFILE – MERGECO CAPITALIZATION MERGECO CAPITALIZATION Market Capitalization(2) Enterprise Value Total Secured Debt Total Convertible Debentures Debt / GBV Excl. Converts Debt / GBV incl. Converts 1. 2. 3. 4. ~$680 Million ~$1,850 Million ~$1,007 Million ~$113 Million ~55% ~60% MERGECO OUTSTANDING DEBT (1) Balance O/S W.A. Term to Maturity W.A. Interest Rate Canada – Mortgages $632.0 4.8 4.6% Germany – Mortgages $75.6 4.1 2.3% Convertible Debentures – NWI $71.9 4.7 7.1% Convertible Debentures – NWH $40.9 5.8 5.3% Acquisition Facility $23.0 2.0 8.2% Brazil Term Loans $176.3 1.0 (2) 7.3% Corporate Debt (3) $84.6 1.1 7.1% Revolving Credit Facility (Max $50mm) $15.8 1.2 BA+2.00% Vendor Note $41.3 1.0 -- Long Term Debt Obligations Near Term Debt Obligations Debt balance and WATM shown as of December 31, 2014 ; Excludes deferred revenue related to Hospital Sabara Market value based on NWH unit price pre announcement The Brazil term loans mature between December 22, 2015 and January 2, 2016. On November 19, 2014, the REIT entered into a term sheet with a Brazilian financial institution to refinance up to $170mm of the term loans with a long term (12 year) facility Excess liquidity of ~$29mm used to reduce near term corporate debt obligations as part of the Transaction 16 FOREIGN EXCHANGE MANAGEMENT ~40% OF PORTFOLIO NOI GENERATED FROM INTERNATIONAL MARKETS 175.0 RENTAL INDEXATION ACTS AS NATURAL CURRENCY HEDGE 125.0 LOCAL CURRENCY PROPERTY / CORPORATE DEBT TO REDUCE INVESTMENT RISK OVER A 10 YEAR PERIOD, PORTFOLIO INDEX HAS REMAINED IN-LINE WITH ITS BASE VALUE 150.0 108.0 100.0 98.7 98.2 88.5 75.0 50.0 Jan-05 Jan-07 Jan-09 Jan-11 BRL/CAD EUR/CAD NZD/CAD Jan-13 Jan-15 Portfolio Average Historically, Euros and New Zealand Dollars have acted as a natural hedge against Brazilian Real Note: Portfolio index weighted by NOI including proportionally consolidated VHP NOI 17 KEY DRIVERS OF HEALTH CARE REAL ESTATE Aging Population Consolidation & Cost Savings Scale required for efficiency and quality >65 population cohort growing rapidly in developed countries 580mm people worldwide over 65 by 2018, ~10% of global population Increased Healthcare Spend Rise of Public Private partnerships $7.2 trillion global healthcare spending 10.6% of world GDP Growing 5.2% per year The Rise of Private Healthcare Budget pressures affecting the sustainability of public healthcare funding Governments mandating lower costs and improved quality Growing Populations and Wealth Creation Emerging economies demanding better access to quality care Patients seeking more choice and control 1. Source: Deloitte 2015 Global Healthcare sector outlook COMPELLING NEED FOR CAPITAL, FACILITIES AND REAL ESTATE SOLUTIONS 18 HEALTHCARE REAL ESTATE OPPORTUNITIES AND PERFORMANCE THE U.S. EXPERIENCE $1 Trillion Estimated U.S. Healthcare Real Estate Market Exceeds $1 Trillion $100 Billion & < 15% Largest Healthcare REITs Acquired More Than $100 Billion over Last 10 Years, But Still Owns Less than 15% of the Market Return & Stability Large U.S Healthcare REITs Historically Generated Better Returns with Less Volatility HISTORICAL NOI GROWTH OF “BIG 3 HEALTHCARE REITS (1) 6.0% 4.9% 3.7% 4.0% 2.0% 1.7% 1.5% 2007 2008 2009 2.0% 4.2% 3.3% -2010 2011 (2.0%) (4.0%) 1. Source: Green Street Advisors (May 2014) Big 3 HC REITs Major Sectors 19 2012 2013 KEY DRIVERS OF PRIVATE HEALTHCARE STRATEGY Canada Healthcare Regulatory Framework Germany Public Public / private Public / private Large aging population Growing middle class Large aging population Demographic Healthcare Spending(1) (2) Brazil Median population cohort is ages 50-54 ~11% of GDP US$212bn healthcare expenditures Median population cohort is ages 25-29 ~9% of GDP US$208bn healthcare expenditures Australasia Median population cohort is ages 45-49 ~12% of GDP US$411bn healthcare expenditures Real Estate Opportunities Limited ability to invest in hospital infrastructure Select PPP opportunities Fragmented ownership Alberta Health Services, largest health authority for the province Direct investment in public and private assets, including hospitals Sale/leaseback with large operators Primarily MOB product Ability to own clinics Potential for hospital ownership Healthcare Operator Relationships SickKids, leading children’s hospital in Ontario Other regional family health teams Rede D’Or SL, one of the largest and fastest-growing operators with 26 hospitals and ~2,800 beds Sabara, the leading children’s hospital in Sao Paulo 1. OECD average spending of ~9% of GDP 2. Source: Deloitte 2015 Country Healthcare Outlook 20 Family health teams Clinics / doctors Public / private Aging population balanced by younger cohorts Median population cohort is ages 35-44 ~11% of GDP US$172bn healthcare expenditures Direct investment in public and private assets, including hospitals PPP opportunities Sale/leaseback with large operators Healthscope, 2nd largest operator with 44 hospitals / ~4,500 beds Healthecare, one of the largest operators with 16 hospitals / ~1,500 beds TRANSACTION SUMMARY ARRANGEMENT AGREEMENT PROVIDES FOR CUSTOMARY RECIPROCAL BOARD SUPPORT TRANSACTION HIGHLIGHTS Transaction Overview Board Support Governance Voting Threshold Deal Protection Expected Closing 1. PRO FORMA OWNERSHIP NWI Unitholders will receive 0.208 of a NWH unit for each NWI unit held on a tax-deferred basis NWH units held by NWI would be redeemed and cancelled as part of the transaction Unanimous support from both NWH and NWI Boards of Trustees NWVP 34% (1) NWH Public Unitholders 48% Equal representation from the two entities at the Board level Board and management composition includes both NWI and NWH participation NWH – 66 2/3 of the votes cast at special meeting; Approval of a majority of the votes cast at the NWH special meeting, other than votes held by NWI NWI – 66 2/3 of the votes cast at special meeting Customary “fiduciary out” provisions Five day right to match $17 million reciprocal termination fee Expected in Q2 2015 Northwest Value Partners Inc. (“NWVP”) currently holds approximately 65% of NWI’s voting units. NWVP is wholly-owned by Paul Dalla Lana, who currently serves as Chairman of NWH and Chairman and CEO of NWI 21 NWI Public Unitholders 18% CONTACT INFORMATION NORTHWEST INTERNATIONAL HEALTHCARE PROPERTIES REIT NORTHWEST HEALTHCARE PROPERTIES REIT Paul Dalla Lana, Chairman & CEO 416-366-8300 Ext. 1001 Peter Riggin, CEO 416-601-3200 KINGSDALE SHAREHOLDER SERVICES Toll free: 1-877-659-1822 Collect outside North America: 1-416-867-2272 Email: [email protected] 22


© Copyright 2026