
Document 81622
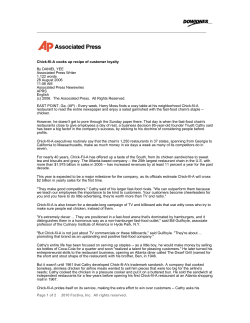
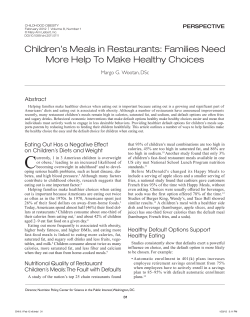
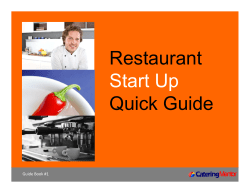
40 years…
and we’re still cookin’
AFC Enterprises, Inc. 2011 Annual Report
Louisiana
LouisianaKitchen
Kitchen
Over
Over
300
300
years
years
ago,
ago,
seven
seven
distinctive
distinctive
culinary
culinary
traditions
traditions
came
came
together
together
to create
to create
THE
THE
uniquely
uniquely
American
American
cuisine:Louisiana
cuisine:Louisiana
cooking.
cooking.
Now
Now
we’re
we’re
serving
serving
it up
it up
likelike
nobody
nobody
elseelse
can.can.
Carefully
Carefully
blending
blending
ourour
ownown
spices
spices
andand
seasonings,
seasonings,
hand
hand
battering
battering
ourour
famous
famous
® ®
Chicken
Chicken
andand
tenderly
tenderly
cooking
cooking
every
every
Bonafide
Bonafide
delicious
delicious
bitebite
long,
long,
slow
slow
andand
easy
easy
––
with
with
a lot
a lot
of heart.
of heart.
AllAll
to give
to give
youyou
an an
incredibly
incredibly
richrich
andand
soul-satisfying
soul-satisfying
taste
taste
of history!
of history!
Serving up results like nobody else
AFC Enterprises, Inc. (NASDAQ: AFCE) is the franchisor and operator of Popeyes® restaurants, the world’s
second-largest quick-service chicken concept based on number of units. Founded in 1972, Popeyes is a growing
global brand, bringing the flavor and festivals of Louisiana to people in 45 states across America, 25 countries,
and three territories: Guam, Puerto Rico, and the Cayman Islands. The passion that Popeyes guests have for our
bold, distinctive food is the same passion that over 345 franchisees have for the brand. The Popeyes brand offers
restaurant owners an excellent investment opportunity backed by exceptional franchisee support systems and
services. For AFCE investors, we believe the Popeyes highly franchised business model provides strong, stable
cash flows, a solid balance sheet, a diversified revenue stream, and significant opportunities for restaurant growth.
Financial Highlights & Key Operational Metrics(1)
(Dollars in millions, except per common share data)
2010
2011
Franchise revenues
Total revenues(1)
$ 153.8
$ 146.4
$ 148.0
$
$
$
Net income
95.0
2009
$
24.2
$
89.4
22.9
$
86.0
18.8
$
0.97
$
0.90
$
0.74
Adjusted earnings per common share, diluted
$
0.99
$
0.86
$
0.74
Operating EBITDA(4,6)
$
45.4
$
45.3
$
41.0
Earnings per common share, diluted
(2)
(3,6)
29.5%
Operating EBITDA margin
(4,6)
Free cash flow
(5,6)
$
28.5
30.9%
$
26.3
27.7%
$
23.7
Global system-wide sales growth(7)
6.6%
5.1%
1.8%
Domestic system-wide same-store sales growth
3.0%
2.5%
0.6%
International system-wide same-store sales growth
3.3%
3.1%
1.9%
Global system-wide same-store sales growth
3.1%
2.6%
0.7%
140
106
95
2,035
1,977
1,943
New restaurant openings
Total restaurants
See page 8 for definitions, computations, and reconciliations to GAAP measures.
Serving it up by design
Popeyes has grown over the past 40 years by creating a distinctive, relevant brand and an attractive franchise model
that delivers results for restaurant owners and AFCE investors. In 2008, we established a Strategic Road Map for Results to
re-energize Popeyes, with four pillars to guide our decision making. We’ve been serving up industry-leading innovation and
performance improvements ever since.
We follow a disciplined approach that addresses all the elements of a great restaurant company:
Superior affordable food so good you can’t wait to eat at Popeyes
Service so good you can’t wait to come back to Popeyes
Profits so good that you are thrilled to own a Popeyes
Returns so good you can’t wait to build more Popeyes
2011 ANNUAL REPORT 1
1
Build a Distinctive Brand
Global Same-store
Sales Growth
3.1%
2.6%
— David Ho
Owns and operates nine Popeyes restaurants in the Washington, D.C. market
0.7%
2009
“I attribute our momentum in the market to the combination of local
and national media, with a local store marketing twist of an everyday
value proposition for my customers. I believe that media and new
product news help in driving people into my stores, but it’s the great
service, operations, and value that keep bringing them back.”
2010
2011
There is a special ingredient in every memorable recipe
for which there is no substitute. For Popeyes, that special
ingredient is our Louisiana heritage. It infuses everything
about the brand – from our bold, flavorful food to the festivals
and zest for life that is ever present in Louisiana. This heritage
has become the lens through which every innovation and
initiative is evaluated and measured.
Annie, our beloved spokesperson, adds spice and authenticity
to the brand in national advertising and marketing materials.
Her persona demands attention, and she clearly resonates
with our guests. Powered by national advertising, our
commercials are drawing guests into Popeyes restaurants
and distinguishing us from the competition.
Our guests come to our restaurants for the bold flavor of
our core menu, and they are just as delighted with our new
product innovation. Wicked Chicken, introduced in 2010,
was the most successful product launch in Company history.
Last year, it won the 2011 MenuMasters Award for Best
Limited Time Offer. Rip’n Chick’n, introduced in 2011, was
our most successful local Limited Time Offer. Dip’n Chick’n,
2 AFC ENTERPRISES, INC.
also introduced in 2011, was our most successful boneless
promotion. Our 2pc/9pc Bonafide® chicken offer was our most
successful value promotion. With each promotion, we are
raising the bar, drawing on innovation in the kitchen and in our
marketing strategy to deliver solid results.
In 2011, we expanded our menu to include Louisiana
Leaux™ and a Get Up & Geaux!™ Kids Meal. By adding
Naked Chicken Tenders, green beans, and apple sauce to
our menu, we gave our guests reduced calorie/fat/sodium
alternatives. We celebrated the launch of these menu
additions with a dancing-in-the-streets celebration held in
the New Orleans French Quarter.
After 40 years, we’re still cooking in our Louisiana kitchen
– and throughout 2012 we’ll be rolling out a new look to
Popeyes Louisiana Kitchen restaurants. This fresh image
communicates both Louisiana and premium-quality food
while adding a relevant and contemporary appearance.
Taken together, our heritage, our food, our marketing, and
our new restaurant image make Popeyes a distinct brand
with plenty of growth opportunity.
Run Great Restaurants
“In this competitive environment, we must continually be on top
of the competition if we are to succeed with the value-driven
mindset consumers have. And value is so much more than
just price. Our unique food, presented quickly by a friendly
crew, is what we strive for on a shift-by-shift basis.”
GEM “% Delighted”
70%
74%
77%
— Scott Stockton
Vice President of Operations, POP Investments; 72 Popeyes in Texas, Oklahoma, and Florida
2009 Q4
A great restaurant company requires more than just
exceptional food. It requires an exceptional guest experience.
Since putting our Strategic Road Map for Results in place,
we’ve worked to build a culture dedicated to achieving
operating excellence at each and every restaurant, making
our service as good as our food. We want everyone to focus
on doing the right things, doing them well, and serving our
guests Louisiana Fast™. This means providing our guests
with an overall authentic, friendly, and memorable experience
so good they’ll want to return again and again.
We are deliberate in our efforts to deliver excellent service,
and we are data-driven in our measurement of success. We
use a balanced scorecard that encompasses critical aspects
of the business, from guest satisfaction to talent and training,
and same-store sales to profitability.
At the heart of the scorecard is our “GEM” – Guest
Experience Monitor – that encourages guests to provide
immediate feedback about their visit through a brief
interactive survey. Tracking this data enables management
to make smart, fact-based decisions and identify areas of
greatest opportunity.
2010 Q4
2011 Q4
Since the GEM rollout to domestic restaurants, scores
have improved significantly across all categories: “Percent
Delighted,” “Intent to Return,” and “Speed of Service.”
Our guests have never been more satisfied, and we have
never been more determined to drive these scores even
higher – especially at the drive-thru window.
One of the greatest indicators of guest satisfaction is speed
of service. Headsets and timer equipment are now standard
throughout the system, and we use clear metrics to measure
performance. With the vast majority of restaurants reporting
drive-thru service times, improving speed of service has
become entrenched in our restaurant culture. By year-end
2011, over 75 percent of all reported drive-thru system
transactions were achieving three minutes or less total
service time.
Internationally, GEM was in 48 percent of all restaurants
at year-end 2011. It will be rolled out to additional
countries in 2012 and, in similar fashion to the domestic
system, it is becoming a key measurement tool for
international performance.
2
2011 ANNUAL REPORT 3
Harry Stafford
Franchisee in Texas
3
Grow Restaurant Profits
ROP Dollars and Margins*
30%
$250
($ in thousands)
$200
$191,000
$209,000 $211,000
$50
0
27%
24%
$150
$100
21%
19.5%
18.7%
18.4%
2009
Charles Boyd
Franchisee in Texas, Georgia,
and North Carolina
2010
2011
18%
“Until now, we did not have the ability to do theoretical versus
actual inventory. Now, with the software as a service platform,
I have information for all my restaurants at my fingertips. With
access to the Internet, I can find out immediately what my
sales are, my weekly numbers; it’s been a big benefit to us.”
— Danny Gililland
Owns and operates six Popeyes restaurants in the Little Rock, AR market
15%
We are passionate about the success of our franchisees – they
are our customers at AFC Enterprises. Our ability to provide
exceptional marketing programs and franchisee support
enhances their ability to make money. So we partner alongside
our franchisees, with cross-functional brand and field support
teams and with Supply Management Services, Inc., our
supply chain purchasing cooperative, to focus on growing
profits at the restaurant level.
While growing top line sales is the fastest way to grow
restaurant profits, we also remain intent on cutting costs to
benefit the bottom line. Our strategies include reducing costs
both inside and outside the four walls of the restaurant.
In 2011, higher commodity costs challenged restaurant
profits – for Popeyes and the industry – and we redoubled
our focus on cost reduction measures. To drive costs out
of the restaurants, we continue to lower costs of goods
and services coming into the restaurants. By securing
national supply chain savings, adding national procurement
programs, and partnering with our suppliers to control
delivered costs, our teams delivered 0.5 percentage points
in cost savings to the average restaurant bottom line.
*ROP margins are domestic franchise freestanding restaurant operating profit margins before rent.
4 AFC ENTERPRISES, INC.
We also work to reduce costs incurred inside the four walls
of the restaurants through benchmarking performance,
and by using the right processes and tools. Partnering
with a third-party “software as a service” provider, we have
developed, piloted, and are rolling out a standardized
approach for back-of-house business processes that supports
our efforts to drive waste and costs from restaurant operations.
Our franchisees are extraordinary people, and we continue
to coach, train, and develop them and their crews to achieve
superior results. Our aim is to help franchisees attract, develop,
motivate, and retain employees to provide guests with exceptional
and distinctive service. When we bring our franchisees together
as a group, all are eager to share their best practices, to learn
from others, and to be among the top performers.
Because we are so information-driven, each year we turn
the tables and have our franchisees rate us as a franchisor.
Our 2011 report card showed high marks, with 91 percent
of domestic franchisees rating the franchise from good to
excellent. Internationally, in a leadership transition year, more
than 80 percent said they feel good about the quality of the
Popeyes franchising opportunity. These results attest to our
strong partnership with our franchisees, as we work together
to grow their restaurant profits.
Accelerate Quality Restaurant Openings
“One of the keys to our successful location in Sparks, NV was
Popeyes highly effective site selection process, modeling tools,
and analytics. We’re taking advantage of location, location,
location. With the tremendous success of my first Popeyes,
I’m now making plans for restaurant number two.”
— Dr. Luther Mack, Jr.
Owns and operates the Popeyes in Sparks, Nevada, which set an all-time opening sales record in 2010
and remains among the highest volume restaurants within the system
With 40 years of experience behind us, and significant
growth opportunities ahead of us both in the U.S. and
around the globe, Popeyes is well poised for the future.
In 2011, we celebrated the opening of our 2,000th restaurant
in Memphis, Tennessee. Throughout the year, we opened
140 restaurants around the globe, 34 more than the previous
year. Our net growth was 65 new restaurants, including
46 domestic units. The Popeyes system built more domestic
freestanding franchised units on a percentage basis than
any other of our quick-service restaurant (QSR) competitors in
2011. As important, and exciting, is the fact that franchisees
are opening new restaurants to greater success, with
volumes about 40 percent above our system average.
The Popeyes system continues to thrive and grow, even in
the challenging economy of recent years. For this, we credit
the strong partnership we enjoy with our franchisees and the
powerful impact of implementing our Strategic Road Map.
One example where partnership and strategy meet is in
the work of the Popeyes Development Team, which has
become a valuable asset to existing and new franchisees,
Net Unit Growth
65
39
14
2009
2010
2011
helping to grow the number of restaurants around the world.
Once a new restaurant is open, we continue to provide a
strong supporting infrastructure, with marketing, operations,
training, systems, and finance experts. And while Popeyes
has traditionally been viewed as a restaurant concept for
urban markets, we’ve been expanding our reach in suburban
locations, some of which are proving to be among our
highest-volume restaurants.
The brand’s dollar share of sales at chicken quick-service
restaurants is growing. To build on this momentum, we
announced aggressive growth plans for several domestic
markets: Los Angeles and San Diego in Southern California;
and Tampa and Orlando in Florida. We believe there is plenty of
opportunity to grow, both in domestic and international markets.
The unique tie we have to Louisiana cuisine and culture
differentiates Popeyes from other QSR concepts – and
that, along with our support systems and services,
makes us an attractive opportunity for restaurant
owners and AFCE investors alike.
4
2011 ANNUAL REPORT 5
To Our Stakeholders
As we celebrate our 40th year, Popeyes is cookin’. We just completed our third
straight year of positive same-store sales. We are gaining market share in a
sluggish economy. And, according to independent data, our same-store sales
have outpaced our competitors in the chicken quick-service restaurant (QSR)
category for the past 15 quarters. We’re doing exactly as promised four years
ago when we established our Strategic Road Map for Results to re-energize
Popeyes and unleash its full potential.
Cheryl A. Bachelder
Chief Executive Officer, AFC Enterprises, Inc.
Serving up results
The Popeyes brand resonates with hungry
guests who return again and again for our
flavorful food and compelling everyday
value. Throughout 2011, many QSR
brands struggled, as restaurants faced the
headwinds of low consumer confidence,
high levels of unemployment, and rising
commodity prices. Still, Popeyes served up
another year of positive results, financially
and operationally.
» Adjusted earnings were $0.99 per
diluted share versus $0.86 in 2010.
Operating EBITDA margins remained
among the highest in the restaurant
industry at 29.5 percent of total
revenues, and we generated more than
$28 million in free cash flow.
» Global same-store sales grew 3.1 percent,
the combined result of positive growth of
3.0 percent domestically and 3.3 percent
in international markets. Restaurant
operating profits in absolute dollars have
grown for the third straight year despite
record high costs.
» We opened a net total of 65 new
restaurants, bringing the system
to a record 2,035. On a percentage
basis, the Popeyes system opened
more domestic freestanding
franchised restaurants than any
of our QSR competitors in 2011.
» Our guests tell us they are enjoying
a better experience than ever before,
as evidenced by scores on our
Guest Experience Monitor survey that
show record highs in virtually every
operational metric.
6 AFC ENTERPRISES, INC.
We were honored by several prestigious
organizations during 2011.
Serving up talent
» For the second time in our history,
we won a MenuMasters Award, with
Wicked Chicken named the Best
Limited Time Offer.
A key aspect underlying all we do is talent
– the restaurant crews and corporate
staff who bring our strategy to life every
day. Over the past year, we have made
important changes to our leadership team.
» Popeyes Louisiana Kitchen is featured
as one of the 15 most relevant and
successful recent brand refreshes in
the Graphic Design: Now in Production
exhibition, organized by the Walker Art
Center in Minneapolis, in collaboration
with the Smithsonian’s Cooper-Hewitt,
National Design Museum in New York.
» We won two top honors in Brandon
Hall’s Excellence in Learning and Talent
Management awards for the Best
Use of Blended Learning and Best
Onboarding Program.
In the QSR industry, money is made
in slivers of percentages, and so we
continued our focus on restaurant
profitability. In 2011, we saved
approximately $9 million in supply-chain
food costs throughout the Popeyes
system, on top of $16 million saved in
2010. While we saw a decline in restaurant
operating profit margin on a percentage
basis, 2011 was the third year in a row we
delivered increased absolute profit dollars
to our franchisees. We continue working
diligently on in-restaurant cost controls
to reduce waste and utilities. We’ve also
stepped up our business intelligence
systems for better data collection and
analysis for key metrics.
Ralph Bower was named President-U.S.
in March 2012, leading day-to-day U.S.
operations for Popeyes restaurants. In
his previous role as Chief Operating
Officer, Ralph was instrumental in
both the strategy and execution of
our Strategic Road Map for Results,
creating an impressive record of
accomplishments.
Dick Lynch assumed the newly created
role of Chief Global Brand Officer in
December. Over the past four years,
as Chief Marketing Officer, he led the
transformation of the Popeyes brand,
with new positioning, messaging,
culinary innovation, and Bonafide®
chicken promotions that are clearly
resonating with guests. We are now at a
natural inflection point for Dick to extend
the power of Popeyes Louisiana Kitchen
positioning globally.
Andrew Skehan joined Popeyes in
August in the role of Chief Operating
Officer, International. With his hands-on
experience in building winning teams
and restaurants around the globe,
Andrew is ideally suited to support our
expansion plans and help our franchise
partners succeed.
Lynne Zappone joined us in April in
the newly created role of Chief Talent
Officer. She is responsible for making
sure we have the right people doing the
right things in the right places to deliver
our strategic plan. What will ultimately
differentiate Popeyes will be the results
we accomplish and how our people go
about accomplishing them.
Our purpose, and my personal passion,
is to develop a deep bench of servicefocused leaders who deliver superior
results, building on our accomplishments
to date.
“
Serving up mindshare
What makes Popeyes a distinctive
and relevant brand is its Louisiana
heritage. Even as we began our brand
transformation, we continued to embrace
and celebrate this distinguishing
characteristic. Today, it drives everything
from our menu and the look of our new
restaurants to promotions and advertising.
It’s even infused in our beverage strategy,
with both Cane Sweeeet Iced Tea and
Flavoriety™ quenching our guests’ thirst
in a big way while delivering double-digit
growth in 2011 beverage volume.
We have outpaced our competitors
in chicken quick-service restaurants
(QSR) for the past 15 quarters.
Serving up strategy
All we’ve accomplished springs from a
strategy that capitalizes on the strengths
of our business model as a highly
franchised restaurant system. This model
provides diverse and reliable earnings,
with steady cash flow and low capital
spending requirements.
Our Strategic Road Map for Results has
proven its value by performing well for
investors, for franchisees, and for guests
who have developed a passion for our
Louisiana-inspired cuisine and culture.
It is built on four pillars that we believe
make a great restaurant company: build
a distinctive brand; run great restaurants;
grow restaurant profits; accelerate quality
restaurant openings.
Our singular focus on executing these
pillars is responsible for making Popeyes
a competitive brand that’s capturing
market share and accelerating long-term
growth prospects. We’ve always been
passionate about our food, and, for the
past four years, we’ve brought that same
passion to building a stronger foundation
for performance.
”
Our TV spokesperson Annie adds
authenticity and knowledge, mixed with a
lot of charisma, to the Popeyes Louisiana
Kitchen brand. In 2011, we added a sixth
cycle of national advertising to our media
plans, and we saw the results with more
guest traffic coming through our doors.
Our message platform positions
Popeyes as slow-cooked, Louisianainspired home cooking for a fast-paced
life: we’re Louisiana Fast™. In the past
four years, we’ve re-energized the brand.
Now we’re extending a new look and
feel to the bricks and mortar of Popeyes
restaurants. Beginning in late 2011, we
introduced a stunning new design in
select markets that visually reinforces
our heritage and premium-quality food,
imparting a contemporary feel. In 2012,
we are targeting 600 restaurants to
adopt the new look.
Serving up the future
Through our philanthropic arm, The
Popeyes Foundation, Inc., we are
working to engage the next generation
of passionate foodies and Popeyes
restaurateurs by partnering with
ProStart®, a program of the National
Restaurant Association Educational
Foundation. This nationwide two-year
high school program introduces students
and teachers to careers in the restaurant
industry through mentoring, internships,
and training opportunities.
It is immensely rewarding to look back
at the last four years and mark how
well our strategy has molded Popeyes
into a global brand that is outpacing
the competition. As we like to say, “You
ain’t seen nothin’ yet!” Few 40-year-old
brands have such growth opportunities in
both domestic and international markets.
Even fewer can cite the level of quality
openings, with average unit volumes
of new domestic restaurants about
40 percent above our system average.
As we celebrate our 40th anniversary
throughout 2012, our thoughts will be on
the next 40 or 50 or 100 years. We know
we have to win over our guests every
single time they come through the door,
which is something our franchisees,
restaurant managers, and crews do
really well. Through steady, consistent
improvements, they give guests – and, by
extension, AFCE investors – more reasons
to trust us with their hard-earned dollars.
The entire Popeyes team remains
committed to delivering flavorful food and
a distinctive experience to our guests…
with a festival feeling of Louisiana that’s
unique to our restaurants.
Sincerely,
Cheryl A. Bachelder
CEO, AFC Enterprises, Inc.
2011 ANNUAL REPORT 7
Board of Directors
[Left to right]
1. Krishnan Anand
President: International Division of
Molson Coors Brewing Company
Director since: 2010 Age: 54
3. Carolyn Hogan Byrd
Founder, Chair & Chief Executive
Officer: GlobalTech Financial, LLC
Director since: 2001 Age: 63
5. Cheryl A. Bachelder
Chief Executive Officer:
AFC Enterprises, Inc.
Director since: 2006 Age: 55
2. R. William Ide, III
Partner: McKenna Long &
Aldridge, LLP
Director since: 2001 Age: 71
4. John M. Cranor, III
Chairman: AFC Enterprises, Inc.
Director since: 2006 Age: 65
6. Kelvin J. Pennington
President: Pennington
Partners & Co.
Director since: 1996 Age: 53
7. John F. Hoffner
Director: AFC Enterprises, Inc.
Director since: 2006 Age: 64
8. Victor Arias, Jr.
Senior Client Partner:
Korn/Ferry International
Director since: 2001 Age: 55
(1) Additional information concerning financial performance can be found in AFC’s Consolidated Financial Statements and Management’s Discussion & Analysis of Financial Condition and Results of Operations in the 2011 Annual Report on
Form 10-K, including, without limitations, information in Item 7 of the Annual Report related to total revenues.
(2) Weighted average common shares for the computation of diluted earnings per common share were 25.0 million, 25.5 million and 25.4 million for 2011, 2010 and 2009, respectively.
(3) The Company defines adjusted earnings for the periods presented as the Company’s reported net income after adjusting for
certain non-operating items consisting of the following: (i) other expense (income), net, as follows: for 2011, includes
$0.8 million in expenses for the global service center relocation, and $0.5 million in impairments and disposals of
fixed assets offset by a $0.8 million net gain on the sale of assets; for 2010, includes $0.7 million for impairments and
disposals of fixed assets partially offset by $0.5 million for net gain on sales of assets; for 2009, includes $3.3 million
on the sale of assets partially offset by $0.6 million related to impairments and disposals of fixed assets and $0.6 million
of other expense; (ii) for fiscal 2011, $0.5 million in accelerated depreciation related to the Company’s relocation to a new
corporate service center; (iii) fiscal years 2010 and 2009, the interest charges associated with the refinancing of the Company’s
credit facility; (iv) the tax effect of these adjustments; and (v) for fiscal 2010 the tax audit benefit. Adjusted earnings per diluted
share provides the per share effect of adjusted net income on a diluted basis. The following table reconciles on a historical
basis for 2011, 2010 and 2009, the Company’s adjusted earnings per diluted share on a consolidated basis to the line on its
consolidated statement of operations entitled net income, which the Company believes is the most directly comparable GAAP
measure on its consolidated statement of operations to adjusted earnings per diluted share:
(In millions, except per share data)
2011
2010
2009
Net income
$ 24.2
$ 22.9
$ 18.8
Other expenses (income), net
$ 0.5
$ 0.2
$ (2.1)
Accelerated depreciation related to the Company’s
relocation to a new Global Service Center
$ 0.5
—
—
Interest charges associated with refinancing of credit facility
—
$ 0.6
$ 1.9
Tax effect
$ (0.5)
$ (0.3)
$ 0.1
Tax audit benefit
—
$ (1.4)
—
Adjusted net income
$ 24.7
$ 22.0
$ 18.7
Adjusted earnings per diluted share
$ 0.99
$ 0.86
$ 0.74
Weighted average diluted shares outstanding
25.0
25.5
25.4
(5) The Company defines free cash flow as “net income” plus “depreciation and amortization”, plus “stock-based
compensation expense”, minus “maintenance capital expenditures” (which includes: for 2011, $1.5 million in
Company restaurant reimages, $0.8 million of information technology hardware and software, and $0.5 million
in other capital assets to maintain, replace and extend the lives of Company-operated restaurant facilities and
equipment; for 2010, $1.4 million for information technology hardware and software, $1.2 million for reopening a
Company restaurant in New Orleans and restaurant reimaging and corporate office construction, and $0.6 million
in other capital assets to maintain, replace and extend the lives of Company-operated facilities and equipment;
and for 2009, $0.3 million for information technology hardware and software and $1.1 million in other capital
assets to maintain, replace and extend the lives of Company-operated restaurant facilities and equipment). In 2011,
maintenance capital expenditures exclude $3.3 million related to the construction of the new corporate office, and
$1.5 million for the construction of new Company-operated restaurants. The Company’s definition of free cash flow
has been changed to exclude the effects of mandatory debt payments as management believes the new definition
conforms to the free cash flow definition more commonly used by analysts, investors and lenders. The following table
reconciles on a historical basis for 2011, 2010 and 2009, the Company’s free cash flow on a consolidated basis to
the line on its consolidated statement of operations entitled net income, which the Company believes is the most
directly comparable GAAP measure on its consolidated statement of operations to free cash flow:
(Dollars in millions)
Net income
Depreciation and amortization
Stock-based compensation expense
Maintenance capital expenses
2011
$ 24.2
$ 4.2
$ 2.9
$ (2.8)
2010
$ 22.9
$ 3.9
$ 2.7
$ (3.2)
2009
$ 18.8
$ 4.4
$ 1.9
$ (1.4)
Free cash flow
$ 28.5
$ 26.3
$ 23.7
(6) Adjusted earnings per diluted share, Company-operated restaurant operating profit margins, Operating EBITDA, and
(4) The Company defines Operating EBITDA as “earnings before interest expense, taxes, depreciation and amortization, and
free cash flow are supplemental non-GAAP financial measures. The Company uses Company-operated restaurant
other expenses (income), net”. The following table reconciles on a historical basis for 2011, 2010 and 2009, the Company’s
operating profit margins, Operating EBITDA, free cash flow and adjusted earnings per diluted share, in addition
earnings before interest expense, taxes, depreciation and amortization, and other expenses (income), net (“Operating EBITDA”) to net income, operating profit and cash flows from operating activities, to assess its performance and believes
on a consolidated basis to the line on its consolidated statement of operations entitled net income, which the Company
it is important for investors to be able to evaluate the Company using the same measures used by management.
believes is the most directly comparable GAAP measure on its consolidated statement of operations to Operating EBITDA.
The Company believes these measures are important indicators of its operational strength and performance of its
“Operating EBITDA as a percentage of Total Revenues” is defined as “Operating EBITDA” divided by “Total Revenues”.
business because they provide a link between profitability and operating cash flow. Company-operated restaurant
(Dollars in millions)
2011
2010
2009
operating profit margins, Operating EBITDA, free cash flow and adjusted earnings per diluted share as calculated by
Net income
$ 24.2
$ 22.9
$ 18.8
the Company are not necessarily comparable to similarly titled measures reported by other companies. In addition,
Interest expense, net
$ 3.7
$ 8.0
$ 8.4
Company-operated restaurant operating profit margins, Operating EBITDA, free cash flow and adjusted earnings
Income tax expense
$ 12.8
$ 10.3
$ 11.5
per diluted share: (a) do not represent net income, cash flows from operations or earnings per share as defined
Depreciation and amortization
$ 4.2
$ 3.9
$ 4.4
by GAAP; (b) are not necessarily indicative of cash available to fund cash flow needs; and (c) should not be
Other expenses (income), net
$ 0.5
$ 0.2
$ (2.1)
considered as an alternative to net income, earnings per share, operating profit, cash flows from operating
Operating EBITDA
$ 45.4
$ 45.3
$ 41.0
activities or other financial information determined under GAAP.
Total Revenues
$ 153.8
$ 146.4
$ 148.0
(7) System-wide sales growth calculates combined sales of all restaurants that we operate or franchise. Sales information
Operating EBITDA as a percentage of Total Revenues
29.5%
30.9%
27.7%
for franchised restaurants is provided by our franchisees. System-wide sales are unaudited.
8 AFC ENTERPRISES, INC.
Design: Eisenman Associates. Copywriting: Amy Binder. Photography: Haigwood Studios, Scott Housley Photography, Laura Noel. Printing: Harty Press, RR Donnelley.
Design: Eisenman Associates. Copywriting: Amy Binder. Photography: Haigwood Studios, Scott Housley Photography, Laura Noel. Printing: Harty Press, RR Donnelley.
Cautionary
Cautionary
Note
Note
Regarding
Regarding
Forward-Looking
Forward-Looking
Statements
Statements
Forward-Looking
Forward-Looking
Statement:
Statement:
Certain
Certain
statements
statements
in this
in Annual
this Annual
Report
Report
contain
contain
“forward-looking
“forward-looking
statements”
statements”
within
within
the meaning
the meaning
of theof the
federal
federal
securities
securities
laws.laws.
Statements
Statements
regarding
regarding
future
future
events
events
and developments
and developments
and our
and future
our future
performance,
performance,
as well
as well
as management’s
as management’s
current
current
expectations,
expectations,
beliefs,
beliefs,
plans,
plans,
estimates,
estimates,
or projections
or projections
relating
relating
to thetofuture,
the future,
are forward-looking
are forward-looking
statements
statements
within
within
the meaning
the meaning
of of
thesethese
laws.laws.
These
These
forward-looking
forward-looking
statements
statements
are subject
are subject
to a to
number
a number
of risks
of risks
and uncertainties.
and uncertainties.
Examples
Examples
of such
of such
statements
statements
in this
in this
Annual
Annual
Report
Report
include
include
discussions
discussions
regarding
regarding
the Company’s
the Company’s
planned
planned
implementation
implementation
of itsofstrategic
its strategic
plan,plan,
the Company’s
the Company’s
future
future
cashcash
flows,
flows,
revenues,
revenues,
financial
financial
position,
position,
and opportunities
and opportunities
for restaurant
for restaurant
growth,
growth,
projections,
projections,
and expectations
and expectations
regarding
regarding
same-store
same-store
salessales
for for
fiscalfiscal
20122012
and beyond,
and beyond,
the Company’s
the Company’s
ability
ability
to improve
to improve
restaurant
restaurant
levellevel
margins,
margins,
guidance
guidance
for new
for new
restaurant
restaurant
openings
openings
and closures,
and closures,
and the
andCompany’s
the Company’s
anticipated
anticipated
20122012
and long-term
and long-term
performance,
performance,
including
including
projections
projections
regarding
regarding
general
general
and administrative
and administrative
expenses,
expenses,
and net
andearnings
net earnings
per diluted
per diluted
share,
share,
and similar
and similar
statements
statements
of belief
of belief
or expectation
or expectation
regarding
regarding
future
future
events.
events.
Among
Among
the important
the important
factors
factors
that could
that could
cause
cause
actual
actual
results
results
to differ
to differ
materially
materially
fromfrom
thosethose
indicated
indicated
by such
by such
forward-looking
forward-looking
statements
statements
are: are:
competition
competition
fromfrom
otherother
restaurant
restaurant
concepts
concepts
and food
and food
retailers,
retailers,
continued
continued
disruptions
disruptions
in theinfithe
nancial
financial
markets,
markets,
the loss
the loss
of franchisees
of franchisees
and other
and other
business
business
partners,
partners,
laborlabor
shortages
shortages
or increased
or increased
laborlabor
costs,
costs,
increased
increased
costscosts
of our
of principal
our principal
foodfood
products,
products,
changes
changes
in consumer
in consumer
preferences
preferences
and demographic
and demographic
trends,
trends,
as well
as well
as concerns
as concerns
aboutabout
health
health
or food
or food
quality,
quality,
instances
instances
of avian
of avian
flu orfluother
or other
food-borne
food-borne
illnesses,
illnesses,
general
general
economic
economic
conditions,
conditions,
the loss
the loss
of senior
of senior
management
management
and the
andinability
the inability
to attract
to attract
and retain
and retain
additional
additional
qualifi
qualifi
ed management
ed management
personnel,
personnel,
limitations
limitations
on our
on business
our business
underunder
our credit
our credit
facility,
facility,
our ability
our ability
to comply
to comply
with with
the repayment
the repayment
requirements,
requirements,
covenants,
covenants,
tests,tests,
and and
restrictions
restrictions
contained
contained
in ourin credit
our credit
facility,
facility,
failure
failure
of our
of franchisees,
our franchisees,
a decline
a decline
in theinnumber
the number
of franchised
of franchised
units,units,
a decline
a decline
in ourin ability
our ability
to to
franchise
franchise
new new
units,units,
slowed
slowed
expansion
expansion
into new
into new
markets,
markets,
unexpected
unexpected
and adverse
and adverse
fluctuations
fluctuations
in quarterly
in quarterly
results,
results,
increased
increased
government
government
regulation,
regulation,
effects
effects
of volatile
of volatile
gasoline
gasoline
prices,
prices,
supply
supply
and delivery
and delivery
shortages
shortages
or interruptions,
or interruptions,
currency,
currency,
economic,
economic,
and political
and political
factors
factors
that affect
that affect
our international
our international
operations,
operations,
inadequate
inadequate
protection
protection
of our
of intellectual
our intellectual
property
property
and liabilities
and liabilities
for environmental
for environmental
contamination,
contamination,
and the
andother
the other
risk factors
risk factors
detailed
detailed
in this
in Annual
this Annual
Report
Report
and other
and other
documents
documents
we fiwe
le with
file with
the Securities
the Securities
and Exchange
and Exchange
Commission.
Commission.
Therefore,
Therefore,
you should
you should
not place
not place
undue
undue
reliance
reliance
on any
on forward-looking
any forward-looking
statements.
statements.
Shareholder
Shareholder
Information
Information
Principal
Principal
Office
Office
Other
Other
Information
Information
400 Perimeter
400 Perimeter
Center
Center
Terrace
Terrace
SuiteSuite
10001000
Atlanta,
Atlanta,
GA 30346
GA 30346
404-459-4450
404-459-4450
The Company’s
The Company’s
presspress
releases,
releases,
annual
annual
reports,
reports,The Company’s
The Company’s
20112011
Annual
Annual
Report
Report
on Form
on Form
and other
and other
information
information
can be
canaccessed
be accessed
10-K,10-K,
as filed
as fiwith
led with
the Securities
the Securities
and Exchange
and Exchange
through
through
the Company’s
the Company’s
website:
website:
Commission,
Commission,
is being
is being
delivered
delivered
with this
with Letter
this Letter
www.afce.com
www.afce.com
to Our
to Stakeholders.
Our Stakeholders.
Form
Form
10-K
10-K
Stock
Stock
Transfer
Transfer
Agent
Agent
Annual
Annual
Meeting
Meeting
Computershare
Computershare
TrustTrust
Company,
Company,
N.A. N.A.
P. O. PBox
. O. 43078
Box 43078
Providence,
Providence,
RI 02940-3078
RI 02940-3078
800-962-4284
800-962-4284
www.computershare.com
www.computershare.com
AFC’s
AFC’s
20122012
Annual
Annual
Meeting
Meeting
will will
be held
be held
at: at:
Hilton
Hilton
Garden
Garden
Inn—Atlanta
Inn—Atlanta
Perimeter
Perimeter
Center
Center
15011501
LakeLake
Hearn
Hearn
DriveDrive
Atlanta,
Atlanta,
GA 30319
GA 30319
8:30 8:30
AM ET,
AMMay
ET, May
15, 2012
15, 2012
404-459-0500
404-459-0500
Copies
Copies
of the
ofAnnual
the Annual
Report
Report
on on
FormForm
10-K10-K
are also
are also
available
available
without
without
charge
charge
uponupon
written
written
request
request
to: to:
AFC AFC
Enterprises,
Enterprises,
Inc. Inc.
400 Perimeter
400 Perimeter
Center
Center
Terrace
Terrace
SuiteSuite
10001000
Atlanta,
Atlanta,
GA 30346
GA 30346
Attn:Attn:
Investor
Investor
Relations
Relations
www.investor.afce.com
www.investor.afce.com
© Copyright,
© Copyright,
AFC Enterprises,
AFC Enterprises,
Inc., 2012.
Inc., 2012.
All rights
All rights
reserved.
reserved.
AFC Enterprises, Inc. 2011 Annual Report
AFC Enterprises, Inc. • 400 Perimeter Center Terrace • Suite 1000• Atlanta, GA 30346 • www.afce.com


© Copyright 2026