
better health-but not for all: the swedish public health report, 1987
BETTER HEALTH-BUT NOT FOR ALL:
THE SWEDISH PUBLIC HEALTH REPORT, 1987
Finn Diderichsen and Gudrun Lindberg
This article is a summary of the Public Health Report submitted to the Swedish
Parliament in 1987. Health development, especially that of underprivileged groups,
is regarded as an indicator of the quality of social and economic development of the
country. Sweden is a very egalitarian country, but in spite of decreasing inequalities
in living standards, the Report shows increasing inequalities in health. At the same
time, the state has put restraints on health care spending, and the shift in the health
care budget toward more primary care has stopped. This development seriously impairs the ability of the health and medical services to cope with inequities described
in this Report.
THE DEVELOPMENT OF PUBLIC HEALTH
191 1: Toward a Better Public Health
The previous national public health report in Sweden was published in 1911 (1).
In 1911-just as today-Sweden was passing through a period of very rapid public
health improvement. Water and sewerage mains had been widely installed in the towns
and cities, with the result that infant mortality was halved in a couple of decades, and
average life expectancy increased by more than five years. It was considered axiomatic
that the government had a duty of working to improve the state of public health, but
a great deal remained to be achieved. Average life expectancy in those days was
57 years, as against 77 today. Infant mortality was 70 per 1,000 births, i.e., ten times
what it is today-a level that still prevails in many poor countries of the world. The
high level of excess mortality among children born out of wedlock also declined during
the early decades of this century. Hygiene legislation proved to have a considerable
effect on mortality, not least among those children who had the greatest social
disadvantage.
This article was originally published as the Public Health Report 1987 by the Swedish National
Board of Health and Welfare, and is reprinted here with permission.
International Journal of Health Services, Volume 19, Number 2, Pages 221-255, 1989
22 1
doi: 10.2190/N1NJ-LW6J-URLA-D1EL
http://baywood.com
222
/ Diderichsen and Lindberg
The 1930s: Better Conditions for Young Families
The causes of concern in the 1930s were unemployment, the housing shortage, and
a declining birth rate. Social differences in morbidity were once more on the increase,
not least among children. During the following years, the Parliament passed many
reforms to improve the living conditions and health of young families. Child allowances, maintenance advances, free school meals, and an expanded system of free
mother-and-child health care were introduced. Special efforts were made to assure
single mothers of housing, employment, and child care. As a result, infant mortality
declined sharply, and the differences between children born in and out of wedlock
were reduced.
The 1940s: Expensive and Elusive Medical Care
During the 1940s, there was widespread criticism of outpatient medical care.
Outpatient care away from the hospitals existed on a modest scale. In some parts of
the country, it was virtually nonexistent, there were long waiting lists for hospital
outpatient clinics, and doctors charged heavy fees for consultations. In an official
report, the then Director General of the National Board of Health, Axel Hoier,
reiterated the proposal already put forward in 1934 by the Myrdals in their book
Kris i befolkningsfrdgan (2): an expansion of free outpatient care, with special
emphasis on preventive screening. This proposal, however, came under such heavy fire
that the Government never introduced legislation on the subject. For the next 25
years, efforts were instead concentrated on a tremendous expansion of institutional
medical care. The number of beds rose from 77,000 in 1945 to 120,000 in 1970.
The 1960s: The Seven-CrownReform
Starting in the second half of the 1960s, however, the development of health and
care underwent several trend inflections. The national economic growth rate began to
decline. Unemployment rose, and increasing numbers of workers-especially men over
SO-were retired on disability pensions. At the same time, mortality began to increase
among middle-aged men, a phenomenon that, previously, had only occurred in Sweden
during periods of starvation, epidemic, or war (3). Despite the deceleration of
economic growth, medical care continued its rapid expansion. A fixed low charge for
medical consultations (seven Swedish crowns) was introduced in 1970. Social and
economic factors no longer played such an important part in determining people’s
access to care.
The 1970s: Development o f Outpatient Care
Medical expenditure in 1970 comprised 7.2 percent of the gross national product
(GNP). By 1982, that figure had risen to 9.7 percent. During this period, heavy investments were made in outpatient care in the form of medical care and social services.
Outpatient primary care doubled its share of the health care budget. In recent years,
the State has imposed heavy spending restraints on the county councils, with the effect
that medical spending has been cut from 9.7 percent of GNP to 9.1 percent in 1986.
Swedish Public Health Report, 1987
/ 223
Approaching the 1990s: Health Objectives
In 1985, the Parliament commissioned a public health report from the National
Board of Health and Welfare and at the same time laid down a number of overriding
aims for health and medical care:
Improved public health calls for a continuing active, coordinated health policy
aimed at reducing health hazards, and special attention should be paid to those
groups in society that are exposed to the main risks. The motive power and
foundation of public health promotion are the involvement and priorities of the
public as expressed in the democratic process and in direct community participation. This form of health policy augments opportunities-and liberty-for
citizens themselves to influence living conditions and lifestyle factors with a
bearing on their own health.
Care on equal terms for the entire population must be guaranteed regardless of
the patient’s age, sex, nationality, residential locality, financial resources and
powers of initiative, ethnic identity, and cultural differences. This implies a
distribution of available resources of money and personnel with reference to the
caring needs of the population.
In addition, the Parliament defines certain fundamental requirements and principles
together with lines of development for the structure of care, etc. (4).
This policy resolution was taken with reference to the Government’s endorsement
in 1984 of the 38 goals of health development proposed by the World Health Organization (WHO) for the coming 15 years in Europe-“Health for All by the Year 2000.”
Achievement of these objectives, WHO states, will depend on developments proceeding
in accordance with certain guidelines for the national health policies of member
countries:
Equality of health and living conditions
Health promotion and disease prevention
Active involvement of the general public
Intersectorial cooperation
Health and medical care concentrating on primary care
International cooperation
At the follow-up of the “Health for All” strategy during the World Health Assembly,
Sweden supported the concluding resolution in which the member states were, among
other things, called upon to:
Identify goals of health policy for developments in several sectors of society,
e.g., agriculture, the environment, education, and housing, and endeavor to
specify health effects of current programs in these fields.
Specify goals of equality in their national health policy objectives, formulated in
terms of improved health for underprivileged groups.
Use the health status of the population, and especially that of underprivileged
groups, as an indicator of the quality of social development.
224
/ Diderichsen and Lindberg
Making the health of the population the goal of a country’s health policy means
aiming for a reduction of premature death-adding years to people’s lives, adding
health to life, and adding life to years.
ADDING YEARS TO LIFE
During the first half of the 1980s, average life expectancy rose by one year, which
is a faster increase than previously experienced in the postwar era. This increase has
above all been due to a reduction of mortality among middle-aged and elderly people
in recent years. In 1986, average life expectancy at birth was 80 years for women
and 74 for men. The rise in average life expectancy has made it necessary to revise
forecasts of age development. The number of persons over 85 is now expected to reach
200,000 by the turn of the century, instead of 168,000 as predicted five years ago.
Why Is Average Life Expectancy on the Increase?
The question is whether the increase in average life expectancy reflects a decline in
morbidity and accident risks or is a result of more efficient medical inputs. The appropriate structure of health and medical policy for the future will hinge on the answer
to that question.
0
0
If the decline in mortality is due to a fall in the number of new cases of illness
and accident, this will offset the steep rise in morbidity otherwise associated
with the growing number of senior citizens. This will also give us a “compression” of morbidity, in the sense of chronic, degenerative diseases occurring later
and being of shorter duration.
If these developments have resulted from more efficient treatment curing larger
numbers of patients, or at all events preventing persistent functional impairment
and dependence on help, this will counteract a steady growth in the need for
care but will not prevent a growth of the need for medical treatment.
If these developments have resulted solely from life-saving inputs, with increasing numbers of people surviving with persistent functional impairments and care
requirements, the development of the age structure will have an unrestrained
impact on future caring needs.
These are not easy questions, but some answers can perhaps be derived from the
following analysis of changes in public health.
Must People Die Sick?
During periods of stagnant but high average life expectancy, the hypothesis has
emerged among certain gerontological researchers that we are approaching a “ceiling”
of average life expectancy, a point at which more and more people live in good health
to an advanced age and then die after a brief period of illness. It has been pointed out
that there is no biological law saying that “people must die sick,” but that there are
biologically specific processes of aging that impose a limit on maximum life expectancy.
Swedish Public Health Report, 1987
/ 225
Very few people live to be more than 105 years old. Thus, according to this intellectual model, average life expectancy is increasing because premature deaths, due to
sickness and accident, can be prevented more and more up to the age range where
everybody dies a “natural” death.
In support of this assumption, we may note that there is an ongoing tendency in
favor of a “compression” of mortality within a narrow range at advanced age. It has
been estimated, for example, that 52 percent of all deaths among women in 1985
occurred in the 80-94 age group, compared with 34 percent at the end of the 1940sin other words, the survival curve for the elderly is falling more and more steeply.
The corresponding figures for men are lower: 36 percent in 1985, compared with 30
percent in 1946-50, which tallies with the notion that men, owing to their more
hazardous living habits, are further away from the “ceiling.”
Younger pensioners, at all events, are getting healthier. In 1975, 26 percent of those
aged between 65 and 74 reported that they had suffered from prolonged illness that
had impaired their work capacity. Ten years later, this figure had fallen to 19 percent.
In 1975, again, 57 percent reported some degree of physical disability. Ten years
later, the figure was 45 percent. And, no doubt, there is a great deal that can be
improved still further. At present, salaried employees are five to ten years older than
manual workers by the time they reach the same level of morbidity.
Infant Mortality Lowest in the World
Infant mortality has been declining steadily for several hundred years. This decline
seems, however, to have been arrested during the 1980s, and the same is true for
perinatal mortality. In 1985, 664 children died before they were one year old. Half of
them died within a week of being born, 223 died as a result of deformities incompatible with survival, and 224 died of obstetric injuries, etc. Finally, there were 103
victims of cot (crib) death. The principal decline since 1975 has been in deaths during
the first week of life as a result of obstetric injuries; this, among other things, reflects
improvements in obstetric and maternity health care.
The comprehensive system of mother and child health care has reduced, but
apparently not altogether eliminated, excess mortality among the children of single
persons or other socially disadvantaged members of society. Infant mortality has been
found to be 30 percent higher among children whose mothers have low social status
than among those whose mothers have high social status. The percentage of children
with low weight at birth, as well as perinatal mortality, is elevated among low-status
families. And the reduction occurring in perinatal mortality has not benefited the least
privileged but has favored the large “intermediate group” (Table 1).
Are More Children Being Born with Deformities in the
Chemical Society of Today?
One may ask whether the incidence of serious deformities has increased during the
20 years that have passed since Sweden opened a deformity register in 1964. This has
been a period of growing pollution; a period in which more and more women have
begun working, not least in occupations previously dominated by men; and a period of
226
/ Diderichsen and Lindberg
Table 1
Perinatal mortality, 1976-8 1, by maternal social status (n = 378,6511,
per thousand‘
Cohabiting, highly
educated, house or
tenant-owner flat,
Swedish citizen
(1 0%)
1976177
1980181
‘Source:
7.9
7.1
Not cohabiting,
not highly educated,
rented accommodation
(7%)
10.7
10.9
Others
(83%)
Total
(100%)
10.4
7.5
10.2
7.6
Zetterstrom, R., and Eriksson, M. Hiilsa och social klass. Sociulrnedicinsk tidskrift,
No. 1,1987.
growing alcoholism and drug abuse. Just under 1 percent of all births during this
period have been entered in the deformity register. There is no clear rising tendency,
except at the beginning of the period, which was probably due to a number of years
elapsing before the register became really comprehensive (5). Roughly the same level
was established in a survey of part of Sweden as long ago as the 1920s.
One type of deformity-myelocele-has steadily declined in most, but not all, parts
of the world that have been investigated. We have no explanation for this, but it is
believed to be connected with improvements in the health of expectant mothers,
because deficiencies in certain vitamins and trace metals during early pregnancy can,
it is believed, aggravate the risk of myelocele. No signs can be seen of a change in the
frequency of other easily identifiable deformities, e.g., facial clefts (hare lip or cleft
palate). Fluctuations, it is true, can be observed from year to year, but most of these
are probably random.
One example of an ostensible increase in the frequency of a deformity is hypospadias (the urethra having its aperture in the wrong part of a boy’s penis), which was
seen to increase considerably during the early 1970s. As this is a relatively common
deformity, the increase may have helped to raise the total figures. It is uncertain
whether the increase is a true one or due to improvements in registration practice. The
increase has been observed in many different countries and is probably authentic,
although there is no reliable explanation for it. One example of an unusual deformity
that has become more frequent is gastroschisis (a defect in the abdominal wall that
causes the intestines to protrude). This grew in frequency in about 1973, but then
there was a decline. This phenomenon, too, was observed in various parts of the world,
but without any tenable explanation being found.
Child Mortality Steadily Declining
Sweden, like Iceland, has by international standards a very low mortality rate for
children aged one to 14. Sweden’s low figures are due mainly to a low level of accidental mortality, partly because of many years’ systematic prevention. Child mortality
has declined rapidly throughout the postwar era and is still declining (Table 2). The
Swedish Public Health Report, 1987 / 227
Table 2
Number of deaths from specified causes between the
ages of 1 and 14, 1975-85 (age-standardized?
Tumors
Leukemia
Deformities
Traffic accidents
Drowning
1975
1980
1985
107
79
43
53
70
19
71
55
66
91
37
28
47
45
14
‘Source: Dodsorsaker (SOS), SCB.
decline in accidental fatality is probably due above all to environmental improvements
in traffic and housing conditions, swimming instruction, etc. The diminishing number
of leukemia fatalities can be put down to more effective treatment methods.
Young Men Increasingly at Risk in Traffic
Sweden also has a low mortality rate among young persons (ages 15 to 24), with
Japan and Britain on the same level. Mortality in this age group declined between 1970
and 1985, although the rate of decline was a good deal slower than that for children
(roughly 2 percent annually). Men’s mortality is three times that of women. Seventy
percent of deaths are due to injuries resulting from external violence and poisoning.
Of these deaths, 35 percent result from traffic accidents and 25 percent from suicide
(confirmed and unconfirmed). Traffic accidents showed a declining trend during the
1970s and at the beginning of the 1980s, from 309 deaths in 1970 to an all-time low
of 187 in 1982, but since then the figures have been rising again. The number of
suicides during this period has not presented any clear trend but has fluctuated
between 150 and 250 annually. A declining tendency can possibly be discerned in this
age group for the 1980s.
Many Accidents Can Be Bevented
Knowledge of accident prevention has been very good for many years now, and
tremendous progress has been made, especially where children are concerned. But
there are still many accidents every day-unnecessary accidents, because we do have
the knowledge required to reduce the number still further.
Every day, eight people die as a result of accidental injury. Half of them are over
75 years old.
Every day, about 1,000 people are so severely injured as to require treatment.
Nearly a quarter of all accidents occur in the home, one-fifth are work injuries, and
just under one-tenth (8 percent) are traffic accidents. Nearly half of all accidents,
however, occur elsewhere (at school, in connection with sport, in the countryside,
228 / Diderichsen and Lindberg
etc.). Accidents during physical education lessons and sports training sessions are
very common.
The number of femoral fractures among elderly persons is increasing, at least in big
cities. There may be several factors involved here. In addition to the risk of slipping
and falling over at home or on the streets, increasing bone brittleness may be part
of the reason. This in turn may be connected with such living habits as smoking,
alcohol consumption, and exercise, but excessive prescription of drugs for insomnia
and high blood pressure may also be part of the reason.
Compared with other health problems, accidental injuries are eminently amenable
to preventive action. This is borne out, for example, by the results of the nationally
coordinated measures that have been taken to combat traffic and work injuries.
Drowning accidents are another example. These have been very substantially reduced
in recent decades by means of an intersectorial campaign in which official initiatives
were combined with efforts, for example, by voluntary organizations. No such efforts
have yet been made to reduce other injury risks in the dwelling, school, and recreational environments. Experience of local projects, however, has shown the possibility
of achieving palpable effects within a short time in these environments as well (6).
Work Accidents. During 1985, upward of 100,000 work accidents were reported
to the Work Injuries Register kept by the National Board of Occupational Safety and
Health. These included 140 fatal accidents. About half of the fatalities occurred
en route to and from work. Hardly any other country in the world has such a low level
of work accident mortality. Two out of five fatal work accidents involve vehicles.
One in every five is due to a fall. Slaughterhouse, shipyard, steel mill, and construction
workers are five to ten times more accident prone than people employed in certain
types of office work. The statistics point to a certain decline in the number of serious
work accidents per one million working-hours over the past 30 years. Thus, the
number of fatal accidents has declined to one quarter. Although records have grown
progressively more complete, the risk of slight accidents diminished by about 15
percent during the early years of the 1980s.
Traffic Accidents (Figure I ) . Statistics of traffic accidents reported to the police
in 1986 indicated that 844 people were killed on Sweden’s roads that year, which
means that the number of traffic deaths rose for the fourth consecutive year. The
number of car drivers killed varied during the period 1968-78 between 360 and 400.
During the six years that followed, the figure declined by almost 30 percent. Up to
and including 1983, however, there was a considerable increase, and the number of
motorists killed in 1986, at 347, was the highest on record since 1978. During the
past few years, the number of cars on the roads has increased by 11 percent, which,
coupled with a rise in average speeds, may have helped to bring about this negative
development. The decline in the number of cur passengers killed in 1986 applies
almost exclusively to persons sitting in the front seat, not in the back, contrary to
what the new, stricter legislation on seat belts, effective July 1, 1986, might lead one
to suppose.
During the years up to and including 1975, an average of about 50 motorcyclists
were killed every year; during the second half of the 1970s the figure was between 30
Swedish Public Health Report, 1987 / 229
No.
CAR DRIVERS
-
200
PEDESTRIANS
MOTORCYCLISTS
1968 1970 1972 1974
1976 1978
1980
1982
1984 1 w
No.
10000 7
9000
8000
7000
-
CAR DRIVERS
.
.
6000 .
6000
.
4000
.
..................
0
1968 1970
CYCLISTS
PEDESTRIANS
MOTORCYCLISTS
MOPED RIDERS
OTHERS
1972
1974
1976 1978 1980
1982 1984 1986
Figure 1. Top, number of deaths in traffic accidents, by road-user category, Sweden, 1968-86.
Bottom, number of persons injured in traffic accidents, by road-user category, Sweden, 1968-86.
and 40 annually, followed by a steep rise, peaking at 84 in 1983. Motorcycle accidents
claimed 68 lives in 1986. Just over 10 percent of the fatal casualties are passengers.
About three-quarters of the motorcyclists who lose their lives are between 15 and 24
years old. Apart from legislation making the use of safety helmets compulsory, the
improvement in traffic safety for moped riders can mainly be put down to a decline
in moped traffic during this period. More than 150 cyclists were killed in 1968 and
1969. The figure has fallen since then, and in 1986 it was 85. More than half the
cyclists killed that year were aged 55 and over. Children up to the age of 14 are
another large group. Of all fatal casualties in 1986, 19 were under 15 years old.
230 / Diderichsen and Lindberg
Most pedestrian accidents (about 80 percent) occur in built-up areas. Darkness is a
particular hazard for pedestrians on the roads. Just over half the pedestrians killed lost
their lives in accidents during the hours of darkness, but this proportion has declined
somewhat over the years. The number of pedestrians killed on the roads diminished
between 1968 and 1986. Every year during the 1980s, between 113 and 152
pedestrians lost their lives. A very large proportion of the decline during this period
occurred among persons aged 65 or over, who constitute a highly vulnerable group.
No less than half the pedestrians killed in traffic accidents are 65 or over. There has
also been a steady decline in the number of fatalities among children.
Preventive Measures. A number of such measures are possible:
Influencing drivers’ judgment of suitable speeds by means of augmented and
more efficient surveillance, severer penalties for offenses, and information
measures.
Segregating pedestrians and cyclists from motor traffic.
Informing pedestrians about the use of reflectors.
Informing cyclists about safety equipment (helmets), lighting, and reflectors, as
well as technical regulations for bicycles.
Stipulation of driving instruction for moped riders, moped licenses, and registration and regular inspection of mopeds.
Consideration of the possibility of raising the current driving license age for
motorcyclists.
Development and improvement of driving instruction.
Measures for the prevention of drunken driving, based on a reform of driving
instruction.
Better maintenance of pavements and footpaths.
Lower speeds and other technical measures in traffic environments frequented
by large numbers of citizens.
A generous network of roadside parking facilities.
Greater segregation of children from motor traffic, and lower speeds in places
often frequented by children.
Traffic education in preschool institutions and schools.
Seat belt legislation applying to all children under 15.
Review of laws and regulations applying to children and traffic.
Suicide: The Main Cause of Premature Death
Sweden does not have a particularly low rate of mortality in the 25 to 44 age
group. Norway, the United Kingdom, Japan, and several Mediterranean countries,
for example, occupy the same level as Sweden, if not a lower level, in this respect.
Mortality in this age group, which during the 1970s was constant or even increasing
for men over the age of 40,has now begun to recede once again for both sexes. The
decline in mortality has been especially pronounced among divorced men, who,
however, still have a certain excess mortality compared with other categories. Suicide
is the commonest cause of death (one in three deaths among men in this age group
Swedish Public Health Report, 1987
/ 231
and one in every four among women). Cancer is the commonest cause of death among
women, accounting for two deaths in every five.
The decline in mortality during recent years is not connected with a fall in the
suicide rate but has resulted from a decline in alcohol-related injuries, in accident
mortality, and in cancer mortality. The infectious disease AIDS (acquired immune
deficiency syndrome) is a new and rapidly growing, though still comparatively rare,
cause of death.
Human Immunodeficiency Virus (HIV)/AIDS
In New York, AIDS has become the leading cause of death in the 25 to 44 age
group. In Sweden it is, so far, a rare but rapidly growing cause of death. The earliest
known and confirmed case of AIDS appeared in Central Africa in 1963. The infection
had probably already occurred in the United States by 1971, and in Sweden by 1979.
By the end of 1987, there were 157 confirmed cases of AIDS in Sweden, and 79 of the
patients had died. Of the cases now known, roughly two-thirds have occurred in
Stockholm, and almost a quarter in Malmo and Gdteborg. The majority (80 percent)
of people with AIDS are homosexual or bisexual. Thirteen percent have been infected
as a result of blood transfusions or other blood products. None of the HIV-infected
intravenous drug abusers had contracted AIDS by July 1987. A small but growing
proportion have been infected through heterosexual contacts with the abovementioned groups or through sexual contacts abroad.
The number of persons known to be HIV-positive in Sweden was 1,701 at the end
of 1987, and included 237 women. Fifty-two percent of HIV-positive persons
belonged to the homosexual or bisexual risk category, and 26 percent were
intravenous drug users. The smaller proportion of homosexuals among HIV-infected
persons than among those who have contracted AIDS may possibly point to a reduction in the spread of infection in this group. This is corroborated, for example, by a
decline in the occurrence of certain venereal diseases among homosexual men.
Probably, though, the true number of HIV-positive persons is much greater, perhaps
in the region of 5,000.
Rapid Spread. Attention hitherto has been concentrated on those groups in the
society that are considered most liable to be infected-homosexual men, intravenous
drug abusers, and prostitutes. In total figures, these groups constitute a small portion
of the population. The number of current intravenous drug users is estimated at 8,000,
the number of homosexual men at, possibly, about 100,000, and the number of
women prostitutes at 2,000, which altogether is 1.3 percent of the population. But the
disease is also beginning to spread to the rest of the population, as a result of heterosexual contacts with people in the above categories, partly through bisexual behavior
and prostitution. Presumably, 3 to 4 percent of the male population of Sweden comes
into contact with women prostitutes in the course of a year. In addition, there are a
number who have dealings with prostitutes abroad. Little is known at present concerning the risk of contracting the infection as a result of heterosexual relations
with a carrier.
232
I
Diderichsen and Lindberg
The public task of preventing the spread of HIV/AIDS is to follow a plan that
comprises inputs of the following kinds:
Heavily intensified information activities.
Efforts to reinforce the care of drug abusers, including outreach activities.
Efforts to counteract AIDS in the prison and probation system.
Psychosocial support in medical services and through the popular movements.
Financial assistance to voluntary bodies and interest organizations.
Efforts to prevent the spread of infection among homosexual and bisexual men.
Increasing Inequalities in Mortality
Compared with most industrialized countries, Sweden has a low rate of mortality of
the 45 to 64 age group. But the corresponding death rates in Iceland, Greece, and
Japan are slightly lower. Mortality among men aged 40 to 59 increased between 1965
and 1979, mainly because of a rise in the number of cardiac infarcts. Mortality from
directly alcohol-related causes of death also increased during this period. At the same
time, there was a decline in mortality in motor vehicle accidents. During this period,
mortality developed on very different lines in different occupational groups (Table 3
and Figure 2).
Table 3
Mortality index among men in certain occupational groups,
1966-70 and 1976-80, direct age-adjusted valuesaib
1966-70
1976-80
Engineers, etc.
Doctors, etc.
Teachers, etc.
Administrative work
Commercial travelers
Seamen (deck and engine room)
Bus drivers, engine drivers, etc.
Steel mills, forging, foundry work
Metal manufacturing
Building
Food manufacturing
Chemical and pulp processing
Heavy and casual laboring
Hotels and restaurants, etc.
96
100
94
85
134
164
107
100
105
97
103
101
108
143
82
74
76
76
94
158
106
108
106
103
110
115
121
163
All gainfully employed persons
Not gainfully employed
100
235
97
250
?Source: Dodsfallregistret, SCB.
bMortality for all gainfully employed men aged 45-64 in 1966-70 = 100,
Swedish Public Health Report, 1987 / 233
Deaths pr 100,000
- Industry
1500
1200
............
.. ........
.............................
600
Office & c a r e (M)
- Industry
______
900
(M)
(F)
Office & c a r e (F)
--_------_.-------.--------.............____ .............
300
0
1966-70
1976-80
Period
Figure 2. Occupational mortality in Sweden, 1966-80; ages 45 to 64; industry compared with
office and care (care professions).
As seen in Table 3, commercial travelers, seamen, and hotel and restaurant
employees, for example, had very high levels of mortality in the 1960s compared with
other occupations. This has often been attributed to the living habits of people in
these categories and, for example, their access to alcohol. A somewhat different
pattern emerges for the 1970s. The working conditions and recruitment patterns of
commercial travelers have probably changed, with the result that their living habits
have done the same. At all events, their excess mortality has disappeared, unlike that
of the other two categories. Meanwhile, mortality has dropped sharply among such
highly educated categories as doctors and teachers, at the same time that it has risen
in several working-class categories, e.g., steel mills, food manufacturing, the building
industry, and chemical and processing industries. In a word, mortality in these categories at the end of the 1970s was about 50 percent higher than in certain graduate
occupations (7). Considering that the category of nonemployed middle-aged men
increased its numbers by about 50 percent during this period, partly because of a rise
in the number of disability pensions awarded on grounds of redundancy, the rise in
their mortality is remarkable since it is not very likely to be a selective phenomenon.
Female Mortality Declining. Women’s total mortality has declined a good deal
during the period under consideration, especially in intellectual and clerical jobs and
in transport and services, whereas for industrial workers the decline has been average.
In agriculture and forestry, there has been a further decline in female mortality,
234 / Diderichsen and Lindberg
whereas relatively speaking the mortality rate for nonemployed women has risen.
The latter group diminished appreciably during the 1960s, and so the increase may be
a selective phenomenon, with a growing proportion of women being nonemployed on
account of illness.
There can be several causal mechanisms behind these differences in mortality
among different groups. Recruitment of relatively healthy persons for white-collar
occupations may be part of the reason but, on the other hand, the growth of retirement on disability pensions tends to reduce mortality in those groups in which such
retirements are commonest, e.g., manual occupations in industry. The factors of the
working environment or other living conditions and living habits that may conceivably
be responsible for these developments are purely a matter of conjecture. It is worth
noting, however, that whereas the survey of living conditions (ULF) conveys the
picture of a general decline in differences between the living standards of socioeconomic groups between 1975 and 1985, medical risk factors such as smoking, intensive
and monotonous work, and unemployment reveal a rising trend for differences
between manual workers and senior salaried employees (Table 4).
Since the end of the 1970s, mortality has declined sharply for both sexes in all
marital status categories. This decline has been especially noticeable among divorced
men and in the County of Stockholm (which has a particularly high percentage of
divorced persons). The decline applies to several different causes of death. For
example, coronary mortality among men, which until 1980 had been increasing at a
rate of 1 percent annually, has begun to decline by 3 percent annually. A decline
in male mortality from alcohol-related injuries and strokes is also part of the
reason. Among women, too, half the decline in mortality during the 1980s concerns
deaths from cardiovascular diseases. In addition, there is a slight reduction in
cancer mortality. We do not have any data on occupationally related mortality in
the 1980s.
Table 4
Health hazards for manual workers compared with senior salaried employees,
1984/85, age- and sex-adjusted percentage values, 16-74 years'
Manual workers
1984/85
Intensive, monotonous work
Experience of unemployment
Daily smoking
Deafening noise
Illness reducing work capacity
20.1
19.3
36.9
16.7
11.5
Change
1975-85
+4.9
+6.9
-5.2
-4.2
-0.8
Senior salaried
employees
1984/85
2.7
9.3
20.3
1.1
3.3
'Source: Ojhlikheten i Sverige. Levnadsforh%llanden.Rapport 51 (SOS), SCB, 1987.
Change
1975-85
0.0
+0.4
-9.9
-0.3
-1.9
Swedish Public Health Report, 1987
/ 235
Bigger Health Hazards for Manual Workers (Tables 4-6)
Present-day patterns of mortality have something to say about the health hazards
entailed by the environment and living habits of yesterday. Changes in present-day
health hazards provide an indication of what happens when nothing is done. During
the past decade, we have witnessed a reduction of class inequities in terms of material
welfare, but, looking at a number of factors with a major bearing on health status,
e.g., smoking, unemployment, and the occurrence of intensive and monotonous work,
we find that developments are moving in the opposite direction. Accordingly, there is
a great risk that, in future, when this pattern produces an effect on mortality and
morbidity, we will experience an accentuation of class inequalities. We can also see
how, within one and the same group, there is an accumulation of many different
health hazards that have the effect of reinforcing one another. It is hardly surprising
that manual workers are more likely to be hospitalized for several types of serious
illness. Breast cancer is one notable exception to this rule.
Cardiac Infarcts Declining
Every day in Sweden, 90 persons develop cardiac infarcts.
Every day, 45 people, 20 of them under 75 years old, die of cardiac infarcts.
One percent of the population suffers from angina pectoris.
Men are treated for cardiac infarction a great deal more than women. Manual
workers and junior salaried employees are more at risk than senior salaried employees.
Disability pensioners, of course, comprise a sample of the population with much
higher morbidity than gainfully employed persons. But the risk of illness at different
ages has undergone interesting changes in recent years (Figure 3). Through the 1970s,
Table 5
Relative percentage of population hospitalized in 1981 in 15 county council areas,
direct age-adjusted indexarb
Manual workers
Lung cancer
Breast cancer
Cardiac infarct
Stroke
Alcohol-related injuries
Psychoses
Attempted suicide
Motor vehicle accidents
Senior salaried
employees
M
F
M
F
133
44
157
32
56
30
73
116
89
26
225
10
55
10
45
42
63
0
157
104
139
57
83
158
70
0
112
85
23
26
23
139
Total
M+F
100
100
100
100
100
100
100
100
‘Source: Data from patient statistics processed by the National Board of Health and Welfare
and the 1980 Population and Housing Census.
bpercentage hospitalization for all persons aged 15-64 = 100.
Q\
29.4
30.1
38.1
20.8
19.4
31.1
29.3
27.5
30.7
27.3
31.5
30.9
32.0
32.3
22.8
10.0
30.3
24.6
30.4
35.6
31.0
35.6
41.9
32.4
32.9
39.7
33.4
39.3
34.2
32.0
33.6
32.9
39.6
39.9
42.1
32.2
33.4
36.3
39.5
40.9
All employees
All LO members
Unions:
Clothing workers
Building workers
Electricians
Factory workers
Building maintenance workers
Insurance employees
Commercial employees
Hotels and restaurants
Municipal workers
Food industry
Metal workers
Painters
Paper workers
Forestry
Government employees
Transport
Wood conversion
Printing
32.7
10.8
7.4
28.4
21.4
10.8
14.1
19.2
15.5
34.1
27.6
18.1
28.2
23.7
16.7
20.0
31.6
23.4
32.3
37.8
12.6
25.8
21.4
8.7
16.5
27.9
17.2
21.4
22.1
29.7
16.4
23.2
11.3
18.1
27.0
12.7
20.2
14.2
14.2
Tiredness
Prolonged
illness
19.9
Unemployed
some time
in the past
5 years
Intensive,
monotonous
work
Health hazards and morbidity among members of various trade unions, average percentage figures, 1980-85'
Table 6
41.3
40.5
31.0
42.6
50.1
35.3
37.1
47.0
37.7
50.1
43.3
35.3
41.6
27.0
34.9
53.9
40.7
46.5
40.3
34.8
Daily
smoker
22.8
27.3
23.0
21.1
13.7
All SAC0 members
Unions: lawyers and social scientists
Teachers
Graduate engineers
Doctors
30.6
18.7
33.4
42.9
43.0
28.7
14.1
28.7
38.7
35.1
30.2
30.1
27.2
30.2
32.6
8.1
30.7
‘Source: Ojiimlikheteni Sverige. Levnadsforh%Uanden.Rapport 5 1 (SOS), SCB,1987.
28.0
31.0
23.3
29.0
28.8
29.1
20.9
27.5
30.4
24.7
19.5
33.1
All TCO members
Unions: foremen and supervisors
Banking
Specialized teachers
Insurance
Commerce
Hospitals and public health
Industry
Local government
Teachers
Police
Government employees
4.1
7.3
3.4
2.7
2.4
7.8
3.4
12.1
2.4
8.1
12.0
6.0
8.2
9.1
4.0
3.2
11.3
7.8
7.6
6.0
8.3
3 .O
9.4
6.1
4.6
14.6
4.9
13.6
5 .O
8.8
13.2
4.1
0
9.4
21.0
22.7
17.6
17.9
13.1
30.4
37.6
24.8
25.7
34.3
37.8
19.5
32.0
30.8
15.1
30.1
32.0
0
r-
0
0
d
0
0
0
v)
m
m
238
Year
78
82
84
I
Figure 3. Mortality in ischemic heart disease, Sweden, 1970-86, ages 45 to 64 and 65 to 84. Top, men. Bottom, women.
80
500
76
50.
74
700
60
72
900
70
70
1100
1500
80
Deaths per 100,000 (65-84
1300
Deaths per 100,000 (45-64)
90
100
240 / Diderichsen and Lindberg
cardiac infarct morbidity and mortality both increased throughout the country.
Mortality peaked in 1979; since then, it has fallen so steeply that the total number of
cardiac infarct fatalities has diminished in spite of a growing percentage of elderly
persons in the population. Certain studies indicate that the incidence has also begun
to diminish since 1981 (8).
Risk Aggravated by Unhealthy Living Habits. There is widespread agreement that
a group of risk factors has a major bearing on the occurrence of cardiovascular disease:
0
Dietlblood fats
Smoking
Psychosocial conditions
Disturbed blood fat values are very important; these can be partly hereditary, but they
are mainly conditioned by the fat content of the diet. Elevated cholesterol (or, more
exactly, elevated LDL (low-density lipoprotein) cholesterol or reduced HDL (highdensity lipoprotein) cholesterol) augments the risk of cardiac infarct. A certain “least”
level of blood fats is apparently necessary to the development of cardiac infarction.
Without it, other risk factors such as smoking make little difference. In Japan there is
a very low incidence of cardiac infarction and far lower blood fat levels than in
Sweden. In Sweden the levels are high compared with many other countries. These
differences have to a great extent been attributed to the inclusion in the Swedish diet
of a high content of saturated fatty acids, derived mainly from mammalian products.
It is a well-known fact that smoking elevates the risk of cardiac infarct and that, in
those who give up the habit, the risk rapidly declines to the values applying to nonsmokers. Smokers are two to three times as liable as nonsmokers to fall ill. Deficient
social networks and major changes of life are associated with a slightly elevated risk of
cardiac infarct, which among other things, may contribute to the elevated mortality
of divorcees and widowers. The social environment at work is also important. Jobs
characterized by exacting demands combined with a lack of stimulus and scope for
decision-making can lead to a greater risk of cardiac infarct (9). Unemployment has
been found to lead to elevated blood pressure and elevated secretion of stress
hormones in the bloodstream (10). One often finds that people living in psychosocially
adverse environments also have unfavorable living habits, e.g., heavy tobacco consumption, high fat and salt in their food, lack of exercise, etc. It thus seems that several risk
factors accumulate in people with low educational standards, hence the elevated
morbidity in these categories.
Increasing Rate of Stroke Survival
Every day, about 70 people in Sweden suffer strokes.
Every day, about 25 people die of this disease. Seven of them are under 75
years old.
Women tend less often than men to be treated for stroke. In the big cities, senior male
salaried employees are definitely less liable than manual workers and junior salaried
employees to suffer stroke.
Swedish Public Health Report, 1987 / 241
Compared with other countries, Sweden has a relatively low incidence of stroke,
and mortality has shown a falling tendency during the past 20 years, but the decline
has not been so pronounced as in the United States and Japan, for example. Japan
presents a conspicuously steep decline, part of which has been attributed to improvements in blood pressure monitoring. The number of fust-time stroke patients is
difficult to gauge, but in Goteborg and Stockholm, where this question has been
studied, the tendency has remained virtually constant (1 1). There are several possible
explanations. Improved treatment of high blood pressure, for example, has helped to
reduce the type of stroke (cerebral hemorrhage) that has a high mortality but has
probably not affected other types of disease (cardiac infarct, etc.) to the same degree.
The main risk factors for stroke are:
High blood pressure
Smoking
The decline in stroke mortality has above all been attributed to the more effective
treatment of high blood pressure. Japan has by tradition had a very high incidence of
stroke, which has been attributed to high blood pressure resulting from heavy salt
intake.
Gncer-More Patients but Better Survival
0
Every day in Sweden, 103 persons contract cancer.
Every day, 55 persons, 14 of them under 75 years old, die of cancer.
A total of some 38,000 cases of cancer were diagnosed in Sweden in 1984. This means
that, sooner or later, more than one inhabitant in three will contract the disease. The
endemic status of cancer is also emphasized by the fact that more than one in every
five deaths is cancer-related.Survival rates for cancers of the cervix and breast improved
during the 1970s. More than 70 percent of these patients are still alive after five years,
compared with 15 percent for cancers of the lungs and stomach. The probability of
survival five years after diagnosis was about 60 percent for prostate cancer and barely
50 percent for cancer of the large intestine.
Lung cancer and stomach cancer are more common among manual workers than
among salaried employees, whereas cancer of the large intestine and breast are more
common among salaried employees (Table 7). Farmers generally run little risk of
cancer, but they run a greater risk for types of skin cancer other than malignant
melanoma (12). Among cancer patients, salaried employees tend to have better
survival prospects than manual workers and farmers, especially for cancers of the
breast and cervix among women and rectal cancer among men (13). Cancers of the
lung and cervix are more common among divorced women, while cancers of the
ovaries and cervix are more common among unmarried women. Number of births and
sexual hygiene make a certain difference where the last three forms of tumor are
concerned. There are also geographical differences in the incidence of cancer in
Sweden. Generally speaking, the big cities have high risk levels for most forms of
cancer except cancer of the stomach and leukemia. Lung cancer is more frequent in
242
/ Diderichsen and Lindberg
Table 7
New cases of cancer, standardized for age and residential locality, 1961-79‘3b
~
Manual workers
M
Breast cancer
Prostate cancer
Cancer of the large intestine
Lung cancer
Stomach cancer
97
94
110
108
All cancer
100
-
Salaried employees
F
86
M
-
98
109
112
106
120
97
78
97
105
-
Farmers
F
112
M
-
102
92
88
101
78
41
109
102
87
-
‘Source: reference 12.
b d e x with all employed persons = 100.
big cities. Heavy smoking in big cities is believed to make the greatest difference here.
Breast cancer and cancer of the large intestine are more frequent in big cities, but also
in agricultural regions of southern Sweden. Dietary habits associated with a certain
level of material prosperity may be relevant.
In total figures, the number of cases of cancer in Sweden has increased over the past
few decades. This is partly due to an aging population-65 percent of all cancer affects
persons aged 65 and over-but partly reflects a true increase. The number of cases of
breast cancer rose steadily throughout the 1970s, but has not increased since 1980.
The rise in numbers was partly due to improved diagnosis, including the gradual
expansion of mammography, which has probably led to improved survival. Prostate
cancer appears to have increased heavily over the past 20 years, which may also be
partly or wholly due to the improvement of diagnosis. Prostate cancer mortality,
meantime, has declined since 1975. Cancer of the stomach, which used to be one of
the two commonest forms of cancer, has halved in incidence since 1960. Cancers of
the large intestine and rectum have increased, slowly but surely, in terms of incidence,
but mortality has been declining since the mid 1970s. Cizncer of the lungs increased
throughout the 1960s. It has stagnated for men since the 1970s, but the increase has
accelerated for women. Male mortality has been declining since the end of the 1970s,
but female mortality has continued to increase. One form of cancer has increased
more than others: malignant melanoma. The risk of this form has more than doubled
in the space of 20 years. The declining incidence and mortality of cervical cancer
since the mid-1960s have probably been due to the earlier stages of this cancer now
being discovered and treated, before it has time to develop.
Environmental Hazards. It has been estimated that 80 percent or more of all cases
of cancer are partly brought about by various environmental factors. Our knowledge
concerning the identity of those factors, however, is incomplete. The best-charted and
most amply documented cause of cancer is smoking, which causes about 15 percent
of all cancer and nearly 80 percent of all lung cancer. Even “passive smoking” and the
Swedish Public Health Report, 1987
/ 243
use of smoke-free tobacco products have a certain connection with elevated cancer
risk. A number of circumstantial indications have been collected in recent years, suggesting that eating habits are connected with several different types of cancer, especially cancer of the large intestine and stomach, but also cancer of the breast and
prostate gland. Altogether, according to these estimates, diet could affect 30 percent
of cancer cases. But this is an uncertain estimate. Air pollution is believed to account
for no more than 1 to 2 percent of all cancers, but especially cancer of the lung.
Ionizing radiation from radon, X-rays, etc., presumably accounts for only a small
percentage of cancer cases today. Radon in homes probably has an important bearing
on lung cancer. Chemical and physical components of the working environment have
an important bearing on the cancer risks encountered by certain specific occupational
categories, e.g., coking plant workers, miners, etc. They are thought to have a less
important bearing on the total number of cancer cases in the community. The proportion is estimated at between 1 and 10 percent of all cancer. All in all, however, it is
important to emphasize that the long latency period between exposure to carcinogens
and contraction of cancer makes it difficult to arrive at a firm assessment of presentday environmental hazards.
ADDING HEALTH TO LIFE
Prevention of Mental Disease-A Task for Social Policy
0
0
0
Between 20 and 30 percent of the population report unsatisfactory mental wellbeing (including anxiety and sleep disturbances).
Between 2 and 3 percent say that they are suffering from prolonged mental illness, and an equally large percentage apply for psychiatric care in the course of a
year. At present, 0.3 percent of the population is receiving psychiatric care in
institutions.
The risk of suffering from depression some time before age 80 has been estimated at 50 percent for women and 25 percent for men, and these percentages
have been increasing during the postwar era.
The risk of contracting senile dementia before age 90 has been estimated at 20
to 25 percent. The number of patients with senile dementia is increasing as a
result of the growth of the elderly population but, on the other hand, the risk
that an individual will contract this disease before a certain age is diminishing.
Two percent of the population take their lives.
It is widely assumed that mental illness has increased in our society. The transition
to a postindustrial society characterized by high social and geographical mobility, a
transformation of family structure with a rising divorce rate, increased unemployment,
and housing segregation are all factors suggesting a growing threat to mental health.
But we do not have any good studies on which to decide whether this is the case. Nor
does the existing material provide unambiguous support for the assumption, because:
The percentage of persons reporting reduced mental well-being has remained
practically unchanged.
244
0
/ Diderichsen and Lindberg
Consumption of alcohol and drugs by the juvenile population has diminished in
the past ten years, though a resurgence is observable after 1985. Sales of antidepressants, however, have increased since 1981.
The suicide rate has been virtually stationary since the mid-1970s.
The National Board of Health and Welfare has compiled an action program against
mental illness, in which it is pointed out that there is a connection between mental
illness and social structure. The program also recommends measures that can help to
prevent mental illness:
0
0
0
0
Continuing measures of social policy, e.g., as regards parental leave, shorter working hours, and measures to combat unemployment.
Adequate resources for child care and increasing emphasis on personal development in schools.
Continuation of an active policy on prices and of information activities with the
aim of reducing alcohol intake.
Self-help groups and interemployee supportive activities to counteract isolation and loneliness. Popular movements and associations can provide social
participation.
Improvements to the social environment at work, through measures to improve
work organization and to give employees more influence at work, as well as
reducing monotony and stress.
Planning of housing areas to facilitate community experience. The community
should support popular movements and voluntary organizations so that people
will have an opportunity of participation and responsibility. If the individual is
given a genuine opportunity of participation, this will also create scope for
greater self-realization.
Breaking the isolation of elderly persons by means of outgoing activities and
encouragement of the activities of voluntary organizations.
Special projects for the prevention of suicide.
Prevention of Diseases of the Locomotor SystemA Question of the Working Environment
Sixteen percent of the population between the ages of 16 and 84 report some
illness of the locomotor system or some arthritic symptom. No less than 55 percent
report pains in the back, neck, hips, or other joints. Diseases of the locomotor system
accounted in 1983 for about 40 percent of retirements on disability pension and 28
percent of absences due to sickness. And yet, less than 5 percent of medical expenditure is devoted to this group of diseases. Disorders of this kind are much commoner in
the north of Sweden than in the Stockholm region. They are three times more
common among unskilled workers and farmers than among senior salaried workers in
the corresponding age groups.
The percentages of the population suffering from diseases of the locomotor system
remained unaltered between 1975 and 1985, but there may well have been changes of
magnitude within this broad category of diseases. Owing to the mechanization and
Swedish Public Health Report, 1987
/ 245
automation of industry, disorders of the shoulders and cervical spine, for example, are
becoming increasingly common. About ten years ago, it was disorders of the lumbar
spine that predominated in industry. Lumbar disorders are connected, for example,
with physically strenuous work such as heavy lifting. Although jobs of this kind have
been reduced in industry, the number of (female) employees having to do heavy lifting
at work has increased, because of a rise in the number of nursing auxiliaries in longterm care and home nursing.
It is mainly in working life that measures will have to be taken for the prevention
of diseases of the locomotor system. The action program drawn up by the National
Board of Health and Welfare includes the following recommendations:
0
Offensive follow-up of compliance with current regulations concerning movement of unsuitable physical loads from heavy static load, flexed, twisted, or
stretched positions, one-sided movements, vibrations, and mental strain.
Increasing opportunities for regular, intensive physical activity during intermissions and leisure.
Intensified efforts for the prevention of smoking, excess weight, and alcohol
intake and for the increase of calcium intake and physical activity among the
elderly.
Content and Effects of the Health Message
For 25 years now, the National Board of Health and Welfare and other bodies have
been trying to convey the following message to the population:
0
0
Stop smoking.
Drink in moderation or not at all.
Take in less fat, especially saturated fats, in the diet.
Take in more fiber and less salt in food.
This is how developments have moved:
0
0
0
Tobacco consumption rose steadily throughout the postwar years until the end
of the 1960s; since then, it has been slowly declining.
Men’s smoking peaked at the end of the 1960s, whereas women’s began slowly
declining at the end of the 1970s. Daily smokers comprised 28 percent of the
adult population in 1986.
The percentage of smokers among pupils in grade nine (the terminal grade of
compulsory school, age 16) fell rapidly in the 1970s, but a trend inflection
occurred in 1984, at least for the boys.
Whereas in the 1960s smoking was fairly evenly distributed between social
classes, today it is commonest among the undereducated and socially disadvantaged. Single mothers and people on public assistance are the heaviest smokers.
Snuff consumption has doubled since the end of the 1960s and is still increasing.
After the abolition of ration books in 1955, alcohol consumption rose steadily
until 1976. Since then it has heavily declined (Figure 4).
246
/ Diderichsen and Lindberg
.........*.......
No. of d e a t h s p e r
100,000 inhabitants
15 y e a r s and above
A l c o h o l sales,
litres 100%a l c o h o l
p e r i n h a b i t a n t 15
y e a r s and above
-
8.5
- 8
3
200 1
- 7
- 6
- 5
196062 64 66 80 70 72 74 76 70 00 02 04
06
Figure 4. Alcohol sales and mortality due to cirrhosis of the liver, pancreatitis, alcoholism,
alcohol psychosis, or alcohol poisoning, Sweden, 1960-86.
0
0
Heavy drinkers in 1968 comprised 18 percent of the juvenile population in social
class I and 11 percent in social class 111. By 1980, this pattern was reversed, with
10 percent in social class I and 21 percent in social class 111.
Between 15 and 20 percent of young persons in 1970 had tried drugs. By 1986,
this figure had fallen to 5 to 7 percent.
The number of heavy drug users increased toward the end of the 1960s, and
since then has been about 10,000, including 1,000 to 2,000 intravenous drug
users. To begin with, amphetamines predominated among intravenous drug
users, but heroin has become increasingly widespread during the past decade.
During the Second World War, the proportion of fat in the diet fell to 30 percent,
but it then rose to 40 percent by the mid-1960s. After that, it declined for some
years, rising again to 40 percent in the 1980s.
Compared with the 1950s, we now eat more meat, fruit, and green vegetables
but less potatoes and grain products.
Compared with the total index of retail prices, the prices of both green vegetables and grain products have risen steeply. The steepest rises have affected
meat, fish, and dairy products. Prices of soft drinks and cigarettes have risen least.
We know that the percentage of children with a properly balanced diet is a good
deal higher in social class I than in social class 111.
/ 247
Swedish Public Health Report, 1987
Living Habits Established Early
It is during childhood and adolescence that we establish our basic living habits
with regard to diet, tobacco, and alcohol. Health hazards have sometimes been
described in terms of certain biological conditions such as high blood pressure or
elevated blood fat content, sometimes in terms of certain forms of behavior associated with tobacco, diet, and alcohol. Specific environmental conditions, such as air
pollution, monotonous working movements, lack of control over one’s working
situation, etc., have been referred to. Mention has sometimes been made of such
sociostructural phenomena as unemployment, class identity, and migration for
example. Thus, our designation of the causes of health problems can vary between
quite different types of phenomena. We alternate between different levels. When
looking for the causes of disease, we remain stationary at these various levels. Research,
for example, often stops short at smoking or high blood fat content as a “cause”
and does not go on t o inquire why people smoke or eat as they do. And yet it is the
answers to these questions that can form the basis of a health policy that will promote
people’s ability to lead a healthy life and will not put the blame on the victims.
What Governs Our Smoking Habits (Table 8)? There are dramatic differences in
smoking habits between groups living under different social and economic conditions.
Moreover, we see that, although the total percentage of smokers has declined in recent
years, differences between the various groups have increased. The top groups in 1985
are the ones that have cut down least on their smoking or even increased it since 1977.
There can hardly be anybody in Sweden who has not been reached by information to
the effect that smoking endangers health. And everybody is at liberty to stop smoking.
Yet here we have these palpable differences, differences for which there must be an
explanation. The explanatory model chosen will make a great deal of difference to the
measures recommended. If smoking is viewed primarily as a form of chemical exposure
Table 8
Percentages of daily smokers in various groups, all Sweden, 1984-85O
Percentage
daily smokers,
1984185
Percentage
change,
1977-85
Young persons (ages 16-24)
Single parents of infants
Unskilled workersb
Senior and intermediate salaried staffb
Disability pensioners and long-term unemployedb
Social allowance recipients (>six months)
26.2
61.4
39.0
20.3
45.9
66.3
-15.3
-3.4
Total, ages 16-74
30.9
-5.8
“Source: Ojiimlikheten i Sverige. Levnadsforhhnden. Rapport 5 1 (SOS), SCB, 1987.
bAge- and sex-adjusted values.
-3.1
-9.2
+6.5
-
248
/ Diderichsen and Lindberg
that must be reduced, filter cigarettes will be a relevant expedient. If smoking is
regarded as behavior based on ignorance of risks, health education will be a plausible
measure. If smoking behavior is seen as a manifestation of stress, this may, among
other things, call for improvements to the working environment. If tobacco in itself
is regarded as an addictive drug, restrictions in the form of prohibitions and high prices
will be consistent.
Living habits such as smoking must be viewed as behavioral patterns that people
choose from the alternatives available, with reference to the social and economic
situation in which they live and the opportunities of a choice that the situation
actually confers. Accordingly, WHO has defined health promotion as the process
inducing people to augment individual and collective control of conditions affecting
their health, so as to improve those conditions.
The Health Question-Not Only an Information Problem
Smoking. Through the medium of tax and surcharge policies, the Government and
Parliament are in control of the level of tobacco prices. Thus, an active price policy is
a readily available instrument that could be increasingly used to restrain consumption.
One minimum requirement from a health policy viewpoint is that the prices of
tobacco products should at least keep pace with the level of prices generally. Restrictions on the marketing of tobacco should be further intensified. Tobacco advertising
should immediately be prohibited altogether. Stipulations concerning the health
warnings to be printed on tobacco packaging can be intensified. The organization of
the market can be reviewed in order to reduce the scope for purely commercial
interests. Work on the creation of more smoke-free environments should be intensified,
both in the light of increasing knowledge concerning the hazards of passive smoking
and in order to create a social climate that will support young persons who do not
wish to start smoking or who wish to give up the habit. The question of legislation
to restrict smoking on public and certain other communal premises should be given
renewed consideration. All measures taken must be based on a realization of the close
connection between living habits and social conditions, the working environment, etc.,
and on the realization that this is more than just a problem of information.
Eating Habits. Food policy and price policy hitherto have shown very little
consideration for health policy aspects, which may be part of the reason why the
eating habits of many groups have still not developed in the right direction. Price
movements for various types of food in recent years have hardly been calculated to
further the aims of policy with regard to eating habits. The Government and Parliament
have stressed the need for intensified research and information on dietary matters.
A 25 percent reduction of fat intake is one of the central goals of health policy. The
food trade should be able to offer a variegated supply of good products throughout
the country, in both big cities and rural areas. It is not unlikely that large-scale operations and the concentration of products operate to the disadvantage of consumers,
since supply is dictated to such a great extent by producer interests. It should also
be stipulated that information, in the form of advertising and product labeling, be
Swedish Public Health Report, 1987
/ 249
appropriate to the consumers, supplying correct, distinct, and intelligible particulars
concerning content of fat, salt, sugar, fiber, etc., without any irrelevant value
judgments.
In addition to measures simplifying consumers’ choices, improvements are needed
in consumers’ knowledge. One fundamental measure to be taken, therefore, is diet
education, which can be said to serve three purposes:
0
Supplying knowledge and awareness of the importance of diet to health.
Supplying knowledge of what constitutes a good diet.
Supplying practical guidance for the implementation of that knowledge.
Physical ActivitylExercise. Measures designed to augment the physical activity of
the general public should focus on the interest that physical activity clearly arouses.
In the local community, there must be scope for and access to suitable activities for
all ages. The sports movement, of course, has an important part to play, but it has
been found that most activities take place outside the sports organizations. Opportunities of taking part in organized sport decline rapidly with advancing age. Noncompetitive activities are few and far between.
Alcohol. Measures to reduce alcohol-related injuries must continue to focus on
both demand and supply. Measures relating to demand are aimed at:
Influencing knowledge and attitudes and mobilizing public opinion in favor of a
reduction of alcohol consumption.
Restricting advertising and other marketing measures.
Maintaining a high level of prices.
Supporting the activities of organizations and associations.
Measures aimed at supply include, for example:
Age limits for purchasing
Restraint in the establishment of sale points and restrictions on opening hours.
Prohibition of pushing and home distilling, and restrictions on importation.
Promotion of alcohol-freeenvironments.
Special measures must be devoted to groups frequenting particularly hazardous
environments, e.g., traffic and shipping, and to expectant mothers and persons whose
behavior is particularly hazardous. Health and medical services have special opportunities of working preventively, by identifying and helping heavy drinkers. Thus, the
overriding aim of alcohol policy is at present to reduce total alcohol intake by 25
percent by the year 2000. It is particularly important to delay the onset of drinking
among young persons and to reduce their consumption.
250 / Diderichsen and Lindberg
ADDING LIFE TO YEARS
Public health policy is concerned not only with the elimination of disease and
premature death but also with the promotion of health in a positive sense. Many
qualities of life that are conducive to well-being also reduce the risk of serious illness.
We will now turn to consider two factors: access to social participation and meaningful
work.
More Frequent Changes of Family, Home, and Work
Deficient social networks, above all as regards relations to one’s nearest and dearest,
have proved to have an important effect on health. During the postwar era, we have
been able to observe a falling marriage rate, whereas cohabitation in couples hardly
appears to have diminished at all. Mobility of cohabitation, on the other hand, has
increased, with a larger number of dissolved and newly formed cohabitational relationships. The divorce rate doubled between 1965 and 1980. When needs-tested
maintenance advances for the children of unmarried women were introduced in 1946,
allowances were awarded for 1.6 percent of all children. Today, the figure is more than
14 percent.
More People Living Alone. The proportion of single-living persons has risen in the
past decade from 17 to 19 percent. The proportion professing to live in complete
social isolation remains constant at about 1 percent. This is presumably an underestimate, because many severely isolated and handicapped people do not take part in
interview studies. The number reporting that they have no contact with close relatives,
neighbors, and fellow employees has diminished. These very rough yardsticks of social
relations in the society do not suggest any total increase in loneliness, although there
are signs of increasing instability in personal relations, due to divorce, migration, and
job changes.
A very important part is played here by regional policy and its effects on the
necessity of people migrating from one region to another in order to gain a livelihood.
During the 196Os, there was a heavy drift from the forest counties to the metropolitan
areas. A decline during the 1970s has been followed, in recent years, by a resurgence
of migration. We know that involuntary migration due to a heavy imbalance in the
labor market has a negative impact on the health of people who have difficulty in
establishing social contacts and finding work in their new residential locality. Thus, it
is to be feared that developments in recent years, with unemployment falling steeply,
for example, in Stockholm while remaining high in the forest counties, will force
migration even upon those groups that are most adversely affected by it.
Meaningful Work-A Prerequisite of Health
Access to meaningful work has a crucial bearing on people’s lives, not only in their
working hours but also during their leisure, on their housing conditions and living
habits, and consequently, on their health as well. The proportion of women gainfully
employed has risen steeply throughout the postwar era, from less than 30 percent in
Swedish Public Health Report, 1987
/ 25 1
1940 to nearly 60 percent in 1970 to almost 80 percent today. The possible implications of this trend for women’s health are uncertain. As we have seen, women’s
mortality continues t o decline, and the percentage professing to suffer from prolonged
illness, tiredness, etc., has remained fairly constant for both sexes over the past decade.
Absence due to sickness among the gainfully employed is also developing along fairly
similar lines for both sexes. Men during this period have suffered heavy rejection from
the labor market, above all in occupations and regions affected by structural changes
in agriculture, forestry, mining, steel making, and shipbuilding. The proportion of men
employed between the ages of 55 and 64 has declined from 84 percent in 1970 to
73 percent in 1985. Meanwhile, the corresponding percentage for women in this age
group rose from 44 to 57 percent.
The number of persons over 50 retiring early on disability pensions has tripled over
the past 20 years. Today, 18 percent of this age group (50 to 64) are retired. Certain
surveys indicate that retirement has the same negative impact on health status as
unemployment. For example, the initial period of retirement brings an upsurge of
mortality. The retirement of handicapped persons or persons with strenuous working
conditions has a positive health impact. Persons who have been heavily commited to
their work, have had few friends and acquaintances, have no leisure activities, have
enjoyed good health, and receive a small pension appear to be particularly prone to
negative health effects after retirement. There is also a great deal to suggest that the
negative development of mortality observed among middle-aged men during the 1970s
may have been partly connected with developments in the labor market. At all events,
the increase was most apparent among the nonemployed and among industrial
workers.
Unemployment Affects the Entire Family. Total unemployment has declined over
the past five years from 3.5 percent to below 2.0 percent. The forest counties have not
shared in this reduction. The medical effects of unemployment are to a great extent
dependent on its duration. Seventy-five percent of all people unemployed for more
than a year are over 55 years old. The upturn in recent years has not reduced the long
periods of unemployment affecting this age group. Experience of unemployment is
twice as common among manual workers as among salaried employees-a difference
that has increased during the past decade. The corresponding difference, however, is
smaller among young persons.
Overt unemployment, however, is only the tip of the iceberg. The 100,000 or so
who are overtly unemployed must be compared with almost 500,000 who have
retired on disability pensions or are involved in various labor market policy programs
such as sheltered employment, employment training, temporary public employment,
youth teams, etc. Unemployment and the threat of unemployment experienced by
many people taking part in different kinds of temporary public employment, youth
team employment, etc., have been found t o be connected with physiological reactions,
such as elevated blood pressure and secretion of stress hormones, and with mental
reactions such as apathy and nervousness. They also involve a greater risk of such
illnesses as cardiac infarct and depression. Negative consequences are also apparent
among the children of unemployed persons, in the form of increasing truancy, absence
due to sickness, and deteriorating achievement at school. The consequences of youth
252 / Diderichsen and Lindberg
unemployment have been less extensively studied, but certain reports indicate an
elevated risk of alcoholism and of growing mental and psychosomatic symptoms.
THE CONDITIONS OF CARE
Diminishing Share of GNP for Medical Services
Between 1970 and 1984, health and medical services expanded on average by
about 3.5 percent annually in fured money terms. The rate of expansion has gradually
declined, however, and is only forecast at 1.0 percent for 1987. In 1980, both the
United States and Sweden allocated 9.5 percent of GNP for health and medical care.
Since then, the United States has raised its percentage to 11.0 (1986), whereas in
Sweden the figure has fallen to 9.1 percent. State grants to the county councils have
fallen in relative terms since 1982, from 28 percent of county council expenditure in
1982 to 20 percent in 1987. In addition, the Parliament has passed legislation reducing
the county council tax.
Toward More Open Care?
From the turn of the century until the 1970s, the expansion of public caring
resources was dominated by the construction of institutions. Today, in the 1980s,
only long-term care is being expanded, and this only in the form of local nursing
homes. Even here, the growth rate has decelerated (Table 9). A heavy expansion of
outpatient care amenities was inaugurated in the mid-1960s. In 1951, home-help
services were being provided for 16,000 senior citizens. By 1985, the figure was
313,000. This is a multiple increase, even when compared with the growing number
of elderly persons. Personnel strength in primary care has tripled in 20 years up to the
year 1980, and viewed in relation to the expansion of inpatient care, primary care also
increased slightly during the 1970s (Table 10). But under the current spending restrictions, it has not been able to hold its ground (Table 11).
Table 9
Number of institutional beds, 1945-85, thousands‘
Acute medical care, etc.
Psychiatric care
Long-term care
Old people’s homes
Mentally retarded
Total
1945
1960
1970
1980
1985
41
22
32
10
54
33
15
42
14
49
37
34
60
14
46
27
45
57
9
39
23
52
52
8
119
158
194
184
174
8
‘Source: Aldreomsorg i utveckling. SOU 1987:21.
Swedish Public Health Report, 1987
/ 253
Table 10
Number of medical practitioners in Sweden and percentage practicing outside
hospitals in public care (staff physicians and district medical officers) and in
privatelcorporate health services, all Sweden, 1886-1985"
Percentage outside hospitals
1886
1930
1950
1970
1975
1979
1982
1985
No. of physicians
Statelcounty
councilb
Privateloccupational
health careC
728
2,329
4,894
10,558
14,050
16,840
18,400
21,200
26
23
15
10
12
16
16
16
60
35
20
9
8
9
10
10
'Source: SOU 1978:74, LKELP and LA 85.
bFor the period 1896-1 970, district medical officer appointments and municipally employed
physicians. For the period 1975-83, appointments for postqualified physicians in outpatient
care outside hospitals, and for 1984-85 in primary care, etc.
CPrivatepractitioners,occupational health physicians.
Few questions of health and medical policy have formed the subject of so many
inquiries and policy decisions over the past 50 years as this development of noninstitutional primary care away from hospitals. The first and, in its day, highly
controversial proposal was introduced in 1948 by the Hoier Commission; the latest,
by the HS 90 Commission (SOU 1984:39). In between, the OHS Committee submitted a report in 1957. The National Board of Health and Welfare presented its
first program of principle for outpatient care in 1969 and then proceeded to elaborate
these principles in the report of the HS 80 Commission in 1975. These programs of
principle have gained the support of medical mandators, who in their planning during
Table 11
Approximate distribution of costs between various fields of activity in public
medical care, percentages'
Short-term somatic care
Long-term somatic care (including local nursing homes)
Psychiatric care
Nonhospital outpatient care
1970
1983
1986
60
17
17
6
50
24
13
13
48
21
12
13
'Source: Hut utnyttjas hslso- och sjukvhdens resurser? Spri rapport 193, 1985, and Spri
threeyear program for 1987-89. (Spk The Planning and Rationalization Institute for the Health
and Social Services.)
254
/ Diderichsen and Lindberg
the 1970s advocated increasing emphasis on primary care. But, as we have seen, this
order of priority has proved very difficult to realize.
Emphasis on primary care, home nursing and local nursing homes included, is
vitally important for several reasons:
Primary care, with home-visiting services available around the clock, is essential
in order for the transition from institutional care to care in the home to represent an improvement, not a deterioration, from the patient’s point of view.
In 1986, only 35 percent of primary care areas had access to home nursing
personnel round the clock. Stand-by responsibility for primary care, including
district medical officers permanently on call for home visits, is rare.
Compared with private medical care, public primary care has more extensive
contact with elderly persons and with manual workers, i.e., the categories with
the greatest needs (Figure 5). One reason for this is that private care has primarily
opted for the more well-established areas of the big cities. The residents of
Danderyd (a prosperous municipality) in the County of Stockholm visit a
private practitioner 2.4 times more often than the residents of Botkyrka (a
working-class municipality). At the same time, mortality and absence due to
sickness are 50 to 100 percent higher in Botkyrka.
Public primary care has a pivotal role to play in preventive work, in conjunction with local popular movements, companies, and public authorities.
Public
Privote
Man. workers
Low level sal.empl.
High level scl.empl.
0
I
I
25
50
75
Figure 5 . Percentages of manual (man.) workers and salaried employees (sal. empl.) visiting
private or public primary care centers, Stockholm, 1984.
Swedish Public Health Report, 1987
/ 255
REFERENCES
1. Medicinalstyrelsens underddniga berattelse for Br 1910. (Public Health Report 1910, in
Swedish.) Haso- och sjukvkden, Stockholm, 1912.
2. Myrdal, A. Nation and Family. The Swedish Experiment in Democratic Family and Population Policy. Harper and Brothers, New York and London, 1941.
3. Diderichsen, F. Ideologies in the Swedish health sector today: The crisis of the social democracy. Int. J. Health Serv. 12(2): 191-200,1982.
4. Dahlgren, G., and Diderichsen, F. Strategies for equity in health: Report from Sweden. Int. J.
Health Serv. 16(4): 517-537,1986.
5 . Folkhalsorapport, Socialstyrelsen Redovisar 1987: 15. (Public Health Report 1987, in
Swedish.) Stockholm, 1987.
6. Schelp, L. Epidemiology as a Basis for Evaluation o f a Community Intervention Programme
on Accidents. Karolinska Institute, Sundbyberg, 1987.
7. Diderichsen, F. Health and social inequities in Sweden. SOC.Sci. Med., 1989, in press.
8. Hammar, N., and Ahlbom, A. Recent trends in mortality from and incidence of myocardial
infarction in Stockholm. Br. Med. J. 294: 609-610,1987.
9. Alfredsson, L., Spetz, C.-L., and Theorell, T. Type of occupation and near-future hospitalization for myocardial infarction and some other diagnosis. Inf. J. Epidemiol. 14: 378-387,
1988.
10. Brenner. S.-0.. and Levi. L. Lone-term unemnlovment amone women in Sweden. SOC.Sci.
Med. 25(2): 153-162, 1987.
I
. -
I
11. Alfredsson, L., von Arbin,M., and deFaire, U. Mortality from and incidence of stroke in Stockholm. Br. Med. J. 292: 1299-1303,1986.
12. Vggero, D., and Persson, G. Occurrence of cancer in socioeconomic groups in Sweden. Scand.
J. SOC.Med. 14: 151-160,1986.
13. V%gero, D., and Persson, G. Cancer survival and social class in Sweden. J. Epidemiol. Community Health 41(3): 2 0 4 2 0 9 , 1987.
Direct reprint requests to:
Dr. Finn Diderichsen
Department of Social Medicine
Karolinska Institute
S-172 83 Sundbyberg
Sweden


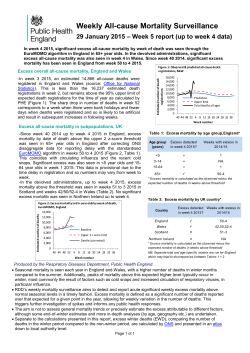


© Copyright 2026