
TRENDWATCH - American Hospital Association
AMERICAN HOSPITAL ASSOCIATION
MARCH 2015
TRENDWATCH
Rethinking the Hospital Readmissions Reduction Program
R
educing readmissions is an
important way to improve
quality and lower health care spending.
Hospitals are making significant progress;
as reported by the Centers for Medicare
& Medicaid Services (CMS), the national
readmission rate (i.e., instances when
patients return to the same or different
hospital within 30 days of discharge) fell
to 17.5 percent in 2013, after holding
steady at around 19 to 19.5 percent
for many years.1 However, reducing
readmissions is a complex undertaking
because not all readmissions can or
should be prevented; indeed, some
are planned as part of sound clinical
care. Furthermore, while hospitals are
working to reduce readmissions caused
by clinical care practices, there are many
other factors beyond hospitals’ control—
including sociodemographica factors,
such as poverty and lack of access to supportive services in the community that
aid post-hospitalization recovery, that
increase the risk of readmission. Public
policy efforts intended to reduce hospital
readmissions should target the reduction of only avoidable readmissions. In
measuring hospital performance, policies
must account for many factors beyond
hospitals’ control in order to facilitate
accurate comparisons of performance.
To encourage efforts to reduce
readmissions, Congress created in the
Affordable Care Act (ACA) the Hospital
Readmissions Reduction Program
(HRRP), which instructs CMS to penalize hospitals with higher-than-expected
readmissions for specific clinical conditions—such as heart attack, pneumonia
and heart failure.2 The HRRP payment
penalties took effect in fiscal year (FY)
2013; hospitals can incur a penalty of up
to 3 percent of their Medicare payments.
While hospital readmissions are
declining, there are serious questions
about how the HRRP assesses penalties
that affect the fairness and long-term
sustainability of the program.
Specifically, hospitals and other stakeholders have raised concerns about:
1. The lack of risk-adjustment for key
sociodemographic factors, usually outside of hospital control, that influence
the likelihood of readmission; and
2. The inclusion of readmissions
unrelated to the initial admission
in the determination of the HRRP
penalties.
Other critiques have highlighted the
imbalance between the total penalty
amounts relative to the reimbursement
for readmissions. As CMS increases both
the reimbursement at risk and adds conditions to the program, more hospitals
will face penalties, further highlighting
the urgency of addressing the program’s
shortcomings. The HRRP’s approach
to calculating hospital penalties needs
refinement to achieve the goal of
reducing readmissions without unfairly
penalizing hospitals.
Overview of the Hospital Readmissions Reduction Program3
Mandated by the ACA, the HRRP is
a payment penalty program designed
to reduce Medicare fee-for-service
(FFS) hospital readmission rates for
conditions that account for expensive,
high-volume admissions and frequent
readmissions. As of federal FY 2013,
CMS reduces a hospital’s Medicare
payments for all patients if it has a
higher-than-expected 30-day readmission rate for patients with specific
clinical conditions. By law, only those
hospitals paid under the Inpatient
Prospective Payment System are eligible
for HRRP penalties; therefore, CMS
excludes critical access hospitals
(CAHs), inpatient psychiatric facilities
and post-acute care providers such as
long-term acute care hospitals.b
CMS uses an ACA-mandated
formula to determine each eligible
READMISSIONS REDUCTION PROGRAM
hospital’s readmissions performance.
The formula calculates an “excess
readmission ratio” for each hospital
using readmission measures for the
clinical conditions in the program,
and then translates that ratio into a
financial penalty. As of FY 2015, the
HRRP includes readmission measures for heart attack, heart failure,
pneumonia, chronic obstructive
pulmonary disease (COPD) and
total hip and knee replacements. The
excess readmission ratio calculated
by the measures determines whether
a hospital has a higher number of
readmissions than the national average
for other hospitals treating a similar
clinical mix of patients (i.e., patients
with a similar mix of age and clinical
risk factors for readmissions). CMS
applies a “risk adjustment,” described
in a later section of this TrendWatch,
to account for the differences in clinical
mix across hospitals before making
comparisons. Hospitals with “excess”
readmissions when compared to the
expected level incur a penalty—the
higher the number of excess readmissions, the higher the penalty. When
calculating each hospital’s readmissions
performance, CMS excludes patients
who had certain planned readmissions,
transferred to other hospitals, or left
against medical advice. However, CMS
includes patients readmitted for reasons
unrelated to the initial hospital stay in
readmission rate calculations.
The HRRP’s measures assess readmissions over a three-year “performance
period.” However, this performance
period begins over four years prior to
the payment adjustment, which means
that a hospital may face a HRRP
penalty despite more recent improvements in performance. In addition, the
program determines penalties based
on performance before the time period
and conditions subject to the HRRP
were known. For example, CMS did
not finalize inclusion of elective total
hip replacement in the HRRP until
Aug. 19, 2013, well after the initial
performance evaluation period (July 1,
2010 to June 30, 2013) for this condition had ended.
The number of clinical conditions
included in the HRRP has expanded
over time. In FY 2013, hospitals
were assessed on readmission rates for
patients with heart failure, pneumonia and acute myocardial infarction
(AMI) using National Quality Forum
(NQF)-endorsed measures, as required
by the ACA. Beginning in FY 2015,
Congress authorized the Secretary of
Health and Human Services (HHS) to
expand the number of HRRP conditions for which hospitals may incur
a penalty. As a result, CMS included
penalties for excessive readmissions associated with COPD and elective total
hip/total knee arthroplasty in FY 2015
and will add coronary artery bypass
grafting to the program in FY 2017.
In addition to adding new conditions, the maximum penalty under the
HRRP also has increased. In FY 2013,
the maximum penalty was a 1 percent
reduction in base operating payments
for all Medicare FFS discharges. The
maximum penalty increased to 2
percent in FY 2014 and 3 percent for
FY 2015 and beyond. Higher penalties raise the level of reimbursement
at-risk, while each additional condition increases the number of patients
included in the program and, consequently, the probability that hospitals
will face a readmission penalty. Under
this structure, the HRRP is merely a
way to cut hospital payments, rather
than an incentive program to improve
patient care.
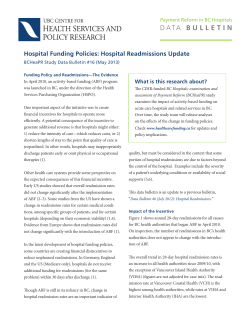
HRRP calculations utilize past performance periods that include older experience data, which do
not reflect more recent hospital efforts to reduce readmissions.
Chart 1: Performance Periods for Each HRRP Adjustment Year
2008
2009
2010
FY 2013 Performance Period 7/1/08—6/30/11
2011
8/18/2011
2012
10/1/2013
FY 2015 Performance Period 7/1/10—6/30/13
2009
New measures finalized
2010
2011
Penalty effective date
HRRP = Hospital Readmissions Reduction Program; FY = Fiscal Year
Source: FY 2011, 2012, 2013, 2014, and 2015 Inpatient Prospective Payment System Final Rules.
2
2014
10/1/2012
FY 2014 Performance Period 7/1/09—6/30/12
2008
2013
2012
8/19/2013
2013
10/1/2014
2014
TRENDWATCH
Not All Readmissions Are Avoidable
Providers may be able to prevent certain
readmissions if they ensure that their
patients receive the right care at the
right time, both in the hospital and
in subsequent care settings. However,
many readmissions may be unavoidable due to the natural progression of
disease, accepted treatment protocol or
a patient’s preferences. Recognizing the
potential for confusion when evaluating
readmissions, the American Hospital
Association (AHA) consulted with clinicians to create this framework for types
of readmissions:
• A planned readmission related to the
initial admission, such as placement of
a ventricular assist device following a
heart attack.
• A planned readmission unrelated to
the initial admission, such as readmission for removal of a lung tumor
discovered during an admission for
a heart attack.
• An unplanned readmission unrelated to the initial admission, such as
readmission for a fracture sustained in
a car accident following an initial stay
for pneumonia.
• An unplanned readmission related to
the initial admission, such as readmission for a surgical site infection or
adverse reaction to a medication.
Planned readmissions are typically
part of clinically appropriate care. For
example, during an acute care admission, clinicians may identify the need
for a hysterectomy or hernia repair and
plan these procedures within 30 days
of the original hospital admission.
At first, CMS did not adequately exclude
these and other planned readmissions
from calculating penalties in the pro-
gram. However, after receiving feedback
from hospitals, CMS developed an
algorithm to omit planned readmissions
from the HRRP penalty calculation.4
Accordingly, many planned readmissions
within 30 days of discharge no longer
count as a readmission for the HRRP.
Similarly, CMS should not hold
hospitals accountable for unplanned,
unrelated admissions because they are
unpredictable and not typically preventable. However, these readmissions are
currently included in the HRRP penalty
calculation even though they are not
associated with care delivered by the hospital. Avoidable, unplanned readmissions
related to the original admission—such
as an infection after receiving a surgical
procedure in the hospital—are included
in the HRRP and should be the focus of
hospital improvement efforts.
The HRRP should only focus on unplanned readmissions related to the initial admission.
Chart 2: A Framework for Classification of Readmissions
Related to Initial Admission
Unrelated to Initial Admission
Planned
Readmission
A planned readmission for which the reason
for readmission is related to the reason for the
initial admission.
A planned readmission for which the reason for
readmission is not related to the reason for the
initial admission.
Unplanned
Readmission
An unplanned readmission for which the reason
for readmission is related to the reason for the
initial admission.
An unplanned readmission for which the reason
for readmission is not related to the reason for the
initial admission.
HRRP = Hospital Readmissions Reduction Program
Source: American Hospital Association.
“”
from the field
“If someone fractures his leg after being hospitalized for pneumonia and is readmitted, that
would count toward a readmission penalty. It is hard to understand why hospitals would be
penalized for an event we cannot control and that is unrelated to the care the patient received.”
— Paul Janke, president and CEO, Bay Area Hospital, Coos Bay, Ore.
5
3
READMISSIONS REDUCTION PROGRAM
Risk-adjustment Should Account for Factors Outside of a Hospital’s Control
Hospitals are intensely focused on
reducing avoidable readmissions using
a number of strategies. For example,
many hospitals have used the tools from
Project Re-engineered Discharge (Project
RED), which focuses on enhancing the
clarity and effectiveness of discharge
plans and care coordination. Hospitals
are arranging follow-up appointments,
educating patients about what to expect
when they are discharged, and conducting follow-up phone calls in the days
immediately after hospital discharge to
address issues such as questions about
medications.6
Nevertheless, the likelihood of
patients being readmitted to the hospital is affected not only by the steps
hospitals take to improve care, but also
by a variety of clinical and non-clinical
factors beyond providers’ control. For
example, Medicare beneficiaries with
six or more chronic conditions have a
readmission rate of 25 percent, compared to 9 percent for those with one
or no chronic conditions.7 Similarly,
patients whose illnesses are more severe,
or who have other co-morbid conditions (e.g., a heart failure patient who
also is diabetic) face greater challenges
in recovering from illness and are more
likely to have readmissions. While not
all hospitals treat the same proportions
of these types of patients, the HRRP
requires the comparison of the performance of all hospitals. Therefore, it
is important to ensure that hospitals
are not adversely impacted and receive
“”
from the field
Medicare beneficiaries with multiple chronic conditions have
higher readmission rates.
Chart 3: 30-Day Readmission Rates for Medicare Fee-for-Service Beneficiaries,
by Number of Chronic Conditions, 2011
25%
14%
9%
10%
0 to 1
2 to 3
4 to 5
Number of Chronic Conditions
Source: Lochner KA, et al. (2013). Multiple Chronic Conditions Among Medicare Beneficiaries: State-Level Variations in Prevalence,
Utilization, and Cost, 2011. Medicare & Medicaid Research Review. http://www.cms.gov/mmrr/Downloads/MMRR2013_003_03_b02.pdf
greater penalties simply because they
treat more complex patients.
Risk-adjustment is a widely accepted
statistical technique that accounts for
some the factors outside the control
of providers when one is seeking to
isolate and compare the quality of care.
It is intended to create a “level playing
field” that allows fairer comparisons of
whether providers are doing all they can
to ensure the quality of care. The readmission measures used in the HRRP
risk-adjust for several clinical factors,
including age, gender, comorbidities
and patient frailty. CMS recognizes that
comorbidities and frailty contribute to
the cause and outcome of the admission
and acknowledges that hospitals have
limited tools to cure or manage them
during a single inpatient stay.
However, CMS does not apply a
similar risk-adjustment to account for
sociodemographic factors within a hospital’s service area. Research shows that
economically disadvantaged patients
often have limited access to services
and resources that can help support
their recovery post-hospitalization and,
therefore, reduce their likelihood of
being readmitted. Such supports include
public transportation to get to follow
up appointments, grocery stores to
support any special dietary needs, and
social supports.9 A study at Henry Ford
“[Because penalties fall disproportionately on] teaching and safety-net hospitals that care
for disadvantaged patients, the Hospital Readmissions Reduction Program diverts money
away from these hospitals and has the unintended consequence of worsening disparities
between rich and poor.”
— Steven Lipstein, president and CEO, BJC HealthCare, St. Louis, Mo.
8
4
6 or more
TRENDWATCH
Hospital in Detroit, Mich., found that
patients living in high-poverty neighborhoods were 24 percent more likely to
have a readmission when compared to
their peers in higher-income neighborhoods.10 In addition, researchers who
evaluated readmission rates reported by
more than 4,000 hospitals for patients
with AMI, heart failure and pneumonia found that nearly 60 percent of
the variation in hospital readmission
rates was due to community attributes,
including high unemployment rates,
never-married residents, and fewer
general practitioners per capita.11 Highquality inpatient care and coordination
with other care providers cannot change
these individual and neighborhood
characteristics.
CMS has resisted risk-adjusting for
additional sociodemographic factors,
including sociodemographic status,
suggesting that doing so would “mask disparities in quality of care provided.”12
However, excluding important sociodemographic factors, such as income,
education, occupation and primary language, creates an inherent disadvantage
for hospitals treating patient populations
at higher risk for readmission. As a result,
many researchers have demonstrated that
hospitals caring for the neediest patients
are much more likely to incur a penalty
under the HRRP.13, 14, 15, 16, 17
Current risk-adjustment does not account for key sociodemographic
factors associated with readmissions.
Chart 4: Sociodemographic Factors Excluded from Medicare HRRP Risk-adjustment
Sociodemographic Factors
Dual eligibility (Medicaid) status
Income level
Education level
Medicare eligibility status (e.g., aged, disabled)
Employment status
Primary language and health literacy
Geographic region
Social support structure (e.g., single or married)
Housing situation
HRRP = Hospital Readmissions Reduction Program
Source: Avalere analysis of HRRP measure specifications.
Hospitals with a larger percentage of low-income patients are more
likely to incur a HRRP penalty.
Chart 5: Hospitals Incurring an HRRP Penalty, by DPP Quartile, FY 2015(1)
$117
85%
$78
62%
Percent Penalized
Highest Income (Lowest DPP Quartile)
Total Penalty (In Millions)
Lowest Income (Highest DPP Quartile)
HRRP = Hospital Readmissions Reduction Program; FY = Fiscal Year; DPP = Disproportionate Patient Percentage
Source: American Hospital Association
(1) The Centers for Medicare & Medicaid Services uses DPP to determine eligibility for disproportionate share hospital payments.
DPP includes Medicaid and Medicare Supplemental Security Income days. In this analysis, each quartile includes 849 hospitals.
Policymakers Recommend Risk-adjusting for Sociodemographic Factors
Recognizing the disproportionate
readmissions risk for hospitals serving low-income patients, in June
2013 the Medicare Payment Advisory
Commission (MedPAC) recommended
that CMS account for sociodemographic
factors in calculating HRRP penalties.18
Specifically, MedPAC recommended
that hospitals continue to report unadjusted readmission rates, so that data on
potential disparities would be available.
However, to calculate readmissions
penalties, MedPAC recommended that
CMS compare hospitals’ readmission
rates to peer groups with similar proportions of low-income patients, rather than
evaluating their performance based on
national levels. Each hospital would have
a fixed target readmission rate based
on its percentage of patients receiving
Supplemental Security Income benefits.c
Hospitals that exceed the target would
incur a penalty, while those below the
target would not. In such a way, CMS
would use one method to report publicly
on readmission results (i.e., unadjusted
for sociodemographic factors), and a
second method for assessing payment
adjustments. MedPAC reiterated its
recommendations in its March 2014
5
READMISSIONS REDUCTION PROGRAM
report,19 while other stakeholders also
have called on CMS to incorporate
sociodemographic factors.
An expert advisory panel convened by
the NQF recommended including sociodemographic factors in risk-adjustment
models for outcome measures—such as
readmission rates, mortality and cost—
in order to fully account for all characteristics outside of provider control
that could influence performance. The
NQF is a non-profit, consensus-standards organization that endorses quality
measures assessing the performance of
hospitals, physicians, health plans and
others. The NQF endorsement process is
intended to assess whether measures are
important, scientifically sound, usable
and feasible to collect. NQF-endorsed
measures are used extensively in CMS’s
“accountability programs” (i.e., quality
reporting and pay-for-performance programs). In the case of the HRRP, CMS
is required to use NQF-endorsed measures for the first three conditions in the
program (i.e., heart attack, heart failure
and pneumonia) and is expected to seek
NQF endorsement of any additional
measures added to the program.
The NQF’s existing evaluation
criteria prohibit using sociodemographic
factors in risk-adjustment models.
Similar to CMS, the NQF believed
such adjustment could mask disparities.
NQF convened a panel of experts in
response to the increased use of outcome
measures to determine provider payment adjustments, and concerns from
many stakeholders about whether the
lack of sociodemographic adjustment in
measures lead to worse performance for
“”
from the field
some providers simply because they serve
a more socioeconomically disadvantaged
patient population. In August 2014, the
panel published its final report, which
recommended that policymakers include
sociodemographic factors in measures
because “patient characteristics that are
present before care begins can influence
patient outcomes” and lead to incorrect
conclusions about care quality.20
The panel recommended that
measures used for accountability
applications (such as the HRRP)
should include risk-adjustments for
both clinical and sociodemographic
factors. These adjustments would help
isolate the effect of hospital care on
readmissions from the circumstances
outside of providers’ control. The panel
called on the NQF to define a timeline
for transitioning to sociodemographic-adjusted measures and to work with
organizations such as CMS, the Office
of the National Coordinator for Health
Information Technology, and the Agency
for Healthcare Research and Quality
to define a standard set of sociodemographic variables. Commenters broadly
supported the recommendations, with
143 of 158 organizations that submitted
comments offering support, including
providers and some consumer advocates.
Only eight organizations opposed the
recommendations, including CMS and
some consumer and purchaser groups.21
Legislators also have turned their
attention to the issue of sociodemographic adjustment. In 2014, legislators
in the 113th Congress demonstrated
bipartisan support for addressing this
issue by introducing two bills supported
“The growing body of evidence suggests that the primary drivers of variability in 30-day
readmission rates are the composition of a hospital's patient population and the resources
of the community in which it is located—factors that are difficult for hospitals to change.”
— Karen E. Joynt, M.D., M.P.H., and Ashish K. Jha, M.D., M.P.H.
22
6
by the AHA that would have required
CMS to include sociodemographic
factors in the HRRP’s risk-adjustment
methodology. Representative James
Renacci (R-Ohio) introduced the
Establishing Beneficiary Equity in the
Hospital Readmission Program Act in
March 2014, which would have required
CMS to risk-adjust readmission rates
based on the share of Medicaid-Medicare
dual eligible individuals served by the
hospital.23 The bill would have excluded
additional readmissions for patients
whose diagnoses may require frequent
hospitalizations, such as transplants
or end-stage renal disease. The legislation also would have encouraged CMS
to consider whether it could exclude
non-compliant patients from the
calculation of readmission rates. The
Hospital Readmission Program Accuracy
and Accountability Act, introduced
by Senator Joe Manchin (D-W.V.) in
June 2014, would have required CMS
to define a methodology to risk-adjust
readmission measures using Census
data for at least one of three sociodemographic factors: income, education or
poverty level.24 Beginning in FY 2017,
CMS could use an alternative method,
such as the peer groups recommended
by MedPAC.
These two bills, and the MedPAC
and NQF expert panel recommendations, all acknowledged the need for the
HRRP’s risk-adjustment methodology to
account for additional sociodemographic
factors to help ensure that CMS compares hospital performance fairly, while
maintaining an incentive for all hospitals
to prevent avoidable readmissions.
TRENDWATCH
Other Proposed Modifications to the Penalty Formula
In addition to the issue of adjusting
for sociodemographic factors, stakeholders have raised a number of other
concerns about whether the statutorily
mandated payment penalty formula
creates an appropriate incentive to
reduce readmissions. In its June 2013
Report to Congress, MedPAC found that
the readmissions penalty formula has a
“multiplier effect” that results in:
1) readmissions penalties that far exceed
the cost of excess readmissions, and
2) an inverse relationship between
national readmission rates and hospital
penalties.25 That is, as readmission rates
drop across the nation, the magnitude
of the penalty could stay the same or
grow. Over the long run, this penalty
structure actually penalizes hospitals for
achieving the goal of the program—real
reduction in readmissions that mean
better care for patients at lower cost.
The AHA has found that the
multiplier effect is, in part, due to the
design of readmissions penalty formula.
The intent of the formula is to recoup
the “excess costs” paid to hospitals for
readmissions determined to be excess
readmissions for each condition in the
program. But the formula specified in
the statute multiplies the per-admission
payment by the number of all admissions for that condition, not merely the
number of readmissions. This allows
Medicare to recoup a payment amount
that is far greater than the payments
made for the excess readmissions. This
issue could be somewhat mitigated if
the HRRP’s legislative language were
clarified so that the formula multiplies
by the number of expected readmissions
instead of the number of admissions.
Others have highlighted limitations
with the statutory requirement defining
how CMS must measure “excess” readmissions. Specifically, CMS calculates
an “excess readmissions ratio” that is the
ratio of predicted to expected readmissions. The readmissions are calculated
using a complex regression formula
that blends the national average readmission rate with the hospital’s actual
readmissions. The regression formula
uses what is known as a “random effects
model,” which assumes that random
variations in performance are more likely
to be present when there is a smaller
volume of cases for a given condition.
To adjust for these effects, rates for
hospitals with less volume are more
heavily weighted toward the national
average. Hospitals with a larger number
of cases for a given condition will be
judged mostly on their own performance, while scores for smaller hospitals
are pulled toward the national average.
However, the use of this blended model
makes it more difficult for hospitals
to assess their actual performance. In
its June 2013 report, MedPAC also
notes that the use of this measurement
approach reduces the incentive for
hospitals to collaborate on reducing
readmissions; if the national average
readmission rate goes down, a given hospital’s readmission penalty may increase
because it has not reduced its readmissions as quickly as the national average.26
The HRRP formula has a multiplier effect that makes the penalties greater than the hospital
revenue for readmissions.
Chart 6: Simplified HRRP Penalty Formula Showing the Multiplier Effect
Simplified Penalty Formula:
x
1 ÷ (National readmission rate for the condition)
=
Penalty
{
{
(Payment rate for the initial admission) x
(Adjusted number of excess readmissions)
Excess Cost
Penalty Multiplier
HRRP = Hospital Readmissions Reduction Program
Source: Medicare Payment Advisory Commission. (15 June 2013). June 2013 Report to Congress: Medicare and the Health Care Delivery System. Chapter 4 Appendix: Refining the Hospital
Readmissions Reduction Program. http://www.medpac.gov/documents/reports/jun13_ch04_appendix.pdf?sfvrsn=0
7
READMISSIONS REDUCTION PROGRAM
Due to the multiplier effect, the hospital in this example has a penalty five times larger than the
cost of excess readmissions.
Chart 7: Example Hospital Penalty Calculation Illustrating the Multiplier Effect(1)
Hospital A has 100 HF admissions and 22 risk-adjusted HF readmissions. The national average readmission rate is 20 percent, meaning
Hospital A has two excess readmissions. Hospital A receives $10,000 for each HF admission, so the cost of the excess readmissions is $20,000.
However, due to the multiplier effect, the penalty is $100,000:
Payments for Excess Readmissions
{
{
HRRP Penalty Calculation
$10,000 x
=
$20,000
<
$10,000 x
x
1 ÷ 0.20
=
$100,000
HRRP Penalty
Payment per heart failure
(HF) admission
2 excess HF readmissions
National HF
readmission rate
CMS = Centers for Medicare & Medicaid Services; HRRP = Hospital Readmissions Reduction Program; HF = Heart Failure
Source: Medicare Payment Advisory Commission. (15 June 2013). June 2013 Report to Congress: Medicare and the Health Care Delivery System. Chapter 4 Appendix: Refining the Hospital Readmissions
Reduction Program. http://www.medpac.gov/documents/reports/jun13_ch04_appendix.pdf?sfvrsn=0
(1) In this example, the hospital has 100 HF admissions and 22 HF readmissions. Since the national HF readmission rate is 20 percent, CMS would expect the hospital to have only 20 HF readmissions.
As a result, the hospital has two excess HF readmissions that would be subject to an HRRP penalty.
Comparison against national averages
also may inflate the number of penalized hospitals. Although readmission
rates have declined nationally, as many
as three-quarters of hospitals have
incurred a penalty during each year of
the HRRP.27 This trend will persist in
subsequent years of the program, as the
formula does not set an acceptable lower
bound for readmissions.28
Some researchers have raised concerns
that efforts to reduce unnecessary
hospitalizations may inadvertently serve
to increase readmissions penalties. For
example, the Altarum Institute studied
readmission rates in San Diego County
“”
from the field
after area hospitals began participating
in the Center for Medicare & Medicaid
Innovation’s Community-Based Care
Transitions Programd in 2010.29
Altarum found that readmissions and
hospitalizations per 1,000 Medicare
FFS beneficiaries in the county fell 15
percent and 11 percent, respectively,
in 2013 compared to 2010. However,
the HRRP calculates readmissions on
a per hospital discharge basis. As a
result, because their readmissions and
discharges declined at about the same
rate, it appears that their readmission
rates did not improve significantly. On
a per discharge basis, San Diego County
hospitals ultimately only had a 4 percent
decline in their readmission rate, with
10 of 14 hospitals incurring a FY 2015
HRRP penalty. In essence, decreases in
discharges masked reductions in total
readmissions. Worse yet, if discharges
fall at a faster rate than readmissions,
then hospital readmission rates would
increase, despite a decline in the total
number of readmissions.
MedPAC recommended to Congress
an alternative method for assessing
hospital performance that respects the
intent of the program while recognizing
improvements. The proposal would set
a risk-adjusted readmission rate target
“Some hospitals and communities are creating the standard for best practices, and the rest
of the country should be learning from them. Instead, the measure that Medicare uses
makes them appear to [have made] little progress.”
— Dr. Joanne Lynne, director, Center for Elder Care and Advanced Illness, Altarum Institute
30
8
TRENDWATCH
based on historical national performance
and a hospital’s share of low-income beneficiaries.31 For example, CMS could set
the unadjusted target at the 40th percentile of the national hospital readmission
rate during 2011, and then risk-adjust
that target based on a hospital’s share of
low-income beneficiaries. Such a target
would create a defined benchmark for
hospitals to work toward during the
performance year and, unlike the current
system, every hospital could avoid a penalty
by achieving fewer readmissions than the
target. Ultimately, the Medicare program
would continue to reduce expenditures
related to readmissions, in addition to
collecting any penalties imposed on
hospitals that fail to reduce readmissions
below the predetermined target.
The percentage of penalized hospitals will increase as additional
conditions are included in the program.
Chart 8: Percent of Hospitals Incurring a HRRP Penalty, FYs 2013-2015
Two conditions added to the HRRP
76%
64%
63%
No Penalty
37%
36%
Penalized
24%
FY 2013
FY 2014
FY 2015
CMS: Centers for Medicare & Medicaid Services; HRRP = Hospital Readmissions Reduction Program; FY = Fiscal Year
Source: Avalere analysis of FY 2013, 2014, and 2015 Inpatient Prospective Payment System Final Rule Supplemental Data Files.
Note: FY 2013 n = 3,500, FY 2014 n = 3,483, FY 2015 n = 3,476
Hospital efforts to reduce discharges can increase readmission rates.
Chart 9: Example of Increased Readmission Rate despite Fewer Total Readmissions
Hospital B has 100 HF discharges and 20 readmissions in 2013, a readmission rate of 20 percent. In 2014, due to population health
management efforts, Hospital B’s HF discharges decline to 65 and HF readmissions to 16. Although the total number of HF readmissions
fell by 20 percent, Hospital B’s HF readmission rate increased to 25 percent:
2013
2014
20 heart failure (HF) readmissions
16 readmissions
÷
÷
100 HF discharges
65 HF discharges
20% HF Readmission Rate
<
25% HF Readmission Rate
HRRP = Hospital Readmissions Reduction Program; CMS = Centers for Medicare & Medicaid Services; HF = Heart Failure
Source: Adapted from: Lynn J and Jencks S. (26 August 2014). A Dangerous Malfunction in the Measure of Readmission Reduction. Altarum Institute.
http://medicaring.org/2014/08/26/malfunctioning-metrics/
Note: CMS does not count readmissions as a new index stay for the purposes of assessing HRRP payment penalties.
9
READMISSIONS REDUCTION PROGRAM
Hospitals Are Reducing Readmissions through Innovative Approaches
Despite issues with the HRRP, hospitals
are committed to reducing avoidable
readmissions. The Health Resource and
Educational Trust (HRET), an educational affiliate of the AHA,32 joined
CMS’s Partnership for Patientse as a
Hospital Engagement Network (HEN)
that included 1,500 hospitals and 31
state hospital associations.33 The HENs
have helped advance the Partnership’s
goal of reducing readmissions by identifying and sharing best practices.
To that end, HRET developed a
number of tools and resources to prevent
readmissions, including a toolkit, checklist and multilingual posters. The toolkit
describes four primary drivers of lower
readmission rates: (1) identification of
high-risk patients, (2) self-management
skills (e.g., appropriate medication use),
(3) coordination of care along the care
continuum, and (4) adequate follow-up
and community resources.34 For each
driver, the toolkit includes example
interventions and metrics to measure
success. Early results are promising, as
HRET’s HEN hospitals have decreased
heart failure readmission rates by an
average of 13 percent.35
In 2008, the University of California
San Francisco Medical Center started
a team-based intervention to prevent
readmissions for elderly patients with heart
failure. The medical center’s multi-disciplinary team includes two nurse program
coordinators, geriatricians, hospitalists,
cardiologists, clinical nurse specialists, case
“”
from the field
Ongoing follow-up care for high-risk patients is essential to
reducing readmissions.
Chart 10: Steps in Swedish Covenant Hospital’s Care Transitions Program
1. Pre-discharge Risk-screening
Screen all patients for their risk of readmission and note risk-level
in their electronic health record
2. Hospital Visit with Wellness Coach
Assess capacity of high-risk patients to self-manage care and enroll in
ongoing follow-up program
3. Home Visit with Wellness Coach
Visit within two days of discharge for nutrition screening,
medication reconciliation and care coordination
4. Ongoing Follow-up Care (3 Months)
Conduct follow-up calls for all enrolled patients and additional
home visits, disease management coaching and telehealth
monitoring as needed
Source: Przybyciel N. (24 April 2014). Aggressive Intervention Helps Chicago Hospital Drastically Lower Number of Patients Readmitted
After Treatment. Swedish Covenant Hospital Press Release. http://www.swedishcovenant.org/about-us/in-the-news/news-details/2014/
04/24/aggressive-intervention-helps-chicago-hospital-drastically-lower-number-of-patients-readmitted-after-treatment
managers, social workers, pharmacists,
dieticians and post-acute care providers.37
When the patient is first admitted to the
hospital, the team alerts external providers
who are responsible for the patient, such as
the primary care physician, and engages
others, such as home health care providers, during the course of treatment and
discharge.38 During the inpatient stay,
providers educate patients about their
“Smaller hospitals are required to meet the same guidelines as larger ones but with fewer
patients and fewer employees… If we can get best practices and tools that someone has
already invested in, such as patient education or a checklist, that saves us a great deal
of time.”
— Scotta Orr, director, Quality and Accreditation, Transylvania Regional Hospital, Brevard, N.C.
36
10
TRENDWATCH
condition using the “Teach Back” method,
which ensures that patients understand
and “repeat back” their care plan before
returning home.39 After discharge, patients
at the highest risk of readmission receive
home visits from geriatricians to help
manage cognitive conditions and improve
medication adherence.40 The program has
reduced 30-day heart failure readmission
rates by 45 percent.41
Swedish Covenant Hospital, a
safety-net provider in Chicago, Ill.,
implemented a care transitions program
focused on reducing readmissions for
“”
from the field
patients with chronic conditions
discharged home that were uninsured
or ineligible for home health services.42
The program features disease management coaching by registered nurses, a
home visit to reconcile medications and
conduct nutrition screening, and ongoing
telemonitoring, telephone calls and home
visits as needed for three months.
After implementing the program,
Swedish reduced its Medicare FFS
readmission rate from 16 percent in
2012 to 14.3 percent in 2013. Rather
than focusing on conditions included in
the HRRP, Swedish focused on all types
of patients with chronic conditions.
Unfortunately, the lagging HRRP performance period began to incorporate
Swedish’s 2013 improvement only at the
end of the FY 2015 performance period
(July 2010 to June 2013). As a result,
Swedish has incurred a HRRP penalty in
all three-adjustment years, including FY
2015.43 These penalties may further strain
scarce resources deployed to reduce readmissions, as Swedish already draws on
its general account and grant funding to
support the care transitions program.
“Without these crucial services, these patients would fall through the cracks of the health
care system and remain at higher risk of complications, dramatically impacting their quality
of life while contributing a large portion to the soaring level of health care expenditures in
the U.S.”
— Kathy Donofrio, associate vice president and nursing director, Swedish Covenant Hospital
44
Conclusion
Not all readmissions are the same; they
can be planned or unplanned, and
related or unrelated to the initial admission. Planned readmissions often have
a medically supported reason, while
unplanned, unrelated readmissions are
unpredictable and beyond a hospital’s
control. Improvements to the HRRP
should focus the penalty on admissions
that are avoidable and related to the
initial admission. An adjustment for
sociodemographic factors will ensure
that hospitals serving higher-risk populations do not incur disproportionate
penalties. Critical changes to the HRRP
evaluation timeframe and performance
rate calculation would promote continued
innovation in reducing readmissions
without unfairly penalizing hospitals
focused on providing care for their
community’s population.
POLICY QUESTIONS
• How can regulators reform the HRRP to focus only on
unplanned, related readmissions – those that hospitals are
best able to prevent?
•H
ow can policymakers encourage hospitals and other
providers to continue to design and implement innovative
approaches to reduce readmissions?
• What additional research is necessary to ensure appropriate
risk-adjustment of readmission rates for the HRRP?
• What are the best approaches for disseminating information
about programs proven to reduce readmissions?
• What are the best methods to account for patients’
life circumstances and sociodemographic factors when
calculating expected and actual readmission rates?
•H
ow can regulators anticipate and avoid unintended adverse
consequences for patients and providers when imposing
financial penalties for excess readmissions?
11
ENDNOTES
1. U
.S. Department of Health and Human Services. (7 May 2014). New HHS Data Shows
Major Strides Made in Patient Safety, Leading to Improved Care and Savings. http://
innovation.cms.gov/Files/reports/patient-safety-results.pdf
2. Patient Protection and Affordable Care Act, 42 U.S.C. § 18001 (2010).
3. Centers for Medicare & Medicaid Services. (24 November 2014). Readmissions
Reduction Program. http://www.cms.gov/Medicare/Medicare-Fee-for-Service-Payment/
AcuteInpatientPPS/Readmissions-Reduction-Program.html
4. Centers for Medicare & Medicaid Services. (19 August 2013). 42 CFR §§ 412.50 –
412.154. http://www.gpo.gov/fdsys/pkg/FR-2013-08-19/pdf/2013-18956.pdf
5. KCBY CBS 11. (18 November 2014). Bay Area Hospital Working to Lower Readmission
Rate. http://www.kcby.com/news/health/Bay-Area-Hospital-working-to-lower-readmissionrate-283104981.html
6. See the Project RED website at http://www.bu.edu/fammed/projectred/index.html
7. Lochner KA, et al. (2013). Multiple Chronic Conditions Among Medicare Beneficiaries: StateLevel Variations in Prevalence, Utilization, and Cost, 2011. Medicare & Medicaid Research
Review. http://www.cms.gov/mmrr/Downloads/MMRR2013_003_03_b02.pdf
8. Lipstein SH. (May 2014). Viewpoint: Without sociodemographic data, ACA provisions
unfairly penalize teaching hospitals. Association of American Medical Colleges. https://www.
aamc.org/newsroom/reporter/may2014/380604/viewpoint.html
9. Hu J., et al. (May 2014). Socioeconomic Status and Readmissions: Evidence from an Urban
Teaching Hospital. Health Affairs. https://www.henryford.com/documents/PR/Readmission_
Study.pdf
10. Ibid.
11. Herrin J, et al. (9 April 2014). Community Factors and Hospital Readmissions Rates. Health
Services Research. http://onlinelibrary.wiley.com/doi/10.1111/1475-6773.12177/abstract
12. Lipstein SH and Dunagan CW. (22 July 2014). The Risks of Not Adjusting Performance
Measures for Sociodemographic Factors. Annals of Internal Medicine. http://annals.org/
article.aspx?articleid=1890210
13. Gu Q., et al. (13 January 2014). The Medicare Hospital Readmissions Reduction Program:
Potential Unintended Consequences for Hospitals Serving Vulnerable Populations. Health
Services Research. http://onlinelibrary.wiley.com/doi/10.1111/1475-6773.12150/abstract
14. Gilman M, et al. (August 2014). California Safety-Net Hospitals Likely To Be Penalized By
ACA Value, Readmission, and Meaningful-Use Programs. Health Affairs. http://content.
healthaffairs.org/content/33/8/1314.abstract
15. Williams KA, et al. (11 September 2014). Medicare Readmission Penalties in Detroit. New
England Journal of Medicine. http://www.nejm.org/doi/full/10.1056/NEJMc1405047
16. Sjoding MW, et al. (1 November 2014). Readmission Penalties for Chronic Obstructive
Pulmonary Disease Will Further Stress Hospitals Caring for Vulnerable Patient Populations.
http://www.atsjournals.org/doi/abs/10.1164/rccm.201407-1345LE#.VKLCW14AAA
17. Amy JH, et al. (2 December 2014). Neighborhood Socioeconomic Disadvantage and
30-Day Rehospitalization: A Retrospective Cohort Study. Ann Intern Med. http://annals.org/
article.aspx?articleid=1983380
18. Medicare Payment Advisory Commission. (June 2013). Report to Congress: Medicare and
the Health Care Delivery System. Chapter 4: Refining the Hospital Readmissions Reduction
Program. http://www.medpac.gov/documents/reports/jun13_ch04.pdf?sfvrsn=0
19. Medicare Payment Advisory Commission. (March 2014). Report to Congress: Medicare
Payment Policy. Chapter 3: Hospital Inpatient and Outpatient Services. http://www.medpac.
gov/documents/reports/mar14_ch03.pdf?sfvrsn=0
20. Fiscella K, et al. (15 August 2014). Risk Adjustment for Socioeconomic Status or
Other Sociodemographic Factors. National Quality Forum Technical Report. http://www.
qualityforum.org/Publications/2014/08/Risk_Adjustment_for_Socioeconomic_Status_or_
Other_Sociodemographic_Factors.aspx
21. Lipstein SH and Dunagan CW. (22 July 2014). The Risks of Not Adjusting Performance
Measures for Sociodemographic Factors. Annals of Internal Medicine. http://annals.org/
article.aspx?articleid=1890210
22. Joynt KE and Jha AK. (18 April 2012). Thirty-Day Readmissions—Truth and Consequences.
New England Journal of Medicine. http://www.nejm.org/doi/full/10.1056/NEJMp1201598
23. H.R. 4188 Establishing Beneficiary Equity in the Hospital Readmission Program Act of 2014.
(11 March 2014). https://www.congress.gov/113/bills/hr4188/BILLS-113hr4188ih.pdf
24. S. 2501 Hospital Readmissions Program Accuracy and Accountability Act of 2014.
(19 June 2014). https://www.congress.gov/113/bills/s2501/BILLS-113s2501is.
pdfaspx?id=22288
25. Medicare Payment Advisory Commission. (June 2013). Report to Congress: Medicare and
the Health Care Delivery System. Chapter 4: Refining the Hospital Readmissions Reduction
Program. http://www.medpac.gov/documents/reports/jun13_ch04.pdf?sfvrsn=0
26. Ibid.
27. Avalere analysis of FY 2013, FY 2014, and FY 2015 Inpatient Prospective Payment System
Final Rules: Hospital Readmissions Reduction Program Supplemental Data Files. Available
at: http://www.cms.gov/Medicare/Medicare-Fee-for-Service-Payment/AcuteInpatientPPS/
Readmissions-Reduction-Program.html
TrendWatch, produced by the American Hospital
Association, highlights important trends in the
hospital and health care field. Avalere Health supplies
research and analytic support.
TrendWatch—March 2015
Copyright © 2015 by the American Hospital Association.
All Rights Reserved
28. James J, et al. (12 November 2013). Medicare Hospital Readmissions Reduction Program.
Health Affairs Health Policy Brief. http://www.healthaffairs.org/healthpolicybriefs/brief.
php?brief_id=102
29. Lynn J. (8 December 2014). The Evidence that the Readmissions Rate (Readmissions/
Hospital Discharges) is Malfunctioning as a Performance Measure. http://medicaring.
org/2014/12/08/lynn-evidence/
30. Altarum Institute. (16 December 2014). Medicare’s Measure for Readmissions Fails
to Identify Excellence and Improvement. http://altarum.org/about/news-and-events/
medicare%E2%80%99s-measure-for-readmissions-fails-to-identify-excellence-andimprovement
31. Medicare Payment Advisory Commission. (15 June 2013). June 2013 Report to Congress:
Medicare and the Health Care Delivery System. Chapter 4 Appendix: Refining the Hospital
Readmissions Reduction Program. http://www.medpac.gov/documents/reports/jun13_ch04_
appendix.pdf?sfvrsn=0
32. Health Research and Educational Trust. (1 December 2014). About Us. http://www.hret.org/
about/index.shtml
33. Vesley R. (11 November 2014). Hospital Engagement Networks participants make big
strides in reducing patient harm and readmissions. http://www.hhnmag.com/display/
HHN-news-article.dhtml?dcrPath=/templatedata/HF_Common/NewsArticle/data/HHN/
Magazine/2014/Nov/fea-hospital-engagement-networks
34. Health Research and Educational Trust. (2014). Readmissions Change Package:
Improving Care Transitions and Reducing Readmissions. http://www.hret-hen.org/index.
php?option=com_phocadownload&view=category&download=1232:preventablereadmission-change-package&id=72:preventable-readmissions
35. Vesley R. (11 November 2014). Hospital Engagement Networks participants make big
strides in reducing patient harm and readmissions. http://www.hhnmag.com/display/
HHN-news-article.dhtml?dcrPath=/templatedata/HF_Common/NewsArticle/data/HHN/
Magazine/2014/Nov/fea-hospital-engagement-networks
36. McKinney M. (19 May 2012). Laying the Groundwork for Quality. Modern Healthcare.
http://www.modernhealthcare.com/article/20120519/MAGAZINE/305199934
37. Brimmer K. (26 November 2012). UCSF Medical Center Program Slashes Heart Failure
Readmission Rates. http://www.healthcarefinancenews.com/news/ucsf-medical-centerprogram-slashes-heart-failure-readmissions
38. Rush-Monroe K. (6 July 2011). UCSF Medical Center Program Cuts Heart Failure
Readmission Rate by 30 Percent. http://www.ucsf.edu/news/2011/07/10166/ucsf-medicalcenter-program-cuts-heart-failure-readmission-rate-30-percent
39. Brimmer K. (26 November 2012). UCSF Medical Center Program Slashes Heart Failure
Readmission Rates. http://www.healthcarefinancenews.com/news/ucsf-medical-centerprogram-slashes-heart-failure-readmissions
40. Rush-Monroe K. (6 July 2011). UCSF Medical Center Program Cuts Heart Failure
Readmission Rate by 30 Percent. http://www.ucsf.edu/news/2011/07/10166/ucsf-medicalcenter-program-cuts-heart-failure-readmission-rate-30-percent
41. Brimmer K. (26 November 2012). UCSF Medical Center Program Slashes Heart Failure
Readmission Rates. http://www.healthcarefinancenews.com/news/ucsf-medical-centerprogram-slashes-heart-failure-readmissions
42. Przybyciel N. (24 April 2014). Aggressive Intervention Helps Chicago Hospital Drastically
Lower Number of Patients Readmitted After Treatment. Swedish Covenant Hospital Press
Release. http://www.swedishcovenant.org/about-us/in-the-news/news-details/2014/04/24/
aggressive-intervention-helps-chicago-hospital-drastically-lower-number-of-patientsreadmitted-after-treatment
43. Avalere analysis of FY 2013, FY 2014, and FY 2015 Inpatient Prospective Payment System
Final Rules: Hospital Readmissions Reduction Program Supplemental Data Files. Available
at: http://www.cms.gov/Medicare/Medicare-Fee-for-Service-Payment/AcuteInpatientPPS/
Readmissions-Reduction-Program.html
44. Joseph N. (17 January 2014). North Side Patients to Benefit From Grant Award. Chicago
Tribune. http://www.chicagotribune.com/suburbs/community/chi-ugc-article-north-sidepatients-to-benefit-from-grant-awa-2014-01-17-story.html
a.
A combination of socioeconomic factors, such as income and employment status, and
demographic factors, such as age and health literacy.
b. All hospitals in Maryland are exempt from the HRRP due to that state’s unique
reimbursement system, although CMS requires Maryland to operate its own readmissions
reduction program.
c. Supplemental Security Income (SSI) is a Federal program for senior citizens—as well as
individuals who have significant disabilities - who have very little or no income. Beneficiaries
receive payments to help meet needs like food, clothing and shelter. Additional information
on the SSI program can be found at http://www.ssa.gov/ssi/.
d. San Diego County’s Aging and Independence Services convened the hospitals as the partner
agency for the Community-Based Care Transitions Program.
e. One goal of the Partnership for Patients is to reduce readmission rates by 20 percent
compared to 2010.
American Hospital Association
800 10th Street, NW
Two CityCenter, Suite 400
Washington, DC 20001-4956
202.638.1100
www.aha.org
Avalere Health LLC
1350 Connecticut Avenue, NW
Suite 900
Washington, DC 20036
202.207.1300
www.avalere.com


© Copyright 2026