
The Smarter Balanced Common Core Mathematics Tests Are Fatally
The Smarter Balanced Common Core
Mathematics Tests Are Fatally Flawed
and Should Not Be Used
An In-Depth Critique of the Smarter Balanced
Tests for Mathematics
Steven Rasmussen
SR Education Associates
March 2015
www.mathedconsulting.com
[email protected]
This critique is available at www.mathedconsulting.com. Send comments to the
author at [email protected]. This is a “living” document. As needed
and appropriate, I will clarify or revise the analysis to address reader comments
and queries.
Please share the critique with colleagues and friends. When sending it out as an
attachment, you may want to download the latest version available online. If
you want to link to it, link to http://www.mathedconsulting.com, and not to the
PDF version that appears in your browser. As this critique is revised, the
document URL may change and result in a “file not found” error, but the link to
my website will always work and the links there will point to the most current
version.
Last revisions were made on 3/24/15.
The Smarter Balanced Common Core Mathematics Tests
Are Fatally Flawed and Should Not Be Used
An In-Depth Critique of the Smarter Balanced Tests for Mathematics
Steven Rasmussen, SR Education Associates, March 2015
Introduction
In 2010, like many educators, I was hopeful that a $330 million investment of tax dollars
from the U.S. Education Department and the pooled resources of state governments1
would produce a new generation of standardized tests for assessing student performance
on the Common Core State Standards for Mathematics and English language arts—tests
that would be better than the traditional paper-and-pencil multiple-choice tests. Both
Smarter Balanced and PARCC, the Education Department’s contractors, promised
technology-enhanced tests populated by high cognitive-demand tasks with interfaces that
made smart use of digital tools for mathematics to more deeply assess student knowledge.
Smarter Balanced, with an award of $176 million2, promised to “create innovative and
real-world item types that rely on technology platforms.”3
In early 2012, Smarter Balanced contracted with CTB/McGraw-Hill (CTB) for $72
million4 to build the tests we’ll see this year. CTB enlisted partners, including the
American Institutes for Research, to assist with the “development of technology-enabled
test items and new open-source scoring engines as well as research into new item types.”5
In October 2014, after a field test with 4.2 million students that “closely resembled the
summative assessment that students will participate in during the spring of 2015,”6
Smarter Balanced published a self-congratulatory report titled Smarter Balanced “Tests
of the Test” Successful: Field Test Provides Clear Path Forward. Although the report
contained very little discussion of the technology-enhanced items overall, it stated:
These item types appear to have caused little problem for the large majority of
students, although educators raised concerns about those without access to
technology at home. Interestingly, the youngest students reported the greatest ease
with navigating the items and entering responses.7
While neither the tryout tests nor their detailed results have been officially made public,
summary analyses from Smarter Balanced, as well as nationwide and local news reports
following the field test, indicated that things had not gone well. Christina Samuels, in an
Education Week blog post on January 2, 2015, reported that Smarter Balanced predicts
results will be poor when the tests are given in the spring:
Based on the field test results, the consortium estimates that fewer than half of all
students will be able to demonstrate proficiency by scoring at level 3 or above when
the test is first administered, though test officials expect those scores to rise over
time.8
Alarmed by these troubling signs, concerned about the impact of poor test scores on my
profession, and skeptical that any vendor could craft high-quality technology-enhanced
tests in the short time allotted in the contracts, I decided to take a close look at the
Smarter Balanced practice and training tests available online at
www.smarterbalanced.org/practice-test.
Critique of Smarter Balanced Common Core Tests for Mathematics, SR Education Associates 2 The landing page for these tests reads:
Welcome to the Smarter Balanced Practice and Training Tests
The Smarter Balanced Practice and Training Tests are available to schools and
districts for practice and training purposes, professional development activities, and
for discussions with parents, policymakers, and other interested stakeholders.9
I clicked through the links, randomly chose the practice test for tenth grade mathematics,
and clicked “Yes, Start My Test.”
What I found shocked me. This analysis of mathematics test questions posted online by
Smarter Balanced reveals that, question after question, the tests:
• Violate the standards they are supposed to assess;
• Cannot be adequately answered by students with the technology they are required to
use;
• Use confusing and hard-to-use interfaces; or
• Are to be graded in such a way that incorrect answers are identified as correct and
correct answers as incorrect.
If the technology-enhanced items on the Smarter Balanced practice and training tests are
indicative of the quality of the actual tests coming this year—and Smarter Balanced tells
us they are10— the shoddy craft of the tests will directly and significantly contribute to
students’ poor scores.
Smarter Balanced Practice Test Items
You can follow my critique of the first five items from the Smarter Balanced tenth grade
math practice test to get a clear picture of the problems.
Tenth Grade Practice Test, Question 1
Before I even attempted to answer Question 1, I was troubled by its premise. It begins
with a mathematical contrivance: who uses fractions—fifths of gallons and miles—when
discussing fuel consumption? Odometers display decimals rather than common fractions.
So the problem context starts off as immediately insincere. The question then speaks of
“these rates,” but no rates are given. A rate for this question—according to the Common
Core itself—would have the unit “miles per gallon.” Remember, Mathematical Practice 6
is Attend to precision per the Common Core’s Standards for Mathematical Practice.11
Critique of Smarter Balanced Common Core Tests for Mathematics, SR Education Associates 3 Further, students are asked to do two almost identical calculations to obtain the correct
answer to this question, doubling the chance of a careless error from a student who knows
how to do the problem.
When I solved the two parts of the question on scratch paper, I suspected something
funny was going on—both of my answers were whole numbers: 25 and 31. How likely is
it to get two whole numbers when dividing mixed numbers? And how even less likely are
whole-number answers in any real-world driving context? The fact that both answers
turned out to be whole numbers made me question my work. This will be very unnerving
to students who would expect to get a mixed number as a result of these calculations.
Question 1 will make an anxious student more anxious.
Then, as I went to indicate my answers, I was simply confused by the technology I was
seeing. The “innovative” technology here is a dynamic number line—a digital
manipulative familiar to me for which I’ve developed many compelling applications
while working with The Geometer’s Sketchpad, and which I know has a deep research
pedigree going back at least to Paul Goldenberg’s Dynagraphs project. But Question 1
has nothing to do with elementary number theory, proportion, continuity, the real
numbers, or any of the other mathematical concepts that dynamic number lines are
productively used for. The problem simply tests a procedural skill—division of mixed
numbers—and the dynamic number line is used only as a mechanism for filling in a
blank with a specific value, and a whole number value at that. This was supposed to be an
innovative use of mathematics technology? The technology “enhancement” has nothing
whatsoever to do with the actual problem. A multiple-choice response would serve this
question perfectly well.
As I reflected on the problem and played with the number line, my initial confusion about
the number line’s apparent lack of relevance turned into eye-opening concern.
When I dragged one of the “answer cars” to the number line, I was surprised to discover
that when I let go of it, the car jumped to a nearby number before coming to rest. I tried
again—with the same result. What I was seeing was some form of “snap-to-points,”
where the technology “corrected” my answer to the nearest whole number on the number
line. “Why?” I wondered. And what are the implications of this snap-to behavior?
First, the snap-to behavior comes as a complete surprise to any user. When you drag the
car and then let it go, the snap causes the car to jump left or right by up to half a mile on
the number line, locking in to a value other than the one you chose. It’s counterintuitive
and unsettling. If a student calculates an answer that is not a whole number, then she
simply cannot represent her answer in this test. Worse, a student who believes her noninteger answers to be correct will be frustrated and confused when the test “changes” her
answers to values she did not intend. “Those weren’t my answers—why can’t I show my
answers?”
Second, the snap-to behavior is mathematically inappropriate for what Question 1 is
asking. Mathematically, snap-to behavior is a rounding function—in this case, the snap
rounds any answer to the nearest whole number. But Question 1 does not ask for answers
rounded to whole numbers. And it wouldn’t make sense to ask for rounded answers in a
problem about fraction division where exact procedure is being tested.
Third, a discrete snap-to interaction space (“interaction space” is the Smarter Balanced
name for the place on a technology-enhanced item where students perform an interaction
to indicate their answers to a question) is the wrong model for the continuous function
Critique of Smarter Balanced Common Core Tests for Mathematics, SR Education Associates 4 describing gas consumption. On a Common Core test that adheres to CCSSM
Mathematical Practice 4: Model with mathematics,12 it’s worth getting mathematical
models right.
Mathematical Practice 2: Reason abstractly and quantitatively, reads, in part:
Quantitative reasoning entails habits of creating a coherent representation of the
problem at hand; considering the units involved; attending to the meaning of
quantities, not just how to compute them;….13
Judged by this standard, at this point in my analysis, Question 1 isn’t performing well.
The more I played with Question 1, however, the more I realized how poorly conceived
the question’s interaction space was. It could actually misinterpret students’ intentions
and interfere with our understanding of their work. The number line snap will convert an
infinite number of incorrect answers into a correct answer. For example, if a student
calculates 25 1/5 as the mileage for Justin’s car and drags the car to this spot, Justin’s car
snaps to 25—the correct answer. The test’s scoring mechanism wouldn’t know the
student calculated incorrectly. Any answer a student calculates between 24½ and 25½
becomes a correct answer. Huh?
But simply turning off the snap won’t cure the flaws in Question 1—in fact, doing so
would only create other problems. How do you locate a mistaken answer like 23 7/31 on a
number line drawn to this scale if you wanted to? With no snap, how would the scoring
algorithm know what fraction a student wants to indicate?
If the test makers gave information in decimal fractions—like an actual odometer—and
the problem was testing division with decimal numbers, a number line without snap
would be appropriate. In such a case, CTB would have defined acceptable tolerances for
the location of the “answer cars” according to the process set out in the document
Smarter Balanced Assessment Consortium: Technology-Enhanced Items Guidelines.
These guidelines, authored by Measured Progress/ETS Collaborative at the outset of
Smarter Balanced’s work, and presumably followed by CTB, state that, for this type of
question, “appropriate tolerances should be determined through cognitive labs and/or
field testing.”14
So the problem is not just that the number line behavior needs fixing; it’s that a number
line is the wrong tool for answering Question 1. Asking students to display the exact
results of division with fractions on a tiny number line marked only in whole units —
whether it “snaps” or not—is like asking students to eat soup with a fork to determine
whether they know how to eat.
So while innocuous at first glance, Question 1 mismodels the mathematics of the given
problem; and if you answer the problem incorrectly, depending on your answer, the test
may (a) accept it, (b) autocorrect it (e.g., 25 1/5 becomes 25), or (c) auto-discorrect it into
some other wrong answer (e.g., 25½ becomes 26)! In terms of the insight we gain into
students’ performance by examining their test results, we can’t tell what a right answer
means because the system corrects many wrong answers into right ones. And we can’t
tell what a wrong answer means because it may not be the student’s wrong answer, or, if
it is, the result does not let us identify which of the many mathematical skills contributing
to a successful solution the student actually got wrong.
Critique of Smarter Balanced Common Core Tests for Mathematics, SR Education Associates 5 While the test makers might think that the dynamic number line adds cachet to an
otherwise traditional problem, analyzing this test question demonstrates that they are in
over their heads when it comes to the design of technology-enhanced items.
Practice Test: Tenth Grade, Question 2
In Question 2, the test makers ask students to solve a geometric problem and show their
work. In general, asking students to show their work is a good way to understand their
thinking. In this case, would anyone begin the problem by not sketching a picture of the
circles? I doubt it. I certainly started by drawing a picture. A simple sketch is the most
appropriate way to show one’s work. However, there’s just one major issue: There is no
way to draw or submit a drawing using the problem’s “technology-enhanced” interface!
So a student working on this problem is left with a problem more vexing than the
mathematical task at hand—“How do I show my picture by typing words on a
keyboard?”
Clearly whoever wrote the test question saw how nonsensical the “show your work”
admonition was, and added, “… or explain how you found your answer.” So I start typing
my answer: “First I drew a circle centered at point (6, 7) that passed through the point
(1, 4). Then I….” It doesn’t take very long to wonder, “Are the test makers playing a
cruel joke on me?”
Question 2 asks students to solve the problem and then conceptually re-engineer their
solutions in order to accommodate the limitations of the testing machine and the test
design—all while the test clock is ticking.
Give me a grid and a circle-drawing tool if I am to show circles on a coordinate plane!
Let me use a dynamic-dragging representation—like the one they misused in Question
1—to drag a dynamic circle to its correct position and size on a given coordinate system.
Asking students to communicate their thinking should be done in fair and appropriate
contexts. This one is neither.
Critique of Smarter Balanced Common Core Tests for Mathematics, SR Education Associates 6 Tenth Grade Practice Test, Question 3
Question 3 amplifies the “careless error” possibilities present in Question 1. Even though
there are only two zeros of the function, a student who correctly finds them must
carefully click in four checkboxes to indicate his answer: “No” in the first row, “Yes” in
the second, “Yes” in the third, and “No” in the fourth.
Suppose, however, a student makes the common mistake of identifying 2 and –7 rather
than –2 and 7 as zeros of the function. That student likely checked the wrong box in
every row. But perhaps in the last minutes of the test, while reviewing his answers, our
student catches his mistake and tries to correct it. (You might think of this as one mistake
that results in four incorrect answers.)
To simulate this situation, I initially checked the wrong boxes in each row, and then, to
correct my mistake, I clicked the “No” box for the x-value 2 in the first row. Much to my
surprise, “Yes” remained checked in the first row! Instead of “No,” my answer is now
“Yes” and “No.” You can see this in the picture above. You will be hard pressed to find
another digital interface where a binary choice (a choice with an either/or response)
requires checking two boxes. Typically, an “or” question conforms to the standard digital
interface of either a single checkbox, or a radio button that automatically unselects “Yes”
when a user selects “No.” But that’s not how this problem was designed.
So our student, who is rushing to correct his mistake, must realize that this user interface
is unconventional and click twice properly in each row—once to check the right box and
a second time to uncheck the wrong box—eight clicks in all.
Phew! Try purposely messing this problem up and then try correcting your answer. The
silly interface will make you dizzy—even when you know the right answer. It feels like a
trap.
Rather than using checkboxes or radio buttons, what if the test makers had instead asked,
“Find all zeros of the function f where f(x) = x2 – 5x – 14,” and offered two blank boxes
for input? Not only is this a better question, it likely requires less keyboarding.
To gain insight into the original thinking about how a Yes/No question was supposed to
work, one can refer to early test design guidelines in the document Smarter Balanced
Assessment Consortium: Technology-Enhanced Items Guidelines, developed by the
Measured Progress/ETS Collaborative (April 16, 2012):
Critique of Smarter Balanced Common Core Tests for Mathematics, SR Education Associates 7 Boolean: A binary variable with two possible values: true and false. These variables
can be used to indicate the preference for any characteristic that has two states, e.g.,
on/off or yes/no. For example, whether a default coordinate grid should be displayed
on an item can be specified by the item writer as yes (true) or no (false). Whether a
student is limited to choosing one item or is allowed to choose multiple items can be
specified by the item writer as limited (true) or unlimited (false).15
This makes total sense. But it was not how Question 3 was implemented by CTB. And
the implementation of Boolean logic in a computer interface ought to be trivial.
The guidelines also set forth how the score of a single question might rely on the answers
to subparts of the item:
Composite Set (of Items): A composite set is composed of multiple individual items
(either technology-enhanced items, technology-enabled items, or traditional items),
with each item containing its own interaction, score response set, and scoring
algorithm. The items within the composite set are presented to the student together.
Each individual item returns an individual score that is independently calculated (i.e.,
the scoring of one item response is not dependent on the response to a prior item).
The score of the composite set is based on a combination of the scores from each
independent composition. To determine the composite set score, a composite set
includes a scoring algorithm that defines how scores from the multiple individual
items are combined to provide a single composite set score.16
Could it be that Question 3 was implemented as a composite of eight individual responses
corresponding to the eight independent checkboxes? Even when the answer to the
question is simply two integer values?
At some point between April 16, 2012, and now, a simple, well-specified interface idea
turned into a nightmarish implementation. Smarter Balanced quality control17 failed.
Tenth Grade Practice Test, Question 4
Critique of Smarter Balanced Common Core Tests for Mathematics, SR Education Associates 8 The wording on Question 4 is sloppy. It should read, “The graph of an exponential
function f is shown.” The question claims f(x) refers either to a function or to a graph. But
it is neither. The function would be simply f, its graph might be y = f(x), and the
question’s f(x) refers instead to the value of the function at x. As phrased, the question is
mathematically comprehensible—but it misuses the mathematical terminology CCSSM
expects students to use correctly by tenth grade. (The previous question also used sloppy
language. The wording should have been: “Consider the function f given by
f(x) = x2 – 5x – 14.”)
Additionally, there are multiple types of exponential functions, not just one as the
question implies.
In Question 4, students must determine the equation of the function shown through the
visual information in its graph. The equation is clearly supposed to be f(x) = 2x and thus
f(6) = 64. But actually, the function is only “kind of” 2x. After x = 2, the curve appears as
a straight line. No way the arrow is going to make it to (3, 8)! Also, f(–2) is not ½ and
f(–2) is clearly closer to 1/3 than to 1/4. The graphic on this question was obviously not
created using mathematical software. The graph is inaccurate and misleading.
Despite all of this, I like the question that the test makers thought they wrote.
However, as soon as I tried to input my answer, I was dismayed by what I saw. While it
is possible to simply type 64 in the answer space for Question 4, the test makers have also
offered a graphical keypad for inputting one’s answer with a series of mouse clicks
(officially, the “Equation Response Editor tool.” Why a graphical keypad here? As seen
with Question 2, students are asked to input the coordinates of a point in a text box (e.g.,
an ordered pair of numbers, either of which may be negative) and then follow it with a
typed essay explaining the answer. So undoubtedly the test makers expect that students
can type “64” on a computer keyboard. In Question 4, a graphical keyboard is therefore
unnecessary and inconsistent with the way students input their answers in Question 2.
To make matters worse, the graphical keypad is obviously poorly designed. It’s confusing
on the surface, and inscrutable “under the hood.”
First, I wondered why there were so many buttons on it and what they each did. The five
arrow buttons above the numbers—three leftward and two rightward pointing arrows—
look so similar that their actions can only be deciphered through trial and error. (I’ll list
their functions here to save you the effort of experimenting: move cursor left, move
cursor right, undo last action, redo last undone action, and delete digit to the left of the
cursor.) Only the last of these buttons—Delete—is needed. If one wanted more buttons,
Critique of Smarter Balanced Common Core Tests for Mathematics, SR Education Associates 9 Delete All might be a nice addition and correspond to the Clear and All Clear keys
students are familiar with on calculators.
Second, is the last key on the keypad a subtraction key or a key for inputting a negative
number, or can it be used for both purposes? It acts a lot like a subtraction key—you can
enter “65–1” for instance—but you can press it repeatedly and display many subtraction
signs—like a negative key. I wondered whether “65–1” would be evaluated by the parser
as 64. Unfortunately, it’s impossible to figure out what this key actually does
mathematically. That’s why I call it “inscrutable.”
Like “65–1,”all of the inputs below might equal 64. Would they be accepted as correct
answers to Question 4? Who knows?
Third, if a student using the keypad inputs an answer such as the answer below, it’s likely
the student made a typing mistake. Calculators typically don’t allow more than one
decimal point in a number—precisely to prevent silly typing mistakes. There is no benefit
to this question in allowing typing mistakes.
It can be argued that a generalized interface for mathematical input should allow arbitrary
and unrestricted input. After all, when a student does mathematical work with a pencil on
paper, there are no restrictions on the numbers and symbols that can be combined. The
extent to which a computer interface accepts arbitrary input, especially in mathematical
programs, is a fascinating and open question in user interface design. Every software
developer will answer this question differently. I have spent long hours in discussions
regarding the educational tradeoffs between arbitrary vs. constrained input over the
course of my career in software development, and seldom is the exact right course
obvious. However, all good software designers agree on two points: programs should be
consistent and they should provide user feedback in some manner as to whether input is
mathematically understandable and acceptable to the program. Neither consistency nor
helpful user feedback is present in the Smarter Balanced-CTB design.
Critique of Smarter Balanced Common Core Tests for Mathematics, SR Education Associates 10 Desmos (www.desmos.com) is a popular online graphing calculator for education that
offers such feedback. Here is a typical Desmos entry box if a user enters “64..0” with its
keypad.
Interestingly, for the mathematical input in its application, Desmos uses MathQuill, an
open source mathematical rendering library. From the apparent behavior of the Smarter
Balanced practice and training tests, it seems that CTB also uses MathQuill on the tests it
produced for Smarter Balanced. But Desmos has put thought and programming behind
the mathematical rendering library, offering an elegant solution to the conundrum, “Is it
bad typing or bad mathematics?” CTB didn’t bother to do this work. And student scores
will suffer as a result—for no good reason. In the Smarter Balanced tests, mathematically
incorrect answers, typing mistakes, as well as mathematically valid answers entered in
unconventional ways, will all be treated equally.
So in Question 4, too, the design that CTB implemented for Smarter Balanced penalizes
struggling students. Students at ease with the mathematics and familiar with computer
input interfaces will breeze through Question 4—they need only correctly type “64.” But
a student who struggles with the math, makes a mistake or two, and tries to correct his
mistakes may get mired in the ridiculous interface, especially if he is tempted to input his
answer with the graphical keypad. It reminds me of the saying, “The rich get richer….”
Tenth Grade Practice Test, Question 5
Question 5 starts off poorly. A normal distribution doesn’t approximate a height, it
approximates a distribution of many heights—in this case over 100 million.
When I read Question 5, I was immediately suspicious of the data based on the numbers
in the problem. To make any sense, an actual analysis of the spread of women’s heights
would have to measure heights with more precision than the problem indicates.
Critique of Smarter Balanced Common Core Tests for Mathematics, SR Education Associates 11 Remember, CCSSM Mathematical Practice 2: Reason abstractly and quantitatively states
in part:
Quantitative reasoning entails habits of creating a coherent representation of the
problem at hand; considering the units involved; attending to the meaning of
quantities, not just how to compute them.18
Curious how the data were actually reported, I searched the Internet and found a
document of the Centers for Disease Control and Prevention (CDC)19 that reports recent
data on heights of women in the United States. The aggregated mean of women over 20
in the CDC sample is 63.8 inches—not 65. All reports of heights of women in inches I
found from any authority reported heights to tenths of an inch—a choice of precision
appropriate for this problem. (Only one subgroup in the CDC data has a mean height that
would round to 65—non-Hispanic white women 20 to 39 years in age. Hmm…. This
ought to be a warning that gross errors in reporting data carry certain biases!) But
apparently, the actual numbers as reported in tenths of an inch would be inconvenient for
this question. Instead, Question 5 throws valid statistics to the wind and “approximates”
the actual curve so that both the median and the standard deviation are integers—and so
that even the correct answer for Question 5 based on the concocted data, 62.977 (found
using http://stattrek.com/online-calculator/normal.aspx), is very nearly an integer. One
wonders how many made-up scenarios the test writers explored to come up with a
question that almost completely eliminates the messiness of real data.
Once I got past my concerns about the data and precision, I began to think about how I
was going to answer the question. Question 5 seems designed to align with CCSSM High
School Statistics and Probability Standard HSS.ID.A.4, which states, “Use calculators,
spreadsheets, and tables to estimate areas under the normal curve.”20 (It’s the only
Common Core standard on the topic of standard deviation.) A statistician would use one
of these tools. But no spreadsheet, table, or statistical calculator is provided, so that
couldn’t be the method the test makers had in mind.
Since the problem says, “Click on the number line to show a vertical line,” I clicked.
You’ll see the vertical line I got in the picture above.
This line might be helpful to students who are trying to figure out how to divide the area
under the curve so that 25% is to the left of the line and 75% is to the right of the line—
except that students cannot drag the dashed line; they can only click the number line
below it and watch the dashed line jump to the integer value nearest their click. What a
convenient input method this is: it simultaneously communicates to students that an
integer answer is required, and implies to students that height (though graphed so as to
appear continuous) is actually a discrete variable, not a continuous one! This
inappropriate treatment of the height variable is presumably motivated by the need to
mark students’ “approximate” answers categorically as either correct or incorrect. While
mathematically more logical, a vertical line that moved continuously wouldn’t work like
a multiple-choice input method—and that’s what this question ends up being.
Look carefully at the areas to the left and right of the vertical line at 62 in my picture.
Can you tell me with assurance that 62 is not an excellent approximation of the “height at
which 25% of the women are shorter and 75% are taller”? I think it is an excellent
approximation given the visual information. The question doesn’t ask for an
approximation to a specific level of accuracy. But I’m certain that 62 is not the answer
that this question is looking for. Otherwise, the test writers wouldn’t have fudged the data
Critique of Smarter Balanced Common Core Tests for Mathematics, SR Education Associates 12 to get an answer that came out close to 63. They must have wanted me to put the line at
63. (Interestingly, the CDC data also reported that the first quartile for all women, asked
for here, is about 61.9 inches—so 62 is closer to the real answer to this question than 63.)
In the absence of a table or statistical calculator, visually estimating the areas under the
curve would be an excellent way to answer this question. This method, however, makes
no use of either the mean or the standard deviation or even the fact that the curve is a
normal distribution. The question done by my method becomes simply an area estimation
question. All a test-taker needs to do is estimate where the line puts 25% of the area on
the left.
How else might a student answer this question in the absence of the tools statisticians
would use? If a student studied normal distributions, she might know that about 68% of
the cases lie within plus and minus one standard deviation of the mean (e.g., from 62 to
68), and from this, determine that the area to the left of the 62-inch mark therefore
represents about 16% of the total? Does she then further guess that the interval between
62 and 63 appears to contain the additional 9% required to make 25%? Probably not.
Given that only integer answers are possible, she’d probably just guess the answer 63
because 64 just seems too close to the mean. Is this really what the test makers wanted
her to do? If so, her response to this question relies on recalling a single fact about the
relationship between the normal distribution and standard deviation and noticing the odd
behavior of the number line.
Beyond the issues on this question that relate to statistics, the snap-to behavior of the
number line butchers the elegant and fundamental mathematics related to calculus that
underlies the normal distribution curve and it’s relationship to the aggregated area under
the curve as one moves along the x-axis. The mechanism chosen by the test makers for
students to indicate their answers indicates clearly how little important mathematics the
test makers actually understand. For a detailed discussion of this issue, read the boxed
test at the end of this critique.
Before leaving this problem, let me use two students with two hypothetical answers to
illustrate concretely why an interaction space with a number line that snaps to integers
fails for this question as it did for Question 1 of this practice test.
The answer to Question 5 is very close to 62.977. For my argument, I’ll choose two
hypothetical answers from the set of possible answers that are close to this number. I
realize that I am choosing extreme cases. Suppose Student A thought that that the answer
was 63.49, for whatever reason, and clicked this point. The vertical line would appear at
63. Now suppose Student B thought that the answer was 62.49 and clicked there. This
answer would appear as 62. I imagine that the test would consider Student A’s answer to
be correct and Student B’s answer to be incorrect. But actually, Student B’s answer (P(X
≤ 62.49) = 0.20139) is a tiny bit closer to the correct answer than Student A’s (P(X ≤
63.49) = 0.30736). The interaction space behavior can make worse answers right and
better answers wrong. With other percentages, where the distribution curve is less linear,
this behavior could be more of a problem.
Movable lines in graphs of data can be used productively in many circumstances to gain
insight in statistics. This moveable line on this snap-to number line in this poorly crafted
question neither works to help students nor works to help us understand what students
know or don’t know about normal distributions and standard deviation.
Critique of Smarter Balanced Common Core Tests for Mathematics, SR Education Associates 13 Tests at Other Grade Levels Are No Better
I began this analysis with the first five items of an arbitrary practice test—I chose the
tenth grade practice test—because I didn’t want it to seem that I “cherry picked”
questions to complain about. The poor craft, however, is not confined to this single test.
The problems run through all of the tests. Below I’ve picked three questions from the
fourth grade practice test and one question each from the third and eleventh grade tests to
critique.
In the fourth grade practice test you’ll see many examples of the clumsy keypad for
numeric input—almost identical to the one we saw above on the tenth grade test. Except,
on the fourth grade test, the test makers seem to think every keypad needs a fraction
key—even when it is mathematically ridiculous to consider fractions as a possible
answer.
Fourth Grade Practice Test, Question 9
In a whole-number addition problem, why offer a keypad with a fraction key? And why
offer such a complicated keypad that resembles a calculator but builds numbers in the
opposite direction from the calculators kids likely use in school? (Calculators push digits
left, while this keypad works in the opposite direction.)
Mathematical Practice 5: Use appropriate tools strategically reads, in part:
These tools might include pencil and paper, concrete models, a ruler, a protractor, a
calculator, a spreadsheet, a computer algebra system, a statistical package, or
dynamic geometry software. Proficient students are sufficiently familiar with tools
appropriate for their grade or course to make sound decisions about when each of
these tools might be helpful, recognizing both the insight to be gained and their
limitations.21
On an addition problem like this one, the interface should be simple. If it’s just a question
of typing digits, leave it at that. One doesn’t need something that resembles a calculator
but doesn’t calculate and works in the opposite direction. (Later in this critique you’ll
find a link to a video that shows fifth grade students struggling to make sense of this
graphic keypad. You can see how it gets in the way of inputting simple answers. I
Critique of Smarter Balanced Common Core Tests for Mathematics, SR Education Associates 14 question how much user testing was done with kids during the design process of this and
other interface elements of these tests.)
I’m sure that the test makers would defend themselves by saying that this keypad is used
throughout the fourth grade test and that they wanted a consistent tool so that students
could use it regardless of the situation—a tool that allows the user to make whole
numbers, numbers with decimal points, and fractions. That doesn’t justify, however, the
overly complex design (five arrow buttons). Nor is this claim sustainable. Looking across
the fourth grade practice, there is no consistency. Other items, Questions 17 and 13 below
for instance, use different interfaces for numeric input. The consistency argument doesn’t
stand up.
Fourth Grade Practice Test, Question 17
With Question 17, the test makers abandon the keypad we saw in Question 9 of the fourth
grade test and insist you type numbers on your keyboard instead. (If there’s a reason the
keypad is “strategically appropriate” for entering four-digit whole number responses in
Question 9, but not a two-digit number in Question 17, I missed it.) So much for
consistency.
But this apparently simpler interface has critical problems that go beyond inconsistent
design. If a student fills in the first two boxes in the sequence as I have above, but is
stumped by the fourth element in the series, he is locked in “enter-numbers-in-boxes”
purgatory. The test clock is ticking. Anxiety is rising. And when he tries to advance to
Question 18 without filling in the last two boxes, he’ll receive the message I received
when I tried this:
Our poor student is stuck on Question 17. I imagine for some students, this is the end of
the test—Message Code: 10914! Explain that to your parents.
Critique of Smarter Balanced Common Core Tests for Mathematics, SR Education Associates 15 This sort of design violates a central tenet of sound test-taking advice we give our
students, which is to stay collected, keep an eye on the clock, skip parts that you’re stuck
on, and come back to them at the end when you have time. It also violates a central tenet
of sound computer interface design—avoid highly modal interfaces (of which Question
17 is one clear example)—dating back at least to Apple’s extensive critique of them in
the celebrated Macintosh Human Interface Guidelines that accompanied the firstgeneration Macintosh and the dawn of the modern computer interface.22 Users get stuck
in modal interfaces.
Finally, the wording of Question 17 misses the fundamental notion of iterative
sequences—the iterative process continues. The rule must state that explicitly. The
question should have been written as: “Start with the number 7 as the first term and add 5
to get the second term. Continue to add 5 to each term to get the next.” The “rule” given
in Question 17 actually generates a finite sequence with exactly two elements: 7 and 12. I
hope that the scoring engine for this problem insists that the third, fourth and fifth boxes
be left blank. But if they are blank, a student cannot proceed. In other words, a correct
answer to this question actually stops the test! Please, test makers, “Attend to precision.”
While Questions 9 and 17 of the fourth grade test raise serious concerns about the depth
of thought given to the user interface by the test makers, Question 13 makes one wonder
whether they have any knowledge of mathematics at all. It offers yet another way to input
whole numbers.
Fourth Grade Practice Test, Question 13
I dragged the protractor to the angle and saw that the angle was 45°. Easy enough. Then I
dragged two “numbers into the box” to show 45°.
Take a minute to appreciate what you see. Once used, a digit is no longer available for
use again. What if I had wanted to show 44°?
You’ll see my digits in the box—a 4 and a 5—somewhat misaligned. Apparently, my
juxtaposition of the 4 and the 5 was acceptable enough to the test interface that I could go
on to the next question when I finished. (No modal problem here.) Now the loaded
question: “Did I input 45?”
Critique of Smarter Balanced Common Core Tests for Mathematics, SR Education Associates 16 What possible mathematical purpose, conceptual insight, computational fluency, or
procedural skill is revealed by having students express an arbitrary whole number by
dragging digits from a finite supply of them into a fixed input field?
Conversely, how many unconstructive and even profoundly misleading ideas about basic
number concepts can you see this interface as encouraging? Shall we express our
numbers by arbitrarily dragging digits to the left and right of each other or above and
below one another? Shall we think about the structure of the set of numbers that are
expressible using no digit more than once? (Or maybe better still: shall we assume that
there is a mathematical prohibition against angle measurements with repeated digits?)
If fourth grade math is about anything, it’s about understanding place value. Even if the
test parsed my answer correctly, misalignment and all, this interface is so egregiously
“anti-place value” that it rises to the level of “anti-intellectual.” It is an insult to
mathematics teachers everywhere. Sadly, you’ll find variants of this “anti-place value”
interface sprinkled throughout the Smarter Balanced-CTB tests.
Third Grade Practice Test, Question 6
I would seriously question whether this problem is appropriate for third grade, but that
discussion is outside the scope of this critique. Question 6 of the third grade practice test
employs a simple drawing interface to input one’s answer. It is a drawing interface that
appears in a number of geometry questions across grade levels on both the practice tests
and the training tests. The interface has four tool buttons: Arrow (for dragging points but
not segments), Delete, Add Point, and Connect Line. Students are asked to use these tools
to “draw a rhombus that is also a rectangle.”
But wait, there are no lines in a rhombus—one draws a rhombus with segments. This is a
distinction all geometry curricula insist we respect! Polygon edges are segments. A Draw
Segment tool, a Use Straightedge tool, or a Draw with Ruler tool would all be appropriate
possible tools to construct a rhombus, but not a Connect Line tool. And just what is a
Connect Line tool anyway? If you think about it, what function does this name actually
describe? A user connects two things, not one. Is it a Connect Lines tool? A Connect a
Line to Something Else tool? In fact, it’s a Connect Two Points to Make a Line Segment
tool—with three-quarters of its name missing.
Critique of Smarter Balanced Common Core Tests for Mathematics, SR Education Associates 17 The tutorial for this tool helps us understand why this tool is messed up—apparently the
designers didn’t know the difference between a line and a segment themselves!
Am I being picky? Not according to Mathematical Practice 6: Attend to precision.23
Unfortunately, the misnamed tool is only the beginning of the issues with this
“Frankenstein” drawing interface assembled thoughtlessly and arbitrarily from body parts
of other drawing software programs. Some students will figure out how to use the
drawing interface because they are clever and adept at navigating clumsy software.
Students fed high doses of test prep specifically using this interface may fare OK when
they encounter it on a Common Core test. (I only hope they have something better to use
on every occasion when they are not test prepping!) But many students that try to use this
interface to answer a test question, especially if they get off track and want to revise a
drawing they have initially made, will be stumped and foiled by its lack of coherent
design. When I tried to delete a segment using the interface, for instance, I couldn’t do it.
By trial and error I discovered that you had to delete points to delete a segment or you
had to exactly line up crosshairs over a segment to get it to delete—hard to do on vertical
and horizontal segments, nearly impossible on diagonal segments.
On the silly keypad used for number input, the interface programmers gave us an Undo
button that no one will ever use. Here, where Undo would be very useful, there is no such
button. Did the programmers ever discuss among themselves what they were doing, or
were all of these interfaces programmed in isolation from each other? Never mind, I
know the answer.
The bottom line is this: many students who know the answer to this question will be
tripped up by this interface and get it wrong.
Interestingly, when I look all the way back to the first Smarter Balanced Showcase in
January 2012 where Measured Progress/ETS shared their design specifications, I can see
the origins of this geometric interface. Here is slide 62 of the PowerPoint for that
webinar24:
Critique of Smarter Balanced Common Core Tests for Mathematics, SR Education Associates 18 At the time, I had high hopes for this item genre. Dynamic geometry is a proven
technology. Unfortunately, the poor implementation of this powerful idea has dashed my
hopes for these tests.
Geometric tools are not the only poorly designed tools in these tests. The tests also make
frequent use of a poorly designed graphing interface. Here’s Question 12 from the
eleventh grade practice test. I placed the red points shown on the graph. There is no snapto behavior on this coordinate grid.
Eleventh Grade Practice Test, Question 12
In solving this problem, Question 12 of the eleventh grade test, a logical substitution to
try would be 0.09 for x, as this yields an exact solution of (0.09, 10) for the equation.
However, the x-axis uses a confusing representation to indicate “torn axes” as a way to
reduce the space between 0 and 0.25—even while not “tearing” the grid itself. Does this
mean that any solution with an x-value less than 0.25, such as (0.09, 10), is not
permissible? If so, why isn’t this region of the graph simply omitted? Assuming, as I
have above, that 0.09 is an acceptable x-value for a solution, where should the
approximate position of this x-value be shown? I have identified an easy-to-calculate
solution to the equation, but I am stymied by the representation of the interaction space.
Critique of Smarter Balanced Common Core Tests for Mathematics, SR Education Associates 19 What is the upper limit of permissible y-values allowed? Is it 10? Is it 11? Why is the
upper limit of y-values treated differently than the lower limit of x-values?
Why is the x-axis labeled in such an unorthodox way—with odd multiples of 0.05? Is it
to direct a student to guess that 0.25 is an easy x-value to try? Why not 0.1, 0.2, 0.3, etc.,
as is customary?
I assume the test makers would consider the approximate solution (0.64, 3.75) to be
correct. Is the approximate solution (0.81, 3.333…) shown above and allowed by the
interface also correct even though it falls outside the grid?
It would be nice if the coordinates of a point were displayed at the cursor. This would
help students place their solutions accurately without giving away answers.
The item asks for three solutions. Does that mean that an answer with four points will be
incorrect (as above with a non-solution point at (0.5, 8))?
The interface of Question 12 is modal. Until the user selects the Add Point button, it is
impossible to answer the question. And upon using the Delete button, it remains selected
and the user can only delete points. However, by selecting the Add Point button, not only
can the user add a point, but also move a point. Moving a point is highly useful to
complete the problem efficiently. Yet there is no clear indication as to how one moves a
point or even that dragging is permitted. The confusion caused by the modal interface
makes it difficult to demonstrate one’s answer. Had the test makers displayed three red
points to the side of the graph and asked students to drag the points to three places on the
graph that represent solutions to the equation (removing the Delete and Add Point
buttons), many of the interface issues could have been avoided. The interface would not
be modal and it would be clear that exactly three points are desired. With this change,
dragging points would be elevated to its proper place as a useful problem-solving
technique in dynamic mathematical representations.
Smarter Balanced Training Tests
In addition to the grade-specific practice tests, Smarter Balanced provides training tests
across several grade bands so that students can prep for the tests: grades 3 to 5, grades 6
to 8, and high school. There are fewer items represented on each of these training tests
than on the practice tests. Hoping that these tests would be significantly better in quality
than the practice tests, I reviewed all questions in each band.
Grades 3 to 5 Training Test, Question 4
Critique of Smarter Balanced Common Core Tests for Mathematics, SR Education Associates 20 The checkbox quagmire, again, but with a new spin. Isn’t the last column redundant?
Apparently it’s needed to tell the difference between a question that wasn’t answered and
one that was. Otherwise, if I left the 8 row blank because I forgot to fill it in, it might
count as a correct answer. Surely, there are less convoluted ways to see if kids know
multiples and factors of 6—like asking them for a couple.
Grades 3 to 5 Training Test, Question 7
Question 7 rolls a variety of problems seen earlier into one item:
• You use a Connect Line tool to draw segments;
• Once depressed, the Connect Line tool is in “line” mode and you can’t easily figure
out how to stop it from drawing “lines”;
• You pile digits in boxes to make base ten numbers; and
• To change an answer in a box you have to click on the Delete tool, enter delete mode,
and then click on the digit in the box you want to delete (you have to click separately
on both “2” and “0” to delete “20”), then go back to the Delete tool and click it again
to leave delete mode, and then drag a digit or two to the box to indicate your new
answer.
Unlike fourth grade Question 13 above, at least the test makers gave us an inexhaustible
supply of digits to use in this problem.
Grades 3 to 5 Training Test, Question 9
Critique of Smarter Balanced Common Core Tests for Mathematics, SR Education Associates 21 This question suffers from the same modal issues as Question 17 of the fourth grade test.
Same “Message Code: 10914” when you try to move on before finishing your last
answer.
Grades 6 to 8 Training Test, Question 5
I like this question and the interface worked well!
Grades 6 to 8 Training Test, Question 8
This question is mathematically unanswerable as written. One cannot calculate the height
of the prism without knowing the shape of the base. In order to calculate height as I
suspect the test makers wanted, the prism must be a “rectangular prism” to specify that
the prism has a rectangular base. If the prism is a rectangular prism, then the height is 8
½. But there is an additional issue introduced by the way test makers want students to
show their answer. If the answer above is what the makers wanted, because the height is
marked on an edge of the prism, the problem must further state that the prism is a “right
rectangular prism.” Additionally, there are no units on the height and an entirely different
scale is used. If the base is measured in inches, the height certainly is not. Attend to
precision (Mathematical Practice 6)!
Critique of Smarter Balanced Common Core Tests for Mathematics, SR Education Associates 22 High School Training Test, Question 1
Oh, no! The cars again. On the high school training test you’ll find that Smarter Balanced
recycled the tenth grade practice test questions because Smarter Balanced is no longer
supporting testing in tenth grade.
I urge you to go to the practice and training tests and examine other items on other tests.
The URL is www.smarterbalanced.org/practice-test. I assure you that you will find
similar issues in the majority of items. In fact, you’ll find them in virtually all of the
questions that are not the old multiple-choice type.
Smarter Balanced’s Promise to the Nation
Before going further, it is worth reviewing exactly what Smarter Balanced promised the
nation when they submitted their proposal to the Education Department:
The Consortium is deeply committed to ensuring that the intellectual integrity and full
rigor of the academic content standards are maintained throughout all forms of
assessments developed to serve this system….25
According to a January 2013 report from the National Center for Research on Evaluation,
Standards, & Student Testing (CRESST), On the Road to Assessing Deeper Learning:
The Status of Smarter Balanced and PARCC Assessment Consortia, Smarter Balanced
makes these claims for assessing “deeper learning”:
1. Concepts and Procedures: Students can explain and apply mathematical concepts and
interpret and carry out mathematical procedures with precision and fluency.
2. Problem Solving: Students can solve a range of complex well-posed problems in pure
and applied mathematics, making productive use of knowledge and problem solving
strategies.
3. Communicating Reasoning: Students can clearly and precisely construct viable
arguments to support their own reasoning and to critique the reasoning of others.
4. Modeling and Data Analysis: Students can analyze complex, real-world scenarios and
can construct and use mathematical models to interpret and solve problems. 26
The CRESST report came after the Measured Progress/ETS design guidelines were
Critique of Smarter Balanced Common Core Tests for Mathematics, SR Education Associates 23 released, but before anyone saw the actual test items developed by CTB. At that time,
CRESST researchers were optimistic: “…a review of the task specifications and public
release sample items suggest that Smarter Balanced performance tasks will be aligned
with important goals for deeper learning….”27
They also cautioned, “However, at this early stage of test development, key questions
remain about how well these intentions will be realized.” And later, “…while technologybased assessment offers many new opportunities, care will need to be taken that the
technology manipulation required by the assessment does not unintentionally add
construct-irrelevant barriers for some students, particularly those with less access and less
facility with technology.”28
Contrast these promises to the reality of the delivered tests.
Flaws in the Smarter Balanced Test Items
What happened? Despite elaborate evidence-centered design frameworks29 touted by
Smarter Balanced as our assurance that their tests would measure up, the implementation
of the tests is egregiously flawed. I wish I could say the flaws in the Smarter Balanced
tests are isolated. Unfortunately, they are not. While the shortcomings are omnipresent
and varied, they fall into categories, all illustrated multiple times by the examples in this
critique:
• Poorly worded and ambiguous mathematical language and non-mathematical
instructions;
• Incorrect and unconventional mathematical graphical representations;
• Inconsistent mathematical representations and user interfaces from problem to
problem;
• Shoddy and illogical user interface design, especially with respect to the dynamic
aspects of the mathematical representations;
• Consistent violations and lack of attention to the Common Core State Standards;
• Failure to take advantage of available technologies in problem design.
The result? Untold numbers of students and teachers in 17 Smarter Balanced states will
be traumatized, stigmatized and unfairly penalized. And the quagmire of poor
technological design, poor interaction design, and poor mathematics will hopelessly
cloud the insights the tests might have given us into students’ understanding of
mathematics.
Technology-enhanced items could have made use of widely ratified and highly developed
technologies (e.g., graphing calculators, dynamic geometry and data analysis tools) to
engage students in substantive tasks. Instead, these tests rely on a small number of
pedestrian and illogical interface “widgets”(arrays of checkboxes, crude drawing tools,
graphical keypad, a drag-and-drop digit pilers, etc.) that the test item writers used via
question templates. The widgets often provide window dressing for multiple-choice
questions. Spending $330 million of federal spending could have funded real
innovation—or at least deployment of the best technologies available for these tests. The
public at large—students, parents, educators, policy makers—who see these poor and
dated uses of technology may incorrectly conclude that technology can not significantly
improve mathematics instruction. These tests give educational technology a bad name.
Critique of Smarter Balanced Common Core Tests for Mathematics, SR Education Associates 24 Soon after I circulated the first version of this critique, Elizabeth Willoughby, a fifth
grade teacher in Clinton Township, MI, sent me the following note:
After reading your piece covering the flaws you found on the Smarter Balanced
assessment, I had to reach out and thank you. I teach fifth grade. I put my students
on the math test, made a video and sent it to Smarter Balanced. My students are on
computers almost every day—they are tech savvy. The video is worth a watch:
https://www.youtube.com/watch?v=UZgb46Jm4Oo.
I watched Ms. Willoughby’s video. You should, too. Her “tech savvy” kids are as
confused by the test interface as I was. The video vividly demonstrates that even these
very capable students will get stuck on the Smarter Balanced tests as a result of the
shoddy interface.
Ms. Willoughby also shared with me her email exchange with the Smarter Balanced Help
Desk on the subject of her students’ problems. The email below is part of this exchange
and occurred in March 2014:
…Reading below, you will see my students took the practice test and had many issues
with the student interface. Smarter Balanced, in reply, sent me a series of confusing
emails filled with half-information regarding access to TIDE and field tests which
supposedly has updated tests with cleaner, easier to operate user interface tools…
I would greatly appreciate an answer to a simple question:
Your email below acknowledges the issues with the student interface tools found
on the practice tests. Your email also indicates you found the same issues in the
recent field test. Your email below clearly indicates you will make changes to the
practice test to address these issues…Can I get a general timeline as to when the
update to the practice test will occur and will the practice test reflect all of the
student interface skills students will need to perform tasks on the actual test? As
these skills are unique to your assessment (not found in other programs, apps,
etc.), your practice test needs to provide those practice opportunities.
I don't mean to press, however, these ARE high stakes tests. I need to be prepared
and I need to prepare my students for success on these tests, which includes providing
them with the ability to use the assessment with success.
Thanks, Elizabeth L. Willoughby
Ms. Willoughby received no satisfactory reply. Despite vague assurances the iterative
rounds of field tests would address her students’ frustrations with the interface, we see
that nothing has improved by the launch of the actual tests.
CTB created nearly 10,000 test items for Smarter Balanced30. If half of these are for
mathematics, there are almost 5,000 items already deposited in the mathematics item
bank. Bad items will surface on tests for years to come.
Liana Heitin, in a September 23, 2014, article in Education Week, “Will Common-Core
Testing Platforms Impede Math Tasks?” wrote:
Some experts contend that forcing students to write a solution doesn’t match the
expectations of the common-core math standards, which ask students to model
mathematics using diagrams, graphs, and flowcharts, among other means.
“It’s not like, during the year in classrooms, these kids are solving these problems on
the computer,” said David Foster, the executive director of the Morgan Hill, Calif.Critique of Smarter Balanced Common Core Tests for Mathematics, SR Education Associates 25 based Silicon Valley Mathematics Initiative, which provides professional
development for math teachers, creates assessments, and has worked with both
consortia. “It’s such an artificial idea that now it’s test time, so you have to solve
these problems on computers.”
Mr. Foster, who has authored problems for the new Common Core tests, goes on in the
article to say:
“I’m a mathematician, and I never solve problems by merely sitting at the keyboard. I
have to take out paper and pencil and sketch and doodle and tinker around and draw
charts,” he said. “Of course, I use spreadsheets all the time, but I don’t even start a
spreadsheet until I know what I want to put in the cells.
“All Smarter Balanced and PARCC are going to look at is the final explanation that
is written down,” he said, “and if there’s a flaw in the logic, there’s no way to award
kids for the work they really did and thought about.”
Mr. Foster added: “I’ve played with the platform, and it makes me sick. And I’ve
done it with problems I’ve written.”
Further along we hear the same sentiment from another expert:
But, as James W. Pellegrino, a professor of education at the University of IllinoisChicago who serves on the technical-advisory committees of both consortia, points
out, students can solve a single problem in any number of ways, not all of which are
easy to explain in words.
“The worry is [the platform] narrows the scope of what students can do, and the
evidence they can provide about what they understand,” he said. “That leads to
questions about the validity of the inferences you can make about whether students
really developed the knowledge and skills that are part of the common core.”31
In a post to the Illinois Council of Teachers of Mathematics listserv in July 2014, Martin
Gartzman, Executive Director of the Center for Elementary Mathematics and Science
Education at the University of Chicago, took specific aim at the shortcomings of the
PARCC tests, but also stated that his criticisms applied equally to Smarter Balanced:
I understand that creating a large-scale assessment, such as the PARCC assessment,
is an incredibly complex task that involves many decisions and many compromises.
However, I assert that we are being far too generous about PARCC’s decision
regarding the ways that students can enter their responses to open-response, handscored items. By accepting that decision, we are essentially endorsing an assessment
system that, by design, does not give students a fair shot at showing what they know
about mathematics, and that we know will underrepresent what Illinois students
understand about the mathematics addressed in the CCSS-M.
This is not an issue of students needing to get used to the PARCC formats. The
problem is that the test format itself is mathematically inadequate. The extensive
PARCC field test definitively affirmed that the limited tools available to students
(keyboard and equation editor) for entering their responses made it extremely
difficult for many students to demonstrate what they knew about the CCSS-M content
and practices.
While the experts cited here are highly critical, I think the actual situation with the new
tests is even more disastrous than they describe. The tests suffer from the problems they
Critique of Smarter Balanced Common Core Tests for Mathematics, SR Education Associates 26 describe and the issues go far beyond the limitations imposed by computer keyboards and
equation editors. The appalling craft displayed in these tests compounds the problems
that even well-conceived computer-based mathematics tests would have to overcome to
effectively assess students.
In July 2012, Measured Progress, a contractor to Smarter Balanced, warned in Smarter
Balanced Quality Assurance Approach Recommendation for the Smarter Balanced
Assessment Consortium:
In this industry and with a system of this highly visible nature, the effects of software
that has not been sufficiently tested can lead to an array of problems during a test
administration that can be financially and politically expensive.32
Interestingly, my online review of the Smarter Balanced proposals and contract
documents finds little evidence of attention to quality assurance at the level of “widget”
or item development. There are vague statements about item review processes, but few
specifics. There is a tacit assumption that the companies that develop high-stakes tests
know how to develop mathematical test items and will do it well and that they are
capable of performing their own quality assurance. Those of us in the education industry
know better.
Unfortunately, the Smarter Balanced tests are lemons. They fail to meet acceptable
standards of quality and performance, especially with respect to their technologyenhanced items. They should be withdrawn from the market before they precipitate a
national catastrophe.
We know, however, that this won’t happen. Test season has already started.
Kids Deserve Better
Struggling students will likely be penalized more than proficient students on the Smarter
Balanced tests as the cognitive load of grappling with poorly designed interfaces and
interactive elements will raise already high levels of test anxiety to even more distracting
levels. Those who attempt to mine the test results for educational insight—teachers,
administrators, parents, researchers, policy makers—will be unable to discern the extent
to which poor results are a reflection of students’ misunderstandings or a reflection of
students’ inability to express themselves due to difficulties using a computer keyboard or
navigating poorly constructed questions and inadequate interactive design.
Time spent prepping for these tests using the practice and training tests and learning how
to use the arcane test tools like the “Equation Response Editor tool” is educational time
squandered. Many schools have scheduled inordinate numbers of days just for this test
prep, but using the tools offered by Smarter Balanced will lead to none of the educational
outcomes promised to support CCSSM. These tools are not learning tools that lead to
mathematical insight, they’re highly contrived force-a-square-peg-into-a-round-hole testspecific tools.
If widespread testing is going to be a reality in schools, and if schools are going to deploy
scarce resources to support computer-based tests, then it is essential that tests
successfully assess students and contribute more generally to the improvement of the
quality of education. There is no good reason for the tests to be this bad. The past forty
years of extraordinary progress in research-directed development of mathematics
visualization and technology for expressing mathematical reasoning could be put to use
Critique of Smarter Balanced Common Core Tests for Mathematics, SR Education Associates 27 to power these tests—elegantly and effectively. As an example of computer-based
assessment pursuing a vastly higher quality standard than that achieved by Smarter
Balanced and CTB, look at the December 15, 2014, and January 5, 12, and 19, 2015, blog
posts at Sine of the Times: http://blog.keycurriculum.com. These posts describe work we
did some years ago at KCP Technologies and Key Curriculum Press. Others in the
mathematics education community—researchers and practitioners—know how to do
quality work.
“Déjà Vu All Over Again”
The results of the Smarter Balanced tests for 2014–2015, when they come, will further
confuse the national debate about Common Core and contribute significantly to its
demise. Because the general public has no reason to believe that these results do not
accurately reflect mathematics education in this country, they will not realize that the
poor performance of students on these tests is due, in significant part, to the poor craft of
the test makers. When poor results make headlines, will anyone point the finger in the
direction of the test makers? Likely not.33 Students and frontline educators at all levels
will be attacked as incompetent—but the incompetent test makers will get a free pass.
I’ve seen this before. Twenty-five years ago, Creative Publications, a California
publisher, developed MathLand, an innovative elementary mathematics program. These
materials were rated as “promising” by a U.S. Education Department panel. But Creative
Publications had rushed the materials to market for the 1992 state of California adoption
and MathLand was not ready for “prime time.” However “promising,” it was poorly
crafted—ideas were not fully developed, there had been little or no field-testing, little
revision of the original manuscript, and there had been no application of the iterative
principles of product engineering. Even so, a majority of California school districts
adopted MathLand. Why? Because it was a promising idea and the craft issues with
MathLand were invisible to an untrained eye. And there was no pilot period during which
schools and districts could properly vet the materials within the California adoption
timeline and reject them if they proved lacking. Whatever one’s position on the
underlying educational principles of MathLand, the materials did not work well in
classrooms—but no one found this out this until too late. Completely lost in the public
uproar over MathLand was the distinction between good ideas and poor craft. As soon as
they were able, California districts abandoned MathLand. Creative Publications
disappeared. In California, the MathLand fiasco discredited California’s 1992
Mathematics Framework and significantly contributed to the launch of the national
“Math Wars.” It has taken 20 years to undo the damage these poorly crafted materials did
to our mathematics education community.
The Common Core State Standards for Mathematics and the high-stakes tests under
development by Smarter Balanced and PARCC are not one and the same. However, in
the public eye, and particularly in the crosshairs of Common Core political opponents,
Common Core and the Smarter Balanced/PARCC high-stakes tests funded by the federal
government are two sides of the same coin. As Diane Briars, National Council of
Teachers of Mathematics (NCTM) President, pointed out in “Core Truths,” a July 2014
“President’s Corner” message: “Particularly problematic is a tendency to equate CCSSM
with testing and with test-related activities and practices.”34
While certainly not perfect, the Common Core State Standards for Mathematics are a step
forward, especially because of the prominence of the Standards for Mathematical
Critique of Smarter Balanced Common Core Tests for Mathematics, SR Education Associates 28 Practice. I believe that CCSSM should continue to receive full support and that it should
evolve and improve based on the experiences of practicing teachers, mathematics
professionals, mathematics educators, parents, students, and a wide range of other
stakeholders. In high-performing countries like Singapore and South Korea, national
curricula are revised and improved on a regular schedule. South Korea, for instance, has
revised its national curricula once every 5 to 7 years and is now using the 7th iteration of
the curriculum.35 However, the appalling Smarter Balanced high-stakes tests could well
be the death of the national effort to improve mathematics instruction via Common
Core—before we ever get to iteration 2. That would be tragic.
I don’t think I’m alarmist. In a September 14, 2013, article in the Atlanta JournalConstitution, titled “Errors plague testing in public schools: Consequences for students
can be dire,” Heather Vogell pointed out:
Quality-control breakdowns have become near commonplace on the state tests taken
in public schools across the country, The Atlanta Journal-Constitution found. Faulty
tests undermine reforms seeking to rescue American schools and risk harming them
instead.36
Ironically, while poor results on the Common Core tests will be a blow to policy makers,
parents, educators, and students, they will be a boon to those in education for a profit.
I’ve been in the business for decades as an educational publisher. For many companies,
including the large ones, there is no business like the “failure business.” Failure
precipitates large-scale crises. National politicians, governors, and state legislatures
demand immediate action to address crises. In desperation, school officials look for quick
solutions. They loosen purse strings in states and districts. And quick-solution vendors
spring into action, throw together products, and make money from their “solutions.”
The same testing companies that delivered these failed tests will win new contracts to
deliver “better” tests to states forced to abandon the current ones. Next year you’ll see a
host of new “Common Core” branded intervention and test prep programs pitched as
solutions to a problem caused, in part, by the same companies who will be pitching the
solutions. The large education companies with both testing and curriculum divisions
make money on both ends.
What Can We Do?
The national testing train is hurtling down the tracks out of control. Fueled by lucrative
contracts with testing companies, often driven by people with insufficient understanding
of the educational and social consequences of their actions, and racing to reach a
destination in too little time, the train will crash very soon.
What can one do? The boldest choice, and in some real sense, the most principled one,
would be to jump off.
If I were a state administrator responsible for state testing, a superintendent, a school
board member, a teacher, a parent, or even a student old enough to make my own
decisions about my education, I would seriously consider not participating in the coming
round of high-stakes national testing—the tests will do too much damage on too many
levels to students, teachers, and champions of education. I salute those who have taken
courageous stands to opt-out of the new rounds of testing. Flawed tests cannot be fixed in
the time before they’ll be administered. And in the current political climate, there will not
be funding available for those who could fix them to actually fix them.
Critique of Smarter Balanced Common Core Tests for Mathematics, SR Education Associates 29 I recognize that a stand to resist the tests has many consequences, some severe in the
short run. But anyone who takes this stand now will be exonerated in the long run. It is
the moral and practical thing to do. Next year a stand taken against the tests today will
look prescient.
I also recognize that most people with a stake in education aren’t inclined or aren’t in a
position to become “conscientious objectors” and opt-out of participating in the coming
tests. What can we do?
Since I wrote the first version of this critique, the California Board of Education decided
to suspend its Academic Performance Index for the 2014-2015 school year, according to
Christine Armario of the Associated Press, in order “to give teachers and students time to
adjust to standardized tests aligned with the Common Core standards.”37 That action is a
useful start to a process that must be much more ambitious if we want to put the
assessment train back on the tracks. Students and teachers do need time to adjust to the
higher expectations embodied in Common Core. But equally important, and not
addressed in the California Board action, states need several more years, at least, to
develop assessment systems worthy of the efforts that the teaching community is making
to improve instruction. Until then, “accountability” ought to go on hold.
While I have looked in detail at the Smarter Balanced mathematics tests, many
responsible educators cited above and elsewhere have called into question the efficacy of
other high-stakes Common Core-aligned tests.38,39 All states should take a “time out” to
apply careful analysis to their high-stakes tests, including both the Smarter Balanced and
PARCC tests, and question whether the new crop of tests will drive the improvements in
educational outcomes they seek. Our educational professional organizations should
participate in this analysis. The analysis should be complete and transparent.
We can mitigate the damage done by flawed tests by protecting students from days,
weeks, even months of test prep for these tests. Based on the evidence Smarter Balance
has given us, practice on their tools will not lead to better teaching or learning. In fact it
will “dumb down” instruction.
We can urge schools and school boards to ignore the results of contrived and fatally
flawed high-stakes tests like the Smarter Balanced tests—they do not measure
mathematical understanding.
We can make sure that those responsible for flawed assessments—the state testing
consortia and the testing companies they hired—fix the problems they have created. At
the same time, the nation and our states must realize that outsourcing educational
assessment to for-profit companies is not in the long-term public interest and will
inevitably lead to low-quality systems out of sync with national priorities. In most
countries, educational assessment systems are developed and maintained by well-funded
national government agencies, accountable to the public, who draw upon the expertise of
leading educators and professional bodies, not people hired anonymously on a percontract basis to write test items.
We can support and defend the teachers and educational professionals who have done all
they can to improve mathematics education in countless ways, but who will unfairly take
the fall for poor test results.
Critique of Smarter Balanced Common Core Tests for Mathematics, SR Education Associates 30 We can work to uncouple the Common Core effort from poorly crafted tests and try to
save the potential of CCSSM when politicians attack Common Core because of poor test
results.
We can seek help from our professional teaching organizations like NCTM and the
National Council of Supervisors of Mathematics (NCSM) to apply the organized
collective wisdom of educational practitioners and mathematics education leaders to the
task of accurately measuring student progress in attaining higher outcomes in
mathematics. Those closest to classrooms and children are best able to see what works
and doesn’t in mathematics education. Our professional bodies represent the best thinking
in our field.
We can continue to research and develop well-crafted digital tools for mathematics
education and work to deploy them in realistic time frames and in appropriate contexts.
We can demand the education funding necessary for teaching and assessing in this
country in ways worthy of our students. The promise of cheaper but deeper assessments40
was a false promise from the start.
We need to back off the high-stakes testing craze that is destroying public education.
Mathematics can be interesting and engaging. But the steady diet of boring test prep faux
mathematics that we are force-feeding kids in our classrooms is robbing them of the
opportunity to learn and teaching them to dislike a beautiful subject. And at the same
time it is driving veteran teachers into retirement and discouraging bright young people
from pursuing careers in education.
Maybe we can even make great assessments some day.
About Steven Rasmussen
Steven Rasmussen is an educational consultant at SR Education Associates. He was co-founder,
publisher and president at Key Curriculum Press, a mathematics curriculum
publishing company. As president of KCP Technologies, an educational software
research and development company, he led teams that specialized in the
development of dynamic digital tools for mathematics classrooms. These
mathematics technologies have been adopted for state and national use—for both
teaching and testing—by ministries of education in high-performing countries such
as Canada, Singapore, and China.
Steve serves as an advisor and board member to various non-profit and for-profit organizations
working in mathematics education. Steve has worked with ministries of education in numerous
countries, especially in Asia, and has spoken frequently at international and national education
conferences.
Please send comments to [email protected].
Critique of Smarter Balanced Common Core Tests for Mathematics, SR Education Associates 31 A Mathematical Aside: Looking at Question 5 from the Perspective of Calculus
If one steps back from the specifics of Question 5 and thinks more generally about the
mathematics modeled by the problem and its answer space, in particular, looking at it
from the perspective of calculus, one can’t help being deeply concerned about it. The
problem asks a question about a population that is represented by an area under a curve to
the left of a movable vertical line. The curve, in this case, represents a normal distribution
of the population. The area to the left of the line is an area-under-the-curve-left-of-theline function with the x-value of the line as its independent variable. The range of this
function is 0% to 100%. Depending on the value of this variable, as one moves in a small
region around a particular point on the x-axis, the area function may be changing rapidly
or barely changing at all. It may be changing at a relatively constant rate or changing at a
varying rate. The bell curve is the rate of change of the function.
But the snap-to number line forces discrete and evenly spaced jumps on the x-axis (each
jump equal to one inch of height) and forces us to seek an answer based on these jumps
as if the function were varying at a constant rate over the entire domain. Across the
domain of the function, a jump to an integer value of x may cause the output of the area
function to change a lot—or barely at all—depending on the height of the bell curve at
that point. At the points on the curve where the value is high, more accuracy is needed to
predict specific outcomes because more change in area is taking place. Had the question
asked for the place where approximately 1% of the women were shorter and 99% taller,
there would many good answers to the question. In fact, if the number line extended all
the way to zero, one could hop along the number line from integer to integer, starting at 0
and going all the way to 56, hardly changing the population left of the line, and keeping
the population “approximately” 1%.
The test makers, by luck or by design, chose a value of the function (25%) where the
normal distribution curve is nearly an integer and where the relatively straight bell curve
allows accurate extrapolation of values, even though the area function is changing
relatively quickly. Area functions defined by a normal distribution curve are fairly tame
in their behavior. However, other area functions (i.e., definite integrals) based on other
curves (i.e., functions) can be less well behaved. A small change in the value of the input
to the function may cause the output to race to infinity, or go suddenly to zero—or both.
From the point of view of statistics education, Question 5 is a very poor question. From a
more general mathematics perspective, it sacrifices good mathematical thinking and
problem solving in the interest of concocting a test question with an integer as an answer.
It encourages students to guess at ways to come up with their answers that have no
applicability in more general cases. It is misleading, misguided, and, like so many others
on these tests, fatally flawed.
Critique of Smarter Balanced Common Core Tests for Mathematics, SR Education Associates 32 Notes
1
U.S. Department of Education, Press release, “U.S. Secretary of Education Duncan Announces Winners
of Competition to Improve Student Assessment,” September 2, 2010. http://www.ed.gov/news/pressreleases/us-secretary-education-duncan-announces-winners-competition-improve-student-assessments
2
Smarter Balanced, Press release, “31-State Consortium Awarded RTTT Assessment Grant.”
http://www.smarterbalanced.org/news/31-state-consortium-awarded-rttt-assessment-grant
3
Washington State on Behalf of the Smarter Balanced Assessment Consortium, Proposal to the U.S.
Education Dept., Education Week website, “Race to the Top Assessment Program Application for New
Grants: Comprehensive Assessment Systems,” June 23, 2010, p. 37.
http://www.edweek.org/media/sbac_final_narrative_20100620_4pm.pdf
4
Sean Cavanaugh, “Common-Core Contracts Favor Big Vendors,” Education Week, Sept. 30, 2014.
http://www.edweek.org/ew/articles/2014/10/01/06contract.h34.html
5
CTB/McGraw-Hill, Press release, “Smarter Balanced Assessment Consortium Selects CTB/McGraw-Hill
to Develop Next Generation of Assessments to Help Schools Meet New Common Core State Standards,”
April 16, 2012.
http://www.ctb.com/ctb.com/control/aboutUsNewsShowAction?newsId=45443&p=aboutUs
6
Smarter Balanced, Website. http://www.smarterbalanced.org/field-test/
7
Nancy Doorey, Smarter Balanced website, “Smarter Balanced ‘Test of the Test’ Successful: Field Test
Provides Clear Path Forward,” October 2014, p. 11. http://www.smarterbalanced.org/wordpress/wpcontent/uploads/2014/10/SmarterBalanced_FieldTest_Report.pdf
8
Christina Samuels, “Smarter Balanced Field-Test Data Show Large Score Gap Among Students With
IEPs,” Education Week, January 2, 2015.
http://blogs.edweek.org/edweek/speced/2015/01/smarter_balanced_field_test_da.html
9
Smarter Balanced, Website. http://sbac.portal.airast.org/practice-test
10
Smarter Balanced, Website. http://www.smarterbalanced.org/practice-test
11
Common Core State Standards Initiative, Website. http://www.corestandards.org/Math/Practice/ CCSS.Math.Practice.MP6
12
Common Core State Standards Initiative, Website. http://www.corestandards.org/Math/Practice/ CCSS.Math.Practice.MP4
13
Common Core State Standards Initiative, Website. http://www.corestandards.org/Math/Practice/ CCSS.Math.Practice.MP2
14
Measured Progress/ETS Collaborative, Smarter Balanced website, “Smarter Balanced Assessment
Consortium: Technology-Enhanced Items Guidelines,” April 16, 2012, p. 9.
http://www.smarterbalanced.org/wordpress/wpcontent/uploads/2012/05/TaskItemSpecifications/TechnologyEnhancedItems/TechnologyEnhancedItemGui
delines.pdf
15
Ibid. p. 7.
16
Ibid. p. 7.
17
Washington State on Behalf of the Smarter Balanced Assessment Consortium, Proposal to the U.S.
Education Dept., Education Week website, “Race to the Top Assessment Program Application for New
Grants: Comprehensive Assessment Systems,” June 23, 2010, p. 84.
http://www.edweek.org/media/sbac_final_narrative_20100620_4pm.pdf
18
Common Core State Standards Initiative, Website. http://www.corestandards.org/Math/Practice/ CCSS.Math.Practice.MP2
19
U.S. Dept. of Health and Human Services, Centers for Disease Control and Prevention, “Anthropometric
Reference Data for Children and Adults: United States, 2007–2010,” Vital and Health Statistics, Series 11,
No. 252, October 2012, p. 14. http://www.cdc.gov/nchs/data/series/sr_11/sr11_252.pdf
20
Common Core State Standards Initiative, Website. http://www.corestandards.org/Math/Content/HSS/ID/
- CCSS.Math.Content.HSS.ID.A.4
21
Common Core State Standards Initiative, Website. http://www.corestandards.org/Math/Practice/ CCSS.Math.Practice.MP5
Critique of Smarter Balanced Common Core Tests for Mathematics, SR Education Associates 33 22
Apple Computer, Inc., Macintosh Human Interface Guidelines, Addison-Wesley Publishing Company,
1995, p. 36. https://hec.unil.ch/docs/files/53/322/macintosh_guidelines.pdf
23
Common Core State Standards Initiative, Website. http://www.corestandards.org/Math/Practice/ CCSS.Math.Practice.MP6
24
Smarter Balanced, Website, “SBAC 04 Showcase 1 Vendor Update,” January 6, 2012, p. 62.
http://www.smarterbalanced.org/wordpress/wp-content/uploads/2012/02/SBAC-04 Showcase 1 Vendor
Update.pdf
25
Washington State on Behalf of the Smarter Balanced Assessment Consortium, Proposal to the U.S.
Education Dept., Education Week website, “Race to the Top Assessment Program Application for New
Grants: Comprehensive Assessment Systems,” June 23, 2010, p. 47.
http://www.edweek.org/media/sbac_final_narrative_20100620_4pm.pdf
26
Joan Herman & Robert Linn, “CRESTT Report 823: On the Road to Assessing Deeper Learning: The
Status of Smarter Balanced and PARCC Assessment Consortia,” National Center for Research on
Evaluation, Standards, & Student Testing (CRESST), University of Calif., Los Angeles, January 2013, p. 8.
http://www.cse.ucla.edu/downloads/files/CRESSTReport823.pdf
27
Ibid. p. 4.
28
Ibid., p. 19.
29
Ibid., p. 6.
30
CTB/McGraw-Hill, Press release, “Smarter Balanced Assessment Consortium Selects CTB/McGrawHill to Develop Next Generation of Assessments to Help Schools Meet New Common Core State
Standards,” April 16, 2012.
http://www.ctb.com/ctb.com/control/aboutUsNewsShowAction?newsId=45443&p=aboutUs
31
Liana Heitin, “Will Common Core Math Tasks Impede Math Tasks?,” Education Week, Sept. 23, 2014.
http://www.edweek.org/ew/articles/2014/09/24/05math.h34.html?cmp=ENL-EU-NEWS1
32
Measured Progress, SmarterApp.org website, Smarter Balanced Quality Assurance Approach
Recommendation for the Smarter Balanced Assessment Consortium, July 20, 2012, p. 2.
http://www.smarterapp.org/documents/Draft-Quality-Assurance-Approach.pdf
33
Andrew Ujifuse, “States Prepare Public for Common-Core Test Results,” Education Week, March 17,
2015.. http://www.edweek.org/ew/articles/2015/03/18/states-prepare-public-for-common-core-testresults.html
34
Diane Briars, National Council of Teachers of Mathematics website, “Core Truths,” July 2014.
http://www.nctm.org/News-and-Calendar/Messages-from-the-President/Core-Truths/
35
Hee-chan Lew, “Some Characteristics of the Korean National Curriculum,”Mathematics Curriculum in
Pacific Rim Countries—China, Japan, Korea, and Singapore , Zalman Usiskin, Edwin Willmore, eds.,
Center for the Study of Mathematics Curriculum, 2008. p. 63.
36
Heather Vogell, “Errors plague testing in public schools: Consequences for students can be dire” The
Atlanta Journal-Constitution, Sept. 14, 2013. http://www.myajc.com/news/news/errors-plague-testing-inpublic-schools/nZwmw/
37 Christine Armario, “California Gives Extra Year to Adjust to Common Core Tests,” Associated Press,
March 12, 2015.
http://hosted.ap.org/dynamic/stories/U/US_SCHOOL_BOARD_TESTS?SITE=AP&SECTION=HOME&T
EMPLATE=DEFAULT 38
Grant Wiggins, “A dissection of Common Core math test questions leaves educator ‘appalled,’”
Washington Post, November 30, 2014. http://www.washingtonpost.com/blogs/answersheet/wp/2014/11/30/a-dissection-of-common-core-math-test-questions-leaves-educator-appalled/
39
Estzar Harrgitai, “The Wrong Test, Inside Higher Education, March 20, 2015.
https://www.insidehighered.com/views/2015/03/20/essay-flaws-parcc-tests
40
Washington State on Behalf of the Smarter Balanced Assessment Consortium, Proposal to the U.S.
Education Dept., Education Week website, “Race to the Top Assessment Program Application for New
Grants: Comprehensive Assessment Systems,” June 23, 2010, p. 144.
http://www.edweek.org/media/sbac_final_narrative_20100620_4pm.pdf
Critique of Smarter Balanced Common Core Tests for Mathematics, SR Education Associates 34


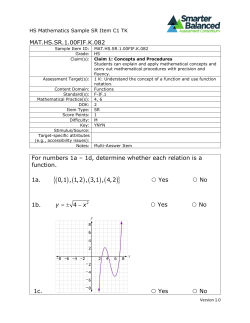


© Copyright 2026