
An Analysis on Borrowing Behavior of Rural Households in
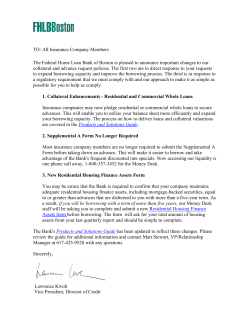
An Analysis on Borrowing Behavior of Rural Households in Vientiane Municipality: Case Study of Four Villages Chansathith Chaleunsinh,* Ohno Akihiko,** Fujita Koichi,*** and Mieno Fumiharu*** Since the late 1990s the savings groups have been introduced in the villages of Laos. This movement has offered new borrowing opportunities for the rural people. Based on household survey using a structured questionnaire in four study villages (N=684) in Vientiane Municipality during 2007–08 we analyzed the role and performance of the savings group in rural financial markets, especially focusing on who borrows, from which sources, and for what purposes by comparing the savings group with informal and formal lenders. Two major findings are as follows. First, three types of lenders (savings groups, formal and informal lenders) have their own particular features, and thereby loan purposes differ significantly. Formal banks offer loans exclusively for production purposes, while informal lenders do for coping with emergencies. Savings groups fall between them. Second, though poor households are reluctant to be a savings group member, once they participate in they actively obtain loans from it. In contrast, though rich households actively participate in the group, they obtain loans less from it. Group members claim that the primary purpose of joining the savings group is to cope with emergencies. When the members obtain loans from the savings group, however, nearly 40% of the loans are used for production purposes, mainly in agriculture. There exists a change between saving purposes and borrowing ones. It is assumed that in villages with the higher loan credit for production purposes, the savings groups show favorable performance, and thus a rapid growth. Keywords: Laos, savings groups, credit demand, precipitation incentive, household behavior * ຈ ັນສະຖິດ ຈະເລີນສິນ, National Economic Research Institute, 5th Floor, New MPI Building, Souphanouvong Avenue, Vientiane Capital 01001, Lao PDR Corresponding Author’s e-mail: [email protected] ** 大野昭彦, School of International Politics, Economic and Communication, Aoyama Gakuin University, 4-4-25 Shibuya Shibuya-ku, Tokyo 150-8366, Japan *** 藤田幸一; 三重野文晴, Center for Southeast Asian Studies, Kyoto University, 46 Shimoadachi-cho, Yoshida Sakyo-ku, Kyoto 606-8501, Japan Southeast Asian Studies, Vol. 3, Supplementary Issue, March 2015, pp. 113–133 © Center for Southeast Asian Studies, Kyoto University 113 114 Chansathith Chaleunsinh et al. I Introduction Since the late 1990s the savings groups (hereafter SG) have been introduced in the rural areas of Laos (Coleman and Wynne 2006), starting from the villages in Vientiane Municipality. In Laos rural people find it difficult to access formal financial markets. Though the Agricultural Promotion Bank (APB) is almost a sole formal financial institution for rural people, its branch network is poorly established. Thus, rural people rely on informal lenders such as relatives, friends, moneylenders, and so forth for loans. By the time of our survey the SG has been established in almost all the villages in Vientiane Municipality. Thus, the SG turns out a vital lender for rural people. Some important questions arise as to who participate in the SG, who actually borrow, and for what purposes they borrow. In addition, we need to examine who participate in the SG and if the group substitutes for formal and informal lenders. The emergence of SGs is a recent phenomenon (Ledgerwood 1999; Robinson 2001). The financial system has several forms of cooperative financial institutions called as credit unions, savings and loan cooperatives, village banks, self-help groups, and so forth. SGs are community-based credit and savings association established to provide access to savings and loan services in rural areas. However, only few research attempts have so far been made at SGs in developing countries (Gingrich 2004; Papias and Ganesan 2009; Cheruiyot et al. 2012). Furthermore, these studies do not explore the above research questions. In order to examine such a series of questions, we selected four villages in Vientiane Municipality and conducted a detailed household-level survey in 2007–08 using a structured questionnaire (N=684). The Vientiane plain that covers Vientiane Municipality is a major rice producing area in Laos. In the Plain there exist two types of village, rice producing villages and villages engaging in rural non-farm activities, of which most wellknown is hand-weaving cottage industry. Thus, we selected two agriculturally advanced villages especially in rice cultivation (paddy villages) and two villages with active handweaving cottage industry (hand-weaving villages) to explore how different village characteristics affect the role and performance of the three rural lenders: SGs, formal banks, and informal lenders. The remaining part of this paper is organized as follows. In section 2, we present basic characteristics of the study villages and of 684 surveyed households. The households are classified into three economic classes; poor, middle, and rich, based on the holdings of major consumer durables and the amount of gold held. In section 3, we proceed to analyze the performance of the SGs and other rural financial markets in the villages. Section 4 discusses who borrow from which sources, and for what purposes. An Analysis on Borrowing Behavior of Rural Households in Vientiane Municipality 115 In addition, we examine who participate in an SG. Finally, in section 5 we conclude. II Characteristics of the Study Villages and Households The locations of our study villages (ban) are shown in Fig. 1 with traveling hours by motorcycle from the center of Vientiane city. As road condition to Thanasa and Natan is not favorable, vehicles take more time to reach the villages in the rainy season. The two paddy villages (Thanasa and Don Neua), located along the Mekong River, are agriculturally advanced, especially in rice production. In contrast, other two weaving villages (Natan and Phon Ngam) are agriculturally backward, whereas the hand-weaving cottage industry is thriving. The history of Don Neua dates back to the early seventeenth century. Phon Ngam was established only in 1969 by the migrants (Tai-dam ethnic) from Xieng Khuang Province. The other two villages have roughly 100 years of history. Natan started in 1917 when people (Tai-puan ethnic) migrated from Xam Neua Province due to inter-ethnic conflicts. Thanasa started from 15 households more than 100 years ago when people (Tai-puan ethnic) migrated from somewhere between the two provinces of Xieng Khuang and Vientiane. In 2007 and 2008, by using a semi-structured questionnaire we conducted a household census survey in these villages (N=684), although a few households could not be Fig. 1 Location of the Study Villages Source: The National Geographic Department (NGD). 116 Chansathith Chaleunsinh et al. covered for various reasons. Table 1 demonstrates the basic structure of income earnings of the surveyed households in the four villages. Major notable findings are summarized as follows. First, most households in Thanasa and Don Neua of the paddy zone are self-sufficient in rice, whereas 18–25% of households need to purchase rice in the two weaving villages. Note also that compared to Don Neua, Thanasa has much more marketable surplus of rice, with more than 85% of households selling rice in the market. Second, Phon Ngam scores the highest average household cash income (nearly 25 million kip per annum, approximately US$2,500), followed by Thanasa and Don Neua at around 17–18 million kip, and the lowest is recorded by Natan at slightly more than 10 million kip.1) Third, the sources of cash income differ substantially among the four villages. Dependency on agriculture (including livestock) is already low even in the two agricul turally advanced villages (45.9% and 30.8% in Thanasa and Don Neua respectively, and 36.4% and 19.6% in Natan and Phon Ngam respectively). The share of income from hand-weaving is high in Natan and Phon Ngam, whereas the share of income from “other business” (business other than hand-weaving) is high in Thanasa and Don Neua. Other notable facts are that salary income is important for Phon Ngam and that remittance is important for Don Neua.2) Table 2 shows the status of major non-land assets holding among the households. Cattle mainly for meat are the most important livestock. It is found that motorcycles, TVs, refrigerators, and phones reach more than 70% penetration rates. Gold is an important form of savings for the villagers, along with livestock. Let us classify the households based on the ownership of consumer durables and gold (as shown in Table 2) into three classes; poor, middle, and rich (Table 3).3) Note that whereas middle class households occupy 46–54% of the households in the four vil1) Note that the average household cash income in the eight villages studied by authors in Luang Prabang Province in 2010 and 2011 is as follows; 52 million kip in Xieng Lek, 16 million kip in Sop Houn, 10 million kip in Kogneiw, 6.0 million kip in Sop Khon, 5.2 million kip in Had Sao, 4.1 million kip in Houei Hoi, 3.7 million kip in Sop Khan, and 2.4 million kip in Had Chan (see Table 6 in Fujita, Ohno, and Chansathith, the second paper in this special issue). Although Natan is the poorest among the four villages, it is relatively wealthy compared to the villages in Luang Prabang Province. 2) After the social revolution in 1975 many villagers fled to abroad especially USA from Don Neua, which causes a high remittance income in the village. 3) The classification method applied is a bit arbitrary; i.e., we took up seven consumer durables as car, motorbike, bicycle, television set, refrigerator, telephone, and power connection and if a household has more than six items or five items plus more than two baat of gold, it is classified into the “rich” whereas if a household has less than three items (except for car and motorbike) it is classified into the “poor.” However, even if a bit arbitrary, by and large it seems quite reasonable when looking at the other economic indicators for the three class categories (see Table 4). 169 202 138 684 Phon Ngam Thanasa Don Neua Total 1.32 1.33 1.47 1.08 1.35 Rice 684 Total 4.06 4.55 4.22 4.30 2.91 Cattle 1.52 1.61 2.40 1.16 0.78 32 18.3% 42 24.9% 12 5.9% 5 3.6% 91 13.3% 95 54.3% 68 40.2% 172 85.1% 77 55.8% 412 60.2% 181 26.5% 48 27.4% 59 34.9% 18 8.9% 56 40.6% No Trans. 0.75 0.50 0.65 0.74 0.30 0.32 Pig 1.16 0.80 0.85 1.29 1.83 Goat No. of Livestock per HH 1.19 0.34 1.17 0.05 3,085,139 17.7% 1,912,655 18.7% 1,639,645 6.6% 5,085,406 28.4% 3,414,262 19.9% Paddy 621,674 3.6% 105,086 1.0% 1,361,952 5.5% 602,401 3.4% 398,406 2.3% Other Agr. 1,937,063 11.1% 1,705,372 16.7% 1,847,468 7.5% 2,526,383 14.1% 1,477,968 8.6% Livestock 1,528,850 8.7% 2,166,004 21.2% 3,817,953 15.4% 26,733 0.1% 116,297 0.7% Weaving 3,770,668 21.6% 1,645,314 16.1% 3,834,124 15.5% 5,360,248 29.9% 4,061,377 23.7% Other Business 22.58 16.89 27.15 23.65 22.64 Chicken 6.7 3.5 8.3 5.9 10.1 Car 70.5 66.9 77.0 66.4 73.2 Motorcycle 55.3 49.7 67.5 36.6 74.6 Bicycle 87.3 83.4 89.4 84.1 94.2 TV 71.9 59.4 71.0 71.3 89.9 Refrigerator Durables (% of Holding HHs) 2,921,250 16.7% 1,522,789 14.9% 5,351,988 21.6% 1,905,604 10.6% 2,451,623 14.3% Salary Cash Income (kip/year) Table 2 Major Non-land Assets Holding among the Households Purchase Sale Buffalo Nonrice Rice Transaction Status (HHs) Source: Prepared by authors. Note: One baat of gold is equivalent to 15.2 gram. 175 169 202 138 Natan Phon Ngam Thanasa Don Neua HHs Source: Prepared by authors. 175 Natan HHs Cultivated Area (ha) Table 1 Status in Rice Transactions and Cash Income Sources in Four Villages 76.5 66.3 82.8 73.3 86.3 Phone 2,694,051 15.4% 805,257 7.9% 5,891,213 23.8% 2,099,634 11.7% 2,796,920 16.3% 10,205,505 100% 24,771,592 100% 17,908,389 100% 17,131,418 100% Total 35.1 21.0 46.1 36.1 37.7 Power 0.67 0.21 1.11 0.56 0.86 Gold (baat/HH) 917,902 17,476,598 5.3% 100% 343,029 3.4% 1,027,249 4.1% 301,980 1.7% 2,414,565 14.1% Agri. Wages Remittance and Others An Analysis on Borrowing Behavior of Rural Households in Vientiane Municipality 117 118 Chansathith Chaleunsinh et al. Table 3 Economic Classes and Population Natan Phon Ngam Thanasa Don Neua Total No. of HHs Share Poor Middle Rich 51 94 30 Total No. of Population per HH Male Female Total 29.1% 53.7% 17.1% 2.27 2.81 2.43 2.37 2.69 2.67 4.64 5.50 5.10 175 100% 2.59 2.59 5.18 Poor Middle Rich 32 77 60 18.9% 45.6% 35.5% 2.59 2.90 3.13 2.56 2.61 3.28 5.15 5.51 6.41 Total 169 100% 2.92 2.84 5.76 Poor Middle Rich 60 102 40 29.7% 50.5% 19.8% 1.87 2.28 2.60 2.12 2.30 2.55 3.99 4.58 5.15 Total 202 100% 2.22 2.30 4.52 Poor Middle Rich 19 69 50 13.8% 50.0% 36.2% 2.11 2.32 2.46 1.95 2.19 2.60 4.06 4.51 5.06 Total 138 100% 2.34 2.31 4.65 Poor Middle Rich 162 342 180 23.7% 50.0% 26.3% 2.17 2.57 2.71 2.27 2.45 2.83 4.43 5.03 5.54 Total 684 100% 2.51 2.51 5.02 Source: Prepared by authors. lages, the share of poor households is larger (29–30%) in Natan and Thanasa and that of rich households is larger (36%) in Phon Ngam and Don Neua. Average family size is the smallest in the poor, followed by the middle and the rich. This indicates that family cycle may at least partly concern the disparity. The largest household size of 5.76 is recorded in Phon Ngam and the smallest size of 4.52 in Thanasa. Thus, nuclear family is said to be the rule in Lao villages. Tables 4 and 5 summarize the major economic indicators by the three economic classes. Several notable points are as follows. First, economic disparity as to household cash income is relatively small in Natan and Don Neua, while it is large in Phon Ngam and Thanasa. Natan is relatively egalitarian in terms of income distribution between the poor and the rich, though having a large share of the poor; Phon Ngam is inequitable in terms of income distribution, with a large share of the rich; Thanasa is inequitable in terms of income distribution, with a large share of the poor; and Don Neua is egalitarian in terms of income distribution, with a large share of the rich. 1.44 2.04 0.54 0.94 1.55 0.82 1.59 2.14 0.66 0.88 2.20 Middle Rich Poor Middle Rich Poor Middle Rich Poor Middle Rich Source: Prepared by authors. Don Neua Thanasa Phon Ngam Natan 0.79 Poor Rice 2.88 0.99 0.48 3.01 2.47 1.88 1.48 0.98 0.98 1.49 0.82 0.29 Nonrice Cultivated Area (ha) 11 57.9% 33 47.8% 33 66.0% 46 76.7% 89 87.3% 37 92.5% 6 18.8% 34 44.2% 28 46.7% 19 37.3% 50 53.2% 26 86.7% Sale 1 5.3% 3 4.3% 1 2.0% 8 13.3% 4 3.9% 0 0% 16 50.0% 15 19.5% 11 18.3% 19 37.3% 12 12.8% 1 3.3% Purchase 7 36.8% 33 47.8% 16 32.0% 6 10.0% 9 8.8% 3 7.5% 10 31.3% 28 36.4% 21 35.0% 13 25.5% 32 34.0% 3 10.0% No Trans. Rice Transaction Status (HHs) 1,232,853 17.3% 2,847,551 21.1% 5,025,260 19.4% 1,970,500 35.8% 5,849,206 37.5% 7,810,075 18.4% 416,875 5.6% 1,207,208 6.3% 2,846,750 6.9% 931,908 15.2% 2,070,494 18.9% 3,085,367 21.0% Paddy 105,263 1.5% 266,957 2.0% 691,200 2.7% 346,717 6.3% 682,451 4.4% 781,750 1.8% 96,250 1.3% 2,150,909 11.2% 1,024,500 2.5% 10,000 0.2% 155,106 1.4% 110,000 0.7% Other Agr. 248,158 3.5% 954,179 7.1% 2,649,440 10.2% 517,292 9.4% 3,093,725 19.9% 4,093,300 9.6% 778,250 10.5% 1,697,416 8.8% 2,610,283 6.3% 615,569 10.0% 1,937,351 17.6% 2,831,167 19.3% Livestock 692,500 9.4% 1,394,286 7.2% 8,640,783 21.0% 1,448,431 23.6% 1,525,106 13.9% 2,356,667 16.0% Other Business 149,947 2.1% 165,797 1.2% 35,200 0% 1,477,368 20.8% 2,855,652 21.1% 6,707,200 25.9% 0 428,333 0% 7.8% 52,941 1,204,118 0.3% 7.7% 0 23,356,250 0% 55.0% 2,933,813 39.7% 4,593,610 23.9% 3,294,067 8.0% 1,732,275 28.3% 2,440,638 22.2% 2,042,820 13.9% Weaving 473,176 7.7% 663,298 6.0% 1,814,600 12.3% 252,632 3.6% 1,529,913 11.3% 4,559,200 17.6% 578,000 10.5% 2,326,039 14.9% 2,824,900 6.7% 2,158,947 30.4% 2,795,290 20.7% 3,041,600 11.7% 1,534,167 27.9% 2,079,765 13.3% 2,998,500 7.1% Total 1,481,053 7,106,221 20.8% 100% 2,107,536 13,522,875 15.6% 100% 3,193,000 25,902,100 12.3% 100% 133,333 5,508,342 2.4% 100% 297,059 15,585,304 1.9% 100% 567,500 42,432,275 1.3% 100% 456,250 7,396,126 6.2% 100% 1,005,779 19,233,221 5.2% 100% 1,359,333 41,146,082 3.3% 100% 421,373 6,128,026 6.9% 100% 173,404 10,981,120 1.6% 100% 741,333 14,706,954 5.0% 100% Agri. Wages Remittance and Others 912,500 1,109,688 12.3% 15.0% 5,019,013 2,165,000 26.1% 11.3% 8,147,033 13,223,333 19.8% 32.1% 495,294 8.1% 2,015,723 18.4% 1,725,000 11.7% Salary Cash Income (kip/year) Table 4 Differences among the Economic Classes I An Analysis on Borrowing Behavior of Rural Households in Vientiane Municipality 119 2.19 3.81 5.90 1.68 4.28 8.28 0.33 2.47 4.44 Poor Middle Rich Poor Middle Rich Poor Middle Rich Phon Ngam Thanasa Don Neua Source: Prepared by authors. 1.84 4.96 7.87 Poor Middle Rich Natan Cattle 0 0 0.14 0.43 0.87 3.05 0.25 0.46 0.24 0.61 1.07 2.53 Buffalo 0 0.27 0.50 0.22 0.09 0.95 0.03 0.48 1.47 0 0.83 1.20 Pig 0.39 1.14 3.28 0 2.39 0.40 1.09 0.58 1.07 0.20 1.06 0.97 Goat No. of Livestock 5.78 22.03 29.56 13.00 25.12 35.88 15.63 24.22 37.50 9.61 16.14 31.60 Chicken 0 0 28.0 0 0 30.0 0 0 23.3 0 0 20.0 Car 10.5 72.5 98.0 5.0 92.2 92.5 12.5 85.7 100 3.9 91.5 96.7 36.8 73.9 90.0 26.7 29.4 70.0 50.0 62.3 83.3 37.3 44.7 86.7 Motorcycle Bicycle 57.9 99.0 100 51.7 97.1 100 59.4 96.1 96.7 56.9 92.6 100 TV 47.4 94.2 100 36.7 81.4 97.5 18.8 72.7 96.6 19.6 68.1 100 47.4 87.0 100 40.0 82.4 100 43.8 85.7 100 31.4 75.5 96.7 Refrigerator Phone Durables (% of Holding HHs) Table 5 Differences among the Economic Classes II 0 20.3 76.0 6.7 34.3 85.0 9.4 35.1 80.0 19.6 46.8 90.0 Power 0.07 0.20 2.08 0.07 0.25 2.12 0.19 0.36 2.57 0.03 0.13 0.78 Gold (baat/HH) 120 Chansathith Chaleunsinh et al. An Analysis on Borrowing Behavior of Rural Households in Vientiane Municipality 121 Second, the share of hand-weaving income in total household cash income is the highest for the poor both in Natan and Phon Ngam. It is evident that the development of the hand-weaving cottage industry in Laos is induced by poverty among the poorer households in agriculturally backward villages.4) Third, in the two villages of paddy zone the share of agricultural wage income (including other miscellaneous incomes) is the highest for the poor. This implies that agricultural development alleviates poverty through the agricultural labor market. Fourth, business income (other than hand-weaving) is a major cause of income disparity among the three classes in the study villages, especially in the agriculturally advanced villages of Thanasa and Don Neua. III The Savings Groups and the Rural Financial Markets in the Study Villages The SGs were introduced to the four villages almost simultaneously in the early 2000s; firstly in Don Neua in 2000, followed by in Phon Ngam in 2001 and finally in Natan and Thanasa in 2003. However, they show different growth pathways (Table 6). Don Neua achieves the most rapid development, with almost 100% of household participation in SG and 3.74 members per household on average.5) Thanasa SG records nearly 80% of household participation, although per household members is only 1.74. In contrast, the two “hand-weaving villages,” the household participation rate is short of 50%, in spite of the relatively high per household members, especially in the case of Natan. On the other hand, the table clearly shows among the four villages that the proportion of membership is the lowest for the poor and that the number of group members per member household is the smallest for the poor. Table 7 demonstrates the borrowing behaviors of the households by the three economic classes; if a household borrowed money from at least one of sources (either from the SG, formal banks, or informal lenders) during the two year period prior to our survey, it is classified as a “borrower.” The sources of loans are shown in the table. The first table is for all the households; the second one is for SG members; and the third one is for non-members. There are several points to be noted here. First, overall, 50% of the households are borrowers, ranging from 31% in Phon Ngam to 67% in Thanasa. Usually, non-SG mem4) For the hand-weaving cottage industry in Laos, refer to Ohno (2001; 2009). 5) For more information, see Fujita, the sixth paper in this special issue. 122 Chansathith Chaleunsinh et al. Table 6 Performance of the Savings Group in the Study Villages HHs Natan Phon Ngam Thanasa Don Neua Total Rate of Participation (%) No. of Members per HH Number Share (%) SG Member HHs Poor Middle Rich 51 94 30 29.1 53.7 17.1 16 50 18 31.4 53.2 60.0 20 104 42 1.25 2.08 2.33 Total 175 100 84 48.0 166 1.98 Poor Middle Rich 32 77 60 18.9 45.6 35.5 12 35 30 37.5 45.5 50.0 18 56 53 1.50 1.60 1.77 Total 169 100 77 45.6 127 1.65 Poor Middle Rich 60 102 40 29.7 50.5 19.8 38 85 34 63.3 83.3 85.0 58 159 56 1.53 1.87 1.65 Total 202 100 157 77.7 273 1.74 Poor Middle Rich 19 69 50 13.8 50.0 36.2 18 69 50 94.7 100.0 100.0 52 244 217 2.89 3.54 4.34 Total 138 100 137 99.3 513 3.74 Poor Middle Rich 162 342 180 23.7 50.0 26.3 84 239 132 51.9 69.9 73.3 148 563 368 1.76 2.36 2.79 Total 684 100 455 66.5 1,079 2.37 No. of Members Source: Prepared by authors. ber households record a significantly lower incidence of borrowing (vis-à-vis SG members) at only 15% on average, except for the case of Thanasa at 40%. In other words, those who intend to borrow are likely to be SG members. Second, among the SG households the rich show the lowest incidence of borrowing from the SG. In contrast, though the participation rate in an SG is the lowest for the poor, they turn out active borrowers once they participate in an SG. This means that an SG functions as a financial intermediary between the cash-surplus rich to the cash-deficit poor. Third, borrowings from formal banks are mainly observed in agriculturally advanced zone, Thanasa and Don Neua. This is mainly because the APB is almost the sole institutional lender in rural Laos, which extends loans only for agricultural purposes. An Analysis on Borrowing Behavior of Rural Households in Vientiane Municipality 123 Table 7 Borrowers and Source of Borrowing (total HHs, SG member HHs, and non-SG member HHs) No. of HHs Natan Phon Ngam Thanasa Don Neua Total Poor Middle Rich Total Poor Middle Rich Total Poor Middle Rich Total Poor Middle Rich Total Poor Middle Rich Total NonBorrower borrower 51 94 30 175 32 77 60 169 60 102 40 202 19 69 50 138 162 342 180 684 No. of SG Member HHs Natan Phon Ngam Thanasa Don Neua Total Poor Middle Rich Total Poor Middle Rich Total Poor Middle Rich Total Poor Middle Rich Total Poor Middle Rich Total 16 50 18 84 12 35 30 77 38 85 34 157 18 69 50 137 84 239 132 455 No. of Non-SG Member HHs Poor 35 Middle 44 Natan Rich 12 Total 91 Poor 20 Middle 42 Phon Ngam Rich 30 Total 92 Poor 22 Middle 17 Thanasa Rich 6 Total 45 Poor 1 Middle 0 Don Neua Rich 0 Total 1 Poor 78 Middle 103 Total Rich 48 Total 229 Source: Prepared by authors. 38 51 15 104 22 51 43 116 22 28 17 67 4 23 26 53 86 153 101 340 13 43 15 71 10 26 17 53 38 74 23 135 15 46 24 85 76 189 79 344 NonBorrower borrower 6 9 7 22 4 14 13 31 10 16 14 40 3 23 26 52 23 62 60 145 10 41 11 62 8 21 17 46 28 69 20 117 15 46 24 85 61 177 72 310 NonBorrower borrower 32 42 8 82 18 37 30 85 12 12 3 27 1 0 0 1 63 91 41 195 3 2 4 9 2 5 0 7 10 5 3 18 0 0 0 0 15 12 7 34 % 25.5 45.7 50.0 40.6 31.3 33.8 28.3 31.4 63.3 72.5 57.5 66.8 78.9 66.7 48.0 61.6 46.9 55.3 43.9 50.3 % 62.5 82.0 61.1 73.8 66.7 60.0 56.7 59.7 73.7 81.2 58.8 74.5 83.3 66.7 48.0 62.0 72.6 74.1 54.5 68.1 % 8.6 4.5 33.3 9.9 10.0 11.9 0 7.6 45.5 29.4 50.0 40.0 0 0 19.2 11.7 14.6 14.8 Source of Borrowing SG Only 8 34 9 51 6 15 14 35 19 41 9 69 9 24 11 44 42 114 43 199 Bank Only 1 1 1 1 1 4 5 10 1 3 3 7 2 8 9 19 IF Only 3 3 4 10 4 5 1 10 8 3 1 12 3 1 4 15 14 7 36 SG +Bank 1 2 3 SG +IF 1 3 1 5 1 1 2 6 19 7 32 1 11 4 16 8 33 12 53 3 1 4 3 6 1 10 3 3 4 10 7 15 7 29 Bank +IF SG+Bank +IF 1 1 1 1 1 1 2 2 1 2 1 4 1 4 1 6 Bank +IF SG+Bank +IF 1 1 Source of Borrowing SG Only 8 34 9 51 6 14 14 34 19 41 9 69 9 24 11 44 42 113 43 198 Bank Only 1 1 2 2 4 1 3 3 7 1 6 5 12 IF Only 1 2 3 2 1 1 4 1 1 2 3 1 4 2 6 5 13 SG+ Bank 1 2 SG+ IF 1 3 1 3 4 1 1 1 2 6 19 7 32 1 11 4 16 8 33 12 53 3 1 4 2 6 1 9 3 3 4 10 6 15 6 27 1 1 1 1 1 1 2 1 4 1 4 1 6 Bank +IF SG+Bank +IF 1 Source of Borrowing SG Only Bank Only 1 1 1 1 1 1 IF Only 3 2 2 7 2 4 SG+ Bank SG+ IF 1 1 1 2 3 6 6 8 2 1 10 1 1 2 4 7 13 8 2 23 1 2 1 1 1 1 1 124 Chansathith Chaleunsinh et al. IV The Determinants of a Household Decision on Borrowing In this section we propose a binary probit model to estimate a household’s decision of whether or not to obtain loans from three types of lenders: SGs, a formal bank, and informal lenders. As these three financial sources have their own features, different loan functions are expected. Thus, we estimate two types of a loan borrowing function: (a) a general function that deals with loans from at least one of the lenders, and (b) a borrowing function from a respective lender: loans from an SG, a formal bank, and an informal lender. Each function is displayed using (1) entire sample, (2) the paddy zone sample, and (3) the weaving zone sample. However, a function for a formal bank is estimated only for the paddy zone, because only a few households borrow from a bank in the weaving zone. The borrowing function we estimate is, Bij = αXij + βZij + γAij + δSij + ζYij + ηZij + μij , where Bij stands for borrowing experience of ith household from a lender j, which equals 1 if the household has borrowed money from any lenders at least once in the past two years. X is vector measuring household’s characteristics that include age and educational attainments of household head, wealth levels, family size, SG membership. Z represents paddy production characteristics that include planted area for paddy and expenditure for chemical fertilizer. A denotes social capital gauged by a question: If you suddenly needed a substantial amount of money (say, one million kip [approximately US$100]), how many people in the village could you turn to? (less than 3=1, 3 to 5=2, 6 to 8=4, more than 9=5). S is a shock dummy measured by a question if the household encountered a shock in the past two years (Yes=1, No=0). Y is per capita annual income from different sources. Z is an area dummy (paddy zone=0, weaving zone=1) and N and D are the dummies for Natan and Don Neua respectively. μ is the error term. The details of variables including their summary statistics are reported in Table 8. The regression coefficients for the above equation are presented in Table 9. First, the results of a general function (columns 1 to 3) indicate that SHOCK is the major reason of loan taking. Living with various risks, rural households face difficulties in managing emergent expenditures on various events. From another perspective, the households having a constant inflow of cash income, WEAVING and SELFEMP, decrease the likelihood of obtaining loans. SALARIED and REMITTANCE also decrease the likelihood in the paddy zone. Remittance is mostly sent from overseas Laotians who fled An Analysis on Borrowing Behavior of Rural Households in Vientiane Municipality 125 Table 8 Descriptive Statistics of Variables and Test of Equal Means by Zone Description Remark Savings group member Member=1, otherwise=0 Age of household head year Education of household head Variable Name Total Paddy Weaving t-value SGM-D 0.67 0.86 0.47 AGE 44.62 42.12 47.1 no education=0 to university=5 ED 2.62 2.43 2.81 Poor household Poor household=1, otherwise=0 POOR-D 0.23 0.23 0.24 Rich household Rich household=1, otherwise=0 RICH-D 0.25 0.25 0.25 HHSIZE 5.02 4.57 5.46 Household size Paddy land in ha PADDYHA Expenditure for chemical fertilizer kip CHEMI 0.09 –6.16 *** 1.31 1.42 1.19 1.81 199,075 232,750 –0.95 Reciprocal social capital see, main text KIN 0.38 0.31 0.45 see, main text SHOCK 0.27 0.3 0.25 PADDY –3.94 *** 1.64 kip paddy sales 3,085,139 4,407,118 1,778,531 agriculture other than paddy OTHERAGRI 621,671 519,597 7,225,580 –0.84 livestock sales LIVESTOCK 1,937,063 2,100,850 1,775,180 0.8 hand weaving WEAVING 1,528,850 63,085 self-employed business SELFEMP 3,770,668 4,833,058 2,720,631 salaried occupation SALARIED 2,769,342 2,127,224 3,403,394 remittance REMITTANCE agricultural wage Gold 4.19 *** –0.46 216,011 Previous expenditure shock Cash Income from –4.73 *** AGRIWAGE Gold ownership in baat (local unit of gold) GOLD 5.34 *** 2,977,572 –11.17 *** 917,902 1,159,441 679,171 1,803,854 2,382,650 1,231,787 0.67 0.69 0.66 1.71 –2.49 ** 1.73 3.47 *** 0.65 Note: *** P<1%, ** P<5%. t-value is for the difference between paddy villages and weaving villages. the country following its communist Pathet Lao takeover as a result of the Laotian Civil War in 1975. The displaced persons were mostly the natives of indigenous villages in the Vientiane plain such as Don Neua (Table 1). Similarly, households in a rich stratum of village societies (Rich-D) borrow less. They are assumed to be able to self-finance emergencies. A significantly positive coefficient to SG membership (SGM-D) implies that SG turns out an additional lender for village households. As Table 7 shows, the sample households obtain loans from different sources. Column 4 of Table 9 presents a borrowing function for a formal bank in the paddy zone. Educational attainments significantly increase the likelihood of obtaining a loan from a formal bank (mostly APB). This is possibly because higher educational attainment facilitates the procedure for a loan request. That expenditure for chemical fertilizer (CHEMI) has a significantly positive effect on a bank loan is because APB extends loans for agricultural production. As was observed in Japan (Ohno, the first paper in this special issue), increasing application of chemical fertilizer in Laos will necessitate well-established financial services for rural households. It should be noted that SHOCK also lets the households obtain loan from APB. This is mainly because the household having obtained loans from informal sources when they experienced emergent expenditure obtained a loan from APB to pay off their debt. This fungibility assumedly appears as a significant positive coefficient of SHOCK. In fact, what we observed in Don Neua during our field survey is that some villagers borrowed from informal sources (mainly relatives and 1.5 –0.326 0.026 1.528 0.048 –4.25E-08 –0.14 0.26 –0.112 Rich-D HHSize SGM-D PaddyHa Chemi Kin Shock Zone-D (100.0) (49.7) (50.3) –3.92E-08 –1.07E-08 –9.22E-09 –4.38E-08 2.18E-08 684.0 0=340 1=344 Weaving Selfemp Salaried Remittance Others Log likelihood 705.534 373.379 *** 0.182 *** 0.299 LR chi 2 Pseudo R 2 (64.7) (35.3) (100.0) 2.191 3.173 * 6.007 ** 3.689 * 1.798 0.088 Prob > chi 2 1=220 0=120 340.0 0.244 –0.55 –4.01E-08 –7.43E-09 4.27E-07 –4.59E-09 1.912 0.56 2.604 5.648 ** 4.002 ** 0.553 0.001 18.891 *** 1.931 4.086 ** 0.058 1.849 1.206 68.11 5.07 ** 1.008 6.805 *** 4.71 ** 0.054 –4.70E-08 8.99E-09 –0.36 0.411 –0.333 1.43E-07 0.001 1.018 0.066 –0.39 0.05 0.121 –0.007 Wald 242.668 N (%) 2.498 –2.79E-09 Livestock 0.862 4.50E-09 –2.04E-08 Paddy 0.218 0.665 4.312 ** 0.996 125.006 *** 0.688 5.344 ** 0.036 OtherAgri Income by sources 0.123 0.028 Poor-D 0.079 –0.014 ED 2.784 * –0.007 Z-Coeff Paddy Zone Wald Entire Sample Z-Coeff Age Column General Term 2 1 3 1=124 0=220 344.0 0.37 –0.05 1.06E-08 –4.43E-08 –4.92E-08 4.06E-10 5.31E-09 –4.43E-08 0.17 0.17 0.085 –9.08E-08 0.099 1.937 –0.012 –0.072 –0.15 –0.081 –0.001 Z-Coeff 282.93 0.384 *** 166.806 (36.0) (64.0) (100.0) 1.995 0.025 0.682 5.388 ** 5.615 ** 0 0.037 2.44 0.782 0.691 0.226 0.192 1.389 110.848 *** 0.07 0.095 0.425 1.188 0.028 Wald Weaving Zone Table 9 Borrowing Functions 1=71 0=269 340.0 0.049 –1.411 –4.20E-08 –1.35E-09 9.92E-08 7.41E-09 –8.50E-08 1.70E-08 –0.53 0.489 –0.1 4.48E-07 –0.031 0.387 0.017 –0.463 0.24 0.225 –0.002 Z-Coeff 301.505 0.129 *** 46.923 (20.9) (79.1) (100.0) 0.093 5.211 ** 3.562 * 0.112 0.336 0.258 1.63 2.933 * 4.242 ** 7.464 *** 0.279 4.956 ** 0.405 1.791 0.096 2.614 0.763 4.939 * 0.116 Wald Paddy Zone Bank 4 126 Chansathith Chaleunsinh et al. 0.052 1.74E-07 PaddyHa Chemi (100.0) (89.2) (10.8) –9.16E-09 –3.06E-08 –4.73E-08 –3.92E-09 0.106 0.068 684.0 0=610 1=74 Livestock Weaving Selfemp Salaried Remittance Others *** 0.1 222.254 *** 0.059 426.941 Note: *** P<1%, ** P<5%, * P<10%. Pseudo R2 is Cox-Snell. Log likelihood LR chi 2 Pseudo R 2 (12.6) (87.4) (100.0) 0.247 0.057 1.391 1.339 0.003 1.016 Prob>chi 2 1=43 0=297 340.0 0.099 –0.1 –3.60E-08 –3.81E-08 –1.94E-06 –4.07E-08 0.103 0.003 1.249 5.652 ** 0.006 0.977 1.207 10.552 *** 1.891 0.83 0 0.053 1.18 Wald 35.889 0.251 0.081 3.837 ** 1.087 0.269 –2.06E-08 –6.91E-10 0.326 0.494 –0.017 2.22E-07 0.045 –0.884 –0.09 –0.375 –0.005 –0.027 –0.009 Z-coeff 41.884 N (%) 0.206 –1.88E-08 0.274 –7.06E-09 0.277 0.009 Paddy –0.017 11.068 *** 0.021 1.684 2.025 0.978 3.501 * 0.042 OtherAgri Income by sources Zone-D 0.49 –0.162 SGM-D Shock –0.079 HHSize –0.021 –0.038 Rich-D Kin 0.227 1.749 1.185 –0.074 ED Poor-D Wald 3.464 * Z-Coeff Paddy Zone Entire Sample –0.01 Age Informal Lenders 6 5 1=31 0=313 344.0 –0.044 0.236 1.02E-08 –1.06E-07 –4.54E-08 3.55E-09 –2.64E-08 –8.99E-08 –0.198 0.579 –0.044 –1.72E-08 0.107 0.211 –0.078 0.023 0.009 –0.195 –0.018 Z-coeff 180.215 0.078 * 28.116 (7.0) (91.0) (100.0) 0.022 0.469 0.355 2.575 1.979 0.021 0.244 2.621 0.651 5.797 ** 0.041 0.006 0.888 0.952 1.685 0.006 0.001 3.865 ** 4.249 ** Wald Weaving Zone 7 8 1=344 0=171 455.0 2.80E-09 –2.60E-09 –8.64E-09 –3.00E-08 –3.46E-08 1.13E-08 –1.72E-08 –3.98E-09 0.123 0.07 –0.133 7.88E-08 0.07 NA 0.036 –0.481 –0.106 –0.008 –0.003 Z-score 551.706 0.105 *** 50.698 (62.4) (37.6) (100.0) 3.395 * 0.734 8.098 *** 2.749 * 0.407 0.541 0.206 0.263 3.395 * 1.017 0.337 1.243 1.048 NA 9.152 *** 0.362 0.018 0.278 1.639 Wald Entire Sample Table 9 Borrowing Functions (continued) 1=183 0=111 294.0 4.00E-08 –2.80E-09 –4.08E-08 –3.04E-08 2.50E-07 1.19E-08 –4.43E-08 –2.03E-09 –0.503 0.215 –0.189 2.14E-07 0.021 NA 0.087 –0.492 –0.048 0.054 –0.001 Z-score Wald 333.712 0.174 ** 56.045 (62.2) (37.8) (100.0) 5.06 ** 1.027 5.517 ** 4.923 ** 1.25 0.208 1.622 0.045 4.998 ** 1.515 1.197 1.263 0.136 NA 2.817 * 6.022 ** 0.046 0.352 0.009 Paddy Zone Savings Group 9 10 1=101 0=60 161.0 3.02E-09 4.00E-11 2.17E-08 –2.38E-08 –2.94E-08 1.73E-08 2.88E-08 –7.69E-08 0.457 –0.212 0.063 1.75E-07 0.102 NA –0.018 –0.24 –0.265 0.011 0.007 Z-score 188.212 0.141 * 24.425 (62.7) (37.3) (100.0) –0.76 0.014 1.198 2.028 1.536 0.352 0.54 3.584 * 3.415 * 0.753 0.073 0.347 0.449 NA 0.108 0.634 0.751 0.013 0.523 Wald Weaving Zone An Analysis on Borrowing Behavior of Rural Households in Vientiane Municipality 127 128 Chansathith Chaleunsinh et al. friends, and in some cases from moneylenders) when they faced emergencies, and after some time they borrowed from APB to repay the debt. In such cases, SHOCK induces villagers to borrow from formal banks, with a certain time lag. Informal loan functions are shown in columns 5 to 7 of Table 9. The results indicate that SHOCK is a major reason of borrowing from informal lenders; on an average 62.3% are from relatives, 18.2% from neighbors and friends, and 11.7% from money lenders in the four study villages. Informal lenders offer convenient loans due to their swift pro cedure when rural households face emergencies. It is noted that in the paddy zone SGs are substituting for informal lenders. This will be discussed later as a difference between saving motive and borrowing purposes. Columns 8 to 10 show borrowing functions for SGs (sample households are group members only). A constant inflow of cash income, SELFEMP and SALARIED, deceases the likelihood of a loan taking from SGs in the paddy zone. Pecuniary enough, SHOCK does not account for loans from SGs. This is probably because an urgent loan demand cannot be satisfied by SGs. SG loan is disbursed once a month on the fixed day, and group members who have a debt to repay cannot obtain a loan from SGs even if they faced shocks. In this respect, informal lenders are assumed to still offer most convenient loans against shocks that involve urgent expenditures. In whole, especially for the weaving zone, SG borrowing functions are rather blurred. A major motivation to participate in an SG is for precautionary savings followed by education expenditure (Table 10). However, when it comes to loan usages (Table 11), though coping with shock (disease and other emergencies) is a major reason of loan usage that accounts for 24.5% of loan obtained, nearly 40% of loan is spent for production purposes including education. Another usage (16%) goes for consumption purposes. Unlike production-specific loans from APB, the usage of loan form SG is diversified. As the SG Table 10 Reasons to Participate in Savings Group Entire Sample Emergency Education To prepare for old age Future consumption To gain dividend Not to waste expenditure Agricultural purpose Others Total Source: Prepared by authors. (%) Paddy Zone Weaving Zone 72.5 11.9 5.7 0.2 4.0 4.0 1.1 0.6 73.6 10.4 7.4 0.6 4.3 3.1 0 0 71.8 12.7 4.5 0 3.8 4.5 1.7 1.0 100.0 99.4 100 129 An Analysis on Borrowing Behavior of Rural Households in Vientiane Municipality Table 11 Usage of Loan from Savings Group (%) Entire Sample Paddy Zone Weaving Zone Disease Emergency other than disease Production purposes Paddy planting Chemical fertilizer Paddy harvesting Other agriculture Livestock Education Consumption Child birth Ceremony Others 18.8 5.7 (39.3) 9.9 2.1 2.8 16.0 1.8 6.7 16.0 0.7 2.1 17.4 18.1 3.3 (44.9) 13.7 2.2 4.4 20.3 2.7 1.6 14.2 0.5 1.1 17.9 20.0 10.0 (29.1) 3.0 2.0 0 8.0 0 16.0 19.0 1.0 4.0 17.0 Total 100.0 100.0 100.0 Source: Prepared by authors. is a savings-first financial institution, borrowers tend to perceive the loans from an SG as withdrawal of own savings. Thus, purpose-specific loans cannot be bound to borrowers for the SG. This is likely to blur the SG borrowing function. Tables 10 and 11 indicate that the motive of savings does not match the actual usage of loans. Though precautionary savings characterize saving behavior of rural households, they utilize sizeable amount of their loans for production purposes. Though this is a natural process of savings accumulation, it implies that growth prospects of the SG largely depend on loan demands for production purposes. Otherwise, as discussed in several articles of this special issue, emerging surplus money is concerned to jeopardize the SG movement of Laos. The question that needs to be taken up next is who participate in the SG. Table 12 presents an SG participation function. The poor segment of the village households does not participate in an SG. They find it difficult to save every month, because SGs require members to save at least 5,000 to 10,000 kip every month. A shock experience has the effect of encouraging participation in the SG. As a rule, members are entitled to access loan after saving more than three months. Thus, transitory shock itself does not explain the participation in the SGs. It can be assumed that shock-prone households tend to participate in an SG. It should be noted that income from livestock sales is negatively associated with participation in the SG. Table 13 shows the allocation of lump-sum income (one million kip); the question is that “Suppose you get one million kip, how do you allocate the money 130 Chansathith Chaleunsinh et al. Table 12 Savings Group Participation Function Age ED Poor-D Rich-D HHSize PaddyHa Chemi Kin Shock Cash income by sources Paddy OtherAgri Livestock Weaving Non-farm self employment Salaried Remittance Agri. Wages and others Gold N P Z-coefficient Wald 0.002 0.098 –0.457 0.076 0.055 0.034 –1.32E-07 –0.003 0.394 0.133 3.146 9.329 0.207 2.65 0.405 0.736 0.001 8.183 –4.04E-09 6.12E-09 –2.22E-08 1.14E-08 4.03E-10 –9.68E-09 2.47E-08 6.78E-09 0.018 –0.947 –1.173 0.201 0.128 3.501 0.554 0.008 1.046 1.044 0.196 0.016 30.98 39.836 N (%) Member Non-member LR chi 2 Prob>chi 2 Pseudo R2 Log likelihood * *** *** * *** *** 546 (100.0) 318 (58.2) 228 (41.8) 93.971 *** 0.158 648.043 Note: *** P<1%, * P<10%. among the followings (choices are shown in the table).” Respondents have little intention to save the money in a formal bank, because they do not have ready access to savings facilities in formal financial institutions. Instead, they save one-third of the money in an SG. It should be noted that 17% goes for livestock purchase. Livestock is known in less developed countries like Laos as the most common means of non-cash savings. Thus, households who are endowed with favorable conditions for livestock farming tend not to participate in SGs. Though gold is said to be another means of savings, it does not affect participation behavior. This is partly because gold investment is far smaller than livestock investment as can be understood from Table 12. Our major findings are; 1) Rural households have access to several lenders. SGs turn out to be a prepotent lender. 2) Lenders (SGs, formal bank, and informal lenders) An Analysis on Borrowing Behavior of Rural Households in Vientiane Municipality Table 13 Allocation of Lump-sum Income Deposit money in a Laotian bank Deposit money in a Thai bank Deposit money in the Savings Group Buy gold Buy cattle Buy something you want Others Total 131 (%) Entire Sample Paddy Zone Weaving Zone 7.0 0.6 31.6 3.8 16.6 18.2 22.2 4.5 0.5 40.0 1.4 13.4 19.8 20.4 9.4 0.7 23.2 6.2 19.7 16.5 24.3 100.0 100.0 100.0 Source: Prepared by authors. have their own peculiarities in that formal banks extend loans for production purposes, informal lenders for coping with shocks. The SG falls between them. SG members borrow money to cope with shocks as well as for production purposes, and even for a consumption purpose. V Concluding Remarks Our major objective is to discuss how the SG functions in the villages of Vientiane Municipality, based on the case studies in four villages. We selected two “weaving villages” and two “paddy villages” in order to assess the differential performance and impact of the SGs between them. Our focus is to clarify who borrow, from which sources, and for what purposes. In order to deepen the analysis we classified the households into three economic classes; poor, middle, and rich. The major findings and conclusions are summarized as below. First, the poor are less likely to participate in an SG. This is partly because the poor are too poor to afford monthly commitment savings of at least 5,000–10,000 kip (roughly US$0.5–1). Another plausible reason is an emotional barrier in participation due to their poverty and deprivation. Second, the major motivation to participate in the SG is found “to prepare for emergencies” that accounts for more than 70% of the reasons of participation. However, as to actual usage of loans from the SG, dealing with shocks accounts for only 24.5% of loan amounts. On the other hand, nearly 40% goes for production purposes including education. Despite rapid economic growth in Laos in the last 10–15 years, the major concerns of rural people, even in Vientiane Municipality, are still “protective.” In fact, the SHOCK dummy is significant in the SG participation function. Our interpretation is that those households with a high propensity to be hit by shocks are more willing to participate in 132 Chansathith Chaleunsinh et al. the SG. Third, while SHOCK dummy is insignificant in the SG borrowing function, it is significant in the borrowing function for informal sources and partly for formal banks (mostly APB). It can be interpreted that obtaining SG loans is somewhat inconvenient for rural people to deal with emergencies in that the SG extends loans only once in a month and that members cannot apply for a loan when they have already borrowed money from the SG. Only after repaying all the debt, members can apply for a loan. In contrast, borrowing from informal sources (in the four villages average, 62.3% are from relatives, 18.2% from neighbors and friends, and 11.7% from money lenders) is far easier. The significance of SHOCK for the borrowing function from formal banks can be explained by the fact that some people borrow from informal sources, and later apply for formal banks to repay the debt. Fourth, generally speaking, we obtained only blurred results for the SG borrowing function, especially in the case of the weaving villages. This is mainly because loans from the SG are spent for various purposes including emergencies and production purposes. Fifth, however, it should be noted that the borrowing from informal sources became less if households participated in the SG, especially in the case of paddy villages. It means that at least some of the borrowings from informal sources were substituted by the borrowing from the SG. Sixth, though rich households are more likely to be SG members, they tend to borrow less from the SG. Thus, it can be claimed that SGs provide financial intermediation between cash-surplus rich households and cash-deficit middle and poor households. Seventh, SGs perform differently between the paddy villages and the weaving villages. With four sample villages, we can only propose a following hypothesis; the performance of paddy villages was better because of the higher percentage of loan usage (from the SG) for production purposes (44.9% in the paddy zone versus 29.1% in the weaving zone as shown in Table 11). In both of the weaving villages, as traders or m aster weavers provide raw materials for weavers, financial constraints turn out to be minimized for weavers. In contrast, as the borrowing function from formal banks indicates, there exists a strong demand for credit in the paddy villages, especially in rice cultivation. It should be concluded, from what has been said above, that the SG carries out complementary functions with formal and informal financial institutions, and that the SG has potential for growth where growing loan demands for productive purposes are expected. Otherwise, the SG stagnates as observed in Luang Prabang Province and partially in Natan and Phon Ngam. This offers an answer to the research question of the diversified growth of the SGs in Vientiane Municipality as advanced in the introduction. This does not imply, however, that the SG should be introduced only in the areas An Analysis on Borrowing Behavior of Rural Households in Vientiane Municipality 133 endowed with the long-term prospects for growth of loan demands, because the SG functions as an insurance institution in economically backward areas. Distinct mechanisms for extending loans are required for different villages. Accepted: December 22, 2014 References Cheruiyot, Thomas Kimeli; Kimeli, Catherine Muganda; and Ogendo, Susan M. 2012. Effect of Savings and Credit Co-operative Societies Strategies on Member’s Savings Mobilization in Nairobi, Kenya. International Journal of Business & Commerce 1(11): 40–63. Coleman, Brett E.; and Wynne-Williams, Jon. 2006. Rural Finance in the Lao People’s Democratic Republic: Demand, Supply, and Sustainability Results of Household and Supplier Surveys. Manila: Asian Development Bank. Gingrich, Chris D. 2004. Community-based Savings and Credit Cooperatives in Nepal: A Sustainable Means for Microfinance Delivery? Journal of Microfinance 6(1): 21–39. Ledgerwood, Joanna. 1999. Microfinance Handbook: An Institutional and Financial Perspective. Washing ton, D.C.: World Bank. Ohno, Akihiko. 2009. Rural Clustering at Incipient Stages of Economic Development: Hand-weaving Clusters in Lao PDR. In Reshaping Economic Geography in East Asia, edited by Yukon Huang and Alessandro Magnoi Bocchi, pp. 37–47. Washington, D.C.: World Bank. ―. 2001. Market Integrators for Rural-based Industrialization: The Case of the Hand-weaving Industry in Laos. In Communities and Markets in Economic Development, edited by Masahiko Aoki and Yujiro Hayami, pp. 153–186. New York: Oxford University Press. Papias, Malimba Musafiri; and Ganesan, P. 2009. Repayment Behaviour in Credit and Savings Cooperative Societies: Empirical and Theoretical Evidence from Rural Rwanda. International Journal of Social Economics 36(5): 608–625. Robinson, Marguerite S. 2001. The Microfinance Revolution: Sustainable Finance for the Poor. Washing ton, D.C.: World Bank.


© Copyright 2026