
Chapter 16: Patients with Diabetic Nephropathy in Established Renal Failure: Demographics,
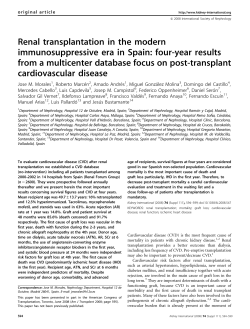
Chapter 16: Patients with Diabetic Nephropathy in
Established Renal Failure: Demographics,
Survival and Biochemical Variables
Summary
.
.
Of the 20,532 patients who started RRT
from 1997 to 2004, 19% were reported as
having diabetic nephropathy (DN). Of these,
the majority (77%) were White. There were
many missing data on ethnicity, referral, comorbidity, cholesterol and HbA1c.
20% of patients with DN were referred <3
months before starting RRT and 46% within
a year. This is disappointing in patients under
regular medical supervision. The National
Service Framework for Renal Services
advocates referral within a year of established
renal failure.
.
There was evidence that patients with
diabetic nephropathy from socially deprived
areas were referred later than those from
more affluent areas, both in crude and age
and gender adjusted analyses (chi-sq
p < 0.0001, Mantel–Haenszel: p ¼ 0.0026).
.
19% of diabetic nephropathy patients were
recorded as smokers at the start of RRT.
.
Incident patients with DN were significantly
more likely to be from a socially deprived
area than others, even within the White
population alone (p < 0.0001).
.
Patients with DN were less likely to receive a
transplant.
.
After adjusting for age, ethnicity, social
deprivation and co-morbidities including
cardiovascular disease, long-term survival
was significantly worse for DN patients than
for other patients on RRT. The difference in
crude survival was greatest in younger
patients (5-year survival 56% in 18–54 year
olds compared to 85% of others of the same
age (p-value for interaction <0.001)).
.
Blood pressure data were only available for
about 40% of the patients. Diabetic nephropathy patients on HD had higher blood
pressures than other patients, but there was
no difference for other treatment modalities.
.
Data on cholesterol were missing in 60% of
patients. Overall, patients with DN had
lower cholesterol values than other patients
on PD and HD.
.
HbA1c data were missing in a high proportion of the incident DN cohort although
reporting had improved in recent years.
Glucose control was worse in PD than HD
patients.
Introduction
Diabetic nephropathy is now the most common
renal disease leading to renal replacement
therapy in developed countries1,2,3,4. Within the
UK, the number of DN patients accepted for
RRT rose steadily in the 1990s5 especially in the
African–Caribbean and South Asian populations3,4,5,6. This may be related to the increased
prevalence of Type 2 diabetes in the general
population, the ageing population and the
liberalisation of attitudes to acceptance for
RRT5,7. The overall rise has slowed in the last 4
years8. DN patients starting RRT are likely to
have more co-morbidity than other patients, in
particular cardiovascular disease, and consequently worse survival on RRT9,10,11. In recent
years there has been some reduction in the high
mortality of such patients, so the prevalence of
diabetic nephropathy patients on RRT
(currently lower than the percentage of incident
patients, see Chapter 3) might increase12,13.
The National Service Frameworks for
Diabetes14 and for Renal Services15 have
highlighted the importance of the primary
prevention of DN in diabetic patients by early
detection and aggressive management of
hypertension, glucose control and cardiovascular risk factors and of the timely referral
(recommendation >1 yr before RRT) of those
with progressive renal disease in order to plan
for RRT.
251
The UK Renal Registry
There is a key policy drive to reduce health
inequalities in England16. In the UK there is
evidence that diabetic patients in more socially
deprived areas have higher all cause mortality
even after adjustment for smoking and blood
pressure9, and lower rates of attendance at GP
and hospital clinics17. The UK Renal Registry
2003 Report highlighted the possible role of
social deprivation in the context of DN.
This chapter examines the characteristics of
patients developing established renal failure from
DN, their access to modalities of treatment and
their survival on RRT relative to other incident
patients. It also includes data on quality of care
(HbA1c, cholesterol and blood pressure).
These analyses were undertaken before individual patient data from the Scottish Registry
became available and therefore only includes
England and Wales.
Methods
Use of incident patients in analyses
As prevalent patients represent a complex
mixture of incident patients and survivors, only
incident patients commencing RRT between
1997 and 2004 in centres reporting to the
UKRR were included. It was not possible to
distinguish accurately between Type 1 and 2
diabetes, most are Type 2.
Measure of social deprivation
All postcodes were validated against the
patient’s full address using a commercial
software package (QAS). The Townsend index
of social deprivation was calculated from the
2001 UK Census. This index is based on the
percentages of unemployed, households without
a car, overcrowding, and non owner occupied
homes in each output area18, a high Townsend
score indicating greater social deprivation. The
Census output area for each patient’s postcode
of residence was identified, and the patients
were then allocated into five equally sized
quintiles according to their estimated level of
deprivation. For the 5% of postcodes which
cross a Census output area boundary and
which therefore have more than one Townsend
score, the mean value was taken.
252
The Eighth Annual Report
Measures of ethnicity, co-morbidity
and referral
Ethnicity was recorded in the renal units largely
by self-ascription, and grouped into African–
Carribean, South Asian and White descent. To
obtain high quality data the analyses in the
incident cohort were confined to centres which
returned information on ethnicity on at least
85% of patients. Within this restricted group of
patients there was a high proportion of missing
data on co-morbidity at start of RRT and on
referral date; to strike a balance between data
quality and quantity for these items, slightly
less stringent cut-offs were chosen for inclusion,
with centres returning more than 75% referral
data and more than 80% co-morbidity data
included. For analysis of co-morbidities,
‘cardiac disease’ included those patients
recorded as having angina, previous myocardial
infarction, coronary artery by-pass grafts or
angioplasty and ‘peripheral vascular disease’
(including claudication, ischaemic and neuropathic ulcers, non-cardiac angioplasty and
amputations due to ischaemia). Late referral
was defined as referral to a nephrologist within
90 days of starting RRT; referral within 1 year
of RRT was also examined.
Measures of quality of care in
patients with DN: blood pressure,
HbA1c and cholesterol
For HD patients post-dialysis blood pressure
was analysed. In patients on PD and those who
were transplanted, blood pressure measured at
clinic visits was used. HbA1c measures were
only included from laboratories whose assays
were validated to ensure comparability between
centres; more details on the HbA1c measurements and their validation can be found in the
2003 UKRR Report, Chapter 1919. For
analyses of changes over time the first available
measurement, the measurement at 90 days, and
the measurement at 1 year after start of RRT
were used. For analyses of prevalent patients
the most recent measurement of blood pressure,
cholesterol and HbA1c were used.
Survival analyses
Chi-square, Chi-square for trend and Kruskal
Wallis tests were performed to identify associations between diabetes and potential predictors
Chapter 16
Patients with Diabetic Nephropathy in Established Renal Failure
of survival. Mantel–Haenszel tests were used if
effects were examined in different strata of age
and sex. As there is variability in defining
whether patients who die early have acute or
chronic renal failure, which would affect early
death rates, survival up to 90 days of RRT was
assessed separately from survival after 90 days.
Follow up was continued until 31st December
2004. Patients were not censored at time of
renal transplant. For descriptive analyses of
survival in DN incident patients, Kaplan-Meier
graphs, life-table methods, and log-rank tests
were used where appropriate. Cox’s proportional hazards model was then used to explore
the independent effect of variables on survival.
Age was entered as a linear variable, social
deprivation as a categorical variable using the
aforementioned quintiles, late referral, diabetes
and gender as binary variables. As there was a
cohort effect up to 90 days on RRT, all models
were adjusted for year of onset of RRT, though
this variable had no significant effect on survival after 90 days.
Four different cohorts were used in the
analysis.
Cohort 1: patients with available baseline
information on Townsend Scores, treatment
modality, gender, age, and primary renal
disease (n ¼ 20,532 patients, n ¼ 49 units).
Cohort 2: as 1 but restricted to Whites
(n ¼ 9,810 patients, n ¼ 24 units), to assess the
effect of adjusting for social deprivation
independent of ethnicity.
Cohort 3: as 1 but restricted to those with data
on co-morbidities at start of RRT (n ¼ 4,530
patients, n ¼ 16 units), to examine whether
these were the main mediators of worse
outcome of diabetic nephropathy patients
while adjusting for social deprivation and all
other variables.
Cohort 4: as 3 but restricted to Whites
(n ¼ 2,760 patients, n ¼ 10 units).
Prior knowledge and both crude and adjusted
analyses suggested the presence of an interaction between DN and age in models after
90 days RRT, both on continuous age-scale
as well as using age-categories. For simplicity,
the effect in different age categories is reported
(18–54 years, 55–64 years and above 65 years of
age). However, because of remaining residual
confounding due to age, each category was
adjusted for age. The assumption of propor-
tionality was investigated by using graphical
methods (Nelson–Aalen Plots) and the final
model using Schoenfeld tests.
Results
Baseline characteristics of incident
RRT patients
Of new patients starting RRT 19% had DN,
the most common cause of ERF in the UK (see
Chapter 3): just over 60% of both these and
other patients were male (Table 16.1). Although
DN is common in South Asian and African–
Caribbean ethnic minorities within the UK,
White diabetic nephropathy patients represent
the main burden of ERF. DN patients were
younger at the start of RRT when compared
with other RRT patients. There may be competing risks as older diabetics are more likely to
die of cardiovascular disease (CVD) before
RRT than younger ones19, and it is possible
there is a degree of selection.
Incident patients with DN had higher
Townsend scores (greater social deprivation)
than others. Given the strong association of
social deprivation with ethnicity (odds ratio
3.15, 95% CI: 2.81, 3.53; p < 0.0001) Whites
alone were analysed: a significantly higher
proportion of White DN patients were from a
more socially deprived background compared
to other White patients (p < 0.0001) (Figure
16.1). The observed differences in social deprivation in diabetic nephropathy patients and
others may be due to the increased incidence of
obesity and metabolic syndrome and consequently of Type 2 diabetes in more socially
deprived groups20. Social deprivation and
young age are also associated with poorer
diabetic control, poor CVD risk management9,17,21,22,23 and a high rate of smoking.
Late referral was less common in DN patients
than others, but nevertheless 20% of this group
of patients under regular medical surveillance
who needed RRT were referred less than 90
days from starting RRT and only half within
one year. Whilst diabetic nephropathy patients
were referred to renal units earlier than others,
there remains much scope for improving
referral to nephrologists, especially given the
difficulties of establishing vascular access in
253
The UK Renal Registry
The Eighth Annual Report
Table 16.1: Demographics of diabetic nephropathy and other patients
DN
Others
Total
n
%
n
%
n
%
3,959
19.3
16,573
80.7
20,532
100.0
2,427
1,532
3,959
61.3
38.7
100.0
10,233
6,340
16,573
61.8
38.3
100.0
12,660
7,872
20,532
61.7
38.3
100.0
48.8
60.7
69.2
50.5
65.1
74.3
50.1
64.1
73.5
Age distribution at start of RRT
18–54
55–64
65þ
Total
1,463
988
1,508
3,959
37.0
25.0
38.1
100.0
5,166
3,074
8,333
16,573
31.2
18.6
50.3
100.0
6,629
4,062
9,841
20,532
32.3
19.8
47.9
100.0
Townsend scores
Distribution of social deprivation quintiles
1
2
3
4
5
Total
515
622
728
968
1,126
3,959
13.0
15.7
18.4
24.5
28.4
100.0
3,064
3,315
3,136
3,635
3,423
16,573
18.5
20.0
18.9
21.9
20.7
100.0
3,579
3,937
3,864
4,603
4,549
20,532
17.4
19.2
18.8
22.4
22.2
100.0
EthnicitySee note 1
White
South Asian
African-Caribbean
Other
Total
1,707
322
122
70
2,221
76.9
14.5
5.5
3.2
100.0
8,103
558
242
167
9,070
89.3
6.2
2.7
1.8
100.0
9,810
880
364
237
11,291
86.9
7.8
3.2
2.1
100.0
Treatment modality at start of RRT
HD
PD
Tx
Total
2,728
1,187
44
3,959
68.9
30.0
1.1
100.0
11,616
4,580
377
16,573
70.1
27.6
2.3
100.0
14,344
5,767
421
20,532
69.9
28.1
2.1
100.0
Number of patients
Gender
Male
Female
Total
Age (years)
Median age start RRT
Interquartile range
0.6076
<0.0001
<0.0001
<0.0001
<0.0001
<0.0001
<0.0001
At day 90
HD
PD
Tx
OtherSee note 2
Died before 90 days
Not on RRT for 90 days
Total
2,218
1,237
49
34
220
201
3,959
At one year
HD
PD
Tx
OtherSee note 3
Died before 90 days
Not on RRT for 90 days
Total
1,521
845
116
37
596
844
3,959
254
p-value
63.3
35.3
1.4
100.0
9,123
4,755
493
106
1,312
784
16,573
63.5
33.1
3.4
100.0
11,341
5,992
542
140
1,532
985
20,532
63.5
33.5
3.0
100.0
<0.0001
61.3
34.1
4.7
100.0
6,265
3,335
1,007
121
2,504
3,341
16,573
59.1
31.4
9.5
100.0
7,786
4,180
1,123
158
3,100
4,185
20,532
59.5
31.9
8.6
100.0
Chapter 16
Patients with Diabetic Nephropathy in Established Renal Failure
Table 16.1: (continued)
DN
Others
Total
n
%
n
%
n
%
ReferralSee note 4
0 to 89 days
90 to 365 days
More than 365 days
Total
179
232
473
884
20.3
26.2
53.5
100.0
1,129
699
2,042
3,870
29.2
18.1
52.8
100.0
1,308
931
2,515
4,754
27.5
19.6
52.9
100.0
Co-morbiditySee note 5
Number of pats with at least one co-morbidity at start
Cardiovascular disease
Cardiac disease
Myocardial infarction
CABG/angioplasty
Angina
PVD
Cerebrovascular disease
Malignancy
Smoker
COPD
Liver disease
442
360
230
121
44
190
180
105
32
131
46
14
59.1
48.1
30.8
16.2
5.9
25.5
24.1
14.0
4.3
18.2
6.2
1.9
1,623
930
671
335
142
523
315
290
404
468
243
68
55.8
32.0
23.1
11.6
4.9
18.0
10.9
10.0
13.9
16.9
8.4
2.3
2,065
1,290
901
456
186
713
495
395
436
599
289
82
56.5
35.3
24.7
12.5
5.1
19.6
13.6
10.8
12.0
17.1
7.9
2.3
p-value
<0.0001
0.1067
<0.0001
<0.0001
0.0006
0.2763
<0.0001
<0.0001
0.0015
<0.0001
0.3945
0.0448
0.4378
Note 1: Only centres with 585% ethnicity completeness.
Note 2:
DN
Others
Total
n
n
n
Other modalities
34
106
140
Patient transferred out
16
54
70
Treatment stopped
15
49
64
Patient declines RRT
1
1
2
Clinical decision not to offer RRT
0
1
1
Patient lost to follow up
2
1
3
Note 3:
Other modalities
37
121
158
Patient transferred out
29
91
120
Treatment stopped
6
26
32
Patient declines RRT
0
1
1
Patient lost to follow up
2
3
5
Note 4: Only centres with 575% referral completeness.
Note 5: Only centres with 580% comorbidity completeness.
Cardio vascular disease include any one of the following: cardiac disease, PVD, cerebrovascular disease.
Cardiac disease include any one of the following: angina, myocardial infarction at any time, angioplasty/vascular graft.
Peripheral vascular disease (PVD) include any one of the following: claudiation, ischaemic/neuropathic ulcer, angioplasty/vascular graft
(non-coronary), amputation.
CABG ¼ coronary artery bypass grafting or coronary angioplasty.
COPD ¼ chronic obstructive pulmonary disease.
Myocardial infarction included previous MI within the past 3 months and MI more than 3 months ago.
diabetics. There was evidence that patients with
diabetic nephropathy from socially deprived
areas were referred later than those from more
affluent areas, both in crude and age and
gender adjusted analyses (chi-sq p < 0.0001,
Mantel–Haenszel: p ¼ 0.0026).
Incident DN patients starting RRT are a
high-risk group. About half suffer from
manifest cardiovascular disease, although
malignancy was much less common. Smoking
was equally common in DN and other patients
(in about a fifth). When adjusted for age and
sex, there was a borderline association between
social deprivation and CVD (Mantel–Haenzel:
p ¼ 0.050). Another 270 patients (9.3%) with
other causes of ERF also had diabetes but are
not included with the DN patients in the
survival analyses that follow below; 55% of
these patients also had CVD. Renal impairment
has been recognised as an independent CVD
risk factor24 and CVD risk reduction and CVD
255
The UK Renal Registry
The Eighth Annual Report
Figure 16.1: Age and sex adjusted distributions of Townsend scores in incident diabetic nephropathy and
other White patients in England and Wales
management are important aspects of quality of
care15. More systematic management of CVD
risk factors, including more incentives to reduce
the high rate of smoking, is required.
DN patients were slightly more likely to
receive peritoneal dialysis and half as likely to
be transplanted in the first year of RRT in both
the full and White only cohorts, even having
adjusted for age and sex (each p < 0.001).
There is a low rate of transplantation in DN
patients, even after adjusting for ethnicity,
despite the fact that renal transplantation has
been shown to offer the best survival for
them25. Approaches to pre-emptive and speedy
transplant listing vary widely between renal
units26,27, and diabetic patients are not
uniformly targeted for transplantation: transplant outcomes are less good than in other
patients and many are unfit for major surgery,
especially due to CVD.
Survival on dialysis
Survival in first 90 days of RRT
Up to day 90, 1,532 died over 5,010 personyears. 1,125 patients who stopped treatment
within 3 months were censored of whom 21%
(n ¼ 235) had DN. Survival in the first 90 days
of RRT improved in recent years.
Even after adjustments for age, gender,
modality and deprivation, DN patients had
similar or better survival than others at 90 days
of RRT. The slight crude survival advantage
was due to confounding from earlier referral
256
and less malignancy at start of RRT (Table
16.2). In support of this, malignancies
accounted for a significantly higher proportion
of deaths in the first 90 days in non-DN
patients (9% vs 0%, p < 0.001).
Survival after 90 days of RRT
After 90 days, the Kaplan-Meier curves show
crude survival of patients with DN was lower
than other patients in all age groups (Figure
16.2). The estimated crude mortality rate in DN
was 19.3 deaths/100 person-years and in nondiabetics
13.3
deaths/100
person-years.
However the difference varied by age (p-value
for interaction: p < 0.0001). Although older
patients had a higher mortality, the difference
between DN patients and others was greatest in
the young with a tripling of crude hazard in
those less than 55 years. At one year after 90
days RRT, the proportion of 18–54 year old
DN patients surviving had already dropped to
90%, with only 56% alive at 5 years after
commencing RRT, compared with 96% and
85% respectively of others in the same age
group (log-rank p < 0.0001).
Survival after 90 days RRT was examined
with adjustment for social deprivation, late
referral and the presence of co-morbidities
(cardiovascular, peripheral vascular, smoking,
malignancy, chronic obstructive pulmonary
disease) (Tables 16.3 and 16.4). DN remained a
significant predictor of death with a doubling of
hazard for the age groups below 65 compared
to others on RRT, even when adjusted for all
known co-morbidities and time of referral. In
Chapter 16
Patients with Diabetic Nephropathy in Established Renal Failure
Table 16.2: Crude and adjusted effects of diabetic nephropathy on survival in the first 3 months after
initiation of RRT in the full cohort and the cohort restricted to White patients, with and without available
data on co-morbidity and referral (all adjusted for year of onset of RRT)
Effect of diabetic nephropathy on survival at 90 days
Full cohort
Crude
Adjusted for:
Age, gender, deprivation,
Age, gender, deprivation,
Age, gender, deprivation,
Age, gender, deprivation,
Restricted to White patients
Crude
Adjusted for:
Age, gender, deprivation,
Age, gender, deprivation,
Age, gender, deprivation,
Age, gender, deprivation,
modality
modality, co-morbidities
modality, referral
modality, co-morbidities, referral
modality
modality, co-morbidities
modality, referral
modality, co-morbidities, referral
HR
95% CI
p-value
0.70
0.61–0.81
<0.0001
0.86
1.05
0.99
1.44
0.74–0.99
0.79–1.40
0.75–1.30
0.93–2.23
0.0396
0.7349
0.9225
0.0996
0.69
0.56–0.86
0.0008
0.92
1.14
1.01
1.48
0.74–1.14
0.77–1.69
0.72–1.42
0.88–2.50
0.4475
0.5162
0.9581
0.1429
HR ¼ Hazard Ratio.
n ¼ 4,530.
n ¼ 5,777.
n ¼ 2,345.
contrast, in Whites above 65 years the effect of
DN seemed to be due to co-morbidities. Social
deprivation affected survival in White patients
with an estimated gender, age and modality
adjusted hazard ratio (HR) of 1.16 of the
highest versus the lowest quintile (95% CI:
1.03, 1.32; p ¼ 0.0125), which disappeared after
further adjustment for co-morbidities (HR 0.93;
95% CI: 0.74, 1.20; p ¼ 0.61). In all analyses,
adjustment for referral only increased the effect
of DN. This suggests DN has an even stronger
association with poor survival despite earlier
medical surveillance.
It remains unclear why young and middleaged patients with DN have such increased
mortality after adjusting for co-morbidity and
smoking at the start of RRT. It may be that
conventional cardiovascular interventions are
either less well applied or are less beneficial in
diabetics compared to non-diabetics28. Asymptomatic undetected coronary artery disease is
also more common in DN patients at the start
of RRT29.
The main limitation of these analyses is
incomplete data on co-morbidity. Data on
vascular access were lacking. However, as data
were only analysed from centres with a high
data return, and because of the consistency of
the findings across different subsets of the data,
the results appear robust.
Factors amenable to influence
Reliance is placed on intermediate variables
such as cholesterol, blood pressure and HbA1c
to indicate cardiovascular risk and the quality of
care. However, there is only limited knowledge
of their role on outcome in patients on HD
and PD. Current guidelines extrapolate from
findings from the general population and the
population with diabetes that are not yet needing RRT. There has been some recent evidence
that cholesterol and blood pressure measurements are inversely associated with mortality in
patients on HD and PD30,31. Similar observations were made by the UKRR in the 2003
Report19. These observations do not show cause
and effect, but describe the situation given the
limits of current dialysis practice: for example
they may reflect that fitter patients feel well and
eat more. Thus the following analyses must be
interpreted with this in mind, as the optimal
standards for HD and PD patients are not clear.
Blood pressure
Blood pressure was reported in 60% of patients
at the start of RRT, in 50% at 90 days and in
257
The UK Renal Registry
The Eighth Annual Report
Table 16.5. These are mostly clinically very
small differences, even if sometimes statistically
significant. URR is a little lower in DN
patients, possibly due to the difficulties in
establishing good vascular access. However
post-dialysis systolic blood pressure is considerably higher in diabetic nephropathy patients.
In view of the unclear effect of lowering BP
on survival in HD and PD, the implications of
relatively poor achievement of BP targets are
unknown.
Serum cholesterol
At the start of RRT, cholesterol was reported
in only 36% of HD patients, in 47% of PD
patients and in 44% of those who were
transplanted. The reporting of cholesterol for
incident dialysis patients has improved over the
years; current (2004) 90 day figures are 65% in
HD and 71% in PD patients. Data were less
complete at 12 months: HD 50%, PD 55%.
Cholesterol was reported in 65% of transplanted patients at 12 months.
In most instances, more diabetic nephropathy
patients than other patients had a cholesterol
level below 5 mmol/L. At the start of RRT the
figures for HD were 74% (overall 70%,
p ¼ 0.143), for PD 63% (overall 56%, p ¼ 0.002)
and for transplants 67% (overall 52%,
p ¼ 0.25). All the day 90 results and the 12
month HD results were similar, whereas the 12
month result for PD had fallen to 54% (overall
46%, p ¼ 0.001) and the transplant result to
42% (with no difference in DN patients).
HbA1c
Figure 16.2: Age-dependent survival of diabetic
nephropathy patients and others on RRT after
90 days
45% at 12 months. There was no difference
between DN patients and others. On average,
patients showed small decreases of blood
pressure from 90 days to 1 year of RRT, with
median values of 1 to 3 mmHg.
There are differences between patients with
DN and others established on dialysis in some
standard markers of good care, as shown in
258
HbA1c was not reported in 70% of both HD
and PD patients with DN at the start of RRT,
but the percentages of missing values decreased
from 1997 (95% and 88% missing values for
HD and PD respectively) to 2004 (64% missing
values for all HD and PD patients). HbA1c
values were reported for 11 of the 44 preemptively transplanted patients with DN. At 90
days, HbA1c data were reported on 46% of PD
and HD patients with similar figures at 12
months. From 1997 to 2004, there was a substantial improvement in reporting of HbA1c
values, from 23% of patients in 1997 to 62% of
patients in those who had started RRT in 2003.
Chapter 16
Patients with Diabetic Nephropathy in Established Renal Failure
Table 16.3: Crude and adjusted effects of diabetic nephropathy on survival in the full cohort with and without
available data on co-morbidity and referral (all adjusted for year of onset of RRT) stratified by age-category
Effect of diabetic nephropathy
On survival in 18–54 year old patients
Crude
Adjusted for:
Age, gender, deprivation, modality
Age, gender, deprivation, modality, co-morbidities
Age, gender, deprivation, modality, referral
Age, gender, deprivation, modality, co-morbidities, referral
On survival in 55–64 year old patients
Crude
Adjusted for
Age, gender, deprivation, modality
Age, gender, deprivation, modality, co-morbidities
Age, gender, deprivation, modality, referral
Age, gender, deprivation, modality, co-morbidities, referral
On survival in patients aged 65 years and above
Crude
Adjusted for:
Age, gender, deprivation, modality
Age, gender, deprivation, modality, co-morbidities
Age, gender, deprivation, modality, referral
Age, gender, deprivation, modality, co-morbidities, referral
HR
95% CI
p-value
3.27
2.85–3.75
<0.0001
2.91
1.87
3.30
2.03
2.54–3.35
1.32–2.65
2.57–4.23
1.17–3.50
<0.0001
0.0005
<0.0001
0.0112
1.91
1.68–2.17
<0.0001
1.83
1.74
1.98
1.70
1.61–2.09
1.30–2.33
1.56–2.50
1.10–2.62
<0.0001
0.0002
<0.0001
0.0160
1.20
1.10–1.31
<0.0001
1.30
1.15
1.38
1.21
1.19–1.42
0.94–1.40
1.16–1.64
0.90–1.61
<0.0001
0.1682
0.0002
0.1995
HR ¼ Hazard Ratio.
Table 16.4: Crude and adjusted effects of diabetic nephropathy on survival in the White cohort with and without
available data on co-morbidity and referral (all adjusted for year of onset of RRT) stratified by age-category
Effect of diabetic nephropathy
On survival in 18–54 year old patients
Crude
Adjusted for:
Age, gender, deprivation, modality
Age, gender, deprivation, modality, co-morbidities
Age, gender, deprivation, modality, referral
Age, gender, deprivation, modality, co-morbidities, referral
On survival in 55–64 year old patients
Crude
Adjusted for:
Age, gender, deprivation, modality
Age, gender, deprivation, modality, co-morbidities
Age, gender, deprivation, modality, referral
Age, gender, deprivation, modality, co-morbidities, referral
On survival in patients aged 65 years and above
Crude
Adjusted for:
Age, gender, deprivation, modality
Age, gender, deprivation, modality, co-morbidities
Age, gender, deprivation, modality, referral
Age, gender, deprivation, modality, co-morbidities, referral
HR
95% CI
p-value
3.54
2.92–4.28
<0.0001
3.23
2.67
3.58
2.61
2.66–3.91
1.75–4.07
2.69–4.75
1.39–4.93
<0.0001
<0.0001
<0.0001
0.0003
2.03
1.68–2.44
<0.0001
2.00
1.94
2.16
1.97
1.66–2.42
1.30–2.89
1.63–2.86
1.17–3.31
<0.0001
0.0011
<0.0001
0.0106
1.18
1.03–1.34
0.0135
1.26
1.03
1.36
1.02
1.11–1.44
0.78–1.35
1.11–1.67
0.71–1.46
0.0005
0.8466
0.0034
0.9018
HR ¼ Hazard Ratio.
259
The UK Renal Registry
The Eighth Annual Report
Table 16.5: Median values for some markers of quality of care in patients with DN and non DN
Median
DN
URR
Interquartile range
66.0
59.0
Number of patients
Number of patients
162.0
11.5
12.7
10.4
76.0
85.0
66.0
1,200
0.0334
85.0
6,337
135.0
153.0
<0.0001
12.6
11,895
5,137
119.0
0.3928
2.00
11,955
76.0
66.0
143.0
125.0
1.27
9,578
1,200
Systolic BP
Number of patients
84.0
1.60
2.00
11.6
10.4
75.0
65.0
Number of patients
Interquartile range
12.5
<0.0001
5,253
9,624
2,317
Diastolic BP
Interquartile range
1.27
11.4
10.3
68.0
1.61
1.95
p-value
73.0
4,215
2,331
Haemoglobin
Total
68.0
62.4
1.59
1.29
Number of patients
Interquartile range
70.0
1,038
Phosphate
Interquartile range
Non-DN
136.0
120.0
5,139
<0.0001
154.0
6,339
Where treatment is HD.
Post dialysis in HD patients.
At the start of RRT, the HbA1c value was
below 7.5% in 58% of HD patients, in 44% of
PD patients, and in 5 of the 11 pre-emptively
transplanted patients with available HbA1c
data. The 90 day figures were very similar but
at 1 year, the difference between HD and PD
patients was greater, with HbA1c below 7.5%
in 54% of HD patients and 31% of PD patients
with available data.
Conclusion
At the start of RRT most patients with DN
were White; all cohorts had significantly worse
long-term survival on RRT compared with
other patients. The observed differences in
survival were greatest in younger patients,
which was not fully explained by known comorbidity or social deprivation. Currently, the
value of these findings is considerably limited
by the poor reporting of co-morbidity, time of
referral, blood pressure, serum cholesterol and
HbA1c. It is hoped that improved data
submission to the UKRR will improve audit
and knowledge of the role of HbA1c, cholesterol and blood pressure targets in the survival
of these patients.
260
References
1. ERA–EDTA Registry. [http://www.era-edta-reg.org/
index.jsp]; last accessed on 28.04.2005.
2. US States Renal data system [http://www.usrds.org/];
last accessed on 28.04.2005.
3. Ritz E, Rychlic I, Locatelli F, Halimi S. End-stage
renal failure in type 2 diabetes: A medical catastrophe
of worldwide dimensions. Am J Kidney Dis
1999;34(5):795–808.
4. Zimmet P, Alberti KGMM, Shaw J. Global and
societal implications of the diabetes epidemic. Nature
2001;414:782–787.
5. Feest TG, Rajamahesh J, Byrne C, Ahmad A, Ansell
D, Burden R, Roderick PJ. Trends in adult renal
replacement therapy in the UK: 1982–2002. QJM.
2005;98(1):21–8.
6. Roderick PJ, Raleigh VS, Hallam L, Mallick NP. The
need and demand for renal replacement therapy in
ethnic minorities in England. J Epidemiol Community
Health. 1996;50(3):334–9.
7. Gansevoort RT, van der Heij B, Stegeman CA, de
Charro FT, Nieuwenhuizen MG, de Zeeuw D, de
Jong PE. Trends in the incidence of treated end-stage
renal failure in The Netherlands: hope for the future?
Kidney Int Suppl. 2004;(92):S7–10.
8. Ansell D, Feest T, UK Renal Registry Report 2004,
[www.renalreg.com/], last accessed on 28.08.2005.
9. Chandna SM, Schulz J, Lawrence C, Greenwood RN,
Farrington K. Is there a rationale for rationing
chronic dialysis? A hospital based cohort study of
factors affecting survival and morbidity. BMJ. 1999;
318:217–23.
Chapter 16
Patients with Diabetic Nephropathy in Established Renal Failure
10. Lok CE, Oliver MJ, Rothwell DM, Hux JE. The
growing volume of diabetes related dialysis: a population based study. Nephrol Dial Transplant 2004;19:
3098–3103.
11. Chaturvedi N, Jarrett J, Shipley MJ, Fuller JH.
Socioeconomic gradient in morbidity and mortality
in people with diabetes: cohort study findings from
the Whitehall Study and the WHO Multinational
Study of Vascular Disease in Diabetes. BMJ. 1998;
316:100–5.
12. Van Dijk PC, Jager KJ, Stengel B, Gronhagen-Riska
C, Feest TG, Briggs JD. Renal replacement therapy
for diabetic end-stage renal disease: data from 10
registries in Europe (1999–2000). Kidney Int 2005;67:
1489–99.
13. Elinder CG, Jones E, Briggs JD, Mehls O, Mendel S,
Piccoli G, Rigden SPA, Pinto dos Santos J, Simpson
K, Tsakiris D, Vanrenterghem Y. Improved survival
in renal replacement therapy in Europe between 1975
and 1992. An ERA–EDTA Registry Study. Nephrol
Dial Transplant 1999;14:2351–2356.
14. Department of Health: National Service Framework
for Diabetes: Delivery Strategy, 2003.
15. Department of Health Renal Team. The National
Service Framework for Renal Services. Part 1:
Dialysis and Transplantation, 2004.
16. Department of Health: Tackling health inequalities.
A Programme for Action. [http://www.dh.gov.uk/
assetRoot/04/01/93/62/04019362.pdf;2003];
last
accessed on 12.11.2005.
17. Goyder EC, McNally PG, Botha JL. Inequalities in
access to diabetes care: evidence from a historical
cohort study. Qual Health Care. 2000;9(2):85–9.
18. Townsend P, Phillimore P, & Beattie A. Health and
deprivation: Inequalities in the North. London:
Croom Helm, 1988.
19. Ansell D, Feest T. UK Renal Registry Report 2003,
[www.renalreg.com/], last accessed on 1.03.2006.
20. Bhopal R, Hayes L, White M, Unwin N, Harland J,
Ayis S, Alberti G. Ethnic and socio-economic
inequalities in coronary heart disease, diabetes and
risk factors in Europeans and South Asians. J Public
Health Med. 2002;24(2):95–105.
21. Evans JM, Newton RW, Ruta DA, MacDonald TM,
Stevenson RJ, Morris AD. Frequency of blood
glucose monitoring in relation to glycaemic control:
observational study with diabetes database. BMJ.
1999;319(7202):83–6.
22. Hippisley-Cox J, Pringle M. Prevalence, care, and outcomes for patients with diet-controlled diabetes in
general practice: cross-sectional survey. Lancet 2004;
363:423–8.
23. Wills CJ, Scott A, Swift PWG, Davies MJ, Mackie
ADR, Mansell P. Retrospective review of care and
outcomes in young patients with type 1 diabetes. BMJ
2003;327:260–1.
24. Sarnak MJ, Levey AS, Schoolwerth AC, Coresh J,
Culleton B, Hamm LL, McCullough PA, Kasiske BL,
Kelepouris E, Klag MJ, Parfrey P, Pfeffer M, Raij L,
Spinosa DJ, Wilson PW. Kidney disease as a risk factor
for development of cardiovascular disease: a statement
from the American Heart Association Councils on
Kidney in Cardiovascular Disease, High Blood Pressure
Research, Clinical Cardiology, and Epidemiology and
Prevention. Circulation 2003;108:2154–2169.
25. Locatelli F, Pozzoni P, Del Vecchio L. Renal
replacement therapy in patients with diabetes and
end-stage renal disease. J Am Soc Nephrol 2004;15
Suppl 1:S25–9.
26. Oniscu GC, Schalkwijk AAH, Johnson RJJ, Brown
H, Forsythe JLR. Equity of access to renal transplant
waiting list and renal transplantation in Scotland:
cohort study. BMJ 2003;1261–5.
27. Ansell D, Feest T, UK Renal Registry Report 2001,
Chapter 10: Listing for Renal Transplantation
[www.renalreg.com/], last accessed on 28.08.2005
28. Wilson SR, Vakili BA, Sherman W, Sanborn TA,
Brown DL. Effect of diabetes on long-term mortality
following contemporary percutaneous coronary intervention: analysis of 4284 cases. Diabetes Care 2004;
27(5):1137–42.
29. Ohtake T, Kobayashi S, Moriya H, Negishi K,
Okamoto K, Maesato K, Saito S. High prevalence of
occult coronary artery stenosis in patients with
chronic kidney disease at the initiation of renal
replacement therapy: An angiographic examination. J
Am Soc Nephrol 2005;16:1141–8.
30. Kalantar-Zadeh K, Abbott KC, Salahudeen AK,
Kilpatrick RD, Horwich TB. Survival advantages of
obesity in dialysis patients. Am J Clin Nutr. 2005;
81(3):543–54.
31. Kalantar-Zadeh K, Kilpatrick RD, McAllister CJ,
Greenland S, Kopple JD. Reverse epidemiology of
hypertension and cardiovascular death in the hemodialysis population: the 58th annual fall conference
and scientific sessions. Hypertension. 2005;45(4):811–7.
261


© Copyright 2026