
The Impact of Tuition Increases on Enrollment at Public Colleges
Educational Evaluation and Policy Analysis
December
Fall XXXX,
2011,Vol.
Vol.XX,
33, No.
No. X,
4, pp. 435–457
215–229
DOI: 10.3102/0162373711415261
© 2011 AERA. http://eepa.aera.net
The Impact of Tuition Increases on Enrollment
at Public Colleges and Universities
Steven W. Hemelt
Cornell College
Dave E. Marcotte
University of Maryland, Baltimore County
In this paper we review recent increases in tuition at public institutions and estimate impacts on
enrollment. We use data on all U.S. public 4-year colleges and universities from 1991 to 2006 and
illustrate that tuition increased dramatically beginning in the early part of this decade. We examine
impacts of such increases on total enrollment and credit hours, and estimate differences by type of
institution. We estimate that the average tuition and fee elasticity of total headcount is -0.0958. At
the mean, a $100 increase in tuition and fees would lead to a decline in enrollment of about 0.25
percent, with larger effects at Research I universities. We find limited evidence that especially large
tuition increases elicit disproportionate enrollment responses.
Keywords: tuition, costs, postsecondary enrollment, public higher education
In the summer of 2009, with its budget a shambles,
the state of California cut support for the
University of California system by 20%, or over
$800 million (O’Leary, 2009). The allocation to
the California State University system suffered
a similar cut of 20% (Gordon, Holland, &
Landsberg, 2009). Faced with this sharp decline,
the University of California Board of Regents
approved a tuition and fee increase of more than
32%, setting off a storm of protests on campuses
throughout the system (Lewin & Cathcart,
2009). Although California’s situation is severe,
it is hardly unique. With economic conditions
weak and financial pressures on state budgets
growing, the New York Times reported that the
need to offset these declines by raising college
tuition was building rapidly (Lewin, 2008). This
upward pressure on tuition in public higher
education is not new, and neither is the declining
general revenue support by state government
(Johnstone, 2004; Koshal & Koshal, 2000;
Rizzo & Ehrenberg, 2003). In the case of
California, in 1990, the state appropriation to
the University of California system amounted to
$16,430 per student, compared with $7,570 in
the most recent year (Friend, 2010, p. 24).
As fiscal pressures have mounted, college
and university administrators and their governing
boards have been forced to offset declines in
nontuition sources of revenue. Naturally, they face
We are grateful to Tim Brennan, Mark Duggan, Doug Lamdin; seminar participants at the University of Maryland, Baltimore
County, the American Education Finance Association (2008) meetings in Denver, and the American Economic Association
(2010) meetings in Atlanta; as well as three anonymous referees for helpful comments and suggestions. Of course, any errors
and all opinions are our own.
435
Downloaded from http://eepa.aera.net at VIRGINIA COMMONWEALTH UNIV on March 31, 2015
Hemelt and Marcotte
substantial pressure to increase tuition. The faculty
representative to the University of California
regents characterized this pressure as follows:
“The legislators have told us, essentially, ‘The
student is your A.T.M. They’re how you should
balance the budget’” (Friend, 2010, p. 24).
Although administrators and analysts are aware,
at least at some level, that demand schedules
are downward sloping, the implicit assumption
among many higher education administrators
seems to be that tuition elasticity of enrollment
is tolerably small, so that any enrollment decline
will be small enough that net revenues will rise
with the higher tuition. More generally, an important
concern is whether rising prices are making higher
education less affordable.
In this article, we examine the impact on
enrollment of rising tuition at public colleges and
universities. Our first objective is to update estimates of the price sensitivity of enrollment in
public education. Much of what we know about
enrollment response to tuition increases comes
from data collected in the 1980s, an era predating
the recent run-up in tuition and fees. Using data
from the Integrated Postsecondary Education
Data System (IPEDS) on all 4-year public institutions from 1991 to 2006, we estimate the relationship between tuition increases and enrollment. We
examine the impact of price changes on several
measures of enrollment: total headcount, total
number of credits taken, and the number of firsttime, full-time (FTFT) freshman. As we describe
below, the first of these measures is likely to be
the slowest to respond but is clearly an important
measure of demand for any institution.
The data we use constitute an institution-level
panel and permit us to measure enrollment, tuition
and fees, and student aid for all public 4-year colleges and universities. In addition, we can measure the size of the cohort of high school graduates within a state and the tuition and fees charged
at all other 2- and 4-year colleges within the state.
The identifying assumptions for our models
are that tuition increases are largely exogenous
(at least at the institution level) and that schools
have limited power to affect enrollment by modifying admissions decisions when adopting tuition
increases. As we discuss in this article, both of
these assumptions appear to hold. For example,
a large portion of the within-state variation in
tuition and fees is common across institutions,
and we find no evidence that an institution’s
admissions decisions are related to tuition and
fee changes.
A second objective derives from an important
aspect of intertemporal patterns of tuition at public institutions. Although tuition levels can vary
substantially across institutions within a state, as
we illustrate below, tuition patterns over time
are quite similar across institutions within states.
Although tuition may be rising in similar ways
across various public institutions, the markets they
serve can be quite dissimilar. Public institutions
are diverse, with different missions and students.
As an example, though in the same state, the
University of Michigan in Ann Arbor and Lake
Superior State University differ along many
dimensions important for understanding comparative statics of price changes.1 Because of
variety in the education and experience colleges
and universities provide students, and because
of differences in the financial resources of the
average student across institutions, enrollment
responses to price fluctuations may vary. So, one
of our goals is to assess the degree to which the
impact of tuition increases on enrollment varies
at different types of institutions.
Finally, we examine the impacts of exceptionally large tuition increases on enrollment. Recent
declines in nontuition revenue have forced administrators at public colleges and universities to
adopt unusually large tuition increases. To give
some sense of the magnitude of the tuition
increases recently implemented across the country, during the early part of the decade, as states
grappled with fiscal crises, the University of
Arizona increased real tuition from $2,906 to
$3,948 for a full-time in-state student in 2003.
The same year, the University of Massachusetts–
Lowell increased tuition from $5,842 to $8,040.
Changes such as these not only raise public
awareness of the rising cost of higher education
but also make more important the task of updating estimates of enrollment impacts. One question we address is whether large, abrupt changes
in tuition such as these have disproportionately
large effects on enrollment.
In the next section, we briefly summarize
recent work on the relationship between tuition
costs and enrollment in higher education in the
United States and summarize recent trends in
tuition. We then describe our empirical objectives
436
Downloaded from http://eepa.aera.net at VIRGINIA COMMONWEALTH UNIV on March 31, 2015
Impact of Tuition Increases on Enrollment
and estimation strategy, along with the IPEDS
data we use. We then turn to our examination
of patterns of tuition and enrollment at 4-year
public colleges and universities during the past two
decades. We not only focus on average impacts and
basic revenue implications but also explore the
degree to which student response differs across
types of public institutions. We also examine
enrollment changes following exceptionally large
tuition increases that have typified price changes
in the most recent decade. Finally, we consider evidence relevant to understanding what information
these enrollment changes provide about the tuition
elasticity for demand.
Background
Price Response Literature
in Higher Education
Economists and other analysts have long been
interested in understanding the demand for higher
education. Examples of such work include studies
focused on quantifying price elasticities for various student populations, estimating student sensitivity to changes in financial aid packages, or constructing university-specific demand functions.
Much of the early work on the demand for
higher education was reviewed by Jackson and
Weathersby (1975). Using the parameters estimated in a number of studies, they concluded that
the net behavioral response to changes in tuition
is modest: a decrease of between 0.05% and
1.46% in enrollment ratio per each $100 increase
(in 1974 dollars) in student cost. Additionally,
they found the absolute magnitude of price
responsiveness to decrease with increasing
income. In a meta-analysis of studies completed
between 1967 and 1982, Leslie and Brinkman
(1987) concluded a $100 tuition price (in 1982
dollars) increase to be associated with a 0.6 to 0.8
percentage point decline in college enrollments.
Heller (1997) provided an update to Leslie
and Brinkman (1987). He concluded that a $100
increase results in a 0.5% to 1.0% decline in
enrollments. But he pointed out that the empirical
work he examined used data from the 1970s and
1980s, so the effect might not generalize to the
higher tuition levels at the time of his analysis
(p. 650). A decade after Heller’s analysis, tuition
has climbed higher still.
Although much of the initial work on enrollment responses to tuition consisted of institutional demand studies, several studies examined
national-level data. For example, Kane (1994a)
and St. John (1990) used the High School and
Beyond data (which followed a sample of students who were high school sophomores and
seniors in 1980) and estimated that enrollments fell by approximately 0.5% to 1% with
a $100 increase in tuition. Rouse (1994) used
data from the National Longitudinal Survey
of Youth, a cohort contemporary to the High
School and Beyond students, and found that an
8% increase in tuition resulted in a decline in
enrollments of between 0.67% and 1%. Using
pooled cross-sections of the October Current
Population Survey from 1973 to 1988, Kane
(1994b) found a $1,000 increase in the net direct
costs of college to be associated with a 5 percentage point decline in the likelihood of attending
college. Most relevant to our empirical work,
Heller (1996) and Kane (1995) used data from
the IPEDS for the 1980s and early 1990s. In both
cases, they found that a $100 increase in tuition at
4-year institutions resulted in a decline in enrollments of just under 0.5%.
Many other studies have exploited changes
in financial aid packages or laws to estimate the
enrollment impact of the costs of higher education. For example, Kane (2003) examined the
Cal Grant aid program in California using data
from 1998 and 1999. He found that applicants to
the financial aid program were 3 to 4 percentage
points more likely to enroll in college. Dynarski
also examined evidence from both the HOPE
scholarship program in Georgia (Dynarski, 2000)
and the elimination of the Social Security Student
Benefit Program in 1982 (Dynarski, 2003). In
both studies, she found each $1,000 increase in
aid to be associated with an increase in the college
attendance rate of about 4 percentage points.2
One recent study examined enrollment effects
specifically at public universities and colleges.
Shin and Milton (2006) used IPEDS data on
FTFT fall enrollments and in-state tuition levels
from 1998 to 2002 to estimate the impacts of
tuition increases on enrollment growth. They concluded that enrollment changes were not affected
by changes in tuition or financial aid over this
time period (p. 234). Yet because of missing outcome data, Shin and Milton could analyze only
437
Downloaded from http://eepa.aera.net at VIRGINIA COMMONWEALTH UNIV on March 31, 2015
300
250
200
150
Costs (1991 = 100)
100
1990
1995
2000
2005
Year
Research I
Comprehensive
CPI-U
Research II
Liberal Arts
FIGURE 1. Tuition costs at public universities and colleges.
5
0
Percentage
10
Source: Data for the Consumer Price Index for all urban consumers (CPI-U) are from the Bureau of Labor Statistics.
Note: Tuition prices are enrollment weighted.
–20
–10
0
10
20
30
Annual Change in Real Tuition
FIGURE 2. Distribution of year-to-year changes in real tuition, 1991 to 2006.
3 years of data. This leaves little identifying information on changes in enrollments and tuition
costs within institutions over time. Furthermore,
some of the largest average year-to-year changes
in tuition price occurred after the end of Shin and
Milton’s (2006) panel.
Recent Trends in Tuition Costs
at Public Colleges and Universities
With the exception of Shin and Milton’s (2006)
analysis, these previous studies have all used data
from about a decade or more ago. In the meantime, tuition has continued to rise, and by a lot.
Using data from IPEDS and the U.S. Bureau of
Labor Statistics, Figure 1 shows the increase in
nominal tuition costs from 1991 to 2006 compared with the increase in the inflation rate, as
measured by the Consumer Price Index (CPI).3
Clearly, tuition costs are rising substantially,
and the rate of increase accelerated recently.
Additionally, tuition rose at comparable rates
at research-intensive universities, comprehensive universities, and liberal arts colleges.
438
Downloaded from http://eepa.aera.net at VIRGINIA COMMONWEALTH UNIV on March 31, 2015
300
400
Texas
100
200
Costs (1991 = 100)
200
150
100
Costs (1991 = 100)
250
California
1990
1995
Year
2000
Research I
1990
2005
Costs (1991 = 100)
Research I
2005
Research II
2000
2005
Research II
Comprehensive
Florida
100 110 120 130 140 150
160 180
120 140
Costs (1991 = 100)
100
Year
2000
Comprehensive
New York
1995
Year
Research I
Research II
Comprehensive
1990
1995
1990
1995
Year
Research I
2000
2005
Research II
Comprehensive
FIGURE 3. Trends in tuition costs in selected states, by institution type, 1991 to 2006.
The time series of average tuition in Figure 1
does not illustrate two important stylized facts
about recent changes in tuition relevant to our
work. First, the distribution of year-to-year real
tuition increases is positively skewed. The mean
annual increase in real tuition during the period
we study was 4.2%. But a number of institutions implemented much larger real year-to-year
increases. In Figure 2, we present the frequency
distribution of real year-to-year tuition increases
for all public 4-year colleges and universities
from 1991–1992 to 2006–2007. Although many
of these year-to-year increases are in the neighborhood of 4% or 5%, a considerable number
are above 10%, 15%, and even 20%.
The second important fact about recent changes
in public higher education costs is that although
there are markedly different intertemporal changes
in tuition across states, within states, trends in
tuition are generally similar across the various
types of 4-year institutions. So, although Figure 1
illustrates that at the national level, patterns of
average changes in tuition are similar for various
types of institutions, we find the same thing
within states. We illustrate this in Figure 3, which
shows the time series of real tuition (indexed to
1991) at public Research I, Research II, and comprehensive universities in the four most populous
states in the United States. Generally, tuition
increases across public 4-year institutions are
very similar within states. This is to be expected,
because states typically govern public colleges
and universities through multicampus systems
and have established higher education coordinating boards for the purposes of advancing
general policy objectives across campuses. On
average, we find that about 68% of the withinstate variation in tuition costs is common across
institutions.4
Identifying the Elasticity of Demand
Our objective is to understand how these recent
tuition increases affect demand for education
at public 4-year colleges and universities. As
with any good or service, price increases such
439
Downloaded from http://eepa.aera.net at VIRGINIA COMMONWEALTH UNIV on March 31, 2015
–.04 –.02
0
.02
.04
.06
De-trended logged appropriations
150
Frequency/Count
50
100
0
1990
1995
# of hikes ≥ 15%
Year
2000
2005
Logged Real SA
FIGURE 4. Temporal distribution of large tuition hikes versus logged real state appropriations (SA).
Note: State appropriations are available only through the 2005–2006 academic year.
as these could arise because supply has shifted
due to suppliers leaving the market. But we
find no evidence of this: The number of public
4-year institutions has increased modestly over
the past decade, from 622 in 1997 to 638 in
2006 (National Center for Education Statistics, 2008). Contemporaneous to this modest
change was a large change in total enrollment:
Between 1995 and 2005, total enrollment at public 4-year postsecondary institutions grew by
slightly more than 1 million students (National
Center for Education Statistics, 2005a). In any
case, because we focus on 4-year public institutions, it is important to recognize that the processes that set prices here do not necessarily
adhere to market principles. In previous studies,
researchers have found that much of the withininstitution variation in tuition at public universities appears to be driven by fluctuation in state
appropriations (Koshal & Koshal, 2000; Rizzo &
Ehrenberg, 2003). Furthermore, Lowry (2001a,
2001b) presented empirical evidence that factors
determining fluctuation in state appropriations
are exogenous to the process shaping enrollment
demand.
Evidence from the IPEDS, too, suggests that
state appropriations drive pricing decisions at
4-year institutions. As an illustration, consider
again the large tuition increases in the upper tail
of Figure 2. In Figure 4, we present a frequency
distribution of the number of tuition hikes of
15% or more at public 4-year institutions over
the course of our panel. Superimposed on this dis-
tribution is a time series of the mean of detrended
logged real state appropriations received by these
institutions in each year, net of institution fixed
effects. If the average institution’s revenue growth
followed the national trend, this line would be flat,
at zero. In years when institutions receive real
appropriations in excess of their normal appropriations (detrended), the series is positive. In
bad years (lower appropriations than typical),
the series is negative. Clearly, real state appropriations were about 4% below typical levels in
the early part of this decade, when most of the
large year-to-year tuition hikes occurred. During
the late 1990s, when appropriations were relatively high, there were few large tuition increases.
Our reading of these patterns is that large tuition
increases at public colleges and universities track
changes in state appropriations.
One interpretation of the substantial relationship between state appropriations and tuition is
that at the institution level, administrators are
highly constrained in their ability to set tuition.
As such, a good bit of the variation in an institution’s tuition can be treated as exogenous, so
subsequent relationships between tuition and
enrollment can provide information about demand
elasticity. In practice, however, the collective
research on the tuition price and enrollment
relationship has done little to model the simultaneous relationship between the two.5 Rather, researchers have focused on using variation in tuition
prices, conditioning on demographic controls
such as the number of high school graduates, as
440
Downloaded from http://eepa.aera.net at VIRGINIA COMMONWEALTH UNIV on March 31, 2015
Impact of Tuition Increases on Enrollment
well as institution effects and year controls. We
adopt a similar strategy here to limit the possibility that the observed tuition enrollment relationship is due to shifts in supply of potential college students.
There is some evidence on shifts in the aggregate supply of college students to the labor market over long periods. For example, Bound and
Turner (2006) provided evidence that over the
past half century, large cohorts of college-age
students faced higher net costs and subsequently
lower rates of undergraduate degree attainment.
We focus here on a much shorter period, for
which these demographic shifts can have a limited role, if any. Within our shorter period, if
states where costs of higher education were rising faster also saw above-average growth in the
size of the college-age population, this could
lead us to understate the impact of price changes
on enrollment. On the other hand, if these states
saw the smallest changes in the number of young
persons, we might overstate the demand response
to price increase. To explore the direction of any
potential bias in our own data, we calculated
mean changes in the size of the graduating high
school cohorts for states and years in the top and
bottom quartiles of the distribution of year-toyear tuition changes. We found no statistically significant difference in the growth of the
number of high school graduates between
states with the fastest growing tuition costs and
those with the slowest growing costs. Furthermore, to limit these concerns, all our empirical
models include year fixed effects. To the extent
that there were important shifts in the number of
persons of college age, or applying for college,
within our panel, these year effects will pick up
any common effects on enrollment demand.
More important for estimating demand elasticity
are matters of model specification that control for
quality differences, income, labor market conditions, and prices of substitutes.
Methods
To investigate student response to tuition
increases at U.S. public universities, we use IPEDS
data from 1991–1992 to 2006–2007. The IPEDS
is an institution-level data set, and we use data on
all reporting 4-year public institutions across the
entire United States. We focus on 4-year public
universities because the vast majority of students
at 4-year colleges and universities attend public
institutions. In 2003–2004, public universities
enrolled 69% of all undergraduate students enrolled
at 4-year institutions (National Center for Education Statistics, 2005b). Furthermore, as a matter of
public policy, demand functions at public institutions are of primary concern.
IPEDS is the main postsecondary education
collection program from the National Center for
Education Statistics. It is a system of survey components designed to collect data from all organizations whose primary purpose is to provide
postsecondary education. IPEDS contains a compilation of institution-level data on enrollment,
program completion, faculty size and salaries,
staff, institutional prices, and other institutional
characteristics (National Center for Education
Statistics, n.d.). IPEDS provides three different
yearly measures of enrollment: total undergraduate unduplicated headcount, total undergraduate credit hours, and the total number of FTFT
undergraduates in the entering cohort. Although
the first two measures are available for the majority of our panel, the FTFT measure is available
only from 1999–2000 to 2006–2007.
The Bureau of Labor Statistics reports on
many key national and regional economic indicators. We use yearly state unemployment rate statistics from the Bureau of Labor Statistics, personal income measures by state from the U.S.
Bureau of Economic Analysis, and data on state
populations from the U.S. Census Bureau. We
also use data on the number of public high school
graduates by state and year from the Digest of
Education Statistics, published by the National
Center for Education Statistics. For clarity, we
provide additional information in the Appendix
on the specific source, name, and availability of
each of our main variables.
For our panel, we estimate log-log models of
the following general type:
ln(ENit) = a + bTln(Tit) + bAln(Aidit)
+ bHSln(HSgradsst) + bCPln(CPst) + bIln(Incst) + bUln(Unst) + ai + at + eit.
(1)
We use log-log specifications for ease of interpretation and because of improved model fit, where
ENit is a measure of enrollment at institution i in
academic year t. We use the three different measures of enrollment described above. Because
students can adjust credit hours and freshman
441
Downloaded from http://eepa.aera.net at VIRGINIA COMMONWEALTH UNIV on March 31, 2015
Hemelt and Marcotte
enrollment more readily at the margin, we anticipate total headcount to be the least responsive to
price changes.6
The key independent variable is Tit, a measure
of in-state tuition and fees charged to full-time
students attending institution i in year t.7 Aidit is a
vector of two measures: total Pell Grant dollars
disbursed or otherwise made available to recipients
by the institution and the total gross amount of
scholarships and fellowships awarded. Student
aid is an important mechanism for reducing the
real price of postsecondary education. Among
full-time students attending 4-year public institutions, about 76% reported receiving some kind
of financial aid during the 2003–2004 academic
year (National Center for Education Statistics,
2006).8 Furthermore, the proportion of full-time
students using institutional aid increased from
17% in 1992–1993 to about 23% in 1999–2000.
Over this same period, the average amount of aid
received by these students increased (in constant
1999 dollars) from $2,200 to $2,700 (Horn &
Peter, 2003). Indeed, public institutions faced
with implementing large tuition increases might
attempt to offset those costs by making larger
financial aid offers or better facilitating the ability of students to apply for federal aid or subsidized loans (Marklein, 2002).9 We include a
number of controls to capture institution- and
state-level factors that affect enrollment for a
given institution and over time. HSgradsst is a
measure of the number of public high school
graduates in state s in academic year t. CPst is a
vector of competitors’ prices, including average
community college tuition and fees and average
4-year private university tuition and fees, in state
s in year t. Incst and Ust are measures of average
per capita income and the unemployment rate for
state s in year t, respectively. We include these to
control for economic and social conditions that
could potentially affect both enrollment numbers
as well as the opportunity costs students face.
We include institution-specific fixed effects
(ai) and year effects (at). By including institution
fixed effects, we use within-institution variation
over time in tuition and fees to estimate enrollment effects, net of common year effects. To
account for the possibility of serial correlation in
the error term, we cluster standard errors at the
institution level.10
To this basic setup, we carry out two main
extensions. First, we estimate this general model
separately by Carnegie classification of institution (Carnegie Foundation for the Advancement of Teaching, 2006). The strategy to identify
effects of tuition changes on enrollment described
above will provide the average within-institution
effect for a group of heterogeneous institutions:
large research-intensive and doctoral-granting
universities, comprehensive teaching universities,
and small liberal arts colleges. Large researchintensive universities are classified by Carnegie as
Research I or Research II institutions. Research I
universities include the University of Wisconsin–
Madison, Florida State University, and Stony
Brook University. Research II universities include
Wichita State University, East Carolina University, and The College of William & Mary. Comprehensive institutions grant fewer doctorate
degrees but at least 50 master’s degrees. Liberal arts colleges primarily grant undergraduate
degrees. For example, the University of Michigan–
Flint, San Jose State University, and Montclair State
University are comprehensive universities, while
Evergreen State College, St. Mary’s College of
Maryland, and the University of Minnesota–
Morris are liberal arts colleges.
Not only do these institutions vary in size and
mission, but their students may vary in their sensitivity to price changes. Furthermore, the importance of tuition as a source of revenue varies by
institution type (National Center for Education
Statistics, 2005c). Hence, the ability to provide
learning, campus activities, or services to students may be more sensitive to fluctuations in
tuition revenue at comprehensive universities
and liberal arts colleges than at research-intensive
universities.
Second, we examine whether enrollment following especially large year-to-year tuition hikes
falls, over and above the enrollment response
resulting from the tuition increase itself. Especially large tuition increases from one year to the
next might elicit a response from students, over
and above a scaled-up response to a more modest
tuition increase. Students may view large tuition
hikes as unfair, out of line with previously established norms, or even violating an implicit contract once enrolled. Large tuition hikes may also
signal that a school is performing and planning
442
Downloaded from http://eepa.aera.net at VIRGINIA COMMONWEALTH UNIV on March 31, 2015
TABLE 1
Descriptive Statistics
Variable
n
Costs
In-state tuition and fees
Out-of-state tuition and fees
Average community college tuition and fees
Average 4-year private college tuition and fees
Total scholarships and fellowships (× $1,000)
Total Pell Grants (× $1,000)
Outcomes
12-month unduplicated headcount (enrollment)
Total undergraduate credit hours
Total FTFT freshman enrollment (cohort)
FTFT freshman enrollment (in state)
FTFT freshman enrollment (out of state)
Percentage FTFT in state
Percentage FTFT out of state
Other controls
Average per capita income, by state
Annual state unemployment rate
State population
Number of high school graduates, by state
Mean
SD
7,075
7,029
7,075
7,075
7,075
7,075
4,209.69
10,845.35
2,036.19
16,507.81
20,500.00
6,319.30
1,668.29
3,622.05
852.14
4,241.29
25,500.00
5,222.99
7,075
7,075
3,831
3,831
3,831
3,831
3,831
10,714.98
261,076
1,556.67
1,305.20
251.45
82.07
15.55
8,496.81
342,050
1,357.22
1,129.67
386.54
17.36
13.83
7,075
7,075
7,075
7,075
32,312.83
5.13
9,276,186
84,642.65
4,888.09
1.25
8,463,302
79,162.42
Note: FTFT = first-time, full-time. All monetary values are expressed in 2006 dollars. The analytical sample includes a total of
557 institutions.
poorly or is in dire financial straits, or they may
act as an indication of price changes to come.
Or very large year-to-year tuition increases may
have disproportionately large enrollment effects
because families planning and saving for college
may not be able to adjust long-term financial planning to accommodate abrupt price changes.11
To examine if large tuition increases have
proportionately more impact on enrollment than
small hikes, we modify the specification of our
empirical model. In the augmented model,
described in Equation 2, in addition to the contemporaneous direct measure of tuition and fees,
we include a separate vector of dummies defined
around a large hike in tuition at institution i (Hikeit)
between year t – 1 and year t. If large hikes have
proportionately no more impact on enrollment
than smaller tuition increases, bT will capture the
entire impact of the tuition increase. But if large
hikes elicit an enrollment response more than
proportionate to their size, we expect bH < 0.
ln(ENit) = a + bTln(Tit) + bHHikeit + bAln(Aidit)
+ bHSln(HSgradsst) + bCPln(CPst) + bIln(Incst) (2)
+ bUln(Unst) + ai + at + eit.
We explore various thresholds for determining
what constitutes a large hike. But the basic idea is
that we include an indicator equal to 1 if institution i increased tuition between year t – 1 and
year t in excess of some threshold (e.g., 10%,
15%, or 20%). Because students often enroll at
an institution as freshmen with the intention of
graduating from that institution, those already
enrolled at the time of large increases may be
less responsive to tuition hikes than prospective
students. To see if the full effect of large tuition
hikes develops over a few years, we include
lags of the main hike dummy variables to capture the enrollment effect in years following large
tuition hikes.
Results
Descriptive Statistics
We begin by considering descriptive statistics
on enrollments, tuition rates, school-level characteristics, and state-level characteristics for our
sample, presented in Table 1. Over the course of
the panel, the average annual cost of in-state
443
Downloaded from http://eepa.aera.net at VIRGINIA COMMONWEALTH UNIV on March 31, 2015
TABLE 2
Enrollment Effects of Tuition Increases: Full Sample
Variable
Log tuition and fees (in state)
Log average private 4-year tuition and fees
Log average community college tuition and fees
Log average per capita income
Log number of high school graduates
Log unemployment rate
Log total scholarships and fellowships
Log total Pell Grant dollars
Observations
R2
Log headcount
Log credit hours
Log FTFT
–0.0958
(0.0312)***
0.0091
(0.0326)
0.0093
(0.0280)
0.3223
(0.1640)**
0.3221
(0.0664)***
0.0015
(0.0248)
0.0584
(0.0160)***
0.2286
(0.0416)***
7,075
.9825
–0.1089
(0.0339)***
0.0335
(0.0437)
0.0002
(0.0342)
0.2164
(0.1849)
0.4096
(0.0684)***
–0.0164
(0.0294)
0.0732
(0.0189)***
0.2419
(0.0393)***
7,188
.9674
–0.1147
(0.0964)
0.1376
(0.1162)
0.0391
(0.0676)
0.0470
(0.4599)
0.5740
(0.1473)***
0.0547
(0.0622)
0.0993
(0.0342)***
0.2881
(0.0719)***
3,831
.9301
Note: FTFT = first-time, full-time. Values in parentheses are robust standard errors. All models also include institution and year
effects.
**Significant at 5%. ***Significant at 1%.
tuition and fees at 4-year public institutions was
slightly under $4,200 (measured in 2006 dollars). Yet there is large variation in public university tuition levels, ranging mostly between $1,400
and $11,000. Not surprisingly, the cost of tuition
at public 4-year colleges and universities is
between those at community colleges ($2,000)
and 4-year private universities ($16,500). Fouryear public institutions of higher education also
vary widely in their enrollment numbers over
the course of the panel, with a mean 12-month
unduplicated headcount of 10,700 (ranging from
400 to over 40,000 students).
Multivariate Results
To more fully consider the relationship between
tuition increases and enrollment, we present results
from our first set of empirical models in Table 2.
The columns present the results of our basic
specification on each of the three measures of
enrollment described above. In columns 1, 2, and
3, respectively, we present estimates of the effect
of tuition on total enrollment, total credit hours,
and enrollment of FTFT freshmen. All of these
models include controls for state characteristics,
institution fixed effects, and year effects.
We estimate that the average tuition and fee
elasticity of total headcount is –0.0958. Evaluated at the means (approximately $4,200 tuition
and enrollment of 10,700), a $100 increase in
tuition and fees would lead to a decline in enrollment of approximately 25 students, or a little
more than 0.23%. This estimate is quite similar
to that of Kane (1995), who used state-level data
for the 1980s and early 1990s and estimated
that a $100 increase in 1991 dollars resulted in
an enrollment decline of just under 0.5%. In
comparable dollars, we estimate a decline of
just under 0.35%.
The tuition elasticity of credit hours is similar (Table 2, column 2). The enrollment response
of freshmen is a bit larger, but less precisely
estimated (column 3). This is expected, because
students who have not yet matriculated may be
most able to change enrollment decisions in
response to price changes. But the difference
between the tuition elasticities of total headcount
and freshman enrollment is not significant at
conventional levels.
As expected, enrollment is positively related
to the amount of financial aid and grant money
available to students. The effects of scholarships
and fellowships on enrollment are nearly as large,
444
Downloaded from http://eepa.aera.net at VIRGINIA COMMONWEALTH UNIV on March 31, 2015
Impact of Tuition Increases on Enrollment
and Pell Grant receipts are larger in absolute
value than the effects of tuition costs on enrollment.
This provides some evidence that aid can be used
to offset the impact of increased tuition costs on
enrollment. How to interpret these coefficients
is made difficult by at least two complications,
however. First, scholarships or fellowships and
Pell Grants are received by different groups of
students, which are likely differently price sensitive. Second, although tuition is largely determined at state or system levels, institutions have
some control over the amount of scholarship
money available to students and can encourage
or enable application for Pell Grants on the part
of applicants. Indeed, student aid can be used as
a recruiting device. Hence, the coefficient on aid
or grant money may be overstated if other factors are associated with the availability or use of
student aid at an institution, such as academic
counseling or student support services.
The cross-price elasticities of private college
tuition and community college tuition are of the
expected signs but are statistically insignificant.
As before, it appears that freshmen may be more
responsive to price changes at the margin. Yet
these enrollment effects are small and always
insignificant.
Results by Institution Type
We next turn to the question of whether the
enrollment response of tuition changes is different for different types of public universities and
colleges. In Table 3, we present results of models
identical to those in Table 2 but estimated separately for Research I, Research II, comprehensive,
and liberal arts institutions. A striking pattern
emerges in comparing enrollment responses to
tuition across institution types. The tuition elasticity of enrollment is largest at Research I universities. Enrollment also falls with tuition at
Research II universities, but the elasticity of total
headcount is about two thirds as large as that at
Research I schools. If we look at credit hours,
tuition elasticities are quite similar. But if the
measure is enrollment of FTFT freshmen, enrollment appears much more price responsive at
Research I schools (even if less precisely estimated). For neither comprehensive nor public
liberal arts colleges are there significant negative enrollment effects of tuition increases.
Important for understanding the relative price
sensitivity of enrollment at these different types of
institutions, the average amount of aid available to
students is mostly strongly related to enrollment
at comprehensive and liberal arts institutions.
Although Pell Grant dollars are associated with
higher enrollments even at research-intensive colleges, the magnitudes of this aid effect are smaller
than at comprehensive, liberal arts, and even
Research II schools. How can a higher price sensitivity be reconciled with lower aid sensitivity at
Research I institutions? Two factors seem relevant
here. First, one clue lies in substantial intrastate
correlation in tuition prices described earlier.
Tuition increases at Research I institutions are
made alongside tuition increases at comprehensive universities. A second relevant consideration
is that these institutions serve different markets.
Public Research I institutions are often state flagship schools or universities with national reputations. These institutions compete with other public flagships and private universities and colleges.
Research II and comprehensives are typically less
selective and may serve as substitutes for more
price sensitive students within the state.
One way to examine this hypothesis for the
relatively elastic price response of Research I
institutions is to focus on the subset that most
clearly have national reputations. One common
source students used to compare and assess the
prestige of various institutions is the annual “Best
Colleges” rankings by U.S. News & World Report.
We use these rankings to identify public colleges
and universities in the top 120 institutions in the
nation.12 We then reestimate the models used to
generate the results in Table 3 but split the sample
into two different groups: those in the top 120 of
U.S. News & World Report’s rankings and all
other institutions.
Because top schools compete nationally for
students, raising prices may come with more risk
than schools whose competitors are other institutions in the same state or system, where relative
tuition costs increase at about the same rate. If so,
we would expect to see greater price sensitivity
at top 120 schools. We present these results in
Table 4. In the first panel, we present estimates
for top 120 institutions. In the second panel, we
present results for all others. We also present the
mean percentage of out-of-state FTFT students
enrolling at each type of institution.
445
Downloaded from http://eepa.aera.net at VIRGINIA COMMONWEALTH UNIV on March 31, 2015
446
Downloaded from http://eepa.aera.net at VIRGINIA COMMONWEALTH UNIV on March 31, 2015
Log credit
hours
Research I
Log FTFT
Log
headcount
–0.0919
(0.0852)
0.2404
(0.0622)***
3,582
.9379
0.4590
0.2256
(0.2515)* (0.0659)***
463
3,532
.8259
.9688
Note: FTFT = first-time, full-time. Values in parentheses are robust standard errors. All models also include institution and year effects.
*Significant at 10%. **Significant at 5%. ***Significant at 1%.
0.0616
(0.0276)**
–0.0469
(0.0357)
0.1649
0.0395
(0.0918)* (0.0233)*
–0.0234
(0.0303)
0.2538
(0.1296)*
1,969
.8704
0.4194
(0.1216)***
862
.9514
0.0983
0.0476
(0.0482)** (0.0518)
0.0899
(0.0778)
0.0093
(0.1061)
0.0530
(0.0979)
–0.0193
(0.0997)
–0.0147
(0.1028)
0.1112
(0.1673)
–0.0022
(0.0555)
–0.0910
(0.1706)
0.2809
(0.2182)
Log FTFT
Log
headcount
–0.6655
1.2516
(0.6418)
(0.5812)**
0.6149
0.3205
(0.2744)** (0.1734)*
0.0572
(0.0414)
–0.0379
(0.1691)
–0.0290
(0.0634)
0.0626
(0.0525)
Log credit
hours
Comprehensive
2.2832
–0.0936
–0.0265
(1.6533) (0.1904)
(0.2748)
0.5494
0.3783
0.4883
(0.2936)* (0.1193)*** (0.1184)***
–0.0582
(0.0581)
0.0335
(0.0469)
Log
headcount
–0.0365
(0.1860)
0.0476
(0.1848)
Log credit
hours
Log FTFT
Research II
Log tuition and
–0.2142
–0.1763
–0.2299
–0.1381
–0.1986
(0.0663)*** (0.0644)*** (0.1606)
(0.0686)** (0.1052)*
fees (in state)
Log average
0.0976
0.0149
–0.0268
–0.0274
0.0518
(0.0379)**
(0.0445)
(0.1143)
(0.0809)
(0.1187)
private 4-year
tuition and fees
Log average
0.0333
0.0164
–0.0402
–0.0327
0.0013
(0.0463)
(0.0537)
(0.1393)
(0.0660)
(0.0817)
community
college tuition
and fees
Log average per
–0.1512
0.0563
0.1962
0.7507
0.6599
(0.3647)
(0.3494)
(0.3499)
(0.4092)*
(0.4639)
capita income
Log number of
0.2485
0.2219
0.1573
0.1609
0.28450
(0.0938)*** (0.1125)*
(0.1307)
(0.1328)
(0.1701)*
high school
graduates
Log
–0.0790
–0.1125
0.0952
0.0588
0.1328
(0.0437)*
(0.0568)*
(0.0785)
(0.0981)
(0.1248)
unemployment
rate
Log total
0.0085
0.0073
0.0669
0.1097
0.1039
(0.0246)
(0.0318)** (0.0453)** (0.0556)*
scholarships and (0.0217)
fellowships
Log total Pell
0.1335
0.1145
0.1828
0.1509
0.1665
(0.0556)**
(0.0669)*
(0.0867)** (0.0626)** (0.0649)**
Grant dollars
Observations
1,343
1,358
741
832
848
.8707
.9052
.8572
.9691
.9388
R2
Variable
Log
headcount
Table 3
Enrollment Effects of Tuition Increases by Institution Type
0.4109
(0.0895)***
887
.9306
0.0791
(0.0549)
–0.0329
(0.0739)
0.1704
(0.4706)
0.4538
(0.1577)***
–0.0925
(0.0756)
–0.0143
(0.0969)
0.1117
(0.0812)
Log credit
hours
Liberal arts
0.3643
(0.1604)**
467
.8829
0.2190
(0.1106)*
0.0971
(0.1334)
0.4287
(0.9665)
1.2858
(0.3285)***
0.2534
(0.2398)
0.0170
(0.3138)
0.0861
(0.1346)
Log FTFT
Table 4
Enrollment Impacts of Tuition Increases: Top Public Schools Versus All Others
Top 120
Variable
Log tuition and fees
(in state)
Log average private
4-year tuition and fees
Log average community
college tuition and fees
Log average per capita
income
Log number of high
school graduates
Log unemployment rate
Log total scholarships
and fellowships
Log total Pell Grant
dollars
Observations
R2
Mean percentage out of
state
Log
headcount
Log credit
hours
–0.2505
(0.0693)***
0.2389
(0.1287)*
0.0504
(0.0393)
–0.3810
(0.4210)
0.2569
(0.1151)**
–0.0969
(0.0640)
0.0175
(0.0258)
0.1108
(0.0856)
768
.9071
–0.3051
(0.0903)***
0.0544
(0.2306)
0.0452
(0.0616)
0.5301
(0.4957)
0.2271
(0.1856)
–0.0401
(0.0688)
0.0533
(0.0387)
0.1252
(0.0754)
777
.9480
22.3
All others
Log FTFT
Log
headcount
Log credit
hours
–0.2581
(0.0726)***
0.1935
(0.1245)
0.1279
(0.0631)**
–0.4077
(0.4712)
0.1512
(0.1400)
0.0580
(0.0492)
0.0443
(0.0282)
0.1290
(0.0817)
417
.9743
–0.0770
(0.0332)**
0.0001
(0.0339)
0.0027
(0.0309)
0.3770
(0.1700)**
0.3081
(0.0719)***
0.0107
(0.0268)
0.0621
(0.0177)***
0.2363
(0.0448)***
6,307
.9829
–0.0844
(0.0368)**
0.0345
(0.0447)
–0.0077
(0.0378)
0.1777
(0.1955)
0.3985
(0.0731)***
–0.0198
(0.0318)
0.0745
(0.0209)***
0.2525
(0.0427)***
6,411
.9611
14.7
Log FTFT
–0.0784
(0.1078)
0.1284
(0.1181)
0.0283
(0.0792)
0.0603
(0.5015)
0.6212
(0.1627)***
0.0519
(0.0697)
0.1068
(0.0376)***
0.2947
(0.0797)***
3,414
.9129
Note: FTFT = first-time, full-time. Values in parentheses are robust standard errors. All models also include institution and year
effects. The difference in mean percentage out-of-state FTFT enrollments between top 120 schools and all others is statistically
significant at the 1% level.
*Significant at 10%. **Significant at 5%. ***Significant at 1%.
At the top 120 schools, there is evidence that
enrollment is more sensitive to tuition. The price
elasticity of 12-month headcount and total credit
hours are significant and substantially larger at
top schools. Furthermore, enrollment is less sensitive to aid at top 120 schools than at other institutions. These patterns in price and aid sensitivity are consistent with students opting out of top
120 schools for competitors as price rises, while
finding a way to pay tuition bills at other state
schools at which students may have fewer options.
The percentage of out-of-state FTFT freshman
enrolling in top 120 schools is also appreciably
larger than the corresponding percentage enrolling in other public 4-year institutions.13
Another explanation for larger enrollment
responses at Research I institutions is due to
the greater composition of out-of-state students
in their total enrollment. Because in-state and
out-of-state tuition follow similar trends, if
out-of-state students are more price sensitive
because they have alternatives in their state of
residence, we would expect higher overall
enrollment response at Research I institutions. To
examine this possibility, we first graph (Figure 5)
the increases in nominal out-of-state and in-state
tuition costs separately, comparing both with
the CPI for all urban consumers, for each type
of public 4-year institution. Across all types of
schools, out-of-state tuition cost patterns clearly
mirror in-state cost trajectories. Therefore, we
continue to use changes in real in-state tuition
costs as our main independent variable of interest; however, using additional information from
IPEDS, we split the FTFT outcome into two separate variables: the total number of out-of-state
FTFT students and the total number of in-state
FTFT students. We then estimate models otherwise identical to those in columns 3 and 6 of
Table 4 on both of these outcomes by type of
institution. Table 5 presents these results.
Additionally, we present the mean percentage
447
Downloaded from http://eepa.aera.net at VIRGINIA COMMONWEALTH UNIV on March 31, 2015
1990
1995
Research II
Costs (1991 = 100)
100 150 200 250 300
Costs (1991 = 100)
100 150 200 250 300
Research I
2000
2005
1990
1995
2000
Year
2005
Year
In-state tuition
Out-of-state tuition
In-state tuition
CPI-U
Out-of-state tuition
CPI-U
Costs (1991 = 100)
100 150 200 250 300
Liberal Arts
Costs (1991 = 100)
100 150 200 250 300
Comprehensive
1990
1995
Year
In-state tuition
2000
2005
Out-of-state tuition
CPI-U
1990
1995
In-state tuition
Year
2000
2005
Out-of-state tuition
CPI-U
FIGURE 5. In-state versus out-of-state tuition prices by institution type.
Note: CPI-U = Consumer Price Index for all urban consumers.
of out-of-state enrollments applicable to each
type of institution.
Examining the results in Table 5, we again
see a much higher tuition price sensitivity at
Research I institutions for both in-state and outof-state FTFT enrollments, with little sensitivity at other institution types. The reverse pattern
holds for enrollment sensitivity to financial aid.
The enrollment sensitivity of out-of-state students
to tuition increases appears to be slightly greater
than the price sensitivity of in-state students, but
this difference is not statistically significant. We
also see that incoming FTFT freshman cohorts at
Research I schools are about 19.4% out-of-state
students, compared with 15.1% at Research II
and 12.9% at comprehensive institutions. Both of
these differences in mean percentage of out-ofstate FTFT students are statistically significant at
conventional levels.
The evidence from Tables 3, 4, and 5 of higher
price sensitivity but lower aid sensitivity at top
120 and Research I institutions raises general
questions about enrollment patterns at public
4-year colleges and universities, beyond the
implications of tuition on enrollment at single
institutions. One implication may be a shift of
students from higher income families to private
institutions or public universities in other states,
along with a shift of students from lower income
families to less expensive public universities
within the state.14 This would suggest a redistribution of students across public colleges and
universities within a state, with those most financially able leaving the system, and others scaling
back to enroll at more affordable institutions.
Obviously, student-level data are needed to more
fully test these hypotheses.
Effects of Large Tuition Increases
Another way in which the average price
response estimated in Table 2 may not be fully
informative is the possibility that the average
conceals relatively large enrollment declines
during years following especially large real
tuition increases. To explore this possibility, we
first consider patterns of enrollment before and
after large tuition increases.
448
Downloaded from http://eepa.aera.net at VIRGINIA COMMONWEALTH UNIV on March 31, 2015
TABLE 5
In-State Versus Out-of-State Enrollment Effects of Tuition Increases
Log FTFT
Research I
Variable
Log tuition and
fees (in state)
Log average
private 4-year
tuition and fees
Log average
community
college tuition
and fees
Log average per
capita income
Log number of
high school
graduates
Log
unemployment
rate
Log total
scholarships and
fellowships
Log total Pell
Grant dollars
Observations
R2
Mean percentage
out of state
Out of
state
In state
Research II
Out of
state
In state
Comprehensive
Out of
state
In state
Liberal Arts
Out of
state
In state
–0.4376
–0.3366
(0.1874)** (0.1362)**
0.0725
0.0705
(0.1616) (0.0965)
–0.1481 –0.0110
(0.2955) (0.1999)
0.0012
0.0147
(0.2165) (0.1873)
–0.2448
(0.1786)
0.1685
(0.1340)
–0.2022
(0.1490)
0.3767
(0.2419)
–0.1414 –0.2835
(0.3081) (0.1800)
0.1772 0.0373
(0.2331) (0.1367)
–0.0773
(0.1670)
0.0359
(0.1005)
–0.0559
0.0487
(0.2671) (0.1820)
–0.0368
(0.1479)
0.0191
(0.0949)
0.2412 0.1746
(0.2305) (0.1418)
0.3099
(0.8252)
–0.4052
(0.3932)
–0.3293
1.7194
2.6293
(0.5471) (1.9642) (1.7417)
0.2392
0.0784
0.7405
(0.1325)* (0.5038) (0.3026)**
–1.3056
–0.5603
(0.6814)* (0.7259)
–0.0235
0.6384
(0.3438) (0.2898)**
0.6338 –0.0412
(1.4944) (0.9368)
0.1388 1.6916
(0.6486) (0.3013)***
0.0803
(0.1532)
0.0571
(0.1031)
–0.0455
0.1229
(0.2130) (0.1747)
–0.2311
0.0708
(0.1173)** (0.1274)
0.0533 –0.0416
(0.2011) (0.0864)
0.1139
(0.1210)
0.0122
(0.0839)
0.0769
0.2123
0.1043
0.1062
0.0713 0.1936
(0.1400) (0.0995)** (0.0539)* (0.0494)** (0.2141) (0.1062)*
0.1379
(0.1107)
739
.9370
19.4
0.1483
0.5229
0.4804
(0.0755)* (0.2756)* (0.2419)*
740
463
462
.8387
.8821
.8761
15.1
0.1842
0.2678
0.3087 0.1994
(0.0943)* (0.1348)** (0.3002) (0.1390)
1,954
1,959
459
465
.9180
.9133
.8893
.9292
12.9
19.4
Note: FTFT = first-time, full-time. Values in parentheses are robust standard errors. All models also include institution and year
effects. The differences in mean percentage out-of-state FTFT enrollments between Research I and Research II and between
Research I and comprehensive institutions are both statistically significant at the 1% level.
*Significant at 10%. **Significant at 5%. ***Significant at 1%.
In Figure 6, we present time series of enrollments, net of institution fixed effects, at institutions
that raised tuition from one year to the next by more
than 15% compared with institutions that did not.
To set up a simple difference-in-differences style
comparison, we center the series for institutions
with large hikes around the year of the first hike
large hike (Year 0). To develop the counterfactual,
we center the time series for institutions without
large hikes in 1998, which was the mean year
in which these large hikes were implemented.
There are interesting and suggestive differences
in the patterns of enrollment in institutions making large tuition hikes compared with those that
do not. Enrollment falls at institutions making
large hikes after the first, second, and third years
following large tuition hikes, relative to those
without such large tuition increases. Interestingly,
enrollments grow a bit faster in the years preceding
a large tuition increase then they do at comparable institutions that do not adopt large tuition
increases. This raises the possibility that large
changes in tuition are more likely at institutions
experiencing especially large growth. This is a
topic we return to in the following discussion.
To more fully investigate the presence of
disproportionate enrollment effects of particularly large tuition increases, we present results
in Table 6 from estimations using the setup
described by Equation 2. In the first set of
449
Downloaded from http://eepa.aera.net at VIRGINIA COMMONWEALTH UNIV on March 31, 2015
.04
.02
0
–.02
–.04
Enrollments – School Mean
(indexed to year 0)
–4
–2
0
2
4
Year Relative to Large Tuition Increase
(1998 for Nonhiking institutions)
No large tuition increase ever
One tuition increase ≥ 15%
FIGURE 6. Enrollment patterns by presence of large tuition increases.
Note: Institutions that adopted back-to-back hikes of 15% or greater are not included.
columns, we present results from models in
which we augment the specification in Table 2
to include an indicator denoting whether the
current-year tuition costs were at least 10% higher
than the prior year, along with a series of lags. In
the next three columns, we present results for
the same models in which the threshold for
what determines a large hike increases from a
10% increase to at least a 15% increase in real
tuition.
The interpretation of the elasticities in the first
row of Table 2 remains the same as in previous
models. Regardless of whether we define especially large tuition increases to be above 10% or
above 15%, the total enrollment falls by about
–0.09% for each percentage increase in tuition.
Recall that the estimate from Table 2 comparable with the results in columns 1 and 4 here was
–0.0958. If enrollment fell markedly after large
tuition increases, we would see negative coefficients on the lag variables that pick up changes in
enrollment above institution trends. Furthermore,
one might expect the absolute value of these lagyear shifters to increase, as students are better
able to adjust. However, we see limited evidence
of such nonlinear effects.
If there are any additional declines in enrollments following very large tuition increases,
above and beyond the linear impacts, we see
these declines in the third post-hike year and only
for total credit hours. If we focus on tuition
increases of 10% or more, total credit hours are
expected to fall an additional 1.3% the 3rd year
after the hike was instituted. Similarly, when a
large hike is defined as an increase in tuition
costs of 15% or more, we predict total credit
hours 3 years out to fall off by an additional
1.9%. The enrollment coefficients for FTFT
students border on significance. For example,
the t statistics corresponding to the coefficients
on the 2nd and 3rd post-hike years in column 3
are both about 1.4. Taken together, these findings
suggest that although students may not drop out
of college in response to very large tuition
increases, they may reduce course loads or postpone entering college. Finally, corroborating the
run-up in prehike enrollments we observe in
Figure 6, the coefficients on the contemporaneous tuition hike indicators in columns 2 and 4
of Table 6 suggest that enrollments were indeed
rising a little faster than normal at institutions
that later chose to adopt especially large tuition
increases.
Discussion
Although the patterns of intertemporal tuition
changes across public 4-year institutions
within states along with the inverse relationship
between tuition increases and state appropriation
levels provide confidence that the tuition
increases observed during the course of this
panel can be taken as exogenous at the institution level, other concerns related to interpreting
450
Downloaded from http://eepa.aera.net at VIRGINIA COMMONWEALTH UNIV on March 31, 2015
TABLE 6
Enrollment Effects of Large Tuition Hikes: Full Sample
10%
Variable
Log tuition and fees
(in state)
Log average private
4-year tuition and
fees
Log average
community college
tuition and fees
Log average per capita
income
Log number of high
school graduates
Log unemployment
rate
Log total scholarships
and fellowships
Log total Pell Grant
dollars
Large hike dummy
(year of hike)
1st year after hike
2nd year after hike
3rd year after hike
Observations
R2
Log
headcount
Log credit
hours
15%
Log FTFT
Log
headcount
Log credit
hours
Log FTFT
–0.0882
–0.0797
(0.0336)*** (0.0500)
0.0258
0.0561
(0.0333)
(0.0481)
–0.0349
(0.1131)
0.1555
(0.1165)
–0.0847
(0.0341)**
0.0261
(0.0335)
–0.0813
(0.0487)*
0.0559
(0.0480)
–0.1059
(0.1082)
0.1549
(0.1167)
0.0061
(0.0277)
–0.0094
(0.0361)
0.0525
(0.0707)
0.0083
(0.0274)
–0.0078
(0.0354)
0.0391
(0.0687)
0.2342
(0.1585)
0.3149
(0.0713)***
–0.0017
(0.0254)
0.0431
(0.0149)***
0.2090
(0.0441)***
0.0091
(0.0063)
0.0020
(0.0060)
–0.0076
(0.0073)
–0.0038
(0.0056)
6,399
.9830
0.2592
(0.1897)
0.4041
(0.0757)***
–0.0131
(0.0297)
0.0619
(0.0179)***
0.2151
(0.0417)***
0.0205
(0.0124)*
–0.0013
(0.0076)
–0.0092
(0.0080)
–0.0129
(0.0075)*
6,509
.9663
–0.0559
0.2443
(0.4593)
(0.1581)
0.5700
0.3184
(0.1398)*** (0.0708)***
0.0671
0.0008
(0.0629)
(0.0252)
0.0967
0.0429
(0.0312)*** (0.0148)***
0.2717
0.2078
(0.0810)*** (0.0439)***
–0.0270
0.0154
(0.0172)
(0.0080)*
–0.0020
–0.0025
(0.0175)
(0.0076)
–0.0217
–0.0157
(0.0155)
(0.0104)
–0.0238
–0.0092
(0.0164)
(0.0067)
3,75
6,399
.9300
.9831
0.2649
(0.1891)
0.4113
(0.0754)***
–0.0119
(0.0294)
0.0617
(0.0179)***
0.2144
(0.0415)***
0.0306
(0.0214)
–0.0039
(0.0109)
–0.0091
(0.0086)
–0.0194
(0.0100)*
6,509
.9663
–0.0377
(0.4593)
0.5825
(0.1406)***
0.0639
(0.0631)
0.0988
(0.0309)***
0.2761
(0.0819)***
–0.0028
(0.0224)
0.0156
(0.0217)
–0.0079
(0.0217)
–0.0145
(0.0283)
3,746
.9299
Note: FTFT = first-time, full-time. Values in parentheses are robust standard errors. All models also include institution and year
effects.
*Significant at 10%. **Significant at 5%. ***Significant at 1%.
the enrollment-tuition relationships estimated here
as evidence of demand elasticity may remain.
An important assumption underlying all our
models is that there has been no sharp increase
in the supply of students within states, above
prevailing trends that are associated with tuition
changes. In addition to the intertemporal withinstate tuition cost patterns described above, we
also examined the enrollment effects of tuition
increases for public in-state students only.
Out-of-state tuition increases mirrored in-state
increases and patterns of enrollment sensitivity
across different types of 4-year public institutions
did not meaningfully differ for in-state versus
out-of-state student populations.
An additional concern about interpreting
our main estimates as demand elasticities is the
possibility that schools might alter admissions
criteria at the margin as a means to offset the
negative enrollment impacts of tuition increases.
If public 4-year institutions lower their admissions standards, or simply admit more students
following large tuition increases, these behaviors
could affect overall enrollment numbers as well
as the impact of large tuition increases on future
enrollments. One way to assess the importance
of this concern is to examine the year-to-year
change in the percentage of students admitted
to see if it varies systematically with year-toyear changes in tuition costs. After all, admissions
451
Downloaded from http://eepa.aera.net at VIRGINIA COMMONWEALTH UNIV on March 31, 2015
100
50
0
–50
–100
Year-to-year change in percent admitted
y = –0.38 – 0.00012x
–1,000
0
1,000
2,000
3,000
Year-to-year change in real in-state tuition (dollars)
FIGURE 7. Yearly tuition increases versus admission rates: 4-year public institutions, 2001 to 2007.
Note: The line is a linear fit of change in admission percentage on change in real tuition.
decisions are the only real lever institutions have
to manage enrollment. If institutions are planning enrollment in response to higher levels of
tuition and fees, we would expect higher rates of
admission as a means to fill seats that might be
vacated or because of lower anticipated yield at
the higher level of tuition.
In Figure 7, we summarize the relationship
between admission decisions and recent tuition
changes for institutions in our panel.15 The y-axis
measures year-to-year changes in the percentage
of applicants offered admission, while the x-axis
measures year-to-year changes in tuition and fee
prices. Over the scatterplot is a linear fit of the
relationship, confirming that there is no evidence
in our panel that rates of admission increase with
tuition.16 Hence, we find no evidence that public
4-year colleges and universities were engaged
in strategic behaviors to increase enrollment in
response to tuition changes during the later portion of our panel, a period rife with large tuition
increases. Indeed, it is not clear that they could do
much about it. Because of the vagaries of yield,
knowing how many students to admit to meet
targets as tuition prices change is surely difficult.
Furthermore, there is nothing admissions officers
can do about lower retention rates that are associated with higher tuition, and increases in dropout at that margin could swamp any strategic
efforts admissions officers do make.
Although none of these checks is ironclad,
together they suggest our main identifying assump-
tions hold. To the extent that universities and
colleges were responding in other ways to tuition
changes that might also affect enrollment numbers, such behaviors would cause us to underestimate the true demand elasticity of enrollment.
Therefore, at a minimum, our estimates reliably
identify a lower bound of the true demand sensitivity of enrollment to tuition changes.
Conclusion
During the past decade, there have been
exceptional and perhaps unprecedented increases
in tuition at public colleges and universities.
Poor economic conditions and subsequent state
budget cuts have created a fertile landscape for
large tuition increases. Those pressures have not
abated. We survey the terrain of public higher
education between 1991–1992 and 2006–2007 to
update what is known about the relationship
between tuition and enrollment. We make use
of the variation in the timing and magnitude of
sometimes very large tuition increases to examine patterns of enrollment.
An important empirical finding to derive from
our work is that despite increases in the rate of
real tuition growth, there is no evidence that
the tuition elasticity of enrollment at public
4-year institutions has increased. We estimate
that the average tuition and fee elasticity of total
headcount is –0.0958. So, at the mean, a $100
increase in tuition and fees (in 2006 dollars)
would lead to a decline in enrollment of a little
452
Downloaded from http://eepa.aera.net at VIRGINIA COMMONWEALTH UNIV on March 31, 2015
Impact of Tuition Increases on Enrollment
less than 0.25%. This is quite similar to estimates of tuition elasticities from the 1980s and
early 1990s (Kane, 1995; Heller, 1996).
Our estimates suggest that tuition can be used
as a lever to offset revenue losses from declining
appropriations. At the means of enrollment and
tuition price, our results imply that a 5% increase
in tuition (about $210) would result in an enrollment decline of about 51 students and the loss of
about $225,000 in tuition from these students.
But the higher price charged to remaining students would bring in an additional $2.24 million
in tuition revenue. So, if net revenue in the short
run is the only concern for an institution, tuition
is clearly a mechanism for augmenting revenue.
Obviously, there may be political or other considerations important for public institutions that
complicate this calculus.
We find limited evidence that unusually large
year-to-year tuition increases (e.g., real increases
in excess of 15%) have disproportionately large
impacts on enrollment. If they do, such impacts
appear to manifest as less drastic decisions on
the part of students, such as decreasing future
course loads (in terms of the number of credit
hours taken).
We also find substantial differences in enrollment responses at different types of colleges and
universities. We find larger effects of tuition
increases on enrollment at Research I and top
120 public universities than we do at comprehensive universities and public liberal arts colleges. Moreover, enrollment is less sensitive to
aid at Research I universities and those in the top
120 of the U.S. News & World Report rankings.
At public colleges and universities of this type, it
appears that the near-term consequence of
increased tuition is a decline in enrollment. On
the other hand, at comprehensive universities, it
appears that tuition increases do not necessarily
mean lower enrollment; rather, they mean more
reliance on aid for the students who do enroll.
Institution-level panel data, like ours, are
ultimately quite limited for the purposes of
understanding consequences of tuition increases
on individual students, educational attainment,
and the public system of higher education more
broadly. The enrollment responses at the institution level are consistent with softness in demand
at the top tier of public colleges and universities.
This could arise because students at these insti-
tutions view schools in other states, or private
universities, as substitutes. It could also arise
because these schools are relatively expensive
within state systems, and price increases induce
some students to substitute to choose less expensive options within the state. Of course, both of
these explanations may be relevant for different
sets of students. In either case, shifts would be
consistent with a cascading effect in the public
university system that implements large tuition
increases: As tuition increases, the outflow is
largest at the most prestigious state universities as students there leave for other states, private colleges, or less expensive options within
the state. At the relatively inexpensive but less
selective Research II and comprehensive state
universities, the loss of students who substitute
down to less expensive options such as community colleges could be offset by students who
once would have gone to the state flagship but
can no longer afford it.
Although we cannot assess the relative merits
of explanations such as these using institutionlevel data, doing so is clearly important. Public
institutions enroll the vast majority of students
in American higher education, and relative price
changes may result in substantial shifts across
institutions, or enrollment intensity within institutions. Shifts in where students enroll and the
number of credit hours taken may play a role
in helping us understand why college completion rates have declined, even as enrollment
rates have risen. Bound, Lovenheim, and Turner
(2010) examined initial enrollment decisions
of students from the 1970s and 1990s and find
important shifts toward less selective postsecondary institutions, where student support and
completion rates are lower. Furthermore, they
found that “student observables explain virtually none of the observed cross-cohort shifts in
initial school choice” (p. 142). One possibility
suggested by our findings is that some of these
shifts were due to relative price changes.
Another policy question to which the current
findings are related is a concern about increasing stratification of student and institutional
quality. An important dimension of this has been
at the public-private margin: Kane, Orszag, and
Gunter (2003) reported that the combination of
falling state appropriations and political constraints on tuition increases have led to relative
453
Downloaded from http://eepa.aera.net at VIRGINIA COMMONWEALTH UNIV on March 31, 2015
Appendix
Variable Sources and Availability
Variable
Costs
In-state tuition and fees
Average 4-year private
tuition and fees
measure (by state,
year)
Average community
college tuition and
fees (by state, year)
Outcomes
12-month unduplicated
undergraduate
headcount
Total undergraduate
credit hours (measure
of instructional
activity)
FTFT undergraduate
enrollment
Availability
(Academic Years)
1990–1991 to
2007–2008
1993–1994 to
2006–2007
1993–1994 to
2006–2007
Source
IPEDS Variable Names,
Table, or Specific Survey Element
IPEDS
Tuition and fees, full-time
undergraduate, in-state and
published in-state tuition and fees
Postsecondary tables, by year and
Digest of
state (for recent years) and State
Education
Comparisons of Education
Statistics (NCES),
Statistics (1969–1997)
multiple years
Postsecondary tables, by year and
Digest of
state (for recent years) and State
Education
Comparisons of Education
Statistics (NCES),
Statistics (1969–1997)
multiple years
1991–1992 to
2006–2007
IPEDS
12-month unduplicated
undergraduate headcount
1991–1992 to 2006–
2007 (linearly
interpolated: 1994–
1995 and 1996–1997)
1999–2000 to
2006–2007
IPEDS
12-month instructional activity
credit hours: undergraduates
IPEDS
Number of FTFT students in
cohort who are in-state/out-ofstate
Other controls
State unemployment
rates (by year)
Total personal income
(by state, year)
1991–1992 to
2007–2008
1990–1991 to
2006–2007
BLS
State populations (by
year)
1990–1991 to
2007–2008
Census
Local Area Unemployment
Statistics (multiscreen option)a
Table 658: “Personal Income in
Current and Constant (2000)
Dollars by State: 1979-2006”
National and State Population
Estimates: 2007 vintage for later
years, 1990s archive for earlier
years
Average per capita
income (by state,
year)
Public high school
graduates (by state,
year)
1990–1991 to
2006–2007
Created
1990–1991 to 2005–
2006 (linearly
interpolated: 1991–
1992 to 1994–1995,
1996–1997, and
1998–1999)
1990–1991 to
2006–2007
1990–1991 to
2006–2007
Table 101: “Public High School
Digest of
Graduates, by State or
Education
Jurisdiction: Selected Years,
Statistics (NCES),
1980-81 Through 2005-06”
2007
Total Pell Grants
Total scholarships and
fellowships
BEA
IPEDS
(Total) Pell Grants
IPEDS
Total (gross) scholarships and
fellowships
Note: BEA = U.S. Bureau of Economic Analysis; BLS = U.S. Bureau of Labor Statistics; FTFT = first-time, full-time;
IPEDS = Integrated Postsecondary Education Data System; NCES = National Center for Education Statistics.
a. http://www.bls.gov/data/#unemployment.
454
Downloaded from http://eepa.aera.net at VIRGINIA COMMONWEALTH UNIV on March 31, 2015
Impact of Tuition Increases on Enrollment
declines in per student spending at public colleges and universities. The ratio declined from
about 70% public to private per student spending
in the mid-1970s to 58% by the mid-1990s. More
generally, Hoxby (2009) found that student
quality, tuition, and subsidies have stratified
markedly across institutions ranked by quality.
Our finding that large tuition increases lead to
enrollment declines at selective public universities but steady enrollment, and perhaps larger
debt, at less selective colleges suggests there
may be a link between policies that offset general revenue declines with tuition increases and
this larger landscape of stratification.
Notes
1. Nonetheless, the correlation coefficient on intertemporal variation in tuition at these institutions is .984.
2. It is important to note that enrollment responses
to changes in tuition price need not be equivalent to
responses to identical changes in the availability of
financial aid, because the latter require more information and effort to adequately price.
3. The Bureau of Labor Statistics calculates and
publishes a variety of CPI measures. We use the multiscreen database tool to extract yearly CPI values for all
urban consumers (http://www.bls.gov/data/#prices).
4. This figure is the average R2 value across regressions by state of real tuition costs on institution effects.
5. Some basic attempts at modeling demand and
supply simultaneously can be found for specific types
of institutions, such as doctorate-granting institutions
(Koshal & Koshal, 1994), private liberal arts colleges
(Koshal & Koshal, 1999), and public comprehensive
universities (Koshal & Koshal, 1998). Yet these studies all used data from just 1 academic year, and they
suffer from the common inability to find credible factors that shift either supply or demand without affecting the other.
6. Certainly students might adjust the number of
classes (or credits) differently at the margin on the
basis of whether institutions price by credit hour or
at a flat semester rate. Yet pricing policies differ by
institution, ranges of credit hours, and by whether a
student is full- or part-time. It is reasonable to argue
that this adjustment at the margin in response to tuition
changes would be greatest at institutions that price by
credit hour. We capture the average effect across all
institutions.
7. We deflate all monetary values to 2006 dollars
using the CPI for all urban consumers.
8. This figure includes grants, loans, work study,
and “other” federal and nonfederal aid.
9. Even in the presence of financial aid to help
reduce costs, students are likely to respond first and
most strongly to the “sticker price” of attendance. For
instance, decisions about some types of financial aid
come much too close to the time students must make
actual attendance decisions. Furthermore, many students do not even apply for financial aid, because of
the complicated nature of the forms and process
(Dynarski & Scott-Clayton, 2006).
10. We also estimated models in which we clustered
on state, because of the substantial relationship between
intertemporal patterns of tuition across institutions
within states. Standard errors from models clustered on
states were indistinguishable from models clustered on
institutions.
11. There is evidence that families do not substantially adjust college savings plans in response to changes
in financial aid incentives (Long, 2004; Monks, 2004).
12. We identified schools in our sample as being
top 120 schools by whether they appeared on the
“Best Colleges 2000” list published in the August
1999 issue of U.S. News & World Report (which is
approximately the midpoint of our panel).
13. This difference in mean out-of-state FTFT enrollments is statistically significant at conventional levels.
14. In our sample, the average cost of enrollment at
a Research I university is $4,837, compared with
$4,390 at Research II schools and $3,869 at comprehensive institutions.
15. We focus on the latter half of our panel, because
admissions data are available from IPEDS only for
2001 through 2007.
16. This conclusion is robust to whether we use
contemporaneous or lagged changes in year-to-year
tuition costs and to whether we use changes in the
percentage admitted or changes in the percentage
enrollment yield (defined as the number of students
enrolled divided by the number admitted) as the outcome of interest.
References
Bound, J., Lovenheim, W. F., & Turner, S. (2010).
Why have college completion rates declined? An
analysis of changing student preparation and collegiate
resources. American Economic Journal: Applied
Economics, 2(3), 29–57.
Bound, J., & Turner, S. (2006). Cohort crowding:
How resources affect collegiate attainment. Journal
of Public Economics, 91(5–6), 877–899.
Carnegie Foundation for the Advancement of Teaching.
(2006). Basic classification technical details. Available
at http://classifications.carnegiefoundation.org/
descriptions/basic.php
455
Downloaded from http://eepa.aera.net at VIRGINIA COMMONWEALTH UNIV on March 31, 2015
Hemelt and Marcotte
Dynarski, S. (2000). Hope for whom? Financial aid for
the middle class and its impact on college attendance.
National Tax Journal, 53(3), 629–661.
Dynarski, S. M. (2003). Does aid matter? Measuring
the effect of student aid on college attendance and
completion. American Economic Review, 93(1),
279–288.
Dynarski, S. M., & Scott-Clayton, J. E. (2006). The cost
complexity in federal student aid: Lessons from
optimal tax theory and behavioral economics (NBER
Working Paper Series, No. 12227). Cambridge, MA:
National Bureau of Economic Research.
Friend, T. (2010, January 4). Protest studies; the state
is broke, and Berkley is in revolt. The New Yorker,
85(43), 22–28.
Gordon, L., Holland, G., & Landsberg, M. (2009,
July 31). California’s higher education system could
face decline. The Los Angeles Times. Available at
http://www.latimes.com/news/local/la-me-college-cuts
31-2009jul31,0,6428362.story
Heller, D. E. (1996). Tuition prices, financial aid,
and access to public higher education: A statelevel analysis. Paper presented at the meeting of
the American Educational Research Association,
New York.
Heller, D. E. (1997). Student price response in higher
education: An update to Leslie and Brinkman.
Journal of Higher Education, 68(6), 624–659.
Horn, L., & Peter, K. (2003). What colleges contribute:
Institutional aid to full-time undergraduates attending
4-year colleges and universities. Education Statistics
Quarterly, 5(2).
Hoxby, C. M. (2009). The changing selectivity of
American colleges. Journal of Economic Perspectives,
23(4), 95–118.
Jackson, G. A., & Weathersby, G. B. (1975).
Individual demand for higher education: A review
and analysis of recent empirical studies. Journal of
Higher Education, 46(6), 623–651.
Johnstone, B. D. (2004). The economics and politics
of cost sharing in higher education: Comparative
perspectives. Economics of Education Review,
23(4), 403–410.
Kane, T. J. (1994a). The causes and consequences of
recent public tuition increases. Cambridge, MA:
Kennedy School of Government.
Kane, T. J. (1994b). College entry by Blacks sine
1970: The role of college costs, family background,
and the returns to education. Journal of Political
Economy, 102(5), 878–911.
Kane, T. J. (1995). Rising public college tuition and
college entry: How well do public subsidies promote
access to college? (NBER Working Paper Series,
No. 5164). Cambridge, MA: National Bureau of
Economic Research.
Kane, T. J. (2003). A quasi-experimental estimate of
the impact of financial aid on college-going (NBER
Working Paper Series, No. 98703). Cambridge,
MA: National Bureau of Economic Research.
Kane, T. J., Orszag, P. R., & Gunter, D. (2003). State
fiscal constraints and higher education spending
(Discussion Paper No. 11). Washington, DC:
Urban-Brookings Tax Policy Center. Available at
http://www.taxpolicycenter.org/UploadedPDF/
310787_TPC_DP11.pdf
Koshal, R. K., & Koshal, M. (1994). Tuition at PhDgranting institutions: A supply and demand model.
Education Economics, 2(1), 29–44.
Koshal, R. K., & Koshal, M. (1998). Determinants of
tuition at comprehensive universities. Applied
Economics, 30, 579–583.
Koshal, R. K., & Koshal, M. (1999). Demand and
supply of educational service: A case of liberal arts
colleges. Education Economics, 7(2), 121–130.
Koshal, R. K., & Koshal, M. (2000). State appropriation
and higher education tuition: What is the relationship?
Education Economics, 8(1), 81–89.
Leslie, L. L., & Brinkman, P. T. (1987). Student price
response in higher education: The student demand
studies. Journal of Higher Education, 58(2), 181–201.
Lewin, T. (2008, October 30). Downturn expected to
drive tuition up. The New York Times, p. A18.
Lewin, T., & Cathcart, R. (2009, November 19).
Regents raise college tuition for California by
32 percent. The New York Times, p. A26.
Long, M. (2004). The impact of asset-tested college
financial aid on household savings. Journal of Public
Economics, 88(1–2), 63–88.
Lowry, R. C. (2001a). The effects of state political
interests and campus outputs on public university
revenues. Economics of Education Review, 20(2),
105–119.
Lowry, R. C. (2001b). Governmental structure, trustee
selection, and public university prices and spending:
Multiple means to similar ends. American Journal
of Political Science, 45(4), 845–861.
Marklein, M. B. (2002, August 8). Public universities
raise tuition, fees—and ire. USA Today, p. 1A.
Monks, J. (2004). An empirical examination of the
impact of college financial aid on family savings.
National Tax Journal, 57(2), 189–207.
National Center for Education Statistics. (2005a).
Table 187: Total fall enrollment in degree-granting
institutions, by attendance status, sex of student,
and type and control of institution: Selected years,
1970 through 2005. In Digest of Education Statistics.
Washington, DC: U.S. Department of Education.
National Center for Education Statistics. (2005b).
Table 319: Undergraduates enrolled full time and
part time, by aid status, source of aid, and control and
456
Downloaded from http://eepa.aera.net at VIRGINIA COMMONWEALTH UNIV on March 31, 2015
Impact of Tuition Increases on Enrollment
type of institution: 2003–04. In Digest of Education
Statistics. Washington, DC: U.S. Department of
Education.
National Center for Education Statistics. (2005c).
Table 330: Current-fund revenue of public degreegranting institutions, by source of funds and type
of institution: 2000–01. In Digest of Education
Statistics. Washington, DC: U.S. Department of
Education.
National Center for Education Statistics. (2006).
Table 327: Percentage of full-time, first-time
undergraduates receiving aid, by type and source
of aid received and control and type of institution:
Selected years, 1992–93 through 2003–04. In
Digest of Education Statistics. Washington, DC:
U.S. Department of Education.
National Center for Education Statistics. (2008).
Table P71: Number of postsecondary undergraduate
institutions, overall, and those awarding career
education credentials, and percentage of Title IV
postsecondary undergraduate institutions awarding
career education credentials, by control and level of
institution: United States 1997 to 2006. In Career/
Technical Education Statistics. Washington, DC:
U.S. Department of Education.
National Center for Education Statistics. (n.d.). About
IPEDS. Available at http://nces.ed.gov/ipeds/about/
O’Leary, K. (2009, July 18). California’s crisis hits
its prized universities. Time. Available at http://
www.time.com/time/nation/article/0,8599,
1911455,00.html
Rizzo, M., & Ehrenberg, R. G. (2003). Resident and
nonresident tuition and enrollment at flagship state
universities (NBER Working Paper Series, No. 9916).
Cambridge, MA: National Bureau of Economic
Research.
Rouse, C. E. (1994). What to do after high school:
The two-year versus four-year college enrollment
decision. In R. G. Ehrenberg (Ed.), Choices and
consequences: Contemporary policy issues in
education (pp. 59–88). Ithaca, NY: ILR Press.
Shin, J., & Milton, S. (2006). Rethinking tuition
effects on enrollment in public four-year colleges
and universities. Review of Higher Education, 29(2),
213–237.
St. John, E. P. (1990). Price response in enrollment
decisions: An analysis of the high school and beyond
sophomore cohort. Research in Higher Education,
31(2), 161–176.
Authors
Steven W. Hemelt is an Assistant Professor in
the Department of Politics, Cornell College, 600 First
St. SW, Mount Vernon, IA 52314. His research focuses
on the economics of education and education policy—
including topics such as K-12 accountability structures, the influence of teachers on students, and college
choice. Hemelt is currently on leave as a Research
Fellow at the Gerald R. Ford School of Public Policy,
University of Michigan; [email protected].
Dave E. Marcotte is a Professor in the
Department of Public Policy, University of Maryland
Baltimore County, 1000 Hilltop Circle, Baltimore,
MD 21250; [email protected]. His areas of specialization are the economics of education and health,
and evaluation.
Manuscript received January 26, 2010
Revision received February 24, 2011
Accepted June 2, 2011
457
Downloaded from http://eepa.aera.net at VIRGINIA COMMONWEALTH UNIV on March 31, 2015


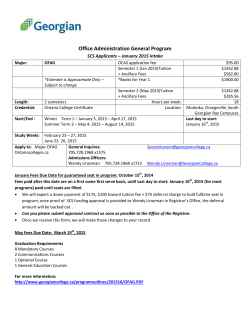


© Copyright 2026