
Common variants in 22 loci are associated with QRS
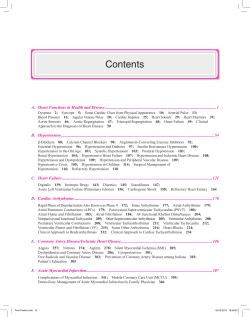
Articles © 2010 Nature America, Inc. All rights reserved. Common variants in 22 loci are associated with QRS duration and cardiac ventricular conduction Nona Sotoodehnia1,2,78*, Aaron Isaacs3,4,78, Paul I W de Bakker5–8,78, Marcus Dörr9,78, Christopher Newton-Cheh10–12,78, Ilja M Nolte13,78, Pim van der Harst14,78, Martina Müller15–17,78, Mark Eijgelsheim18,78, Alvaro Alonso19,78, Andrew A Hicks20,78, Sandosh Padmanabhan21,78, Caroline Hayward22,78, Albert Vernon Smith23,24,78, Ozren Polasek25,78, Steven Giovannone26,78, Jingyuan Fu13,27,78, Jared W Magnani12,28, Kristin D Marciante2, Arne Pfeufer20,29,30, Sina A Gharib31, Alexander Teumer32, Man Li33, Joshua C Bis2, Fernando Rivadeneira18,34, Thor Aspelund23,24, Anna Köttgen35, Toby Johnson36,37, Kenneth Rice38, Mark P S Sie3, Ying A Wang12,39, Norman Klopp17, Christian Fuchsberger20, Sarah H Wild40, Irene Mateo Leach14, Karol Estrada34, Uwe Völker32, Alan F Wright22, Folkert W Asselbergs13,14,41, Jiaxiang Qu26, Aravinda Chakravarti42, Moritz F Sinner16, Jan A Kors43, Astrid Petersmann44, Tamara B Harris45, Elsayed Z Soliman46, Patricia B Munroe36,37, Bruce M Psaty2,47–49, Ben A Oostra4,50, L Adrienne Cupples12,39, Siegfried Perz51, Rudolf A de Boer14, André G Uitterlinden18,34,52, Henry Völzke53, Timothy D Spector54, Fang-Yu Liu26, Eric Boerwinkle55,56, Anna F Dominiczak21, Jerome I Rotter57, Gé van Herpen43, Daniel Levy12,58, H-Erich Wichmann15,17,59, Wiek H van Gilst14, Jacqueline C M Witteman18,52, Heyo K Kroemer60, W H Linda Kao33, Susan R Heckbert2,47,49, Thomas Meitinger29,30, Albert Hofman18,52, Harry Campbell40, Aaron R Folsom19, Dirk J van Veldhuisen14, Christine Schwienbacher20,61, Christopher J O’Donnell12,58, Claudia Beu Volpato20, Mark J Caulfield36,37, John M Connell62, Lenore Launer45, Xiaowen Lu13, Lude Franke27,63, Rudolf S N Fehrmann27, Gerard te Meerman27, Harry J M Groen64, Rinse K Weersma65, Leonard H van den Berg66, Cisca Wijmenga27, Roel A Ophoff 67,68, Gerjan Navis69, Igor Rudan40,70,71,78, Harold Snieder13,54,78, James F Wilson40,78, Peter P Pramstaller20,72,73,78, David S Siscovick2,47,78, Thomas J Wang11,12,78, Vilmundur Gudnason23,24,78, Cornelia M van Duijn3,4,52,78, Stephan B Felix9,78, Glenn I Fishman26,78, Yalda Jamshidi54,74,78, Bruno H Ch Stricker18,34,43,52,75,78, Nilesh J Samani76–78, Stefan Kääb16,78 & Dan E Arking42,78 The QRS interval, from the beginning of the Q wave to the end of the S wave on an electrocardiogram, reflects ventricular depolarization and conduction time and is a risk factor for mortality, sudden death and heart failure. We performed a genomewide association meta-analysis in 40,407 individuals of European descent from 14 studies, with further genotyping in 7,170 additional Europeans, and we identified 22 loci associated with QRS duration (P < 5 × 10⁻⁸). These loci map in or near genes in pathways with established roles in ventricular conduction such as sodium channels, transcription factors and calcium-handling proteins, but also point to previously unidentified biologic processes, such as kinase inhibitors and genes related to tumorigenesis. We demonstrate that SCN10A, a candidate gene at the most significantly associated locus in this study, is expressed in the mouse ventricular conduction system, and treatment with a selective SCN10A blocker prolongs QRS duration. These findings extend our current knowledge of ventricular depolarization and conduction. The electrocardiographic QRS interval reflects ventricular depolarization, and its duration is a function of electrophysiological properties within the His-Purkinje system and the ventricular myocardium. A diseased ventricular conduction system can lead to life-threatening bradyarrhythmias, such as heart block, and tachyarrhythmias, such as ventricular fibrillation. Longer QRS duration is a predictor of mortality and sudden death in the general population and in cohorts with hypertension and coronary artery disease1–3. In a population-based study, prolonged baseline QRS was associated with incident heart failure4. Twin and family studies suggest a genetic contribution to QRS duration, with heritability estimates of up to 40% (refs 5,6). Prior candidate gene and smaller genome-wide studies identified a limited *A full list of author affiliations appears at the end of the paper. Received 3 May; accepted 19 October; published online 14 November 2010; doi:10.1038/ng.716 1068 VOLUME 42 | NUMBER 12 | DECEMBER 2010 Nature Genetics Articles © 2010 Nature America, Inc. All rights reserved. number of loci associated with QRS duration, supporting the hypo thesis of the contribution of common genetic variation in QRS duration7–9. To identify additional loci and highlight physiologic processes associated with ventricular conduction, we performed a meta-analysis of 14 genome-wide association studies (GWAS) of QRS duration in a total of 40,407 individuals of European descent, where we adjusted the analyses for age, sex, height and body mass index (BMI) after appropriate sample exclusions (Online Methods). After an initial discovery phase, we further genotyped selected variants representing nine loci with P values ranging from P = 1 × 10⁻⁶ to P = 5 × 10⁻⁹ in an additional cohort of 7,170 European individuals. RESULTS Meta-analysis of genome-wide association results We conducted meta-analyses for approximately 2.5 million SNPs in 40,407 individuals of European ancestry from 14 GWAS (Supplementary Table 1a,b). Overall, 612 variants in 20 loci exceeded our genome-wide significance P value threshold of P = 5 × 10⁻⁸ after adjusting for modest genomic inflation (genomic inflation factor (λGC) = 1.059) (Fig. 1 and Supplementary Fig. 1). The loci associated with QRS interval duration are detailed in Table 1 and Supplementary Figure 2, with the index SNP (representing the most significant association) labeled for each independent signal. Across the genome, the most significant association for QRS interval duration (termed locus 1) was on chromosome 3p22 (Fig. 2a), where we identified six potentially independent association signals based on the linkage disequilibrium (LD) patterns in the HapMap European CEU population (pairwise r2 among all index SNPs was <0.05). In conditional analyses where all six SNPs were included in the same regression model, there was compelling evidence that at least four SNPs from this region were independently associated with QRS duration (Table 1). Two of these associations were in or near SCN10A, which encodes a voltage-gated sodium channel. Variation at this locus was recently associated with QRS duration in two GWAS. The top SNP identified in those two studies, rs6795970, is in strong LD with our top signal, rs6801975 (r2 = 0.93)8,9. Two additional signals were identified in SCN5A, a sodium channel gene adjacent to SCN10A (Table 1). The second most significant locus (locus 2) was on chromosome 6p21 near CDKN1A, which encodes a cyclin-dependent kinase inhibitor. The CDKN1A locus was recently associated with QRS interval duration in an Icelandic population9. The index SNP in the prior report, rs1321311, is in strong LD with our top signal, rs9470361 (r2 = 0.88). CDKN2C, which encodes another cyclin-dependent kinase inhibitor, is located in locus 15, which encompasses several other genes, including C1orf185, RNF11 and FAF1. Locus 3 on chromosome 6q22 contains the PLN-SLC35F1C6orf204-BRD7P3 cluster of genes. PLN encodes phospholamban, a key regulator of sarcoplasmic reticulum calcium reuptake. Significant associations were found in several other regions harboring calciumhandling genes, including locus 12 (STRN-HEATR5B), locus 16 (PRKCA) and locus 18 (CASQ2). Locus 4 mapped to an intronic SNP in NFIA, which encodes a transcription factor. Several other significant loci also mapped in or near Nature Genetics VOLUME 42 | NUMBER 12 | DECEMBER 2010 SCN5A-SCN10A 30 CDKN1A 25 20 –log10 P Figure 1 Manhattan plot. Manhattan plot showing the association of SNPs with QRS interval duration in a GWAS of 40,407 individuals. The dashed horizontal line marks the threshold for genome-wide significance (P = 5 × 10⁻⁸). Twenty loci (labeled) reached genome-wide significance. Two additional loci, GOSR2 and DKK1, reached significance after genotyping of select SNPs in an additional sample of 7,170 individuals (see results section of the main text). 15 10 PLN NFIA HAND1SAP30L RNF11-CDKN2C CRIM1STRN CASQ2 TKT-CACNA1D 1 3 TBX20 VTI1A IGFBP3 LRIG1-SLC25A26 DKK1 TBX5-TBX3 SIPA1L1 KLF12 SETBP1 PRKCA GOSR2 5 2 4 5 6 7 8 9 10 11 12 13 14 15 1617 18 20 22 Chromosome genes encoding transcription factors, including locus 5 (HAND1), locus 6 (TBX20), locus 8 (TBX5), locus 9 (TBX3) and locus 19 (KLF12). Common variation in TBX5 was recently associated with QRS duration9. The index signal in the prior report, rs3825214, was in moderate LD with our top signal, rs883079 (r2 = 0.67). Additional regions identified include locus 7 (SIPA1L1), locus 10 (VTI1A), locus 11 (SETBP1), locus 13 (TKT-CACNA1D-PRKCD), locus 14 (CRIM1), locus 17 (the nearest gene, IGFBP3, is 660 kb away) and locus 20 (LRIG1). Collectively, the identified index SNPs across these 20 loci explained approximately 5.7% (± 2.3% (s.d.)) of the observed variance in QRS duration, consistent with a polygenic model in which each of the discovered variants exerts only a modest effect on QRS interval. None of these index SNPs showed a significant interaction with sex or age after Bonferroni correction (Supplementary Table 2). We observed moderate levels of heterogeneity of the effect (25 < I2 < 75) for several index SNPs (Table 1). However, only HAND1-SAP30L showed significant evidence of heterogeneity using Cochran’s Q test corrected for 23 independent genome-wide variants (Cochran’s P = 0.005). Extension of findings in an additional 7,170 individuals Based on the discovery meta-analysis, we selected the index SNPs at four loci (loci 15, 17, 19 and 20) with P values ranging between P = 5 × 10⁻⁸ and P = 5 × 10⁻⁹ and from all five loci with P values ranging from P = 1 × 10⁻⁶ to P = 5 × 10⁻⁸ (Online Methods) for genotyping in an additional 7,170 European individuals in order to boost the study’s power. In a joint analysis combining all 47,577 individuals, the significance for the four loci with P values between P = 5 × 10⁻⁸ and P = 5 × 10⁻⁹ increased, indicating these represent true positive associations (Table 1). The joint analysis also provided further evidence for two other loci (locus 21 near DKK1 and locus 22 tagged by an intronic SNP in GOSR2) that reached genome-wide significance, bringing the total number of significant loci to 22, with 25 independently associated index SNPs (Table 1). The index SNP (rs1733724) in DKK1 was previously associated with QRS duration in an Icelandic population9. Association with conduction defect Based on this series of QRS associations, we sought to test the hypothesis that QRS-prolonging alleles, on average, increase risk of ventricular conduction defects. To address this question, we calculated a risk score in each individual by adding up the number of QRS-prolonging alleles identified in this study weighted by the observed effect sizes (β estimates) from the final meta-analysis. In an independent set of 519 individuals from the Atherosclerosis Risk in Communities (ARIC) and Rotterdam (RS) studies with bundle branch block or nonspecific prolongation of QRS interval (QRS > 120 milliseconds (ms)) compared with those individuals with normal conduction (N = 12,804), we found evidence that the cumulative burden of QRS-prolonging alleles is associated with risk of ventricular conduction defect (P = 0.004). This result was largely driven by those individuals with nonspecific 1069 Articles Table 1 Significant loci at P < 5 × 10⁻⁸ in combined GWAS and candidate SNP meta-analysis Locus Chr. Index SNP GWAS GWAS β s.e.GC GWAS PGC I2 PREVEND PREVEND β P POverall MultiSNP β MultiSNP P 3.43 × 10⁻¹⁴ 5.78 × 10⁻¹⁶ 1.67 × 10⁻⁴ 1.33 × 10⁻⁶ 7.23 × 10⁻⁶ 3.71 × 10⁻² — — 2 3 3 3 3 3 3 3 6 6 rs6801957 rs9851724 rs10865879 rs11710077 rs11708996 rs2051211 rs9470361 rs11153730 T/C C/T T/C T/A C/G G/A A/G C/T 0.41 0.77 0.33 −0.66 0.41 0.77 0.21 −0.84 0.16 0.79 0.26 −0.44 0.25 0.87 0.49 0.59 0.07 0.07 0.07 0.09 0.10 0.08 0.08 0.07 1.10 1.91 1.10 5.74 1.26 1.57 3.00 1.26 × × × × × × × × 10−28 10−20 10−28 10−22 10−16 10−8 10−27 10−18 45.3 57.1 53.6 23.8 0.0 0.0 14.6 5.3 — — — — — — — — — — — — — — — — 1.10 1.91 1.10 5.74 1.26 1.57 3.00 1.26 × × × × × × × × 10−28 10−20 10−28 10−22 10−16 10−8 10−27 10−18 0.54 −0.60 0.33 −0.44 0.47 −0.18 — — 4 5 6 7 8 9 1 5 7 14 12 12 rs9436640 rs13165478 rs1362212 rs11848785 rs883079 rs10850409 G/T A/G A/G G/A C/T A/G 0.46 0.36 0.18 0.27 0.29 0.27 −0.59 −0.55 0.69 −0.50 0.49 −0.49 0.07 0.07 0.09 0.08 0.08 0.08 4.57 7.36 1.12 1.04 1.33 3.06 × × × × × × 10−18 51.2 10−14 64.6 10−13 0.0 10−10 0.0 10−10 8.3 10−10 0.0 — — — — — — — — — — — — 4.57 7.36 1.12 1.04 1.33 3.06 × × × × × × 10−18 10−14 10−13 10−10 10−10 10−10 — — — — — — — — — — — — 10 11 12 13 10 18 2 3 rs7342028 rs991014 rs17020136 rs4687718 T/G T/C C/T A/G 0.27 0.48 0.42 0.42 0.21 0.51 0.14 −0.63 0.08 0.07 0.08 0.11 4.95 6.20 1.90 6.25 × × × × 10−10 10−10 10−9 10−9 0.0 0.0 0.0 0.0 — — — — — — — — 4.95 6.20 1.90 6.25 × × × × 10−10 10−10 10−9 10−9 — — — — — — — — 14 15 2 1 rs7562790 rs17391905 G/T G/T 0.40 0.39 0.05 −1.35 0.07 8.22 × 10⁻⁹ 0.23 8.72 × 10⁻⁹ 0.0 4.0 — −1.17 — 0.005 8.22 × 10⁻⁹ — 3.26 × 10⁻¹⁰ — — — 16 17 18 19 20 17 7 1 13 3 rs9912468 rs7784776 rs4074536 rs1886512 rs2242285 G/C G/A C/T A/T A/G 0.43 0.39 0.43 0.39 0.29 −0.42 0.37 −0.40 0.42 0.37 0.07 0.07 0.07 0.07 0.07 10−8 10−8 10−8 10−8 10−8 28.2 0.0 0.5 0.0 35.4 — 0.36 — −0.28 0.29 — 0.015 — 0.047 0.040 1.06 1.28 2.36 1.27 1.09 21 22 10 17 rs1733724 rs17608766 A/G C/T 0.25 0.16 0.09 1.26 × 10⁻⁷ 0.10 3.71 × 10⁻⁷ 0.0 13.8 0.34 0.92 1 © 2010 Nature America, Inc. All rights reserved. Coded/ non-coded Allele AF 0.49 0.53 1.06 1.42 2.36 4.31 4.79 × × × × × × × × × × 10−8 10−9 10−8 10−8 10−8 — — — — — — — — — — 0.035 3.05 × 10⁻⁸ — 4.7 × 10⁻⁵ 4.75 × 10⁻¹⁰ — — — Nearest gene SNP annotation SCN10A SCN10A-SCN5A SCN5A/EXOG SCN5A SCN5A EXOG CDKN1A C6orf204SLC35F1PLN-BRD7P3 NFIA HAND1-SAP30L TBX20 SIPA1L1 TBX5 TBX3 Intron Intergenic Intergenic Intron Intron Intron Intergenic Intergenic VTI1A SETBP1 HEATR5B-STRN TKT-PRKCDCACNA1D CRIM1 C1orf185RNF11CDKN2C-FAF1 PRKCA IGFBP3 CASQ2 KLF12 LRIG1SLC25A26 DKK1 GOSR2 Intron Intron Intron Intron Intron Intergenic Intergenic Intron 3′ UTR Intergenic Intron Intergenic Intron Intergenic Missense Intron Intron Intergenic Intron, 3′ UTR In each locus, at least one marker exceeded the genome-wide significance threshold of P < 5 × 10⁻⁸. At locus 1, six signals were identified (r2 < 0.05) that exceeded this genomewide threshold. In a multi-SNP model that included all six SNPs, there was evidence that at least four of these SNPs were independently associated with QRS duration. The bolded allele is the coded allele. β values estimate the difference in QRS interval in milliseconds per copy of the coded allele, adjusted for the covariates in the model. Chr., chromosome; AF, coded allele frequency; s.e., standard error; GC, genomic-control adjusted; UTR, untranslated region. AF is an average weighted by study size. i ntraventricular conduction defects, as opposed to those with left or right bundle branch block (Supplementary Table 3a,b). Similar results were observed using an unweighted genotype risk score. Putative functional variants Of the 612 genome-wide significant SNPs, one in SCN5A (rs1805124, His558Arg, P = 2.4 × 10⁻¹⁸), two in SCN10A (rs12632942, Leu1092Pro, P = 5.1 × 10⁻¹¹, and rs6795970, Ala1073Val, P = 5 × 10⁻²⁷), one in C6orf204 near PLN (rs3734381, Ser137Gly, P = 1.1 × 10⁻¹⁰) and one in CASQ2 (index SNP rs4074536, Thr66Ala, P = 2.4 × 10⁻⁸) were non-synonymous (Fig. 2 and Supplementary Fig. 2). The PolyPhen-2 program predicts all five of these variants to be benign, which is consistent with small-effect associations: each copy of the minor allele was associated with cross-sectional differences in QRS duration of less than 1 ms. The 25 index SNPs (Table 1) were subsequently tested for association with gene cis expression levels in 1,240 PAXgene whole blood samples10. Four cis expression QTLs (eQTLs) were detected after stringent Bonferroni correction (Supplementary Fig. 3). The most notable eQTLs were observed for probes in exonic regions of TKT (rs4687718, P = 5.87 × 10−70) and CDKN1A (rs9470361, P = 1.41 × 10⁻¹⁰) and in an intronic probe for C6orf204 near PLN (rs11153730, 1070 P = 1.54 × 10⁻¹⁰). We additionally assessed cis regulation for all HapMap SNPs for these three loci (± 250 kb around the SNPs). The top eSNPs for TKT (rs9821134) and C6orf204 (rs11970286) were in moderate to high LD (r2 = 0.47 and r2 = 0.91, respectively) with the top QRS signals at these loci. However, the top eSNP for CDKN1A, rs735013, was only weakly correlated with the QRS index SNP rs9470361 (r2 = 0.089). In a conditional analysis that included both CDKN1A locus SNPs in the regression model, both rs735013 and rs9470361 remained independently associated with expression levels (P = 1.7 × 10⁻⁹ and P = 2.3 × 10⁻⁵, respectively). Additionally, rs735013 itself was marginally associated with QRS duration (coded allele frequency = 0.39, β = 0.33 ms (s.e. = 0.07 ms), P = 2.4 × 10⁻⁶). Whether these associations in whole blood samples will be similar to associations in cardiac myocytes and conduction tissue deserves further investigation. Pleiotropic effects of ECG-associated variants To explore the shared genetic underpinnings between atrial and ventricular depolarization and conduction (as measured by PR and QRS intervals) as well as ventricular depolarization and repolarization (QRS and QT intervals), we examined the effects of previously published PR and QT SNPs with respect to QRS interval. Several QRS loci were VOLUME 42 | NUMBER 12 | DECEMBER 2010 Nature Genetics Articles QRS PR QT QRS SCN5A SCN10A TBX5 CAV1-CAV2 TBX3 PR QRS QT PLN SCN5A SCN10A PRKCA NOS1AP Nature Genetics VOLUME 42 | NUMBER 12 | DECEMBER 2010 –log10 P 0.8 rs11710077 rs9851724 18 60 0.5 rs2051211 12 r2 30 6 0 0 SLC22A14 OXSR1 XYLB SLC22A13 38,300 –log10 P b 12 EXOG ACVR2B SCN10A SCN5A SCN11A 38,600 Chromosome 3 position (kb) 38,900 90 rs883079 rs10850409 0.8 9 60 0.5 6 r 2 3 30 0 0 RBM19 113,000 c 12 –log10 P © 2010 Nature America, Inc. All rights reserved. rs10865879 90 rs6801957 rs11708996 24 TBX5 TBX3 113,300 113,600 113,900 Chromosome 12 position (kb) 114,200 90 rs17020136 rs7562790 9 0.8 60 0.5 6 r 3 0 STRN CRIM1 FEZ2 36,200 36,500 VIT 36,800 CEBPZ EIF2AK2 HEATR5B SULT6B1 PRKD3 CCDC75 C2orf56 QPCT 37,100 2 30 0 Recombination rate (cM/Mb) Bioinformatic network analysis of QRS-associated loci To examine the relationships between genetic loci associated with QRS duration, we developed an in silico relational network linking the loci based on published direct gene product interactions obtained from curated databases (Supplementary Fig. 4)14. Most loci meeting genome-wide significance mapped to this network after a minimum number of ‘linker’ nodes were incorporated to create a spanning 30 Recombination rate (cM/Mb) previously associated with PR or QT intervals, including PLN, TBX5TBX3 and SCN5A-SCN10A, the last of which is associated with all three traits (Supplementary Table 4a). We also tested 9 PR SNPs and 16 QT SNPs for their effect on QRS duration (Supplementary Table 4b)11–13. Our results suggest roles for CAV1-CAV2 (rs3807989, P = 5.8 × 10⁻⁶) and NOS1AP (rs12143842, P = 1.3 × 10⁻⁴) in QRS duration. Indeed CAV1-CAV2 was recently associated with QRS interval9. QRS duration is positively correlated with both PR interval (r = 0.09) and QT interval (r = 0.44)9. To test if these relationships are also observed genetically, we compared the directionality of the association of SNPs at the published PR and QT loci with those for QRS duration. Generally, the effects of SNPs on PR interval were positively correlated with their effects on QRS duration (r = 0.53). With the exception of TBX3, the loci influencing both PR and QRS intervals (SCN5A, SCN10A, TBX5 and CAV1-CAV2) do so in a concordant fashion (that is, variants that prolong PR also prolong QRS duration) (Fig. 3 and Supplementary Table 4a,b). By contrast, although QT and QRS are positively correlated at the population level, the effects of SNPs on QT interval were marginally negatively correlated with their effects on QRS interval (r = −0.08). Of the index SNPs at the four loci significantly associated with both QT and QRS interval (SCN5A-SCN10A, PRKCA, NOS1AP and PLN), only the PLN locus SNPs showed effects in the same direction (Fig. 3 and Supplementary Table 4a,b). a Recombination rate (cM/Mb) Figure 2 Association plots for select loci. Each SNP is plotted with respect to its chromosomal location (x axis) and its P value (y axis on the left). The tall blue spikes indicate the recombination rate (y axis on the right) at that region of the chromosome. The blue-outlined triangles indicate coding region SNPs. (a) Locus 1 (SCN5A-SCN10A) on chromosome 3. The six index signals are named with their rs numbers and highlighted in different colors (yellow, green, teal, blue, purple and red). Other SNPs in linkage disequilibrium with the index SNP are denoted in the same color. Color saturation indicates the degree of correlation with the index SNP. (b) Locus 8 (TBX5) and locus 9 (TBX3) on chromosome 12. (c) Locus 12 (HEATR5B-STRN) and locus 14 (CRIM1) on chromosome 2. 37,400 Chromosome 2 position (kb) etwork. This analysis provides a graphical overview of the intern connections among QRS-associated genetic loci and highlights both known and putative molecular mechanisms regulating ventricular conduction (see below for further discussion). Several of the ‘linker’ nodes incorporated in the network, such as GJA1 (encoding connexin 43), NEDD4, KCNMA1 and RYR2, are known modulators of cardiac electrical activity. Functional enrichment analysis of the QRS-associated network nodes (that is, loci with P < 5 × 10⁻⁸) using two independent software tools revealed that programs involved in heart development were highly overrepresented (P value range: P = 5.8 × 10⁻⁶ to P = 9.6 × 10⁻⁵)15,16. SCN10A function in a mouse model We undertook functional studies to determine whether our most significant locus was associated with ventricular conduction in mice. Transcriptional profiling suggests that Scn10a mRNA, which encodes the Nav1.8 sodium channel, is expressed in the ventricular myocardium and at higher levels in the specialized conduction system17. These data were confirmed and extended by quantitative Figure 3 Pleiotropic associations of PR, QRS and QT loci. Electrocardiographic tracing delineating the PR, QRS and QT intervals. PR and QRS intervals reflect myocardial depolarization and conduction time through the atria and down the atrioventricular node (PR) and throughout the ventricle (QRS) and are weakly positively correlated (r = 0.09). The majority of loci that influence both PR and QRS (SCN5A, SCN10A, TBX5 and CAV1-2) do so in a concordant fashion (meaning variants that prolong PR duration also prolong QRS duration). The notable exception is a region on chromosome 12, where variants in the TBX5 locus have a concordant effect, whereas those in nearby TBX3 have a discordant effect. By contrast, although QRS (ventricular depolarization) and QT (ventricular repolarization) are moderately positively correlated, the majority of loci (SCN5A, SCN10A, PRKCA and NOS1AP) that influence both phenotypes do so in a discordant fashion (meaning variants that prolong the QRS interval shorten the QT interval). The exception is the locus at PLN, where the variants have a concordant effect. 1071 Articles Figure 4 Expression and function of Scn10a Vehicle A-803467 EGFP+ EGFP– in the mouse heart. (a) Neonatal ventricular HV HV Vehicle myocytes from Cntn2-eGFP BAC transgenic EGFP Pre A-803467 mice were fluorescence-activated cell sorted and eGFP+ and eGFP− pools were analyzed by Cntn2 50 ms RT-PCR. Transcripts encoding eGFP, Cntn2 + and Scn10a were highly enriched in the eGFP HV Scn10a HV 20 ms fraction. Quantitative RT-PCR demonstrated Post 25.7-fold enrichment of Scn10a Nav1.8. GAPDH (b) Representative telemetric electro cardiographic recordings (lead II configuration) obtained 30 min after administration of vehicle alone (black tracing) or the Scn10a Nav1.8 antagonist A-803467 (green tracing). The two tracings are aligned at the onset of the QRS wave, and both PR interval and QRS interval prolongation were observed in drug-treated mice. (c) Representative intracardiac recordings showing HV intervals obtained before (Pre) and after (Post) administration of vehicle or A-803467. Significant HV prolongation was observed in drug-treated mice. © 2010 Nature America, Inc. All rights reserved. a PCR (Fig. 4a), demonstrating a 25.7-fold ± 1.1-fold (s.e.) enrichment of Scn10a Nav1.8 in Purkinje cells compared to working ventricular myocytes (n = 3 for each cell type; P = 0.002). Telemetric electrocardiographic recordings (lead II position) were obtained in conscious mice treated with A-803467, a potent Scn10a Nav1.8 antagonist, which blocks Nav1.8 100 times more potently than Nav1.5 with the doses used18. These studies showed a significant increase in QRS duration (11.6 ms (± 2.6 ms (s.e.)) to 14.5 ms (± 0.54 ms), n = 7, P < 0.001), whereas treatment with vehicle alone was without effect (11.4 ms (± 0.29 ms) to 11.9 ms (± 0.42 ms), n = 7, P value was not significant). The PR interval was also increased in drugtreated mice, from 31.4 ms (± 0.98 ms) to 42.5 ms (± 3.3 ms), n = 7, P < 0.01), whereas treatment with vehicle alone resulted in no significant change (32.6 ms (± 1.0 ms) to 33.4 ms (± 0.69 ms), n = 7, P value was not significant) (Fig. 4b). To further delineate the site of ventricular conduction slowing, we performed intra-cardiac recordings from mice treated with A-803467. These studies confirmed the significant increase in QRS duration (from 12.26 ms (± 0.62 ms) to 14.56 ms (± 0.58 ms), n = 7, P = 0.015), whereas treatment with vehicle alone was without significant effect (12.39 ms (± 0.52 ms) to 13.65 ms (± 0.97 ms), n = 5, P value was not significant). A-803467 treatment resulted in a 35.7% ± 1.2% increase in HV interval (from 9.33 ms (± 0.74 ms) to 12.67 ms (± 1.06 ms), P = 0.009), whereas treatment with vehicle alone was without significant effect (10.67 ms (± 0.83 ms) to 11.17 ms (± 1.10 ms, P value was not significant) (Fig. 4c). Taken together, these data indicate that the QRS prolongation may primarily reflect conduction slowing in the specialized ventricular conduction system. DISCUSSION Our meta-analysis of 14 GWAS consisting of 40,407 individuals of European descent with additional genotyping in 7,170 Europeans yielded genome-wide significant associations of QRS duration with common variants in 22 loci. Variations in four of these loci (locus 1, SCN5A-SCN10A; locus 2, CDKN1A; locus 8, TBX5; and locus 21, DKK1) were previously associated with QRS duration in smaller independent studies using both candidate gene and genome-wide approaches7–9. The 22 loci include genes in a number of interconnected pathways, including some previously known to be involved in cardiac conduction, such as sodium channels, calcium-handling proteins and transcription factors, as well as previously unidentified processes not known to be involved in cardiac electrophysiology, such as kinase inhibitors, growth factor-related genes and others. The electrocardiographic QRS interval reflects ventricular depolarization and conduction time. Ventricular myocyte depolarization occurs through cardiac membrane excitatory inward currents mediated by voltage-gated sodium channels19. The primary determinants of conduction velocity are the magnitude of excitatory inward 1072 b c currents flowing through these sodium channels, the extent of cellto-cell communication through gap junction–connexin coupling, and cell and tissue architecture and morphology19. Multiple pathways suggested in this study determine or modulate these key components of ventricular depolarization and conduction. Candidate genes in these pathways are briefly discussed in Box 1. Our strongest association signal (locus 1) mapped in or near two voltage-gated sodium channel genes: SCN5A and SCN10A. SCN5A encodes the cardiac Nav1.5 sodium channel and is well known for its role in cardiac conduction and other cardiovascular and electrophysiologic phenotypes20,21. SCN10A encodes the Nav1.8 sodium channel. We provide new data demonstrating that the SCN10A transcript and product is preferentially expressed in the mouse His-Purkinje system compared with the ventricular myocardium, and that Nav1.8 channel blockers result in QRS and HV interval prolongation, indicative of a slowing of impulse propagation in the specialized ventricular conduction system and a delayed activation of the ventricular myocardium. Notably, a recent study reported shortening of the PR interval in Scn10a knockdown mice and concluded that Nav1.8 prolongs cardiac conduction and that rs6795970, encoding the A1073V variant, is a gain-of-function allele8. Alternatively, the more rapid conduction they observed in the knockdown mice could reflect compensatory upregulation of TTX-sensitive currents, a phenomenon previously observed in Nav1.8-deficient DRG neurons22. We and others demonstrated previously that, in addition to their association with QRS duration, variants in SCN5A and SCN10A are associated with atrial conduction (PR interval) and myocardial repolarization (QT interval), as well as atrial and ventricular fibrillation8,9,13. These results emphasize the crucial role played by these genes in cardiac conduction and the generation of arrhythmias. Calcium regulation is integral to impulse propagation, modulating cellular electrophysiology, including sodium channel and gap-junction function, as well as tissue architecture20,23,24. Several of the loci associated with QRS duration contain genes directly related to calcium processes. As depicted in Supplementary Figure 4 and detailed in Box 1, these genes encode interrelated proteins that influence Ca2+ signaling (PLN in locus 3; PRKCA in locus 16; and CASQ2 in locus 18) and downstream effects (STRN in locus 12). Transcription factors regulating embryonic electrophysiologic development are critical for the integrity of impulse conduction25. We identified six transcription factors (TBX3 in locus 9; TBX5 in locus 8; TBX20 in locus 6; HAND1 in locus 5; NFIA in locus 4; and KLF12 in locus 19) in loci associated with QRS duration. Several of these transcription factors affect cardiac morphogenesis and may influence conduction by altering cellular and tissue architecture. Notably, they may also have direct electrophysiologic consequences by modifying factors involved in impulse conduction. For example, HAND1 and VOLUME 42 | NUMBER 12 | DECEMBER 2010 Nature Genetics Articles T-box factors regulate GJA5 (encoding connexin 40) and/or GJA1 (encoding connexin 43), and TBX5 binds to the ATP2A2 (also known as SERCA2A) promoter26. Our study suggests a number of processes and pathways not previously known to be involved in cardiac electrophysiology, including cyclin-dependent kinase inhibitors and genes related to tumorigenesis and cellular transformation. How these previously unidentified processes influence QRS duration remains to be defined. In pleiotropic analyses, most variants influencing both PR and QRS interval, with the exception of TBX3, were concordant in effect direction, consistent with the known shared physiologic processes underlying the two traits: depolarization and conduction time in the sino-atrial node, Box 1 Noteworthy genes within loci associated with QRS duration Of the 22 loci identified, common variants in four loci (SCN5A-SCN10A, CDKN1A, TBX5 and DKK1) were previously associated with QRS duration in genetic association studies. Mutations in two loci (SCN5A and TBX5) lead to inherited syndromes associated with conduction disease. Animal experiments show a role for several additional loci (HAND1, TBX3 and TBX5) in cardiac ventricular conduction, as detailed below. The remainder are new QRS loci, and their role in cardiac conduction remains to be elucidated. © 2010 Nature America, Inc. All rights reserved. (1) Cardiac sodium channel genes: • SCN5A (locus 1): SCN5A encodes the cardiac Nav1.5 sodium channel and is well known to influence cardiac conduction, as well as other cardiovascular and electrophysiologic phenotypes20,21. • SCN10A (locus 1): SCN10A encodes the Nav1.8 sodium channel, present in both ventricular myocardium and conduction fibers. Selective SCN10A blocker prolongs QRS interval. (2) Calcium-handling proteins: • CASQ2 (locus 18): CASQ2 regulates opening of the ryanodine receptor (encoded by RYR2)28,29. Cellular depolarization through sodium channels triggers calcium influx through L-type calcium channels, which in turn provokes RYR2-mediated calcium release from the sarcoplasmic reticulum. CASQ2 mutations have been associated with catecholaminergic polymorphic ventricular tachycardia30,31. • PLN (locus 3): Calcium uptake into the sarcoplasmic reticulum by SERCA2a is regulated by PLN (encoding cardiac phospholamban)32. The phosphorylation state of PLN is dependent on signaling pathways involving phosphatases and kinases, including that encoded by PRKCA32. We previously demonstrated that this locus is associated with both cardiac electrical properties (QT interval duration and heart rate) and size (left ventricular end diastolic dimension) in genome-wide association analyses11,12,33,34. • PRKCA (locus 16): Protein kinase C alpha activity affects dephosphorylation of the sarcoplasmic reticulum Ca2+ ATPase-2 (SERCA-2) pump inhibitory protein phospholamban (PLN) and alters sarcoplasmic reticulum Ca2+ loading and the Ca2+ transient35. • STRN (locus 12): Striatin is a Ca2+-calmodulin binding protein that directly binds to caveolin scaffolding protein. Striatin has recently been implicated in a canine model of arrhythmogenic right ventricular cardiomyopathy36,37. (3) Transcription factors: • TBX3 (locus 9) and TBX5 (locus 8): TBX3 and TBX5 encode transcription factors found in the cardiac conduction system. TBX5 (activator) competes with TBX3 (repressor) for the regulation of working myocardial genes such as GJA138,39. Common variations near TBX3 and TBX5 were associated with PR and QRS durations9,13. Mutations in TBX3 and TBX5 have been associated with rare inherited syndromes manifested by an array of defects including ventricular structural and/or conduction defects. • TBX20 (locus 6): TBX20 demarcates the left and right ventricles40 and mutations in TBX20 have been implicated in multiple structural defects in mouse and human models41,42. • HAND1 (locus 5): HAND1 encodes a transcription factor essential to cardiac morphogenesis43, with a mutation in this gene having been identified in human hearts with septal defects44. Overexpression of Hand1 in the adult mouse heart leads to loss of connexin 43 (encoded by GJA1) expression, QRS prolongation and predisposition to ventricular arrhythmia45. • NFIA (locus 4) and KLF12 (locus 19): Little is known about the role of Nuclear Factor One (NFIA) and Kruppel like protein 12 (KLF12) in cardiac tissue development. (4) Cyclin dependent kinase inhibitors: • CDKN1A (locus 2): CDKN1A is a negative regulator of cell cycle entry into G2/M phase and is upregulated by ERBB2 activation. ERBB2, encoding a member of the EGF-receptor family of tyrosine kinases, is essential for proper heart development, and its ligand neuregulin-1 promotes formation of the murine cardiac conduction system46. Furthermore, ERBB2 can modulate gap junction assembly and alter appropriate phosphorylation of connexin 43 in glial cells47. In addition, CDKN1A is upregulated by PRKCA (locus 16)48. • CDKN2C (locus 15): A member of the family of cyclin-dependent kinase inhibitors that prevent the activation of the CDK kinases, thus functioning as a cell-growth regulator that controls cell cycle G1 progression. (5) Other pathways: • CRIM1 (locus 14): CRIM1, encoding a cell-surface transmembrane protein that may bind to various members of the TGF-beta superfamily of ligands, is expressed in mouse and human cardiac tissues49,50. CRIM1 interacts with bone morphogenetic proteins, which induce the expression of CDKN1A (p21) 49,51. • LRIG1 (locus 20): LRIG1 is upregulated in malignancies. It negatively regulates the proto-oncogenic, tyrosine kinase receptor family ERBB2 (ref. 52). • SETBP1 (locus 11): SETBP1 encodes a ubiquitously expressed protein that binds to SET (ref. 53). The SETBP1-SET interaction has been hypothesized to be a component in tumor development. • TKT (locus 13): Transketolase (TKT) is a ubiquitous enzyme used in multiple metabolic pathways, including the pentose phosphate pathway54. • DKK1 (locus 21): DKK1, implicated in several tumors, inhibits the Wnt signaling pathway55. Wnt signaling is an important modulator of connexin43dependent intercellular coupling in the heart56. In cardiac tissue, it has an embryologic role with regard to axial development57. • SIPA1L1 (locus 7): SIPA1L1 appears to play a role in non-canonical Wnt signaling and contributes to development58. Nature Genetics VOLUME 42 | NUMBER 12 | DECEMBER 2010 1073 © 2010 Nature America, Inc. All rights reserved. Articles atria and atrioventricular node (PR interval) and depolarization and conduction time in the ventricles (QRS interval). By contrast, although QRS (ventricular depolarization) and QT (ventricular repolarization) are moderately positively correlated, most loci influencing both traits showed discordant effect directions (with the exception of the PLN locus). Investigating the physiologic foundations for these concordant and discordant PR-QRS and QT-QRS relationships could be particularly informative for elucidating the mechanisms by which these loci influence cardiac depolarization, conduction and repolarization. Several limitations of our study should be considered. First, although we have identified 22 loci significantly associated with QRS duration, the broad nature of LD among common variants generally precludes an unambiguous identification of the culprit variant or of the functional gene. For several genes (SCN5A, SCN10A, C6orf204 and CASQ2), there are common coding SNPs in high LD with the index SNP, which may lend some support for a functional role for these genes. Furthermore, our expression analysis in blood revealed very strong cis-eQTL associations for TKT and CDKN1A, lending additional support to these genes as functional candidates. It would be desirable to perform similar eQTL analyses based on expression data in myocardial cells or in conduction tissue. For our top signal in SCN10A, a gene which until recently was not known to be expressed in the heart, our functional work in mice confirms that SCN10A is involved in ventricular depolarization and conduction. Further fine mapping is needed at all 22 loci to conclusively test all genetic variation (rare and common) for a role in QRS modulation. To minimize the potential for confounding due to population substructure, we limited our analyses to individuals of European descent, a population for which we could assemble the largest number of samples. At the individual study level, the GWAS showed very little evidence for gross stratification (genomic inflation factor, λGC, values ranged from 1.00 to 1.05). However, one of our QRS loci, mapping to HAND1-SAP30L, showed evidence of heterogeneity. In genetic association studies, heterogeneity can be due to sampling error, differences in phenotypic measurement, differences in LD structure between populations, technical artifacts, or genuine biological heterogeneity, but it would be difficult to conclude on the basis of our data here which of these is the most likely explanation27. Our study underscores the power of a large genome-wide association study to extend prior biological understanding of cardiac ventricular conduction. Better understanding of the complex biologic pathways and molecular genetics associated with cardiac conduction and QRS duration may offer insight into the molecular basis underlying the pathogenesis of conduction abnormalities that can result in increased risk of sudden death, heart failure and cardiac mortality. URLs. MACH, http://www.sph.umich.edu/csg/abecasis/mach/; MANTEL, http://www.broadinstitute.org/~debakker/mantel.html; MetABEL, http://mga.bionet.nsc.ru/~yurii/ABEL/; BIMBAM, http:// quartus.uchicago.edu/~yguan/bimbam/; METAL, http://www.sph. umich.edu/csg/abecasis/metal/; PLINK, http://pngu.mgh.harvard. edu/~purcell/plink/; IMPUTE, https://mathgen.stats.ox.ac.uk/impute/ impute.html; SNPTEST, http://www.stats.ox.ac.uk/~marchini/software/ gwas/snptest.html; 1000 Genomes Project, http:// www.1000Genomes. org/; SNAP, http://www.broadinstitute.org/mpg/snap/; Ingenuity, http:// www.ingenuity.com/; DAVID, http://david.abcc.ncifcrf.gov/; GOTM, http://bioinfo.vanderbilt.edu/webgestalt/. Methods Methods and any associated references are available in the online version of the paper at http://www.nature.com/naturegenetics/. 1074 Note: Supplementary information is available on the Nature Genetics website. Acknowledgments Acknowledgments are available in the Supplementary Note. AUTHOR CONTRIBUTIONS Study concept and design: N.S., A.A., D.E.A., P.I.W.d.B., E.B., H.C., A.C., C.M.v.D., M.E., S.B.F., G.I.F., A.R.F., J.F., V.G., P.v.d.H., S.R.H., A.A.H., A.H., A.I., S.K., H.K.K., C.N.-C., B.A.O., A. Pfeufer, P.P.P., B.M.P., J.I.R., I.R., H.S., E.Z.S., B.H.C.S., A.G.U., A.V.S., U.V., H.V., T.J.W., J.F.W., A.F.W., N.J.S., Y.J. Acquisition of data: A.A., D.E.A., L.H.v.d.B., R.A.d.B., E.B., M.J.C., A.C., J.M.C., A.F.D., M.D., C.M.v.D., R.S.N.F., A.R.F., L.F., S.G., H.J.M.G., T.B.H., P.v.d.H., C.H., G.v.H., A.I., W.H.L.K., N.K., J.A.K., A.K., L.L., M.L., F.-Y.L., I.M.L., G.t.M., P.B.M., G.N., C.N.-C., B.A.O., R.A.O., S. Perz, A. Pfeufer, A. Petersmann, O.P., B.M.P., J.Q., F.R., J.I.R., I.R., N.J.S., C.S., M.P.S.S., M.F.S., E.Z.S., B.H.C.S., A.T., A.G.U., D.J.v.V., C.B.V., R.K.W., C.W., J.F.W., J.C.M.W., D.L., T.D.S. Statistical analysis and interpretation of data: A.A., D.E.A., T.A., P.I.W.d.B., N.S., E.B., A.C., L.A.C., M.E., K.E., G.I.F., A.R.F., L.F., J.F., C.F., S.A.G., W.H.v.G., S.G., V.G., P.v.d.H., C.H., S.R.H., A.I., T.J., W.H.L.K., X.L., K.D.M., I.M.L., M.M., I.M.N., S. Padmanabhan, A. Pfeufer, O.P., B.M.P., K.R., H.S., A.T., A.V.S., S.H.W., Y.A.W., N.J.S. Drafting of the manuscript: N.S., A.A., D.E.A, F.W.A., P.I.W.d.B., M.D., C.M.v.D,. M.E., G.I.F., J.F., S.A.G., V.G., C.H., A.I., Y.J., S.K., J.W.M., I.M.N., O.P., N.J.S., H.S., C.N.-C., P.v.d.H. Critical revision of the manuscript: A.A., D.E.A., T.A., F.W.A., J.C.B., R.A.d.B., E.B., H.C., M.J.C., A.C., J.M.C., L.A.C., A.F.D., M.D., C.M.v.D., M.E., K.E., S.B.F., G.I.F., A.R.F., J.F., W.H.v.G., V.G., T.B.H., P.v.d.H., C.H., S.R.H., G.v.H., A.A.H., A.H., A.I., Y.J., T.J., S.K., W.H.L.K., N.K., J.A.K., A.K., H.K.K., L.L., D.L., M.L., J.W.M., I.M.L., T.M., M.M., P.B.M., G.N., C.N.-C., I.M.N., C.J.O., B.A.O., S. Padmanabhan, S. Perz, A. Pfeufer, A. Petersmann, O.P., B.M.P., F.R., J.I.R., I.R., M.P.S.S., M.F.S., D.S.S., H.S., B.H.C.S., E.Z.S., A.T., A.G.U., D.J.v.V., U.V., H.V., T.J.W., H.-E.W., A.V.S., S.H.W., J.F.W., J.C.M.W., A.F.W. Obtained funding: L.H.v.d.B., E.B., H.C., M.J.C., A.C., J.M.C., A.F.D., C.M.v.D., S.B.F., G.I.F., W.H.v.G., H.J.M.G., V.G., P.v.d.H., A.H., Y.J., S.K., H.K.K., L.L., P.B.M., G.N., C.N.-C., C.J.O., B.A.O., R.A.O., P.P.P., B.M.P., J.I.R., I.R., N.J.S., N.S., T.D.S., A.G.U., D.J.v.V., U.V., H.V., T.J.W., R.K.W., H.-E.W., C.W., J.F.W., A.F.W., D.L. COMPETING FINANCIAL INTERESTS The authors declare competing financial interests: details accompany the full-text HTML version of the paper at http://www.nature.com/naturegenetics/. Published online at http://www.nature.com/naturegenetics/. Reprints and permissions information is available online at http://npg.nature.com/ reprintsandpermissions/. 1. Desai, A.D. et al. Prognostic significance of quantitative QRS duration. Am. J. Med. 119, 600–606 (2006). 2. Elhendy, A., Hammill, S.C., Mahoney, D.W. & Pellikka, P.A. Relation of QRS duration on the surface 12-lead electrocardiogram with mortality in patients with known or suspected coronary artery disease. Am. J. Cardiol. 96, 1082–1088 (2005). 3. Oikarinen, L. et al. QRS duration and QT interval predict mortality in hypertensive patients with left ventricular hypertrophy: the Losartan Intervention for Endpoint Reduction in Hypertension Study. Hypertension 43, 1029–1034 (2004). 4. Dhingra, R. et al. Electrocardiographic QRS duration and the risk of congestive heart failure: the Framingham Heart Study. Hypertension 47, 861–867 (2006). 5. Busjahn, A. et al. QT interval is linked to 2 long-QT syndrome loci in normal subjects. Circulation 99, 3161–3164 (1999). 6. Hanson, B. et al. Genetic factors in the electrocardiogram and heart rate of twins reared apart and together. Am. J. Cardiol. 63, 606–609 (1989). 7. Bezzina, C.R. et al. Common sodium channel promoter haplotype in Asian subjects underlies variability in cardiac conduction. Circulation 113, 338–344 (2006). 8. Chambers, J.C. et al. Genetic variation in SCN10A influences cardiac conduction. Nat. Genet. 42, 149–152 (2010). 9. Holm, H. et al. Several common variants modulate heart rate, PR interval and QRS duration. Nat. Genet. 42, 117–122 (2010). 10.Dubois, P.C. et al. Multiple common variants for celiac disease influencing immune gene expression. Nat. Genet. 42, 295–302 (2010). 11.Newton-Cheh, C. et al. Common variants at ten loci influence QT interval duration in the QTGEN Study. Nat. Genet. 41, 399–406 (2009). 12.Pfeufer, A. et al. Common variants at ten loci modulate the QT interval duration in the QTSCD Study. Nat. Genet. 41, 407–414 (2009). 13.Pfeufer, A. et al. Genome-wide association study of PR interval. Nat. Genet. 42, 153–159 (2010). 14.Calvano, S.E. et al. A network-based analysis of systemic inflammation in humans. Nature 437, 1032–1037 (2005). 15.Huang, W., Sherman, B.T. & Lempicki, R.A. Systematic and integrative analysis of large gene lists using DAVID bioinformatics resources. Nat. Protoc. 4, 44–57 (2009). VOLUME 42 | NUMBER 12 | DECEMBER 2010 Nature Genetics © 2010 Nature America, Inc. All rights reserved. Articles 16.Zhang, B., Schmoyer, D., Kirov, S. & Snoddy, J. GOTree Machine (GOTM): a webbased platform for interpreting sets of interesting genes using Gene Ontology hierarchies. BMC Bioinformatics 5, 16 (2004). 17.Pallante, B.A. et al. Contactin-2 expression in the cardiac Purkinje fiber network. Circ. Arrhythm. Electrophysiol. 3, 186–194 (2010). 18.Jarvis, M.F. et al. A-803467, a potent and selective Nav1.8 sodium channel blocker, attenuates neuropathic and inflammatory pain in the rat. Proc. Natl. Acad. Sci. USA 104, 8520–8525 (2007). 19.Desplantez, T., Dupont, E., Severs, N.J. & Weingart, R. Gap junction channels and cardiac impulse propagation. J. Membr. Biol. 218, 13–28 (2007). 20.Abriel, H. Cardiac sodium channel Na(v)1.5 and interacting proteins: physiology and pathophysiology. J. Mol. Cell. Cardiol. 48, 2–11 (2010). 21.Remme, C.A., Wilde, A.A. & Bezzina, C.R. Cardiac sodium channel overlap syndromes: different faces of SCN5A mutations. Trends Cardiovasc. Med. 18, 78–87 (2008). 22.Akopian, A.N. et al. The tetrodotoxin-resistant sodium channel SNS has a specialized function in pain pathways. Nat. Neurosci. 2, 541–548 (1999). 23.Saimi, Y. & Kung, C. Calmodulin as an ion channel subunit. Annu. Rev. Physiol. 64, 289–311 (2002). 24.Potet, F. et al. Functional interactions between distinct sodium channel cytoplasmic domains through the action of calmodulin. J. Biol. Chem. 284, 8846–8854 (2009). 25.Wolf, C.M. & Berul, C.I. Inherited conduction system abnormalities—one group of diseases, many genes. J. Cardiovasc. Electrophysiol. 17, 446–455 (2006). 26.Zhu, Y. et al. Tbx5-dependent pathway regulating diastolic function in congenital heart disease. Proc. Natl. Acad. Sci. USA 105, 5519–5524 (2008). 27.Lebrec, J.J., Stijnen, T. & van Houwelingen, H.C. Dealing with heterogeneity between cohorts in genomewide SNP association studies. Stat. Appl. Genet. Mol. Biol. 9 article 8 (2010). 28.Wei, L., Hanna, A.D., Beard, N.A. & Dulhunty, A.F. Unique isoform-specific properties of calsequestrin in the heart and skeletal muscle. Cell Calcium 45, 474–484 (2009). 29.Terentyev, D. et al. Abnormal interactions of calsequestrin with the ryanodine receptor calcium release channel complex linked to exercise-induced sudden cardiac death. Circ. Res. 98, 1151–1158 (2006). 30.Priori, S.G. et al. Clinical and molecular characterization of patients with catecholaminergic polymorphic ventricular tachycardia. Circulation 106, 69–74 (2002). 31.Postma, A.V. et al. Absence of calsequestrin 2 causes severe forms of catecholaminergic polymorphic ventricular tachycardia. Circ. Res. 91, e21–e26 (2002). 32.Wang, Y. & Goldhaber, J.I. Return of calcium: manipulating intracellular calcium to prevent cardiac pathologies. Proc. Natl. Acad. Sci. USA 101, 5697–5698 (2004). 33.Vasan, R.S. et al. Genetic variants associated with cardiac structure and function: a meta-analysis and replication of genome-wide association data. J. Am. Med. Assoc. 302, 168–178 (2009). 34.Eijgelsheim, M. et al. Genome-wide association analysis identifies multiple loci related with resting heart rate. Hum. Mol. Genet. 19, 3885–3895 (2010). 35.Braz, J.C. et al. PKC-alpha regulates cardiac contractility and propensity toward heart failure. Nat. Med. 10, 248–254 (2004). 36.Baillat, G. et al. Molecular cloning and characterization of phocein, a protein found from the Golgi complex to dendritic spines. Mol. Biol. Cell 12, 663–673 (2001). 37.Meurs, K.M. et al. Genome-wide association identifies a deletion in the 3′ untranslated region of Striatin in a canine model of arrhythmogenic right ventricular cardiomyopathy. Hum. Genet. 128, 315–324. (2010). 38.Boogerd, K.J. et al. Msx1 and Msx2 are functional interacting partners of T-box factors in the regulation of Connexin43. Cardiovasc. Res. 78, 485–493 (2008). 39.Hoogaars, W.M. et al. The transcriptional repressor Tbx3 delineates the developing central conduction system of the heart. Cardiovasc. Res. 62, 489–499 (2004). 40.Singh, R. et al. Tbx20 interacts with smads to confine tbx2 expression to the atrioventricular canal. Circ. Res. 105, 442–452 (2009). 41.Posch, M.G. et al. A gain-of-function TBX20 mutation causes congenital atrial septal defects, patent foramen ovale and cardiac valve defects. J. Med. Genet. 47, 230–235 (2009). 42.Bakker, M.L. et al. Transcription factor Tbx3 is required for the specification of the atrioventricular conduction system. Circ. Res. 102, 1340–1349 (2008). 43.Riley, P., Anson-Cartwright, L. & Cross, J.C. The Hand1 bHLH transcription factor is essential for placentation and cardiac morphogenesis. Nat. Genet. 18, 271–275 (1998). 44.Reamon-Buettner, S.M. et al. A functional genetic study identifies HAND1 mutations in septation defects of the human heart. Hum. Mol. Genet. 18, 3567–3578 (2009). 45.Breckenridge, R.A. et al. Overexpression of the transcription factor Hand1 causes predisposition towards arrhythmia in mice. J. Mol. Cell. Cardiol. 47, 133–141 (2009). 46.Rentschler, S. et al. Neuregulin-1 promotes formation of the murine cardiac conduction system. Proc. Natl. Acad. Sci. USA 99, 10464–10469 (2002). 47.Hofer, A. et al. C-erbB2/neu transfection induces gap junctional communication incompetence in glial cells. J. Neurosci. 16, 4311–4321 (1996). 48.Besson, A. & Yong, V.W. Involvement of p21(Waf1/Cip1) in protein kinase C alphainduced cell cycle progression. Mol. Cell. Biol. 20, 4580–4590 (2000). 49.Wilkinson, L. et al. CRIM1 regulates the rate of processing and delivery of bone morphogenetic proteins to the cell surface. J. Biol. Chem. 278, 34181–34188 (2003). 50.Kolle, G., Georgas, K., Holmes, G.P., Little, M.H. & Yamada, T. CRIM1, a novel gene encoding a cysteine-rich repeat protein, is developmentally regulated and implicated in vertebrate CNS development and organogenesis. Mech. Dev. 90, 181–193 (2000). 51.Pardali, K., Kowanetz, M., Heldin, C.H. & Moustakas, A. Smad pathway-specific transcriptional regulation of the cell cycle inhibitor p21(WAF1/Cip1). J. Cell. Physiol. 204, 260–272 (2005). 52.Laederich, M.B. et al. The leucine-rich repeat protein LRIG1 is a negative regulator of ErbB family receptor tyrosine kinases. J. Biol. Chem. 279, 47050–47056 (2004). 53.Minakuchi, M. et al. Identification and characterization of SEB, a novel protein that binds to the acute undifferentiated leukemia-associated protein SET. Eur. J. Biochem. 268, 1340–1351 (2001). 54.Zhao, J. & Zhong, C.J. A review on research progress of transketolase. Neurosci. Bull. 25, 94–99 (2009). 55.Fedi, P. et al. Isolation and biochemical characterization of the human Dkk-1 homologue, a novel inhibitor of mammalian Wnt signaling. J. Biol. Chem. 274, 19465–19472 (1999). 56.Ai, Z., Fischer, A., Spray, D.C., Brown, A.M. & Fishman, G.I. Wnt-1 regulation of connexin43 in cardiac myocytes. J. Clin. Invest. 105, 161–171 (2000). 57.Korol, O., Gupta, R.W. & Mercola, M. A novel activity of the Dickkopf-1 amino terminal domain promotes axial and heart development independently of canonical Wnt inhibition. Dev. Biol. 324, 131–138 (2008). 58.Tsai, I.C. et al. A Wnt-CKIvarepsilon-Rap1 pathway regulates gastrulation by modulating SIPA1L1, a Rap GTPase activating protein. Dev. Cell 12, 335–347 (2007). 1Division of Cardiology, Department of Medicine, University of Washington, Seattle, Washington, USA. 2Cardiovascular Health Research Unit, Department of Medicine, University of Washington, Seattle, Washington, USA. 3Genetic Epidemiology Unit, Department of Epidemiology, Erasmus Medical Center (MC), Rotterdam, The Netherlands. 4Centre for Medical Systems Biology, Leiden, The Netherlands. 5Division of Genetics, Department of Medicine, Brigham and Women’s Hospital, Harvard Medical School, Boston, Massachusetts, USA. 6Program in Medical and Population Genetics, Broad Institute, Cambridge, Massachusetts, USA. 7Department of Medical Genetics, University Medical Center, Utrecht, The Netherlands. 8Julius Center for Health Sciences and Primary Care, University Medical Center, Utrecht, The Netherlands. 9Department of Internal Medicine B, Ernst Moritz Arndt University Greifswald, Greifswald, Germany. 10Center for Human Genetic Research, Massachusetts General Hospital, Boston, Massachusetts, USA. 11Cardiology Division, Massachusetts General Hospital, Boston, Massachusetts, USA. 12National Heart, Lung, and Blood Institute’s (NHLBI) Framingham Heart Study, Framingham, Massachusetts, USA. 13Unit of Genetic Epidemiology and Bioinformatics, Department of Epidemiology, University Medical Center Groningen, University of Groningen, Groningen, The Netherlands. 14Department of Cardiology, University Medical Center Groningen, University of Groningen, The Netherlands. 15Institute of Medical Informatics, Biometry and Epidemiology, Chair of Epidemiology, LudwigMaximilians-Universität, Munich, Germany. 16Department of Medicine I, University Hospital Grosshadern, Ludwig-Maximilians-Universität, Munich, Germany. 17Institute of Epidemiology, Helmholtz Zentrum München-German Research Center for Environmental Health, Neuherberg, Germany. 18Department of Epidemiology, Erasmus MC, Rotterdam, The Netherlands. 19Division of Epidemiology and Community Health, School of Public Health, University of Minnesota, Minneapolis, Minnesota, USA. 20Institute of Genetic Medicine, European Academy Bozen-Bolzano (EURAC), Bolzano, Italy, affiliated institute of the University of Lübeck, Germany. 21Institute of Cardiovascular and Medical Sciences, College of Medical, Veterinary and Life Sciences, University of Glasgow, University Place, Glasgow, UK. 22Medical Research Council (MRC) Human Genetics Unit, Institute of Genetics and Molecular Medicine, Edinburgh, UK. 23Icelandic Heart Association, Kopavogur, Iceland. 24University of Iceland, Reykjavik, Iceland. 25Andrija Stampar School of Public Health, Medical School, University of Zagreb, Zagreb, Croatia. 26Leon H. Charney Division of Cardiology, New York University School of Medicine, New York, New York, USA. 27Department of Genetics, University Medical Center Groningen, University of Groningen, The Netherlands. 28Section of Cardiovascular Medicine, Boston University School of Medicine, Boston, Massachusetts, USA. 29Institute of Human Genetics, Helmholtz Zentrum München-German Research Center for Environmental Health, Neuherberg, Germany. 30Institute of Human Genetics, Klinikum Rechts der Isar, Technische Universität München, Munich, Germany. 31Center for Lung Biology, Department of Medicine, University of Washington, Seattle, Washington, USA. 32Interfaculty Institute for Genetics and Functional Genomics, Ernst Moritz Arndt University Greifswald, Greifswald, Germany. 33Department of Epidemiology and the Welch Center for Prevention, Epidemiology and Clinical Research, Johns Hopkins University, Baltimore, Maryland, USA. 34Department of Internal Medicine, Erasmus MC, Rotterdam, The Netherlands. 35Department of Epidemiology, Johns Hopkins University, Baltimore, Maryland, USA. 36Clinical Pharmacology and Barts and the London Genome Centre, William Harvey Research Institute, Barts and the London School of Medicine, Queen Mary University of Nature Genetics VOLUME 42 | NUMBER 12 | DECEMBER 2010 1075 © 2010 Nature America, Inc. All rights reserved. Articles London, London, UK. 37Barts and the London National Institute of Health Research Cardiovascular Biomedical Research Unit, London, UK. 38Department of Biostatistics, University of Washington, Seattle, Washington, USA. 39Department of Biostatistics, Boston University School of Public Health, Boston, Massachusetts, USA. 40Centre for Population Health Sciences, University of Edinburgh, Edinburgh, Scotland. 41Department of Cardiology, Division of Heart and Lungs, University Medical Center Utrecht, Utrecht, The Netherlands. 42McKusick-Nathans Institute of Genetic Medicine, Johns Hopkins University School of Medicine, Baltimore, Maryland, USA. 43Department of Medical Informatics, Erasmus MC, Rotterdam, The Netherlands. 44Institute of Clinical Chemistry and Laboratory Medicine, Ernst Moritz Arndt University Greifswald, Greifswald, Germany. 45Laboratory of Epidemiology, Demography and Biometry, National Institute on Aging, National Institutes of Health, Bethesda, Maryland, USA. 46Epidemiological Cardiology Research Center (EPICARE), Wake Forest University School of Medicine, Winston Salem, North Carolina, USA. 47Department of Epidemiology, University of Washington, Seattle, Washington, USA. 48Department of Health Services, University of Washington, Seattle, Washington, USA. 49Group Health Research Institute, Group Health Cooperative, Seattle, Washington, USA. 50Department of Clinical Genetics, Erasmus MC, Rotterdam, The Netherlands. 51Institute for Biological and Medical Imaging, Helmholtz Zentrum München-German Research Center for Environmental Health, Neuherberg, Germany. 52Netherlands Genomics Initiative (NGI)-sponsored Netherlands Consortium for Healthy Aging (NCHA), Rotterdam, The Netherlands. 53Institute for Community Medicine, Ernst Moritz Arndt University Greifswald, Greifswald, Germany. 54Department of Twin Research and Genetic Epidemiology Unit, St. Thomas’ Campus, King’s College London, St. Thomas’ Hospital, London, UK. 55Human Genetics Center, University of Texas Health Science Center at Houston, Houston, Texas, USA. 56Institute for Molecular Medicine, University of Texas Health Science Center at Houston, Houston, Texas, USA. 57Medical Genetics Institute, Cedars-Sinai Medical Center, Los Angeles, California, USA. 58National Heart, Lung, and Blood Institute, Bethesda, Maryland, USA. 59Klinikum Grosshadern, Munich, Germany. 60Department of Pharmacology, Center for Pharmacology and Experimental Therapeutics, Ernst Moritz Arndt University Greifswald, Greifswald, Germany. 61Department of Experimental and Diagnostic Medicine, University of Ferrara, Ferrara, Italy. 62University of Dundee, Ninewells Hospital and Medical School, Dundee, UK. 63Blizard Institute of Cell and Molecular Science, Barts and The London School of Medicine and Dentistry, Queen Mary University of London, London, UK. 64Department of Pulmonology, University Medical Center Groningen, University of Groningen, Groningen, The Netherlands. 65Department of Gastroenterology and Hepatology, University Medical Center Groningen, University of Groningen, Groningen, The Netherlands. 66Department of Neurology, Rudolf Magnus Institute, University Medical Center Utrecht, University of Utrecht, Utrecht, The Netherlands. 67Department of Medical Genetics and Rudolf Magnus Institute, University Medical Center Utrecht, Utrecht, The Netherlands. 68Center for Neurobehavioral Genetics, University of California, Los Angeles, California, USA. 69Department of Internal Medicine, University Medical Center Groningen, University of Groningen, Groningen, The Netherlands. 70Centre for Global Health, Medical School, University of Split, Split, Croatia. 71Gen-info Ltd. Zagreb, Croatia. 72Department of Neurology, General Central Hospital, Bolzano, Italy. 73Department of Neurology, University of Lübeck, Lübeck, Germany. 74Division of Clinical Developmental Sciences, St. George’s University of London, London, UK. 75Inspectorate of Health Care, The Hague, The Netherlands. 76Department of Cardiovascular Sciences, University of Leicester, Leicester, UK. 77Leicester NIHR Biomedical Research Unit in Cardiovascular Disease Glenfield Hospital, Leicester, UK. 78These authors contributed equally to this work. Correspondence should be addressed to N.S. ([email protected]), S.K. ([email protected]) or D.E.A. ([email protected]). 1076 VOLUME 42 | NUMBER 12 | DECEMBER 2010 Nature Genetics ONLINE METHODS Participating Studies. Details of the 15 participating studies are available in the Supplementary Note. © 2010 Nature America, Inc. All rights reserved. Phenotype modeling. We excluded individuals of non-European ancestry and those with QRS duration longer than 120 ms, which is often due to acquired left or right bundle branch block. We also excluded individuals with characteristics that may influence QRS duration, including a history of prior myocardial infarction or heart failure, atrial fibrillation on the electrocardiogram (ECG), pacemaker, Wolff-Parkinson-White syndrome, or use of class I and/or class III antiarrhythmic medications at the time of ECG acquisition. Covariates mea sured at baseline included age, gender, study site or cohort (if relevant), height and BMI. GWAS genotyping and imputations. Either Affymetrix or Illumina arrays were used for genotyping (Supplementary Table 1b). Each study performed filtering of both individuals and SNPs to ensure robustness for genetic analysis (Supplementary Table 1b). Each study used the genotypes generated with these platforms to impute genotypes for approximately 2.5 million autosomal SNPs based on LD patterns observed in the HapMap European CEU samples. Imputed genotypes were coded as dosages, fractional values between 0 and 2 reflecting the estimated number of copies of a given allele for a given SNP for each individual. Most studies used a Hidden Markov model as implemented in the MACH software (see URLs). In the Cardiovascular Health Study (CHS) imputation was performed using BIMBAM (see URLs). Extension genotyping. To extend our analyses, we genotyped nine SNP variants representing nine loci with P values ranging from P = 1 × 10⁻⁶ to P = 5 × 10⁻⁹ in an additional group of 7,170 individuals in the Prevention of Renal and Vascular Endstage (PREVEND) study. Of the nine SNPs, four represented loci with P values between P = 5 × 10⁻⁸ and P = 5 × 10⁻⁹ in the discovery phase (Table 1). The remaining five index SNPs (rs1733724 near DKK1; rs1662342 in an MYL12A intron; rs17608766, intronic in GOSR2; rs17362588, missense variant in CCDC141; rs2848901, intronic in FHOD3) had P values ranging from P = 1 × 10⁻⁶ to P = 5 × 10⁻⁸ and so needed additional statistical evidence in favor of the alternative hypothesis that they represented true associations. The SNPs were genotyped using TaqMan Allelic Discrimination Assays (ABI). Statistical methods. Associations between QRS duration and SNPs were tested using linear regression models under the assumption of an additive (allelic trend, Armitage) model of genotypic effect. These models were adjusted for age, gender, height, BMI and study site (as appropriate). In family-based cohorts, linear mixed modeling was implemented to control for relatedness among samples59. A genomic control correction factor (λGC), calculated from all imputed SNPs, was applied on a per-study basis to account for cryptic population substructure and other potential biases60. The regression results were meta-analyzed using inverse variance weighted fixed-effects models61. We conducted the meta-analysis by using three independent analysts and three different software packages: MANTEL, MetABEL and METAL (see URLs). All the results were extremely concordant, reflecting a robust analysis. To be conservative, we subsequently corrected all P values from the meta-analysis for the overall inflation factor (λGC = 1.059). Results were considered statistically significant at a P = 5 × 10⁻⁸ after inflation correction, a figure that reflects the estimated testing burden of one million independent SNPs in samples of European ancestry62. Regions harboring association signals were visualized using SNAP63. To discern independent SNPs in regions with multiple genome-wide significant hits, we used an LD-binning procedure as implemented in PLINK. Starting with the most significant result as the index SNP, all surrounding SNPs within 500 kb (regardless of P value) with a very liberal pairwise r2 > 0.05 were ‘clumped’ with the index SNP using LD patterns from HapMap CEU (release 27). The procedure was repeated until all SNPs found membership in a clump. Thus, all index SNPs are, by definition, in very weak LD (if at all) with one another (pairwise r2 < 0.05) and are, as such, suggestive of independent signals of association. We then evaluated a multivariate regression model based on 28 index SNPs that reached genome-wide significance in the discovery meta-analysis to test doi:10.1038/ng.716 which index SNPs represented true independent signals. We set the significance threshold for claiming independence based on the estimated number of uncorrelated tests we performed across the 20 genetic loci (that contain the 28 ‘independent’ index SNPs). At these 20 loci, there are 21,551 SNPs surrounding the index SNPs within 500 kb in HapMap CEU samples, but after correcting for LD, we arrived at ~1,563 tests, which corresponds to a threshold of P < 3.2 × 10⁻⁵. Through meta-analysis of the multivariate P values across the participating cohorts with the largest sample sizes, we found significant evidence for four independent SNPs at the SCN10A-SCN5A locus (Table 1) but not elsewhere. To test for an association with QRS greater than 120 ms, we calculated a SNP score for each individual in the RS and ARIC studies by adding up the number of QRS-prolonging alleles from the dosage counts and weighting by the β estimate from the meta-analysis. Logistic regression modeling was then performed with QRS greater than 120 ms as the dependent variable (dichotomous trait), which was regressed on the score, adjusting for age, sex, height, BMI and study site. Because QRS interval is strongly influenced by sex, and inherited conduction defects can show a pronounced influence with aging, we explored whether the 23 genetic associations identified by our discovery GWAS meta-analysis (index SNPs at each of the 20 QRS-associated loci plus three additional independent SNPs at locus 1) differed by sex or age. For interactions with sex, we performed analyses in each cohort including an interaction term for sex × genotype, and then we used inverse variance weighting to meta-analyze the interaction terms. For interactions with age, each cohort performed separate analyses for each SNP stratified by decade, and then we performed regression analyses to assess the effect of age on the magnitude of the genetic effect. eQTL analysis. We used genomics data from 1,240 PAXgene whole blood samples10. The samples were expression profiled on an Illumina HT-12 platform and genotyped using either an Illumina Hap370 or 610-Quad platform. Ungenotyped SNPs were imputed with the IMPUTE software (see URLs). We applied a 500-kb window (250 kb on each side) around each of the 25 QRS-associated SNPs and tested the cis expression-genotype association using SNPTEST (see URLs). One hundred forty-two independent probes were examined at 22 QRS loci (comprising 25 index SNPs), resulting in a total of 198 probe-SNP pairs tested. Bonferroni adjustment was applied for the tested probe-SNP pairs (P < 2.5 × 10⁻⁴ was deemed significant). The eQTLs were checked for possible polymorphisms within the probe region. 1000 Genomes Project data (April 2009 release) was used to assess LD between the detected eSNP and the SNPs located within the probe region. If r2 > 0.05 between an eSNP and the SNPs in the probe region, the eQTL was deemed a false positive assuming the ‘probe SNP’ caused differential hybridization. Bioinformatics. All identified QRS loci were chosen to generate a gene product interaction network using Ingenuity Pathway Analysis software14. For locus 1, two genes were independently associated with QRS duration (SCN5ASCN10A) and both were included in the network. For loci 3, 5, 12, 13, 15, 21 or 22, where it was difficult to discern to which of several genes the association signal might map, several genes (listed in Table 1 for each of the loci) were included in the model. Of these seven loci, three (loci 13, 15 and 21) had two members each map to the network. We limited the relational network to known direct relationships (for example, protein-protein interaction, phosphorylation or physical binding). To ensure a spanning network, Ingenuity algorithmically incorporated additional nodes that interact with the QRSassociated loci. However, we limited these ‘linkers’ such that the relational distance among the QRS-associated loci was no more than one linker node. In some cases, this resulted in a genome-wide significant locus to remain unconnected to the network (for example, GOSR2, CRIM1 and NFIA). We systematically searched PubMed to find direct gene product relationships among the network nodes to complement the original network. Relationships highlighted in this network have been compiled from a range of experimental conditions, organisms and tissue types, and therefore may not correspond to actual pathways in the human heart. For the functional enrichment analysis, we used two independent online tools, the Database for Annotation, Visualization and Integrated Discovery (DAVID, v6.7) and GOTree Machine (GOTM), to Nature Genetics i dentify Gene Ontology categories overrepresented among the QRS-associated loci relative to the entire human genome background15,16. A modified version of Fisher’s Exact test (DAVID) and the hypergeometric test (GOTM) were used to determine the probability that a functional category is enriched compared to that expected from random chance. Mouse model. Quantitative real-time PCR. Enhanced green fluorescent protein (EGFP)+ Purkinje cells and EGFP− ventricular myocytes were isolated from neonatal Cntn2-EGFP transgenic mice by fluorescence-activated cell sorting17,64. Quantitative PCR was performed user primers (Supplementary Table 5) for SCN10A and ribosomal S26 as an internal reference using the 2-ΔΔCT method65. 59.Chen, W.M. & Abecasis, G.R. Family-based association tests for genomewide association scans. Am. J. Hum. Genet. 81, 913–926 (2007). 60.Devlin, B., Roeder, K. & Wasserman, L. Genomic control, a new approach to geneticbased association studies. Theor. Popul. Biol. 60, 155–166 (2001). 61.de Bakker, P.I. et al. Practical aspects of imputation-driven meta-analysis of genomewide association studies. Hum. Mol. Genet. 17, R122–R128 (2008). 62.Pe’er, I., Yelensky, R., Altshuler, D. & Daly, M.J. Estimation of the multiple testing burden for genomewide association studies of nearly all common variants. Genet. Epidemiol. 32, 381–385 (2008). 63.Johnson, A.D. et al. SNAP: a web-based tool for identification and annotation of proxy SNPs using HapMap. Bioinformatics 24, 2938–2939 (2008). 64.Sreejit, P., Kumar, S. & Verma, R.S. An improved protocol for primary culture of cardiomyocyte from neonatal mice. In Vitro Cell. Dev. Biol. Anim. 44, 45–50 (2008). 65.Livak, K.J. & Schmittgen, T.D. Analysis of relative gene expression data using real-time quantitative PCR and the 2(-Delta Delta C(T)) method. Methods 25, 402–408 (2001). 66.Lee, P. et al. Conditional lineage ablation to model human diseases. Proc. Natl. Acad. Sci. USA 95, 11371–11376 (1998). © 2010 Nature America, Inc. All rights reserved. Electrophysiologic testing. Telemetric devices (DSI) were implanted into adult CD1/129SI/SV1MJ mice and recordings were obtained before and 30 min after intraperitoneal injection of the Nav1.8 antagonist A-803467 (100 mg/kg)66. Intracardiac recordings were obtained using an open-chest model under isoflurane anesthesia (1.5% v/v) using an octapolar catheter (EPR-800, Millar Instruments) placed in the right jugular vein. Nature Genetics doi:10.1038/ng.716


© Copyright 2026