
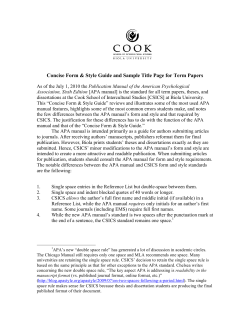
Self-Efficacy, Financial Stress, and the Decision to Seek
Self-Efficacy, Financial Stress, and the Decision to
Seek Professional Financial Planning Help
Jodi C. Letkiewicz
Dale L. Domian
Chris Robinson
Natallia Uborceva
York University
Toronto, Canada
Presented at the Academy of Financial Services annual meeting
Nashville, Tennessee
October 2014
Self-Efficacy, Financial Stress, and the Decision to Seek Professional Financial Planning Help
Abstract
Canadian survey data is used to establish how financial self-efficacy and financial stress affect
one’s tendency to seek professional financial planning help. Self-efficacy is the belief in one’s own ability
to succeed at a task. It is related to other behavioral characteristics such as self-confidence, motivation,
optimism, and the belief that one can cope with a variety of life’s challenges (Bandura 1997, 2006). We
find in this study that one’s sense of financial self-efficacy positively predicts the likelihood to seek
professional financial help after controlling for age, income, education, assets and debt, and
employment.
Background
What are the benefits of professional financial planning help?
Professional financial planning is an important option for overall financial well-being. Financial
planners have tools and expertise lacking in the general population. As financial circumstances become
more complicated, financial planners can help individuals and households decide which financial
decisions are in their best interest. As part of understanding financial help-seeking behavior, we need to
clarify the goals of financial planning. If those results can be quantified in dollar terms, then cost-benefit
analyses are possible. That is, we may be able to determine under what circumstances individuals will get
results that exceed the fees paid to the financial planner.
The potential benefits of professional financial planning help may vary across the components of
financial planning. Altfest (2004) notes six broad areas: tax planning, cash flow planning, investments,
risk management, retirement planning, and estate planning. The first area, tax planning, may offer the
simplest opportunity for assessing the value of financial planning. If a planner charges someone $5000 for
advice that produces an immediate $10,000 reduction in income taxes, then that individual may view this
as a clear gain. However, as described below, many complexities are encountered in assessing other areas
of planning.
Hanna and Lindamood (2010) use an expected utility approach to study issues in three of
Altfest’s six areas. Their theoretical method avoids some crucial problems posed by survey data or other
empirical methods. For example, in the 2007 Survey of Consumer Finances, the median net worth was
$275,700 for households using financial planners, compared to $87,500 for households not using
financial planners. But Hanna and Lindamood caution against concluding that the financial planners were
responsible for the tripling of net worth, since the people who chose to use planners may have done so
because they already had higher income and net worth.
The first area considered by Hanna and Lindamood is risk management. They construct two
simple examples, one involving a 0.1% chance of losing 80% of wealth, and the other with a higher
probability (1%) of a more modest loss (20% of wealth). The household’s net worth is assumed to be $2.5
million. In the first scenario, for plausible levels of risk aversion, certainty equivalent wealth (CEW)
increases by more than $200,000 if they purchase insurance against the loss. In the second scenario, CEW
increases by only a few thousand dollars. If the household did not otherwise know to purchase insurance,
the CEW increase is the value of that advice from the financial planner.
The second area examined by Hanna and Lindamood is investments. If the household would
otherwise choose only risk-free investments, what is the value of advice to choose a riskier portfolio with
a higher expected return? Again, the answer is provided by comparing CEWs. Interestingly, the increases
in CEW are quite modest, and are negative for highly risk-averse households. Comparing the results from
these two areas, Hanna and Lindamood conclude that “most people would place relatively high values on
risk reduction strategies and relatively low values on wealth increasing strategies.” (p. 121)
The final area studied by Hanna and Lindamood is consumption smoothing, which falls under
Altfest’s retirement planning category. The assumption is a household income stream which steadily rises
from age 25 to 65, and then plunges to a modest constant pension in retirement. If a household does not
save and therefore consumes 100% of income each year, then consumption similarly plunges at
retirement. Utility is increased by an optimal consumption path, which requires savings during the
2
working years in order to augment income during retirement. In each of the three examples constructed
by Hanna and Lindamood, the value of advice to follow an optimal savings plan exceeds $400,000.
Marsden, Zick, and Mayer (2011) take a different approach. Although their study is titled “The
Value of Seeking Financial Advice,” they do not give dollar values for the benefits. They use a propensity
score method to create a matched sample of those who met with financial advisors, and those who did not.
The key element of the matching process is a logit model to estimate probabilities of meeting with an
advisor. After controlling for self-selection, they found statistically significant results in several areas.
Respondents who had met with a financial advisor were more likely to subsequently establish long-term
goals; calculate their retirement needs; establish retirement accounts and emergency funds; display
appropriate investment responses to a recession; and have greater retirement confidence.
Cummings (2013) shows that individuals with financial advisors are more likely to have Roth
IRAs, and to start them at an earlier age. He also demonstrates long-run benefits, both financial and
non-financial, among older respondents. Further findings about older adults are presented by Cummings
and James (2014) in an analysis of decisions to either get or drop financial advisors. The most
significant factors in getting a financial advisor included becoming a new widow(er), asking family
members for assistance with financial decisions, seeking help for emotional problems, and positive
changes in income and net worth. Similarly, new widow(er)s and people with increased net worth were
less likely to drop their financial advisors.
Who is likely to seek financial help?
The decision to seek help is relevant across multiple domains, including medicine, mental
health, and personal finance. Health and finances are two big stressors in modern day life. As such,
research has focused on whether people, when faced with financial or medical problems, decide to seek
help for those problems. Research in health fields has been more prolific than research in the financial
field, but financial planning is gaining traction. Some of the first researchers to consider help-seeking
in a financial content were Grable and Joo (1999). Grable and Joo conceptualized help-seeking behavior
as a coping strategy to deal with financial troubles. They developed a framework consisting of five
3
stages including the recognition and evaluation of one’s own financial behaviors to the process of
seeking professional help when they recognized problems with which they needed help. Other theories
and frameworks have been used to better understand help-seeking behaviors including Stigler’s (1961)
model of the economics of information and the Transtheoretical Model of Behavior Change (Prochaska
and Velicer, 1997).
Grable and Joo (2001) examine the choice between obtaining financial advice from
professionals versus non-professionals. They find that financial risk tolerance and financial satisfaction
are the key variables which differentiate between individuals who seek help from a professional source,
and those who turn to family, friends, and work colleagues for advice. Individuals with lower income
and lower self-esteem tend to seek help from non-professionals; this was confirmed in a medical setting
by Banerjee and Suparana (1998), and by duPlessis, Lawton, and Corney (2010) who find that barriers
to financial help-seeking included shame and embarrassment, as well as lack of knowledge about
professional sources. Dearden et al. (2010) demonstrate gender differences in help-seeking for debt
problems.
Hanna (2011) uses four separate waves of the Survey of Consumer Finances, from 1998 to
2007, to analyze the likelihood of using a financial planner. In the first three waves, reported use of
financial planners was roughly constant at 21.1% to 22.0% percent of households. In the 2007 wave,
usage was significantly higher at 25.2%. However, there were large differences across a variety of
independent variables. Descriptive statistics show greater usage of financial planners among people
with above average risk tolerance, post-bachelor degree education, higher household income, and higher
net worth. A logistic relation shows how each independent variable affects the likelihood of using a
financial planner when all other variables are set at the sample means. One methodological advance is
to specify net worth as a piecewise log variable, in order to test separately for negative net worth which
was reported by 7% of the households.
4
Self-Efficacy
There has been a strong push towards improving financial literacy of consumers, with the
argument being that more financially literate consumers will be able to navigate the complex financial
systems and make decisions in their own best interest. Researchers, however, have been unable to
identify effective ways at improving financial literacy and there is a lack of evidence that even those
with more financial knowledge make better decisions (Willis, 2008). What has arisen from the research
is the theory that better consumer financial decision making stems from financial self-efficacy
(Remund, 2010) – a belief that one can effectively manage their personal financial affairs. Confirming
this link between knowledge and self-efficacy, Heckman and Grable (2011) found that college
students’ financial knowledge was positively associated with financial self-efficacy.
It is reasonable to expect that there is a connection between financial self-efficacy and the
tendency to seek financial planning help. In the cognitive theory of stress and coping, self-efficacy acts
as a mediator of stress and stress-related adaptive behaviors (Folkman, 1984; Folkman, Schaefer, &
Lazarus, 1979). Those with a high sense of financial self-efficacy believe they have the ability to
handle their financial affairs and are likely able to identify what they can manage and when they need
help. Those low in financial self-efficacy are less able to manage their financial affairs and are
therefore unable to determine when they need help. In a recent study, Lim et al. (2014) found that
college students with high levels of financial stress were generally less likely to seek financial help, but
that effect was moderated for those high in self-efficacy.
Self-efficacy is particularly important in the context of financial decisions and help-seeking
because it influences individuals’ behavioral changes (Bandura, 1977; Gecas, 1989). Research in the
health and exercise fields has demonstrated that self-efficacy can be boosted to encourage health
promoting behaviors (Grembowski et al., 1993). Individuals with high levels of self-efficacy have been
shown to be more successful than those with low self-efficacy in coping with adversity (Park &
Folkman, 1997). Findings from a study by Engleberg (2007) revealed correlations between economic
self-efficacy and the notion of adhering to saving plans and better self-control of emotions. Lapp (2010)
5
found higher financial self-efficacy was associated with lower debt, fewer financial problems, lower
financial stress, higher savings and greater financial happiness. In studies examining self-efficacy, risk
tolerance, age, and education have been found to be positively correlated with self-efficacy (Lown,
2011).
Engelberg (2007) found that respondents with a high sense of self-efficacy were less likely to
perceive themselves being at risk for disrupted income, unforeseen expenses, and unsuccessful
investments, as compared to those with low self-efficacy. Those with high self-efficacy also reported a
sense of financial control, less attachment to the importance of money, better economic knowledge, a
more optimistic view of their financial situation and less distrust in money matters. Lacking a sense of
economic self-efficacy has been associated with feelings of stress, negative emotion, and in more
extreme cases, depression (e.g. Burgogne, 1990; Krause and Baker, 1992; Mates and Allison, 1992;
Ennis et al., 2000).
Measuring Financial Self-Efficacy
Self-efficacy is domain specific (Badura 1997, 2006; Lown, 2011), meaning that it is not universal
across all aspects of one’s life. Badura’s research (2006) differentiates between general self-efficacy
and domain-specific self-efficacy and states that it is necessary to include items that relate to the
particular concept being measured. For example, the belief in one’s ability to complete a triathlon does
not necessarily mean they are able to manage their money with the same sense of confidence.
A number of measures of financial self-efficacy have been developed and deployed for use in
research. Dietz, Carrozza, and Ritchey (2003) developed a financial self-efficacy scale to analyze
retirement saving strategies. Three items in the scale include: (1) I have little control over financial
things that happen to me, (2) I often feel helpless in dealing with the money problems of life, and (3)
There is little I can do to change many of the important money issues in my life. Danes and Haberman
(2007) used financial self-efficacy to evaluate the effects a high school financial planning curriculum.
6
The two items measuring financial self-efficacy were: (1) I believe the way I manage my money will
affect my future, and (2) I feel confident about making decisions that deal with money. Lapp (2010)
measured financial self-efficacy with three items: (1) I was good at planning for my financial future, (2)
I was satisfied with my financial situation, and (3) I was able to save money.
Lown (2011) created a financial self-efficacy measure after recognizing both the importance of
self-efficacy in financial decisions, and also the lack of a concrete measure. Lown’s work began with a
10-item General Self-Efficacy Scale (GSES) developed by Schwarzer and Jerusalem (1995) and
validated in 30 countries. The GSES is a general measure that does not assess specific behavior;
therefore, Lown incorporated measures of financial behaviors to focus the measure specifically on
financial self-efficacy. The following six questions were asked: (1) It is hard to stick to my spending
plan when unexpected expenses arise, (2) It is challenging to make progress toward my financial goals,
(3) When unexpected expenses occur I usually have to use credit (4), When faced with a financial
challenge, I have a hard time figuring out a solution, (5) I lack confidence in my ability to manage my
finances, and (6) I worry about running out of money in retirement.
Engelberg (2007) used a measure of economic self-efficacy. To quantify the measure, the
survey included 23 items measuring economic risk perception and then asked the respondents the
extent to which themselves at risk of experiences each of the risks. A sample of the risks listed include
unemployment, financial assets decreasing in value, and paying more in interest on a loan than
originally planned. The respondents then rated the same 23 items to assess what they thought of their
ability to take precaution against each of the economic risks.
Theoretical Foundation
The Transtheoretical Model of Behavior Change (TTM) (Prochaska and Velicer, 1997) is the
theoretical model underlying the analysis presented in this paper. The TTM assesses an individual’s
willingness or ability to change a behavior and outlines processes to help guide individuals through the
7
stages. TTM has been used in studies to explain how people stop unhealthy behaviors and develop
healthy ones (Xiao et al., 2004) and extended to explain and predict positive changes in financial
behaviors based on participation in financial education programs (Shockey and Seiling, 2004). The TTM
outlines five stages that individuals go through when changing behaviors: pre-contemplation (not ready),
contemplation (getting ready), preparation (ready), action and maintenance. In order to progress through
those stages, individuals need awareness that the advantages of the change outweigh the disadvantages,
confidence they can make and maintain the changes (self-efficacy), and strategies to help them maintain
their new behaviors.
The theory is adapted slightly, focusing on the stages of habit formation (pre-contemplation,
contemplation, preparation, action and maintenance) rather than focusing on “bad behaviors”, and
incorporating an aspect of help-seeking. Separating the stages of positive habit formation may help
explain the precise reasons why people with low financial self-efficacy or high financial stress may resist
getting financial planning help. There are many ways to change and improve behaviors; this study will
focus primarily on the help-seeking aspect. Financial help-seeking will be considered as a positive habit
that can be developed to deal with financial stress.
Our hypothesis is that financial stress is the main trigger in the “pre-contemplation” and
“contemplation” stages of the TTM, while high financial self-efficacy is the trigger that leads to the
“preparation” stage. We also hypothesize that the “action” stage of the TTM is when financial planning
help is sought, and the “maintenance” stage is when the results of the help-seeking are realized. This
study is focused on the first four stages as our data does not allow us to test the maintenance phase. This
study does not attempt to test causality, but rather whether there is a correlation between financial stress,
financial self-efficacy and the decision to seek help.
Data
8
Data for this study come from a three-year longitudinal survey commissioned by the Financial
Planning Standards Council (FPSC) in Canada. The survey was conducted among the general Englishspeaking population of Canada. Quebec was excluded due to the assumption that financial planning is
subject to a specific provincial regulatory regime, which significantly differs in Quebec in comparison to
the other provinces.
The survey was repeated in three waves. In the first wave, 7,383 surveys were completed between
August 2009 and January 2010. In the second wave, 2,471 surveys were completed during February 2011
to July 2011; these respondents had also completed the first wave surveys. The third wave, from April to
August 2012, included 1,045 respondents from Waves 1 and 2, along with 7,501 new panelists. Wave 2
is excluded from the analysis because the interim data collection (Wave 2) was not conducted in the same
manner as Wave 1 and Wave 3 (for example, not all variables were collected and the sample size was
about 75% smaller than in the other two waves). Data from Waves 1 and 3 are combined to create a
dataset containing 14,793 observations. A categorical variable was created to control for the survey year
(Wave 1). This ensures that the results presented in the paper are not time-dependent.
The survey was designed to target households likely to seek help from a financial planner, with
quota minimums based on the type of financial advice received (Comprehensive/Integrated Planning,
Limited Planning); credentials of the advisors (Certified planners vs. Non-certified advisors); and those
using or not using an advisor. Therefore, the sample is not nationally representative. While this is
certainly a limitation of the dataset, we do not believe it introduces sufficient bias as to make the results
unreliable. As such, the results will not be generalizable to the greater population of Canada, only for the
subset seeking financial help.
The FPSC published some initial results of the survey in their document titled The Value of
Financial Planning. Findings indicate that on average, persons who seek professional financial-planning
help will experience greater financial and emotional well-being. The survey is much wider in scope than
just those topics published in the initial report, as this study utilizes the data along with a theoretical
foundation to delve deeper into the question of what affects the decision to use a financial planner.
9
The demographic variables include age (categorical variables), gender, marital status (married or
not currently married), educational attainment (no college degree, did not finish college, have a
university degree), employment status (unemployed, employed, or retired) and whether or not they
have children or supported extended family members. These variables likely affect help seeking
tendencies, but they are not our primary concern. They must be included to remove their effect before
we can determine the significance of our hypotheses. Financial variables (for example, assets, debt,
income, and homeowner status) will also be included in the model, as they are likely to affect the
likelihood to seek financial help. Finally, the effects of financial stress and financial self-efficacy will
be analyzed.
A series of questions on financial well-being were included in the survey. Principle component
factor analysis was conducted on a subset of these questions to construct measures of financial stress
and financial self-efficacy. The resulting constructs were built based on the analysis as well as findings
supported by related research.
Financial stress measure is constructed on the assumption that stress represents the precontemplation and contemplation stages of the TTM, where a respondent realizes there is a financial
problem but may not be ready to deal with it. The resulting construct has a Cronbach’s alpha of 0.809,
indicating good internal consistency of this measure. The following three questions are used to construct
this measure:
•
I worry a lot about my financial situation
•
I feel I barely get by every month
•
My finances are out of control
The questions measuring financial self-efficacy were selected based on existing research, as
described in an earlier section, as well as the theoretical framework of the paper - that financial selfefficacy represents the preparation stage of the TTM. As such, the following seven questions were
selected:
•
I could do a much better job managing my finances (reverse coded)
10
•
I feel that I am prepared to manage through tough economic times
•
Over the last 5 years, I have improved my ability to save
•
I don't know what to do to improve my financial situation (reverse coded)
•
I feel prepared in the event of an unexpected financial emergency
•
I am on the right track in terms of financial affairs
•
I am successful at sticking to my budget
The combined measure for financial self-efficacy has a Cronbach’s alpha of 0.623, which indicates an
acceptable level of internal consistency of this measure.
In addition to using these two measures as possible predictors of the respondents’ help seeking
tendencies, the analysis also focuses on determining what factors determine one’s level of stress and selfefficacy in order to explain help-seeking tendencies more insightfully.
Analysis
This study utilizes a number of analytical techniques in order to test the hypothesis that the
tendency to seek financial help is affected by one’s level of financial stress, which represents one’s
ability to realize the existence of a financial issue, and financial self-efficacy, which illustrates one’s
readiness to deal with that issue. Together, these two triggers lead to the arrival at the “action” stage of
the TTM, where the decision whether or not to seek financial help is made. A two-step process is utilized
to analyze this hypothesis.
A logistic regression is used to establish the main predictors of one’s help-seeking tendencies. In
general terms, this model has the following form:
Financial help-seeking = f(financial stress, financial self-efficacy, control variables)
As this model uses a logistic regression, the relationship between the predictor and response variables
is not a linear function; instead a logit transformation is used to arrive at the following relationship:
𝑙𝑜𝑔𝑖𝑡 𝜃 𝑥
= 𝑙𝑜𝑔
! !
!!! !
= 𝛼 + 𝛽! 𝑥! + 𝛽! 𝑥! … + 𝛽! 𝑥! + 𝑒! .
11
Such a form is justified as the predictor, financial help-seeking, is a dichotomous variable and either
equals one, if help was sought in the last 5 years, or zero, if it was not. In order to test the hypothesis three
different types of response variables are introduced in stages, resulting in three different models. The first
stage analyzes the effect of demographic and financial variables on help-seeking and establishes some
basic correlations. The second stage introduces financial stress into the model. Finally, one’s readiness to
deal with that problematic situation is examined utilizing the financial self-efficacy variable as well as the
relationship between one’s stress and self-efficacy when it comes to help-seeking decisions.
Building on the results from the logistic regression, two separate Generalized Linear Models (GLM)
are used to analyze the predictors of financial self-efficacy and financial stress. A GLM is used to analyze
these two variables in lieu of OLS as the data used in the analysis are not normally distributed. In addition
to the demographic and financial variables used in the logistic regression, the self-efficacy and financial
stress models also analyze the effects of life-cycle variables such as one’s health condition, job security
and the degree of financial responsibility. Establishing correlations between all these variables and stress
and self-efficacy helps to better analyze the paper’s main hypothesis. Based on the TTM framework,
explaining the conditions during both “contemplation” and “preparation” stages should help predict the
results of the “action” stage of the process and thus, provide a more detailed explanation for financial
help-seeking tendencies.
Results
Descriptive Analysis
As the main aim of the paper is to investigate the characteristics determining one’s tendency to
seek financial help, it is important to establish key demographic characteristics of help-seekers for the
sample used in the analysis. Out of the total sample studied 58% are female, over 65% are married and
approximately 90% are at least 30 years of age. While approximately 80% of the sample went to college,
only 25% of non-help-seekers finished university, in comparison to 40% of help-seekers. Therefore,
one’s education level might be a possible predictor. Over 60% of the overall sample have kids, with
help-seekers more likely to be parents than non-help-seekers. So we can expect that having children
12
might also affect help-seeking tendencies. Owning a house might be another factor effecting helpseeking as 79% of help-seekers own a house instead of renting it, while only 56% of non-help-seekers do
so. The amount of assets and debts differ slightly between help-seekers and non-seekers, with the former
having higher amounts of both. Thus, one’s financial situation might also affect his or her tendency to
seek help. Finally, generally, help seekers have higher levels of financial self-efficacy but lower levels of
financial stress compared to those who have not sought help. Table 1 illustrates these and other
characteristics in greater detail.
[Insert Table 1 about here]
Effect of Demographic and Financial Variables on Financial Help-Seeking
Based on the demographic statistics, it makes sense to assume that one’s age, level of education,
marital status, financial situation and stage in the lifecycle (i.e., whether they have children, own their
house or plan to retire within the next five years) might have bearing on his or her tendency to seek help.
Model 1, presented in the first column of Table 2, examines these assumptions using a logistic regression.
[Insert Table 2 about here]
Due to the existence of missing values in a few of the variables used, the sample size drops to
13,747. Model 1 illustrates that the above assumption is justified. It is clear that there is a correlation
between demographic variables and help-seeking tendencies. Age is a predictor of help-seeking
tendencies as respondents ages 50 to 64 have higher odds of seeking help. Unmarried people have1.13
times the odds of seeking help compared to their married counterparts. The level of education has a clear
effect on help-seeking as the odds for respondents who did not go to college are 30% less than those who
did. On the other hand, those respondents who have a university degree have odds of seeking help that
are 1.4 times greater than those who do not. Finally, employment status is clearly correlated with help 13
seeking. Compared to those who are employed, unemployed respondents have odds that are 20% lower
and those who were retired at the time of the survey have odds 1.2 times higher .
Financial and lifecycle variables also seem to have a bearing on help-seeking. The model shows
that higher incomes and higher assets increase the odds of seeking help, while higher debt decreases
those odds. In addition, we see that the odds are higher for those respondents who own a house, have
children, support extended family or plan to retire within the next 5 years. Model 1 gives a decent insight
into help-seeking tendencies during the pre-contemplation stage of the TTM before either stress or selfefficacy is introduced. This model is an important benchmark that will help us draw conclusions about
the effects of stress and self-efficacy once they are introduced into the model.
Effects of Financial Stress on Financial Help-Seeking
Before examining the hypothesis that one’s financial stress and financial self-efficacy affect one’s
tendency to seek financial help, it is important to discuss these two variables in greater detail. Table 3
below summarizes the mean scores for each of the items comprising the financial stress measure used in
this paper along with the mean financial stress scores for the entire sample, the help-seeking group, and the
non-help-seeking group.
[Insert Table 3 about here]
Each of the items used to measure financial stress, and presented in Table 3, was based on a 9-point
scale, where 1 stands for strongly disagree, 5 stands for neither agree nor disagree, and 9 stands for
strongly agree. When comparing the two groups, we see that those who seek help feel less stress in the
three measured areas when compared to those who have not sought help. Based on this analysis, it is
reasonable to assume that there may be a negative correlation between financial stress and the decision to
seek help. This assumption is tested in Model 2 (the results are in the second column of Table 2), which
examines the effects of financial stress as well as the descriptive variables, used in the first model, on
one’s help-seeking tendencies.
14
In Model 2 the increase in the pseudo-R2 measure indicates that the new variable (financial stress)
adds some explanatory power, which might indicate that the existence of the financial stress implies that
the respondent is in the contemplation stage of the TTM, specifically that he or she realizes that there is a
financial problem that needs to be addressed. Unfortunately, our conjecture about a positive correlation
between stress and help-seeking is not supported by Model 2 results. In fact, we see that there is a
negative correlation between the two variables, with a one standard deviation increase in stress level
decreasing the odds of seeking help by 15%. This result does not support the supposition that the
respondents measured by this model are in the “contemplation” stage as the findings indicate that those
feeling stress are less likely to seek help. We will not completely rule out support for the hypothesis at
this stage, as those who seek help still report feeling stress.
Effects of Financial Self-Efficacy on Financial Help-Seeking
The questions used to construct the financial self-efficacy measure were based on the same 9-point
scale as described for financial stress. Response means for each question along with the mean comparison
between groups are presented in Table 4. Some of the items were reverse coded and that is noted in the
table. Respondents who have sought help report higher scores on all measures of financial self-efficacy
and have a higher mean score than those who did not seek help. Table 4 summarizes the financial selfefficacy construct.
[Insert Table 4 about here]
From these statistics a positive correlation can be expected to exist between financial self-efficacy
and help-seeking. Model 3 (third column in Table 2) tests this assumption by adding financial selfefficacy as well as a variable representing the interaction term between stress and efficacy to Model 2.
This model attempts to show that adding self-efficacy, in addition to stress, pushes the person out of
“contemplation” stage (just stress) into the “preparation” stage where the respondent is ready to start
15
fixing the problem (seek financial help). The interaction term is included to further explore the
relationship between financial stress and financial self-efficacy in the help-seeking model.
[Insert Graph 1 about here]
Adding both the measure for financial self-efficacy and the interaction term to Model 3 increases
the pseudo-R2 measure significantly.
In addition to highlighting the positive relationship between
efficacy and stress, Model 3 also helps verify the hypothesis that higher financial self-efficacy increases
the odds of seeking financial help. In Model 3 the coefficient for financial stress becomes positive and
significant. This relationship is explored using the interaction term and will be explained at the end of this
section. This change in sign once again illustrates that with the addition of efficacy, financial stress
becomes a driving force towards the “action” stage of TTM, leading to the tendency to seek financial
help. Therefore, Model 3 supports our main hypothesis that financial stress and financial self-efficacy are
two of the key predictors of the tendency to seek financial help.
Aside from employment status, the significance of demographic variables in the model does not
change. As one might expect, the likelihood of seeking help is higher for those between the ages of 50
and 64, homeowners, those with a university degree and/or children, and those planning to retire in the
next five years. The likelihood increases with income and assets.
In Model 2, we see that financial stress is negative and significant, but in Model 3 it becomes
positive and significant once self-efficacy is added. This indicates a relationship among stress, selfefficacy and help-seeking and the interaction is included to better understand that relationship. The idea
behind the interaction term between the two variables is that stress alone is not enough to get the
respondent to the “action” stage (seeking help) instead, he or she needs to both realize that there is a
problem (stress in contemplation stage) and feel ready to fix it (self-efficacy in preparation stage). This
relationship has been graphically depicted and is illustrated in Figure 1. The figure shows that for those
with low self-efficacy, the likelihood of seeking help is not affected by level of stress. However, for those
16
with high self-efficacy, higher stress leads to a higher likelihood of seeking financial help. This finding
provides some support for our hypotheses. Self-efficacy is an important trait that helps people struggling
with financial stress to identify the problem and seek help.
Predictors of Financial Stress
The GLM, used to analyze the predictors of the financial stress construct, examines the relationship
between the stress and three types of variables (demographic, financial, and lifecycle variables) in order to
better understand what underlying forces might be influencing stress and thus, its relationship with helpseeking decision. Demographic and financial variables are the same variables used in the logistic
regression described above: however, there are a few new lifecycle variables added to this model. One of
the most interesting variables is the degree of financial responsibility placed on the respondent, whether he
or she is the primary decision maker or whether financial responsibilities are shared with other members of
the household. The assumption here is that sharing responsibilities should lower financial stress as the
respondent has another person to help him or her with the problematic financial situation. Another
additional variable looks at one’s job security. It is a dichotomous variable indicating whether the
respondent thinks that he or she might lose their job in the near future. The final additional variable is also
dichotomous and indicates whether the respondent’s health is worse than five years ago. Both job security
and perception of one’s health might place extra stress on the respondent and thus, possibly affect helpseeking tendencies. Table 5 shows the full results from the GLM analysis.
[Insert Table 5 about here]
There are several interesting results that come out of the analysis. First, there is a clear year effect;
respondents surveyed in W1 reported less stress than those in W3. Second, the conjecture that sharing
responsibility lowers stress is supported by the significant negative correlation between the variables. This
17
outcome might have both positive and negative effects. The positive effect is due to financial stress being a
negative feeling and thus, its decline is better for the well-being of the respondent. However, as we
established when discussing Model 3, stress, when coupled with self-efficacy can push someone out of
“contemplation” and into “preparation” in order for the respondent to be able to fix a problematic financial
situation. Thus, sharing responsibilities might prevent one from seeking help in the event of financial
issues. Third, low job security and deteriorating health both increase financial stress as they create
obstacles when it comes to reaching financial goals. Fourth, planning to retire in the next five years or
owning a house lowers financial stress as it implies a rather stable financial situation. Fifth, high income
and increasing assets lower financial stress, while increasing debts increase the stress. Lastly, increasing
age, higher education and being retired all lower one’s level of stress.
On the whole, this model helps us verify our original results when it comes to the importance of
stress pushing the respondent towards seeking financial help in case of problematic financial situation. The
most interesting result from this model is the possible duality of the degree of the financial responsibility
that needs to be explored in further research as it might provide valuable insights when it comes to helpseeking tendencies and financial decision making in households.
Predictors of Financial Self-Efficacy
Using the same model to analyze predictors of financial self-efficacy provides us with a mirror
image of the results in the financial stress model. First, the respondents in W1 had higher financial selfefficacy than those in W3. This supports our logistic regression results as putting this together with year
effect from the stress model, we can conclude that higher stress leads to higher self-efficacy. Second, job
insecurity, deteriorating health and having children all decrease the level of self-efficacy according to the
model. Third, we see that sharing financial responsibility has a negative effect, lowering one’s level of selfefficacy. However, this result is only significant at the 10% level and thus, further investigation is
required. Fourth, higher income and more assets increase self-efficacy while increasing debt lowers it. And
18
finally, lower education level, unemployment and being unmarried all cause self-efficacy to decline. All
other effects are shown in Table 6.
[Insert Table 6 about here]
Overall, this model supports the results found earlier in the paper and once again shows that further
investigation into the question of the degree of financial responsibility is required.
Summary
Our study highlights the importance of self-efficacy in the decision to seek professional financial
planning help. Although it seems like a plausible conjecture that financial stress would be a trigger for
help-seeking, we find that this holds only for respondents with high self-efficacy. When self-efficacy is
low, stress does not factor into the equation. These findings suggest that a society high in self-efficacy
may make greater use of financial planners.
A novel finding of our research is that households sharing responsibility for financial decisions
have both less stress and lower self-efficacy. Perhaps when responsibilities are shared, neither partner
feels 100% secure in all aspects, lowering total self-efficacy. It might also be due to disagreements
between partners regarding how to handle financial situations, reducing overall confidence in those
decisions. Regardless of the explanation, this is an important finding which could motivate further
research about household behavior.
19
References Altfest, L. (2004). Personal financial planning: Origins, developments and a plan for future direction. The
American Economist, 48(2), 53-60.
Bandura, A. (1997). Self-efficacy: The exercise of control. New York: Freeman.
Bandura, A. (2006). Guide for constructing self-efficacy scales. In T. Urdan & F. Pajares (Eds.). Selfefficacy beliefs of adolescents (pp. 307-337). Charlotte, NC: Information Age Publishing.
Banerjee, G., & Roy, S. (1998). Determinants of help-seeking behavior of families of schizophrenic
patients attending a teaching hospital in India: An indigenous explanatory model.
International Journal of Social Psychology, 44(3), 199-214.
Burgogne, C. (1990). Money in marriage. Sociological Review, 38, 634-665.
Cummings, B. F. (2013). Three essays on the use and value of financial advice (Unpublished doctoral
dissertation). Texas Tech University, Lubbock TX.
Cummings, B. F., & James, R. N. III. (2014). Factors associated with getting and dropping financial
advisors among older adults. Journal of Financial Counseling and Planning, 25(2), 129-147.
Danes, S. M., & Haberman, H. R. (2007). Teen financial knowledge, self-efficacy, and behavior: A
gendered view. Financial Counseling and Planning, 18(2), 48-60.
Dearden, C., Goode, J., Whitfield, G., & Cox, L. (2010). Credit and debt in low-income families. York,
UK: Joseph Rowntree Foundation.
Dietz, B. E., Carrozza, M., & Ritchey, P. N. (2003). Does financial self-efficacy explain gender
differences in retirement saving strategies? Journal of Women & Aging, 15(4), 83-96.
du Plessis, K., Lawton, J., & Corney, T. (2010). Unemployed and struggling: The lack of financial helpseeking behavior exhibited by male construction workers. The Australian Journal of Financial
Planning, 6(1), 1-8.
Engleberg, E. (2007). The perception of self-efficacy in coping with economic risks among young adults:
An application of psychological theory and research. International Journal of Consumer Studies,
31(1), 95-101.
20
Ennis, N.E., Hobfoll, S.E. & Schroeder, K.E.E. (2000). Money doesn’t talk, it swears: how economic
stress and resistance resources impact inner-city women’s depressive mood. American Journal of
Community Psychology, 28, 149-173.
Financial Planning Standards Council. The value of financial planning. Retrieved from
http://www.fpsc.ca/value-financial-planning
Folkman, S. (1984). Personal control and stress and coping processes: A theoretical analysis.
Journal of Personality and Social Psychology, 46(4), 839-852.
Folkman, S., Scheaefer, C., & Lazarus, R. S. (1979). Cognitive processes as mediators of
stress and coping. In V. Hamilton & D. M. Warburton (Eds.), Human stress and
cognition: An information-processing approach. (pp. 265-298). London, UK: Wiley.
Gecas, V. (1989). The social psychology of self-efficacy. Annual Review of Sociology, 15, 291-316.
Grable, J. E. & Joo, S. (1999). Financial help-seeking behavior: Theory and implications. Financial
Counseling and Planning, 10(1), 14-25.
Grable, J. E. & Joo, S. (2001). A further examination of financial help-seeking behavior. Financial
Counseling and Planning, 12(1), 55-65.
Grembowski, D., Patrick, D., Diehr, P., Durham, M., Beresford, S., Kay, E., & Hecht, J. (1993). Selfefficacy and health behavior among older adults. Journal of Health and Social Behavior, 34(2),
89-104.
Hanna, S. D. (2011). The demand for financial planning services. Journal of Personal Finance, 10(1), 3662.
Hanna, S. D., & Lindamood, S. (2010). Quantifying the economic benefits of personal financial
planning. Financial Services Review, 19(2), 111-127
Heckman, S. J., & Grable, J. E. (2011). Testing the role of parental debt attitudes, student income,
dependency status, and financial knowledge have in shaping financial self-efficacy among college
students. College Student Journal, 45(1), 51-64.
21
Krause, N. & Baker, E. (1992). Financial strain, economic values, and somatic symptoms in later life.
Psychology and Aging, 7, 4–14.
Lapp, W. M. (2010). Behavior models for prosperity: A statistical assessment of savings and behavioral
change. EARN Research Brief. San Francisco, CA: Earned Assets Resource Network. Retrieved
from http://www.earn.org/static/uploads/files/5__Behavioral_Models_for_Prosperity_A_Statistical_Assessment_of_Savings_and_Behavioral_Ch
ange.pdf
Lim, H., Heckman, S. J., Montalto, C. P., & Letkiewicz, J. (2014). Financial stress, selfefficacy, and financial help-seeking behavior of college students. Journal of Financial
Counseling & Planning, 25(2), 148-160.
Lown, J. M. (2011). Development and validation of a financial self-efficacy scale. Journal of
Financial Counseling and Planning, 22(2), 54-63.
Marsden, M., Zick, C. D., & Mayer, R. N. (2011). The value of seeking financial advice. Journal of
Family and Economic Issues, 32(4), 625-643.
Mates, D. & Allison, K. R. (1992). Sources of stress and coping responses of high school students.
Adolescence, 27, 461–474.
Park, C. L., & Folkman, S. (1997). Meaning in the context of stress and coping. Review of General
Psychology, 1(2), 115-144.
Prochaska, J. O., & Velicer, W. F. (1997). The transtheoretical model of health behavior change.
American Journal of Health Promotion, 12(1), 38-48.
Remund, D. L. (2010). Financial literacy explicated: The case for a clearer definition in an increasingly
complex economy. Journal of Consumer Affairs, 44(2), 276-295.
Schwarzer, R., & Jerusalem, M. (1995). Generalized self-efficacy scale. Measures in Health Psychology:
A User’s Portfolio. Causal and control beliefs, 1, 35-37.
Shockey, S. S., & Seiling, S. B. (2004). Moving into action: Application of the transtheoretical
model of behavior change to financial education. Journal of Financial Counseling &
22
Planning, 15(1), 41-52.
Stigler, G. J. (1961). The economics of information. The Journal of Political Economy, 69(3), 213-225.
Willis, L. E. (2008). Against financial-literacy education. Iowa Law Review, 94, 197-285.
Xiao, J. J., Newman, B., Prochaska, J. M., Leon, B., Bassett, R. L., & Johnson, J. L. (2004). Applying
the transtheoretical model of change to consumer debt behavior. Journal of Financial
Counseling & Planning, 15(2), 89-100.
23
Table 1: Descriptive Statistics
Full sample
N = 14,793
Variable
Gender
Female
Male
Age
18 - 29
30 - 49
50 - 64
65 or older
Marital Status
Married
Not Married
Education
Didn't Go to College
College Degree/Some
College
University Degree
Help-seeker
n = 9,150
Non help-seeker
n = 5,643
n
Percentage
n
Percentage
n
Percentage
8,541
6,252
57.70%
42.30%
5,179
3,971
56.60%
43.40%
3,362
2,281
59.60%
40.40%
1,664
5,860
5,365
1,904
11.20%
39.60%
36.30%
12.90%
851
3,473
3,564
1,262
9.30%
38.00%
39.00%
13.80%
813
2,387
1,801
642
14.40%
42.30%
31.90%
11.40%
9,708
5,085
65.60%
34.40%
6,309
2,841
69.00%
31.00%
3,399
2,244
60.20%
39.80%
3,155
21.30%
1,527
16.70%
1,628
28.80%
6,443
43.60%
3,887
42.50%
2,556
45.30%
5,097
34.50%
3,686
40.30%
1,411
25.00%
946
9,041
3,499
10,086
10,423
6.40%
61.10%
23.70%
68.20%
70.50%
425
5,768
2,374
6,452
7,236
4.60%
63.00%
25.90%
70.50%
79.10%
521
3,273
1,125
3,634
3,187
9.20%
58.00%
19.90%
64.40%
56.50%
2,227
15.10%
1,593
17.40%
634
11.20%
8,380
6,413
1,769
56.60%
43.40%
12.00%
5,187
3,963
1,113
56.70%
43.30%
12.20%
3,193
2,450
656
56.60%
43.40%
11.60%
5,030
34.00%
3,013
32.90%
2,017
35.70%
Mean
Median
Mean
Median
Mean
Median
$77,297
$555,4643
$108,570
$75,000
$78,979
$75,000
$76,028
$274,000
$25,000
$587,961
$112,753
$286,000
$28,156
$522,129
$109,613
$75,000
$252,000
$22,000
Employment Status
Unemployed
Employed
Retired
Have Children
Own a House
Plan to Retire In the Next 5
Years
Financial Responsibility
Primary Decision-Maker
Shares Responsibility
Might Lose the Job Soon
Health Worse Than 5
Years Ago
Income
Assets
Debts
24
Table 2: Results from Logistic Regression Analysis
Model 1
Model 2
0.059
0.040
Odds
ratio
1.060
0.009
0.039
1.009
Age 18 - 29
0.068
0.065
Age50 - 64
0.158**
0.052
-0.051
Model 3
0.010
0.041
Odds
ratio
1.010
0.009
0.039
1.012
1.081
0.045
0.066
1.046
1.171
0.136*
0.052
1.146
0.085
0.950
-0.097
0.086
0.908
0.120**
0.045
1.128
0.128**
0.045
Less than College
-0.350***
0.049
0.705
-0.345***
University Degree
0.306***
0.045
1.359
Unemployed
-0.196*
0.079
Retired
0.203**
$50,000-$100,000
More than $100,000
Variable Name
Wave 1
b
SE
b
SE
SE
-0.011
0.041
Gender
Female
b
Odds ratio
0.989
0.013
0.039
1.013
0.000
0.066
1.000
0.184**
0.052
1.202
-0.045
0.086
0.956
1.136
0.141**
0.046
1.152
0.049
0.708
-0.335***
0.049
0.715
0.284***
0.045
1.328
0.278***
0.046
1.320
0.822
-0.163*
0.079
0.849
-0.117
0.080
0.889
0.065
1.225
0.151*
0.066
1.163
0.098
0.066
1.103
0.419***
0.047
1.520
0.382***
0.047
1.465
0.374***
0.048
1.453
0.640***
0.059
1.897
0.569***
0.060
1.767
0.526***
0.060
1.693
0.133***
0.007
1.143
0.121***
0.007
1.128
0.118***
0.008
1.125
†
0.005
0.991
0.000
0.005
1.000
0.005
0.005
1.005
0.184**
0.054
1.202
0.167**
0.054
1.182
0.131*
0.055
1.140
Age (Reference category: Age 30-49)
Age 65+
Marital Status
Non-married
Education (Ref category: Some College)
Employment Status
Income Level (Ref category: < $50k)
Ln of Assets
Ln of Debts
Own a House
Have Children
-0.009
0.094*
0.046
1.099
0.121**
0.046
1.128
0.109*
0.046
1.115
Support Extended Family
0.282***
0.078
1.326
0.351***
0.078
1.420
0.223**
0.079
1.250
Plan to Retire in the Next 5 Years
0.330***
0.061
1.391
0.297***
0.061
1.346
0.252***
0.061
1.287
-0.162***
0.021
0.851
0.120***
0.031
1.127
0.379***
0.032
1.460
Financial Stress
Financial Self-Efficacy
Interaction between Financial Stress &
Financial Self-Efficacy
Constant
Number of Observations
0.084***
-1.618***
0.096
0.198
-1.517***
13,747
Nagelkerke R square (-2Log Likelihood)
2
Likelihood Ratio Test: χ (df)
0.173 (16405.854)
0.219
0.178 (16345.746)
1,865.708 (18)***
1,925.816 (19)***
†
Note. ***p<.001; **p <.01; *p <.05; p<.1
0.099
13,747
26
-1.394***
0.017
1.088
0.100
0.248
13,747
0.193 (16162.132)
2,109.430 (21)***
Table 3: Items Used for Financial Stress Factor
Full sample
Help-seeker
Non helpseeker
N=15,806
N=9,150
N=6,656
I worry a lot about my financial situation
5.17
5.16
5.21
I feel I barely get by every month
4.51
4.47
4.61
My finances are out of control
3.54
3.53
3.62
-0.003
-0.156
0.246
Mean Financial Stress Factor Score
All items are on a 1 to 9 scale, 1 = strongly disagree and 9 = strongly agree
Table 4: Items Used for Financial Self-Efficacy Factor
Full sample
Help-seeker
Non helpseeker
(N=15,806)
(n=5,643)
(n=10,163)
I could do a much better job managing my
finances (reverse coded)
I feel that I am prepared to manage through tough
economic times
Over the last 5 years, I have improved my ability
to save
I don't know what to do to improve my financial
situation (reverse coded)
I feel prepared in the event of an unexpected
financial emergency
I am on the right track in terms of financial affairs
4.64
4.6
4.16
5.53
5.53
5.51
5.53
5.56
5.49
5.66
5.67
5.59
5.06
5.08
4.99
4.79
4.85
4.72
I am successful at sticking to my budget
4.81
4.86
4.71
Mean Self-efficacy Factor Score
0.005
0.188
-0.295
All items are on a 1 to 9 scale, 1 = strongly disagree and 9 = strongly agree
27 Figure 1: Interaction between Financial Stress and Financial Self-Efficacy
5
Likelihood to Seek Help
4.5
4
3.5
Low Self Efficacy
3
High Self
Efficacy
2.5
2
1.5
1
Low Stress
High Stress
28
Table 5: Predictors of Financial Stress
Variable
Surveyed in 2009
Female
Age 18 - 29
Age 50 - 64
Age 65and older
Unmarried
Less than College
b
-0.307***
0.028†
-0.096***
-0.142***
-0.280***
0.013
0.040
SE
0.016
0.015
0.026
0.020
0.033
0.021
0.020
t value
-19.152
1.791
-3.628
-6.96
-8.42
0.633
1.999
University Degree
Unemployed
Retired
Income Between $50k and $100k
Income Higher Than $100,000
Ln Assets
Ln Debts
Owning a House
Having Children
-0.142***
0.258***
-0.259***
-0.225***
-0.439***
-0.074***
0.054***
-0.111***
0.154***
0.018
0.032
0.025
0.019
0.023
0.003
0.002
0.022
0.018
-8.081
8.173
-10.285
-11.745
-18.813
-26.424
30.445
-4.983
8.500
Plan to Retire in the Next 5 Years
-0.131***
0.023
-5.738
Health Worse Than 5 Years Ago
Might Lose Their Job in the Near
Future
Share Financial Responsibility
0.194***
0.016
12.285
0.377***
0.024
15.816
-0.050**
0.018
-2.797
Constant
0.778***
0.040
19.679
Number of Observations
14,084
Adjusted R-squared(df)
0.293(21)
†
Note. ***p<.001; **p <.01; *p <.05; p<.1
29
Table 6: Predictors of Financial Self-Efficacy
Variable
Surveyed in 2009
Female
Age 18 - 29
Age 50 - 64
Age 65 and older
Unmarried
Less than College
b
0.292***
-0.005
0.159***
0.009
0.082*
-0.075***
-0.054**
SE
0.016
0.015
0.026
0.020
0.032
0.020
0.019
t value
18.782
-0.327
6.157
0.472
2.556
-3.767
-2.787
University Degree
Unemployed
Retired
Income Between $50k and $100k
Income Higher Than $100,000
Ln Assets
Ln Debts
Owning a House
Having Children
0.107***
-0.245***
0.365***
0.189***
0.418***
0.065***
-0.049***
0.171***
-0.083***
0.017
0.031
0.024
0.019
0.023
0.003
0.002
0.022
0.018
6.265
-7.928
14.956
10.127
18.443
23.730
-28.703
7.855
-4.691
Plan to Retire in the Next 5 Years
0.191***
0.022
7.855
Health Worse Than 5 Years Ago
-0.327***
0.015
-21.317
Might Lose Their Job in Near Future
-0.160***
0.023
-6.937
0.017
-1.896
0.038
-18.120
Share Financial Responsibility
-0.033
Constant
-0.697
Number of Observations
13,747
Adjusted R-squared(df)
0.274(20)
Note. ***p<.001; **p <.01; *p <.05; †p<.1
†
30


© Copyright 2026