
Error Rate Performance of LTE Mobile Systemthrough
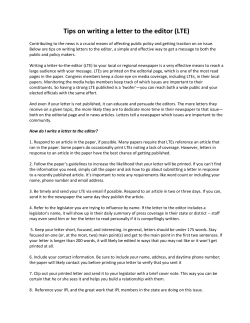
56 | P
age
Australian Journal of Information Technology and Communication Volume II Issue I
ISSN 2203-2843
Error Rate Performance of LTE Mobile
Systemthrough RealisticFading Channel
Manorama setia , Jyotessh Malhotra
(Corresponding author: Manorama setia)
ECE Department, GNDU-RC,
(Email:[email protected])
Abstract-Channel environment is very important parameter of
communication and especially for wireless communication which
have air as interfacing medium that act as channel .Thus it has
different type of powers and delays. Since most of the results are
based on ideal channel (AWGN) but for successful
implementation of any technology we have to evaluate it in
realistic environment.LTE(Long Term Evaluation) is a project
Started by 3GPP(Third Generation Partnership Project) for 4G
development. This paper makes a number of contributions to
evaluate the performance of different realistic channels. Wehad
taken certain channel conditions like modulation scheme,
bandwidth and HARQto observe its variation effect on different
fading channels. The results obtained from this variation helps in
determining good and effective parameters for a particular
fading channel.With the help of LTE link level simulator by
evaluating results in terms of throughput and BLER (block
error ratio)
Keywords- LTE, BLER, CQI, PedB, VehA, eNodeB , HARQ,3GPP
I. Introduction
With the rapid development of wireless communication and
multi-media applications such as Internet suffering,3D
gamming consoles ,VoIP, Live streaming the mobile
communication technology needs to meet different high
requirements of mobile data, mobile calculations and mobile
multi-media operations. In order to accommodate the
increasing mobile data usage, the new multimedia applications
reliability of the system, LTE is introduced.
LTE is a new technology specified by the 3GPP as the
emerging mobile communication technologies for the next
generation i.e. fourth generation (4G) broadband mobile
wireless communication networks [1]. LTE emanates
remarkable changes by orignating a novel physical layer and
reforming the core network which make it better as compared
to previous technologies such as Universal Mobile
Telecommunications System (UMTS) and High-Speed Packet
Access (HSPA).[2]Since there are a lot of security
vulnerabilities in the UMTS. In LTE multiple access schemes
is different for downlink which is Orthogonal Frequency
Division Multiple-Access (OFDMA) and for uplink it is
Single-Carrier Frequency Division Multiple-Access (SCFDMA) [3]. OFDM is preferred not only because it offers
,
, India
high data rate transmission but also because of it flexibility
and robustness against multipath fading.
The development in physical layer of LTE is rapidly
approaching in an extremely fast manner,As the new records
has been set in London for the LTE downlink i.e.1Tbps in
which the downlink speed has been observed to be 1000 times
more of the current speed researched and attained by Samsung
7.5Gbps.
The motivation is to provide the quality of service and high
availability for user’s demand for higher data rateAnd low
complexity as well as to avoid unnecessary fragmentation of
technology for paired and unpaired band operation, and rapid
growth towards the development of broad-band wireless
access technologies.
The Multipath model which is a test operating environment
also known as reference model. In mobile radio propagation
environments, there is multi-path propagation which causes
signal fading and channel time dispersion .The characteristics
of signal fading varies with the propagation environment and
its impact on the communication quality (i.e. bit error
patterns) which is directly linked with the speed of users
correspond to eNodeB, which helps us to give a model of test
environment thatcan be used to evaluate results in realistic
conditions so it becomes an important aspect to analyse before
implementation.[4].
This paper makes a number of contributions to evaluate the
performance of different realistic channel. Wehad taken
certain channel condition like modulation scheme, bandwidth
and HARQ, and evaluate its variations effect on different
fading channels. The results obtained from this variation helps
in determining effective value of parameters for a particular
fading channel.With the help of LTE link level simulator by
calculating throughput and BLER.We will perform
simulations for different conditions in LTE environment and
compare it for different multipath models.
Section II consists of background of parameters which we are
going to vary, In Section III detail introduction to multipath
models we choose to evaluate environment conditions,
Section IV containssimulations results and Section V
concludes the paper.
II. Background
57 | P
age
Australian Journal of Information Technology and Communication Volume II Issue I
In modern wireless networks, the quality of received signal in
wireless channels is calculated by measuring the quality of
channel and these results are used to select appropriate
modulation and coding scheme, proper B.W, proper spatial
diversity, no. of retransmission i.e. HARQ according to the
operated environment.
As these test operating environments (Multipath models) are
an appropriate subset of the IMT-2000 operating
environments which is described under ITU-R M.1034.for
evaluating the performance of individual radio links we can
use simple models ,whereas moreover to evaluate the overall
system-level reliability and compatibility of specific
technologies we require complex models. As narrowband
technologies, may be characterized by its r.m.s value alone for
time delay spread whereas for wideband technologies number
of parameters like relative time delay and strength of the
many signal components become significant. For some
technologies (e.g. those employing power controls) these
models must include coupling between all co-channel
propagation links to achieve maximum accuracy. Also, in
some cases, the large-scale (shadow fading) temporal
variations of the environment must be modelled.
Propagation model would include parameters which describe
as follows:
•
time delay-spread, its structure, and its statistical
variability (e.g. probability distribution of time delay
spread);
•
.path loss rule ofR
•
shadow fading;
•
Characteristics of multipath fading are Doppler
spread, Rayleigh fading.
operating radio frequency[4]
•
and excess path loss;
Main function of Link Adaptation (LA) is to reach the target
value of BLER.LTE utilises different techniques to adapt the
changing environment of LTE, since power in downlink is
constant .As LA is used to analyse the feedback from UE and
select best MCS for UE based also on the information about
the allocation position in the frequency domain.
A. Channel Quality Indicator (CQI)is one of the process
under LA. It acts as a feedback from UE to e-NodeB which
gives information of channel quality. reference signals act a
information to evaluate CQI .evaluated interval, evaluated
resolution in frequency domain, reporting mechanisms, etc.
are all configurable parameters and they have great effect on
performance of the system [8].CQI actually contains the
information of data rate of UE on the downlink channel basis
on which CQI is generated [6].It just not only depends on the
noise and interference within wireless channel but also on the
quality of receiver .Therefore receiver with best front end and
good processing signal deliver good CQI. It is a combination
ISSN 2203-2843
of modulation scheme and code rate which is selected to
ensure that BLER should be less than 0.1[7]
As cqi=1 is the most robust case (modulation scheme=QPSK
and code rate=0.076) select for worst channel quality, and
with increasing value of cqi the quality of channel increases.
CQI values are also used to select the optimum resource block
i.e. the optimum sub-carrier and the optimum time slot. [8],[9]
B.HARQ: HARQ (Hybrid automatic repeat request) is
basically used to detect errors and correct them in order to
increase throughput .HARQ consists of error detection,
Forward Error Correction (FEC), and the well-known ARQ,
By using the Cyclic Redundancy Check (CRC), erroneous
packets can be detected and a request for a retransmission is
sent to the transmitter. It can be a duplicate packet or just
some redundancy bits that are combined with the erroneous
packet so that it can easily be corrected by the FEC.
C.Bandwidth: As frequency spectra are formed of resource
blocks and one resource block contains of 12subcarriers and
spacing between two subcarriers is 15Khz and each slot
consist 6or7 symbols so transmission bandwidth 180Khz.
This enables trans-mission bandwidth configurations from 6
to 110 resource blocks over a single frequency carrier. LTE
standard allows for channel band-widths ranging from 1.4 to
20.0MHz in steps of 180 kHz, allowing the required spectrum
flexi-ability to be achieved. For bandwidths of 3–20MHz, the
totality of resource blocks in the transmission bandwidth
occupies around 90% of the channel bandwidth. In the case of
1.4 kHz, the percentage drops to around 77%
III. Simulation environment and methodology
A. Multipath channel Models
Due to interference in the path of propagation environment of
mobile radio communication the signal follow multiple paths
to reach at target which cause delayed signal to receive at
output and cause fading and due to its impact quality of signal
degrades and it totally dependent on the speed of user with
respect to e-NodeB. All environments are described under
ITU-R M.1034. [4]
1. Pedestrian A and B
Pedestrian environment consist of small cells and low
transmit power. eNodeB with low antenna height are located
outdoors while pedestrian users are located on the streets. for
Non LOS loss rule of
is considered and if path is LOS
loss
follows. The number of paths in PedA model is 4 and
6 in PedB model. According to ITU multipath environment
[4][5] that represent Average powers and relative delays for
the taps of multipath channel for pedestrian channel
2. Vehicular A
Vehicular environment consist of large cells and higher
transmit power. As we have limited spectrum, so capacity is
main factor. With path loss the signal power decreases with
distance. As path loss exponent is 4 for both urban and
suburban areas which will be less for rural areas. In this the
58 | P
age
Australian Journal of Information Technology and Communication Volume II Issue I
vehicle speed is assumed to be 120Km/hr. Table [4][5] shows
Average power and relative delay for vehicular channel.
3. Typical Urban: These models are mostly used for GSM and
PCM bands. There are two definitions of Typical Urban
model which has 12 delay taps and 6 delay taps respectively.
Both definitions have the same delay spread value. Commonly
typical urban model with 6 delay taps is used. Table [5] shows
Power and Relative Delays for Typical Urban Model with 12
delay taps
B. Environment values
Here we present the environment we choose for our
simulations. The values for different parameter that defines
the
environment
aresimulation
type,
CQI,HARQ,
Transmission mode, Data rate, Bandwidth, No. of sub-frames,
Receiver type,modulationtype,multipath model and Coderate.
TABLE I
Case I
Decide
range of
SNR
ISSN 2203-2843
For number of
retransmissions
equal no. of
retransmission
vector Switch
no. of re-tx
Case II
Decide
range
of SNR
Specification ofthe Values of Parameters Used As Simulating Environment
Parameters
values
CQI
Sub-frames
HARQ
4,7,10
500,1000
Determine value of Channel Quality Indicator
0,3
Simulation type
Normal(SUMIMO)
Transmission
mode
111(mode=1,tx.Antenna=1,rx.anteena=1)
Bandwidth
1.4MHZ,3MHZ,10MHZ,20MHZ
Receiver type
multipath models
SSD(Soft sphere decoder)
Case I
Case II
Single User
Multimedia
Input
Multimedia
Output
For cqi =cqi to
simulate
Decide
simulation type
TU, VehA, PedB
C. Methodology
Single
User
Single
Input
Single
Output
Start sending sub-frames according to SNR set
Initiate program and set global debug level to
highest Level
Initiate trace for BLER performance and throughput
performance
Initialize varied parameter i.e. no of sub-frames to
simulate and set simulation type.
Set CQI configuration and Initialize variable
transmission modes to simulatewith the array
parameter
Calculate transmission modes,MIMO, RXAntennas with the help of above variable
Extract the BLER and throughput performance
from traced results and plot it
Exit
Fig. 1 Flow chart
IV Result and discussion
Here we present the results based on simulations done in LTE
link level simulator as changing its parameters and compare
them by computing throughput and BLER for different
59 | P
age
Australian Journal of Information Technology and Communication Volume II Issue I
multipath models. In figure 2 and 3 shows the simulation
result of changing modulation scheme for different multipath
models and comparing in terms of BLER and throughput in
table II and III we are showing the values of BLER and
throughput w.r.t SNR.
TABLE II
BLER Results of Simulation of Realistic Channels for Different Modulation
Scheme
modulation
BLER
PedB
VehA
TU
4.5db
5db
4db
10
16QAM
64QAM
12 db
12.5db
11db
17.5 db
18db
17db
QPSK
10db
9db
8db
10
16QAM
64QAM
16.5db
16db
14db
>21 db
>21db
>20db
-1
10
2
] 1.5
s
p
b
M
[
t
u
p
h
g
1
u
ro
ht
0.5
-5
0
QPSK PedB
QPSK TU
QPSK VehA
16QAM PedB
16QAM VehA
16QAM TU
64QAM PedB
64QAM VehA
64QAM TU
-2
10
-3
-5
10
15
20
QPSK VehA
QPSK PedB
QPSK TU
16QAM VehA
16QAM PedB
16QAM TU
64QAM VehA
64QAM PedB
64QAM TU
2
0
0
-5
0
5
SNR [dB]
10
15
20
-1
modulation
Throughput
0.5
QPSK
16QAM
QPSK VehA
QPSK PedB
QPSK TU
16QAM VehA
16QAM PedB
16QAM TU
64QAM VehA
64QAM PedB
64QAM TU
-3
-5
0
15
20
1.5
64QAM
QPSK
16QAM
64QAM
5
SNR [dB]
10
15
Fig.2BLER comparison for different modulation scheme for 0
PedB
VehA
TU
(Mbps)
10
-2
10
TABLE III
64QAM
10
SNR [dB]
Throughput Result of Realistic Channels for Different Modulation Scheme
QPSK
R
E
L
B
5
Fig. 3 Throughput comparison for different modulation scheme for 0 and 3 retx
16QAM
and 3re-tx
SNR [dB]
throughput,various modulation scheme,1000 subframes, 3 re-tx
2.5
BLER,various modulation scheme,1000 subframes, 3 re-tx
0
10
10
5
0.5
R
E
L
B
10
QPSK PedB
QPSK TU
QPSK VehA
16QAM PedB
16QAM VehA
16QAM TU
64QAM PedB
64QAM VehA
64QAM TU
s] 1.5
p
b
[M
t
u
p
h
g
1
u
o
r
ht
BLER,various modulation scheme,1000 subframes, 0 re-tx
0
10
throughput,various modulation scheme,1000 subframes, 0 re-tx
2.5
0
QPSK
ISSN 2203-2843
20
2.5
3db
3db
3db
5db
5db
5db
8db
8db
8db
-
-
-
-
13 db
13db
-
-
-
-
20db
20db
13db
20db
For QPSK, Up till SNR=2 all channel behaving same but
after that TU behaves well by 2.5db power w.r.t other
channels at BLER=10 and at SNR=11 even PedB performs
well and VehA require 1db more power, and for throughput it
60 | P
age
Australian Journal of Information Technology and Communication Volume II Issue I
is giving value of max. 0.5-0.7 Mbps but it giving a
significant value even at negative SNR
For 16QAM, more power is required to reach at low value of
BLER around 6-7db power dissipate as compared to QPSK
and if we compare multipath models within 16QAM TU
perform good by 2-3db power and throughput is max.1.3-1.4
Mbps.
For 64QAM, In BLER for this requires power dissipation of
13db to reach the value as obtained by QPSK modulation and
in this throughput hikes to 2.5Mbps.
As we compared for HARQ=0 and 3 we can see that around
5-6 db power dissipation is less in case of HARQ=3.
For comparison of multipath models for different B.W or data
rate we took particular case of cqi=7 to evaluate best of these
B.W. we can analyse results from these fig. 4 and 5
10
1.4mhz TU
1.4mhz VehA
1.4MHZ PedB
3mhz TU
3mhz VehA
3mhz PedB
10mhz TU
10mhz VehA
10mhz PedB
10
8
6
4
2
0
BLER,various bandwidths ,500 subframes, 0 re-tx
0
throughput,various bandwidths ,500 subframes, 0 re-tx
12
]
s
p
b
M
[
t
u
p
h
g
u
o
r
ht
ISSN 2203-2843
-5
0
5
SNR [dB]
10
15
20
Fig. 5 Throughput comparison of different bandwidth on multipath models
TABLE V
Throughput Results of Realistic Channels for Different B.W
Bandwidth Throughput
PedB
VehA
TU
1.4mhz TU
1.4mhz VehA
1.4MHZ PedB
3mhz TU
3mhz VehA
3mhz PedB
10mhz TU
10mhz VehA
10mhz PedB
-1
10
R
E
L
B
-2
10
(Mbps)
1.4MHz
8db
8db
8db
5db
5db
5db
10Mhz
3.3 db
3 db
4 db
1.4MHz
-
-
-
11db
12db
10db
10MHz
4 db
5 db
5 db
1.4MHz
-
-
-
-
-
-
10db
11db
9db
3MHz
3MHz
1.5
3.5
-3
10
-5
0
5
SNR [dB]
10
15
20
3MHz
Fig. 4 BLER comparison of different bandwidth on multipath models
TABLE IV
BLER Results of Simulation for Realistic Channels for Different B.W
Bandwidth
BLER
1.4MHz
3MHz
10MHz
10
1.4MHz
3MHz
10MHz
10
PedB
VehA
TU
11db
12db
10db
8.6db
11db
8db
9 db
10db
8.5db
17db
16db
15.5db
13 .5db
14.9db
12db
13 db
14db
11 db
10MHz
11
For 1.4MHz, TU performs good in terms of BLER as it is
giving 1-1.5 db of target to others channels but till SNR=6 or7
all channels are behaving same irrespective of B.W even in
terms of throughput all channels are giving a throughput of
1.5-2 Mbps for this B.W i.e. at 1.4MHz.
For 3 MHz, As compared to 1.4 MHz, at this B.W TU channel
gives 3-4 db less power dissipation bet. SNR 6-10 it is even
performing well than other channels at 10 MHz and in terms
of B.W it is giving a value of 3-3.5 Mbps.
For 10 MHz, in this TU gives 1-1.5 db power target to PedB
and 2-3 db to VehA and at this B.W throughput rises to 12
Mbps.
V. Conclusion
Fading channels are the operating environment, which consist
of average delays and average power.Deployment of any
technology in real world ought to be tested under these fading
channels for a deep analysis of the results before practically
setting up any technology.
In this study we have researched and shown it with fully
dynamic simulations how modulation scheme, B.W, HARQ
affects different fading channels(PedB, VehA, TU) by
evaluating results in terms of throughput and error rate.
61 | P
age
Australian Journal of Information Technology and Communication Volume II Issue I
The results shows that with change in modulation scheme, it
largely affects its performance where throughput becomes five
times by using 64QAM in place of QPSK but for this there is
trade-off between BLER and throughput because of more
power dissipation as for using higher modulation scheme but
its effects can be reduced by using HARQ by sending
duplicate data or bits we can reduce this power dissipation and
can produce 5-6db power saving and effective results in terms
ofrobustness and reliability. By increasing B.W. Throughput
increases to 7 times giving good performance even BLER
power dissipation can b reduced .
Manorama Setia is currently pursuing M.tech in Electronics and
Communication with specialisation in communication from Guru
Nanak Dev University, Regional Campus, Jalandhar. She received
her B.Tech degree from Rayat and Bahara College of engineering,
Mohali in 2013.Her research areas of interests include Wireless
Communication.
Dr. Jyoteesh Malhotra received B.Eng., M.Tech, PhD , is involved
in teaching and research at Electronics and Commun. Department,
Guru Nanak Dev University, Regional Campus, Jalandhar. His
research interests includes LTE, simulation of wireless channels,
Fading mitgitaion techniques, and wireless networks. Dr. Malhotra
has published more than 90 research papers in the International
Journals/ Conferences and authored 02 books. He is in editorial
board of many International Journals of repute.
References
[1] Temitope O. Takpor and Francis E. Idachaba “Analysis and Simulation of
LTE Downlink and Uplink Transceiver”, WCE 2014
[2]J. C. Ikuno, M. Wrulich, M. Rupp“System level simulation of LTE
networks”, IEEE 2010
[3]B. E. Priyanto, H. Codina, S. Rene “Initial Performance Evaluation of
DFT-Spread OFDM Based SC-FDMA for UTRA LTE Uplink”, pp-31753179,IEEE-2007
[4]ITU-R, “Guidelines for evaluation of radio transmission technologies for
IMT-2000,” ITU-R, Tech. Rep. M.1225, 1997.
[5]DesiPramudiwati “Lte System Performance In Relation To Wideband
Channel Properties”, pp-19-22
[6]M. T. Kawser, N. I. Bin Hamid, Md. N. Hasan “Downlink SNR to CQI
Mapping for Different Multiple Antenna Techniques in LTE”, pp757-760,
IJIEE.2012
[7]W. Anyi, L. Zhaoyang “The study and analysis of MIMO technology
based on LTE physical layer”pp-306-308, 2010 IEEE
[8]K. Aho, O.Alanen, J. Kaikkonen“CQI Reporting Imperfections and their
Consequences in LTE Networks”, pp-241-245, IARIA 2011
[9] H.Zarrinkoub, Willey “understanding LTE With mat lab” pp-16-17
ISSN 2203-2843
.


© Copyright 2026