
Intelligent Fault Classification of a Tractor Starter Motor using
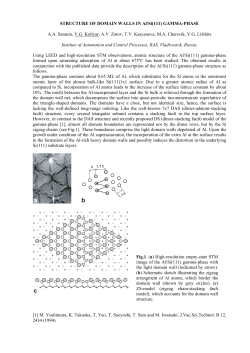
Applied mathematics in Engineering, Management and Technology 2 (3) 2014:416-424 www.amiemt-journal.com Fault Classification of an Electromotor using Acoustic Signal and PNN Model Ebrahim Ebrahimi*1, Majid heydari2 , Hasan Gholami Parashkouhi2 , Ghobad Moradi3, Mojtaba Bavandpour1 1.Department of Mechanical Engineering of Agricultural Machinery, Faculty of Engineering, Islamic AzadUniversity, Kermanshah Branch, Kermanshah, Iran 2. Department of Mechanical Engineering of Agricultural Machinery, Takestan Branch, Islamic Azad University, Takestan, Iran 3.Islamic Azad University, Ravansar Branch, Kermanshah, Iran, [email protected] *Corresponding Author Email: [email protected] Abstract This paper presents an intelligent method for fault diagnosis of the kind of starter motor based on acoustic signals and probabilistic neural network. The electromotor (starter motor of vehicle) conditions were considered to be healthy, crack in rotorbody, unbalancing in driven shaft, and wear in bearing. Thirty-three statistical parameters of acousticsignals in the time and frequency domains were selected as features source for fault diagnosis. In this study, fourteensuperior features were fed into PNN as input vectors. Performance of the system was validated by applying the testing data set to the trained PNNmodel. According to the result, total classification accuracy was 92.17%. This shows that the system has potential to serve as an intelligent fault diagnosis system in real application. Keywords: PNN, Fault detection, Statistical features, Electromotor, Acoustic signal. 1. Introduction Because of the increasing demand for higher performance as well as for increased safety and reliability of dynamic systems,fault diagnosis has been becoming more important for machine monitoring. Early diagnosis of machine faults while the machine is still operating in a controllable region can help avoid abnormal event progression, which in turn can help avoid major system breakdowns and catastrophes. Hence, fault diagnosis is a major research topic attracting considerable interest from industrial practitioners as well as academic researchers (Yang, 2004). Starter motor is one of the critical components of vehicles. If starter motor doesn’t work properly, the engine can’t operate.So, this leads to loss time in farming schedule. Hence, the present study tries to introduce a technique for intelligent fault diagnosis of a starter motor using acquired acousticsignals andPNN. Results of this study help workshop technicians to find the faults of the starter motor without its dismantling. Because of the increasing demand for higher performance as well as for increased safety and reliability of dynamic systems, fault diagnosis has been becoming more important for machine monitoring. Early diagnosis of machine faults while the machine is still operating in a controllable region can help avoid abnormal event progression, which in turn can help avoid major system breakdowns and catastrophes. Hence, fault diagnosis is a major research topic attracting considerable interest from industrial practitioners as well as academic researchers (Goering and et al) One of the most applications of condition monitoring is fault diagnosis of electrical machines (Gaeid). Even though motor current analysis has been widely utilized for electric machines, vibration monitoring is also accepted for diagnosis of faults for these machines [9]. Vibration monitoring of electrical machines has become an attractive region for many researchers, and also has gained industrial acceptance since it is related to almost all of the machinery failures and it does not require modification of the machine or access to the supply lines (Chindurza, 2004). There are several fault types, mechanical and electrical, which can induce undesired vibration levels in electrical motors such as misalignment, broken rotor bar, short circuits, imbalance, stator winding faults, and bearing failures (Bloch) 416 Applied mathematics in Engineering, Management and Technology 2014 E. Ebrahimi et al A number of attempts have been made to diagnose machine fault using artificial intelligence techniques such as Fuzzy Inference System (FIS) for external gear pumps, railway wheel (Saravan, 2010), and DC motor (Miguel, 2004); Artificial Neural Networks (ANN) for automotive generator, internal combustion engines [21] , and gear boxes (Saravan, 2010) ; and Genetic Algorithms (GA) for rolling element(Wu) and so on. Other than these techniques, adaptive systems are used for intelligent fault classification. Nowadays, Adaptive Neuro-Fuzzy Inference Systems (ANFIS) have found a wide gamut of industrial and commercial applications that require analysis of uncertain and imprecise information. ANNs and FISs are complementary technologies in the design of adaptive intelligent systems. Integrated neuro-fuzzy system combines the advantages of ANN and FIS. While the learning capability is an advantage from the viewpoint of FIS, the formation of linguistic rule base is an advantage from the viewpoint of ANN. An integrated neuro-fuzzy system shares data structures and knowledge representations (Yang) The main object of this paper is application of PNN Model on acoustic signal to fault diagnosis of an electromotor. 2. Proposed system for fault diagnosis The classical way for detecting faults consists of checking the measurable variables of asystem in regard to a certain tolerance of the normal values and triggering alarm messagesif the tolerances are exceeded or taking an appropriate action when they exceed a limitvalue which signifies a dangerous process. In this research we want to make an intelligent fault diagnosis system so that it helps us to give a rapid decision on structural health of machine without need to any expert person. In the present study, acousticsignals are utilized for detecting the faults of a starter motor.The proposed system consists of four procedures as shown inFigure1: data acquisition, signal processing, feature extraction, and fault classification which are specifically explainedin the next sections. In this section, the summary role ofeach procedure is described as follows: Data acquisition: this procedure is used to attain the acoustic signals. Signal processing: this includes transfer of data from time domain into frequency domain. Feature extraction: the most significant are calculated using some feature parameters from both time and frequency domain. Fault classification: The data obtained from featureextraction section is fed intoPNN.The results obtained from data test set indicate the total classification accuracy ofPNN. Testing set Data acquisition Signal processing Fault classification using PNN Feature extraction Classification result Training set Fig.1. Proposed system for fault diagnosis 3. Data acquisition Experiments were carried out on the starter motor of kind of Truck. This starter is an electric motor needed to turn over the truck engine to start it. The starter consists of the very powerful DC electric motor and starter solenoid that is attached to the motor. When current from the starting battery is applied to the solenoid, it pushes out the drive pinion on the starter driveshaft and meshes the pinion with the ring gear on the flywheel of the engine[2].The experiment setup is shown in Figure 2. Anacoustic sensor of model 12.5 mV/Pa / 377A13was mounted on the starter motor body in horizontal direction. Through the signal conditioners, the acoustics data was acquired by APC 417 Applied mathematics in Engineering, Management and Technology 2014 E. Ebrahimi et al 40Spectrum Analyzer (A/D converter, APC Ltd, Korea) and Dell Vostro1320 laptop (data acquisition unit). Rotational speed of central shaft of motor was inspected using a contact tachometer (DT-2235B model, Lotron Ltd, Taiwan). Acousticdata was acquired when motor reaches to its maximum speed. Acousticdata of motor in good condition (Healthy) was usedfor comparison with faulty condition of motor. Considered faults weremotor, with crack in rotorbody (CRB), unbalancing in driven shaft (UDS), and wear in bearing (WB),as shown in Figure 3. Unbalancing was created by gluing three nuts on the outer body of driven shaft ring. Table 1 shows the description of fault conditions. Fig.2.The experimental setup Fig.3. Starter motor faults; top-left: crack in rotor body, top-right: unbalancing in driven shaft, Bottom: wear in bearing Table 1. The description of faulty starter motor Fault condition Fault description Crack in rotor body (CRB) Number of broken bars: 27 Unbalancing in driven shaft Unbalancing mass: 3nuts×2.6gr (UDS) Increase of internal diameter: Wear in bearing (WB) 1.6% 418 Applied mathematics in Engineering, Management and Technology 2014 E. Ebrahimi et al 4. Signal processing One of the common procedures to generate usefulfeatures is signal transition from timedomain (e.g.peak values) into frequencydomain. A 1024-point Fast Fourier Transform (FFT) is computedfrom each discrete time signal using MATLAB R2008a. Figure 4 shows an example of the time domain signal, computed FFT amplitudeandphaseangle, computed wavelet approximation and detail, respectively for different faultsof starter motor. Fig.4. Typical acousticspectra of starter motor faults;from top to bottom: time domain, FFT magnitude, FFT phase angle, wavelet approximation and detail coefficients 5. Feature extraction Fault in rotating machinery leads to change of timedomain signal. Both its amplitude and distribution may be different from those of a time-domain signal under healthy condition. Also, the frequency spectrum and its distribution may change, which signifies that new frequency components may appear. These signals are processed to extract twenty-seven feature parameters. The nine parameters (T1–T9) are time domain statistical characteristics and the other nine parameters (F1-F9) are frequency domain statistical characteristics[3, 4].These features are shown in Table 2. 419 Applied mathematics in Engineering, Management and Technology 2014 E. Ebrahimi et al Table 2. Time and frequency domain features Frequency domain features Wavelet FFT phase angle Feature description W1 s (k ) K ((s (k ) W ) W2 Root mean square (RMS) W3 F3 k 1 K W5 W6 Impulse factor s (k ) k 1 s (k ) k 1 W4 W 3 K W Kurtosis F6 K W7 Crest factor F5 K W4 1 K k 1 k (k 1) W8 W9 K W T5 F4 T6 J 1 s( j ) J j 1 F4 F3 J j 1 j ( j 1) 4 K s (k ) W k ( W 1 )3 (k 1)(k 2) k 1 where s(k) is a signal series for k= 1,2,….,K, K is the number of data points F8 F9 (i ( j ) F ) T3 N 1 N x ( n) n 1 T4 N 1 N x ( n) n 1 T4 T3 N T N n x 2 (n ) ( x (n ))2 n 1 n 1 n (n 1) N 4 1 j 1 2 n 1 T7 J 4 ( x(n)) N T4 max x(n) F3 1 J s(j ) J j 1 j 1 F 1 k 1 T3 J J K (s (k ) W ) N 1 2 j i 2 ( j ) ( i ( j )) 2 K 2 1 n 1 N j 1 F7 k s 2 (k ) ( s (k )) 2 k 1 T2 F4 max i ( j ) W3 1 K (i ( j )) N (( x(n) T ) 1 J 1 2 n 1 N 2 J W 4 max s (k ) Shape factor T1 J j 1 F2 K 1 (s (k )) j 1 ((i ( j ) F ) 2 1 k 1 i(j) J K Peak value Skewness F1 k 1 K Standard deviation N x ( n) J K Mean value Time domain features J F4 J i(j)F j ( F 1 )3 ( j 1)( j 2) j 1 where i(j) is a signal series for j= 1,2,….,J, J is the number of data points T8 T9 ( x ( n ) T ) 4 1 n 1 N T 4 N x ( n ) T n ( T 1 )3 (n 1)(n 2) n 1 where x(n) is a signal series for n= 1,2,….,N, N is the number of data points 6.The Architecture of Probabilistic Neural Networks A probabilistic neural network (PNN) has 3 layers of nodes. The figure below displays the architecture for a PNN that recognizes K=4 classes, but it can be extended to any number K of classes. The input layer (on the left) contains N nodes: one for each of the N input features of a feature vector. These are fan-out nodes that branch at each feature input node to all nodes in the hidden (or middle) layer so that each hidden node receives the complete input feature vector x. The hidden nodes are collected into groups: one group for each of the K classes as shown in the figure. 420 Applied mathematics in Engineering, Management and Technology 2014 E. Ebrahimi et al Hidden Layer Input Layer Output Layer Class 1 Group x1 O1 Class 2 Group x2 O2 Class 3 Group x3 O3 Class 4 Group Ok xN Fig.5.The architecture of probabilistic neural networks Each hidden node in the group for Class k corresponds to a Gaussian function centered on its associated feature vector in the kth class (there is a Gaussian for each exemplar feature vector). All of the Gaussians in a class group feed their functional values to the same output layer node for that class, so there are K output nodes. At the output node for Class kth, all of the Gaussian values for Class kth are summed and the sum is scaled to so the probability volume under the sum function are unity so that the sum forms a probability density function. Here we temporarily use special notation for clarity. Let there be P exemplar feature vectors {x (p): p =1,...,P} labeled as Class kth. In the hidden layer there are P nodes in the group for Class kth. The equation (1) is used for each Gaussian centered on the Class kth points x (p) (feature vectors), thus for any input vector x: x x ( p ) g K (x ) 2 e 2 2 (1) (2 ) The kth output node sums the values received from the hidden nodes in the kth group. The sums are defined by f k (x ) 2 N 1 1 P e P p 1 x x ( p ) 2 2 2 (2) (2 ) where x is any input feature vector, are the standard deviations for Gaussian in Classes kth, N is the dimension of x x (p) the input vectors, P is the number of center vectors in Class kth, x(p) Classes kth, and is the Euclidean distance (square root of the sum of squared differences) between x and x(p). Any input vector x is put through sum function fk(x) and the maximum value (maximum a posteriori, or MAP value) of fk(x) decides the class. 2 N 421 Applied mathematics in Engineering, Management and Technology 2014 E. Ebrahimi et al We are given the exemplar feature vectors that make up the training set. For each one we know the class to which it belongs. The following sets up the PNN. Step 1. Read in the file of exemplar vectors and class numbers. Step 2. Sort these into the K sets where each set contains one class of vectors. Step 3. For each k define a Gaussian function centered on each exemplar vector in set k. define the summed Gaussian output function. Once the PNN is defined, then we can feed vectors into it and classify them as follows. Step 1. Read input vector and feed it to each Gaussian function in each class. Step 2. For each group of hidden nodes, compute all Gaussian functional values at the hidden nodes. Step 3. For each group of hidden nodes, feed all its Gaussian functional values to the single output node for that group Step 4. At each class output node, sum all of the inputs and multiply by constant. Step 5. Find maximum value of all summed functional values at the output nodes. 7. Fault diagnosis In order to evaluate the proposed approach, it was appliedto fault diagnosis of starter motor. The data set was collected under different fault categories.The data sets were divided into two separate datasetsthe training dataset and the testing data set. 75 percent of each data set was used for training data and 25 percent of them were used for testing data. Table 3 shows the detailed description of the dataset.According to the featureextraction resultsmentionedin Section 5,thenumbers of 27 features were presented for PNN classifier as entry. Label of classification 1 2 3 4 Operating condition Healthy WB CRB UDS Table 3. Data set description Number of testing Number of training samples samples 30 90 30 90 29 88 26 79 Number of data set 120 120 117 105 PNN classifier was implemented by usingthe MATLAB software package (MATLAB version R2008a).The training data set was used to train the PNNmodel,whereas the testing data set was used to verify the accuracyand the effectiveness of the trained PNNmodel for classification of the four classes of starter motor fault. After training, 25 percent of data set as testing datawere used to validate theaccuracy of the PNNmodel for classification of the starter motor faults.The confusion matrix showingthe classification results of the PNNmodel is givenin Table 4.The diagonal elements in the confusion matrix show the number of correctly classified instances. In the firstcolumn, the first element shows the number of data points belonging to Healthy class andclassified by PNNas Healthy. The second element shows the number of data points belonging to Healthy class but misclassified as WB. The third element shows the number of data points misclassified as CRB and so on. Table 4. Confusion matrix of testing data Output/desired Healthy WB CRB Healthy 29 0 1 WB 0 28 0 CRB 0 0 29 UDS 0 2 4 UDS 0 2 0 20 Sensitivity, specificity and total classification accuracy are three criteria to determine the testperformance of the classifiers. These criteria are defined as: 422 Applied mathematics in Engineering, Management and Technology 2014 E. Ebrahimi et al Sensitivity: number of true positive decisions/number ofactually positive cases. Specificity: number of true negative decisions/number ofactually negative cases. Total classification accuracy: number of correct decisions/total number of cases. According to the values of statistical parameters (see Table 5), PNNclassified sets Healthy, WB, CRB, and UDS as96.67, 93.33, 100 and 76.92%, respectively. Also, the totalclassification accuracy of PNNwas obtained to be 92.17%. Fault condition Healthy WB CRB UDS Table 5. The values of classification accuracy criteria Statistical parameter Sensitivity (%) Specificity (%) Total classification accuracy (%) 96.67 98.82 93.33 97.65 92.17 100 100 76.92 93.26 8. Conclusion The aim of this paper is intelligent diagnosis of the fault type on the starter motor of kind of truck accurately and quickly.The acousticdata were collected from the starter motor under different fault categories using a piezoelectric acceleration sensor and data acquisition system. Statistical features from the time,the frequency domains and wavelet are extracted to reflect different faults of the starter motorthe trained PNN model was evaluated using 25 percent of acquired data and it was observed that the total classification of this technique is 92.17%. The results show the applicability and effectiveness of this method to detect the fault in the starter motors. Acknowledgement This research is supported by Islamic Azad University, Kermanshah Branch. This assistance is gratefully appreciated. References: Ahmadi, H., Mollazade, K. 2009a. Fault diagnosis of an electro-pump in a marine ship using vibration condition monitoring. Insight, 51(8); 431-438. Ahmadi, H., Mollazade, K. 2009b. A practical approach to electromotor fault diagnosis of Imam Khomaynei silo by vibration condition monitoring. African Journal of Agricultural Research, 4 (4): 383-388. Akcayol, M. A. 2004. Application of adaptive neuro-fuzzy controller for SRM. Advances in Engineering Software, 35(3-4); 129-137. Alavandar, S., Nigam, M. J. 2008. Adaptive Neuro-Fuzzy Inference System based control of six DOF robot manipulator. Journal of Engineering Science and Technology Review, 1: 106- 111. Bloch, H., d Geither, F. K. 1990. Machinery Failure Analysis and Troubleshooting, Gulf Publishing Company, Houston, Texas. Chindurza, I., Dorrell, D. G., Cossar, C. 2004. Vibration analysis of a switched reluctance machine with eccentric rotor. In Proceedings of the Second International Conference on Power Electronics, Machines and Drives (PEMD), March-2 April. 2(31); 481–486. Gaeid, K. S., Mohamed, H. A. F. 2010. Diagnosis and Fault Tolerant Control of the Induction Motors Techniques a Review. Australian Journal of Basic and Applied Sciences, 4(2); 227-246. Goering, C. E., Hansen, A. C. 2004. Engine and Tractor Power. American Society of Agricultural and Biological Engineering; 4th edition. USA. Lei, Y. A., He, Z., Zi, Y. 2008. A new approach to intelligent fault diagnosis of rotating machinery. Expert Systems with Applications, 35; 1593–1600. 423 Applied mathematics in Engineering, Management and Technology 2014 E. Ebrahimi et al Miguel, L. J. D., Blázquez, L. F. 2004. Fuzzy logic-based decision-making for fault diagnosis in a DC motor. Engineering Applications of Artificial Intelligence, 18(4); 423-450. Mohamadi Monavar, H., Ahmadi, H., Mohtasebi, S. S., Hasani, S. 2008. Vibration Condition Monitoring Techniques for Fault Diagnosis of Electromotor with 1.5 Kw Power. Journal of Applied Sciences, 8(7): 1268-1273. Mollazade, K., H. Ahmadi, M. Omid and R. Alimardani. 2009. An intelligent model based on data mining and fuzzy logic for fault diagnosis of external gear hydraulic pumps. Insight, 51(11): 594-600. Saravanan, N., Ramachandran, K. I. 2010. Incipient gear box fault diagnosis using discrete wavelet transform (DWT) for feature extraction and classification using artificial neural network (ANN). Expert Systems with Applications. 37(6); 41684181. Sing, G. K., Ahmed, S. A. K. S. 2004. Vibration signal analysis using wavelet transform for isolation and identification of electrical faults in induction machine. Elecical Power Systems Research, 68(N2); 119-136. Skarlatos, D., Karakasis, K., Trochidis, A. 2004. Railway wheel fault diagnosis using a fuzzy-logic method. Applied Acoustics, 65(10); 951-966. Undacheck, J., Dodd, V. R. 1976. Progress and way out of a machinery surveillance and diagnostic system. In Proceedings of the ASME Conference on Pressure Vessel and Piping, Mexico City, Mexico, September 1976. Witten I H and E Frank, ‘Data Mining: Practical machine learning tools and techniques’, Morgan Kaufmann Press, 2nd edition, 560 pages, 2005. Wu, J. D., Huang, C. K., Chang, Y. W., Shiao, Y. J. 2010. Fault diagnosis for internal combustion engines using intake manifold pressure and artificial neural network. Expert Systems with Applications, 37(2); 949-958. Wu, J. D., Kuo, J. M. 2009. An automotive generator fault diagnosis system using discrete wavelet transform and artificial neural network. Expert Systems with Applications, 36; 9776–9783. Yang, Q. 2004. Model-based and data driven fault diagnosis methods with applications to process monitoring. PhD Thesis. Case Western Reserve University. Zhang, Y., Randall, R.B. 2009. Rolling element bearing fault diagnosis based on the combination of genetic algorithms and fast kurtogram. Mechanical Systems and Signal Processing, 23(5); 1509-1517. 424


© Copyright 2026