
EVIDENCE-BASED PRACTICE WORKBOOK
EVIDENCE-BASED PRACTICE
WORKBOOK
Evidence-Based Practice Working Group
School of Population Health
The University of Melbourne
August 2005
Do not cite or quote
Copyright Statement
“All rights reserved: these materials are copyright. Apart from any fair dealing for the purpose
of private study, research or as permitted under the Copyright Act particularly for educational
use, no part may be reproduced or copied in any form or by any means without prior
permission of The University of Melbourne.
The University of Melbourne believes that all information, both written and oral, given in the
course of or in connection with its activities of problem based learning (whether by the
University of Melbourne itself or its employees or agents) is accurate and reliable.”
“The University of Melbourne is bound by and committed to supporting the principles
contained in the Information Privacy Act 2000 and the Health Records Act 2001 in its
treatment of personal and health information. All information has been identified in relation to
personal, health and sensitive information and all relevant consents have been obtained to
protect the privacy of individuals.”
“The University of Melbourne reserves the right to make improvements and/or changes in the
format and/or content of these materials.”
“Links to web sites have been provided which, at the time of publishing these materials, were
correct. However the University of Melbourne takes no responsibility for the accuracy of
those sites. Users consult other links at their own risk.”
© The University of Melbourne (1999-2005)
School of Population Health
2
TABLE
OF
CONTENTS
TABLE OF CONTENTS ................................................................................................ 3
STAFF DETAILS ......................................................................................................... 5
INTRODUCTION TO EBP ............................................................................................. 6
GENERIC SKILLS STATEMENT .................................................................................... 8
LIST OF ACRONYMS ................................................................................................... 8
1.
INTRODUCTION ................................................................................................... 9
1.1
1.2
2.
ASK THE ANSWERABLE QUESTION..................................................................... 13
2.1
2.2
2.3
2.4
2.5
2.6
2.7
2.8
2.9
3.
Learning objectives ....................................................................................... 22
Core reading and key concepts .................................................................... 22
Worked examples ......................................................................................... 35
Self-complete exercise.................................................................................. 40
Answers to self-complete exercise ............................................................... 40
Recommended reading................................................................................. 42
Further reading ............................................................................................. 42
References.................................................................................................... 42
Websites ...................................................................................................... 42
ARTICLES ABOUT THERAPY ............................................................................... 44
4.1
4.2
4.3
4.4
4.5
4.6
4.7
4.8
5.
Learning objectives ....................................................................................... 13
Core reading and key concepts .................................................................... 13
Worked examples ......................................................................................... 16
Self-complete exercise.................................................................................. 18
Answers to self-complete exercise ............................................................... 20
Recommended Reading ............................................................................... 20
Further reading ............................................................................................. 21
References.................................................................................................... 21
Websites ....................................................................................................... 21
SEARCHING THE MEDICAL LITERATURE .............................................................. 22
3.1
3.2
3.3
3.4
3.5
3.6
3.7
3.8
3.9
4.
References .................................................................................................. 11
Further reading ............................................................................................ 12
Learning objectives ....................................................................................... 44
Core reading and key concepts .................................................................... 44
Worked example ........................................................................................... 52
Self-complete exercise.................................................................................. 55
Answers to self-complete exercises.............................................................. 57
Recommended reading................................................................................. 59
References.................................................................................................... 59
Critical appraisal worksheets ........................................................................ 59
SYSTEMIC REVIEWS .......................................................................................... 67
5.1
5.2
5.3
5.4
Learning objectives ....................................................................................... 67
Core reading and key concepts .................................................................... 67
Worked examples ......................................................................................... 77
Self-complete exercises................................................................................ 84
School of Population Health
3
5.5
5.6
5.7
5.8
5.9
Answers to self-complete exercises.............................................................. 89
Recommended reading................................................................................. 92
Further reading ............................................................................................. 93
References.................................................................................................... 93
Critical appraisal worksheets (systematic reviews)....................................... 95
DIAGNOSTIC TESTS......................................................................................... 104
6.
6.1
6.2
6.3
6.4.
6.5
6.6
6.7
6.8
6.9
6.10
7.
Learning objectives ..................................................................................... 104
Core reading and key concepts .................................................................. 104
Other useful concepts ................................................................................. 110
Evaluating and applying the results of an article about diagnosis ............. 111
Self-complete exercises.............................................................................. 114
Answers to self-complete exercises............................................................ 127
Recommended reading............................................................................... 134
Further reading ........................................................................................... 135
References.................................................................................................. 135
Critical appraisal worksheets .................................................................... 136
STUDIES ABOUT PROGNOSIS ........................................................................... 143
7.1
7.2
7.3
7.4
7.6
7.7
7.8
7.9
Learning objectives ..................................................................................... 143
Core reading and key concepts .................................................................. 143
Worked example ......................................................................................... 150
Self-complete exercise................................................................................ 154
Suggested reading...................................................................................... 160
Further reading ........................................................................................... 160
References.................................................................................................. 160
Critical appraisal worksheets ...................................................................... 162
8. HELPING PATIENTS (“CONSUMERS”) TO MAKE INFORMED DECISIONS WHICH
INTEGRATE THEIR VALUES WITH CLINICAL EVIDENCE .............................................. 165
8.1
8.2
8.3
8.4
8.5
Learning objectives ..................................................................................... 165
Core reading, key concepts, and worked examples ................................... 165
Recommended reading............................................................................... 171
Further reading ........................................................................................... 172
References.................................................................................................. 172
9.
CONTRIBUTORS AND AKNOWLEDGEMENTS........................................................ 174
10.
GLOSSARY OF TERMS ................................................................................... 175
11.
BIBLIOGRAPHY ............................................................................................. 177
School of Population Health
4
EBP Workbook 05
STAFF DETAILS
Academic Coordinators
Dr Peter Greenberg
Physician, Department of General Medicine
Principal Fellow, Department of Medicine, University of Melbourne
Project Director, Evidence Based Practice
Clinical Epidemiology & Health Care Evaluation Unit
The Royal Melbourne Hospital
Tel
9342 7459
Email: [email protected]
Administration
Ms Kate Dumas
Undergraduate Programs Officer
School of Population Health, University of Melbourne
Room 427, Level 4, 207 Bouverie Street
Carlton VIC 3053
Tel:
8344 9336
Email: [email protected]
School of Population Health
5
EBP Workbook 05
INTRODUCTION TO EBP
Evidence-based Practice (EBP) has been described as “the conscientious, explicit and
judicious use of current best evidence in making decisions about the care of individual
patients” 1. The practice of evidence-based practice integrates clinical expertise and
patient values with the best available research evidence2.
There are four basic steps to incorporating the best available research evidence in
decision making: asking answerable questions; accessing the best information; appraising
that information for validity and relevance; and applying the information to patient care.
This EBP course aims to equip you with the necessary skills to both identify and
incorporate the best available research evidence into your clinical training and clinical
practice.
•
For those of you starting Semester 8 in 2005, the course is undertaken over
Semesters 8 and 9, and consists of:
1.
Three ‘Back-to-Base’ days
These are undertaken at the University of Melbourne, Parkville, but it is possible that
some of these may be held at the Rural Clinical School as well. Each of these three
modules is of 0.5 days duration, and introduces the key elements of evidence based
practice, using a combination of short didactic sessions and worked exercises in
evidence- identification, critical appraisal and decision-making.
2.
EBP in clinical practice
This program of integrated evidence identification, appraisal and decision-making is
nested within the Integrated Clinical Practice (ICP) block structure. It aims to provide
practical experience in the use of EBP in a variety of clinical settings – clinics,
diagnostic meetings (radiology, pathology, clinical), and inpatient rounds.
EBP objectives for the first three clinical attachments are as follows:
1st clinical attachment • to construct patient-focused, answerable questions
• to begin to search for evidence
• to begin to apply evidence in clinical situations
2nd clinical attachment • to apply the principles of ‘asking answerable questions’ to clinical scenarios,
especially where therapy is the issue
• to competently conduct MEDLINE and ‘secondary’ database searches and
retrieve articles about therapy
• to appraise articles critically, with an understanding of clinical and statistical
significance, relevance and validity
School of Population Health
6
EBP Workbook 05
3rd clinical attachment • to apply the principles of ‘asking answerable questions’ to clinical scenarios or
problems, especially where diagnosis is the issue
• to competently conduct MEDLINE/Cochrane searches and retrieve articles
about diagnosis
• to begin to apply the concepts of sensitivity, specificity and likelihood ratios of
diagnostic tests to clinical problems with diagnostic issues
•
For those of you studying HP2 and HP3 in 2005, the course involves three lectures
in Semester 2 on the critical appraisal of publications addressing ‘Prognosis’,
‘Therapy’, and ‘Diagnosis’, each of which is followed by a practical tutorial. In
Semester 3, you will have 3 lectures on ‘Asking answerable questions’, ‘Searching
secondary databases’ and ‘Searching primary databases’, the latter two of which are
followed by practical tutorials. The objectives for your first three clinical attachments in
Semesters 8 and 9 are as outlined in ‘2’ above.
EBP practice provides us with exciting tools to improve patient care and maximise patient
outcomes. This EBP course provides you with the necessary skills to incorporate
evidence into your clinical practice over the course of your clinical career. If you have
questions or queries, please contact your lecturer, tutor, or the staff listed under Staff
Details.
Peter Greenberg
References
1
Sackett DL, Rosenberg WM, Gray JA, Haynes RB, Richardson WS. Evidence
based medicine: what it is and what it isn't. BMJ 1996; 312:71-72.
2
Straus S, Richardson SR, Glasziou P, Haynes BR. Evidence-Based Medicine. How
to practice and teach EBM. 3rd ed. Elsevier Churchill Livingstone. 2005.
School of Population Health
7
EBP Workbook 05
GENERIC SKILLS STATEMENT
The aim of the “Back-to-Base” days is to equip students with sufficient literacy and skills
so that, during their clinical training blocks, they will be able to:
1.
2.
3.
4.
5.
6.
7.
Reflect on the case scenario to ask the right clinical questions to search for the
best evidence
Find the best available evidence
Appraise the quality and relevance of the evidence
Integrate the research evidence into clinical decision-making
Involve the patient and translate this synthesis into clinical practice
Reflect on the changes effected by EBP on clinical practice
Ask themselves if there are further clinical questions which can be answered
LIST OF ACRONYMS
AAQ
Ask an Answerable Question
CAT
Critical Appraisal of an Article
IMRAD
Introduction Methods Results Analysis and Discussion
LR
Likelihood Ratio
MLS
MEDLINE Search
NNT
Number Needed to Treat
School of Population Health
8
EBP Workbook 05
1.
INTRODUCTION
“ W here is the Life we have lost in living?
Where is the wisdom we have lost in knowledge?
Where is the knowledge we have lost in information? ”
From “The Rock”. TS Eliot 1934
Decisions made during consultations between patients and clinicians have many
determinants. These include the patient and clinician involved at the time and the setting
in which the interaction takes place. Constraints limit the choices that might be otherwise
available at specific places and times. Perceptions about the type and the quality of the
evidence that supports clinical decisions are also relevant.
‘Evidence’ means different things to different people. To a fundamentalist it might mean
what you know to be true. A legal definition of evidence is ‘material which tends to prove
or disprove the existence of a fact, and which is admissible in court’. To a ‘postmodernist’, ‘evidence’ could mean something that you have experienced yourself. The
ancient Greeks debated the value of rational evidence, which could be soundly argued
according to logical rules, compared to empirical evidence, which was assumed to be
valid because it was based on observations. These arguments remain unresolved, but the
scientific basis of medicine is founded on empirical evidence, which comes from
observations and experiments.
Scientific evidence in clinical decisions incorporates basic, clinical, and epidemiological
data obtained from observation and experiment. Patient and clinician related factors
include cultural beliefs, personal values, knowledge and experience. Constraints include
policies, laws, community standards and costs. The relative importance of scientific
evidence has grown over the last 150 years, and especially in the last 50 years. This
partly reflects increasing expectations of patients (‘consumers’) that clinicians will produce
and use even more scientific evidence in healthcare decisions. Should we be afraid of
such changes in community expectations? No, but tools are needed for practitioners to
be better equipped to incorporate scientific evidence.
This workbook is designed to help evolving clinicians adapt to a new way of providing
evidence-based care. It is not always easy and may even be threatening at times. The
patient before you in the clinic or hospital expects you to do your best for them. If your
focus is on ensuring that the best quality evidence is available, and if listen to them, and
take their views into consideration in formulating a management plan, you are well on the
path to “finding the knowledge lost in the information”.
What is evidence-based practice?
There is nothing new about applying empirical evidence to clinical situations. The first
controlled trial is described in the old testament1. The fate of Daniel and his colleagues,
who were fed a diet of vegetables and water for 10 days, was compared to a control group
of Nebuchadnezzar’s subjects, who consumed meat and wine. Maimonides, physician to
Saladin the Great of Egypt and a 12th century philosopher, also supported a scientific
approach: “He who puts his life in the hands of an empiricist who does not think
scientifically, is like a mariner who places his trust in good luck.” Scientific methodology in
medical practice was firmly established by Pierre CA Louis (1787-1872), who showed that
blood-letting did not result in better outcomes for patients with pneumonia.
School of Population Health
9
EBP Workbook 05
Although scientific evidence was being increasingly incorporated into clinical medicine,
especially since the start of the nineteenth century, the term ‘evidence based medicine’
(EBM) was first used in Canada in 19902. It appeared in refereed publications soon after
this3.
Evidence based practice has been described as “the conscientious, explicit and judicious
use of current best evidence in making decisions about the care of individual patients”4. It
“requires the integration of best research evidence with clinical expertise and our patient’s
unique values and circumstances” 5.
Straus and colleagues elaborate further on these elements5:
Clinical expertise
“By clinical expertise we mean the ability to use our clinical skills and past experience to
rapidly identify each patient’s unique health state and diagnosis, their individual risks and
benefits of potential interventions, and their personal circumstances and expectations.”
Best available research evidence
“By best research evidence we mean valid and clinically relevant research, often from the
basic sciences of medicine, but especially from patient-centred clinical research into the
accuracy of diagnostic tests (including the clinical examination), the power of prognostic
markers, and the efficacy and safety of therapeutic, rehabilitative and preventive
regimens. New evidence from clinical research both invalidates previously accepted
diagnostic tests and treatments and replaces them with new ones, that are more accurate,
more efficacious, and safer.”
Patient values
“ By patient values we mean the unique preferences, concerns and expectations each
patient brings to a clinical encounter and which must be integrated into clinical decisions if
they are to serve the patient.”
Patient circumstances
“ By patient circumstances we mean their individual clinical state and the clinical setting.”
The ‘steps’ of evidence-based practice (EBP)
The practice of EBP requires the following steps 6:
• converting the information needs which arise from clinical encounters into questions.
• searching for the best evidence available, in order to answer these questions.
• critically appraising the evidence found. This involves examining the internal validity of
the study, assessing the importance, or the size of the effect and deciding on the
relevance of the study to specific clinical situations.
• applying the information from the critical appraisal to the care of individual patients.
This requires integrating the evidence with clinical expertise and with knowledge
about individual patients, their values and circumstances. It also includes
communicating the outcomes of the above steps to patients, to assist them make
optimal decisions for themselves.
• evaluating the four steps above, and learning ways to make them even more effective
and efficient.
School of Population Health
10
EBP Workbook 05
What can we expect?
Clinical practice is likely to become even more enriched by an expanding body of research
information. The quality of the evidence that is available to practising clinicians is likely to
improve as better research methods in the science of synthesis of research findings are
developed. Clinicians are increasingly confronted with inadequate time and resources to
find, evaluate and incorporate new knowledge into everyday clinical decision-making.
Information technology is already providing ‘point-of-care’ access to data on effectiveness
of care. Practitioners and students, however, need new skills to make use of this
technology.
Most doctors want to be ‘better and faster’
Timely, useful evidence from biomedical literature should be an integral component of
clinical decision-making. For example, when a treatment is shown to be superior, we need
to know about it. It is easy for current research evidence to pass us by.
Although at some times we may lack the time, motivation, or all of those skills needed to
efficiently and properly appraise and synthesise information, we need to understand the
principles of how to do these. In contrast, we all need to know how to seek and find
relevant information and how to involve patients in the clinical decisions that affect them.
We also need to know the ‘short-cuts’ that are available for the other steps of EBP, so that
we can incorporate evidence at those times when we do not wish or are unable to
undertake all of these steps on our own.
Clinicians now face new challenges to ensure that we use all the knowledge that is
available and that we fully involve our patients in making best-quality decisions.
Fortunately we have tools, which help us achieve these goals. If you develop and use the
skills of EBP, you start the lifelong path to becoming and remaining a ‘better, faster
doctor’. Enjoy yourself as you acquire and practise the skills needed to find the
knowledge lost amongst the information!
Training as a clinician teaches you to listen to a patient’s story, to integrate the history with
the findings on physical examination, to incorporate the results of investigations and
together with the patient, to define and prioritise the patient’s relevant health ‘issues’. EBP
helps you to access clinical ‘information’ and to appraise it, so that it becomes
‘knowledge’. Clinical experience, discussion with colleagues and others, and listening and
responding to patients even has the capacity to transform ‘knowledge’ into ‘wisdom’!
“The most common criticism made at present by older practitioners is
that young graduates have been taught a great deal about the
mechanisms of disease, but very little about the practice of medicine or, to put it bluntly, they are too “scientific” and do not know how to
take care of patients.” 7
1.1
1.
References
Bible. Book of Daniel: Chapter 1:Verse 11-16.
School of Population Health
11
EBP Workbook 05
2.
3.
4.
5.
6.
7.
1.2
Guyatt GH, Rennie D. Users’ guides to the medical literature. American Medical
Association Press. Chicago 2002
Evidence-based medicine. A new approach to teaching the practice of medicine.
Evidence-Based Medicine Working Group. JAMA 1992; 268:2420-2425.
Sackett DL, Rosenberg WM, Gray JA, Haynes RB, Richardson WS. Evidence
based medicine: what it is and what it isn't. BMJ 1996; 312:71-72.
Straus S, Richardson SR, Glasziou P, Haynes BR. Evidence-Based Medicine.
How to practice and teach EBM. 3rd ed. Elsevier Churchill Livingstone. 2005.
Adapted from Reference 5 above
Peabody FW. The Care of the Patient. JAMA 1927; 88:877-882
Further reading
Dawes M, Summerskill W, Glasziou P, Cartabellotta A, Martin J, Hopayian K, Porzsolt F,
Burls A, Osborne, J. Sicily statement on evidence-based practice. BMC Medical
Education 2005; 5:1.
Access from http://www.biomedcentral.com/1472-6920/5/1
School of Population Health
12
EBP Workbook 05
2.
ASK THE ANSWERABLE QUESTION
2.1 Learning objectives
•
•
To understand the components of ‘answerable’ clinical questions.
To be able to formulate the information needs arising from ‘issues’ generated during
clinical encounters into potentially answerable questions.
2.2 Core reading and key concepts
Introduction
Almost every time we see a patient we need up to date and reliable information to answer
questions arising about some aspects of cause, diagnosis, prognosis or treatment. Such
needs depend on our “background” knowledge and experience at the time. Additional
information, often in the form of external evidence, which we might have to track down
and then evaluate, may be required as well. For many clinicians, the effort required to
both ask questions and seek answers is so formidable that, when coupled with limited
time for reading, discussion and attending meetings and courses, some of these
information needs are never fully realised.
As trainee clinicians progress through learning programs their information requirements
change. There is a shift from fairly broad “background” questions, which address general
knowledge about conditions and other subjects, to be replaced by more patient and
circumstance-specific “foreground” questions. The two components of structured
“background” questions1 are usually a question root (eg Who… What…?, Where…?,
How…?, When…?, Why…?) and a condition(eg disorder, treatment or test). Some
examples are: “What might cause this condition?”; “How do you diagnose…?”; “What is
the prognosis for patients with…?”; “What are the principles of treatment for patients
with…?”.
A structure for asking potentially answerable clinical “foreground” questions is necessary.
Such questions are less intuitive than “background” questions. This section is designed to
give you some understanding of what is required to formulate potentially answerable
‘foreground’ clinical questions, the first step in evidence-based practice (EBP). In our
experience, this is the hardest step faced in finding the best current evidence to address
clinical problems. The good news is that the skills can be learned and that they do
improve with practice. Clearly, not all potentially answerable clinical questions have
answers, but some of those that do not have answers can be developed further into
research questions to be answered later! Good luck and enjoy.
Structure of a ‘good’ clinical question:
1.
‘PICO’
Patient or problem
How would you describe a group of patients similar to yours? What are the most
important characteristics of the patient? This could include the primary problem, the
disease, or the co-existing conditions. Sometimes the sex, age or ethnic background
of patients might also be relevant to the diagnosis or treatment of a disease.
School of Population Health
13
EBP Workbook 05
2.
3.
4.
Intervention, prognostic factor, or exposure
Which main intervention, prognostic factor, or exposure are you considering? What
do you want to do for the patient? Prescribe a drug? Request a test? Recommend
surgery? What factor might influence prognosis? Age? Co-existing problems?
What was the patient exposed to? Asbestos? Cigarette smoke?
Comparison
What is the main alternative to compare with the intervention? Are you trying to
decide between two drugs, a drug and no medication or placebo, or two diagnostic
tests? Note that some clinical questions do not always require a specific comparison
to be made.
Outcomes
What do you hope to accomplish, measure, improve or affect? What are you trying
to do for the patient? Prolong life? Relieve or eliminate symptoms? Reduce the
number of adverse events? Improve functional performance or improve the results
of tests?
The structure of a question related to therapy might look like this:
In those patients with (Patient population) does this (Intervention) or (Comparison, if any)
affect this (Outcome)?
The type of question and the type of study are helpful in focusing the question and
determining the most appropriate type of clinical evidence.
Type of question
The most common types of questions related to clinical tasks:
Diagnosis
How to select and interpret diagnostic tests
Therapy
How to select treatments which offer patients more good than harm, and
that are worth the efforts and costs of using them
Prognosis/Risk
How to estimate the patient's likely clinical course over time and
anticipate complications of disease
Harm/Aetiology
How to identify causes for disease (including iatrogenic cause)
Type of study
There are many different types of studies. Some of these are shown below, in the form of
a pyramid:
School of Population Health
14
EBP Workbook 05
The pyramid illustrates the evolution of the research literature. The base of the pyramid is
where information usually starts, from an idea based on patho-physiological
considerations, or from laboratory research. As these ideas are developed into possible
‘interventions’, such as drugs and diagnostic tools, they are tested in laboratory models,
then in animals, and finally in humans. Testing in humans might begin with volunteers and
go through several phases of clinical trials, before the drug or diagnostic tool is adopted
for use within the general population. Randomised controlled trials are undertaken to
further test the effectiveness and efficacy of a drug or therapy. As you move up the
pyramid the amount of available literature may decrease, but its relevance to
clinical settings increases.
The ‘best’ evidence for questions of therapy comes from randomised, controlled clinical
trials and their derivatives. These are carefully planned projects that study the effect of a
therapy or test on real patients. They include methodologies that reduce the potential for
bias and that allow for comparison between intervention groups and control groups (no
intervention). Evidence for questions of diagnosis is found in prospective studies, which
compare tests with a reference or ‘gold standard’ test.
Evidence of aetiology or harm is usually found in cohort studies, which take a large
population and follow patients with a specific condition or receive a particular treatment
over time. These are compared to another group that has not been affected by the
condition being studied. Case control studies are studies in which patients who already
have a specific condition are compared with people who do not. Such observational
studies are less reliable than randomised controlled trials because the results are more
likely to be biased. Furthermore, showing an association between two factors does not
necessarily mean a causal relationship.
Case series and case reports consist of collections of reports on the treatment of
individual patients or a report on a single patient. Because they are reports of cases and
do not include control groups with which to compare outcomes, they have no statistical
validity, but may serve to generate hypotheses, which can then be scientifically assessed.
School of Population Health
15
EBP Workbook 05
The evidence pyramid also serves to introduce the concept of a hierarchy or ‘level’ of
evidence, which is based on the type of study design. This concept will be developed
later. You may not always find the highest-level evidence to answer your clinical
questions. In the absence of high-level evidence, you may need to consider moving down
the pyramid to other types of studies.
Data derived from the evidence pyramid can be grouped in various ways to facilitate the
update of evidence into clinical practice:
Systematic reviews usually focus on a clinical topic and answer a specific question.
Extensive literature searches are conducted to identify all relevant studies of sound
methodology. The studies are reviewed, assessed, and summarised according to the
predetermined criteria of the review question. Meta-analyses take systematic reviews a
step further by using techniques to summarise the results of several studies into a
quantitative estimate of the combined result.
Clinical practice guidelines are systematically developed statements to assist
practitioners and patients to make decisions about appropriate health care in specific
clinical circumstances. Guidelines review and evaluate the evidence and then make
explicit recommendations for clinical practice.
2.3 Worked examples
Start with the patient: a clinical problem/question arises from issues of care.
Joyce is an active 80-year old female. She lives in her own home and still drives a car.
Several weeks ago she developed pain in her knee, making it hard for her to walk.
The doctor made the diagnosis of osteoarthritis, and gave her a short course of an oral
non-steroidal anti-inflammatory drug (NSAID). She asks Joyce to see a physiotherapist to
begin a course of physiotherapy. Joyce is wary of potential side effects of the tablets, but
has had physical therapy before for her back and is very sceptical about this suggestion.
She wants to know if there is any proof that physiotherapy helps this problem.
You wonder whether there is any evidence to support the proposition that physiotherapy
does any good for this problem also. Does it?
What information-seeking strategies can you think of to answer this question?
The Question
Consider your current strategies for keeping up to date with the medical literature?
Write them down:
1.
........................................................................................................................................
2.
........................................................................................................................................
3.
........................................................................................................................................
School of Population Health
16
EBP Workbook 05
Some answers that might come to mind
1. Ask a keen (? young) physiotherapist
2. Ask a rheumatology consultant or registrar
3. Thumb through the back issues of the Medical Journal of Australia (MJA) in your
4.
5.
medical library, hoping that this topic was recently included.
Check the rheumatology section of the ‘Oxford Textbook of Medicine’
Glance at your lecture notes
Are there easier ways to get information from the published literature that might appeal to
someone who wants to be a ‘better faster doctor’ (or medical student)?
Can you phrase this problem as an answerable clinical question?
This is the first and most important step on the road to using search strategies for a
literature search (eg. using MEDLINE) and for critical appraisal.
The Question
Construct the clinical question.
HINT: Phrase your question in four parts;
Population
What is the group of patients that you will apply the information to?
(young or old, gender)
Intervention What is the intervention? (treatment, diagnostic test)
Comparison What do you want to compare this intervention to? (nothing?, placebo?,
other?)
Outcome. What is the result you are looking for?
(treatment benefit, side-effect, diagnostic test accuracy)
Choose the option which you think is the best question:
A. Is physiotherapy good for a painful knee?
B. Can physiotherapy help an elderly 80-year old female?
C. In people with osteoarthritis can physiotherapy improve comfort and mobility?
A. Is physiotherapy good for a painful knee?
This question is not specific enough. We still want to know the particular condition
and the outcome expected.
B. Can physiotherapy help an elderly 80-year old female?
We still want to know what the problem is and what the treatment can do for the
patient (the outcome)
Note
C. In people with osteoarthritis can physiotherapy improve comfort and mobility?
We now know the patient problem, the intervention, and the expected outcome.
Although we may not use all of this information to construct a search, we
may need to use more of it when it comes to evaluating the publications
found.
School of Population Health
17
EBP Workbook 05
The elements of the ’answerable’ clinical question are then used to build a search
strategy, in order to find the most relevant and highest quality evidence to inform a
decision.
2.4 Self-complete exercise
Clinical Problem
A 65-year old retired teacher has osteoarthritis in both knees
• she still has pain in spite of paracetamol 4 gm daily
• you wonder about a trial of a non-steroidal anti-inflammatory drugs (NSAID) instead
You are aware of an article2 which says that paracetamol and one of the NSAIDs are
equally effective. You wonder if one NSAID has a better side-effect profile than another. In
particular, you want to know whether there is any information about the relative gastrointestinal risks of different NSAIDs. This might help you decide which NSAID to try,
without putting your patient at undue risk.
Can you phrase this as an answerable clinical question?
This is the first and most important step on the road to a literature search and critical
appraisal.
HINT: Phrase your question in three or four parts:
Population
Intervention
Comparison
Outcome.
What is the group of patients that you will apply the information to?
What is the intervention?
What are you comparing (i.e. if you want to make a comparison)?
What is the result you are seeking?
CLINICAL CASE/SCENARIO
What are the important features of the case?
PATIENT OR PROBLEM
How would you describe a group of similar patients? What are the most important
characteristics of the patient?
INTERVENTION, EXPOSURE, PROGNOSTIC FACTOR
What main intervention are you considering? What do you want to do with this patient?
School of Population Health
18
EBP Workbook 05
COMPARISON
What is the main alternative being considered (if any)?
OUTCOME
What are you trying to accomplish, measure, improve or affect?
QUESTION
The clinical question is:
School of Population Health
19
EBP Workbook 05
2.5 Answers to self-complete exercise
CLINICAL CASE/SCENARIO:
What are the important features of the case?
65-year old retired teacher with osteoarthritis in both knees who currently has poor
quality pain relief on Paracetamol 4 gm daily, requests a trial of NSAIDs.
Does one NSAID have a better gastro-intestinal side effect profile than another?
PATIENT OR PROBLEM
How would you describe a group of similar patients? What are the most important
characteristics of the patient?
has osteoarthritis
INTERVENTION, EXPOSURE, PROGNOSTIC FACTOR
What main intervention are you considering? What do you want to do with this patient?
prescribe non-steroidal anti-inflammatory drugs (NSAIDs)
COMPARISON
What is the main alternative being considered?
another non-steroidal anti-inflammatory drug
OUTCOME
What are you trying to accomplish, measure, improve or affect?
side-effects/ gastro-intestinal
The clinical question is:
Does one NSAID have fewer (gastro-intestinal) side-effects than another?
2.6 Recommended Reading
Straus S, Richardson SR, Glasziou P, Haynes BR. Evidence-Based Medicine. How to
practice and teach EBM.3rd ed. Elsevier Churchill Livingstone. 2005
School of Population Health
20
EBP Workbook 05
2.7 Further reading
•
•
•
•
•
•
Oxman AD, Sackett DL, Guyatt GH, for the Evidence-Based Medicine Working Group.
Users’ guides to the medical literature: I. How to get started. JAMA 1993:270:20932095.
Richardson WS, Wilson MC, Nishikawa J, Hayward RSA. The well-built clinical
question: a key to evidence-based decisions” [Editorial]. ACP J Club 1995;
123(3):A12-13
Richardson WS. Ask, and ye shall retrieve. [EBM Note]. Evidence Based Medicine
1998; 3:100-101.
Mitchell G. Reframing the question. A way of applying evidence based medicine to a
common clinical situation. Aust Fam Physician 1998; 27:875-6.
Stone PW. Popping the (PICO) question in research and evidence-based practice.
Appl Nurs Res 2002;15197-8.
Onady GM, Raslich MA. Evidence-based medicine: asking the answerable question
(question templates as tools). Pediatr Rev 2003; 24:265-8.
2.8 References
1. Straus S, Richardson SR, Glasziou P, Haynes BR. Evidence-Based Medicine. How to
practice and teach EBM. 3rd ed. Elsevier Churchill Livingstone. 2005
2. Bradley JD, et al. Comparison of an anti-inflammatory dose of ibuprofen, an analgesic
dose of ibuprofen, and the acetaminophen in the treatment of patients with
osteoarthritis of the knee. N Eng J Med. 1991; 325:87-91
2.9 Websites
•
•
•
‘Focusing clinical questions’ from the Centre for Evidence-Based Medicine
Oxford(UK) http://www.cebm.net/focus_quest.asp
An interactive tool from the Centre for Evidence Based Medicine Toronto
http://www.cebm.utoronto.ca/practise/formulate http://www.cebm.utoronto.ca
See‘Evidence resources’.
A ‘downloadable’ tool for ‘hand-helds’ for storing clinical questions from the Centre for
Evidence Based Medicine Toronto http://www.cebm.utoronto.ca/palm/cqlogbook
School of Population Health
21
EBP Workbook 05
3.
SEARCHING THE MEDICAL LITERATURE
3.1 Learning objectives
To understand:
• the components of an answerable question
• the principles of searching MEDLINE
• important search strategy skills including:
o the difference between a ‘free text’ search and a ‘thesaurus’ search, using MeSH
(Medical Subject Heading) terms
o the main search operations
o the use of ‘filters’
o the use of ‘limits’
• the principles of searching ‘secondary’ databases
• the principles of searching with ‘EndNote’
3.2 Core reading and key concepts
When overwhelmed by information we may find it difficult to locate specific material which
adds value to clinical decision-making. In order to keep up with the medical literature,
some clinicians have a random approach, some read journals systematically, and some
rely on serendipity. Others use an exhaustive approach and set time aside to at least
read the table of contents of the latest journals and then to peruse particularly interesting
articles.
As you know, one solution for the problem of keeping up to date with the ever-changing
medical literature is called ‘problem-based learning’. When confronted by a clinical
question and are unsure of the current best answer, you need to know where to go to find
answers. You also need efficient search strategies to help you find answers to your
questions, to ‘find the knowledge lost amongst the information’.
Where do you find the best evidence?
Textbooks, especially the electronic versions which are frequently updated, remain a key
source of background information to help you learn the basics of diseases and
therapeutics. Repositories of clinically relevant, primary sources of research evidence are
held in huge databases, which can be accessed electronically. MEDLINE is the bestknown example. Access to the MEDLINE database is free through ‘PubMed’ but it can be
purchased, usually with additional electronic resources as well, through commercial
providers such as ‘OVID’. The University of Melbourne, the Victorian Department of
Human Services and many of the teaching hospitals have subscriptions to ‘OVID’, which
you can access.
Increasingly however, knowledge of common clinical problems is summarised and stored
in smaller, more selective electronic repositories. These secondary sources of evidence,
which often include material that has been systematically reviewed and/or pre-appraised,
are derived from selected components of the ‘primary’ research publications. They are
finding favour as trusted and easily accessible repositories of valuable and up to date
School of Population Health
22
EBP Workbook 05
information, particularly for common conditions. Busy clinicians are increasingly accessing
these electronically, at the point of patient care at the bedside or in the office, in their
quest to remain “better, faster doctors”.
Clinicians need to know how to use computers to access information from these sources
and to recognise when they may need to seek assistance, especially from librarians in
academic and clinical settings.
Note
This chapter provides background information about MEDLINE. You will learn data
acquisition skills through a clinical example, which generates an answerable question as
the basis for developing a MEDLINE search strategy to find clinically relevant information.
You will also be introduced to the ‘secondary’ databases. A list of resources to help you
find evidence-based information is provided at the end of this chapter. Subsequent
chapters address critical appraisal of the information retrieved, and the other steps of
evidence-based practice.
Depending on the type of clinical question, it is often more efficient to search the
secondary databases such as the ‘Cochrane Library of Systematic Reviews’, ‘
Clinical Evidence’ or the ‘ACP Journal Club’ first. If further information is still
required, you can then search primary databases like MEDLINE. In this
chapter, however, searching with MEDLINE is discussed first.
Developing your search strategy (eg MEDLINE)
The key stages in search preparation are:
• asking a clear search question
• breaking the question into parts
• using a range of search terms
• combining terms into a search strategy
Developing your search strategy is the process of:
• formulating your question
• choosing the appropriate database
• selecting the best Medical Subject Headings (MeSH) or index terms to describe
your topic
• combining the terms or sets
• limiting the retrieval to appropriate references
Reliable and efficient searching requires an understanding of:
• medical subject headings ‘MeSH’
• ‘explode’ and ‘focus’
• ‘subheadings’
• ‘textwords’ including ‘truncation’
• ‘boolean’ logic (AND, OR, and NOT)
• ‘limits’
The strategy for searching a ‘primary’ database like MEDLINE is outlined below:
School of Population Health
23
EBP Workbook 05
The MEDLINE Database
MEDLINE is produced by the National Library of Medicine (NLM) in the United States
http://www.nlm.nih.gov/nlmhome.html. Although broad in its coverage and the most well
known and widely used database within the medical field, it is important to remember that
MEDLINE has a significant American bias. It contains about 50% American material.
You can access MEDLINE through ‘Entrez PubMed’, which is freely available at
http://www.ncbi.nlm.nih.gov/entrez/query.fcgi?db=PubMed , and through ‘OVID’, to which
the University of Melbourne (‘Buddy’) and the Department of Human Services in Victoria
(‘Clinicians’ Health Channel’) subscribe. Your teaching hospital libraries may also have
‘OVID’ subscriptions.
In the sections of this chapter, searching MEDLINE through ‘OVID’ is outlined first. This is
then followed by a brief outline of searching through ‘PubMed’. You may find it easier to
School of Population Health
24
EBP Workbook 05
learn one or the other in the first instance, but the principles are very similar. In practice,
some clinicians use ‘OVID’ at the University and teaching hospitals, and ‘PubMed at home
and from other sites where ‘OVID’ may not be available.
To give a few facts and figures:
• MEDLINE contains over 12 million citations to articles published since 1966
• 500,000 citations are added to MEDLINE each year
• MEDLINE is not a full text database, so searches include the title and abstract, but not
the full text
• MEDLINE covers over 4,800 different journal titles, taken from over 70 different
countries
• more than 70% of citations contain abstracts
• ‘PubMed’ is not the same as MEDLINE. It includes some pre-1966 citations and some
‘in-process’ citations as well as MEDLINE
Each record in the database is broken down into separate sections or fields (eg author,
title, abstract). To aid retrieval of information the database is fully indexed using over
23,000 standard or thesaurus terms. These are called Medical Subject Headings or MeSH
terms for short.
Medical Subject Headings (MeSH)
Searching with MeSH terms helps to prevent important material being missed, as a result
of searching for other words or phrases in the text of titles and abstracts of records
making up the database. For example, problems with the use of singular and plural forms
of terms, differences between British and American spellings, and the use of synonyms by
different authors.
The MEDLINE database is indexed by information specialists. They read each article
completely and then assign terms to describe its content, as specifically as they are able
to. The terms used come from a standardised list of vocabulary and definitions called
MeSH or Medical Subject Headings. Each citation is allocated about 10-20 MeSH terms.
The idea behind MeSH terms is that all articles about the same concept are assigned the
same standardised subject heading. For example, one author may use the words diabetes
type 1, another may use insulin-dependent diabetes, and a third might use diabetes
mellitus, sudden-onset. All of these articles will be indexed under Diabetes Mellitus,
Insulin-Dependent, the MeSH term for this disease. Searching exclusively for the
textwords insulin-dependent diabetes, for example, retrieves only about one quarter of the
citations retrieved when ‘insulin-dependent diabetes’ is typed in the search box.
It is necessary to know about MeSH terms so that you can understand how a particular
search has been processed. With both ‘OVID’ and ‘PubMed’ at present, the default is
direct ‘mapping’ of textwords to the relevant MeSH terms, but only when this is possible,
as there are not MeSH terms to cover all of the contents of publications. In MEDLINE you
can seek and do the search with the appropriate MeSH term as well as textwords if you
wish. With both ‘Ovid’ and ‘PubMed’, at the end of a search using textwords, it is easy to
see exactly how the search was undertaken, and if MeSH terms were indeed used in that
particular search.
School of Population Health
25
EBP Workbook 05
Indexers at the USA National Library of Medicine specifically identify MeSH terms when
the subject described is a ‘major’ focus of the article being indexed. In this case the term
is referred to as being ‘majored’. MeSH terms are asterisked when they are ‘majored’.
Note
Broader/narrower subject headings
Broad MeSH terms ‘branch’ into successively narrower terms. Note that MEDLINE
indexers are requested to index to the most ‘specific’ level possible. This means that you
will often find fewer and only general articles indexed using broader indexing terms,
unless you take steps to include the more ‘distal’ branches of the MeSH trees, which
include the more specific terms as well.
MeSH terms and trees are displayed in the MEDLINE and Cochrane Library
databases. In ‘OVID’, choose ‘Search Tools’ and enter a term using ‘Permuted
Index’ for MeSH terms and ‘Tree’ for MeSH trees. ‘PubMed’ has a MeSH
Database, which is accessed from the left panel on the ‘PubMed’ home page.
You can select the appropriate MeSH term and also see its relationship to more
proximal and distal terms in the MeSH tree. MeSH trees are displayed in the
Cochrane databases by choosing ‘MeSH Search’ from the right side panel on
the home page.
Mapping
As indicated above, if you do not know the proper MeSH term for your topic, the inbuilt
mapping feature will help you. For example, when you type in a word or phrase in the
search box, ‘OVID’ and ‘PubMed’ automatically try to match it with an appropriate MeSH
term. In ‘OVID’, it is best to tick the box labelled ‘Map Term to Subject Heading’. This is
shown above and to the right side of the search box over the page:
School of Population Health
26
EBP Workbook 05
In ‘OVID’, the ‘Search History’ column shows how the search was processed, and if and
which MESH terms were used. You can see exactly how a search was processed in
PubMed by choosing ‘Details’, from the home page.
Explode
Explode is a function that allows you to expand your search strategy to include additional
and more specific terms from the distal branches of the MeSH trees. This is known as
‘exploding’ the broad term.
Using ‘OVID’, in the ‘Mapping Display’ screen, mark the box in the ‘Explode’ column
alongside the MeSH term(s) you wish to explode.
The ‘OVID’ ‘Mapping Display’ screen below illustrates how to explode the MeSH heading
‘Osteoarthritis, Knee’:
School of Population Health
27
EBP Workbook 05
When you explode a term, the system will automatically retrieve all citations indexed to
that term as well as all the citations indexed to the terms included under (i.e. below or
distal) to it. Exploding is a very powerful search tool but one that should be used with
caution. Exploding is useful when searching a broad topic, which you wish to proceed to
link with another topic (eg ‘coronary disease in Great Britain’). If the topic of your search
is very specific, ‘exploding’ a broad term that includes it may also retrieve a great deal of
irrelevant material besides. You may increase search specificity at the cost of search
sensitivity, and may be more successful by searching the specific topic on its own, without
‘exploding’ in this case.
In ‘PubMed’, when searching from the ‘MeSH Database’ screen, Explode is the default
setting, but you can choose ‘Do Not Explode This Term’ for a more specific search, which
includes only the chosen MeSH heading.
Focus
Restricting to Focus (when using the ‘OVID’ ‘Mapping Display’ screen) will limit a search
to only those citations in which the subject heading is considered the major point of the
article. As mentioned above, ‘majoring’ is a judgement made by the indexer, who is
required to identify the 3 or 4 major topics of the article. Begin with a broad search
strategy by not restricting to Focus. If you get too many citations, you can always go back
and re-enter the subject heading and use Focus to narrow the results.
Mark the box in the Focus column alongside a MeSH term if you wish only to retrieve
articles with the topic as a major focus. Leave the box blank if you are happy to retrieve
items where the topic is mentioned in any context.
School of Population Health
28
EBP Workbook 05
Note
In PubMed, when searching from the ‘MeSH Database’ screen, you can Focus by
choosing
‘Restrict Search to Major Topic Headings Only’.
‘Explode’ and ‘Focus’ are different concepts. You can choose to both ‘Explode’
and to ‘Focus’.
Subheadings
MeSH terms may also be combined with particular sub-headings, but you must select just
one MeSH term at a time in this case. There are over 80 sub-headings, which describe
particular aspects of, or particular ways of looking at, the subject concerned. For example:
‘adverse effects’, ‘diagnosis’, ‘therapy’. Where a sub-heading cannot be applied to a
particular MeSH term it is because it would not make sense to do so. Subheadings can
help further refine your search by narrowing it more specific aspects of the MeSH term,
which you consider to be more relevant to your search at the time. You can select any
number of subheadings by checking in the boxes next to the terms. The default is to
Include All Subheadings. Click on the sub-heading terms themselves for further
information regarding their particular usage.
The 32 Subheadings for the MeSH term ‘Osteoarthritis, Knee’ are illustrated in the ‘OVID’
screen below:
In PubMed you can see the available subheadings by clicking on MeSH terms in the
MeSH Database. You can then choose the relevant subheadings, and search using them
if you wish.
School of Population Health
29
EBP Workbook 05
Searches using textwords
In this approach, you are searching for the exact words used in the title and/or abstract.
This does NOT necessarily guarantee, however, that the word or phrase is the main topic
of the article. When using textwords, you should think about synonyms to be sure that
you are retrieving as much information as possible on the concept, even though the
automatic ‘mapping’ will include MeSH terms in the search where this is possible.
Textwords are useful in finding information on:
• subjects for which there is no good MeSH heading
• a concept that might be very new to the literature
• subjects that have very specific names, such as the ‘GUSTO’ trials
Textword qualifiers: a textword qualifier tells ‘OVID’ that you are looking for a textword
and therefore bypasses the mapping system:
• stroke.tw. will look for the word ‘stroke’ in the title or abstract
• stroke.mp. will look for the word ‘stroke’ in the title, abstract, registry number field and
as a MeSH term, but only if there is an exact match.
Alternatively, in ‘OVID’, searching a term with the ‘Map Term to Subject Heading’ box not
ticked will default to ‘mp’ as above.
In ‘PubMed’ if you wish to do a textword search exclusively, you can check to see how a
‘PubMed’ search was processed by clicking on ‘Details’, delete other components in the
search box, and search again only using the textword. Alternatively, after the search, you
can then click on ‘Limits’ and choose ‘textword’ as the search ‘field’.
Truncating textwords: textwords can be truncated to pick up various forms of a word.
For example, if you are looking for references that use the word empirical, you might also
want to consider looking for the word empiric.
In ‘OVID’ ‘:’ or ‘$’ symbols are used to truncate: eg empiric$
• empiric:.tw. will retrieve all forms of the word in the title and abstract
• empiric:.mp. will retrieve all forms of the word in the title, abstract, registry number
field and as a MeSH term, but only if the term begins with the word root
Note
In ‘PubMed’, truncating uses an asterisk * as a symbol, instead of the colon ‘:’ or dollar
sign ‘$’ used in ‘OVID’: eg empiric*.
Truncation removes the automatic MeSH term assignment and searching in
MEDLINE.
Combining terms (AND, OR)
After retrieving at least two separate sets of citations that discuss each of the key
elements of your topic, you need to combine them to identify the relevant articles among
the sets. Sets can be combined in the following ways:
School of Population Health
30
EBP Workbook 05
AND All terms must appear in each reference.
This will decrease the number of citations to review. Use ‘and’ to include all the important
concepts in the citations retrieved.
OR
Either of the selected terms may appear in each citation.
The ‘COMBINE’ function in ‘OVID’ will create a new set on the Main Search page.
Note
In ‘PubMed’, searches are combined by typing AND/OR, or by clicking ‘History’ and then
combining individual searches.
Only use the ‘Boolean’ operator ‘NOT’ when you are experienced in searching,
as it is easy to lose relevant citations with this term.
MEDLINE searching using ‘limits’
In MEDLINE, a number of ‘limits’ can be set. In ‘OVID’ these are listed directly below the
box labelled ‘Enter Keyword or Phrase’. Clicking ‘More Limits’ expands this list
These include:
• Human articles, which are primarily about human subjects. It will retain articles about
both human and animal subjects. If you limit by Age Group you do not need to use
this limit.
• English Language articles, which are written in the English language. Foreign
language articles with English abstracts will be eliminated by a limit to English.
• Review Articles
• Abstracts includes citations with abstracts or summaries of the article.
• Latest Update includes citations from the most recent update of the database.
• Full Text includes journal titles to which there is a full text link
• Publication Year
Note
In ‘PubMed, limits are chosen by clicking on ‘Limits’.
It is usually best to save applying limits until the final stage of the search.
Searching with Filters
Note
A filter can be created to identify all articles indexed in MEDLINE, which have a particular
set of methodological characteristics. In ‘OVID’ choose ‘More Limits’ after searching for
citations, and then choose the particular filter you want from ‘Clinical Queries’.
‘PubMed Clinical Queries’, which is accessed from the left side panel on the
‘Entrez PubMed’ home page, is a very useful resource to start searching for
questions of diagnosis, treatment, prognosis and cause, and for clinical
prediction guides.
School of Population Health
31
EBP Workbook 05
Displaying the results
Once your search strategy has retrieved a reasonable set of citations, you can begin to
review the results. Click on the Display button for any set to display those citations.
The default setting is to show the citations with Title, Author and Source displayed in
groups of ten. Click on ‘Customize Display’ for other display options.
In ‘PubMed’, the ‘Display’ button on the home page enables a choice from the drop-down
menu for displays other than in ‘Summary’ form.
Searches using ‘EndNote’
The University of Melbourne has a site licence for this software package. CD’s can be
obtained from the Brownless Library for loading on to your own computer. In addition to
searching, ‘EndNote’ stores and manages references in files called ‘libraries’ for future
perusal and for formatting in bibliographies, in the citation style of your choice. The
University Library homepage has a link to further details about ‘EndNote’, which includes
guides to its use and links to web-based tutorials. ‘EndNote’ libraries have an excellent
‘search’ facility for finding terms within them. This makes them very useful to store the
references retrieved.
MEDLINE searching can be undertaken by searching MEDLINE through ‘OVID’ or
‘PubMed’ first, as outlined above, and by then downloading and storing the citations in
your chosen ‘library’. Alternatively searches can be undertaken from the package directly
after choosing from a broad variety of search fields.
It is strongly recommended that you learn to use ‘EndNote’ for searching, and also for
storage of citations for your future reference.
When searching with ‘Endnote’, it is easy to include multiple search terms, to search in a
large range of ‘fields’ from the ‘pull-down’ menu and to store relevant citations for future
reference in your own 'EndNote Library'’
Searches using ‘Google’
At times you may retrieve useful citations with ‘Google’ or ‘Google Scholar’. The strategies
described are recommended as ‘Google’ currently accesses only a small portion of
MEDLINE. In addition, there is a bias for frequently cited and older publications.
‘Troubleshooting’ searches in ‘primary’ databases
If you’re having difficulty finding enough relevant citations, consider the following:
•
•
review the MeSH headings assigned to publications that are of most interest and
relevance to the search question. You can then, if you wish, construct an
additional search strategy by including MeSH headings that you may not have
considered. This is called a ‘cascade search’, and helps to ensure that you have
identified the relevant MeSH headings.
after choosing the most relevant citation, in ‘OVID’ click on ‘Find Similar’, and in
‘PubMed’ click on ‘Related Articles’ to retrieve additional citations.
School of Population Health
32
EBP Workbook 05
•
seek assistance from more experienced ‘searchers’, especially the librarians in
teaching institutions, who are information experts!
‘Secondary’ sources of evidence
In searching, it is often more efficient to search in these first, and to only search the
‘primary’ sources if the search is unsuccessful. One reason is that citations are selected
for inclusion, so that there are fewer citations than in primary databases like MEDLINE;
searches are both faster and more specific. Another advantage is that many of the
publications have already been appraised.
Cochrane Library
This is available at no cost throughout Australia. It can be accessed from Australia
through the National Institute of Clinical Studies (NICS) website http://www.nicsl.com.au
This also includes a ‘Cochrane User’s Guide’ from the ‘Quick Links’ box. The Library is
also available through the ‘Clinicians’ Health Channel’, from your teaching hospital
libraries, and directly from http:www3.interscience.wiley.com/cgibin/mrwhome/106568753/HOME .
The Cochrane Library includes primary (‘CENTRAL’) and secondary components, which
can be searched separately or together. Some of the components are indicated below:
•
•
Note
•
Cochrane Library of Systematic Reviews (CLSR) provides access to regularly
updated, high quality systematic reviews, maintained by the various Cochrane Review
Groups. This is a very useful ‘secondary’ database for clinicians.
Database of Abstracts of Reviews of Effectiveness (DARE), provides access to
abstracts of systematic reviews, and is maintained by the National Centre for Reviews
and Disseminations at the University of York. DARE includes structured abstracts of
systematic reviews which have been critically appraised by reviewers at the NHS
Centre for Reviews and Dissemination at the University of York, England. Systematic
reviews are identified from a variety of sources and assessed according to a set of
quality criteria. For good quality reviews, detailed structured abstracts describing the
methodology, results and conclusions are produced. Comments on the overall quality
of reviews and their implications for health care are also included. This is a
‘secondary’ database.
Cochrane Central Register of Controlled Trials (CENTRAL), a ‘primary’ database
of controlled trials identified by the Cochrane Review Groups. Most of these are also in
MEDLINE, but are easy to find when grouped together in the Cochrane database.
This is a ‘primary’ database.
The Cochrane Library is different to MEDLINE in two important ways:
• the default is to search all of the text of publications, although you can
choose to restrict the search to the title or abstract. Clicking on ‘History’
enables you to combines searches, as in ‘PubMed’.
• not all citations are allocated MeSH terms yet. This means that you may
need to search with textwords as well as MeSH terms, when this could be
important.
The principles of using the Cochrane Library are otherwise similar to those for MEDLINE.
The website has excellent guides and ‘Help’ sections.
School of Population Health
33
EBP Workbook 05
ACP Journal Club
This ‘secondary’ database can be accessed though ‘Buddy’ at the University of
Melbourne, from your teaching hospitals via their library resources and through the
‘Clinicians’ Health Channel’. It is difficult to locate from some sites. From the ‘Clinicians’
Health Channel’, for example, choose ‘A to Z of Journals’, then ‘Annals of Internal
Medicine’, then ‘ACP Online’, then ‘Journals’. The effort is well worthwhile!
ACP Journal Club's general purpose is to select published articles according to explicit
criteria that warrant immediate attention by physicians attempting to keep pace with
important advances in the treatment, prevention, diagnosis, cause, prognosis, or
economics of the disorders managed by internists. These include a broad spectrum of
general medical conditions. Included articles are summarised in structured abstracts.
There are also comments by clinical experts. More than 100 journals are regularly
reviewed for ACP Journal Club. A short list of key journals is included in each issue on
the Table of Contents, and a full list is available on request. The summaries and
comments are easily searched across a range of categories.
For more information see ACP-ASIM Online: http://www.acpjc.org
Clinical Evidence
This valuable ‘secondary’ database is produced by the British Medical Journal (BMJ)
group. It is accessed from your teaching hospitals via the ‘Clinicians’ Health Channel’ or
through their library resources. It is a regularly updated database of evidence summaries,
which are relevant to primary and secondary care. The editorial process involves choosing
questions of clinical significance, searching systematic reviews and clinical trials, and then
summarising the data and presenting it in a structured format, with both detailed text and
shorter summaries. It comprises 25 sections, each of which has approximately ten
questions.
For more information see http://www.clinicalevidence.com
Search Strategy
The particular strategy will depend to some extent on the question posed and other
issues. In this chapter the ’primary’ databases have been presented before the
‘secondary’ databases but in general, the following strategy is recommended:
1. Search the appropriate ‘secondary’ database (eg ‘Clinical Evidence’; ‘Cochrane
Library of Systematic Reviews’; ‘ACP Journal Club’).
If necessary after this:
2. Use search filters and search ‘Clinical Queries’ in ‘PubMed’
If necessary after this:
3. Do a textword search in MEDLINE (‘OVID’ or ‘PubMed’), and confirm that the search
was conducted with MeSH terms.
If necessary after this:
4. Define MeSH terms and use these to search in MEDLINE (‘OVID’ or ‘PubMed’)
School of Population Health
34
Note
EBP Workbook 05
When searching in the Cochrane Library, always seek and search using
relevant MeSH terms, as well as textwords.
3.3 Worked examples
The purpose of the exercise is to use a clinical example to examine how we can use the
Internet and MEDLINE to enhance patient care, by doing it better and faster.
Consider your current strategies available for literature searching and keeping up to date:
Write them down:
1.
........................................................................................................................................
2.
........................................................................................................................................
3.
........................................................................................................................................
Are there any easier ways to get published medical information that would appeal to
someone who wants to be a “better faster doctor”?
Now that you are sitting in front of a computer, how could you find this information using
MEDLINE?
Getting started
The MEDLINE Search Engine we will use is ‘OVID’ to illustrate these examples. You can
access ‘OVID’ through ‘Buddy’ at the University of Melbourne, through the ‘Clinicians’
Health Channel’ from your teaching hospital, and through your teaching hospital library
resources.
Alternatively you could use ‘PubMed’ which is easily accessed through a web-browser
such as ‘Google’ (http://www.google.com). Type ‘EntrezPubMed’ in the query line.
The web address is http://www.ncbi.nlm.nih.gov/entrez/query.fcgi
In this session we will:
• examine a clinical scenario
• refine a clinical problem by asking an ‘answerable’ question
• search for citations which address the question posed
Remember Joyce? (see 2.3)
Recall the answerable question that arose from her request for information? In people
with osteoarthritis can physiotherapy improve comfort and mobility? How could you
find information to answer this question using MEDLINE?
Try the old way first: textword searching
Before you do this, ‘uncheck’ the box in the screen next to the term ‘Map term to MeSH
Heading’.
School of Population Health
35
EBP Workbook 05
Use the phrases that you identified as part of asking an ‘answerable’ question.
Note that ‘OVID’ may still map text terms to MeSH terms even if this box is ‘unchecked’. It
is wise to check exactly how a search was processed in MEDLINE, at the conclusion of
the search.
1.
Type in ‘osteoarthritis’ and then click ‘SEARCH’
What do you find?
2.
Now type in ‘physiotherapy’ and then click ‘SEARCH’
What do you find?
Next we will:
1.
2.
3.
4.
Map terms against the MeSH headings
‘Explode’ terms to include all the distal MeSH terms
‘Focus’ terms to include those citations for which the topic is deemed to be a major
component
Try ‘limiters’ in a simple subject search strategy
Try the (relatively) new way: thesaurus searching
Before you do this ‘tick’ the box on your screen next to the term ‘Map term to
MeSH Heading’.
Read again: ‘Mapping’ in ‘Medical Subject Headings (MeSH)’ above.
The next step is to map the terms that you used in the textword search to the MeSH
headings and repeat the search. This should help you to become familiar with the
concept of mapping your search to the MeSH headings, in order to make your subject
search more efficient.
Building a Subject Search Strategy
1. Type in ‘osteoarthritis’ and then click SEARCH. Then select ‘Osteoarthritis, Knee’ to
make the search more specific. Tick ‘Explode’ to include the more distal search terms
and ‘Focus’ to include those citations for which the topic is deemed to be a major
component, and then select ‘Include All Subheadings’. Next click on CONTINUE.
What do you find?
___________________________________________________________________
2. Type in ‘physiotherapy’ and then click SEARCH. Select ‘Physical Therapy
Techniques’, choose ‘Explode’ to include more specific terms and highlight the use of
this as a major topic by choosing ‘Focus’. Then select ‘Include All Subheadings’, as we
only want to look at articles where this is the major topic. Next click on CONTINUE.
School of Population Health
36
EBP Workbook 05
What do you find?
___________________________________________________________________
Compare the number of results for each of these 4 searches.
What are the possible reasons for the difference between the number of results in
searches 1 and 3, and between 2 and 4?
___________________________________________________________________
Repeat the searches for either ‘osteoarthritis’ or ‘physiotherapy’ exactly as you have in
1 and 2 above, but this time do not ‘Explode’. Repeat this step again, but this time do
not ‘Focus’.
What are the possible reasons for the difference between the number of results in
searches with and without ‘Explode’ and ‘Focus’?
___________________________________________________________________
3. Now look at your ‘Search History’. Combine the two ‘Exploded’ and ‘Focused’
searches for ‘Osteoarthritis, Knee’ (search number 3) and ‘Physical Therapy
Techniques’ (search number 4) using the Boolean operators ‘AND’ firstly, and then
‘OR’.
What does the term ‘Boolean operator’ mean? Why are there more search results
found when using ‘OR’ rather than AND’?
_______________________________________________________________
Go on, try it out!
You have now created a Subject Search by combining terms using two Boolean
operators. You have also successfully mapped your subject search to the MeSH
Headings and used both exploded and focused MeSH terms.
The ‘OVID’ screen for this search is pasted below:
School of Population Health
37
EBP Workbook 05
How does a focused search differ from an exploded search?
________________________________________________________________
Can you combine the two?
________________________________________________________________
How will you check out the ~108 articles that you have identified using this strategy?
1.
2.
3.
Scan the abstracts after clicking on ‘Display’
Select and peruse those publications that you think are most likely to be relevant
Decide that this is too many citations, and ‘limit’ the search
The ‘OVID screen for 3 possibly relevant limits is shown below:
School of Population Health
38
EBP Workbook 05
Let’s not forget Joyce!
Joyce (and possibly you as well!) might be more convinced by the results of randomised
controlled trials than review articles, so repeat the above search, but limit the ~108 articles
by choosing ‘humans’ and ‘english language’ and ‘randomised controlled trial’. This limits
the search to ~47 citations, some of which seem relevant to Joyce’s question:
• McCarthy CJ. Mills PM. Pullen R. Roberts C. Silman A. Oldham JA. Supplementing a
home exercise programme with a class-based exercise programme is more effective
than home exercise alone in the treatment of knee osteoarthritis. Rheumatology 2004;
43:880-886
• Fransen M. Crosbie J. Edmonds J. Physical therapy is effective for patients with
osteoarthritis of the knee: a randomized controlled clinical trial. Journal of
Rheumatology 2001; 28:156-164
• Jan Petrella RJ. Bartha C. Home based exercise therapy for older patients with knee
osteoarthritis: a randomized clinical trial. Journal of Rheumatology 2000; 27:22152221,
• Deyle GD. Henderson NE. Matekel RL. Ryder MG. Garber MB. Allison SC.
Effectiveness of manual physical therapy and exercise in osteoarthritis of the knee. A
randomised, controlled trial. Annals of Internal Medicine 2000; 132:173-181
School of Population Health
39
EBP Workbook 05
Having found a relevant article we must firstly appraise it for validity (closeness to the
truth) and relevance (usefulness in practice), and then decide on the clinical significance
of the result, using critical appraisal worksheets as guides. Evaluating the medical
literature is a complex undertaking. You will find that the answers to the questions of
validity may not always be clearly stated. You may have to use your own judgment about
the importance and significance of each question. Finally we must use this information in
conjunction with our patients’ preferences to decide on the next step in treatment.
The next chapter will get you started on the road to Critical Appraisal of articles about
therapy. Why not come back to this article after you have learned these skills and
critically appraise this article so that you can apply the knowledge to help Joyce to decide
about physical therapy for her troublesome knee?
3.4 Self-complete exercise
Introduction
You are asked at 5:15pm by the resident on the surgical ward to see a patient with
obstructive airways disease, whom is scheduled for major abdominal surgery the next
day.
You believe that the patient is at high risk of post-operative chest infection.
You are aware of the potential role of peri-operative chest physiotherapy in reducing the
risk of such events.
You wonder if physiotherapy will reduce the risk of post-operative complications.
Your task is to:
• re-phrase this clinical problem( ?dilemma) as an answerable question
• undertake a MEDLINE search to identify a relevant article for critical appraisal
• consider the limits you might introduce to reduce the number of articles that you
may have to search through?
3.5 Answers to self-complete exercise
Re-phrase the clinical problem as a structured question, using the ‘PICO’ format:
Patients: those patients having abdominal surgery
Intervention: physiotherapy
Comparison: preferably those not having physiotherapy
Outcomes: eg death; chest infection; time to getting out of bed; time to discharge; patient
satisfaction; post-operative complications
Use ‘ physiotherapy ’and ‘abdominal surgery’ as search terms in the first instance.
Choose ‘Map Term to Subject Heading’, by ticking the box in the ‘OVID’ main screen.
The subsequent steps in your search may have been as follows:
School of Population Health
40
EBP Workbook 05
•
•
•
•
•
‘physiotherapy’ maps to a number of terms including the MeSH term ‘Physical
Therapy Techniques’, which is most relevant to the question
‘abdominal surgery’ maps to a number of terms including the MeSH term
‘Laparotomy’, which you know means ‘opening the abdomen’. This term may be too
narrow to use, so you ‘click’ on this term to see where the term ‘laparotomy’ lies within
the MeSH trees. You note that it is included in the term ‘Surgical Procedures,
Operative’, which is far too broad a term for this question. ‘Surgical Procedures,
Operative’, however, includes within it ‘Digestive System Surgical Procedures’, which
you consider relevant
As neither of these terms includes the other in the MeSH trees, you decide to search
them both (using ‘OR’).
You select both ‘Explode’ and ‘Focus’ to both include all ‘distal’ terms in the MeSH
trees for the three terms, and to choose the most relevant citations. You then combine
these two searches.
~185 citations are too many to peruse, so you ‘limit’ the search to ‘humans and english
language and randomized controlled trial’. ~ 20 citations result.
The ‘OVID’ search screen is shown below:
You check through the list of citations and their abstracts, and identify a small list of
relevant articles including:
Fagevik Olsen M, Hahn I, Nordgren S, Lonroth H, Lundholm K. Randomised controlled
trial of prophylactic chest physiotherapy in major abdominal surgery. British Journal of
Surgery 1997;84:535-1538.
The critical appraisal of this article is addressed in the next chapter.
School of Population Health
41
EBP Workbook 05
3.6 Recommended reading
•
Straus S, Richardson SR, Glasziou P, Haynes BR. Evidence-Based Medicine. How to
practice and teach EBM.3rd ed. Elsevier Churchill Livingstone. 2005.
3.7 Further reading
•
•
•
•
•
•
JAMA ‘Users’ guides’ series. See http://www.cche.net/che/home.asp (eg Oxman AD,
Sackett DL, Guyatt GH, for the Evidence-Based Medicine Working Group. Users’
guides to the medical literature: I. How to get started. JAMA. 1993;270:2093-2095
Greenhalgh T. How to read a paper: the basics of Evidence-based Medicine. BMJ,
London.1997
Friedland DJ. Ed. Evidence-based Medicine: a framework for clinical practice.
Appleton Lange Stamford, USA. 1998
Ebbert JO, Dupras DM, Erwin PJ. Searching the medical literature using PubMed: a
tutorial. Mayo Clin Proc.2003; 78:87-91).
Robinson A, Day S. The value of PubMed and HighWire Press for the busy general
practitioner. Australian Prescriber 2004; 27(Number 1):16-18.
Sood A, Erwin PJ, Ebbert JO. Using advanced search tools on PubMed for citation
retrieval.
Mayo Clin Proc 2004; 79:1295-1300.
3.8 References
1.
Deyle G, Henderson N, et al. Effectiveness of manual physical therapy and exercise
in osteoarthritis of the knee. A randomised, controlled trial. Annals of Internal
Medicine 2000;132:173-81.
2.
Fagevik Olsen M, Hahn I, et al. (1997). Randomised controlled trial of prophylactic
chest physiotherapy in major abdominal surgery. British Journal of Surgery
1997;84:1535-8.
3.9
•
•
Websites
The ‘Clinicians’ Health Channel’ has ‘Help Cards’ and ‘Self-Directed Learning’ links on
its home page. There are guides to both the ‘OVID’ and ‘PubMed’ portals to
MEDLINE, and to importing references into ‘EndNote’. The ‘Clinicians’ Health
Channel’ can be accessed through your teaching hospital computers. Ask the
librarians in your hospitals to show you how. http://www.health.vic.gov.au/clinicians
The Department of General Medicine at ‘Melbourne Health’ has many EBP resources.
Choose ‘EBM Resources’ from the ‘Department of General Medicine’ webpage, which
is located by clicking on ‘MEDICINE then ‘DEPARTMENTS’ on the Melbourne Health
home page at http://www.mh.org.au/sitesandservices/RMH/index.asp . The direct
web address is http://www.mh.org.au/Royal_Melbourne_Hospital/DEPARTMENTS/GN/General_Medicine
School of Population Health
42
EBP Workbook 05
•
•
•
•
•
•
•
•
•
•
Centre for Evidence-Based Medicine, Oxford (UK). An outstanding collection of tools
and resources http://www.cebm.net/index.asp
‘Entrez PubMed’ includes a tutorial for ‘PubMed’ and there is a separate tutorial for
MeSH terminology in the MeSH database.
http://www.ncbi.nlm.nih.gov/entrez/query.fcgi
‘Bandolier’ has a ‘Learning Zone’ and ‘EBM Glossary’. (as well as many critically
appraised topics) http://www.jr2.ox.ac.uk/Bandolier
University of Alberta Evidence Based Medicine toolkit.
http://www.med.ualberta.ca/ebm/ebm.htm
Canadian Centre for Health Evidence. This contains the ‘Users’ Guides to the Medical
Literature’. http://www.cche.net/about
The Australian Centre for Evidence Based practice (Flinders University, Adelaide) has
resources and links. http://www.acebcp.org.au/intro.htm
‘Netting the Evidence’, from the University of Sheffield(UK) has resources and links.
http://www.shef.ac.uk/scharr/ir/netting
‘Duke University Medical Center Library Online’. There are ‘online’ tutorials containing
self-test exercises. http://www.mclibrary.duke.edu/training
Centre for Evidence-Based Medicine, University of Toronto. This website has on-line
tutorials containing self-test exercises http://www.cebm.utoronto.ca
‘EPIQ’ (Effective Practice, Informatics & Quality Improvement) is produced by
Professor Rod Jackson (University of Auckland). It has very useful materials including
notes and tools. http://www.health.auckland.ac.nz/comhealth/epiq/epiq.htm
School of Population Health
43
EBP Workbook 05
4.
ARTICLES ABOUT THERAPY
4.1 Learning objectives
• To understand the need for medical students and practising clinicians to be able to
critically appraise articles about health care interventions.
• To be able to evaluate publications about therapy in order to detect fatal flaws in the
methods or study design, which threaten the validity and relevance of the findings of
the study.
• To understand the importance of clinical significance and the different measures of
treatment effect and effect size.
• To be able to calculate the Number Needed Treat (NNT) from trial results reporting
binary outcomes.
• To be able to apply the results of particular studies to individual patients.
4.2 Core reading and key concepts
Introduction
Being able to critically evaluate the findings of research reports about therapy is
fundamental to the practice of evidence-based practice. Pre-appraised articles about
health care interventions are becoming increasingly available but medical students and
clinicians also need to make independent judgements about the validity of findings from
trial reports.
Clinicians often rely on opinion leaders to guide clinical practice. Expert opinion clearly
has an important role in influencing clinical practice but relying on expert opinion alone
has limitations. There is evidence to suggest that expert opinion and textbook
recommendations may be inconsistent with, or lag behind the evidence from clinical trials
(Antman, Lau et al. 1992). Colleagues may provide clinical expertise and judgement but
some of their beliefs may not be evidence based (Schroen, Detterbeck et al. 2000). In the
current clinical environment providing effective care relies on clinicians being able to
locate and critically appraise research reports that address their information needs as they
arise during day-to-day practice.
In order to be able to locate and appraise relevant research reports, clinicians need to
understand how to choose the most appropriate study design to answer the question at
hand, how to evaluate the internal validity of the study, how to assess the clinical
significance of the study, and how to apply the results of the study to the care of individual
patients.
Critical appraisal guides have been developed to assist with the critical appraisal process.
An extensive series of Users’ Guides have been published in JAMA (see
http://www.cche.net/usersguides/main.asp). These guides have adopted a similar format
to assess the validity of studies designed to assess a diverse range of clinical questions.
Three basic questions are addressed:
1. Are the results of the study valid?
2. What are the results?
School of Population Health
44
EBP Workbook 05
3. Will the results help me in caring for my patients?
The full critical appraisal guide for articles about therapy is summarised at the end of this
section. Some important concepts relevant to interpreting the results of studies are also
outlined below.
The evidence hierarchy
When making decisions about clinical interventions different types of research or sources
of information are given different weight. “Levels of evidence” have been developed to
rank the validity of evidence. Most of the rankings developed follow the hierarchy set out
below, however minor variations of this have been proposed by some experts on the field
of evidence based practice. (Guyatt, Sackett et al. 1995) (Cook, Guyatt GH et al. 1995)
(Greenhalgh 1997)
1.
2.
3.
4.
5.
6.
7.
8.
Systematic reviews and meta-analyses
Randomised controlled trials with definitive results (a result with confidence intervals
that do not overlap the threshold clinically significant effect)
Randomised controlled trials with non-definitive results (point estimate that suggests
a clinically significant effect but with confidence intervals overlapping the threshold for
this effect
Cohort studies
Case-control studies
Cross sectional surveys
Case reports/case series
Expert opinion (based on physiology, laboratory research, first principles, or
experience)
A high quality systematic review with definitive results and homogeneity in the results of
studies from individual trials, represents the highest level of evidence. However,
regardless of the type and source of reviews or studies, all evidence requires critical
appraisal. For example, a well-designed large cohort study might provide more valid
evidence than a randomised-controlled study with serious methodological flaws.
(Greenhalgh 1997)
Tests of statistical significance and random error
Random error may potentially influence the results of all studies. Statistical tests can be
applied to assess the possible role of chance in the study results. Clinical trials are
conducted on samples of patients rather than all of the possible patients, and statistical
tests are used to help make inferences about the ‘truth’.
If a difference in outcome is observed in a clinical trial comparing two groups (e.g.
treatment and control groups), this difference could either represent a true difference or it
may be due to random variation. A type I statistical error arises when we conclude that a
difference, that is due to chance alone, represents a true difference. Inferential statistics
are used to determine the likelihood of a type I error. The p value quantifies the probability
that an observed difference between two study groups might have arisen due to chance
alone, assuming that there is in fact no difference between the groups. Traditionally p <
0.05 is used as a cut off for determining “statistical significance”.
While statistical tests are important other factors must also be taken into account when
interpreting results. A highly statistically significant result (e.g. p< 0.0001) could be
misleading if the study methods were susceptible to bias or systematic error. Systematic
School of Population Health
45
EBP Workbook 05
error may arise from any process that causes observations to deviate systematically from
the true values. (Fletcher, Fletcher et al. 1988)
Clinical significance
It is often possible for studies (particularly large studies) to produce statistically significant
results that may be of doubtful clinical significance. When assessing the clinical
significance of trial results both the types of outcome measures being reported and the
size of the effect should be taken into account. Some investigators make the distinction
between patient-oriented outcomes (clinical) and disease-oriented (process) outcomes.
Examples of patient oriented outcomes are morbidity, mortality, symptom reduction,
quality of life and other end points of importance to patients. Examples of diseaseoriented outcomes include lung function tests, glycosylated haemoglobin level, left
ventricular function, etc. (Ebell, Barry et al. 1999). The effect size is another important
consideration. In some circumstances this is easy to judge, for example, a cancer
treatment that prolongs life by an average of 1 to 2 weeks would not be considered
clinically significant but a treatment that prolonged life by an average of 12 months would
be considered significant. For some outcome measures the Number Needed to Treat
(NNT) is a useful way to express the absolute and this is discussed under measures of
treatment effect.
Bias and validity
The validity of a study is the extent to which its design and conduct are likely to prevent
systematic errors, or bias (Moher, Jadad et al. 1995). More methodologically rigorous
studies may be more likely to yield results that are closer to the "truth”. There are four
main types of systematic errors in trials examining healthcare interventions: selection bias,
performance bias, attrition bias and detection bias. (Feinstein 1985) (Moher, Jadad et al.
1995) (The Cochrane Library 2000).
Table 4.1: Steps involved in the conduct of randomised controlled trials and
potential sources of bias
STUDY PROCESS
SOURCES OF BIAS
Allocation of subjects to
intervention and control groups
Selection bias: systematic differences in
comparison groups
Implementation of study
interventions
Performance bias: systematic differences in care
provided apart from the intervention being studied.
Follow up of participants
Attrition bias: systematic differences in withdrawals
from the trial.
Evaluation of outcomes
Detection bias: systematic differences in outcome
assessment
Selection bias
Randomised controlled studies will be susceptible to selection bias if the randomisation
process is inadequate. In particular inadequate allocation concealment is an important
School of Population Health
46
EBP Workbook 05
source of bias. (Kunz and Oxman 2000) With appropriate methods, random allocation
removes the potential for bias in the assignment of patients to control and intervention
groups. However when methods such as alternation or hospital UR numbers are used to
allocate patients, it is possible for investigators to subvert the process. When assessing a
potential participant’s eligibility for a trial, investigators recruiting participants should
remain unaware of the next assignment in the sequence until the decision about eligibility
has been finalised. This can be achieved if the assignment schedule (generated by an
appropriate randomisation method, such as computer generated random numbers) is
administered by someone who is not responsible for recruiting subjects. A central trial
office or pharmacy department might be used for this purpose.
Performance bias
Performance bias may influence the results of a study if there are systematic differences
in the care provided to the comparison groups other than the intervention being
investigated. Double blinding is often used to prevent this type of bias. In this situation
neither the patients nor the investigators are aware of which treatment the participant is
receiving. Double blinding also protects against placebo effects. For research with
subjective outcome measures such as pain, blinding is particularly important. (Schulz,
Chalmers et al. 1995) (Colditz, Miller et al. 1989).
Attrition bias
Losses to follow up or dropouts, which are systematically different between comparison
groups, may lead to attrition bias. Participant losses may occur because participants are
withdrawn from the study, dropout or because of protocol violations. Often these details
are poorly reported in trial results.
Detection bias
Where outcome assessment differs systematically between comparison groups, detection
bias may occur. Outcome assessment should be blinded, where possible.
Selective reporting of outcomes
For studies that use multiple outcome measures selective reporting of “positive” outcome
measures may introduce bias. For example in a study of pulmonary rehabilitation for
COPD, several outcomes may be examined, e.g. Lung function tests, exercise tests,
quality of life, utilisation of health care services. The investigators may choose to report
only those outcome measures that are positive in published results.
Precision and confidence intervals
Precision is another measure of the likelihood of random errors. It is reflected in the
confidence interval around the estimate of effect. Confidence intervals can also be used
to examine statistical significance and provide us with more information than p values. In
particular confidence intervals do more than indicate whether the results might be a
chance a effect. They illustrate, allowing for the role of chance, how small or how large
the true effect size might be. (Crombie 1996)
The exact effect size (treatment effect observed in a particular study) is called the point
estimate. This is the best estimate from the study of the true effect size. The precision or
stability of this estimate may be expressed using confidence intervals. By convention,
95% confidence intervals are usually reported in research studies but in some
circumstances other ranges might be used such as 90% or 99% confidence intervals.
School of Population Health
47
EBP Workbook 05
The narrower the confidence interval the more certain one can be about the size of the
true effect. If an unbiased study reports a 95% confidence interval this means that there
is a 95% chance that the true effect lies within the confidence interval.
If the value corresponding to no effect is not included in the 95% confidence intervals then
the results are statistically significant at the 0.05 level of significance. If the confidence
intervals include the null value (the value suggesting no difference between the two
groups) then the results are not statistically significant at the 0.05 level of significance.
Studies with large numbers of participants will usually give more precise estimates of
effectiveness and hence, narrower confidence intervals. (Crombie 1996) (Fletcher,
Fletcher et al. 1988).
Negative studies
Confidence intervals also help us to interpret the results of studies that appear to be
negative. When the results of a study are negative this may either be a true negative or a
false negative result. A false negative result is also termed a type II statistical error and
may arise if the study has insufficient statistical power to detect a true difference between
groups. Examining the upper end of the confidence interval can be helpful when
interpreting the results of negative studies. A trial is definitely negative if the smallest
benefit of clinical importance lies above the upper boundary of the confidence interval. On
the other hand, if clinically important benefits lie within the confidence interval, the trial has
not excluded the possibility that the treatment may be effective. (Guyatt, Jaeschke et al.
1995).
School of Population Health
48
EBP Workbook 05
Clinically significant positive
study
Positive study, possibly clinically
significant
Positive study but not clinically
significant
Negative study but clinically
significant effect not excluded
Definitely negative study
0.5
1
2
Relative risk or odds ratio
Figure 4.1
How to interpret confidence intervals
This figures displays the range of possible results from a hypothetical study. The study is
randomised controlled with an intervention and control group. Subjects in the study are at
risk for ischaemic heart disease and the intervention group receive a new therapy aimed at
reducing death from ischaemic heart disease. The control group receive standard treatment.
A relative risk of less than 1 suggests that the new treatment has a protective effect but for
this study, a relative risk of less than 0.6 is considered clinically significant.
Measures of treatment effect
The results of studies with binary outcomes (yes/no) may be expressed in several ways.
The relative benefit of an active treatment over a control is often expressed as the relative
risk, the relative risk reduction, or the odds ratio. For applying the results of trials to
clinical practice however, the Number Needed to Treat (NNT) is more meaningful. Some
important measures of treatment effect are described below.
Consider a hypothetical parallel group randomised study with an active treatment group
and a placebo control group. The subjects are followed up for a set period of time and the
object of the study is to prevent an adverse event (e.g. death) and the response to
treatment is measured as a binary outcome (event vs no event). The event rate in the
placebo group is X and the event rate in the treatment group is Y.
School of Population Health
49
EBP Workbook 05
Absolute risk reduction (ARR) is the difference in the proportion of subjects with the
outcome of interest in each group, in this case ARR = X-Y.
Relative risk (RR) is defined as the probability of an event in the active treatment group
divided by the probability of an event in the control group. In this case the RR = Y/X. A
relative risk of 1 is the null value or no difference.
Relative risk reduction (RRR) is related to the relative risk and can be calculated by
subtracting the relative risk from 1. The relative risk reduction can be thought of as a
standardised measure of the absolute risk reduction and can be expressed as the
absolute risk reduction divided by the probability of an event in the control group. In this
case RRR = 100(X-Y)/X.
Number needed to treat (NNT) is the number of patients you need to treat to prevent one
additional bad outcome. The number needed to treat is the reciprocal of the absolute risk
reduction (NNT= 1/ARR). The 95% confidence intervals for the NNT can be constructed
by simply inverting and exchanging the limits of a 95% confidence interval for the absolute
risk reduction (Cook and Sackett 1995). Calculating confidence intervals for negative
studies (when the confidence interval for ARR includes 0) requires alternative methods
but these are beyond the scope of this course. (Altman 1998).
Applying the results of studies to patients with different
baseline risks
Relative measures of treatment effect can be limited when applied to clinical decisionmaking. Relative measures can provide a useful estimate of treatment effect for broad
groups of patients, when the benefit of a specific treatment (eg. the relative risk reduction)
remains roughly the same for patients with different baseline risks. Often it is useful
however, to consider the baseline (control) risk of an event before making
recommendations about treatment. For example for patients at high risk of an adverse
event a relative risk reduction of 50%, which is statistically significant, is likely to be
clinically significant. On the other hand for patients with a low baseline risk this level of
risk reduction may not be sufficient to justify the possible harms (side effects) and costs of
treatment. (Cook and Sackett 1995).
The Number Needed to Treat (NNT) can be useful for comparing the likely benefits of
treatment with a particular therapy across groups of patients with varying levels of
baseline risk for the adverse event(s). The simplest method is to compare the baseline
risk of an individual patient with that of the typical patient in the published study. If the
baseline risk for a particular individual is a factor of f times the baseline risk of a typical
study patient and the relative risk remains constant, the absolute risk reduction for the
patient is scaled according to the same factor f. The corresponding number needed to
treat will be the estimated number needed treat from the study results divided by the
factor f. (Cook and Sackett 1995).
Example
Plehn JF, Davis BR, Sacks FM et al. Reduction of stroke incidence after myocardial
infarction with Pravastatin: The cholesterol and recurrent events (CARE) study.
Circulation. 1999;99:216-223.
School of Population Health
50
EBP Workbook 05
This study examines the risk of stroke after myocardial infarction. The experimental group
were treated with pravastatin and the control group received placebo. There was a 32%
risk reduction in the risk of stroke in the experimental group corresponding to a number
needed to treat of 83. The results are outlined in table 5.2. The possible effect of
extrapolating the findings of the study to a lower risk population (for example those without
a history of AMI) is illustrated in the table (bottom line).
Table 4.2: Clinically useful measures of the effects of treatment
Outcome
Control
event rate
(X)
Experimenta
l event rate
(Y)
Relative risk
reduction
RRR =
(X –Y)/X
Absolute
risk
reduction
ARR =
X–Y
Number
needed to
treat
NNT =
1/ARR
Stroke (after
AMI)
3.7%
2.5%
32%
1.2%
83
1.9%
1.3%
32%
0.6%
167
Stroke (risk
at baseline
reduced by
half)
* Event rate = cumulative incidence of major event outcomes during study period
External validity/generalisability
The results of randomised controlled studies may not be generalisable to all patients
outside the clinical trial setting. Randomised controlled trials usually address the question
of whether a treatment can work (efficacy) but may not tell us about whether the treatment
will be effective when offered to the broad range of patients seen in day to day clinical
practice. Randomised controlled studies tend to enrol only a small proportion of the
potential population of patients with the disease of interest. Often extensive inclusion and
exclusion criteria are used in order to limit sources of heterogeneity that may influence the
study results. (Fletcher, Fletcher et al. 1988)
Applicability is closely related to the concepts of generalisability and external validity but it
also encompasses broader issues relating to the overall impact of the therapy on
individual patients. (Dans, Dans et al. 1998)
Factors that may affect the applicability of trial results to individual patients
Differences in the pathophysiological basis for disease in different populations.
Between population differences in the response to treatment (e.g. differences in
drug metabolism or immune responses)
Differences in patient compliance
Differences in baseline risk for adverse events being targeted by the treatment.
Presence of comorbid conditions that may alter the potential benefits and risks of
treatment.
Feasibility of implementing treatments in different clinical settings (e.g. factors
such as technical requirements for safe and effective administration of therapy,
availability of trained staff and cost may influence decisions to offer therapies in
different settings.)
School of Population Health
51
EBP Workbook 05
Critical appraisal guides
Numerous critical appraisal guides have now been published. The guide summarised
below has been taken from Guyatt et al, 1993. (Guyatt, Sackett et al. 1993)
Are the results of this study valid?
Was the assignment of patients to treatment randomised?
Were all patients who entered the trial properly accounted for and attributed at its
conclusion?
Was follow up complete?
Were patients analysed in the groups to which they were randomised?
Were patients, health workers, and study personnel “blind” to treatment?
Were the groups similar at the start of the trial?
Aside from the experimental intervention, were the groups treated equally?
What were the results?
How large was the treatment effect?
How precise was the estimate of the treatment effect?
Will the results help me in caring for my patients?
Can the results be applied to my patient care?
Were all clinically important outcomes considered?
Are the likely treatment benefits worth the potential harms and costs
4.3 Worked example
Introduction
You are the resident admitting a patient, Mr PT, scheduled for an elective Nissen
Fundoplication the following day. The PT is a 55-year old man who is overweight
and stopped smoking a month ago. You believe that he is at high risk of
developing a postoperative chest infection.
You are aware of a broad discussion about the potential role of prophylactic chest
physiotherapy in reducing the risk of such events.
You wonder “Will prophylactic physiotherapy reduce the risk of post-op complications in
my patient?”
You conduct a MEDLINE search and you find the following article:
Fagevik Olsen M, et al. Prophylactic chest physiotherapy reduced pulmonary
complications after major abdominal surgery. Br J Surg 1997;84:1535-1538.
Critically appraise this article using the worksheet provided.
Abstract
School of Population Health
52
EBP Workbook 05
Question: In patients having major abdominal surgery, can prophylactic chest
physiotherapy reduce pulmonary complications after surgery?
Design: Randomised controlled trial.
Setting: University hospital in Goteborg, Sweden.
Patients: 368 patients who were 19 to 92 years of age (mean age 53 y, 57% women) and
were having elective open abdominal surgery. Patients were considered to be high risk if
they were > 50 years of age and had >= 1 of the following risk factors: current or previous
(quit within the past 12 months) history of smoking, body mass index > 30 kg/m2,
pulmonary disease requiring medication, or another medical condition causing reduced
ventilatory function. 79 patients (21%) were high risk.
Intervention: Patients were allocated to prophylactic chest physiotherapy (n = 174) or
usual treatment (n = 194). Patients in the physiotherapy group received information and
training the day before surgery from a physiotherapist. Training involved breathing
exercises with pursed lips and hourly huffing and coughing (30 deep breaths with huffing
and coughing between every 10th breath every daylight hour after the operation). The
importance of changing position in bed and getting out of bed soon after surgery was
emphasised. High-risk patients used positive respiratory pressure masks for respiratory
resistance training during the breathing cycle. Patients in the usual-treatment group did
not receive physiotherapy training or information before the operation but did receive
chest physiotherapy with the mask if pulmonary complications developed after surgery.
Main outcome measures: Pulmonary complications defined as oxygen saturation < 92%
or 2 of the following: temperature > 38.20 C, pathological lung auscultation, or
radiologically confirmed pneumonia or atelectasis.
Main results: Fewer patients who received physiotherapy had pulmonary complications
after surgery than did patients who received usual treatment (P < 0.001); this reduction
was also seen in both high-risk and low-risk patients (P < 0.001 for both) (Table). Greater
oxygen saturation was maintained in the physiotherapy group during the first 3 days after
surgery (P < 0.05). The groups did not differ for body temperature or need for oxygen
support.
Conclusion: Prophylactic chest physiotherapy done before and after major abdominal
surgery reduced pulmonary complications.
Are the results of the study valid?
Was the assignment of patients to treatments randomised?
The authors state “to avoid patient interference a cluster randomisation was performed to
alternate months”. The use of alternation would usually be considered inadequate
because assignment to groups is not concealed. This may introduce selection bias (such
bias may occur in either direction).
Were all patients who entered the trial properly accounted for and attributed at its
conclusion?
Yes.
Was follow-up complete?
Four patients did not complete the study and the reasons were described.
School of Population Health
53
EBP Workbook 05
Were patients analysed in the groups to which they were randomised?
Although not specifically stated in the article the analysis appears to be intention to treat.
Were patients, health workers, and study personnel “blind” to treatment?
The study was not blinded. Although blinding to this type of intervention might be difficult
it should be possible to have a blinded assessment of outcome. Lack of blinding means
the study is susceptible to performance and detection bias.
Were the groups similar at the start of the trial?
Yes.
Aside from the experimental intervention, were the groups treated equally?
The treatment group received both pre operative and postoperative prophylactic
physiotherapy. The control group did not receive any information or training.
Postoperative physiotherapy was withheld unless the patient developed a pulmonary
complication. Because the investigators were not blinded the possibility of performance
bias exists.
What are the results?
For prevention of pulmonary complications (oxygen saturation of less than 92% or 2 of the
following: temperature greater than 38.20 C, pathological lung auscultation, and
radiological evidence of pneumonia or atelectasis) the results are summarised below.
Patient groups: All patients
Physiotherapy: 6% (10/172)
Usual treatment: 27% (52/192)
Patient groups: High-risk patients
Physiotherapy: 15% (6/40)
Usual treatment: 51% (20/39)
Patient groups: Low-risk patients
Physiotherapy: 3% (4/132)
Usual treatment: 21% (32/153)
How large was the treatment effect?
Table 4.3: Clinically useful measures of the effects of treatment
School of Population Health
54
EBP Workbook 05
Outcome
Control
event rate
(X)
Experimental
event rate (Y)
Relative
risk
reduction
RRR =
(X –Y)/X
Absolute
risk
reduction
ARR =
X–Y
Number
needed to
treat (NNT
= 1/ARR)
All patients
27%
6%
21%
5 (95% CI:
3-7)
High risk
patients
Low risk
patients
51%
15%
36%
3 (2-6)
21%
3%
79%
(95%CI: 6089)
78% (3887)
86% (6295)
18%
6 (4-9)
Therefore, for high risk patients 3 patients need to be treated to prevent 1 pulmonary
complication arising post operatively.
How precise was the estimate of the treatment effect
The confidence intervals presented above have been taken from an ACP Journal Club
review article (Marshall 1998) but were not presented in the original article. The
confidence intervals are narrow and hence the estimates of effectiveness are reasonably
precise. For all patients, there is a 95% chance that the true NNT lies between 3 and 7.
Will the results help me in caring for my patient?
Can the results be applied to my patient?
Mr PT is similar, both clinically and in demographic terms to the patients in the study. You
also need to consider whether there are physiotherapists, trained in the methods
described in the study, available at your institution.
Were all clinically important outcomes considered?
Pneumonia is clearly an important clinical outcome, hypoxia and temperature changes
alone are essentially surrogate markers. Interestingly despite the apparent benefits of the
intervention, length of stay did not differ between the 2 groups.
Are the likely treatment benefits worth the potential harms and costs?
There were no adverse events reported, but these would be expected to be minimal with
this type of intervention. Cost would be an important consideration, but this was not
discussed.
4.4 Self-complete exercise
You are the resident assessing a patient with an infective exacerbation of chronic
obstructive pulmonary disease (COPD) in the emergency department.
Mrs DW is a 72-year old woman with known COPD. She regularly attends the outpatient
department but has not previously required admission for COPD. Her past medical
history includes hypertension and late onset diabetes (managed with dietary modifications
alone). She stopped smoking two years ago, having previously smoked approximately a
packet of cigarettes per day for 40 years. Her usual medications include salbutamol
200mg MDI 2 puffs 6 hourly, “Atrovent MDI” 2 puffs 6 hourly and diltiazem slow release
School of Population Health
55
EBP Workbook 05
240mg oral daily. She has no history of asthma and her previous lung function tests
demonstrate severe fixed airflow obstruction with a baseline FEV1 of 0.9 Litres.
She now presents with a week of increasing shortness of breath and productive cough.
After taking a history and examining her you conclude that she has an infective
exacerbation of COPD. There is no evidence of pneumonia on her chest x-ray but she is
hypoxic and requires admission for oxygen therapy and treatment of airways disease.
You commence treatment with regular nebulised bronchodilators, intranasal oxygen (2
litres/minute), oral antibiotics and intravenous hydrocortisone 250mg IV QID.
You are aware that systemic corticosteroids are usually used for the management of
exacerbations of COPD but you have heard colleagues cast doubt on the value of this
treatment in the past. You decide to find out what evidence there is available to support
the use of systemic corticosteroids for exacerbations of COPD and in particular whether
this treatment should be offered to your patient.
You conduct a MEDLINE search and you find the following article:
Niewoehner DE, Erbland ML, Duepree RH, Collins D, et al. Effect of systemic
glucocorticoids on exacerbations of chronic obstructive pulmonary disease. New England
Journal of Medicine 1999;340:1940-1947. (Niewoehner, Erbland et al. 1999)
Critically appraise this study using the worksheet provided.
Abstract
BACKGROUND AND METHODS
Although their clinical efficacy is unclear and they may cause serious adverse effects,
systemic glucocorticoids are a standard treatment for patients hospitalised with
exacerbations of chronic obstructive pulmonary disease (COPD). We conducted a
double blind, randomised trial of systemic glucocorticoids (given for two or eight weeks) or
placebo in addition to other therapies, for exacerbations of COPD. Most other care was
standardized over the six-month period of follow-up. The primary end point was treatment
failure, defined as death from any cause or the need for intubation and mechanical
ventilation, readmission to the hospital for COPD, or intensification of drug therapy.
RESULTS
Of 1840 potential study participants at 25 Veterans Affairs medical centers, 271 were
eligible for participation and were enrolled; 80 received an eight-week course of
glucocorticoid therapy, 80 received a two-week course, and 111 received placebo. About
half the potential participants were ineligible because they had received systemic
glucocorticoids in the previous 30 days. Rates of treatment failure were significantly higher
in the placebo group than in the two glucocorticoid groups combined at 30 days (33
percent vs. 23 percent, P=0.04) and at 90 days (48 percent vs. 37 percent, P=0.04).
Systemic glucocorticoids (in both groups combined) were associated with a shorter initial
hospital stay (8.5 days, vs. 9.7 days for placebo, P=0.03) and with a forced expiratory
volume in one second that was about 0.10 litre8 higher than that in the placebo group by
the first day after enrolment. Significant treatment benefits were no longer evident at six
months. The eight-week regimen of therapy was not superior to the two-week regimen.
The patients who received glucocorticoid therapy were more likely to have hyperglycemia
requiring therapy than those who received placebo (15 percent vs. 4 percent, P=0.002).
School of Population Health
56
EBP Workbook 05
CONCLUSIONS
Treatment with systemic glucocorticoids results in moderate improvement in clinical
outcomes among patients hospitalised for exacerbations of COPD. The maximal benefit is
obtained during the first two weeks of therapy. Hyperglycemia of sufficient severity to
warrant treatment is the most frequent complication.
4.5 Answers to self-complete exercises
Are the results of this study valid?
Was the assignment of patients to treatment randomised?
Yes the study was randomised. Allocation concealment appears to be adequate (study
medications were administered by pharmacy department blind to treatment allocation).
Were all patients who entered the trial properly accounted for and attributed at its
conclusion?
No, see below.
Was follow up complete?
Follow up details were not well outlined in the article. Study drugs were discontinued for
reasons other than the primary end point in 25 patients and follow up data was not
complete for 6 of these. Presumably these are the only losses to follow up in the study
but this is not explicitly stated in the article.
Were patients analysed in the groups to which they were randomised?
Yes the analysis was by intention to treat.
Were patients, health workers, and study personnel “blind” to treatment?
Yes the study was double blind and placebos were used.
Were the groups similar at the start of the trial?
Refer to table 1 in the article. As the authors point out there were small differences in the
total pack years of cigarette smoking, prior use of systemic glucocorticoids, and the
prevalence of diabetes mellitus. These differences are likely to be of limited clinical
importance.
Aside from the experimental intervention, were the groups treated equally?
Yes, again the study was double blinded using placebo medications. There was no
reason to suspect “unmasking” of treatment allocation for whatever reason during the
study period.
What were the results?
For the primary outcome measure (death, intubation, readmission for COPD, or
intensification of therapy) the results for 30 and 90 days are outlined below:
School of Population Health
57
EBP Workbook 05
Table 4.4: Clinically useful measures of the effects of treatment
Outcome
Control
event rate
(X)
Experimental
event rate (Y)
30 days
33%
23%
90 days
48%
37%
Relative
risk
reduction
RRR =
(X –Y)/X
31%
(95%CI: -2
to 53)
23% (-3 to
42)
Absolute
risk
reduction
ARR =
X–Y
10%
11%
Number
needed to
treat (NNT
= 1/ARR)
10 (95% CI:
5 to infinity)
9 ( 4 to
infinity)
Confidence intervals for RRR and NNT were not provided in the article. They are taken
from an ACP Journal Club review (Gibson 2000). The investigators used survival analysis
to analyse their results and the point estimate for the RRR above may underestimate the
survival analysis reported in the article.
How precise was the estimate of the treatment effect?
The confidence intervals presented above are relatively wide but these may be an
overestimate. Nonetheless they do suggest that the true effect size could be a lot smaller
than the point estimate.
Will the results help me in caring for my patients?
Can the results be applied to my patient care?
You work at a tertiary institution probably similar to the ones in the study. In general, your
patient appears to fit the profile of many of the patients included in this study except that
the majority (99%) of participants in the study were males. It is worth noting that some
studies suggest that females attending the emergency department with COPD have a
better prognosis than males (Sunyer, 1998). If the baseline risk of adverse events is lower
in female subjects then the NNT to prevent them would be greater compared with males.
It is worth noting that lower doses of corticosteroids are used to treat exacerbations of
COPD in Australia than were used in this study. Evidence from asthma studies, however,
suggests that lower doses are likely to be sufficient. Oral administration might also be
adequate but there has been little research to evaluate this.
Were all clinically important outcomes considered?
Most clinically important outcomes were considered for this study, but quality of life would
be another outcome of interest to patients.
Are the likely treatment benefits worth the potential harms and costs?
The main side effect was hyperglycaemia requiring treatment. The rate of
hyperglycaemia was 15% in the glucocorticoid treated group compared with 4 % in the
placebo group. This suggests that for every 9 patients treated with glucocorticoids, 1 will
develop hyperglycaemia requiring treatment. However, if short lived and uncomplicated
this side effect is probably of small clinical importance when weighed against the benefits
of treatment. Although not significant in this study other studies have shown an elevated
risk of secondary infection, myopathies and other complications with systemic
School of Population Health
58
EBP Workbook 05
corticosteroids (Gibson, 2000).
4.6 Recommended reading
Guyatt GH, Sackett DL, Cook DJ. Users’ guides to the medical literature. II. How to use an
article about therapy or prevention. A. Are the results of the study valid? Evidence-Based
Medicine Working Group. JAMA 1993;Dec1;270(21):2598-601
Guyatt GH, Sackett DL, Cook DJ. Users’ guides to the medical literature. II. How to use an
article about therapy or prevention. B. What were the results and will they help me in
caring for my patients? Evidence-Based Medicine Working Group. JAMA 1994;Jan
5;271(1):59-63
4.7 References
See Bibliography
4.8 Critical appraisal worksheets
4.8.1
Sample adapted from Centre for Evidence-Based Medicine, Mount Sinai
Hospital
http://www.cebm.utoronto.ca/teach/materials/therapy.htm
Therapy worksheet
Citation
Are the results of this study valid?
Was the assignment of patients
to treatments randomised? Was
the randomisation list concealed?
Was follow-up of patients
sufficiently long and complete?
School of Population Health
59
EBP Workbook 05
Were all patients analysed in the
groups to which they were
randomised?
Were patients and clinicians kept
"blind" to treatment?
Were the groups treated equally,
apart from the experimental
treatment?
Were the groups similar at the
start of the trial?
What were the results?
How large was the treatment effect?
School of Population Health
60
EBP Workbook 05
How precise was the estimate of the treatment effect?
YOUR CALCULATIONS
Table: Clinically useful measures of the effects of treatment
Outcome
Control
event rate
(X)
Experimental
event rate (Y)
Relative risk
reduction
RRR =
(X –Y)/X
Will the results help me in caring for my patient?
Can these results be applied to my patient care?
Is your patient so different
from those in the study that its
results cannot apply?
Is the treatment feasible in
your setting?
School of Population Health
61
Absolute
risk
reduction
ARR =
X–Y
Number
needed to
treat (NNT =
1/ARR)
EBP Workbook 05
Were all clinically important
outcomes considered?
Are the likely treatment
benefits worth the potential
harms and costs?
Additional Notes
4.8.2 Sample from Critical Appraisal Skills Programme (CASP)
School of Population Health
62
EBP Workbook 05
http://www.phru.nhs.uk/casp/appraisa.htm
QuickTime™ and a
TIFF (LZW) decompressor
are needed to see this picture.
QuickTime™ and a
TIFF (LZW) decompressor
are needed to see this picture.
http://www.phru.nhs.uk/casp/appraisa.htm
School of Population Health
63
EBP Workbook 05
QuickTime™ and a
TIFF (LZW) decompressor
are needed to see this picture.
School of Population Health
64
EBP Workbook 05
QuickTime™ and a
TIFF (LZW) decompressor
are needed to see this picture.
School of Population Health
65
EBP Workbook 05
QuickTime™ and a
TIFF (LZW) decompressor
are needed to see this picture.
School of Population Health
66
EBP Workbook 05
5. SYSTEMATIC REVIEWS
5.1 Learning objectives
• To understand the role of systematic reviews in evidence based practice decision
making
• To understand the steps involved in undertaking a systematic review
• To understand the limitations of systematic reviews and meta-analyses
• To be able to critically appraise systematic reviews of controlled trials.
5.2 Core reading and key concepts
Introduction
You are a general practitioner, and are consulted by a 45-year-old woman. She has had
rhinorrhoea for 10 days and she complains that for the last 7 days she has had throbbing
pain over the right maxilla that is only partially relieved with paracetamol. She also
describes purulent post-nasal discharge. On examination she has tenderness over the
right maxillary sinus. There is no relevant past history apart from allergy to cotrimoxazole.
After completing your history and examination you conclude that she has acute sinusitis,
which may either be viral or related to a secondary bacterial infection. You prescribe
cefaclor: 375mg orally twice daily for 5 days. You ask her to return if there has been no
improvement after completing this course of antibiotics.
You often see patients with acute sinusitis in your practice and over lunch you discuss
your management practices with your colleagues. You often prescribe cephalosporins
because of concerns about possible resistance to amoxycillin. However, a colleague of
yours comments that she does not always prescribe antibiotics for uncomplicated acute
sinusitis in the first instance, but sees patients again a few days later if symptoms have
not improved. Another colleague comments that he usually prescribes amoxycillin for
patients with sinusitis. At the end of the day you decide to examine the evidence
regarding the use of antibiotics for the treatment of acute sinusitis. You want to know if
antibiotics have been shown to improve the clinical course of acute sinusitis and if newer
generation antibiotics have been shown to be superior to agents such as amoxycillin.
You decide to search MEDLINE, but where do you begin? You decide to look for
randomised controlled trials examining the effectiveness of antibiotics for acute sinusitis or
compared different antibiotic types in the treatment of acute sinusitis. You use a therapy
methodologic Filter (see 3.3) as the search strategy for MEDLINE 1966 - February 2002:
School of Population Health
67
EBP Workbook 05
You look at the titles and relevant abstracts and notice that there have been quite a few
randomised studies that report different results. Of note, some of the studies have
reported a benefit from antibiotics compared with placebo but others have not (1) (2) (3).
You also notice several trials that have compared amoxycillin or penicillin with other
agents (4) (5).
You do not have time to retrieve all the studies and examine them in detail, and you
wonder what to make of the fact that different studies have reported disparate findings. A
review article might be helpful.
In the following section we will discuss the role of review articles in evidence-based
practice. In particular the advantages and limitations of systematic reviews will be
outlined. Some of the detail below is included for completeness and the sections in italics
may be skipped without loss of continuity.
Systematic reviews and meta-analyses
According to the Cochrane Collaboration Handbook, a systematic review is an
overview of primary studies that contains an explicit statement of objectives,
materials and methods and has been conducted according to explicit and
reproducible methodology (6).
School of Population Health
68
EBP Workbook 05
The two key features of systematic reviews are that the methods used are transparent
and that studies are included in the review on the basis of objective criteria (independent
of the results of the study). A good systematic review will be based on a well-structured
focused clinical question. The validity of information included in the review is usually
assessed by evaluating the methodological quality of individual trials according to specific
criteria. Systematic reviews summarise the available literature using qualitative methods
but may also include numerical quantification, in which case it is called a meta-analysis
(7).
Meta-analysis is defined as a statistical synthesis of numerical results of several trials that
all examine the same question (8). Thus a meta-analysis is not synonymous with a
systematic review but is frequently used to give a statistically valid summary of the data.
Why do we need systematic reviews and meta-analyses?
Clinicians often use textbooks and narrative review articles to keep up to date with the
medical literature. However these articles may not always provide an unbiased and
comprehensive summary of the publications (9). Such articles may include a mixture of
personal opinion and evidence or be based on a biased or incomplete selection of primary
studies. While traditional narrative reviews can be useful in certain circumstances, for
many clinical questions, a systematic review is the best source of evidence-based
information.
There are many features of systematic reviews that make them useful tools for
summarising and evaluating research evidence (10). The most fundamental advantage of
a systematic review is that bias in identifying, selecting and summarising the evidence is
minimised. Because the methods used are both explicit and systematic the conclusions
should be reliable and closer to the ‘truth’ than previous standard methods of reviewing
the literature (10).
For those reviews where meta-analysis can be performed, the quantitative synthesis of
data from different studies can provide additional information. The advantage of metaanalysis is that for average estimates there is a gain in statistical power. This is
particularly important where individual studies may be too small to detect modest but
clinically important effects (insufficient statistical power). Combining the results of
individual trials provides a greater “sample size” and therefore power increases. For the
same reasons the precision of the estimate is likely to be greater (11).
Another important feature of systematic reviews is that the generalisability and
consistency of the results can be explored (10). If a review demonstrates similar effects
across a wide range of settings or study designs we can be reassured about the
robustness of the findings and their generalisability to other settings. Where
inconsistencies are noted between different studies the sources of variation can be
explored.
Steps involved in undertaking a systematic review
1. Formulation of structured question specifying the qualities of primary studies including
populations, interventions and outcomes to be considered for the review.
2. Extensive search of the literature including non-English language or unpublished
sources where appropriate. The search strategy should be documented.
3. Selection of studies for inclusion in the review using at least 2 independent reviewers
and a transparent process for resolving disagreements.
School of Population Health
69
EBP Workbook 05
4. Assessment of the methodological quality of included studies using pre-specified
criteria and 2 independent reviewers.
5. Abstraction of relevant data
6. Data synthesis and discussion of findings.
* Data on the level of agreement required between reviewers for steps 3 to 5 should be
provided.
Assessing agreement between reviewers
The level of agreement between different reviewers assessing studies for inclusion in a
review or evaluating the quality of included studies should be reported in reports of
systematic reviews. Kappa statistics are often used to present data on inter-observer
agreement. A Kappa statistic is a measure of proportional agreement that has been
corrected for chance (also sometimes called Cohen’s κ statistic). A detailed
understanding is beyond the scope of this course. A κ (kappa) of 1 represents perfect
agreement. A value of 0 indicates no agreement better than chance and negative values
indicate worse than chance agreement. There are no absolute criteria used to interpret
kappa statistics but the following may be used as a guide (12):
Value of κ
Strength of agreement
< 0.2
0.21 – 0.40
0.41 - 0.60
0.61 - 0.80
0.81 - 1.00
Poor
Fair
Moderate
Good
Very good
Sources of bias in systematic reviews
Most systematic reviews and meta-analyses are retrospective studies and may be
influenced by several sources of bias. Critical appraisal guides have been developed to
help readers evaluate the validity of the findings of systematic reviews. Reviewers can
introduce bias by using inappropriate study selection criteria, inadequately assessing the
quality of included studies, selectively presenting outcomes or by drawing conclusions that
are not consistent with the study results. Missing trials or missing data are other potential
sources of bias.
Bias related to inclusion criteria
Bias can occur if study results are used to select studies for inclusion. The criteria should
relate closely to a focused clinical question.
Bias related to identification of studies
Inadequate literature search
Literature searches limited to databases such as MEDLINE are likely to miss relevant
published reports. For randomised clinical trials, a search strategy that is limited to
MEDLINE has been shown to identify only 51% of known published studies. Some
studies are not indexed on MEDLINE and even those that are indexed on MEDLINE may
be missed by MEDLINE searches due to the limitations of the indexing process. Even
School of Population Health
70
EBP Workbook 05
with a highly sensitive search strategy using MEDLINE, only approximately three-quarters
of all published studies indexed on MEDLINE are likely to be identified (13).
The authors of review articles should describe the methods used to identify primary
studies. The following sources of information should be considered:
• Electronic databases including MEDLINE, EMBASE, the Cochrane Controlled Trial
Register, Current Contents or other relevant health information databases.
• Searching the bibliographies of previous review articles.
• Contact with authors of primary studies and experts in the field to identify data
missed by the search (published or unpublished data)
• Contact with pharmaceutical companies, where relevant.
• Hand searching of relevant journals or abstracts of international meetings may also
be important for some reviews.
Publication bias
This type of selection bias has been found to occur commonly in systematic reviews and
meta-analyses (14). Publication bias refers to the fact that studies with positive or
significant results are more likely to be submitted, published or published more quickly
that studies with ‘negative’ or non-significant results. For example a review of studies
submitted to an Australian ethics committee found clinical trials, with significant results,
were 3 times more likely to be published than studies with null results (15). Interestingly,
studies with indefinite outcomes were even less likely to be published than studies with a
non-significant study outcome (p > or = 0.10).
There are several methods that reviewers can use to assess the possibility of publication
bias. A detailed discussion is beyond the scope of this course. For those interested,
references are provided (16) (17). Of note, systematic reviews that include a small
number of small studies with weakly positive results are likely to be the most susceptible
to this type of bias. A recent review of meta-analyses found that approximately 50% had
evidence of publication bias. Despite this, publication bias was found to affect the results
of the meta-analyses in less than 10 % of reviews (14). Nonetheless, in most reviews,
reviewers should assess the possibility of publication bias and where relevant perform a
sensitivity analysis to assess the potential impact of missing studies on the review
findings. An example of publication bias is provided below.
Publication bias: an example using funnel plots
Funnel plots are one method that can be used to examine the possibility of publication bias.
A funnel plot is a simple scatter plot with the treatment effect (a measure of effect size) on
one axis plotted against some measure of study size on the other axis. The precision of the
estimate of treatment effect will increase as the sample size of the individual studies
increases, giving rise to the appearance of an inverted funnel. The estimates of treatment
effect from smaller (and less precise studies) will tend to scatter at the bottom of the graph
and the degree of spread becomes less with studies of larger sample size. A pooled
estimate of the treatment effect (usually the most precise estimate of treatment effect) will
often be placed at the top of the funnel. If bias is not present the plot should resemble a
symmetrical inverted funnel (17).
An example of a funnel plot is provided in Figure 5.1 taken from Midgley et al (20). This is
taken from a meta-analysis of randomised controlled trials examining the effect of reduced
dietary sodium intake on blood pressure in both normotensive and hypertensive individuals
(20). The reviewers of this study concluded that dietary sodium restriction for older
hypertensive individuals might be considered but the evidence in the normotensive
population does not support current recommendations for universal dietary sodium
School of Population Health
71
EBP Workbook 05
restriction. The reviewers constructed a funnel plot and the results suggest that publication
bias may be present, although other reasons for funnel plot asymmetry are possible (17).
Note the asymmetry, we would
normally expect to see smaller
negative studies here
Line representing the mean
treatment effect from the metaanalysis of all studies (fixed
effects model)
Figure 5.1 Funnel plot to explore publication bias. The vertical axis represents outcome
systolic blood pressure minus baseline systolic blood pressure in the high-sodium group
subtracted from the low-sodium group; horizontal lines are at zero and at the fixed-effects
mean. The upper and lower dotted lines are twice the median variance divided by the
effective sample size. Data from all trials were included in this analysis.
From: Midgley: JAMA, Volume 275(20). May 22/29, 1996.1590-1597 (20).
Citation bias
This type of bias may occur when the reviewers use searches of the bibliographies of
other review articles to identify primary studies. In some fields there may be a tendency
for authors of narrative reviews to cite positive studies more often than negative ones or
vice a versa depending on the beliefs of the authors. This may mean that some studies
are missed by bibliographic searches (18).
Language bias
Basing reviews on studies that are published in English only can introduce bias. Some
evidence suggests that studies conducted in non-English speaking countries are more
likely to be published in English language journals if the results are “positive” and in local
journals if “negative” (19). Such negative studies would be missed by a search limited to
articles published in English.
School of Population Health
72
EBP Workbook 05
Bias related to selective inclusion or reporting of outcomes
The results of a review may be influenced by whether evidence on all the important
outcomes is included in the report. For example if reviewers omit important data about
adverse events readers may be left with a biased impression of the relative risks and
benefits of the intervention.
Bias related to the inclusion of poor quality primary studies
Systematic reviews should include an assessment of the validity of the primary studies
included in the review. Combining the results from primary studies that are poor quality or
biased is likely to produce unreliable results. Differences in the methodological quality of
studies included in reviews may also explain differences in study results.
Some reviewers use quality scales to assess the validity of included studies; others report
validity by assessing a set number of individual criteria. There are advantages and
limitations to both of these approaches and no absolutely correct method. Readers of
review articles should make judgements about whether the criteria used to assess the
validity of included studies are appropriate. For controlled studies the criteria outlined in
the section on therapeutics (in this workbook) should be considered.
Quantitative synthesis of study results (meta-analysis)
If appropriate, systematic reviews may include a meta-analysis of the results of primary
studies included in the review. Meta-analysis involves 2 steps. Firstly an appropriate
summary statistic is calculated for each of the individual studies in the review. Secondly
these summary values are combined into a weighted average (21). Often studies are
weighted according to their size, so that larger studies receive more weight. Different
statistical methods are available for combining different types of data. A detailed
description is beyond the scope of this course.
Broadly speaking there are 2 types of models used for meta-analysis (21) (22):
•
•
Fixed effects models consider only the within-study variability in the calculation of
the common effect. The assumption is that all the studies are studying the same
true effect and that variability is due to random error.
Random effects models take into account both between study and within study
variability in the calculation of the common effect. This model assumes that the
true effect differs among studies and therefore must be represented by a
distribution of values instead of single value. The random effects model will usually
produce wider confidence intervals. It should be used if there is evidence of
statistical heterogeneity between the studies included in the review (see section
below).
The results of meta-analysis are often displayed using a Forrest plot, an example is
provided in Figure 5.2 taken from a review of lung cancer screening interventions (23).
School of Population Health
73
EBP Workbook 05
Figure 5.2: Example of Forrest plot. Shows mortality from lung cancer in subjects undergoing
chest x-ray screening. From Manser et al, Systematic review: screening for lung cancer (Cochrane
Review) (23). The black square and the horizontal lines correspond to the relative risk and 95%
confidence intervals for each of the individual studies in the analysis. The area of the black
squares reflects the weight each trial contributes to the meta-analysis. The diamond at the bottom
represents the combined relative risk and its 95% confidence intervals. The solid vertical line
corresponds to no effect of treatment (relative risk 1.0). The analysis suggests that frequent chest
x-ray screening compared with less frequent screening is actually associated with a trend to
increased mortality from lung cancer.
Understanding heterogeneity
Heterogeneity refers to the diversity that exists between different studies included in a
review. Differences between studies might include different patient populations, variations
in interventions (eg different pharmaceutical preparations or classes of medications), or
variations in methodological quality. Statistical heterogeneity refers to the incompatibility
in the quantitative results of different studies. The statistical question that arises is
whether there is greater variation between the results of the trials than is compatible with
chance. The Q statistic, interpreted using a chi-squared distribution, is generally used as
a test of homogeneity. As stated, this is a test of homogeneity and therefore a p value of
less than 0.05 indicates that there is significant statistical heterogeneity between the
results of different studies. This suggests that a single common treatment effect is
unlikely. Tests of homogeneity have been shown to have low statistical power and may
fail to detect heterogeneity, therefore a more liberal significance level may be used to
such as 0.1 rather than 0.05 (24). A failure to demonstrate statistical heterogeneity does
not necessarily rule out clinically important heterogeneity.
School of Population Health
74
EBP Workbook 05
The clinical importance/significance of statistical heterogeneity can be examined by
examining the size of the difference in outcome between the 2 most disparate studies.
Furthermore examining the boundaries of the confidence intervals of the different studies
can be useful. If the difference between the boundaries (for example the upper boundary
of one study and the lower boundary of another study) of the confidence intervals for
disparate studies is greater than 5% this suggests clinically significant heterogeneity (25).
Readers of review articles can quickly estimate whether there might be clinically important
heterogeneity between different studies included in the review by examining the Forrest
plot and determining whether the confidence intervals from individual studies tend to
overlap or not.
If significant heterogeneity is present then reviewers should first consider whether it is
appropriate to combine the results of different studies. Such combined estimates may
not make clinical or biological sense. If a meta-analysis is performed with
heterogeneous (statistically significant heterogeneity) data, the random effects model
should be used. The reasons for heterogeneity should be explored and explained
where possible (22).
Sensitivity analyses
Sensitivity analyses can be performed to evaluate the robustness of the results of the
meta-analysis. Sensitivity analyses examine how the results vary under different
assumptions about how the review or meta-analysis is conducted (26). For example
sensitivity analyses may include the following:
• Changing inclusion criteria.
• Excluding poor quality studies.
• Re-analysing the data using alternative statistical approaches, for example comparing
fixed effects with random effects models.
• Re-analysing data to include imputed values for missing data (for example if
publication bias is suspected).
Subgroup analyses
If data from different subgroups of patients are available from each study, subgroup
analyses might be possible. This may provide further insights into reasons for
heterogeneity. In most cases, meta-analysis is retrospective and subgroup analyses are
therefore post-hoc and need to be interpreted cautiously (22). The following criteria have
been suggested for determining whether the results of subgroup analysis are likely to be
reliable (27):
•
•
•
•
•
•
Was the hypothesis made prior to undertaking the study/review?
Was it one of only a few hypotheses tested?
Are the findings consistent across studies?
Are differences biologically plausible?
Is there a big difference in treatment effect between subgroups?
Is the difference in treatment effect highly statistically significant?
Findings from subgroup analyses that satisfy these criteria may carry more weight. In
general, if these criteria are not met, subgroup analyses should be viewed as hypothesis
generating. Subgroup analyses derived from comparisons between studies (comparing
patients in one study with patients in another) should be viewed sceptically (27).
School of Population Health
75
EBP Workbook 05
Meta-regression can be used to examine gradients in treatment effects. In this
way differences in outcomes can be further examined in relation to differences in
the attributes of studies. Factors such as age or duration of follow up can be
explored. Where graded associations exist, statistical tests for trend can be used.
(A detailed description of the statistical methods is beyond the scope of this
course). For those interested in further reading a reference is provided (28)
Outcome measures for systematic reviews
For reviews of controlled or randomised-controlled studies examining treatments,
dichotomous outcomes (yes/no) will often be presented with measures such as relative
risk or absolute risk reduction. For such outcomes it is useful if the reviewers also provide
summary measures, such as NNT. As discussed in the section on therapy, presenting
results, as NNT helps readers understand and communicate the practical importance of
the results. It should be remembered, however, that although NNT is a clinically useful
estimate of the average treatment effect in patients at the average risk in the included
trials, it may not be directly relevant to an individual patient. In calculating the NNT it may
help to use the control event rates from individual studies included in the review or from
cohort studies that have included patients similar to those of interest to the reader (29).
For some types of continuous data such as functional status using different instruments,
the results of each study may be summarised using the effect size. This is a way of
determining the average effect of the intervention. The effect size is the difference in
outcomes between the intervention and control groups divided by the standard deviation.
In this way the results of each study are summarised in terms of the number of standard
deviations of difference between the intervention and control groups. The combined effect
of all studies can be calculated from a weighted average of the effect sizes. Ideally such
results should then be presented in a way that can be understood by readers, perhaps by
translating the summary effect size back into natural units (27).
Issues related to the interpretation of the results of
systematic reviews
Some reviews may find inconclusive evidence. In these circumstances it is important not
to confuse ‘no evidence of effect’ with ‘evidence of no effect’. Often the findings of
reviews will neither confirm nor refute the presence of treatment benefit, particularly if
there are a small number of underpowered studies. Evidence of no effect however, can
only be concluded if the confidence intervals from a pooled analysis clearly exclude a
clinically important difference between intervention and control groups (particularly if the
studies are high quality and homogeneous). For a discussion of confidence intervals see
4.2. Even reviews with inconclusive results are helpful. They provide a summary of the
available literature and often highlight how future research should be focused.
Although systematic reviews of randomised controlled studies are usually considered the
highest level of evidence in the evidence hierarchy, some reviews provide higher-level
evidence than others. For example smaller meta-analyses (those with a limited number of
small trials or less than 200 outcome events) are likely to be less reliable than larger
meta-analyses. Such small meta-analyses are still useful for summarizing the available
evidence and generating hypotheses for future research (30). The results of a metaanalysis of randomised controlled trials in which the treatment effects from individual
School of Population Health
76
EBP Workbook 05
studies are consistent (homogeneous), and the lower limit of the confidence interval for
the treatment effect exceeds the minimally clinically important difference, carry greater
weight than those meta-analyses with significant heterogeneity (wide disparity between
individual studies) or in those where the treatment effect overlaps the minimally clinically
important benefit (31) (25).
Cochrane reviews
The Cochrane Collaboration is an international organisation that aims to produce
evidence based systematic reviews that are accessible, clinically useful, quality controlled
and periodically updated. Cochrane systematic reviews are published in the Cochrane
Library (32). The Cochrane Library can be accessed in Australia from
http://www.nicsl.com.au. In addition to original reviews, the Cochrane Library contains a
database of abstracts of reviews (DARE) from other sources that have been quality
assessed and summarised. An important feature of Cochrane reviews is that they are
periodically updated and may be revised to include new research findings or in response
to valid criticisms. Each new addition of the Cochrane Library (updated quarterly)
contains previously published Cochrane reviews in addition to updates and new protocols.
Critical appraisal of systematic reviews
Several critical appraisal guides have been published (8) (26, 27). We have based our
systematic review critical appraisal worksheet (at the end of this chapter) on the Users’
guides’ series (27) with some modifications taken from the Centre for Evidence-Based
Medicine, Mount Sinai Hospital website:
http://www.cebm.utoronto.ca/teach/materials/therapy.htm
The following criteria are suggested for appraising review articles (27):
Are the results of the study valid?
Primary guides:
Did the overview address a focused clinical question?
Were the criteria used to select articles for inclusion appropriate?
Secondary guides:
Is it unlikely that important, relevant studies were missed?
Was the validity of the included studies appraised?
Were assessments of studies reproducible?
Were the results similar from study to study?
What are the results?
What are the overall results?
How precise were the results?
Will the results help me in caring for my patients?
Can the results be applied to my patient care?
Were all clinically important outcomes considered?
Are the benefits worth the harms and costs?
5.3 Worked examples
Recall the scenario discussed in the introduction to this section. To help you decide if
antibiotics are indicated for the management of your patient (and if so whether newer
generation antibiotics are more effective), you search for a systematic review.
School of Population Health
77
EBP Workbook 05
You decide to search the Cochrane Database of Abstracts of Reviews of Effectiveness
and the Cochrane Database of Systematic Reviews. You use the term acute sinusitis and
find 7 articles; the following 3 are the most relevant:
Williams, JW. Aguilar, C. Makela, M. Cornell, J. Hollman, DR. Chiquette, E. Simel, DL.
Antibiotics for acute maxillary sinusitis. [Systematic Review] Cochrane Acute Respiratory
Infections Group Cochrane Database of Systematic Reviews. Issue 1, 2002.
Center for Reviews and Dissemination Reviewers. Are amoxycillin and folate inhibitors as
effective as other antibiotics for acute sinusitis? A meta-analysis. [Treatment] Database of
Abstracts of Reviews of Effectiveness. Issue 1, 2002. (de Ferranti S D, Ioannidis J P, Lau
J, Anninger W V, Barza M. Are amoxycillin and folate inhibitors as effective as other
antibiotics for acute sinusitis? a meta-analysis. BMJ 1998, 317, 632-637)
Center for Reviews and Dissemination Reviewers. Antimicrobial treatment in acute
maxillary sinusitis: a meta-analysis. [Treatment] Database of Abstracts of Reviews of
Effectiveness. Issue 1, 2002. (de Bock G H, Dekker F W, Stolk J, Springer M P, Kievit J,
van Houwelingen J C. Antimicrobial treatment in acute maxillary sinusitis: a meta-analysis.
Journal of Clinical Epidemiology 1997, 50(8), 881-890)
You examine the article by de Ferranti et al in more detail.
Abstract
Objectives: To examine whether antibiotics are indicated in treating uncomplicated acute
sinusitis and, if so, whether newer and more expensive antibiotics with broad spectra of
antimicrobial activity are more effective than amoxycillin or folate inhibitors.
Design: Meta-analysis of randomised trials.
Setting: Outpatient clinics.
Subjects: 2717 patients with acute sinusitis or acute exacerbation of chronic sinusitis
from 27 trials.
Interventions: Any antibiotic versus placebo; amoxycillin or folate inhibitors versus
newer, more expensive antibiotics.
Main outcome measurements: Clinical failures and cures.
Results: Compared with placebo, antibiotics decreased the incidence of clinical failures
by half (risk ratio 0.54 (95% confidence interval 0.37 to 0.79)). Risk of clinical failure
among 1553 randomised patients was not meaningfully decreased with more expensive
antibiotics as compared with amoxycillin (risk ratio 0.86 (0.62 to 1.19); risk difference 0.9
fewer failures per 100 patients (1.4 more failures to 3.1 fewer failures per 100 patients)).
The results were similar for other antibiotics versus folate inhibitors (risk ratio 1.01 (0.52 to
1.97)), but data were sparse (n=410) and of low quality.
Conclusions: Amoxycillin and folate inhibitors are essentially as effective as more
expensive antibiotics for the initial treatment of uncomplicated acute sinusitis. Small
differences in efficacy may exist, but are unlikely to be clinically important.
School of Population Health
78
EBP Workbook 05
To obtain the full text of this article go to the BMJ website at, http://www.bmj.com. Click
on Search/Archive, then under Word(s) in Title or Abstract type: “acute sinusitis, metaanalysis” and click Search. This article will appear in the search results along with a few
other articles.
A critical appraisal of this article is outlined below.
Worked example: Systematic review (of therapy) worksheet
Citation
de Ferranti S D, Ioannidis J P, Lau J, Anninger W V, Barza M. Are amoxycillin and folate
inhibitors as effective as other antibiotics for acute sinusitis? a meta-analysis. BMJ 1998,
317, 632-637.
Are the results of this systematic review valid?
Did the systematic review
address a focused clinical
question?
Although there is no single statement outlining all the
important elements of the question for this review in the
introduction, the clinical question is clear from the
abstract and text and includes the following
components:
Population – Patients with acute uncomplicated
sinusitis, or acute exacerbation of chronic sinusitis
treated in the outpatient setting
Intervention – Antibiotics
Comparison – compared with different classes of
antibiotics or placebo
Outcomes – Clinical cure, improvement, and treatment
failure
Yes, the following inclusion criteria applied:
Were the criteria used to select
articles for inclusion appropriate? 1) trial compared amoxycillin or a folate inhibitor with
another antibiotic, generally one with broad
spectrum of activity, including cephalosporins,
What were the inclusion criteria?
penicillins with beta-lactamase inhibitors,
tetracyclines, quinolines, and macrolides
2) studies comparing antibiotic treatment with a
placebo control group were also included
3) Only studies with random assignment to treatment
arms were included
4) Trials evaluating acute sinusitis or an exacerbation
of chronic sinusitis
Exclusions:
• studies that compared doses of non-antimicrobial
drugs
• trials of subacute or chronic sinusitis (mean duration
of symptoms > 3 weeks)
These criteria are appropriate to the clinical question
being addressed in the review.
School of Population Health
79
EBP Workbook 05
Is it likely that important, relevant
studies were missed?
The search included medical databases and hand
searching of conference proceedings. Bibliographies
were also searched. Searches of databases such as
EMBASE were not undertaken and therefore the
reviewers could have missed studies published outside
the USA*. There was no mention of attempts to find
possible missing published or unpublished data for
example by contacting experts in the field or
pharmaceutical companies.
Publication bias may be source of bias for this review.
In the meta-analysis analysing placebo controlled trials
there are several small ‘positive’ studies. It is possible
that there are also some smaller ‘negative’ studies that
were conducted but not published. The authors have
not attempted to determine whether publication bias
might be a factor in this review or determine the
potential impact on the results by performing a
sensitivity analysis and it is therefore difficult to
determine whether this might be an important source of
bias in this review.
The authors discuss the possibility of publication bias in
relation to the trials comparing different antibiotic
classes but not in relation to the placebo controlled
studies (see discussion section).
Was the validity of the included
studies appraised?
If validity was assessed, explain
how.
Yes.
The reviewers used 2 methods to assess quality, a
subject specific set of criteria and the Jadad scale for
assessing the methodological quality of clinical trials.
The subject specific criteria were:
• blinded versus unblinded design
• criteria for diagnosis of sinusitis
• clinical outcomes
• loss of subjects to follow up
• use of decongestants
The Jadad quality scale is a validated scale that
assesses the internal validity of randomised controlled
trials. The details are provided at the end of this
section**.
Were assessments of studies
reproducible?
The authors state that data extraction (of results) was
performed by 2 reviewers independently. They do not
say whether the selection of studies for inclusion in the
review or quality assessments was undertaken by 2
School of Population Health
80
EBP Workbook 05
independent reviewers or whether agreement between
reviewers was assessed.
Were the results similar from
study to study? (homogeneous)
Did the authors assess the
possibility of statistical
heterogeneity?
Without a comment about reproducibility, it is difficult to
assess the reliability of the reviewers’ data extraction
and the quality assessment process.
For the placebo controlled studies the authors comment
that there was no statistically significant heterogeneity.
They did note, however that there was a suggestion that
one trial which included patients simply on the basis of
sinusitis-like symptoms without further diagnostic
information, had the highest rate of cure in the placebo
group (85% at 10 days) and showed no benefit from
antibiotics. Those trials with more tightly defined patient
populations and lower spontaneous improvement rates
showed a clear benefit from antibiotics.
For the trials comparing different classes of antibiotics in
different treatment arms, statistical heterogeneity was
noted (p=0.09 for clinical cure) for the studies
comparing folate inhibitors with other antibiotics. None
was noted for studies comparing amoxycillin with other
antibiotics.
Although some limitations to the validity are suggested above, these are unlikely to be
substantial enough to invalidate the results of the review, therefore at this point it would be
appropriate to examine the results. If you felt that the methods of the review were
substantially flawed and could introduce major bias, you might choose to discard the
results altogether.
* Of the Journals covered by MEDLINE, 52% are published in the USA. EMBASE is
another large database of medical and scientific references. The range of journals
covered differs to that of MEDLINE with only 33% of journals covered being published in
North America (34).
** Jadad quality scale assigns a score to studies of between 0 and 5, where 5 is the
maximum score representing the highest quality. The following questions are used (35):
(a) Was the study described as randomised? (1=Yes 0=No).
(b) Was the study described as being double blind? (1=Yes 0=No).
(c) Was there a description of withdrawals and dropouts? (1=Yes 0=No).
(d) Was the method of randomisation well described and appropriate? (1=Yes 0=No).
(e) Was the method of double blinding well described and appropriate? (1=Yes 0=No).
(f) Deduct one point if methods for randomisation or blinding were inappropriate.
What are the results?
What are the overall results?
Compared with placebo, antibiotics decreased the incidence of clinical failures by half, the
risk ratio was 0.54 (95% confidence interval 0.37 to 0.79). For the point estimate the NNT
to prevent clinical failures was calculated (see table below). 7 patients need to be treated
with any antibiotic to ‘cure’ 1 patient (prevent treatment failure within 48 hours of the
completion of treatment). As the reviewers point out the symptoms were noted to improve
School of Population Health
81
EBP Workbook 05
or disappear in 69% of patients without any antibiotic treatment. The risk of clinical failure
did not differ significantly in the analysis of studies comparing amoxycillin with other
antibiotics or in those studies comparing folate inhibitors with other antibiotic classes.
How precise were the results?
For the comparison between placebo and any antibiotic the 95% confidence intervals are
between 0.37 and 0.79. This suggests that the true risk ratio may be as large as 0.37 or
as small as 0.79 at the 95% level of confidence.
Outcome
Control
event rate
(X)
Experimenta
l event rate
(Y)
Relative risk
reduction
RRR =
(X –Y)/X
Clinical
failure
(antibiotics
versus
placebo)
Placebo
Antibiotic
0.31 (31%)
0.17 (17%)
RRR = 1-RR
RRR = 0.46
46%
Absolute
risk
reduction
ARR =
X–Y
Number
needed to
treat (NNT =
1/ARR)
0.14 (14%)
7
Will the results help me in caring for my patient?
Can these results by applied to my patient care?
Is your patient so different
The mean ages of patients ranged from 25 to 44 years.
from those in the study that its Apart from this there is little demographic data about the
results cannot apply?
primary studies included.
An important consideration is the diagnostic criteria used to
establish the diagnosis. Many of the studies included in the
review used diagnostic criteria such as radiography and
culture of sinus aspirations to establish the diagnosis. As
pointed out by reviewers however, the one study that had
inclusion criteria used by most family doctors (sinusitis-like
symptoms) showed no benefit from antibiotics (after 10 days
85% of both the control and intervention groups had
recovered).
However a benefit from antibiotics in this setting is not
excluded from the results of this individual study alone (note
the confidence intervals for the study by Stalman et al 1997
in figure 1). Further studies would be needed before
drawing firm conclusions about the generalisability of the
findings to the general practice setting, where diagnosis is
based on clinical criteria alone. At a minimum however, the
higher rates of spontaneous improvement in this group of
patients suggest that the NNT would be greater in the
School of Population Health
82
EBP Workbook 05
general practice setting.
Of note recent guidelines do not recommend the use of
routine radiography for the diagnosis of acute sinusitis.
Clinical criteria are used to define suspected cases of acute
bacterial sinusitis (33).
Another factor that you may need to take into account is the
local prevalence of antibiotic resistance.
Is the treatment feasible in
your setting?
Oral antibiotic treatment is clearly feasible in the general
practice or outpatient setting.
The ability to perform procedures such as sinus aspiration to
confirm diagnosis may not feasible.
Were all clinically important
outcomes considered?
Clinical cure or failure rates seems a reasonable outcome
measure, but as pointed out by the reviewers, the criteria
used to establish this differed between studies and were not
always well specified, making interpretation of this finding
more difficult for practicing clinicians.
Of note, amongst all the patients treated in the studies
included in the review, there were no serious complications
reported such as meningitis or brain abscess. Outcomes
that would be important to patients but do not appear to have
been covered in the primary studies might include quality of
life, duration and intensity of symptoms such as pain and
need for time off work.
Are the likely treatment
benefits worth the potential
harms and costs?
In discussing the need for treatment with your patient you
might say, “the majority of patients with this conditions get
better without antibiotic treatment. With antibiotics, however,
treatment failures are less likely, but 7 patients need to be
treated with antibiotics to prevent 1 treatment failure (48
When considering this
question you should take into hours after the treatment has been completed)”.
account your patient’s values
and preferences.
Some patients will prefer antibiotics in the first instance while
others may not. The benefits of treatment need to be
weighed against the potential side effects of the medication.
Side effects were not discussed in detail or clearly
considered in the outcomes described.
Costs were not considered but newer antibiotics are usually
more expensive and there are concerns that their
widespread use may increase rates of bacterial resistance.
The results of this review suggest that there are no clear
benefits from using newer antibiotics at this stage.
School of Population Health
83
EBP Workbook 05
5.4 Self-complete exercises
Clinical scenario
You are a general practitioner. A longstanding patient (Mr CE), who has recently had a
transient ischaemic attack (TIA), calls you to say his neurologist and neurosurgeon have
recommended that he have a carotid endarterectomy but he would like to come and
discuss it with you before agreeing to go ahead with the operation.
Mr CE is a 72 and an ex-smoker. He has had hypertension for 10 years, which is
currently well controlled with amlodipine 10 mg daily. His only other regular medication is
aspirin 150mg daily. He has no history of heart disease or peripheral vascular disease. In
the past 6 months he has had 2 TIAs, the first occurred when he was not taking aspirin
and the second while taking aspirin. On both occasions he presented with right facial and
arm weakness associated with slurred speech, which resolved within 24 hours.
He was referred to a tertiary hospital for investigation and management. CT brain was
normal. ECG and echocardiography were normal. Carotid angiography was performed
after a carotid ultrasound suggested a stenosis of the left internal carotid artery. The
angiogram confirmed the presence of 67% stenosis of the left carotid artery. There was
no substantial abnormality noted in the right carotid arterial circulation.
After talking to Mr CE on the phone you arrange to see him the next day. You decide to
examine the evidence regarding the carotid endarterectomy for symptomatic carotid
stenosis and perform a MEDLINE search, hoping to locate a relevant systematic review.
You search MEDLINE, OVID 1966-February 2002. Firstly you enter the term
“Endarterectomy, Carotid/” which yields 2643 citations. You then enter “Meta-analysis.pt”
which yields 6308 citations. You combine these terms using “and” which yields 13
articles. You search the titles and abstracts and find the following systematic review: Cinà
CS, Clase CM, Haynes BR. Refining the indications for carotid endarterectomy in patients
with symptomatic carotid stenosis: A systematic review. Journal of Vascular Surgery
1999;30:606-617.
Critically appraise the article and decide how the results should be applied to your patient.
Use the guide below, which is based on the critical appraisal worksheet provided at the
end of the section. Some additional questions have been added (in italics) to help guide
you through the process.
Systematic review (of therapy) worksheet
Citation
Cinà CS, Clase CM, Haynes BR. Refining the indications for carotid endarterectomy in
patients with symptomatic carotid stenosis: A systematic review. Journal of Vascular
Surgery 1999;30:606-617.
School of Population Health
84
EBP Workbook 05
Are the results of this systematic review valid?
Did the systematic review
address a focused clinical
question?
Yes
Although the research question is not outlined in a single
statement in the introduction the inclusions, exclusions
and outcomes of interest are described. Can you
describe the following components of the question?
Population –
Intervention –
Comparison –
Outcome –
Were the criteria used to
select articles for inclusion
appropriate?
What were the inclusion
criteria?
Is it likely that important,
relevant studies were missed?
If you think that important
studies were not likely to be
missed explain why.
School of Population Health
85
EBP Workbook 05
Was the validity of the
included studies appraised?
If validity was assessed,
explain how.
Were assessments of studies
reproducible?
How do you interpret the
kappa statistics presented in
this article?
Were the results similar from
study to study?
(homogeneous)
Did the authors assess the
possibility of statistical
heterogeneity?
School of Population Health
86
EBP Workbook 05
What are the results?
What are the overall results?
Some of the main results are summarised in the table below. (Taken from table IV, Cinà
et al). Can you calculate the NNT using the data provided in the table?
How precise were the results?
Stenosis
Relative risk
reduction or
increase (%)
Absolute risk
reduction or
increase (%)
70% to 99%
48 (27 to 63)
6.7 (3.2 to 10)
50% to 69%
27 (5 to 44)
.7 (0.8 to 8.7)
< 49%
20 (0 to 44) Increase
.2 (0 to 4.4) Increase
* Number Needed to Harm
Will the results help me in caring for my patient?
Can these results by applied to my patient care?
Is your patient so different
from those in the study that
its results cannot apply?
What are the important
factors that you need to
consider for this patient?
If subgroup analyses were
presented remember the
guidelines outlined for
assessing the reliability of
these.
School of Population Health
87
Number needed
to treat (NNT =
1/ARR)
* NNH
EBP Workbook 05
Is the treatment feasible in
your setting?
Were all clinically important
outcomes considered?
Are the likely treatment
benefits worth the potential
harms and costs?
When considering this
question you should take into
account your patient’s values
and preferences.
School of Population Health
88
EBP Workbook 05
5.5 Answers to self-complete exercises
Citation
Cinà, CS, Clase CM, Haynes BR. Refining the indications for carotid endarterectomy in
patients with symptomatic carotid stenosis: A systematic review. Journal of Vascular
Surgery 1999;30:606-617.
Are the results of this systematic review valid?
Did the systematic review
address a focused clinical
question?
Yes.
Although the research question is not outlined in a
single statement in the introduction, the inclusions,
exclusions and outcomes of interest are described. The
question has the following components:
Population – patients with ipsilateral symptomatic
carotid stenosis
Intervention – carotid endarterectomy
Comparison – compared with medical management
(control group)
Outcome – Death or major disability from stroke.
Were the criteria used to select
Yes.
articles for inclusion appropriate?
Inclusion criteria were based on study design (only
randomised controlled studies were included), and the
intervention, comparison and population of interest. It
seems reasonable to exclude studies with
asymptomatic carotid stenosis since such patients differ
on prognostic grounds. It also seems reasonable to
exclude studies that included unusual surgical
techniques.
Is it likely that important, relevant
studies were missed?
Was the validity of the included
studies appraised?
Unlikely.
The search of medical databases was well described
and comprehensive. There was no attempt to contact
experts in the field or identify unpublished data.
However one of the reviewers has been involved with
the primary studies and therefore has some expertise in
the field. It is difficult to examine for possible publication
bias when the number of studies is small. The 3 studies
identified for the review were all reasonably large and
publication bias is more likely when there are number of
smaller positive studies.
Yes.
The validity of included studies was appraised by 2
School of Population Health
89
EBP Workbook 05
reviewers independently. The results were summarised
in table III of the article. Overall the quality of studies
appears high. As the reviewers point out, it is difficult to
perform a double blind study with a surgical
intervention. Although outcomes were assessed by
independent reviewers, clinical data for such
assessments was derived from unblinded clinical
evaluations. This may lead to detection bias.
Were assessments of studies
reproducible?
Yes.
Studies were selected for inclusion by 2 reviewers.
Inter-observer reliability was excellent (K = 0.95).
Methodological quality was also assessed by 2
reviewers and agreement between reviewers was good
(K= 0.75). Data extraction was performed by 2
reviewers independently using a standard form and the
error rate was low.
Were the results similar from
study to study? (homogeneous)
Yes.
There was no significant statistical or clinical
heterogeneity between studies included in the review.
As the authors point out, because only 2 studies are
included in the actual meta-analysis the power to detect
heterogeneity is low. The point estimates for each of
the studies are similar and the confidence intervals
overlap, making heterogeneity unlikely. (Refer to figure
1 Cinà et al)
What are the results?
What are the overall results?
The main results are summarised in the table below. (taken from table IV, Cinà et al).
How precise were the results?
For patients with a stenosis of 70% to 99% the results are precise with confidence
intervals ranging from 10 to 31 for the NNT. This suggests that there is a 95% chance that
the true NNT lies between 10 and 31. The confidence intervals are wider for the group of
patients with a stenosis of 50 to 69%, the true NNT may lie between 11 and 125, at the
95% level of confidence.
School of Population Health
90
EBP Workbook 05
Stenosis
Relative risk
reduction or
increase (%)
Absolute risk
reduction or
increase (%)
Number needed
to treat (NNT =
1/ARR)
70% to 99%
48 (27 to 63)
6.7 (3.2 to 10)
NNT 15 (10 to 31)
50% to 69%
27 (5 to 44)
4.7 (0.8 to 8.7)
NNT 21 (11 to 125)
< 49%
20 (0 to 44) Increase
2.2 (0 to 4.4) Increase
*NNH 45 (22 to ∞)
* Number Needed to Harm
Will the results help me in caring for my patient?
Can these results by applied to my patient care?
Is your patient so different
No.
from those in the study that
its results cannot apply?
Firstly Mr CE appears to be similar to the types of patients
included in the individual studies in this review in terms of
demographic and clinical features (refer to table II in Cinà et al).
If subgroup analyses were
Secondly Mr CE has a stenosis of 67% and therefore fits into
presented remember the
the group of patients with a carotid stenosis of 50% to 69%.
guidelines outlined for
(Note that these groups are based on stratified randomisation
assessing the reliability of
these.
and not subgroup analysis and are therefore likely to be
reliable.) In order to be able to extrapolate the findings of this
review to your patient you need to be sure that the methods
used to assess the degree of carotid stenosis are standardized
and comparable with those used by the primary studies in the
review.
The results of this study suggest that the benefits of carotid
endarterectomy are less, although still important, for patients
with a stenosis of 50% to 69%. As pointed out by the reviewers
of this article, for patients with this level of stenosis,
consideration should be given to other variables in making
decisions about surgery. For Mr CE there are several factors
that suggest he may derive an increased benefit from surgery
compared with other patients in this category. These factors
include male gender, older age and the degree of stenosis.
Within the categories of stenosis (50% to 69% and 70% to
99%) a gradient effect of benefit was observed with increasing
degree of stenosis. This suggests that a patient with a stenosis
of 67% may derive a greater benefit (all other things being
equal) than a patient with a stenosis of 50%. Male patients and
older patients also appeared to derive greater benefit. Gender
appears to be an important determinant of outcome, this finding
is consistent across the studies, the size of the effect is large
(page 612 Cinà et al) and biologically plausible.
* Note that the subgroup analyses discussed in this article are a
School of Population Health
91
EBP Workbook 05
qualitative summary of the findings of the individual studies and
not based on meta-analysis with separate subgroup analyses.
Is the treatment feasible in
your setting?
Yes.
If Mr CE goes ahead with the surgery you are aware that he will
be operated on in a particular tertiary institution where the
combined morbidity and mortality of the procedure is known to
be less than 6%. This is an important consideration. If the risk
of post-operative death or stroke or other morbidity is greater
than that reported in the individual studies then the benefits of
surgery will be reduced.
Were all clinically important
outcomes considered?
Yes.
Both death and functional outcomes were considered. Both
these outcomes are clearly important to patients. Quality of life
in addition to functional outcomes might be of interest but was
not reported.
Are the likely treatment
benefits worth the potential
harms and costs?
The data suggests that for Mr CE the benefits are likely to
outweigh the harms. Clearly his preferences and values need
to be taken into account. The results could be explained to Mr
CE. Note that for patients with a stenosis of 50% to 69% 21
patients need to be treated to prevent 1 death or disabling
When considering this
question you should take into stroke, (over 5 years of follow up) although this number may be
account your patient’s values less for Mr CE given the factors discussed above. It is
and preferences.
important to convey to Mr CE that although in the long term
there is certainly a net benefit, in the immediate post operative
period (30 days) there is an approximately 3% risk of death or
major disabling stroke.
How would you rank the importance of immediate (small) risk of
an adverse outcome versus the delayed (moderate) benefit in
the longer term?
The value your patient places on these different outcomes
clearly needs to be taken into account and the way that you
convey information about the risk and benefits of the surgery
may influence the informed decision making process. (See 8.1)
5.6 Recommended reading
Oxman A, Cook D, GH G. Users’ Guides to the Medical Literature: VI. How to Use an
Overview. JAMA 1994;272(17):1367-137.
School of Population Health
92
EBP Workbook 05
5.7 Further reading
Glasziou P, Irwig L, Bain C, Colditz G. Systematic Reviews in Health Care: A practical
guide. Cambridge University Press, Cambridge, 2001
5.8 References
1.
Stalman W, Van Essen GA, van der Graaf Y, de Melker RA. The end of antibiotic
treatment in adults with acute sinusitis-like complaints in general practice? A
placebo-controlled double blind randomised doxycycline trial. Br J Gen Pract
1997;47:794-799.
2.
Lindbaek M, Hjortdahl P, Johnsen UL. Randomised, double blind, placebocontrolled trial of penicillin V and amoxycillin in treatment of acute sinus infections in
adults. BMJ 1996;313:325-329.
3.
van Buchem F, Knottnerus JA, Schrijnemaekers VJ, Peeters MF. Primary care
based randomised placebo-controlled trial of antibiotic treatment in acute maxillary
sinusitis. Lancet 1997;349:683-687.
4.
Hayle R, Lingaas E, Hoivik HO, Odegard T. Efficacy and safety of azithromycin
versus phenoxymethylpencillin in the treatment of acute maxillary sinusitis.
European Journal of Clinical Microbiology and Infectious Diseases.
1996;15(11):849-853.
5.
Huck W, Reed BD, Nielsen RW, Ferguson RT, Gray DW, Lund GK, Zobell DH,
Moster MB. Cefaclor versus amoxicillin in the treatment of acute, recurrent, and
chronic sinusitis. Archives of Family Medicine 1993;2(5):497-503.
6.
The Cochrane Library. Cochrane Handbook. Oxford: Update Software; 2000.
7.
Manser R, Walters E. What is evidence-based medicine and the role of the
systematic review: the revolution coming your way. Monaldi Arch Chest Dis
2001;56(1):33-38.
8.
Greenhalgh T. How to read a paper: Papers that summarise other papers
(systematic reviews and meta-analyses). BMJ 1997;315:627-675.
9.
Antman E, Lau J, Kupelinck B, Mosteller F, Chalmers T. A comparison of results of
meta-analysis of randomised control trials and recommendations of clinical experts.
JAMA 1992;268:240-248.
10.
Mulrow C. Rationale for systematic reviews. BMJ 1994;309:597-599.
11.
Dickersin K, Berlin J. Meta-analysis: State-of-the-science. Epidemiologic Reviews.
JAMA 1992;280:280-282.
12.
Altman D. Chapter 14: Some common problems in medical research. In: Altman D,
editor. Practical statistic s for medical research. First ed. London: Chapman and
Hall; 1991. p. 396- 439.
13.
Dickersin K, Scherer R, Lefebvre C. Systematic Reviews: Identifying Relevant
Studies for Systematic Reviews. BMJ 1994;309(6964):1286-1291.
14.
Sutton A, Duval S, Tweedie R, Abrams K, Jones D. Empirical assessment of effect
of publication bias on meta-analyses. BMJ 2000;320(7249):1574-1577.
15.
Stern J, Simes R. Publication bias: evidence of delayed publication in a cohort study
of clinical research projects. BMJ 1997;315(7109):640-645.
School of Population Health
93
EBP Workbook 05
16.
Thornton A LP. Publication bias in meta-analysis; its causes and consequences.
Journal of Clinical Epidemiology 2000;53(2):207-216.
17.
Sterne J, Egger M, Smith GD. Ch 11: Investigating and dealing with publication bias
and other biases. In: Egger M, Smith GD, Altman DG, editor. Systematic Reviews in
Health Care: Meta-Analysis in Context. London: BMJ; 2001. p. 189-208.
18.
Egger M, Dickersin K, Smith GD. Ch 3: Problems and limitations in conducting
systematic reviews. In: Egger M, Smith GD, Altman DG, editor. Systematic Reviews
in Health Care: Meta-Analysis in Context. London: BMJ; 2001. p. 43-68.
19.
Egger M, Zellweger-Zahner T, Schneider M, Junker C, Lengeler C, Antes G.
Language bias in randomised controlled trials published in English and German.
Lancet 1997;350:326-329.
20.
Midgley J, Matthew AG, Greenwood CM, Logan AG. Effect of reduced dietary
sodium on blood pressure: a meta-analysis of randomised controlled trials. JAMA
1996;275:1590-1597.
21.
Deeks J, Altman D, Bradburn M. Ch 15: Statistical method for examining
heterogeneity and combining results from several studies in meta-analysis. In:
Egger M, Smith GD, Altman DG, editor. Systematic Reviews in Health Care: MetaAnalysis in Context. London: BMJ; 2001. p. 285-312.
22.
Lau J, Ioannidis J, Schmid C. Quantitative Synthesis in Systematic Reviews. In:
Series SR, editor. Academia and Clinic: Annals of Internal Medicine, American
College of Physicians; 1997. p. 820-821.
23.
Manser R, Irving L, Byrnes GB, Abramson M, Stone C, Campbell DC. Screening for
lung cancer (Cochrane Review). In: The Cochrane Library. Oxford: Update
Software; 2001.
24.
Gavaghan D, Moore R, McQuay H. An evaluation of homogeneity test in metaanalyses in pain using simulations of individual patient data. Pain 2000;85:415-424.
25.
Guyatt G, Sackett D, Sinclair J, Hayward R, Cook D, Cook R. Users' guide to the
medical literature: IX. A Method for Grading Health Care Recommendations. JAMA
1995;274(22):1800-1804.
26.
Oxman A. Systematic Reviews: Checklists for Review Articles. BMJ
1994;309(6955):648-651.
27.
Oxman A, Cook D, GH G. User's Guides to the Medical Literature: VI. How to Use
an Overview. JAMA 1994;272(17):1367-137.
28.
Thompson S. Systematic Review: Why sources of heterogeneity in meta-analysis
should be investigated. BMJ 1994;309:1351-1355.
29.
McAlister F. Chapter 19: Applying the results of systematic reviews at the bedside.
In: Egger M, Smith GD, Altman DG, editor. Systematic Reviews in Health Care:
Meta-Analysis in Context. London: BMJ; 2001. p. 373-385.
30.
Flather M, Farkouh M, Pogue J, Yusuf S. Strengths and Limitations of MetaAnalysis: Larger Studies May Be More Reliable. Controlled Clinical Trials
1997;18:568-579.
School of Population Health
94
EBP Workbook 05
31.
Cook D, Guyatt GH, Laupacis A, Sackett DL, Goldberg RJ. Clinical
recommendations using levels of evidence for anthithrombotic agents. Chest
1995;108(4 Suppl):227S-230S.
32.
The Cochrane Library. The Cochrane Library. In:. Issue 1 ed. Oxford: Update
Software; 2002.
33.
Hickner J, Bartlett, JG, Besser RE, Gonzales R, Hoffman JR, Sande MA. Principles
of appropriate antibiotic use for acute rhinosinusitis in adults: background. Annals of
Internal Medicine 2001;134:498-505.
34.
Lefebvre C, Clarke MJ,. Ch 4: Identifying randomised trials. In: Egger M, Smith GD,
Altman DG, editor. Systematic Reviews in Health Care: Meta-Analysis in Context.
London: BMJ; 2001. p. 69-86.
35.
Jadad A, Moore AR, Carroll D, Jenkinson C, Reynolds DJ, Gavaghan DJ, McQuay
HJ. Assessing the quality of reports of randomised clinical trials: Is blinding
necessary? Controlled Clinical Trials 1996;17:1-12.
5.9 Critical appraisal worksheets (systematic
reviews)
5.9.1 Systematic review (of therapy) worksheet
Citation
Are the results of this systematic review valid?
Did the systematic review
address a focused clinical
question?
Were the criteria used to select
articles for inclusion appropriate?
Is it likely that important, relevant
studies were missed?
School of Population Health
95
EBP Workbook 05
Was the validity of the included
studies appraised?
Were assessments of studies
reproducible?
Were the results similar from
study to study? (homogeneous)
What are the results?
What are the overall results?
School of Population Health
96
EBP Workbook 05
How precise were the results?
YOUR CALCULATIONS
Table: Clinically useful measures of the effects of treatment
Outcome
Control
Experimental
Relative
event rate
event rate (Y)
risk
(X)
reduction
RRR =
(X –Y)/X
Absolute
risk
reduction
ARR =
X–Y
Number
needed to
treat (NNT
= 1/ARR)
* Some reviews may use odds ratios for summary measures of effectiveness. The table
below can be used to calculate the NNT from the odds ratio if the expected patient event
rate is known.
Will the results help me in caring for my patient?
Can these results by applied to my patient care?
Is your patient so different
from those in the study that
its results cannot apply?
If subgroup analyses were
presented remember the
guidelines outlined for
assessing the reliability of
these.
Is the treatment feasible in
your setting?
School of Population Health
97
EBP Workbook 05
Were all clinically important
outcomes considered?
Are the likely treatment
benefits worth the potential
harms and costs?
When considering this
question you should take into
account your patient’s values
and preferences.
Additional Notes
School of Population Health
98
EBP Workbook 05
* Translating odds ratios to NNTs:
The numbers in the body of the tables are the NNTs for the corresponding odds ratio at
that particular patient's expected event rate (PEER).
When the odds ratio (OR) < 1
This table applies when a bad outcome is prevented by therapy.
Patient's expected event rate
(PEER)
a
b
c
d
0.05
0.10
0.20
0.30
0.40
0.50
0.70
0.90
OR < 1
0.9
0.8
0.7
0.6
0.5
2.09a
110
64
46
40
38
44
101c
69
36
20
14
12
11
13
27
52
27
14
10
9
8
9
18
41b
21
11
8
7
6
6
12d
104
54
30
22
19
18
20
46
The relative risk reduction (RRR) here is 10%
The RRR here is 49%
For any OR, NNT is lowest when PEER = 0.50
The RRR here is 9%
When the odds ratio (OR) > 1
This table applies both when a good outcome is increased by therapy and when a side
effect is caused by therapy.
Patient's expected event rate
(PEER)
0.05
0.10
0.20
0.30
0.40
0.50
0.70
0.90
OR > 1
1.1
1.2
1.3
1.4
1.5
212
112
64
49
43
42
51
121
71
38
22
17
16
15
19
47
54
29
17
13
12
12
15
38
43
23
14
11
10
10
13
32
School of Population Health
99
106
57
33
25
23
22
27
66
EBP Workbook 05
5.9.2
Sample from Critical Appraisal Skills Programme (CASP)
http://www.phru.nhs.uk/casp/appraisa.htm
School of Population Health
100
EBP Workbook 05
QuickTime™ and a
TIFF (LZW) decompressor
are needed to see this picture.
School of Population Health
101
EBP Workbook 05
QuickTime™ and a
TIFF (LZW) decompressor
are needed to see this picture.
School of Population Health
102
EBP Workbook 05
QuickTime™ and a
TIFF (LZW) decompressor
are needed to see this picture.
School of Population Health
103
EBP Workbook 05
6. DIAGNOSTIC TESTS
6.1 Learning objectives
1. To understand, and be able to calculate, the parameters that define diagnostic test
quality – sensitivity, specificity and likelihood ratio (which is derived from these) as well
as the “predictive values” of tests in populations with different prevalence of disease.
2. To understand the clinical uses of these parameters to rule-in or rule-out disease in
individual patients and groups.
3. To understand the concepts of pre- and post-test probability of disease and how they
are derived in clinical practice.
4. To understand and use a nomogram to define post-test probability of disease, given
the pre-test probability and likelihood ratio.
5. To understand the key questions for a critical appraisal of an article on diagnosis.
6.2 Core reading and key concepts
Introduction
Clinical Scenario
A 12-month old baby boy is brought to your surgery by his worried mother. The baby has
been feeding poorly, has fever, rhinorrhea and progressive cough for a week. What are
the possible causes of these symptoms and signs, and how would you refine the
probability of each of them?
As clinicians in this situation, we generate a differential diagnosis that includes the most
important possible causes, and then we use various pieces of information (eg history,
physical examination, clinical laboratory tests and radiographic studies) to help us refine
the probability of disease for each significant possible diagnosis.
Diagnostic test may include any type of information that could be helpful in making a
diagnosis, including history-taking and physical examination, but the term is usually
applied to ward, laboratory or imaging tests.
The usual reasons given for requesting diagnostic tests are: to identify the disease
responsible for a patient’s symptoms, to make better decisions about treatment, to give
patients more accurate information about prognosis and to monitor treatment and disease
progression.
The most important reason we request diagnostic tests is to refine the probability of the
presence or absence of disease. The results of diagnostic tests change the likelihood
of a particular diagnosis. We can improve our use of diagnostic tests by learning to apply
the evidence-based techniques of refining probability.
A useful equation for the use of diagnostic tests is:
What we think before the test + Test Information = What we think after
(Friedland 1998)
School of Population Health
104
EBP Workbook 05
Sensitivity and specificity, and likelihood ratio, which is derived from them, inform us about
the chance, in patients with or without the disease, that the test is positive or negative.
They define precisely how well a diagnostic test rules-in or rules-out the presence of
disease, but have limitations when applied in isolation to patients with different
probabilities of disease (Fletcher, Fletcher et al. 1988).
Using the pre-test probability of disease in combination with the likelihood ratio, clinicians
can calculate the post-test probability of disease, and thus make informed decisions as to
whether, and by how much, diagnostic tests improve diagnostic certainty for particular
groups or individuals (Halkin, Reichman et al. 1998).
The importance of this approach is emphasised by the finding that misdiagnosis rates
have not changed in major US teaching hospitals over the last four decades, despite an
explosion of sophisticated diagnostic technologies. Unnecessary testing also exposes
patients to unnecessary risks including false-positive diagnoses, and significantly
increases healthcare costs (Halkin, Reichman et al. 1998).
Pre-test probability estimates
"What we think before" and "What we think after" are estimates of the likelihood of
disease, and can be expressed in probability terms:
What we think before the test + Information about the test’s quality
= What we think after
OR Pre-test probability + Likelihood ratios = Post-test probability
pre-test probability = the probability that a patient has the disease before a test
is undertaken
post-test probability = the probability that a patient has the disease given the
result of a test
Estimates of pre-test probability can be generated from two sources:
• clinical data - derived from careful clinical assessment, which may include
previous test results for the patient, and personal experience
• published data - giving the prevalence of disease in a defined clinical setting
/population
• clinical prediction rules
Examples of Pre-test Probabilities are available from the NHS Centre for EBM:
http://163.1.96.10/docs/pretestprobsamples.html
Diagnostic test characteristics (test information)
Test information has traditionally been reported in terms of sensitivity, specificity and
predictive value. Likelihood ratios, derived from sensitivity and specificity, are useful to
refine the estimated probability of disease in our patients (Friedland 1998).
Sensitivity, Specificity and Predictive Values: the 2 x 2 Table
These test performance parameters are used to assess diagnostic tests that have only
two outcomes (+/-), and require that the population studied undergoes a “gold standard”
test to "rule-in" or "rule-out" disease (eg evaluating the diagnostic capabilities of
ultrasound for diagnosis gallstones in patients who all underwent cholecystectomy).
School of Population Health
105
EBP Workbook 05
TEST POSITIVE
DISEASE
POSITIVE
a
DISEASE
NEGATIVE
b
a+b
TEST NEGATIVE
True positive
c
False Positive
d
Total positive
c+d
False negative
a+c
True negative
b+d
Total without
disease
Total negative
a+b+c+d
Total with disease
Grand total
Sensitivity = probability of a positive test when disease is present
= a / (a+c)
Specificity = probability of a negative test when disease is absent
= d / (b+d)
Predictive Value = probability of disease, given the results of the test. This is
sometimes called the post-test probability of disease
• positive predictive value = probability of disease in patients with a positive
(abnormal) test result
= post-test probability of disease given a positive test)
= a / (a+b)
• negative predictive value = probability of no disease in patients with a
negative (normal) test result
= post-test probability of disease given a negative test
= d / (c+d)
Note:
Sensitivity, specificity and their derivative, likelihood ratio, are properties of tests,
while predictive values are functions of both of these and the prevalence of
disease in a group, or the chance (or probability) in an individual.
Interpreting test results using sensitivity, specificity and predictive values
Sensitivity and specificity describe the proportion of positive and negative test results in
populations when we already know who has the disease or not. In isolation, they are of
limited use in interpreting test results in the clinical setting, when we don’t know whether a
patient does, or does not have, the disease (Friedland et al, 1998).
• Tests with high sensitivity and/or high specificity are especially helpful:
- a highly sensitive test, when negative, rules out disease (SnNout)
- a highly specific test, when positive, rules in disease (SpPin)
- see examples at:
http://163.1.96.10/docs/spPinsnNoutsamples.html (NHS Centre for EBM)
- see Self-complete exercise 1
The predictive value is determined by the sensitivity and specificity of the test, and also
by the prevalence of disease in the population being tested. Predictive value, based
School of Population Health
106
EBP Workbook 05
on probability of disease in the group, is also of limited value in helping us refine
probability in a particular patient, who may have a different pre-test probability of disease.
• When prevalence of disease is relatively high (over several percent), a highly specific
test will perform well. But at lower prevalences, the positive predictive value drops to
almost zero, and the test becomes virtually useless for diagnosing disease, as a
positive test result is most likely to be a false positive.
Example: HIV testing in persons at extra-ordinary low risk of HIV disease
Likelihood Ratios
Diagnostic tests enable clinicians to revise the probability of disease, and to move from an
initial assessment of the probability of disease (pre-test probability) to determine the final
assessment of disease probability (post-test probability) Pre-test probability + Information about the test’s quality (Likelihood
Ratio) = Post-test probability
Likelihood ratios are derived from sensitivity and specificity. The advantages of the
likelihood ratio approach are:
• Likelihood ratios can deal with tests with more than two possible results (not just
normal/abnormal).
• The magnitude of the likelihood ratio give intuitive meaning as to how strongly a given
test result will raise (rule-in) or lower (rule-out) the likelihood of disease.
• Likelihood ratios are more easily applied to a series of diagnostic tests.
• Likelihood ratios can be easily used to determine post-test “odds” and with a
nomogram to determine post-test “probability” (chance).
LR definitions
• defines how much a positive or negative test result modifies the probability of
disease, and is expressed as a ratio:
LR
=
probability of the test result in a patient with the disease
probability of the test result in a patient without the disease
• positive and negative likelihood ratios are defined as:
probability of a positive test result in a patient with the disease
LR+ = probability of a positive test result in a patient without the disease
probability of a negative test result in an individual with the disease
LR- = probability of a negative test result in an individual without the disease
Effect of the value of a likelihood ratio on post-test probability of disease
• LRs range from 0 to infinity
• A value of 1 means the test provides no additional information.
• Ratios above 1 increase the likelihood of disease
• Ratios below 1 decrease the likelihood of disease
• LRs greater than 10 or less than 0.1 generate large and often conclusive changes
from pre-test to post-test probability
• LRs of 5 to 10 and 0.1 to 0.2 generate moderate shifts in pre-test to post-test
probability
• LRs of 2 to 5 and 0.5 to 0.2 generate small (but sometimes important) changes in
probability
• LRs of 1 to 2 and 0.5 to 1 alter probability to a small (and rarely important) degree
School of Population Health
107
EBP Workbook 05
Examples of LRs
http://163.1.96.10/docs/likeratsamples.html (NHS Centre for EBM)
http://www.cebm.utoronto.ca/glossary/lrs.htm#table (University of Toronto Centre for
EBM)
Printable version: http://www.cebm.utoronto.ca/glossary/lrsPrint.htm
Likelihood ratio, sensitivity and specificity
•
LR+ and LR- are defined in terms of sensitivity and specificity:
LR+ = sensitivity/(1-specificity) OR true+ve /false+ve
LR- = (1-sensitivity)/specificity OR false-ve /true-ve
(see self-complete Exercise 3)
•
Interactive Calculators for diagnostic test 2 x 2 tables to estimate sensitivity,
specificity, positive predictive value, negative predictive value and likelihood ratio
are available at the following websites:
NHS Centre for EBM
http://163.1.96.10/docs/scratchingpost.html
http://163.1.96.10/docs/2x2table.html
AND
University of Toronto Centre for EBM
http://www.cebm.utoronto.ca/practise/ca/statscal/
A palm version of this calculator is downloadable from:
http://www.cebm.utoronto.ca/palm/ebmcalc/
Using likelihood ratios with a nomogram
• Where the LR and pre-test probability are known, a nomogram can be used to
simply determine the post-test probability
School of Population Health
108
EBP Workbook 05
•
An easy-to-use interactive nomogram is available from the NHS Centre for EBM:
http://163.1.96.10/docs/nomogram.html
Using likelihood ratios and odds
•
The product of the LR and the pre-test odds determines post-test odds. Simple
calculations are used to convert odds to probability:
Post-test odds = Pre-test odds x LR
Odds = Probability / (1- Probability)
Probability = Odds / (1+ Odds)
•
Use of the nomogram saves having to convert odds to probability and probability to odds
Using likelihood ratios for multiple tests
•
The likelihood ratio method can take into account test results at multiple different
levels of severity (see Self-complete exercise 5)
•
It is also easy to calculate post-test odds after a series of diagnostic tests:
Post-test Odds = Pre-test Odds x LR1 x LR2 x LR3 ... x LRn
School of Population Health
109
EBP Workbook 05
6.3 Other useful concepts
Accuracy
Proportion of all test results, both positive and negative, that are correct.
Reproducibility
Refers to the repeatability, consistency, or stability of a measure or a test from one
occasion to another. Tests may not always give the same result for a variety of reasons
eg. test variability and observer interpretation.
Intra- and inter-observer agreement
Where tests involve observer interpretation, tests should be evaluated for a summary
measure of observer variability.
This involves measuring agreement between repeat observations made by the same and
between different observers.
The Kappa statistic is the usual measure of the percent agreement between raters that
occurs beyond chance. (see also 5.2)
Spectrum composition
Note that the sensitivity and/or specificity of a test are not always constant, but may also
depend on the characteristics of the population studied. Diagnostic test evaluation should
include data on age distribution, sex distribution, summary of presenting clinical symptoms
and /or disease stage, and eligibility criteria for study subjects, etc.
Bias
Bias may occur if the test result and disease status are not established independently of
each other.
Work-up bias
• in some circumstances the result of the test may influence the subsequent
diagnostic work-up needed
eg. negative test result - additional necessary diagnostic tests not requested
Diagnostic-review bias
• the test result may affect the use of data to establish diagnosis, which can lead to
under and/or over diagnosis
Test-review bias
• test result interpretation occurs after diagnosis established
eg. after “gold standard” test result known
Incorporation bias
• result of test is incorporated into evidence used to establish diagnosis of disease.
The evidence used to establish the true diagnosis must be independent of the
test result
School of Population Health
110
EBP Workbook 05
6.4. Evaluating and applying the results of an
article about diagnosis
Table 2: Evaluating and Applying the Results of an Article about Diagnosis
(Guyatt, Sackett et al. 1993)
Are the results of the study valid?
Primary guides:
Was there an independent, blind comparison with a reference standard?
Did the patient sample include an appropriate spectrum of patient to whom the
diagnostic test will be applied in clinical practice?
Secondary guides:
Did the results of the test being evaluated influence the decision to perform the
reference standard?
Were the methods for performing the test described in sufficient detail to permit
replication?
What were the results?
Are likelihood ratios for the test results presented or data necessary for their
calculation provided?
Will the results help me in caring for my patients?
Will the reproducibility of the test result and its interpretation be satisfactory in my
setting?
Are the results applicable to my patient?
Will patients be better off as a result of the test?
Worked example of an article about diagnosis
Introduction: the clinical problem
You are a general practitioner. A 68-year old male patient consults you with a history of
increasing localised back pain. He is an ex-smoker and has a history of mild asthma.
Three weeks previously, he had presented with right upper quadrant pain, and some
shortness of breath. An ultrasound showed no right upper quadrant abnormality, and a
review of his records showed a normal chest x-ray taken 12 months previously. The pain
has continued and has localised to the lower back.
The patient’s weight is stable. Full blood count, routine biochemistry are normal, and ESR
is 22mm/hour. An x-ray of the thoraco-lumbar spine shows degenerative changes only.
The patient’s pain continues over the next two months. Although controlled with
medication, you are concerned about a non-mechanical cause of his pain. You are aware
that plain x-rays are not “very good” for detecting cancer, but have no idea exactly what
value they have. You feel you may have been falsely reassured by the normal x-ray, and
wonder about the significance of his clinical and laboratory findings.
You formulate the following question: In a middle aged man with back pain (the patient), to
what extent do plain x-rays (the intervention) change the probability that cancer (the
clinical outcome) is present, in comparison to clinical findings (the comparison
intervention)?
School of Population Health
111
EBP Workbook 05
You conduct a MEDLINE Search (OVID, 1966 to February 2002). You enter back-paindiagnosis, which yields 563 entries. You also enter “sensitivity or specificity” and combine
this with the previous search, yielding 8 studies. The most promising of these: “What can
the history and physical examination tell us about low back pain” (Deyo and al, 1992),
refers to an original study looking at diagnostic strategies for patients with cancer and
back pain.
Deyo RA, Diehl AK. Cancer as a cause of back pain: frequency, clinical
presentation, and diagnostic strategies. J Gen Intern Med 1988;3:230-8.
This study is reprinted here. The index terms sensitivity and specificity did not appear n
the abstract or keywords, highlighting how indexing may limit the value of MEDLINE,
requiring other strategies to find the best evidence.
Abstract
Question: In a middle-aged man with back pain (the patient), to what extent do plain xrays (the intervention) change the probability that cancer (the clinical outcome) is present,
in comparison to clinical findings (the comparison intervention)?
Design: Prospective study to define sensitivity, specificity and likelihood ratios for clinical
and diagnostic test findings in a large series of patients with back pain.
Patients: 1975 indigent patients, aged 15-86, attending a walk-in primary care clinic in
Seattle, with a chief complaint of back pain.
Main outcome measure: Identification of cancer as the cause of back pain was
performed by follow-up as performed through the regional cancer registry at least 6
months after the first visit.
Main results: 54% were seeking medical care for back pain for the first time. 76% had
had pain for less than three months, and 84% had low back pain. The prevalence of
underlying cancer was low, with thirteen patients (0.66%) found to have cancer as the
cause of their back pain.
Patients with underlying malignancies often had few suggestive signs. Findings
significantly associated with underlying cancer (p< 0.05) were: age greater than or equal
to 50 years, previous history of cancer, duration of pain greater than 1 month, failure to
improve with conservative therapy, elevated erythrocyte sedimentation rate (ESR), and
anaemia.
Conclusion: The authors have developed an algorithm combining historical features and
ESR results. With suggestive clinical features, an elevated EST should prompt
radiography. In the face of suggestive clinical findings and an elevated ESR, a negative
spine x-ray should be interpreted with caution.
In this patient group, use of the algorithm would have limited x-ray utilisation to just 22% of
subjects while recommending an x-ray for every cancer patient. It would further suggest
which patients with negative x-ray findings require further work-up.
School of Population Health
112
EBP Workbook 05
Are the results of the study valid?
Was there an independent, blind comparison with a reference standard?
The reference standard was registry identified cancer diagnosis. The tumour registry
included every patient with a histologic diagnosis of cancer made in the local public area
health system. While this method would fail to identify cancer patients who sought care
outside this area health system, patients attending the walk-in clinic say they do not attend
other area clinics, and are also highly likely at attend the local public hospital for complex
illnesses.
It is possible however, that patients in this population might have left the area, and had
cancer diagnosed elsewhere. The effect of such a bias would be to weaken the link
between positive test results and diagnosis, but could potentially overestimate the link
between a negative test result and no diagnosis of cancer.
Did the patient sample include an appropriate spectrum of patients to whom the
diagnostic tests will be applied in clinical practice?
The study population was composed of poor, self-referred Mexican Americans, Hispanics
or black Americans. This study population would not be exactly comparable to patients
with back pain seen in most Australian general practices. You would expect it to have a
similar spectrum of disease, but realise that this population could have higher prevalences
of (work-related) injury and/or cancer as causes of back pain.
Tests were applied to approximately two thirds of all back pain patients presenting during
the study period, but patients presenting at night and weekends were less represented
than those presenting during daylight hours. Such patients may be “sicker” and are less
likely to be shift workers.
Not all patients received every diagnostic test, with “sicker“ patients more likely to have
tests. Abnormal results among non-cancer patients may therefore be inflated.
Given these limitations and the lack of studies on other populations, you decide that the
tests were applied to an acceptable spectrum of patients.
What were the results?
The diagnostic value for clinical and laboratory findings are presented in terms of
sensitivity, 1-specificity, and LR (Deyo and Diehl, Tables 2 and 3).
A previous history of cancer had the highest LR of 14.7, and the presence of this finding
would greatly increase the probability of cancer. Other findings, which increased the
probability of cancer to a modest degree (LRs of 2-3), were unexplained weight loss,
failure to improve after a previous visit in the last month, and age over 50.
For test results, an ESR>100 mm Hg had a LR of 55, and the presence of a lytic and
blastic lesion on x-ray had a LR of 120. The presence of these findings would greatly
increase the probability of cancer as the cause of back pain, whatever the pre-test
probability of cancer.
Will the results help me in caring for my patients?
School of Population Health
113
EBP Workbook 05
To apply the results to your patient, your review your notes, and decide that the pre-test
probability of cancer was about 10% on the patient’s initial presentation, increasing to
about 25%, following the patient’s last visit. (You notice this approximates to the shift in
probability expected when you use the nomogram and apply a LR of 3 for the clinical
feature “failure to improve over a month”.)
How does a negative spine x-ray result change the probability of cancer as the cause of
back pain in your patient? You calculate the LR of a normal x-ray using data on sensitivity
and specificity from Table 3 for “either compression fracture or lytic / blastic lesion”:
LR-ve = (1-sensitivity / specificity) = 0.3/0.95, giving a LR of 0.3.
Using the nomogram you see how the meaning of the test result depends on the pre-test
probability of disease:
pre-test probability of 10% : LR of 0.3 reduces post-test probability to <5%, which you
are happy to accept
pre-test probability of 25% : LR of 0.3 reduces post-test probability to about 10%,
which is not a figure that totally reassures you that all is well
You decide that plain films have falsely reassured you in this patient. In future you might
refer such a patient to a specialist or choose more sensitive investigations.
You may feel concerned about the precision of assigning a pre-test probability. The
nomogram is useful for deciding at what probability level we would make or not make a
particular management decision. For example in this patient, you might have requested
an MRI examination if the probability of cancer was above 5%, and have been happy to
wait and see if it was below this. With pre-test probabilities above 10%, the post-test
probability of disease, given a negative x-ray, would be higher than our threshold for
action. So a precise estimate of pre-test probability is not necessary – just a
reasonable estimate, the kind of estimate, which underpins our decisions on a daily
basis.
6.5 Self-complete exercises
Exercise 1:
Calculating sensitivity and specificity for a dichotomous test result
Davie et al assessed the test performance of key symptoms and signs for diagnosis of
congestive heart failure (CHF) (Davie, Caruana et al. 1997).
Below are 2 x 2 tables relating to the symptom of "dyspnea on exertion" (DOE) and the
sign "gallop (S3) murmur".
Calculate sensitivity and specificity for each test.
Test = DOE
CHF
no CHF
School of Population Health
114
EBP Workbook 05
DOE
41
183
no DOE
0
35
Total with disease
Total without
disease
Total
positive
Total
negative
Grand total
Test = S3 murmur
CHF
NO CHF
S3 murmur
10
3
no S3 murmur
31
215
Total with disease
Total without
disease
Total
positive
Total
negative
Grand total
Methodology for evaluating a 2 x 2 Table
http://gim.unmc.edu/dxtests/howto.htm
Disease Present
Disease Absent
Test Positive
TP
FP
Test Negative
FN
TN
Total with disease
Total without
disease
Total
positive
Total
negative
Grand total
Multiply the Grand total by the Pre-test probability to get the Total with disease.
Compute the Total without disease by subtraction.
Multiply the Total with disease by the Sensitivity to get the number of True positives.
Multiply the Total without disease by the Specificity to get the number of True
Negatives.
Compute the number of False positives and False negatives by subtraction.
Compute the Total positive tests and Total negative tests by addition across the rows.
Predictive value of a positive test is True positives divided by Total positive tests.
Predictive value of a negative test is True negatives divided by Total negative tests.
Exercise 2:
Calculating predictive values /post-test probability for a dichotomous test result
Consider the use of the ANA (antinuclear antibody) test in the diagnosis of SLE (systemic
lupus erythematosus). In a hypothetical rheumatology practice of 100,000 patients, the
prevalence of SLE in patients on whom an ANA test was done was 2.88%. The sensitivity
of the ANA for SLE is 98% and the specificity is 93%. A patient from this practice has a
positive ANA test.
School of Population Health
115
EBP Workbook 05
Disease Present
Disease Absent
Test Positive
TP
FP
Test Negative
FN
TN
Total with
disease
Total without
disease
Total
positive
Total
negative
Grand
total
Use the methodology for evaluating a 2 x 2 table to determine:
How many patients in the practice have SLE?
How many patients do not have SLE?
The TP, FN, FP, TN patient numbers for the practice.
How many patients test positive and negative for ANA?
What is the post-test probability of SLE, given the patient's positive test result?
Exercise 3:
Calculating Likelihood Ratios (LRs) from sensitivity and specificity
Using the data from Exercise 2, calculate the likelihood ratio for a positive test
result.
Exercise 4:
Calculating LRs & post-test probability for tests with more than 2 possible results
Likelihood ratios work well for tests with multiple qualitative results such as a ventilation
perfusion (V/Q) scan which can be interpreted as normal, low probability, intermediate
probability, and high probability of pulmonary embolism. For example, the PIOPED Study
(JAMA 1990;263:2753-2759) compared the V/Q scan with angiography and reported the
following data:
School of Population Health
116
EBP Workbook 05
Scan Category
High probability
Sensitivity %
41
Specificity %
97
High or intermediate
82
52
probability
High, intermediate or low
98
10
probability
A patient with a 30% pre-test probability of pulmonary embolism has an intermediate
probability V/Q scan.
Calculate the likelihood ratio for a high or intermediate probability scan from the
sensitivity and specificity data.
Use the nomogram to determine the post-test test probability of disease for this
patient.
This result, however, is not the best use of the available data because it lumps the high
probability and intermediate probability scans together so that a sensitivity and specificity
can be reported. The paper also lists the raw data by individual test category.
Scan Category
High probability
Intermediate probability
Low probability
Normal or near normal
Total
PE Present
PE absent
102
105
39
5
251
14
217
199
50
480
From these data (shown below in the two left columns), calculate the likelihood
ratio for each test result.
Now using the nomogram, determine the post-test probability for the patient with a
30% pre-test probability and an intermediate probability scan.
Exercise 5:
Predicting pre-test probability and calculating predictive values /post-test
probability
School of Population Health
117
EBP Workbook 05
Case Scenarios
Patient A is a 55-year old mildly hypertensive man with a 4-week history of substernal
pain that radiates to his neck, lower jaw and down the inner aspect of his left arm. It is
precipitated by climbing stairs or waking uphill, and disappears after 3 to 5 minutes of
rest. He had a mild episode while undressing for his examination. You think he has an
S4 gallop. You decide he has classic angina and consider requesting an exercise ECG
to confirm the diagnosis.
Patient B is a 35-year old man, who is otherwise healthy and has no coronary risk
factors. He has had ‘heartburn’ for years and now reports a 6-week history of nonexertional, squeezing pain deep to his lower sternum and epigastrium, usually radiating
straight through to his back. It is most likely to occur when he lies down after a heavy
meal. The remainder of his history and physical examination are negative. You think
that his pain reflects oesophageal spasm and will pursue that diagnosis, but judge that
an exercise ECG will rule out significant coronary disease and thus resolve the
uncertainty for both of you.
Patient C is a 45-year old man with a negative past history and no coronary risk factors
save a pack-a-day cigarette habit. He reports a 3-week history of pre-cordial and
substernal pain, usually fleeting and of a stabbing quality. You find a costochondral
junction that is slightly tender, but pressing it does not reproduce the pain. You
conclude that he may have a typical angina and wonder if an exercise ECG would help.
A common problem in internal medicine is deciding how to manage the ambulatory patient
with chest pain. The hypothesis list usually includes coronary artery disease and an
exercise ECG is often considered to help with the diagnosis. A positive exercise test will
suggest coronary artery disease and lead to an angiogram and negative exercise test will
reassure the patient and direct our diagnostic effort elsewhere. Or will it?
Bartel et al. (1974) have looked at the relationship between graded exercise tests and
angiographically documented coronary heart disease. The patients in the study had a
variety of chest pain syndromes and underwent both exercise electrocardiography and
coronary angiography. One mm of ST-segment depression or more was selected as a
cut-off for a positive exercise ECG. Angiography was taken as the “gold standard: (that is,
proof that the disease was present).
350 patients were studied, of which 137 had 70% coronary artery stenosis by angiography
after having a positive exercise ECG. 11 did not have significant stenosis following
positive test. Of those patients who had a negative exercise ECG (ST depression <1mm),
90 had at least 70% coronary artery stenosis on angiography and 112 had no significant
coronary disease.
School of Population Health
118
EBP Workbook 05
1.
Display the above information in the 2 x 2 table now.
positive
70% coronary artery stenosis by
angiogram
present
absent
a
b
total
negative
c
total
exercise ECG
d
total
2.
total
The sensitivity of a test indicates the probability of finding an abnormal
result in a diseased patient. What is the sensitivity of an exercise ECG in
detecting significant coronary artery disease based on the above study?
3.
The specificity of a test indicates the probability of finding a normal result in a
patient without the disease. What is the specificity of an exercise ECG in
detecting significant coronary artery disease based on the above study?
4.
Now consider the accompanying case scenarios. Estimate the pre-test
probability of significant coronary artery narrowing in each of the three
patients:
Patient A:
Patient B:
Patient C:
5.
Which patient is going to benefit the most from having an exercise ECG?
One way of thinking about this to compare the pre-test probability of the patient having the
disease with the post-test probability. Let’s work through the exercise for each of the
patients.
School of Population Health
119
EBP Workbook 05
6.
Patient A:
Assume the pre-test probability is 90%. If you have 1000 patients with the same
presentation as Patient A, 900 will have coronary artery disease and 100 will not.
Assuming that the exercise ECG has the sensitivity and specificity as established by the
paper by Bartel et al, complete the following table:
positive
70% coronary artery stenosis by
angiogram
present
absent
a
b
total
negative
c
total
exercise ECG
d
total
900
total
100
1000
a.
The positive predictive value (or post-test probability) is the proportion of patients
with a positive test result who actually have the disorder. What is the positive
predictive value for the matrix above?
b.
What is the chance that the patient has coronary artery disease if the test is
negative?
c.
What is the percentage change between the pre-test and post-test probabilities?
Comment on the benefit of doing an exercise ECG in Patient A.
7.
Patient B:
Assume the pre-test probability is 5%. If you have 1000 patients with the same
presentation as Patient B, 50 will have coronary artery disease and 950 will not.
Assuming that the exercise ECG has sensitivity and specificity as established by paper by
Bartel et al, complete the following table:
School of Population Health
120
EBP Workbook 05
positive
70% coronary artery stenosis by
angiogram
present
absent
a
b
total
negative
c
total
exercise ECG
d
total
50
total
950
1000
a.
The positive predictive value (or post-test probability) is the proportion of patients
with a positive test result who actually have the disorder. What is the positive
predictive value for the matrix above?
b.
What is the chance that the patient has coronary artery disease if the test is
negative?
c.
What is the percentage change between the pre-test and post-test probabilities?
Comment on the benefit of doing an exercise ECG in Patient B.
8.
Patient C:
Assume the pre-test probability is 50%. If you have 1000 patients with the same
presentation as Patient C, 500 will have coronary artery disease and 500 will not.
Assuming that the exercise ECG has the sensitivity and specificity as established by the
paper by Bartel et al, complete the following table:
positive
70% coronary artery stenosis by
angiogram
present
absent
a
b
total
negative
c
total
exercise ECG
d
total
500
a.
total
500
1000
The positive predictive value (or post-test probability) is the proportion of patients
with a positive test result who actually have the disorder. What is the positive
predictive value for the matrix above?
School of Population Health
121
EBP Workbook 05
b.
What is the chance that the patient has coronary artery disease if the test is
negative?
c.
What is the percentage change between the pre-test and post-test probabilities?
Comment on the benefit of doing an exercise ECG in Patient C.
Exercise 6:
Critical appraisal of an article about diagnosis
Scenario
You are a resident looking after an emergency department patient with suspected
pulmonary embolism. Helical CT, combined with other investigations, is commonly
performed in your hospital for investigation of pulmonary embolism, but you are unsure of
its accuracy and its role.
You have found the American College of Physicians (ACP) Journal Club site very useful
for quickly consulting evidence on a subject, and do a basic search using terms
“pulmonary embol*” and “CT”. This yields commentaries on 4 articles, of which 2 look
particularly relevant.
The first comments on a review article on the accuracy of helical CT. This states that the
accuracy of helical CT for diagnosis of pulmonary embolism (PE) in symptomatic patients
has not been adequately evaluated. Previous studies looking at this question have
suffered from selection, workup and diagnostic-review biases, and have shown wide
variations in sensitivity and specificity. Two recent reviews did not find one study that
satisfied the basic methodological criteria necessary for the results to be regarded as valid
(ACP Journal Club. 2000 July-Aug;133:33:
http://www.acpjc.org/Content/133/1/ISSUE/ACPJC-2000-133-1-033.htm )
The second commentary applies to the paper: Perrier A, Howarth N, Didier D, et al.
Performance of helical computed tomography in unselected outpatients with suspected
pulmonary embolism. Ann Intern Med. 2001 Jul 17;135:88-97. This paper provides valid
results for evaluation of helical CT’s accuracy, and commentary on its role in combination
with other investigations.
Use the worksheet below to undertake a critical appraisal of this paper.
School of Population Health
122
EBP Workbook 05
Diagnostic worksheet
Citation
Are the results of this diagnostic study valid?
Was there an independent,
blind comparison with a
reference ("gold") standard of
diagnosis?
Was the diagnostic test
evaluated in an appropriate
spectrum of patients (like those
in whom it would be used in
practice)?
Was the reference standard
applied regardless of the
diagnostic test result?
Were the methods for
performing the test described in
School of Population Health
123
EBP Workbook 05
sufficient detail to permit
replication?
What were the results?
Are Likelihood Ratios for the
test results presented or data
necessary for their calculations
(ie. sensitivity and specificity)
provided?
School of Population Health
124
EBP Workbook 05
Are the valid results of this diagnostic study important?
YOUR CALCULATIONS
Target Disorder
Present
Absent
Totals
Positive
Diagnostic
test result
a b
a+b
Test Negative
c d
a+c b+d
Totals
c+d
a+b+c+d
Can you apply this valid, important evidence about a diagnostic test in caring for
your patient?
Is the diagnostic test available,
affordable, accurate, and
precise in your setting?
Can you generate a clinically
sensible estimate of your
patient's pre-test probability
(from personal experience,
prevalence statistics, practice
databases, or primary studies)?
Are the study patients similar to
your own?
Is it unlikely that the disease
possibilities or probabilities
have changed since the
evidence was gathered?
Will the resulting post-test
School of Population Health
125
EBP Workbook 05
probabilities affect your
management and help your
patient?
Could it move you across a testtreatment threshold? Would
your patient be a willing partner
in carrying it out?
Would the consequences of the
test help your patient?
Additional Notes
School of Population Health
126
EBP Workbook 05
6.6 Answers to self-complete exercises
Exercise 1:
Calculating sensitivity and specificity for a dichotomous test result
Note
Test = DOE
Sens = 41/(41+0) = 100%
Spec = 35/(183+35) = 17%
If a patient does not complain of dyspnea on exertion, it is very unlikely that
they have CHF (0 out of 41 patients with CHF did not have this symptom).
• A highly sensitive test, when negative, rules out disease (SnNout)
• The acronym "SnNout" is taken from the phrase: "Sensitive test when
Negative rules Out disease"
Note
Test = Gallop murmur
Sens = 10/41 = 24%
Spec = 215/218 = 99%
Thus, if a patient has a gallop murmur, they probably have CHF (10 out of 13).
A highly specific test, when positive, rules in disease (SpPin)
The acronym "SpPin" is taken from the phrase: "Specific test when Positive
rules In disease"
Exercise 2:
Calculating predictive values /post-test probability for a dichotomous test result
Disease Present
Test Positive
Test Negative
Disease Absent
2822
6798
9620
58
90322
90380
2880
97120
100,000
Post-test probability of SLE, for the patient's positive test result
= 2822/9620 = 0.293
Exercise 3:
Calculating likelihood ratios from sensitivity and specificity
probability of a positive test result in a patient with the disease
LR+ = probability of a positive test result in a patient without the disease
School of Population Health
127
EBP Workbook 05
LR+
= sensitivity/(1-specificity)
= 98/5= 14
LR-
= (1-sensitivity)/specificity
= 2/93 = 0.02
Exercise 4:
Calculating Likelihood Ratios and post-test probability for tests with more than two
possible results
Calculate the LR for a high or intermediate probability scan from the sensitivity and
specificity data.
LR+ = sensitivity/(1-specificity)
= 82/48 = 1.7
Use the nomogram to determine the post-test test probability of disease for this
patient.
Post-test probability = 0.4
From these data (shown below in the two left columns), calculate the LR for each
test result.
For high probability: LR+ = (102/251) / (14/480) = 13.9
Scan Category
PE Present
PE absent
Likelihood Ratio
High probability
102
14
13.9
Intermediate
probability
Low probability
105
217
0.93
39
199
0.37
Normal or near
normal
Total
5
50
0.19
251
480
Note
Now using the nomogram, determine the post-test probability for the patient with a
30% pre-test probability and an intermediate probability scan.
Post-test probability = 0.3
This post-test probability is lower than that previously obtained because we are
using all of the information in the data we have available. The LR approach
allows us to work with individual test results without having to choose an
arbitrary cut point by which to dichotomise the results into "positive" and
"negative." Also notice again, the intuitive value of the likelihood ratio number.
An intermediate probability scan has a LR very close to 1. This means that
intermediate probability scans should not appreciably change your pre-test
diagnostic suspicion.
School of Population Health
128
EBP Workbook 05
Exercise 5:
Predicting pre-test probability and calculating predictive values /post-test
probability
1.
Display the above information in the 2 x 2 table now.
positive
exercise ECG
negative
70% coronary artery stenosis by
angiogram
present
absent
a
b
137
11
c
d
90
112
total
total
227
123
total
148
total
202
350
3.
The sensitivity of an exercise ECG in detecting significant coronary artery
disease
= a/a+c = 137/ (137+90) = 137/227 = 60%
4.
The specificity of an exercise ECG in detecting significant coronary artery
disease
= d/b+d = 112/ (11+112) = 91%
The pre-test probability of significant coronary artery narrowing in each of the
three patients:
5.
6.
Patient A:
90%
Patient B:
5%
Patient C:
50%
Which patient is going to benefit the most from having an exercise ECG?
Patient C
Patient A:
positive
exercise ECG
negative
70% coronary artery stenosis by
angiogram
present
absent
a
b
540
9
c
d
360
91
total
total
900
100
The positive predictive value = a/a+b = 540/(540+9)= 98%
School of Population Health
129
total
549
total
451
1000
EBP Workbook 05
What is the chance that the patient has coronary artery disease if the test is
negative?
= 360/451 = 80%
What is the percentage change between the pre-test and post-test probabilities?
+ 8%
Comment on the benefit of doing an exercise ECG in Patient A.
No benefit - a negative test doesn't rule out CAD. Little extra information by
doing the test
7.
Patient B:
positive
exercise ECG
negative
70% coronary by
artery stenosis angiogram
present
absent
a
b
30
86
c
d
20
864
total
total
50
950
total
116
total
884
1000
The positive predictive value = a/a+b = 30/(30+86)= 26%
What is the chance that the patient has coronary artery disease if the test is
negative?
= 20/884 = 2%
What is the percentage change between the pre-test and post-test probabilities?
2%
Comment on the benefit of doing an exercise ECG in Patient A.
Little benefit in doing the test. High false positive rate.
8.
Patient C:
70% coronary artery stenosis by
angiogram
positive
exercise ECG
negative
present
a
300
c
200
total
500
absent
b
45
d
455
total
500
The positive predictive value = a/a+b = 300/345 = 87%
School of Population Health
130
total
345
total
655
1000
EBP Workbook 05
What is the chance that the patient has coronary artery disease if the test is
negative?
= 200/655 = 31%
What is the percentage change between the pre-test and post-test probabilities?
+ 37%
Comment on the benefit of doing an exercise ECG in Patient A.
Largest shift - largest benefit
Exercise 6:
Critical appraisal of an article about diagnosis
Diagnostic worksheet
Citation
Perrier A, Howarth N, Didier D, et al. Performance of helical computed tomography in
unselected outpatients with suspected pulmonary embolism. Ann Intern Med. 2001 Jul
17;135:88-97.
Are the results of this diagnostic study valid?
All 299 patients presenting to an emergency department
with suspected pulmonary embolus and a plasma D-dimer
level > 500 µg/L, had a blinded comparison of helical CT
with a validated diagnostic algorithm.
Was there an independent,
blind comparison with a
reference ("gold") standard of
diagnosis?
This algorithm used standard diagnostic techniques to
make a definitive diagnosis of PE (the gold standard):
Patients were considered to have PE if they had a positive
pulmonary angiographic result, a high-probability lung scan
result, or deep venous thrombosis detected by
compression ultrasonography - at presentation or 3-month
follow-up.
Was the diagnostic test
evaluated in an appropriate
spectrum of patients (like those
in whom it would be used in
practice)?
Yes.
Patients comprised a consecutive series of emergency
patients, with a broad spectrum of patient characteristics
and clinical probability of PE (detailed in Table1). There
were no significant differences between included and
excluded patients for demographic and risk factors, nor for
clinical presentation and clinical probability for PE.
Prevalence of PE in groups with low, intermediate and high
probability was appropriate.
Proportion of inconclusive scans was appropriate.
Was the reference standard
Yes.
School of Population Health
131
EBP Workbook 05
applied regardless of the
diagnostic test result?
All 299 patients had helical CT scans. Scans were deidentified, were withheld from clinicians, and were read
after 3 months by radiologists blinded to all clinical data
and the results of the standard tests. These standard tests
were interpreted without knowledge of CT scan results.
Inter-observer agreement between 3 radiologists was
calculated.
Were the methods for
Yes.
performing the test described in
sufficient detail to permit
Helical CT was done on pulmonary arteries up to and
replication?
including the segmental vessels from the level of the aortic
arch to the lowest hemidiaphragm. Non-ionic contrast
material was injected, and a subspecialty-trained chest
radiologist scored each vessel for the presence or absence
of clot.
What were the results?
Are LRs for the test results
The prevalence of PE in the study population was 39%.
presented or data necessary for
their calculations provided?
Inter-observer agreement among 3 radiologists was high (κ
= 0.82 to 0.90). 12 CT scans were inconclusive. The
sensitivity of CT was 70% (95% CI 62 to 78), and the
specificity was 91% (CI 86 to 95). LRs for positive,
negative, and inconclusive CT results are tabulated below.
Are the valid results of this diagnostic study important?
For patients with conclusive results:
Target Disorder
Present
Absent
81
15
a b
35
156
c d
a+c b+d
116
171
Positive
Diagnostic
test result
Test Negative
Totals
Totals
96
a+b
191
c+d
a+b+c+d
287
Can you apply this valid, important evidence about a diagnostic test in caring for
your patient?
Is the diagnostic test available,
affordable, accurate, and
precise in your setting?
Helical CT is available in most hospitals where
patients are likely to present with PE. The
procedure is expensive for both public and private
School of Population Health
132
EBP Workbook 05
healthcare providers, and there will be cost
savings through elimination of unnecessary
testing.
For patients with conclusive results, sensitivity of helical
CT was 70%, and specificity was 91%. The use of more
stringent diagnostic criteria did not change the sens and
spec. The likelihood of false positive results increased as
the site of diagnosed embolus moved peripherally.
The sensitivity is too low to rule out PE without additional
tests. Where isolated thrombi are diagnosed at the
segmental level and there is a low clinical probability of
disease, diagnosis is uncertain. Patients with an
inconclusive disease should undergo further tests.
Not relevant
Can you generate a clinically
sensible estimate of your
patient's pre-test probability
(from personal experience,
prevalence statistics, practice
databases, or primary studies)?
Are the study patients similar to
your own?
Is it unlikely that the disease
possibilities or probabilities
have changed since the
evidence was gathered?
See additional notes
Will the resulting post-test
probabilities affect your
management and help your
patient? Could it move you
across a test-treatment
threshold? Would your patient
be a willing partner in carrying it
out?
Would the consequences of the In patients presenting to the emergency department
test help your patient?
with suspected pulmonary embolism, a positive helical
computed tomographic result indicated a moderate
increase in the probability of pulmonary embolism, but
a negative result indicated only a small decrease in
probability.
Additional Notes
Source:
ACP Journal Club. 2002 Jan-Feb;136:30
http://www.acpjc.org/Content/136/1/ISSUE/ACPJC-2002-136-1-030.htm or access
through ‘Clinician’s Health Channel’ or through your hospital library
School of Population Health
133
EBP Workbook 05
The study by Perrier and colleagues is important because it extends our understanding of
the ability of helical CT to diagnose or rule out PE. Through careful attention to
minimization of selection, workup, and diagnostic-review biases, the authors largely
succeeded in overcoming the methodologic flaws that have hampered previous attempts
(1,2).
As with lung scanning (3), helical CT is less accurate than many believe. For example, a
patient with a 50% pre-test probability of PE and a negative CT result would still have a
post-test probability of 25%. A negative CT result is not equivalent to a normal result on
a lung scan or an angiogram. Furthermore, when the clinical probability of PE is low, a
positive CT result alone may not be sufficient to establish a diagnosis of PE, particularly
for isolated segmental abnormalities.
Although the observed likelihood ratios with CT are inferior to those previously shown for
lung scanning (3), they were derived from different populations, and comparisons should
thus be made with caution. This study cannot provide direct evidence for choosing one
diagnostic modality over the other. However, the results provide no support in general for
replacing lung scanning with helical CT to diagnose PE.
Three advantages of helical CT deserve mention. First, this study did not consider the
value of CT's ability to identify an alternative diagnosis in up to a third of patients with
suspected PE (2). Second, as with lung scanning, when the combination of pre-test
probability and helical CT results yield sufficiently high or low post-test probabilities, the
test obviates the need for conventional angiography and its associated higher morbidity.
Third, in practice settings in which clinicians can obtain a CT scan more quickly than a
lung scan or an angiogram, the use of CT may prevent delays in therapy.
CT test results
Positive
Negative
Likelihood ratios (95% CI)
8.3 (5.1 to 13.7)
0.34 (0.26 to 0.45)
Inconclusive
0.31 (0.08 to 1.21)
6.7 Recommended reading
Jaeschke R, Guyatt G, Sackett DL , for the Evidence Based Working Group. Users'
Guides to the Medical Literature, III: how to use an article about a diagnostic test, A: are
the results of the study valid? JAMA. 1994; 271: 389-391
Jaeschke R, Guyatt G, Sackett DL , for the Evidence Based Working Group. Users'
Guides to the Medical Literature, III: how to use an article about a diagnostic test, B: what
are the results and will they help me in caring for my patients? JAMA. 1995; 274: 16301632
School of Population Health
134
EBP Workbook 05
6.8 Further reading
1. Halkin A. Likelihood ratios: getting diagnostic testing into perspective. Q J Med
1998: 91: 247-258.
2. Davie AP, Caruana FL, Sutherland GR and McMurray JJV. Assessing diagnosis in
heart failure: which features are any use? Quart J Med 1997; 90:335-339
3. Bartel HG, Behar VS, Peter RH et al. Graded exercise stress tests in
angiographically documented coronary heart disease. Circulation 1974; 49: 348. In
Sackett DL, Haynes RB, Guyatt GH, Tugwell P. Clinical Epidemiology: A Basic
Science for Clinical Medicine. Second Edition. London: Little, Brown and Company,
1991.
4. Fletcher RH, Fletcher SW, Wagner EH. Chapter 3: Diagnosis. In: Clinical
Epidemiology: the essentials. Baltimore; 1988. p. 42-75.
5. Evidence-Based Medicine - A Framework for Clinical Practice. Friedland et al, 1998.
6.9 References
See Bibliography
School of Population Health
135
EBP Workbook 05
6.10 Critical appraisal worksheets
6.10.1 Sample taken from Centre for Evidence-Based Medicine, Mount Sinai Hospital
http://www.cebm.utoronto.ca/teach/materials/therapy.htm
Diagnostic worksheet
Citation
Are the results of this diagnostic study valid?
Was there an independent,
blind comparison with a
reference ("gold") standard of
diagnosis?
Was the diagnostic test
evaluated in an appropriate
spectrum of patients (like those
in whom it would be used in
practice)?
Was the reference standard
applied regardless of the
diagnostic test result?
Were the methods for
performing the test described in
sufficient detail to permit
replication?
School of Population Health
136
EBP Workbook 05
What were the results?
Are likelihood ratios for the test
results presented or data
necessary for their calculations
provided?
Are the valid results of this diagnostic study important?
YOUR CALCULATIONS
Target Disorder
Present
Absent
Totals
a b
a+b
Positive
Diagnostic
test result
Test Negative
c d
a+c b+d
Totals
c+d
a+b+c+d
Can you apply this valid, important evidence about a diagnostic test in caring for
your patient?
Is the diagnostic test available,
affordable, accurate, and
precise in your setting?
Can you generate a clinically
sensible estimate of your
patient's pre-test probability
(from personal experience,
prevalence statistics, practice
databases, or primary studies)?
Are the study patients similar to
your own?
Is it unlikely that the disease
possibilities or probabilities
have changed since the
evidence was gathered?
Will the resulting post-test
School of Population Health
137
EBP Workbook 05
probabilities affect your
management and help your
patient?
Could it move you across a testtreatment threshold?
Would your patient be a willing
partner in carrying it out?
Would the consequences of the
test help your patient?
Additional Notes
6.10.2 Sample taken from Critical Appraisal Skills Programme
http://www.phru.nhs.uk/casp/appraisa.htm
School of Population Health
138
EBP Workbook 05
QuickTime™ and a
TIFF (LZW) decompressor
are needed to see this picture.
School of Population Health
139
EBP Workbook 05
QuickTime™ and a
TIFF (LZW) decompressor
are needed to see this picture.
School of Population Health
140
EBP Workbook 05
QuickTime™ and a
TIFF (LZW) decompressor
are needed to see this picture.
School of Population Health
141
EBP Workbook 05
6.11 Mamogram
Nomogram for likelihood ratios. Adapted from Fagan TJ: Nomogram for Bayes' theorem.
N Engl J Med 1975 293; 257.
School of Population Health
142
EBP Workbook 05
7.
STUDIES ABOUT PROGNOSIS
7.1 Learning objectives
• To understand what types of study designs are appropriate for evaluating clinical
questions about prognosis.
• To understand the potential sources of bias in studies of prognosis.
• To be able to critically appraise studies of disease prognosis and decide how to apply
them to the results to the care of individual patients.
7.2 Core reading and key concepts
Introduction
You are a General Practitioner. A colleague calls you at home one night to ask you to see
a relative of hers the following day. She has just seen her aunt and made a clinical
diagnosis of herpes zoster but feels it would be inappropriate for her to manage the
problem herself. The patient is a 56-year old woman who has previously been well. She
has had 4 days of pain on the left chest wall in a T 6 dermatome distribution. In the last 48
hours she has noticed an erythematous maculopapular rash (in the same area), which
has now become vesicular. She feels otherwise well and is on no regular medication.
You agree to see her the following morning. You are aware that antiviral treatment is
recommended for the treatment of herpes zoster in patients seen within 72 hours of the
onset of vesicles. Studies suggest that some antivirals may reduce the duration of
postherpetic neuralgia. In your experience however severe and persistent pain following
herpes zoster is not common in patients younger than 60 and antiviral therapy is relatively
costly. You decide to see if you can find out more information on the likelihood of
developing postherpetic neuralgia in patients who present with herpes zoster in General
Practice.
You conduct a search of MEDLINE (“OVID”, 1966 to February 2002). You enter “exp
Herpes Zoster/” which yields 5583 citations. You also enter the term “Follow-Up Studies/”
which yields 246612 articles. You combine these two sets of studies using the term “and”
which yields 153 citations. You then limit the search to articles published in English
between 1995 and 2002 and this yields 51 citations. You search the titles and abstracts
of these articles and find a study that sounds relevant to your question. (Helgason S.
Petursson G. Gudmundsson S. Sigurdsson JA. Prevalence of postherpetic neuralgia after
a first episode of herpes zoster: prospective study with long-term follow-up. BMJ.2000
321(7264):794-6.)
This study is a prospective follow up study that evaluates the prevalence of post-herpatic
neuralgia in patients with a clinical diagnosis of herpes zoster presenting to General
Practitioners. In order to be able to decide if this study will be helpful in answering your
question, you need to decide if the study is both valid and applicable to your patients. In
the following sections we will outline some of the potential sources of bias in such follow
up studies and discuss the use of critical appraisal guides.
School of Population Health
143
EBP Workbook 05
General principles related to the interpretation of prognosis
studies
Prognosis is the prediction of the future course of disease following its onset (1). You may
also sometimes hear the term ‘natural history’ being used. This refers to the evolution of
disease without medical intervention. Prognostic information is useful to clinicians for two
main reasons: patients often seek information about the likely course of their disease, and
information about prognosis can be useful for making treatment decisions.
Risk factors for disease and prognostic factors
The factors that predispose individuals to developing a disease (risk factors) may not be
the same as those that influence the outcome of a disease once established (prognostic
factors). For example, in a systematic review of psychosocial factors in the aetiology and
prognosis of coronary heart disease (prospective cohort studies) Hemingway et al found
that depression and anxiety were both risk factors for the development of coronary artery
disease and predicted prognosis in patients who developed coronary artery disease.
However the evidence suggested that a Type A behaviour pattern was a possible risk
factor for the development of coronary artery disease, but did not predict prognosis in
those who developed heart disease (2).
Study types
Several different study types can provide prognostic information. For example
randomised controlled trials of health care interventions may provide prognostic
information on certain outcomes in the control and intervention groups. In particular
where the control group receive placebo or no active intervention, the outcomes in this
group may provide information on the natural history of the disease. However randomised
controlled trials often have some limitations with respect to examining natural history.
Firstly follow up is often limited to a relatively short time frame. Secondly patients that
take part in such studies are usually highly selected and may not be representative of the
types of patients of interest to you in your practice. Finally placebo effects and the other
factors related to participation in the trial may independently influence the natural history
in a way that we would not expect in day-to-day practice.
Prognostic information about disease is often obtained from observational studies. Case
control studies and cohort studies can be used to examine prognostic factors in relation to
particular diseases. Cohort studies can take several forms, for example they may be
retrospective or prospective. When examining risk factors for the development of disease,
studies often assemble a group of individuals exposed to a potential risk factor and
compare the rates of disease during follow up with another group of individuals not
exposed to the risk factor. For studies examining prognosis, however often a cohort of
patients with established disease will be assembled and followed through time to detect
the rates of particular outcome events. Potential prognostic factors can be explored (for
example age, sex or severity of disease at baseline). Study design is displayed in Figure
7.1, note that bias may be introduced at each of the steps outlined.
School of Population Health
144
EBP Workbook 05
Figure 7.1
Design of cohort studies examining prognosis
Cohort of patients with disease
recruited/assembled
Follow up period
Measurement of outcomes
Assembly of patients for prognosis studies
The way that patients are assembled for inclusion in cohort studies can influence the
results. Prognostic studies are most useful if the patients have been followed up from a
similar and well-described point in their illness. The term inception cohort has been used
to describe a group of people who are assembled near the onset (“inception”) of their
disease (1). However it is not always necessary to follow individuals from an early stage,
the important point is that they are followed from a uniform point in their disease. If this is
not well described then it is difficult to interpret the results. A study by Hubbard et al
illustrates the importance of defining at what time point in their disease patients have been
included in prognostic studies (3). In this cohort study examining survival in patients with
cryptogenic fibrosing alveolitis (idiopathic pulmonary fibrosis), the researchers found that
the survival of patients already attending clinics (prevalent cases) was better than that in
individuals who were newly diagnosed (incident cases). The median survival of incident
cases was 2.9 years, compared with 9 years for prevalent cases. It is likely that the
prevalent group excludes patients with aggressive disease that have died early in the
course of their illness (survival bias) (3).
Because descriptions of the course of disease must be based on samples of patients,
they may be susceptible to sampling bias. A common theme for prognostic studies across
different diseases is that the prognosis of individuals who attend tertiary referral centres is
often worse than that found in community based studies. For example the 5-year survival
after a diagnosis of dilated cardiomyopathy was found to be 36% in patients referred to a
specialist centre compared with 80% in a community based cohort (4). There are several
reasons that prognosis may differ between community based studies and those based on
individuals attending tertiary referral centres. Firstly patients with more severe disease
are more likely to be referred for expert opinion and management. Secondly experts may
preferentially investigate, manage and follow up individuals that are thought to be more
severe or more challenging. Finally access to diagnostic and treatment services may be
School of Population Health
145
EBP Workbook 05
linked with sociodemographic and geographic factors and in some circumstances these
factors may themselves be markers of disease prognosis (5).
For these reasons the sample of individuals included in the study should be well
described. Details about how patients are selected for the study and from what sources
are important. For clinicians interpreting prognostic studies the samples should be
representative of the types of patients seen in their practice if the results are going to
helpful to them. If the sample is from a tertiary centre the referral process should be
described. The description should include the source of patients, inclusion or exclusion
criteria and what objective criteria were used to confirm the disease. Note that when
examining the findings of prognostic studies you need enough information to be able to
decide if the sample of patients included in the study is likely to differ systematically from
those you see in practice or wish to apply the results to. A study based on patients from a
tertiary centre may be of limited value to a general practitioner managing patients outside
of this setting, but the results would be helpful to specialists working in similar tertiary
settings.
Follow up
The results of prognostic studies are likely to be more useful if losses to follow up are
minimal and if the duration of follow up is sufficient. The duration of follow up will depend
on the disease being examined but for some disease it may need to be quite long to
detect all-important outcomes. For example to detect cases of cirrhosis following infection
with hepatitis C a follow up period of 15 years or more may be required (6). If follow up is
incomplete this may threaten the validity of the results. Bias may occur if those that are
lost to follow up are systematically different from those in who follow up is complete, and
especially if these differences are related to prognosis. For example patients who are
more severely affected or disabled by their illness may be more difficult to contact or may
fail to attend for follow up review.
Where individuals are followed up by surveys, non-response bias may influence the
results. Non-response bias cannot always be excluded by showing that baseline
characteristics are equally distributed among responders and non-responders. For
example in a cohort study of cement factory workers, non-responders to a follow up
survey were subsequently found to have twice the rate of hospital admission for
respiratory diseases, after controlling for factors such as smoking and age. However,
responders and non-responders did not differ on the basis of smoking habits, respiratory
symptoms and lung function (7).
The potential impact of losses to follow up on the study results can be examined by
recalculating the results taking into account the losses and assuming a best and a worstcase scenario (sometimes called a sensitivity analysis). For example, in a study of the
natural history of acute back pain in patients attending primary care, the risk of having
chronic low back pain at 3 months was found to be approximately 2% (8). This study
initially enrolled 103 patients but complete follow up data was only available on 92
patients (11 drop outs). 2 patients developed chronic low back pain. If we assume that all
those patients lost to follow up developed chronic pain (worst case scenario) then the
actual prevalence of chronic pain would be 11+2/103 = 23%. If we assume that all those
lost to follow up did not develop chronic pain (best case scenario) then the prevalence
would be 2/103 = 2 %. Thus the true rate of chronic pain could range between 2 and
School of Population Health
146
EBP Workbook 05
23%. The clinical implications of these disparate figures are clearly quite different and
therefore we need to be cautious about interpreting these results.
The effect of losses to follow up are usually greater where the risk of the prognostic
outcome is low as demonstrated in the back pain example (5). The clinical implications
may not be as substantial when the prognostic outcome is more common. For example,
in a long term follow up study of children with a history of wheezing or asthma before the
age of 7, 27% (238 subjects) of those surveyed at age 33 reported wheezes during the
previous 12 months (9). The original sample consisted of 1046 children but follow up data
was only available on 880 (166 losses to follow up). We can recalculate the proportion
with wheeze at age 33, using the approach above. Firstly, we assume that all those lost
to follow up do experience wheeze at age 33, in this case the prevalence would be 238+
166/1046 = 39%. If we assume that all those lost to follow up did not have persistent
wheeze at age 33, then the prevalence would be 238/1046 = 23%. Across this range
(23% to 39%) the clinical implications are similar, that is, a reasonable proportion of
patients with childhood wheeze or asthma have persistent symptoms in adulthood.
Outcome measurement
Studies of prognosis may examine different sorts of outcomes. Some studies will report
diagnostic test results, for example, as “surrogate markers”. It is important however that
such studies also consider outcomes that are important to both patients and clinicians.
Such outcomes might include duration or severity of symptoms, death, disease
recurrence/relapse, functional status (for example return to work) or quality of life.
As with other types of studies, outcome assessment should be conducted in a
standardised fashion. In some cases blinding of observers may be necessary to avoid
measurement bias. Blinding of observers may be particularly important when subjective
outcomes are being assessed, such as pain, and prognostic factors are being examined.
In this case blinding to prognostic factors may be necessary. Outcomes should be clearly
defined, and explicit criteria used.
Adjustment for important prognostic factors
Often prognostic studies will compare outcome rates amongst patient groups with different
characteristics. For example age is often a prognostic factor in disease and outcomes in
older populations are sometimes compared with outcomes in younger patients. For many
diseases, multiple factors may influence the disease outcomes and the associations
amongst these different variables may be complex (1). Where there are several factors
that appear to be of prognostic significance, it is important to consider what the particular
relationships between these variables might be, in particular:
• potential prognostic variables may be related to each other as well as the outcome of
interest, in this case one of the variables may merely be a ‘marker’ for the other
prognostic factor, but not predictive of prognosis independently (confounding)
• two or more variables might interact together so that their combined effect is larger
than the sum of their individual effects
Multivariate analysis is often used to simultaneously evaluate the effect of multiple
variables on outcomes. With this method mathematical models are used to relate
independent variables to outcome. Different methods (such as multiple linear or logistic
regression) are in common use and some assumptions are necessary. The details are
beyond the scope of this course and it would be unreasonable to expect that the average
reader of medical studies should be able to determine if appropriate statistical methods
School of Population Health
147
EBP Workbook 05
have been used for such analyses. It is important, however, that readers consider
whether the researchers have taken into account all the potentially important prognostic
factors before drawing conclusions about the relationship between certain variables and
outcomes. Multivariate analysis can be used to simultaneously adjust for the effects of
several variables so that the independent effects of one can be determined. For example
in a study of prognosis following first myocardial infarction, Marrugat et al found that
women have a higher 28-day case fatality and 6 month morbidity and mortality than men
(10). They also found however that the women in the study were on average older and
more often had certain co-morbidities than the males in the study. The relationship
between gender and outcome however remained significant even after adjustment for age
and co-morbidity.
Sometimes multivariate statistics are used to develop predictive models. In this case a
number of factors including demographic and clinical variables might be combined to
make predictions about a particular prognosis. Models based on a single patient sample
may however fail to distinguish between important prognostic variables and unimportant
idiosyncrasies related to that particular sample. Such models should be validated by
assessing the predictive power of the model on a second independent sample of patients
(5).
Examining the results of prognostic studies
Prognostic outcomes are often expressed as a rate. For example the 5-year survival rate
is the proportion of patients surviving 5 years from some point in the course of their
disease. To be able to interpret a rate we need to know at what point in their disease
patients entered the study, how long they were followed up for, how outcome events were
defined and who the people at risk were (1).
Summarising results as a rate at a single time point does not convey any information
about how the chance of survival changes over time. Rates convey simple information but
conducting a survival analysis and displaying survival curves provides more information
about the survival probabilities with time. Survival curves may be used to examine ‘time
to event’ data other than survival, including, but not limited to; disease recurrence,
functional recovery following illness, or time to conception in patients with poor fertility.
Figure 7.2 shows two hypothetical survival curves for 2 different diseases, the probability
of surviving is displayed on the vertical axis and the horizontal axis is the period of time
from the beginning of the observation. In both diseases the 5-year survival is
approximately 10%. In disease A the majority of patients die within the first 6 months and
thereafter the risk of dying improves. In disease B the probability of survival in the first 6
to 12 months is greater than disease A.
A detailed description of survival analysis is beyond the scope of this course but the
following is a brief overview that may help with the interpretation of survival curves.
Using the Kaplan-Meier method, survival probabilities are calculated for a series of
discrete time intervals (11). The time intervals used will depend on the particular study
but often short intervals are used such as days. For each time interval the probability
that those who have survived to the beginning will survive to the end is calculated.
This is termed conditional probability, that is, the probability of being a survivor at the
end of the interval on condition that the subject was a survivor at the beginning of the
interval. For each time period the probability of surviving is based on the number of
School of Population Health
148
EBP Workbook 05
individuals at risk for that period. Individuals who have already died or have been
censored are not at risk and are not used to estimate survival for that time period.
Patients may be censored if they have dropped out, died of another cause or have not
yet been followed up to that point in time. Survival curves are used to display the
survival probabilities over time. Survival curves may have a ‘step’ appearance
because sudden changes in the estimated probability occur when an event has been
observed. For many of the time intervals there will be no outcome events recorded and
the probability of survival will be unchanged over that period until the next event
occurs. Standard errors and confidence intervals can be calculated for survival
probabilities at different time periods.
Some points about interpreting survival curves
The number of observations decreases over time (as the proportion of individuals at
risk diminishes) and therefore the estimates of survival probability at the tail of the
survival curve may be less precise (with wider confidence intervals) than the estimates
from the left hand side of the curve. Similarly some survival curves give the impression
of a plateau effect at the tail end, however the smaller slope of the curve at this end
may be due to the fact that survival rates are based on a diminishing number of
individuals (1).
Figure 7.2
Hypothetical survival curves for two different diseases, with a similar
5-year survival
100%
Disease a
Probability
of survival
(%)
50%
0
5
Time in years
100%
Probability
of survival
(%)
Disease b
50%
0
5
Time in years
School of Population Health
149
EBP Workbook 05
7.3 Worked example
Recall the example discussed in the introduction to this section. The following article
seems to address the clinical question:
Helgason S, Petursson G, Gudmundsson S, Sigurdsson JA. Prevalence of postherpetic
neuralgia after a first episode of herpes zoster: prospective study with long-term follow-up.
BMJ.2000; 321: 794-796.
Abstract
Objective: To estimate the frequency, duration, and clinical importance of postherpetic
neuralgia after a single episode of herpes zoster.
Design: Prospective cohort study with long-term follow up.
Setting: Primary healthcare in Iceland.
Participants: 421 patients with a single episode of herpes zoster.
Main outcome measures: Age and sex distribution of patients with herpes zoster, point
prevalence of postherpetic neuralgia, and severity of pain at 1, 3, 6, and 12 months and
up to 7.6 years after the outbreak of zoster.
Results: Among patients younger than 60 years, the risk of postherpetic neuralgia three
months after the start of the zoster rash was 1.8% (95% confidence interval 0.59% to
4.18%) and pain was mild in all cases. In patients 60 years and older, the risk of
postherpetic neuralgia increased but the pain was usually mild or moderate. After three
months severe pain was recorded in two patients older than 60 years (1.7%, 2.14% to
6.15%). After 12 months no patient reported severe pain and 14 patients (3.3%) had mild
or moderate pain. Seven of these became pain free within two to seven years, and five
reported mild pain and one moderate pain after 7.6 years of follow up. Sex was not a
predictor of postherpetic neuralgia. Possible immunomodulating comorbidity (such as
malignancy, systemic steroid use, diabetes) was present in 17 patients.
Conclusions: The probability of longstanding pain of clinical importance after herpes
zoster is low in an unselected population of primary care patients essentially untreated
with antiviral drugs.
The full text of this article can be downloaded from the BMJ website http://www.bmj.com.
Click on Search/archive. Under Author enter “Helgason, S” and click Search.
In the following section below this article has been appraised using the worksheet
provided at the end of this section.
School of Population Health
150
EBP Workbook 05
Prognosis Worksheet
Citation
Helgason S. Petursson G. Gudmundsson S. Sigurdsson JA. Prevalence of postherpetic
neuralgia after a first episode of herpes zoster: prospective study with long term follow-up.
BMJ 2000; 321:794-796.
Are the results of this prognosis study valid?
Was a defined, representative
sample of patients assembled at
a similar point in the course of
their disease?
The researchers have assembled an inception cohort for
this study. (Patients with a first episode of herpes
zoster). Although not explicitly stated in the article,
presumably the patients were referred to the study after
their first presentation to their GP and once the clinical
diagnosis was established. (Ideally factors such as the
duration of symptoms prior to enrolment in the study
should have been described.) The clinical criteria used
by GPs to diagnose herpes zoster were not described.
The sample included in the study would seem to be
representative of patients attending general practice in
Iceland. 62 selected GPs were used including both rural
and urban practices. In addition, the completeness of
enrolment was assessed by examining the records of
patients attending hospitals covering the same
catchment area. Only GPs with a computerised record
system were included which may not be representative of
all GPs however the total sample is drawn from a large
catchment area in Iceland representing more than a third
of the population of Iceland. Significant sampling bias is
unlikely.
Was patient follow-up
sufficiently complete?
Follow up rates at 1 month, 3 months and 12 months
were 81%, 93% and 99%. The poorer follow up 1 and 3
months could affect the prevalence figures for pain at
these time points. Losses to follow up by age categories
are not described and therefore it is difficult to recalculate
a best and worst case scenario. However recall that
where the prevalence rates are low (categories of
moderate or severe pain), small losses to follow up could
substantially affect the results.
It is however reassuring that the follow up at 12 months
was almost complete and we can be reassured that the
prevalence of protracted post herpetic neuralgia is low.
Were objective and unbiased
outcome criteria applied?
All patients were contacted and surveyed by a single
researcher using a systematic set of questions. A simple
scale was used to assess pain (none, mild, moderate or
severe). They do not state whether this is a validated
tool, but no standardised questionnaires (eg such as
quality of life) were used.
School of Population Health
151
EBP Workbook 05
Ideally a standardised questionnaire, which has been
validated, would be useful. For subjective outcomes
such as pain, the way that questions are phrased, for
example, may influence the results. In this study we are
not able to examine such factors, because a standard
questionnaire reported elsewhere in the literature is not
available. There is no mention of whether the
investigator was blinded to prognostic factors such as
age when undertaking the follow up.
If subgroups with different
prognoses are identified, was
adjustment for important
prognostic factors undertaken?
The only possible prognostic factors considered in the
analysis were sex and age. Gender was not found to be
a significant predictor of outcome. Age was a significant
predictor of pain at each of the follow up points. The
odds ratio per 10 years age difference was 1.87 (95% CI:
1.56 t 2.23) at 1 month and 2.45 (1.5 to 4.01) after 6
months.
Are the valid results of this prognosis study important?
How likely are the outcomes
over time?
In patients aged 50 to 59, the prevalence of mild pain at 1
month was 16% and the prevalence of moderate pain at
1 month was 7%. At 3 and 12 months the prevalence of
mild pain was 4% and moderate pain 0%.
How precise are the estimates
of likelihood?
The numbers of patients experiencing pain are relatively
small and the estimates of prevalence are therefore
somewhat imprecise (wide confidence intervals). For
mild pain at 1 month the confidence intervals are 6,7% to
30%. For mild pain at 12 months the confidence intervals
are narrower, 0.5% to 12.8%.
Can you apply this valid, important evidence about prognosis in caring for your
patients?
Were the study patients and
their management similar to
those in my practice?
Patients included in the study appear to be similar to your
own, 54 patients in the age range 50 to 59 were included.
Because the clinical criteria used to diagnose herpes
zoster are not well defined it is difficult to assess whether
your patient is similar on clinical grounds, however your
patient’s presentation is fairly typical for herpes zoster
and is likely to be similar to those included in the study.
Of note cultural differences may be important in
extrapolating the results of this study to your patients.
Pain thresholds have been noted to vary across cultures.
This study was limited to patients in Iceland.
School of Population Health
152
EBP Workbook 05
Was follow up sufficiently long?
12 months follow up is sufficiently long to capture cases
of post herpetic neuralgia. In addition a sub-sample were
followed for a longer period (up to 7.6 years).
Can I use the results in the
management of patients in my
practice?
Yes, you are happy that, based on the results of this
study, the likelihood of your patient developing severe or
protracted post herpetic neuralgia is very low. You are
aware however, that when this complication does occur it
can be very debilitating. You can use the information
from this study to discuss the risks of post herpetic
neuralgia and the treatment implications.
In the table below calculations for the number needed to
treat to prevent pain at 6 months, based on a study
examining the efficacy of Famciclovir are presented (12)
(13). In this study however, the prevalence of pain at 6
months in the placebo group (23.8%) was greater than
that reported from the population based study by
Helgason et al. The number needed to treat has been
recalculated using prevalence data from Helgason et al
and assuming the relative risk reduction remains the
same. Using data from the Famciclovir study suggests
that 11 patients need to treated to prevent 1 patient
having persistent pain at 6 months. However when the
prevalence rates from a population-based study are used
we find that 68 patients need to be treated to prevent 1
patient from having persistent pain at 6 months.
You can use this information to explain the potential
benefits of treatment to your patient. You also explain
the cost of treatment and the possible side effects (which
are relatively minor with Famciclovir).
Note – other antivirals (eg acyclovir) appear to have some efficacy in the treatment of
herpes zoster, but the benefit is less clearly defined. Other studies also suggest that
tricyclic antidepressants administered early in the course of herpes zoster infection may
help to reduce the risk of post herpetic neuralgia. For those interested, the systematic
review by Alper et al is very comprehensive (13).
School of Population Health
153
EBP Workbook 05
Pain at 6 months following presentation with herpes zoster, comparison of the NNT
from a treatment study with famciclovir with the NNT calculated based on a cohort
of patients followed up from general practice.
Outcome
Number
Absolute
Control
Experiment Relative
needed to
risk
event rate
al event
risk
treat (NNT
reduction
(X)
rate (Y)
reduction
= 1/ARR)
ARR =
RRR =
X–Y
(X –Y)/X
Calculations
based on
Famciclovir study
(12) (13)
Number needed
to treat based on
patients aged 50
to 59, using
prevalence data
from Helgason et
al. (14)
23.8%
15%
37%
0.088
(8.8%)
11
4%
2.5%
37%
0.015
(1.5%)
68
7.4 Self-complete exercise
A patient of yours (Mr AS) who has just been to see his cardiologist calls you. Mr. AS is a
68-year old man who has recently been diagnosed with aortic stenosis. Because he is
asymptomatic his cardiologist has recommended that surgery be delayed until symptoms
develop, however Mr AS is worried about the risk of dying if he does not have surgery in
the near future and would like to discuss this with you further.
Aortic stenosis was diagnosed after you noticed a loud ejection systolic murmur during an
examination several months ago. Subsequently you referred Mr AS for echocardiography
and doppler examination, which confirmed the presence of severe aortic stenosis with a
peak aortic-jet velocity of 4.8m per second. The aortic valve was moderately calcified.
Trivial aortic regurgitation was noted but no other valvular lesions were noted. Left
ventricular size and function was normal. Currently Mr AS is well and has no symptoms
related to the aortic stenosis. He is an ex smoker, with a history of hypercholesterolemia
currently controlled with diet. He has no other relevant past history.
You organise to see Mr AS the following day and decide to read up on the prognosis of
patients with asymptomatic severe aortic stenosis. You conduct a MEDLINE Search,
OVID, 1966 to March 2002 using the following strategy:
School of Population Health
154
EBP Workbook 05
You search the abstracts from your limited search (50 citations) and find the following
article:
Rosenhek R, Binder T, Porenta G, Lang I et al. Predictors of outcome in severe,
asymptomatic aortic stenosis. N Engl J Med 2000;343:611-617.
Critically appraise this article using the worksheet provided and decide if the study is
helpful to you in counselling your patient.
Abstract
Background: Whether to perform valve replacement in patients with asymptomatic but
severe aortic stenosis is controversial. Therefore, we studied the natural history of this
condition to identify predictors of outcome.
Methods: During 1994, we identified 128 consecutive patients with asymptomatic, severe
aortic stenosis (59 women and 69 men; mean [+/-SD] age, 60+/-18 years; aortic-jet
velocity, 5.0+/-0.6 m per second). The patients were prospectively followed until 1998.
Results: Follow-up information was available for 126 patients (98 percent) for a mean of
22+/-18 months. Event-free survival, with the end point defined as death (8 patients) or
valve replacement necessitated by the development of symptoms (59 patients), was 67+/5 percent at one year, 56+/-5 percent at two years, and 33+/-5 percent at four years. Five
of the six deaths from cardiac disease were preceded by symptoms. According to
multivariate analysis, only the extent of aortic-valve calcification was an independent
predictor of outcome, whereas age, sex, and the presence or absence of coronary artery
disease, hypertension, diabetes, and hypercholesterolemia were not. Event-free survival
for patients with no or mild valvular calcification was 92+/-5 percent at one year, 84+/-8
percent at two years, and 75+/-9 percent at four years, as compared with 60+/-6 percent,
47+/-6 percent, and 20+/-5 percent, respectively, for those with moderate or severe
calcification. The rate of progression of stenosis, as reflected by the aortic-jet velocity, was
significantly higher in patients who had cardiac events (0.45+/-0.38 m per second per
year) than those who did not have cardiac events (0.14+/-0.18 m per second per year,
P<0.001), and the rate of progression of stenosis provided useful prognostic information.
Of the patients with moderately or severely calcified aortic valves whose aortic-jet velocity
School of Population Health
155
EBP Workbook 05
increased by 0.3 m per second or more within one year, 79 percent underwent surgery or
died within two years of the observed increase.
Conclusions: In asymptomatic patients with aortic stenosis, it appears to be relatively
safe to delay surgery until symptoms develop. However, outcomes vary widely. The
presence of moderate or severe valvular calcification, together with a rapid increase in
aortic-jet velocity, identifies patients with a very poor prognosis. These patients should be
considered for early valve replacement rather than have surgery delayed until symptoms
develop. (N Engl J Med 2000;343:611-617.)
A full text copy of this article can be obtained by accessing full text journals through
“Buddy”, or through the Clinicians Health Channel or your hospital library.
School of Population Health
156
EBP Workbook 05
7.5
Answers to self-complete exercises
Prognosis Worksheet
Citation
Rosenhek R, Binder T, Porenta G, Lang I et al. Predictors of outcome in severe,
asymptomatic aortic stenosis. N Engl J Med 2000;343:611-617.
Are the results of this prognosis study valid?
Patients appear to have been assembled at a similar
Was a defined, representative
sample of patients assembled at point in the course of their disease, that is they all have
asymptomatic aortic stenosis at entry to the study.
a similar point in the course of
their disease?
Only patients who were referred to an
echocardiography laboratory were studied. The referral
patterns were not described but presumably this is a
tertiary referral centre or major hospital (Vienna
General Hospital). The study will clearly not be
representative of all patients with severe asymptomatic
aortic stenosis, since many patients in the community
will remain undiagnosed or may be diagnosed but not
referred for echocardiography at such centres.
However the patient sample probably is representative
of patients referred to or managed in the tertiary setting.
As the authors point out, one of the main limitations to
the study is the fact that some of the patients
underwent valve replacement shortly after diagnosis
despite being asymptomatic. They could not be used to
examine the natural history of severe asymptomatic
aortic stenosis. If this group of patients differ to those
who did not undergo surgery then the possibility of bias
exists. Importantly the group of patients undergoing
surgery early may represent more severe cases, and
the risk of sudden death, for example, may be
underestimated. These patients do appear to differ on
the basis of age and aortic jet velocity at baseline and
this is clearly a potential source of bias. However the
study represents current practice, that is that some
patients with asymptomatic severe aortic stenosis will
be referred for aortic valve replacement at the
discretion of their treating physician. Other studies
have noted similar circumstances.
Was patient follow-up
sufficiently complete?
Out of 128 patients only 2 were lost to follow up. These
losses to follow up are unlikely to substantially affect
the results of the study.
Were objective and unbiased
outcome criteria applied?
The outcomes were death or aortic-valve replacement
necessitated by the development of symptoms. Cause
of death was also examined. There is no mention that
School of Population Health
157
EBP Workbook 05
outcome assessor s were blind to prognostic factors
being considered, however the outcomes are fairly
objective. Cause of death can be open to interpretation
and different methods were used to determine the
cause of death in different patients. However the
number of deaths is relatively small, most were due to
cardiac causes and it is unlikely that the risk of cardiac
death has been underestimated.
The outcome measure of aortic valve replacement
necessitated by symptoms is somewhat problematic in
relation to the examination of prognostic variables.
Clinicians may take into account prognostic variables
identified in this study such as aortic valve calcification,
or changes in aortic jet velocity over time when making
decisions to refer patients for valve replacement.
Although these patients were classified as having
symptoms, this is open to interpretation by the clinician,
for example a clinician may be more likely to refer a
patient with relatively mild exertional dyspnoea for valve
replacement if they are concerned about other markers
of disease severity such as an increase in aortic jet
velocity over time.
If subgroups with different
prognoses are identified, was
adjustment for important
prognostic factors undertaken?
In examining prognostic factors the researchers
examined multiple variables, including clinical variables
(age, sex, and presence/absence of coronary artery
disease, hypertension, diabetes, and
hypercholesterolemia) and echocardiographic variables
(degree of aortic-valve calcification and aortic-jet
velocity). Change in aortic jet velocity over time was
also examined.
The extent of aortic-valve calcification was a strong
predictor of subsequent events. Although age,
coronary artery disease and diabetes were predictors of
outcome in the univariate analyses, aortic-valve
calcification was the only prognostic factor that
remained significant after adjustment for other possible
prognostic factors in the multivariate analysis.
The researchers appear to have considered most of the
important possible prognostic variables in their analysis.
School of Population Health
158
EBP Workbook 05
Are the valid results of this prognosis study important?
How likely are the outcomes
over time?
During the follow up period (mean 22 months) there
were 8 deaths and 59 valve replacements due to the
development of symptoms. 6 of the 8 deaths were due
to cardiac causes and these were all presumed to be
related to aortic stenosis. However apart from 1 sudden
death they were all preceded by the development of
symptoms (aortic valve replacement was not performed
in these patients for various reasons).
Overall survival was 87% at four years. Event free
survival was 33 percent at 4 years. For patients with
moderate or severe aortic calcification event free
survival was 20% at 4 years. All deaths were noted
amongst patients with moderate or severe valvular
calcification.
How precise are the estimates
of likelihood?
Standard errors and standard deviations were provided
rather than confidence intervals.
Can you apply this valid, important evidence about prognosis in caring for your
patient?
Were the study patients and
their management similar to
those in my practice?
Your patient is similar to those included in the study on
the basis of severity of AS and demographic factors.
Your patient has also recently been assessed and
managed in a tertiary referral setting.
Was follow up sufficiently long?
Yes, a large number of outcome events have occurred
during the follow up period.
Can I use the results in the
management of patients in my
practice?
Yes, although you are concerned about some of the
limitations of this study, you feel this study represents
the best evidence on which to base advice for your
patient.
In summary the article suggests that amongst those
patients who are first diagnosed with asymptomatic
aortic stenosis and are not referred for valve
replacement shortly after diagnosis, the long-term
prognosis in terms of the risk of sudden death is good.
A large proportion of patients end up requiring aortic
valve replacement because of the development of
symptoms however.
You reassure your patient that the risk of sudden death
is less than 1 percent per year. The immediate
perioperative risk associated with isolated aortic valve
replacement is around 3.5% (15) (with higher rates for
older populations or in the presence of co-morbidities)
and there are also long-term complications associated
with prosthetic valves that need to be considered (16).
You advise your patient to have regular review with his
School of Population Health
159
EBP Workbook 05
cardiologist as planned and tell him to report the
following symptoms to you immediately if they develop;
shortness of breath on exertion, chest pain or
discomfort, particularly on exertion and loss of
consciousness or light-headedness on exertion.
7.6 Suggested reading
Laupacis A, Wells G, Richardson WS, Tugwell P for the Evidence-Based Medicine
Working Group. Users' guides to the medical literature: V. How to use an article about
prognosis. JAMA 1994;272:234-237.
7.7 Further reading
Sackett D, et al. Ch 6: Making a prognosis. In: Sackett D, Haynes RB, Guyatt GH, Tugwell
P, Clinical Epidemiology: A Basic Science for Clinical Medicine. Second ed: Little, Brown
and Company; 1991. p173-185.
Fletcher RH, Fletcher SW, Wagner EH. Chapter 6: Prognosis. In: Clinical Epidemiology:
the essentials. Baltimore; 1988. p106-128.
7.8 References
1.
Fletcher RH, Fletcher SW, Wagner EH. Chapter 6: Prognosis. In: Clinical
Epidemiology: The Essentials. Baltimore; 1988. p106-128.
2.
Hemingway H, Marmot M. Psychosocial factors in the aetiology and prognosis of
coronary heart disease: systematic review of prospective cohort studies. BMJ
1999;318:1460-1467.
3.
Hubbard R, Johnston I, Britton J. Survival in patients with cryptogenic fibrosing
alveolitis: a population-based cohort study. Chest 1998;113(2):396-400.
4.
Sugrue D, Rodeheffer RJ, Codd MB, et al. The clinical course of idiopathic dilated
cardiomyopathy. A population based study. Ann Intern Med 1992;117:117-123.
5.
Sackett D, et al. Ch 6: Making a prognosis. In: Sackett D, Haynes RB, Guyatt GH,
Tugwell P, editor. Clinical Epidemiology: A Basic Science for Clinical Medicine.
Second ed: Little, Brown and Company; 1991. p. 173-185.
6.
Thomas D, Astemborski J, Rai RM, Anania FA, Schaeffer M, Galai N, et al. The
natural history of hepatitis c virus infection: Host, viral, and environmental factors.
JAMA 2000;284:450-456.
7.
Vestbo J, Rasmussen FV. Baseline characteristics are not sufficient indicators of nonresponse bias follow up studies. Journal of Epidemiology & Community Health
1992;46(6):617-619.
School of Population Health
160
EBP Workbook 05
8.
Coste J, Delecoeuillerie G, Cohen de Lara A, LeParc JM, Paolaggi JB. Clinical
course and prognostic factors in acute low back pain: an inception cohort study in
primary care practice. BMJ 1994;308:577-580.
9.
Strachan D, Butland BK, Anderson HR. Incidence and prognosis of asthma and
wheezing illness from early childhood to age 33 in a national British cohort. BMJ
1996;312:1195-1199.
10. Marrugat J, Sala J, Masia R, Pavesi M, Sanz G, Valle V, Molina L, Seres L , Elosua
R. Mortality differences between men and women following first myocardial infarction.
JAMA 1998;280:1405-1409.
11. Bland J, Altman DG. Statistics notes: survival probabilities (the Kaplan-Meier
method). BMJ 1998;317:1572.
12. Tyring S, Barbarash R, Nahlik J, Cunningham A, Marley j, Heng M, et al. Famicclovir
for the Treatment of Acute Herpes Zoster: Effects on Acute Disease and Postherpetic
Neuralgia: A Randomised, Double-Blind, Placebo-Controlled Trial. Annals of Internal
Medicine 1995;123(2):89-96.
13. Alper B, Lewis P. Does Treatment of Acute Herpes Zoster Prevent or Shorten
Postherpetic Neuralgia?: A Systematic Review of the Literature. The Journal of
Family Practice 2000;49(3):255-264.
14. Helgason S, Petursson G, Gudmundsson S, Sigurdsson J. Prevalence of
postherpetic neuralgia after a first episode of herpes zoster: prospective study with
long term follow up. British Medical Journal 2000;321(7264):794-796.
15. Magovern J, Pennock JL, Campbell DB, Pae WE, Bartholomew, M, Pierce WS,
Waldhausen JA. Aortic valve replacement and combined aortic valve replacement
and coronary artery bypass grafting: predicting high risk groups. J Am Coll Cardiol.
1987;9:38-43.
16. Vongpatanasin, Wanpen; Hillis, L. David; Lange, Richard A. Prosthetic heart valves.
N Engl J Med 1996;335:407-16.
17. Laupacis A, Wells G, Richardson WS, Tugwell P for the Evidence-Based Medicine
Working Group. Users' Guides to the Medical Literature: V How to use an article
about prognosis. JAMA 1994;272:234-237.
18. Randolph A, Heiner B, Richardson WS, Wells G, Tugwell P, Guyatt G. Prognosis. In:
Guyatt G, Rennie D, editor. Users' Guides to the medical literature. Chicago: AMA
press; 2002.
School of Population Health
161
EBP Workbook 05
7.9 Critical appraisal worksheets
This work sheet has been adapted from the Users guide series (17) (18) and the Centre
for Evidence-Based Medicine, Mount Sinai Hospital website http://www.cebm.utoronto.ca/teach/materials/therapy.htm
Prognosis worksheet
Citation
Are the results of this prognosis study valid?
Was a defined, representative
sample of patients assembled at
a similar point in the course of
their disease?
Was patient follow-up
sufficiently complete?
Were objective and unbiased
outcome criteria applied?
School of Population Health
162
EBP Workbook 05
If subgroups with different
prognoses are identified, was
adjustment for important
prognostic factors undertaken?
Are the valid results of this prognosis study important?
How likely are the outcomes
over time?
How precise are the estimates
of likelihood?
Can you apply this valid, important evidence about prognosis in caring for your
patient?
Were the study patients and
their management similar to
those in my practice?
School of Population Health
163
EBP Workbook 05
Was follow up sufficiently long?
Can I use the results in the
management of patients in my
practice?
Additional Notes
School of Population Health
164
EBP Workbook 05
8. HELPING PATIENTS (“ C ONSUMERS” ) TO MAKE
INFORMED DECISIONS WHICH INTEGRATE THEIR
VALUES WITH CLINICAL EVIDENCE
8.1 Learning objectives
• To further understand how evidence from studies (eg therapy, diagnosis, prognosis,
cause and risk) applies to individual patients.
• To recognise the complexity of individuals’ perceptions of the risks and benefits of
interventions, and how the presentation of data from clinical studies affects its
interpretation.
• To appreciate different models for clinician-patient interactions and decision-making by
patients.
• To assist patients seeking answers to questions, about prognosis and cause, and
about the risks and benefits of treatments and tests.
8.2 Core reading, key concepts, and worked examples
Introduction
Patients have two major concerns about applying the results of clinical evidence derived
from observational and interventional studies to themselves:
•
With the exceptions of “n–of–1” trials, where the patients themselves are
specifically included in control and treatment phases, studies almost always
involve other people, and are in different settings. Therefore the results may not
apply to them.
•
Results are expressed as “averages” with “ranges” for the groups studied.
Patients see themselves as individuals, possibly different from the “average”, and
would like to have more specific information about results for themselves.
Perceptions about health issues and choices about life-style and interventions are
determined by complex experiential and sociological phenomena. Patients also know from
their experiences as “consumers” of products and services unrelated to health, that
advertising, packaging and marketing can influence both the perceived value of products
and their uptake, and recognise that the same applies to health information.
Clinicians are often requested by patients to assist them to make decisions affecting their
health from the various options available. The extent of the request varies from virtually
no assistance at all, to complete dependence on the clinician’s advice. A frequent request
is to satisfy patients’ desires for additional information.
School of Population Health
165
EBP Workbook 05
8.2.1
Applicability
You will recall from “Ask the answerable question” (see also 2.2) that all clinical evidence
requires specification of the characteristics of persons being studied as well as details of
outcomes being assessed. With interventional studies the precise nature of the
intervention is also required.
Applicability refers to the translation of results from the group studied to other persons,
often in different settings. One question is whether an individual’s characteristics are so
different from the group studied that the results no longer apply. Even if your patient’s
characteristics closely resembles those of the group studied, another question is the
relevance of the study in the patient’s own setting.
Although there are sound principles on which to address these questions, the answers
reflect judgements and opinions, which are based on knowledge, wisdom and experience.
Factors, which affect the applicability of clinical studies to a particular patient, can be
classified into 4 groups, although there is considerable overlap.
Patient factors eg age; gender; genes (including race); comorbid conditions; ingested
substances (including medications); individual probability of adverse and beneficial
disease outcomes; individual risk of treatments and investigations; compliance.
Disease factors eg clinical presentation; duration of disease; severity of disease;
presence and type of symptoms.
Environmental factors eg social, geographic, ecological and economic settings;
definition of diseases and outcomes (including regional differences).
Interventional factors eg the nature and consistency of investigations and treatments.
(see also 4.2 “external validity and generalisability”).
Example 1: Patients with the characteristics of your patient have not yet been studied.
Your patient is a 60-year old heavy smoking diabetic with hypertension and
hyperlipidemia. Using the New Zealand cardiovascular risk calculator
(http://www.nps.org.au/docs/pdfs/cardiovascularrisk.pdf) you estimate that he has a 25%
risk of developing coronary heart disease over the next 10 years. He is keen to quit
smoking but past attempts have failed.
Which medications might help him to quit smoking?
A search of “Clinical Evidence” (available from the “Clinician’s Health Channel” through
your hospital computer) indicates that Bupropion is “likely to be beneficial”, but that there
are no studies in diabetic patients. Rather than deciding that the data is inapplicable, you
and the patient ask if there is any reason that these data might not apply. You decide that
there is no reason and proceed to recommend Bupropion.
Although the effectiveness of this medication in diabetics is unknown, it is most unlikely
that people with diabetes would respond differently than non-diabetics. In circumstances
School of Population Health
166
EBP Workbook 05
like this it is worth considering the question: “Is there any reason that the results of this
study should not apply to this patient?”
Example 2: Spectrum bias in diagnostic tests (see also 6.3)
The sensitivity, specificity and likelihood ratios (see also 6.2) of tests are not always
constant across the clinical spectrum, but may vary according to a range of factors
including age; gender; concurrent medications; the presence or absence of symptoms;
duration of illness; severity of illness.
Your patient is a 19-year old Arts student presenting with sore throat, fever and
generalized lymphadenopathy for 5 days. As the probability of HIV infection is minimal,
you wonder about infectious mononucleosis and request Ebstein-Barr virus serology. The
test result is negative then, but positive when repeated 2 weeks later.
Why is the antibody test negative then, but positive 2 weeks later?
The test result is negative at that time, yet positive 2 weeks later, because the production
of antibody production takes time. Thus “duration of illness” is one of the factors that
influence the sensitivity, specificity and likelihood ratio of a diagnostic test.
Example 3: Subgroup analysis.
In some observational studies and clinical trials, it may be possible to refine applicability
by studying smaller “subgroups”, with clinical characteristics more closely resembling your
patient.
There are two major pitfalls of subgroup analyses. The reduction in size of the cohort may
result in false-negative conclusions, as confidence intervals (see also 4.2) become wider.
Furthermore, if the subgroups are not defined prospectively on the basis of scientific
rationale (eg clinical knowledge, pathophysiology etc), retrospective “data dredging” may
result in irrational false-positive conclusions. An inappropriate subgroup analysis showed
fewer deaths for stroke patients when treatment was chosen according to the throw of
coloured dice for some, but not all colours! (Counsell CE et al. 994). A structured
approach to subgroup analysis helps distinguish between artifactual and real differences
in outcomes of clinical trials between subgroups (Oxman AD, Guyatt GH. 1992)
Example 4: Individualising risk and prognostic data.
Analysis of subgroups, within both cohort studies and the placebo arm of intervention
studies, serves to increase the precision of absolute and relative assessments for the risk
of developing diseases and for outcomes of diseases (see also 7.2). Case control studies
enable more precise estimations of relative but not of absolute risk (see also 4.2).
Making individual assessments of the risk of developing diseases and their outcomes is
not only important for information on prognosis, but helps patients to choose interventions
which are most likely to improve their outcomes. There are many examples of
interventions in which relative risk reduction (see also 4.2) remains fairly constant over a
broad range of risk. This means that the Number Needed to Treat (NNT) for patients with
higher risk is smaller, and hence the benefits greater, for those at higher risk. In many
circumstances, the risk of complications of treatment, in contrast, remains fairly constant
across a broad range of risk for adverse disease outcomes. Thus individualization of both
School of Population Health
167
EBP Workbook 05
risk of adverse disease outcomes and the risk of interventions helps patients to make
better decisions about potentially useful interventions.
Your patient is a 78-year old man with atrial fibrillation for 10 years. There is no
suggestion of other cardiac or of general disease following thorough clinical evaluation.
His blood pressure is 130/85 mmHg. You know that several randomised controlled trials
have shown that anticoagulation with warfarin prevents stroke in patients with atrial
fibrillation. Warfarin, although more effective than aspirin, carries greater risks.
Would you recommend aspirin or warfarin for him?
A literature search draws your attention to a publication (Glasziou PP, Irwig LM. BMJ
1995) which shows that across a range of risks, relative risk reduction of stroke is fairly
constant, so absolute risk reduction is proportional to risk. You interpret this to mean that
the Number Needed to Treat (NNT) to prevent one stroke is inversely proportional to risk.
On the other hand, the risk of bleeding from warfarin is independent of the risk of stroke
from atrial fibrillation. Two clinical prediction rules considering the stroke risk for aspirintreated patient in trials comparing aspirin and warfarin to prevent stroke (Hart RS et al.
2003 and Van Walraven C et al. 2003) show that this otherwise healthy man has a
relatively low risk of stroke. Thus you recommend aspirin rather than the more risky
warfarin for him.
8.2.2
Perceptions and presentations
8.2.2.1 Perceptions of risks and benefits
In health-related, as in all other matters, each person perceives information about
prognosis, the cause and risks of disease, and the pros and cons of life-style changes and
the benefits and risks of diagnostic and therapeutic interventions quite differently.
Determinants of an individual’s decisions, selected from the breadth of options available,
relate to many influences. These include past experiences; family, cultural, religious and
ethical values; education; numeracy; literacy; access and opportunities; media coverage;
and the input of significant other people. Decisions may be seen as “right” or “wrong”
when viewed from clinician, patient and other persons’ perspectives.
Depending on the model chosen for the clinician-patient interaction, clinicians sometimes
impose their own values to modify patient choice. Most clinicians accept the responsibility
to provide relevant information in a form, which the patient can fully comprehend, so that
the patient can, to the extent they wish, make their own decisions.
Studies show that other determinants of the perceptions of the risks and benefits of
interventions include:
• voluntary versus mandatory choices
• treatment choice versus behavioural change
• clinician estimate versus patient estimate of risk and benefit
• immediate versus longer-term outcomes
• novel rather than established phenomena and interventions
• selective denial of significant data
School of Population Health
168
EBP Workbook 05
8.2.2.2 Presentation (‘framing’) of data
The manner in which data is presented on the risk, and prognosis of disease and on the
benefits and risk of interventions, is a strong determinant of its interpretation, perception
and uptake by clinicians and patients.
Example: Absolute and/or relative data?
• bigger numbers make more impact than smaller numbers
• “relative” (ie. “proportion” or % or “chance” or “probability”) data are more difficult for
clinicians and patients to understand than “absolute” (ie. ‘natural frequency’) data.
Imagine that you are a 70-year old woman deciding whether to take combination
oestrogen/progesterone “HRT” (Hormone Replacement Therapy) to prevent osteoporotic
fractures. Your clinician tells you of a Randomised Controlled Trial of “HRT” compared to
placebo (Writing group for the Women’s Health Initiative Randomised Control Trial 2002)
in women of your age, and offers you the choice of two treatments: the first will reduce
your risk of hip or vertebral fracture by ⅓ (30%), while the second would give you a 1/400
(0.25%) chance of avoiding a fracture with “HRT” over the next 5 years. Both statements
are derived from the same data and both are correct. The reason for the apparent
difference in the magnitude of the figures is that while the risk-reduction is relatively large,
the absolute risk is fairly small, and so the absolute benefits of treatment are perceived as
small.
Which manner of data presentation to the patient is likely to appeal to the manufacturers
of “HRT”, ie. most likely to increase sales?
Should the first or the second presentation of data (or both) be offered to the patient?
For most people a 30% risk reduction will be more persuasive than an absolute benefit of
0.25%. Thus manufacturers often present relative rather than absolute data. In order to
facilitate patient understanding, both methods should be used. The expression of
absolute benefit and risk as Number Needed to be Treated (NNT) for 1 person to be
benefited or harmed (NNH) provides an easily understood option for clinicians, patients
and others (see also 4.2).
Other examples: The following differences in the way data is presented have also been
also shown to alter the perceptions of risk:
• mortality data in contrast to survival data
• qualitative in contrast to quantitative data
• survival curves in contrast to numerical data
• pictorial representations in contrast to text
• personalised data in contrast to group data
• “plain English” text in contrast to technical jargon
• the order in which data is presented on benefits and risks
• ‘decision aids’ in contrast to verbal explanations
• the source of the data
8.2.3
Models for clinician-patient interactions
The next step in the practice of EBM, which follows asking questions, searching and
appraising the literature, applying results to individuals, and presenting it in appropriate
ways to patients, is to determine the particular model of clinician-patient interaction that
the patient is seeking. Possibilities range from no clinician input at all, even for the
provision of appraised evidence, to complete dependence on the clinician for the
interpretation of evidence and the choice of interventions.
School of Population Health
169
EBP Workbook 05
There are many determinants of such models. Failure to appreciate the differences in
models and the range of possible determinants is a significant source of
miscommunication and discontent in clinician-patient relationships. Broad determinants,
which may be different at different times, even for the same patient-clinician pairs include:
• the particular clinician
• the particular patient
• the setting in which patient and clinician interact
• the acuity (real or perceived) of the problem, disease or illness
As for the perceptions of the particular risks of diseases and benefits of interventions, the
selection of specific clinician-patient interaction models also reflects cultural and
sociological influences. The choice of model cannot always be assumed, however, and
patients and clinicians can usefully interact to establish that model which is best suited to
the current situation.
A variety of models have been suggested. (Emanuel EJ and Emanuel LL 1992) The first
is called “paternalistic”, where the clinician makes decisions, the second, “informative”,
where the clinician provides all relevant data, or access to such data. The third is called
“interpretative”, the clinician providing selected data after making efforts to determine
patients’ values. The fourth, “deliberative”, is where selected data are provided after the
clinician has assisted the patient to define their own values. Frameworks for more
“integrated decision making” (Trevena l and Barrat A 2003), and for the teaching and
learning of “shared decision-making” (Towle A and Godolphin W 1999) are evolving.
8.2.4
Answering patients’ questions concerning prognosis
and cause and the risks and benefits of treatments and tests
In spite of clinician adherence to the issues of applicability, patients’ perceptions, and
concern for the manner of information presentation, additional questions often arise.
These are often resolved by further discussion but the patient may want more information.
The patient-clinician interaction model may also change again at this stage, and in either
direction, towards greater patient autonomy or dependence.
For all patients, especially those choosing greater autonomy, many readily-accessible
resources are now available. These can enhance clinician-patient concept-sharing and
dialogue. Although the clinician cannot and should not guarantee the validity and
applicability of information, even from “trusted” resources, the data obtained often
stimulates further discussion and better resolution of those issues which bother patients.
Consumers, unlike some clinicians, have very few opportunities to access decision
support ‘Systems’ (Haynes RB 2001), although some ‘Synopses’, and many ‘Syntheses’
and primary ‘Studies’ are now available to consumers through resources like the
Cochrane Library and PubMed. Most of this information is designed for clinicians, but
increasing numbers of resources, specifically designed for consumers, are now becoming
available. These more scientific and evidence-based resources supplement traditional
consumer “background” clinical data, derived from the experiences of others, especially
family and friends. Text, visual and electronic material from numerous sources, “framed”
in various ways, still complements the verbal accounts of others, to shape information and
attitudes. Evidence-based consumer-specific information, which can enhance
School of Population Health
170
EBP Workbook 05
“background’, and at times “foreground” information, includes pamphlets and electronic
material prepared by discipline-specific professional societies (eg Gastroenterological
Society of Australia) and foundations (eg National Heart Foundation, Stroke Foundation).
Several medical journals (eg Annals of Internal Medicine, JAMA, UpToDate), and the
Cochrane Collaboration Consumer Network also publish and/or collate consumer-specific
material.
Useful web addresses for both “background” and “foreground” data for patients seeking
these are listed below. Some of these sites also contain worthwhile “links” to other
resources as well:
“Better Health Channel”: http://www.betterhealth.vic.gov.au
This is a Victorian DHS facility. Search in the window provided, but also check the
“links” for more Australian and International sites.
“Entrez-PubMed”
Search in “Google” (http://www.google.com) for “Entrez-PubMed”. Then click on
“consumer health” related resources” in the lower-left third of the “Entrez-PubMed”
home page, and select a topic to search. This USA site gives access to much data for
consumers, but not all of it may be valid.
http://www.healthinsite.gov.au
This is an Australian Commonwealth Government site.
http://www.cochraneconsumer.com
This is a site specifically for consumers provided by the Cochrane Collaboration. It is a
rich source of high-quality material.
Cochrane Library
Free access from Australia is through the Australian National Institute of Clinical
Studies (NICS) web page: http://www.nicsl.com.au. The NICS home page also
includes instructions on how to search the Cochrane Library, which includes systematic
reviews and randomised controlled trials.
8.3 Recommended reading
Edwards A, Elwyn G, Mulley A. Explaining risks: turning numerical data into meaningful
pictures. BMJ 2002;324:827-830
Gordon-Lubitz RJ. Risk communication: Problems of presentation and understanding.
JAMA 2003;289:295
Guyatt GH, Haynes RB, Jaeschke RZ, Cook DJ, Green L, Naylor DC, Wilson
MC, Richardson WS. Users’ guides to the medical literature XXV. Evidence-based
medicine: Principles for applying the users’ guides to patient care. JAMA 2000;284:12901296
Komesaroff PA. Ethical perspectives on the communication of risk. Australian Prescriber
2003;26:44-45
Slovic P. Perception of risk. Science 1987:236:280-285
School of Population Health
171
EBP Workbook 05
8.4 Further reading
Adams AM, Smith AF. Risk perception and communication: recent developments and
implications for anaesthesia. Anaesthesia. 2001;56:745-755
Charles C, Whelan T, Gafni A. What do we mean by partnership in making decisions
about treatment? BMJ 1999; 319: 780-782
Dans AL, Dans LF, Guyatt GH, Richardson R. Users’ guides to the medical literature XIV.
How to decide on the applicability of clinical trial results to your patient. JAMA
1998;279:545-549
Edwards A, Elwyn G. Understanding risk and lessons for clinical risk communication
about treatment preferences. Quality in Health Care 2001; 10: i9-i13
Irwig J, Irwig L, Sweet M. Smarter Health Choices. How to make better health decisions.
1999.Allen& Unwin. NSW. Australia. (EBP written for patients!)
Lloyd AJ. The extent of patients’ understanding of the risks of treatments. Quality in
Health care 2001;10:i14-i18
McAlister FA, Straus SE, Guyatt GH, Haynes RB. Users’ guides to the medical literature
XX. Integrating research evidence with the care of the individual patient. JAMA 2000;283:
2829-2836
O’Connor AM, Stacey D, Entwistle E, Llewellyn-Thomas H, Rovner D, Holmes- Rovner M,
Tait V, Tetroe J, Fiset V. Barry M, Jones J. Decision aids for people facing health
treatment or screening decisions (Cochrane Review). In: The Cochrane Library, Issue 2
2003. Oxford: Update Software.
8.5 References
Counsell CE, Clarke MJ, Slattery, J, Sandercock, PA. The miracle of DICE therapy for
acute stroke: fact or fictional product of subgroup analysis? BMJ. 1994; 309:1677-1681.
Emanuel EJ, and Emanuel LL. Four models of the physician-patient relationship. JAMA.
1992;267:2211-2226.
Glasziou PP, Irwig, LM. An evidence based approach to individualising treatment. BMJ.
1995;311:1356-1359.
Hart RS, et al. Lessons from the stroke prevention in atrial fibrillation trials. Ann Int Med.
2003;138:831-838.
Haynes RB, Of studies, syntheses, synopses, and systems: the "4S" evolution of services
for finding current best evidence. ACP J Club. 2001. Mar-Apr;134(2):A11-3.
Oxman AD, Guyatt GH. A consumer’s guide to subgroup analysis. Ann Int
Med.1992;116:78-84.
School of Population Health
172
EBP Workbook 05
Towle A, Godolphin W. Framework for teaching and learning informed decision-making.
BMJ. 1999;319:766-771.
NHMRC. How to present the evidence for consumers: preparation of consumer
publications. Commonwealth of Australia. 2000.
Trevena l, Barrat A. Integrated decision making; definitions for a new discipline. Patient
Education and Counselling. 2003;3:265-268
Van Walraven C, et al. A clinical prediction rule to identify patients with atrial fibrillation
and a low risk for stroke while taking aspirin. Arch Int Med. 2003;163:936-943.
Writing group for the Women’s Health Initiative (WHI) Randomised Control Trial. Risks
and benefits of oestrogen plus progestin in healthy postmenopausal women. Principal
results from the WHI Randomised Controlled Trial. JAMA. 2002;288:321-333.
School of Population Health
173
EBP Workbook 05
9.
CONTRIBUTORS AND AKNOWLEDGEMENTS
The first edition of this workbook was prepared in 2002 by A/Professor Don Campbell
(Director), Dr Renee Manser (Research Fellow) and Dr Marg de Campo (Project Director),
Clinical Epidemiology and Health Service Evaluation Unit, Royal Melbourne Hospital /
Melbourne Health.
These authors were assisted through formal and informal discussion with the members of
the Unit, by academics from the Faculty of Medicine Dentistry and Health Sciences,
University of Melbourne, especially those from the School of Population Health and the
Faculty Education Unit, and by clinicians from the teaching hospitals. The authors
acknowledge discussions, input and illustrations provided by Professor Rod Jackson,
Professor of Epidemiology, School of Population Health and University of Auckland.
The contributions of Professor Terry Nolan, A/Professor Geoff McColl, Drs Caroline
Brand, Roger Brown, Shlomo Cohney, Jenny Conn, Peter Greenberg and Martin Wright,
Mr Noel Atkinson and Bruce Mann are noted. Many medical students also contributed to
the development of the workbook. Ms Wendy Lemaire, Ms Lori McLeod and Ms Janice
Powell provided invaluable support.
Some editing and additions for 2003 and 2004 were made by Dr Peter Greenberg and
Professor Jeremy Anderson, supported by Ms Rita Ward, Ms Janice Powell and Ms Katie
Dumas. In 2005, editing and additions to the first three chapters were made by Dr Peter
Greenberg, assisted by Ms Rita Ward and Ms Katie Dumas, with input from Ms Elizabeth
Deans and Dr Simon Chatfield.
School of Population Health
174
EBP Workbook 05
10. GLOSSARY OF TERMS
Terms used in therapeutics
Allocation concealed: deemed to have
taken adequate measures to conceal
allocation to study group assignments
from those responsible for assessing
patients for entry in the trial (e.g., central
randomisation; sequentially numbered,
opaque, sealed envelopes; sealed
envelopes from a closed bag; numbered
or coded bottles or containers; drugs
prepared by the pharmacy; or other
descriptions that contain elements
convincing of concealment).
Allocation not concealed: deemed to
have not taken adequate measures to
conceal allocation to study group
assignments from those responsible for
assessing patients for entry in the trial
(e.g., no concealment procedure was
undertaken, sealed envelopes that were
not opaque, or other descriptions that
contain elements not convincing of
concealment).
Unclear allocation concealment: the
authors of the article did not report or
provide us with a description of an
allocation concealment approach that
allowed for classification as concealed or
not concealed.
Blinded: any or all of the clinician,
patients, participants, outcome assessors,
or statisticians were unaware of who
received which study intervention. Those
that are blinded are indicated in
parentheses. If “initially” is indicated (e.g.,
blinded [patients and outcome assessor
initially]), the code was broken during the
trial, for instance, because of adverse
effects.
Blinded (unclear): the authors did not
report or provide with an indication of
whom, if any one, was unaware of who
received which study intervention.
Unblinded: all participants in the trial
(clinicians, patients, participants, outcome
assessors, and statisticians) were aware
of who received which study intervention.
WHEN THE EXPERIMENTAL
TREATMENT REDUCES THE RISK FOR
A BAD EVENT
RRR (relative risk reduction): the
proportional reduction in the rates of bad
events between experimental
(experimental event rate [EER]) and
control (control even rate [CER]) patient in
the trial, calculated as |EER-CER|/CER
and accompanied by a 95% confidence
interval (CI).
ARR (absolute risk reduction): the
absolute arithmetic difference in even
rates, |EER-CER|
NNT (number needed to treat): the
number of patients who need to be treated
to prevent one additional bad outcome;
calculated as 1/AAR, rounded up to the
next highest whole number, and
accompanied by its 95% CI.
WHEN THE EXPERIMENTAL
TREATMENT INCREASES THE
PROBABILITY OF GOOD EVENT
RBI (relative benefit increase): the
increase in the rates of good event,
comparing experimental and control
patients in a trial, also calculated as |EERCER|/CER/.
ABI (absolute benefit increase): the
absolute arithmetic difference in event
rates, |EER-CER|.
NNT: calculated as 1/ABI; denotes the
number of patients who must receive the
experimental treatment to create one
additional improved outcome in
comparison with the control treatment.
WHEN THE EXPERIMENTAL
TREATMENT INCREASES THE
PROBABILITY OF A BAD EVENT
RRI (relative risk increase): the increase
in rates of bad events, comparing
experimental patients to control patients in
a trial, and calculated as for RBI. RRI is
also used in assessing the effect of risk
factors for disease.
ARI (absolute risk increase): the
absolute difference in rates of bad events,
when the experimental treatment harms
School of Population Health
175
EBP Workbook 05
more patients that the control treatment;
calculated as for ABI.
NNH (number needed to harm): the
number of patients who, if they received
the experimental treatment, would lead to
one additional person being harmed
compared with patients who receive the
control treatment; calculated as 1/ARI.
Confidence interval (CI): the CI
quantifies the uncertainty in measurement;
usually reported as 95% CI, which the
range of values within which we can be
95% sure that the true value for the whole
population lies.
Target disorder
Present
Absent
Positive
a
b
Negative
c
c
Test result
Terms used in diagnosis
Sensitivity: the proportion of patients with
the target disorder who have a positive
test result (a/[a + c]) (Figure).
Specificity: the proportion of patients
without the target disorder who have a
negative test result (d/[b + d\) (figure).
Pre-test probability (prevalence): the
proportion of patients who have the target
disorder, as determined before the test is
carried out ([a + c]/[a + b + c + d])
(Figure).
Pre-test odds: the odds that the patient
has the target disorder before the test is
carried out (pre-test probability /[1 – pretest probability]).
Likelihood ratio (LR): the ratio of the
probability of a test result among patients
with the target disorder to the probability
of that same test result among patients
who are free of the target disorder. The
LR for a positive test is calculated as
sensitivity /(1 – specificity). The LR for
negative test is calculated as (1 –
sensitivity)/specificity.
Post-test odds: the odds that the patient
has the target disorder after the test is
carried out (pre-test odds x LR)
Post-test probability: the proportion of
patients with that particular test result who
have the target disorder (post-test odds
/[1+ post-test odds]).
School of Population Health
176
EBP Workbook 05
11. BIBLIOGRAPHY
Altman D. Confidence intervals for the number needed to treat. BMJ 1998;317:1309-1312.
Antman EM, Lau, J, et al. A comparison of results of meta-analysis of randomised control
trials and recommendations of clinical experts. Treatments for myocardial infaction. JAMA
1992;268:240-248.
Bartel AG, Behar VS, et al. Graded exercise stress tests in angiographically documented
coronary heart disease. Circulation 1974;49:348-356.
Bradley JD, Brandt KD, et al. Comparison of an anti-inflammatory dose of ibuprofen, an
analgesic dose of ibuprofen, and acetaminophen in the treatment of patients with
osteoarthritis of the knee. N Eng J Med 1991;325:87-91.
Colditz GA, Miller, JN, et al. How study design affects outcomes in comparisons of
therapy. 1: Medical. Stat Med 1989;8:441-454.
Cook DJ, Guyatt GH, et al. (1995). Clinical recommendations using levels of evidence for
anthithrombotic agents. Chest 1995;108(4 Suppl):227S-230S.
Cook RJ, Sackett DL. The number needed to treat: A clinically useful measure of
treatment effect. BMJ 310:452-454.
Cordes RJ. And Ryan ME. Pitfalls in HIV testing. Application and limitations of current
tests. Postgraduate Medicine 1995;98:177-180.
Crombie IK. A Pocket Guide to Critical Appraisal. London, BMJ Publishing Group. 1996.
Dans AL,Dans LF et al. Users' guides to the medical literature: XIV. How to decide on the
applicability of clinical trial results to your patient. JAMA 1998;279:545-549.
Davie AP, Caruana F et al. Assessing diagnosis in heart failure: which features are any
use? Quart J Med 1997;90:335-339.
Deyle GD, Henderson NE et al. Effectiveness of manual physical therapy and exercise in
osteoarthritis of the knee. A randomised, controlled trial. Annals of Internal Medicine
2000;132:173-181.
Dickersin K, and Berlin, JA. Meta-analysis: State-of-the-science. Epidemiologic Reviews.
JAMA 1992;14:154-176.
Ebell MH, Barry HC et al. Finding POEMS in the medical literature. The Journal of Family
Practice 1999;48:350-355.
Fagevik Olsen M, Hahn, I et al. Randomised controlled trial of prophylactic chest
physiotherapy in major abdominal surgery. British Journal of Surgery 1997;84:1535-1538.
Feinstein A. The Architecture of Clinical Research. Clinical Epidemiology. Philadelphia,
Saunders. 1985;39-52.
Fletcher RH, Fletcher SW et al. Diagnosis. Clinical Epidemiology: the essentials.
Baltimore, USA, Williams & Wilkins. 1988;43-74.
Fletcher RH, Fletcher SW et al. Chapter 3. Clinical Epidemiology: the essentials.
Baltimore, Williams & Wilkins. 1988.
Fletcher RH, Fletcher SW, et al. Chapter 7: Treatment. Clinical Epidemiology: the
essentials. Baltimore, Williams & Wilkins. 1988;129-156.
Fletcher RH, Fletcher SW, et al. Chapter 9: Chance. Clinical Epidemiology: the essentials.
Baltimore, Williams & Wilkins. 1988;173-187.
School of Population Health
177
EBP Workbook 05
Friedland D. Evidence-Based Medicine: A frame work for clinical practice. EvidenceBased Medicine: A frame work for clinical practice. M. Friedland DJ and D. o. M. Assistant
Clinical Professor, University of California, San Francisco. Connecticut, Appleton and
Lange. 1998.
Gerstman BB. Identification of Disease, Part 1 (Reproducibility and Validity). Epidemiology
Kept Simple: An Introduction to Classic and Modern Epidemiology. Wiley-LISS. Canada,
A John Wiley and Sons, Inc. 1998;54-83.
Gibson PG. Glucocorticoids reduced short-term treatment failure in exacerbations of
chronic obstructive pulmonary disease. ACP Journal Club 2000;132: 14.
Greenhalgh T. Chapter 3: Getting your bearings (what is this paper about?). How to read
a paper. London, British Library Cataloguing in Publication Data: 1997;35-53.
Greenhalgh T. How to read a paper: papers that summarise other papers (systematic
reviews and meta-analyses). BMJ 1997;315:672-675.
Greenhalgh T. How to read a paper: the basics of evidence-based medicine. London,
BMJ. 1997.
Grimes DA, and Schulz KF. An overview of clinical research: the lay of land. Lancet
2002;359:57-61.
Guyatt G, Jaeschke R, et al. Basic Statistics for Clinicians: 2. Interpreting study results:
confidence intervals. Canad Med Assoc J. 1995;152:169-173.
Guyatt G, Sackett DL et al. Users' guides to medical literature: II. How to use an article
about therapy or prevention. A. Are the results of the studies valid? JAMA.
1993;270:2598-2601.
Guyatt G, Sackett DL et al. Users' guides to the medical literature. II: How to use an article
about therapy or prevention. B. What were the results and will they help me in caring for
my patients? JAMA. 271:59-63.
Guyatt G, Sackett DL, et al. Users' guides to the medical literature: IX. A method for
grading health care recommendations. JAMA. 1995;274:1800-1804.
Halkin A, Reichman J, et al. Likelihood ratios: getting diagnostic testing into perspective.
Quart J Med. 1998;91:247-258.
Kunz V, and Oxman A. The unpredictability paradox: review of empirical comparisons of
randomised and non-randomised clinical trials. Evidence Based Health Care Workbook.
London, BMJ Publishing Group. 2000;73-81.
Manser R, and Walters EH. What is evidence-based medicine and the role of systematic
review: the revolution coming your way. Monaldi Arch Chest Disease 2001;56:33-38.
Marshall J. Prophylactic chest physiotherapy reduced pulmonary complications after
major abdominal surgery. ACP J Club 1998;3:106.
Moher D. Jadad AR et al. Assessing the quality of randomised controlled trials: an
annotated bibliography of scales and checklists. Controlled Clinical Trials 1995;16:62-73.
Mulrow C. Rationale for systematic reviews. BMJ 1994;315:597-599.
Mulrow C. and Cook D. Systematic Reviews: synthesis of best evidence for health care
decisions. ACP, Philadelphia. 1998.
School of Population Health
178
EBP Workbook 05
Niewoehner DE, Erbland ML et al. Effect of Systemic Glucocorticoids on Exacerbations of
Chronic Obstructive Pulmonary Disease. The New Journal of Medicine 1999;340:19411947.
Oxman AD, Sackett DL et al. Users' guide to the medical literature: I. How to get started.
JAMA 1993;270:2093-2095.
Peabody, F, The Care of Patient. JAMA 1927;8:877-882.
Plehn JF, Davis BR, et al. Reduction of stroke incidence after myocardial infarction with
pravastatin: the Cholesterol and Recurrent Events (CARE) Study. Circulation 1999:216223.
Reid MC, Lachs MS et al. Use of methodlogical standards in diagnostic test research.
Getting better but still not good. JAMA. 1995;274:645-651.
Richardson WS, Wilson MC, Nishikawa J et al. The well-built clinical question: a key to
evidence-based decisions. ACP Journal Club. 1995;123:A12-A13.
Richardson WS. (1998). Ask and you shall retrieve [EBM note]. Evidence-Based Medicine
3.
Sackett DL, Rosenberg WM, et al. Evidence based medicine: what it is and what it isn't.
BMJ. 1996;312:71-72.
Sackett DL, Haynes RB et al. Clinical Epidemiology: A basic science for clinical medicine.
London, Brown and Company. 1991.
Schroen AT, Detterbeck FC et al. Beliefs among pulmonologists and thoracic surgeons in
the therapeutic approach to non-small cell lung cancer. Chest 2000;118:129-137.
Schulz KF, Chalmers I et al. Empirical evidence of bias. Dimensions of methodological
quality associated with estimates of treatment effects in controlled trials. JAMA 1995;273:
408-412.
Straus S. Richardson SR. Glasziov P. Haynes BR. Evidence-Based Medicine. How to
Practice and Teach EBM. 3rd ed. Elsevier, Churhcill, Livingstone. 2005
Sunyer J, Anto JM et al. Sex differences in mortality of people who visited emergency
rooms for asthma and chronic obstructive pulmonary disease. AMJ Respir Crit Care Med
1998;158:851-856.
The Cochrane Library. Cochrane Handbook. Oxford, Update Software. 2000.
School of Population Health
179


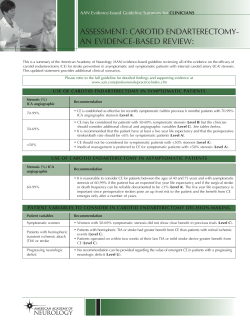


© Copyright 2026