
China Invests in Europe Patterns, Impacts and Policy Implications
China Invests in Europe
Patterns, Impacts and Policy Implications
Thilo Hanemann and Daniel H. Rosen
1 CHINESE DIRECT INVESTMENT IN EUROPE
June 2012
China Invests in Europe
Thilo Hanemann and Daniel H. Rosen
Rhodium Group
June 2012
In partnership with:
COPYRIGHT © 2012 RHODIUM GROUP, LLC. ALL RIGHTS RESERVED
Disclaimer: Although the authors of this report have used their best efforts in its preparation, they assume no responsibility
for any errors or omissions, nor any liability for damages resulting from the use of or reliance on information contained
herein.
About the Authors
THILO HANEMANN
Thilo Hanemann is Research Director at Rhodium Group, a specialized economic
research firm advising the public and private sectors. His research focuses on China’s
macroeconomic development and the implications for global trade and investment
flows. Mr. Hanemann works with the private and public sectors in assessing China’s
role in global cross-border investment transactions. He is a frequent speaker and
commentator on China’s outward investment and has published numerous articles
and reports on the topic. In May 2011, he co-authored Rhodium Group’s authoritative
report on Chinese investment in the United States (“An American Open Door?
Maximizing the Benefits of Chinese Foreign Direct Investment”). A major study
(with Mr. Rosen) on China’s global outward direct investment is scheduled for
release in winter 2012 from the Peterson Institute for International Economics in
Washington, DC.
DANIEL H. ROSEN
Daniel H. Rosen is Founder and China Practice leader of Rhodium Group. Mr. Rosen
is an Adjunct Associate Professor at Columbia University, where he has taught a
graduate seminar on the Chinese economy at the School of International and Public
Affairs since 2001. He is a Fellow with the Peterson Institute for International
Economics in Washington, DC, where he has been affiliated since 1993. His sixth
Institute book, on China-Taiwan economic relations, was published in December
2010. From 2000-2001 he was Senior Advisor for International Economic Policy at
the White House National Economic Council and National Security Council, where
he played a key role in completing China’s accession to the World Trade
Organization. Mr. Rosen is a Member of the Council on Foreign Relations, and serves
on the Board of the National Committee for US-China Relations.
Contents
Executive Summary ................................................................................................3
Introduction: New Investors at the Gate .................................................................. 9
1. Turning Point: China’s Rise as Global Direct Investor .......................................... 13
1.1 The Tide Is Turning for China’s FDI Flows ...................................................... 13
1.2 China’s Significance as Global Investor: Low Base, Fast Growth ...................... 14
1.3 Outlook: The Catch-Up Process Has Just Begun .............................................. 16
2. Drivers: The Political Economy of Chinese Outward FDI .....................................20
2.1 Early Stage Investments: Technology Upgrades and Trade Facilitation ...........20
2.2 The Big Awakening: Buying Into China’s Commodity Boom .......................... 22
2.3 The Next Stage of Outward Investment: Going Truly Global .......................... 25
3. Patterns: Chinese Direct Investment in the EU-27 ............................................... 32
3.1 The Inflection Point: Fast Growth from Low Base ........................................... 32
3.2 Geographic Distribution: New Investors on Old Paths .................................... 36
3.3 Industries Targeted by Chinese Investors ..................................................... 40
3.4 Investors and Ownership Structures ............................................................. 45
4. Impacts: Benefits and Risks ............................................................................... 49
4.1 Economic Impacts........................................................................................ 49
4.2 Political Impacts ........................................................................................... 59
4.3 National Security......................................................................................... 60
4.4 Net Assessment: Is China Different? .............................................................. 62
5. Policies and Politics: Priorities in the Era of Chinese Investment.......................... 63
5.1 Keeping the Door Open ................................................................................. 63
5.2 Addressing Real Economic Concerns............................................................ 67
5.3 Re-Thinking the European Approach to National Security Screening ............ 69
5.4 Attracting Chinese Investment ..................................................................... 73
6. Conclusions and Policy Recommendations ........................................................ 76
References ........................................................................................................... 79
Appendix: Data on Chinese Investment in Europe .................................................. 91
1 CHINA INVESTS IN EUROPE
Acknowledgements
We are grateful to a considerable number of people for their valuable contributions
to and support of this study.
Our corporate partners, China International Capital Corporation (CICC) and
Brunswick Group, have provided support and encouragement throughout the
drafting and roll-out phase. We also want to thank Bruegel, the German Marshall
Fund and the European Council on Foreign Relations for assisting us with
dissemination and public discussion of results.
Our reader-reviewers Jacob Kirkegaard at the Peterson Institute for International
Economics, Jonas Parello-Plesner at the European Council of Foreign Relations and
Nicolas Véron at Bruegel provided critical feedback, and helped construct our
discussions on the data and the policy process, respectively.
A wide range of industry practitioners provided insights for this study. In particular
we wish to thank Frank Xu at CICC, Neil McMillan at Brunswick, and Jörg Wuttke at
BASF, whose feedback and insights helped us to better understand the deal-making
environment.
We benefitted greatly from discussions with a wide range of individuals involved in
investment policy-making at various institutions in Europe, China and the United
States, including the European Commission’s DG Trade, DG Enterprise and DG
Competition, the European External Action Service, China’s Ministry of Commerce,
China Exim Bank, China Development Bank, the bureau of research at China’s Stateowned Assets Supervision and Administration Commission, Germany Trade and
Invest, the SelectUSA team and the Bureau of Economic Analysis.
We owe a debt of gratitude to a number of fellow Peterson Institute economists who
have worked on the larger topic of OFDI in the past. Important among these are Ted
Moran, Monty Graham (1944–2007) and Ted Truman. Fred Bergsten, the Peterson
Institute’s Director, has been hugely supportive of our previous and ongoing work on
this subject. Both authors also benefitted immensely from the discussions at the
China-Stockholm Forum, organized by the German Marshall Fund, the Swedish
Ministry for Foreign Affairs and the Riksbankens Jubileumsfond.
Finally, special thanks go to our colleagues at Rhodium Group in New York City for
their research support and superb critical comments. Hua Pan and Adam Lysenko in
particular have been critical to our data assessment and chart work. Shashank Mohan
helped to optimize our search algorithms and quantitative analysis. And last, but not
least, Michelle McKeehan has been critical in the editorial process, making the study
vastly more readable and polished. While all these people improved the outcome,
imperfections surely remain, which are solely the responsibility of the authors.
Thilo Hanemann, Daniel H. Rosen
(New York, June 2012)
ACKNOWLEDGEMENTS 2
Executive Summary
Europe is experiencing the start of a structural surge in outbound direct investment
in advanced economies by Chinese firms. The take-off was only recent: annual
inflows tripled from 2006 to 2009, and tripled again by 2011 to $10 billion (€7.4
billion) for the year. The number of deals with a value of more than $1 million
doubled from less than 50 to almost 100 in 2010 and 2011.
To many business leaders and policymakers, the drivers, motives, patterns and
impacts of this buying spree seem impenetrable. Neither Chinese nor European
official investment data are sufficient for making sense of this new investment boom.
But an alternative approach, based on the collection of data on Chinese greenfield
and mergers and acquisitions (M&A) transactions in Europe since 2000, can resolve
many of the mysteries surrounding this promising new channel of investment, and
point the way to an effective European response to Chinese foreign direct investment
(FDI).
DRIVERS AND MOTIVES
Our detailed data support the view that Chinese direct investment in Europe is driven
overwhelmingly by commercial motives. Chinese policy is playing a role, but
mostly in terms of getting government out of the way so firms can make more
rational judgments about locating operations. Direct political guidance has played a
very minor role in Chinese investment in Europe thus far. China’s industrial policies
and encouragement (via offered low-interest capital) of going abroad are impacting
investment decisions, but they are not the primary reasons why firms from China are
appraising opportunities in the European Union (EU). The mix of industries targeted,
the high number of private enterprises making investments, and the competitive
behavior of companies from the People’s Republic after they arrive and set up shop in
Europe all point to profit as the greatest motive in China’s outward FDI story.
The profit drive of Chinese executives is colored by a broad range of considerations.
For many, the acquisition of rich-world brands or a technological edge is the key
element for breaking away from a fiercely competitive pack back home. Often times,
it has proven cheaper and more rewarding to situate higher value-added activities in
advanced regulatory locations like Europe. For other Chinese buyers, the crisis in the
West presents the prospect of discounted prices, while an increasingly stronger
renminbi is making European (and American) assets look more attractive. For
Chinese contract manufacturers of the labor intensive products Europeans consume,
defending market share increasingly means expanding market presence. As a direct
investor, Chinese exporters are able to relate directly with customers and deliver
more of the value that makes up profits today.
3 CHINA INVESTS IN EUROPE
PATTERNS
The patterns of direct investment by Chinese firms provide a window into China’s
evolving motives and capabilities. Our dataset shows a profound post-2008 surge
which the official data sources are missing: from less than $1 billion (€700 million)
yearly 2004-2008, annual OFDI flows to Europe tripled to roughly $3 billion (€2.3
billion) in 2009 and 2010 before tripling again to almost $10 billion (€7.4 billion) in
2011. The absolute values remain small compared to Europe’s total inward FDI stock,
but the change in trend line is what matters. The number of annual investments with
a value of more than $1 million grew from less than 10 a decade ago to 50 in 2007 and
almost 100 in 2010 and 2011.
Geographically China’s OFDI preferences look typical for Europe, with the three
biggest economies—France, the United Kingdom and Germany—in the lead. This
pattern supports the notion that China is investing like any other commercially
motivated investor, not in some odd and idiosyncratic way. By coding the ownership
patterns of Chinese deals, we also find that acquisitions are more frequent in the
Western European core; the new EU member states of Eastern Europe see almost
entirely greenfield investments, with a few exceptions. We see practically no
evidence of declining OFDI prospects for states which run afoul of China politically
over issues such as Tibet or arms sales, or rewards in the form of FDI for states which
hew closer to Beijing’s assumed preferences; at the end of the day, it’s hard enough to
make money as a Chinese firm overseas without having a volatile political agenda
foisted upon management.
The sectoral mix of Chinese investment in Europe tells us that a shift is under way.
Chinese deals are less dominated by natural resources and trade facilitation
objectives and more concerned with the full range of industries and assets spread
widely across Europe. Of the 30 sectors we track, 18 show over $200 million in deals; 9
show over $1 billion. Several sectors show greenfield projects at several hundreds of
millions of dollars – unusual for a “developing country”. The bottom line from our
detailed analysis is there is breadth and momentum across the board, not cherry
picking in a handful of strategic industries.
Another useful perspective is Chinese investment by ownership of the investing
firm. While Europeans are somewhat less incensed about statism than many of their
American cousins, it is nonetheless useful to discover that – as across the Atlantic –
about two-thirds of all deals, or 359 of 573, are done by privately held or non-state
publicly traded firms. Due to a handful of large-scale acquisitions in capital intensive
sectors, this picture reverses when looking at ownership in terms of total deal value:
72% of the total $21 billion originates from state-owned enterprises. Not only is the
ownership mix consistent with a benign model of China’s OFDI story, but it also
makes European interests compatible with the United States in this regard.
Finally, the similarity in patterns between Chinese investment in Europe and the
United States is more than superficial. In rough value terms (stock and flow), in the
breadth of the industrial mix, and in ownership patterns, the US and EU have much
EXECUTIVE SUMMARY 4
in common. Thus far they have responded to the advent of Chinese investment in
parallel but very separate ways, with similar results—contrary to all the talk about
America’s higher bar for national security screening. China needs the opportunity to
invest in both the US and Europe – not either/or – and should OECD nations decide to
coordinate international investment regimes more closely, underlying interests
should be fully compatible.
IMPACTS
The arrival of China’s firms elicits both excitement and anxiety, as the new investors
are still unknown and the impacts of their investment unclear. A good analysis of the
impacts of Chinese investment on Europe is difficult because the lion’s share of dealflow is so new, and has not yet fully demonstrated its potential – either positive or
negative. We present an integrated approach, combining an informed view on the
evolution and status quo of the Chinese economy, historical data on foreign
investment, and our database on Chinese investment projects in the EU, to discuss
the impact of Chinese FDI in Europe from the perspectives of economics, politics and
national security.
In the aggregate, Chinese FDI should deliver the same economic benefits as other
direct investment flows, whether from inside or outside the EU. Foreign direct
investment increases the welfare of both producers and consumers. It allows firms to
explore new markets and operate more efficiently across borders, reducing
production costs, increasing economies of scale and promoting specialization. It is
particularly important when serving overseas markets requires an on-the-ground
presence (for example, in the provision of services). Foreign direct investment also
means better prices for firms looking to divest assets, thanks to a bigger and more
competitive pool of bidders. For consumers, it increases the contest for buyers'
attention, leading to more choices, lower prices and innovation. And in local
communities, foreign investment brings new jobs, tax revenue, and knowledge
spillovers from worker training, technology transfers and R&D activities.
In terms of new capital we project $1-2 trillion in global Chinese OFDI from 20102020. At that rate, if Europe continues to attract the same share of global FDI as in the
2000s – around 25% -- then by 2020 Europe would see $250-500 billion cumulatively
in new Chinese M&A and greenfield investment. Even if Chinese outflows
underperform and Europe ceases to attract as big a share, an annual average of $20-30
billion would be expected for the coming decade. Employment impacts are a
common question when it comes to Chinese investment. Unlike trade, direct
investment is unlikely to be associated with negative effects on employment:
greenfield projects by definition create work that was not there before, and
acquisitions are hard to move and often entail turning around a firm that might have
gone under. We count around 45,000 EU jobs associated with Chinese direct
investors today. Projecting job effects from Chinese FDI is a low-return game – too
many variables enter the mix. However, it is helpful to consider the amount of jobs
created by FDI from other major economies: American firms today cut paychecks to
4.3 million EU citizens. Europeans possess advanced economy workforce skills in rich
5 CHINA INVESTS IN EUROPE
abundance urgently needed in Chinese production chains (including environmental
management and controls, quality assurance, design and innovation, and high
technology), which should help to sustain the positive momentum.
We catalogue the potential for negative economic consequences arising from
Chinese investment to the extent possible as well, bearing in mind that such
concerns are tomorrow’s worry more than today’s. As a still minor contributor to
total EU direct investment, China is unlikely to be distorting asset prices or market
efficiency at present – and in fact may well be improving it. However, there are
Chinese economists arguing that China’s tendency to gradually converge toward
market norms of macroeconomic management, pro-competitive regulatory
outcomes and privatization has slowed or even reversed. The massive debate on this
subject is beyond the scope of this study. But in an era of global operations by Chinese
firms (state-owned or otherwise), it is vital to think through the global economic
implications of a future, less market-oriented China. We present four concerns that
require attention in Europe in this regard: greater Chinese investment could expose
Europe to macroeconomic volatility if there is a significant economic disruption in
the years ahead; Chinese firms could have a preference to reorganize operations
according to industrial policy directives and move high value activities back home
after making acquisitions; features from China’s unique economic structure could
spill over through FDI and threaten market-based competition in the European
marketplace; and a race to the bottom to attract Chinese investment could negatively
impact European welfare.
In addition to economic implications, we also consider the political impacts of
Chinese FDI in Europe. It is natural that Chinese officials might threaten to withhold
direct investment if they believed doing so could affect European politics. Based on
our analysis, however, Chinese firms are less subject to Beijing’s puppetry than many
observers believe. As noted above, direct investment (unlike portfolio investment)
cannot be easily liquidated or withdrawn to communicate short-term political
signals. The selection of investment targets requires arduous work by Chinese firms,
and is undertaken for commercial reasons, not at the behest of back-room political
strategists. These firms are not investing in Europe out of charity or with a foreign
policy goal in mind; they are trying to defend market share in the rich world, acquire
technologies and brands to stave off fierce competitors back home, or achieve some
other commercial imperative. That said, there is ample reason to anticipate attempts
by Beijing to mix money with politics – they already have with Japan over rare earths,
and Europe over support for crisis stabilization funds.
Finally, while national security fears related to foreign investment are not new,
China presents particular concerns. For one, China will likely be the world’s largest
economy within two decades, lending it huge leverage and power to shape global
national security. Second, China is a one-party authoritarian state with values at
variance and sometimes at odds with those of OECD countries. State ownership and
influence create special concerns about government-driven, non-commercial
motives for investing. Third, China is not a European ally but an emerging power
with a modernizing military. China and Europe currently have good relations but
EXECUTIVE SUMMARY 6
there is uncertainty about the future: China has a stated aspiration to displace the
existing global power balance in favor of a greater role for itself, including a greater
voting share in international organizations, most likely at Europe’s expense. Fourth,
China has a troubled record on export control rules, and a reputation as a major
proliferator of sensitive technologies to rogue regimes including Iran, North Korea,
and Pakistan. This raises the potential for discord over the obligations of China’s
firms in Europe. Finally, China is considered a heightened threat for economic and
political espionage by the intelligence communities in Europe and North America,
and not without reason.
POLICY RECOMMENDATIONS
The heady growth in Chinese investment in Europe described by this study presents
an impressive picture that warrants an optimistic outlook for Chinese investment in
Europe. As the United States takes the heat for imposing tighter national security
reviews, in relative terms it would appear that Europe is in the fast lane – especially
after 2011’s stellar $10 billion inflows. However we conclude that policy attention to a
number of matters is crucial at this point in time to sustain Chinese investment in
Europe and maximize the benefits from these new capital flows. Several of our
recommendations revolve around a central, simple equation: to support its interests,
Europe needs a common approach to greeting Chinese direct investments as well as
safeguarding against potential economic and political risks. Europe’s current model
of openness will be seriously tested in the future when inflows from China reach
first-tier volumes, not all acquisitions are friendly, and EU austerity is in full swing.
If a pan-European investment policy is to remain free from economic nationalism, it
must assure healthy competition and clear and effective national security screening.
1. Keep the door open. Europe must not risk losing its hard-earned reputation for
openness by imposing additional barriers to capital inflows based on economic
security considerations. Several cases have already raised that specter. There may be
more loopholes for veiled protection in the European framework than admitted, and
the reaction to China is not yet fully tested. Europeans will embrace foreign
investment if they know a thorough, EU-wide process to address concerns is in place,
guided by the principles of openness and non-discrimination.
2. Address market distortions forthrightly. There are concerns about China’s longterm evolution, and the prospect of China’s economic model spilling out with
Chinese firms’ movement abroad. Our advice is not to burden the investment
screening process with “economic security” demands arising from legitimate worries
about China’s system. Nor do we think that reciprocity demands are practical or
productive. Ideally, China will redress aspects of domestic distortion such as
preferential capital costs for state firms, but given the potential risks if this scenario
does not materialize, policy should be in place to protect EU interests via internal
processes including competition policy review. A rational and systematic game plan
for handling the concerns sure to arise over China’s system without risking
investment protectionism is best for Europe; it also lends itself to the prospect of
better coordination internationally to manage the advent of emerging market OFDI.
7 CHINA INVESTS IN EUROPE
By standardizing its internal approach, Europe maximizes its role in joint efforts to
discuss competitive neutrality, state capitalism and other concepts.
3. Take national security seriously. Europe’s current fragmented approach to
screening foreign investment for security threats risks a race to the bottom, fails to
address pan-European national security risks, and offers room for protectionist
abuse in the name of security. A common European concept and legislative
framework for investment review is needed to address these problems and hedge
against a protectionist fallback in the false name of security. Greater transatlantic and
international coordination is needed to reach a consensus on legitimate investment
restrictions and global best practices for investment reviews.
4. Set the right priorities for investment promotion. An EU-China bilateral
investment treaty will help to address market access problems on the European side,
but it will do very little to promote investment flows from China. Tailored
investment promotion approaches that help Chinese investors overcome the hurdles
of entering mature market economies are important to sustain the inflow of Chinese
investment. In the long run, it is critical that Europe finds a way out of its current
crisis. Only a competitive EU economy can sustain foreign investment from China
and other places - and in turn better cope with any challenges it raises.
These findings and policy recommendations are far from comprehensive, but we
hope they will contribute to a better understanding of growing Chinese investment
in Europe and help inform the policy debate. While the growth in recent years is
impressive, many chapters in the story of Chinese EU investment have yet to be
written. Securing the right policy response is crucial, given the potential for future
investment flows and China’s role as test case for a wider range of emerging market
investors.
EXECUTIVE SUMMARY 8
Introduction: New Investors at the Gate
Foreign direct investment (FDI) has been a pillar of European economic and political
integration for the past five decades. 1 With the 1957 Treaty of Rome, six nations
founded the European Economic Community (EEC) and established a common
market based on the “four freedoms” – the free movement of goods, services, people
and capital. By the late 1980s, all capital controls among member states were
abolished, and the freedom of capital movement was subsequently extended to
countries outside the Community. Abolishing capital controls boosted the flow of
FDI both within Europe and with third countries. 2 By 2010, US$8 trillion of intraEuropean FDI stocks were knitting together value chains, empowering firms to serve
customers across borders, and providing consumers with a vast array of goods and
services. Third country inflows, with North American and Japanese firms leading the
pack, have contributed a further $4 trillion to the story.
Today there is broad agreement that the free flow of capital is essential for a wellfunctioning European Single Market, and that openness to global investment is
beneficial for Europe. The fear that cross-border investment threatens to
homogenize Europe lingers and surfaces occasionally; citing this point, governments
have perennially flirted with intervention to protect “strategically important” firms
and industries against takeovers from other EU member states. 3 Investors from
outside the European fence stoke high anxieties too. In the 1960s, Jean-Jacques
Servant-Schreiber warned Europeans that American multinationals were “buying up
Europe”, and would dominate European industry if the continent did not improve its
microeconomic competitiveness. 4 In the 1980s, investment by Japanese firms was as
disconcerting in Europe as it was in the United States. 5 By the late 1990s, the focus
had shifted to the impact of investment from Russia on Europe’s energy supply and
independence. 6 Most recently, growing sovereign wealth fund investment from
Middle Eastern nations has provoked anxious debate. 7
Flare-ups of anxiety have occurred but they have never fundamentally shaken the
consensus that FDI openness is beneficial and necessary for Europe. But a new shift in
global capital flows is now under way, putting Europe’s liberalism to the test once
again: the rise of emerging market outward investment. For decades, the EU, US and
Japan far surpassed the rest of the world in global investment, together making up an
astonishing 72% of global outward foreign direct investment (OFDI) stock. Emerging
markets, who contributed just 2% to global outflows a decade ago, are now rapidly
joining the ranks, seeding 17% of 2010 OFDI flows; the G-3 share of global flows, on
the other hand, has dropped to around 60% (Figure 1). This is not a cyclical
For the history of economic integration and capital liberalization, see Bakker (1995) and Abdelal (2007).
This report uses the term “Europe” in the colloquial sense, referring to Western Europe.
3
For a comprehensive overview, see Table 7 in Chapter 5.
4
See Jean Jacques Servan Schreiber’s bestselling Le Defi Americain (1967).
5
See Probert (1991).
6
See Aslund (2008).
7
See European Commission (2008).
1
2
9 CHINA INVESTS IN EUROPE
phenomenon born out of the global financial crisis— the trend precedes the crisis by
more than half a decade. It is a structural story driven by the greater might of large
emerging nations in the global economy and structural adjustment within these
economies.
Figure 1: Global OFDI Flows: G3 vs. Emerging Markets, 1970-2010
Percent of global OFDI flows, 3 years moving average
100%
90%
80%
70%
60%
G-3
Emerging Markets*
All Others
50%
40%
30%
20%
10%
2010
2008
2006
2004
2002
2000
1998
1996
1994
1992
1990
1988
1986
1984
1982
1980
1978
1976
1974
1972
1970
0%
Source: UNCTAD, Rhodium Group. *Countries included in the Dow Jones Emerging Market Index.
Leading the rise of emerging market OFDI and stirring up controversy across Europe,
is, of course, China. Driven by trade facilitation and natural resources, outward
investment by firms from China has boomed in recent years. China’s outward
investment has grown from an annual average of below $3 billion before 2005 to
more than $60 billion in 2010 and 2011, catapulting it to be one of the world’s ten
biggest exporters of direct investment (Figure 2).
Chinese outward investment is now maturing and evolving, seeking not just natural
resources but operating platforms, brands and technology in developed economies.
As we documented last year, Chinese FDI in the US has grown steeply since 2007,
targeting a broad range of sectors and states. 8 High profile deals demonstrate that
Chinese firms are making similar inroads in Europe – see Geely’s $1.5 billion purchase
of Volvo, the $600 million acquisition of Germany's Medion by Chinese computer
producer Lenovo, or China Investment Corporation’s $3.3 billion investment in
utility giant Gas de France.
8
See Rosen and Hanemann (2011).
INTRODUCTOIN 10
Figure 2: China’s Outward FDI vs. Global FDI Flows, 1982-2011
USD billion
2,500
60
Global Outward FDI Flows (LHS)
2,000
Chinese Outward FDI Flows (RHS)
50
40
1,500
30
1,000
20
500
10
0
1982
1983
1984
1985
1986
1987
1988
1989
1990
1991
1992
1993
1994
1995
1996
1997
1998
1999
2000
2001
2002
2003
2004
2005
2006
2007
2008
2009
2010
2011
0
Source: UNCTAD, PBOC/SAFE, Rhodium Group.
Rising Chinese investment interest presents myriad opportunities for Europe.
Surging investment from China makes up for diminished inflows from traditional
sources, re-ignites growth by providing fresh capital to troubled firms, increases
competition and consumer welfare, and expands European access to one of the
biggest and fastest-growing markets in the world. But these bright prospects carry
darker concerns as well. First, incomplete statistical data and delayed figures allow
only a cloudy, warped idea of the extent and magnitude of Chinese investment.
Second, an air of uncertainty and distrust lingers surrounding the economic and
political risks of Chinese investment, and whether Europe’s current fragmented
policy framework provides a sufficient safeguard. The result is speculation, suspicion
and knee-jerk reactions in European capitals.
This study analyzes the patterns, drivers, and implications of Chinese investment in
Europe, structured around the following six parts:
Part 1 describes the turning point of China’s FDI profile, from one of the world’s
largest importers of FDI to an increasingly important source of outward FDI. An
assessment of past patterns of outward FDI, current stock, and projected economic
size provides the basis for a forward-looking projection of Chinese outward FDI to
2020.
Part 2 explores the motives behind China’s new forays abroad, based on an analysis
of political factors such as capital account liberalization and commercial drivers.
Part 3 turns specifically to the patterns of Chinese direct investment in Europe using
official data and an alternative set of data compiled for this report. In addition to the
11 CHINA INVESTS IN EUROPE
headline figures of Chinese investment, we also analyze the distribution by country
and industry and the landscape of investing entities.
Part 4 analyzes the impacts of Chinese investment in Europe, including economic
benefits and risks and political variables such as national security. A net benefit
analysis helps answer the key question: whether or not China is a unique historical
case, meriting special economic treatment.
Part 5 examines the policy environment in Europe, on both the supranational and
national levels, to ordain whether or not Europe is ready for Chinese investment.
Part 6 draws conclusions from the previous five parts and offers recommendations
for policymakers on how to maximize the benefits of Chinese investment while
limiting exposure to economic and political risks.
INTRODUCTOIN 12
1. Turning Point: China’s Rise as Global
Direct Investor
Historically, China has been one of the major recipients of foreign direct investment,
and—until recently—only a minor contributor to global investment flows. Inward
FDI was a critical aspect of China’s post-1978 growth miracle, but few Chinese firms
had the motivation or ability to go abroad in the first two decades of reform. When
the field changed in the mid-2000s, outward FDI flows exploded. By 2010, China was
already the world’s fifth largest exporter of OFDI. If China follows the typical pattern
of an emerging economy, it will ship US$1-2 trillion in direct investment abroad by
2020. 9
1.1 THE TIDE IS TURNING FOR CHINA’S FDI FLOWS
Foreign investment was the cornerstone of China’s post-1978 economic miracle.
Opening up to FDI brought a flood of much-needed foreign capital, along with the
technology and managerial know-how to knit the Chinese economy into efficient
regional production chains. 10 After joining the World Trade Organization (WTO) in
2001, China became the world’s second-largest recipient of foreign direct
investment, with annual inward FDI rocketing to more than $100 billion in the past
five years. By 2010, China had amassed an inward FDI stock of more than $1.5
trillion. 11
The takeoff of China’s outward FDI started much later. Short on capital and fearing
the asset stripping and capital flight that had ravaged their communist cousins after
the breakup of the Soviet Union, China maintained strict controls on financial
outflows even after capital was no longer scarce. During the 1980s, official outward
FDI flows were virtually zero. In the 1990s and through 2004, annual OFDI flows
averaged a tiny $2 billion, except for spikes in 1993 and 2002 from early oil company
ventures abroad.
The turning point came in the mid-2000s, when Chinese demand sent global
commodity import prices soaring and state-owned enterprises ventured abroad to
buy stakes in extractive projects to increase supply security and profits. This push for
natural resource investments boosted Chinese outward FDI from less than $2 billion
in 2004 to more than $20 billion in 2006 and more than $50 billion in 2008. The
compound annual growth rate of China’s outward FDI in 2004-2008 exceeded 130%.
In 2009, outflows somewhat slowed down amid the global financial panic, but
reached another record high in 2010 with almost $60 billion. In 2011, flows reached
$50 billion amid renewed global financial instability (Figure 3). By the end of 2011,
9
This report denotes all monetary amounts in United States Dollars (USD), following the standard for global
statistics on foreign direct investment.
10
E.g. Rosen (1999) and Naughton (1995).
11
The FDI figures in this paragraph refer to balance of payments data collected by the People’s Bank of China,
which were corrected in 2010 to account for reinvested earnings from existing FDI assets.
13 CHINA INVESTS IN EUROPE
China’s global OFDI stock reached $364 billion, about one-fifth the $1.8 trillion stock
of inward investment.
Figure 3: China’s Inward and Outward FDI Flows, 1982-2011
USD billion
250
Inward FDI
200
Outward FDI
150
100
50
0
2011
2010
2009
2008
2007
2006
2005
2004
2003
2002
2001
2000
1999
1998
1997
1996
1995
1994
1993
1992
1991
1990
1989
1988
1987
1986
1985
1984
1983
1982
-50
Source: PBOC/SAFE, Rhodium Group.
1.2 CHINA’S SIGNIFICANCE AS GLOBAL INVESTOR: LOW BASE, FAST GROWTH
China has become a key player in today’s global economy, accounting for 21% of the
global population, 9.5% of global gross domestic product (GDP), and 9% of global
trade of goods and services. However it has long lagged in cross-border flows and is
only now starting to play catch-up from a very low base. China’s international assets
largely consist of foreign exchange reserves, whereas direct and portfolio investment
assets are negligible compared to China’s weight in other metrics of the global
economy (see Figure 4).
In 2010, China’s outward FDI stock amounted to around $300 billion, a mere 1.5% of
the global total. China owns more hard assets than other emerging markets such as
India ($92 billion) or Brazil ($181 billion), but significantly less than any other large
economy. In 2010, China’s OFDI stock was on par with Sweden, Singapore, and
Taiwan. Japan’s stock is three times that of China, while the United States’ $4.8
trillion is 16 times the OFDI assets of China. With an OFDI stock of $300 billion and $6
trillion in GDP, China’s OFDI-to-GDP ratio is only 5%, far below the global average of
33% and the transitional economy average of 16%. These differences are even more
pronounced in per capita terms: in 2010 each Chinese citizen “owned” $227 in FDI
abroad, compared to $15,600 per American and a $3,200 average worldwide. In short,
China’s OFDI stock is tiny compared to its weight in the global economy.
TURNING POINT 14
Figure 4: China in the Global Economy, 2010
China’s % share of the global total
45%
40.6%
40%
35%
29.4%
30%
25%
20.7%
20%
15%
9.5%
10%
9.4% 8.4%
8.5%
5%
5.1%
3.0% 1.5%
1.1% 0.3%
0.5% 0.6%
Outward Portfolio Stock
Inward Portfolio Stock
Outward FDI Stock
Inward FDI Stock
Total Reserves
Outward Portfolio Flows*
Inward Portfolio Flows*
Outward FDI Flows
Inward FDI Flows
Accumulation of Reserves
Imports of G&S
Exports of G&S
GDP
Population
0%
Sources: Economist Intelligence Unit, United Nations Commodity Trade Statistics Database, United Nations Conference on Trade and
Development, World Bank, Rhodium Group.
While China is starting from a low base, the tremendous surge in outward FDI and a
simultaneous drop in global FDI flows catapulted China into the top 10 of global
direct investors. China’s share in global OFDI flows increased from less than 1% in
2007 to 3% in 2008 and 5% in 2010. In 2010, China was the world’s fifth biggest
outward investor after the United States, Germany, France and Hong Kong (see
Figure 5). China has also become the leading outward investor among its emerging
economy peers. China was the only BRIC country whose OFDI flows did not drop
markedly during the global financial crisis. In 2009, China overtook Russia as the top
emerging market outward investor, accounting for more than one-third of all OFDI
from emerging markets.
China’s importance as a source of capital is even greater for certain industries, and
for the countries and regions that rely on these industries. Chinese firms now are
major players in the global mergers and acquisitions (M&A) landscape in many
extractive industries, from oil and gas to iron ore, copper and other metals. For some
resource-rich economies, China is the largest source of foreign direct investment;
this is particularly true for countries that are often judged to be “too risky” politically,
such as Sudan and Angola. But developed economies such as Canada and Australia
have also experienced a wave of capital from Chinese investors in their extractive
industries in past years.
15 CHINA INVESTS IN EUROPE
Figure 5: The World’s Top Outward Investors, 1981–2010
Percentage of global OFDI flows
60%
50%
China
Germany
India
Japan
United Kingdom
United States
40%
30%
20%
10%
2010
2008
2006
2004
2002
2000
1998
1996
1994
1992
1990
1988
1986
1984
1982
1980
1978
1976
1974
1972
1970
0%
Source: UNCTAD, Rhodium Group.
1.3 OUTLOOK: THE CATCH-UP PROCESS HAS JUST BEGUN
China’s FDI patterns are not unique; they have followed typical developing country
historical trends rather closely (Figure 6). 12 Pre-reform, there are virtually zero crossborder capital flows: foreign investors are not interested and domestic firms have no
foreign exchange to invest abroad (stage I). When economic reforms and domestic
growth kick in, inward FDI usually takes off as capital controls are relaxed and
foreign investors are eager to channel money into a high-growth economy (stage II).
Once a country reaches a certain per capita GDP, domestic firms start to invest abroad
and outward FDI takes off, while inward FDI remains strong. As outward FDI
surpasses inward flows, a country’s net FDI position turns from deeply negative into
positive territory (stages III and IV). Once a country reaches a developed economy
per-capita GDP, its net FDI position stabilizes and hovers around the equilibrium,
depending on economic cycles and a country’s economic structure (stage V).
China’s story so far closely follows this timeline. Before 1978, China was a closed
economy that attracted little cross-border investment—the first stage. As reforms
kicked in in the 1980s, FDI started to grow robustly while outward FDI remained
negligible. China today is in the second stage: inward flows are still growing steadily,
but outward flows have started to take off and are chipping away at the gap. When
exactly China will hit the third stage, where outflows surpass inflows and the country
See Dunning (1981) for the foundations of the investment development path (IDP) theory for explaining
countries’ international direct investment position; see Dunning, Kim, and Park (2008) for a review of the
applicability of the IDP theory in explaining the FDI position of today’s emerging economies.
12
TURNING POINT 16
becomes a net exporter of FDI, is unclear. China’s Ministry of Commerce expects this
crossover to occur around 2015. 13
Figure 6: Economic Development and FDI Patterns
Stylized Display of the Investment Development Path (IDP)
Net Outward Investment Stock
+
TRADITIONAL IDP
0
IDP UNDER
GLOBALIZATION
Stage I
Stage II
Stage III
Stage IV
Gross National Product
Source: Dunning et al. (2008).
As China surges toward this point of inflection, the world will see hundreds of billions
of Chinese investment dollars in the decade ahead—even by conservative estimates.
By 2020, China’s GDP will likely have surpassed $20 trillion (or GDP per capita around
$14,000). The current low OFDI-to-GDP ratio of 5% would yield $1 trillion in new
OFDI through 2020 ($100 billion per year on average). If China’s ratio rises to the
transitional economy average of 15%, outflows would amount to roughly $3 trillion,
or approximately $300 billion annually. Based on those projections, we place our bet
in the middle, at $1 trillion to $2 trillion by 2020.
“Overseas direct investment to grow”, China Daily, December 24, 2010, available at:
http://www.chinadaily.com.cn/bizchina/2010-12/24/content_11749290.htm
13
17 CHINA INVESTS IN EUROPE
Box 1: Foreign Direct Investment: Definition and Data Sources
In national accounting statistics, cross-border investment flows are commonly
separated into five distinct categories: direct investment, portfolio investment,
derivatives, other investment, and reserves. 14
1.
By common definition, direct investment refers to cross-border capital flows
that entail significant management influence and a long-term investment
relationship. The common threshold for a direct investment is 10% of voting
shares.
2. Portfolio investment is typically a shorter-term investment in liquid (easily
bought and sold) securities, which might include holdings of equity shares with
less than 10% of voting rights, or corporate debt instruments (neither of which
convey control or, in the case of debt, ownership).
3. The derivatives category includes financial instruments such as swaps, futures,
and options, which are only contractually related to the underlying value of real
assets such as firms or commodities. 15
4. The residual category of other investment captures all flows that do not fall
under the previous categories, such as foreign bank deposits, currency holdings,
cross-border loans, or trade credits.
5. Reserves held by governments in the form of gold, foreign exchange, or IMF
special drawing rights are another category in international financial statistics.
Foreign direct investment (FDI) flows can include three components: equity
investment, reinvested earnings, and other capital flows. A direct investment
relationship starts with an equity injection into an overseas subsidiary, either for the
establishment of a new overseas subsidiary (greenfield investments) or to acquire a
controlling stake (greater than 10%) in an existing company (mergers and
acquisitions). Once such a direct investment relationship begins, subsequent capital
flows between the parent company and foreign subsidiary are counted as direct
investment. In addition to potential additional equity injections, this can include
profits that are not sent home, but rather are reinvested in the company (reinvested
earnings) and other capital flows between the two firms—for example, when the
overseas parent lends money to its overseas subsidiary, or vice versa (intra-company
debt). 16
14
See IMF (2010). The IMF definitions also are used by other international organizations such as the OECD and
UNCTAD.
15
The new category of derivatives was introduced in the sixth edition of the IMF’s Balance of Payments and
International Investment Position Manual, released in 2009; most countries’ statistics still are based on earlier
versions and thus do not yet show derivatives as separate category.
16
Detailed information on the nature of direct investment and its measurement can be found in the OECD’s
“Benchmark Definition of Foreign Direct Investment” (OECD 2008a).
TURNING POINT 18
A range of different measures and sources are available for tracking FDI flows and
stocks. Most countries compile balance of payments statistics that include
information on annual inflows and outflows for each type of cross-border
investment and related income flows. The corresponding numbers for the inward
and outward stock of each category, which is the accumulated flows adjusted for
exchange rate and valuation changes, are recorded in a country’s international
investment position statistics. The IMF uses these figures as reported by its member
states to compile global financial statistics.
In addition to national accounting statistics based on IMF standard definitions, many
countries publish data sets that provide a more disaggregated view of their
investment relationship with other economies. These detailed statistics are usually
published by central banks or national statistical authorities. Several international
organizations, such as the United Nations Conference on Trade and Development
(UNCTAD) or the Organization for Economic Co-operation and Development
(OECD), also collect data on FDI and other cross-border investment flows.
Unfortunately the accuracy and quality of official statistics on cross-border
investment flows suffers as financial transactions become increasingly complicated,
with tax optimization strategies, transfer pricing, and the use of shell companies in
offshore financial centers. In light of these distortions, alternative methods of data
collection—such as the bottom-up collection of transaction data based on completed
greenfield projects and acquisitions—often produce results that are more reliable
than official statistics. Online-based research opportunities, commercial databases
for certain types of cross-border investment flows, and specialized research products
provide a fertile ground for alternative data collection strategies.
19 CHINA INVESTS IN EUROPE
2. Drivers: The Political Economy of
Chinese Outward FDI
The liberalization of China’s outward investment regime was an important variable
in the explosion of China’s OFDI growth, but economic logic best explains the
patterns of Chinese outward investment. Academic research on outward direct
investment details numerous reasons why firms decide to go abroad. Microeconomic
explanations of outward FDI focus on four motives: securing natural resources,
exploring new markets, buying strategic assets, and improving the efficiency of
operations across borders. 17 All of these motives apply to China’s companies in recent
years, and they will intensify in the decade ahead. Past investments were focused on
trade facilitation and natural resources but macroeconomic adjustment in China and
firm-level pressures are increasingly forcing Chinese firms to look abroad for deeper
market penetration, service provision opportunities, and assets that can give them a
competitive edge at home and abroad. These new motives are leading Chinese
investors to the industrialized world with great vigor: developed economies stand to
receive a substantial share of the US$1-$2 trillion of OFDI China will hold by 2020.
2.1 EARLY STAGE INVESTMENTS: TECHNOLOGY UPGRADES AND TRADE
FACILITATION
Many observers assume that China’s outward FDI is the product of strategic
government campaigns guiding Chinese firms’ overseas activities for political
motivations. Analysts have strained to identify such a strategic rationale for a decade,
and the Chinese government has given them plenty of fodder by portraying itself as
facilitator of outward FDI through a “Going Out” campaign promulgated since
2000. 18 However, we take the view that China’s outward FDI stems from changes in
China’s growth model and marketplace rather than a political agenda.
During the first years of reform, direct investment from China remained at a very
low level. 19 China’s inward-oriented growth model focused on making basic market
reforms at home to kick-start domestic growth. Foreign exchange reserves were
scarce, and capital flight in the form of illegal transactions by corrupt officials and
SOE executives forced China to maintain tight controls on capital outflows. Few
firms had the desire or capacity to invest abroad, and outward investment was
limited to a handful of select, specialized state-owned firms -- foreign trade
corporations (FTCs) and foreign business oriented corporations (FBOCs). These firms
invested in Hong Kong and other parts of Asia to promote trade and upgrade
technology, or made politically-motivated investments in developing countries
See Dunning and Lundan (2008).
See for example Premier Wen Jiabao’s report to the delegates of the 2012 National People’s Congress, which
says that the government will “guide Chinese enterprises under various forms of ownership in making overseas
investments (…) in an orderly manner” (Wen 2012).
19
For an analysis of the first two decades of Chinese overseas investment, see Cai (1999).
17
18
DRIVERS 20
deemed strategically important. The scale of these investments remained small,
however; by the mid-1980s, China’s outward FDI stock was just $900 million.
Figure 7: Policy Liberalization and OFDI Flows, 1980-2011
Stylized Display
70
Growing Support
60
50
40
30
20
10
Going Global Policy
Tight Controls
Cautious
Encouragement
Active Encouragement
Stepping Back
0
1980
1981
1982
1983
1984
1985
1986
1987
1988
1989
1990
1991
1992
1993
1994
1995
1996
1997
1998
1999
2000
2001
2002
2003
2004
2005
2006
2007
2008
2009
2010
2011
-10
Source: Authors. For a detailed overview of China’s outward FDI framework and its liberalization, see Rosen and Hanemann (2009).
The growth of outward investment accelerated in the second half of the 1980s, when
inward FDI started to flow into the country and China became woven into Asian
manufacturing networks. Many firms now had a prime incentive to invest overseas:
trade facilitation. The China Ocean Shipping Corporation (COSCO) and the China
Merchants Group are examples of early overseas investors. Policymakers began to
recognize the economic benefits of overseas investment and take a more encouraging
stance; easing foreign exchange pressures accelerated the process. However,
concerns about capital flight and illicit motivations led policymakers to maintain
strict oversight of outward flows. Average annual outflows grew from around $200
million in the first half of the 1980s to $700 million in the second half, bringing
Chinese OFDI stock to almost $5 billion by 1990.
In the 1990s, outward investment grew further in scale and complexity. The postTiananmen decision to accelerate economic reforms and global integration led to
more active encouragement of OFDI. The goal was to increase the competitiveness of
Chinese businesses, with a special focus on 100+ state-owned national champions. As
foreign exchange pressures eased further, China shifted from an “earn-to-use” to a
“buy-to-use” policy, and OFDI approval procedures were gradually eased and
localized. (This process was interrupted briefly during the Asian financial crisis,
when China reversed course and tightened capital controls again, choking off the
upward trend in outward FDI.) Firms’ commercial appetites for overseas investment
continued to grow. Facilitation of exports remained a core motive, but access to
21 CHINA INVESTS IN EUROPE
technology and know-how to enhance competitiveness became more important.
Increasingly, facilitation of imports – most notably raw materials – emerged as an
additional motivation. Annual outflows in the 1990s hit an average of $2 billion,
swelling total stock from $5 billion in 1990 to $28 billion in 2000.
2.2 THE BIG AWAKENING: BUYING INTO CHINA’S COMMODITY BOOM
On the back of its accession to the World Trade Organization, China’s role in global
trade rose rapidly in the 2000s. The country’s annual exports grew from $250 billion
in 2000 to $1.9 trillion in 2011, with the global financial crisis causing no more than a
minor, temporary dip. More importantly, China’s export base broadened
significantly, and demand from Africa and Latin America made up for some of the
sluggish demand from traditional export markets (Figure 8). By 2011, China’s exports
to Latin America had grown to $122 billion, the same as exports to the US in 2004. In
the same year, Africa imported $73 billion of Chinese goods, equivalent to Chinese
exports to the US in 2002. This acceleration and diversification of external demand
further increased incentives to expand market-seeking and trade-facilitating
outward FDI across the globe.
Figure 8: China’s Monthly Exports by Region, 1993-2011
USD billion
180
Oceania
North America
Latin America
Europe
Africa
Asia
160
140
120
100
80
60
40
20
Dec-11
Apr-11
Aug-10
Apr-09
Dec-09
Aug-08
Apr-07
Dec-07
Aug-06
Apr-05
Dec-05
Aug-04
Apr-03
Dec-03
Dec-01
Aug-02
Apr-01
Aug-00
Apr-99
Dec-99
Aug-98
Apr-97
Dec-97
Dec-95
Aug-96
Apr-95
Aug-94
Apr-93
Dec-93
0
Source: China Customs, Rhodium Group.
The scale of trade-facilitating investments remained comparably low, however. The
sea change in outward investment in the mid-2000s occurred when a sharp increase
in Chinese demand for raw materials made it necessary for China to give up its
resources autarky and look beyond its borders. Structural developments—fast
economic growth and the build-out of urban infrastructure —and the rapid
DRIVERS 22
expansion of heavy industry drove the surge in resources demand. 20 Within just a few
years, China became a net importer of many core commodities such as oil, iron ore,
soybeans, copper and coal. Today, China is the world’s single most important
consumer of many hard and soft commodity groups (Figure 9).
Figure 9: China’s Share of Global Consumption of Selected Commodities
Percent of global total
70%
60%
CEMENT
50%
COPPER
40%
STEEL
30%
ALUMINUM
PAPER
20%
10%
0%
1995 1996 1997 1998 1999 2000 2001 2002 2003 2004 2005 2006 2007 2008 2009 2010 2011
Sources: Bloomberg, CEIC, FAO, USGS, Rhodium Group.
China’s big state-owned commodities firms were caught off-guard by this new
situation. Decades of resources autarky had left them laggards when it came to
overseas reserves and global operations. In the mid-1990s, China’s big three oil
companies – China National Petroleum Corporation (CNPC), Sinopec and China
National Offshore Oil Corporation (CNOOC) -- had virtually zero stakes in overseas
resources extraction. Import dependency made them vulnerable to price volatility,
market power of foreign suppliers and external shocks. At the same time, corporate
restructuring and a partial listing of assets in domestic and Hong Kong stock markets
imposed greater pressure on firms to improve profitability and shareholder value.
However, profits at home were tanking due to price controls on gasoline impacting
the profitability of downstream operations (Figure 10). Overseas investments in
upstream oil and gas assets were one way to escape the margin squeeze at home.
The loss of self-sufficiency and lack of experience with global commodities markets
resulted in widespread concerns about supply security of energy and other
commodities. This led to a major push in the mid-1990s for oil firms to venture
In the early 2000s, distortions in China’s marketplace incentivized strong investment in energy intensive
industries within China’s borders, for which China does not have a natural comparative advantage. See Rosen
and Houser (2007).
20
23 CHINA INVESTS IN EUROPE
abroad and buy into equity production of energy and other resources. As interests
aligned, a symbiotic relationship formed between oil and gas executives and
policymakers, unleashing a wave of Chinese oil and gas investments across the globe
in the next decade. In 2000, the government formally announced its “Going Global”
policy, which significantly eased administrative hurdles for outward investment and
paved the way for more active government support. Outside of motivations for
natural resources and commodities security, a growing awareness of increasing
competitive pressures on Chinese firms after WTO accession helped buoy
bureaucratic support for overseas investment. China’s foreign exchange problem
also continued to wane as its trade surplus widened and foreign exchange reserves
approached the $200 million mark in 2000. In subsequent years, approval procedures
were further eased and local and central governments began to provide broad and
active political and practical assistance for firms with overseas expansion plans.
Figure 10: Domestic Profits Margins of Chinese Oil Companies, 1990-2011
Domestic profit margins by segment
60%
45%
UPSTREAM
30%
15%
CHEMICALS
0%
DOWNSTREAM
-15%
1986
1988
1990
1992
1994
1996
1998
2000
2002
2004
2006
2008
2010
Sources: CEIC, BP, Rhodium Group.
China’s national oil companies were the pioneers in overseas resource investment,
but firms in other resource sectors were close behind. They too had turned abroad to
counter growing demand and low domestic reserves, investing in foreign upstream
assets to diversify supply risks, counter foreign bargaining power, and gain a
foothold in highly profitable overseas upstream businesses. Resources firms took
greater risks in outward FDI because the expectation for RMB appreciation was not as
much of a concern for them; they would import most of the resources to China,
offsetting the negative effect of a stronger RMB in terms of asset valuation with
cheaper imports. Since the mid-2000s, China’s oil firms have emerged as major
players in global oil and gas M&A, competing with traditional buyers from Europe
DRIVERS 24
and North America (Figure 11). Aside from oil and gas, iron ore, bauxite and copper
assets were major resource targets of Chinese acquisitions. Investments in the
capital-intensive resources sector pushed up the total headline figure of China’s OFDI
significantly, from an average of $2 billion in the late 1990s and early 2000s to more
than $20 billion in 2006 and more than $60 billion in 2010 and 2011.
Figure 11: Global Oil and Gas Acquisitions by Region of Buyer*, 2000-2011
USD billion
45
North America
40
EU
China
35
30
25
20
15
10
5
0
2003
2004
2005
2006
2007
2008
2009
2010
2011
Sources: Bloomberg, Rhodium Group. *Selected regions only.
2.3 THE NEXT STAGE OF OUTWARD INVESTMENT: GOING TRULY GLOBAL
The Chinese model of investment-led growth was hugely successful, producing three
decades of double digit growth. However, a new growth model is needed for the next
stage of economic development, and China is beginning a structural adjustment
process which will shift outward investment and shuffle the country’s global
investment position.
The foundations of China’s old growth model, which relied on excessive fixed
investment and exports of overcapacity to overseas markets, are eroding. The prices
of key input factors are gradually rising: labor costs are increasing due to
demographics and social pressures to give households a greater share of the national
income; the cost of land has risen dramatically within a property bubble; exchange
rates are being reformed in response to inflation and increasing pressure from
trading partners; regulatory compliance costs are rising quickly as the government is
forced to address air pollution and other environmental damages; and, perhaps most
importantly, capital costs are being pushed up as China is forced to reform its
financial system to end financial repression of households, improve the allocation of
capital to higher-return investments, and prepare for a gradual opening of the
25 CHINA INVESTS IN EUROPE
country’s capital account. Rebalanced growth will be focused on domestic
consumption, higher value-added manufacturing, and service sector activity. 21 The
competitive pressures arising from this rebalancing process will force Chinese
companies in all sectors to fundamentally adjust their business models in the years
ahead, including greater internationalization and reorientation of global business
strategies.
Changing macroeconomic variables and an even more supportive policy
environment will further encourage outward FDI by Chinese firms. The crippling
capital scarcity that handcuffed Chinese action in the past is no longer an issue for
many firms—or for the nation as a whole. Many Chinese firms now have both the
motive and opportunity to go abroad, by virtue of strong cash positions. The
economic rebalancing process will also entail a correction of China’s undervalued
exchange rate, which is already under way. A stronger renminbi makes overseas
acquisitions cheaper for Chinese firms, which is another incentive to make the step
abroad. If Beijing persists in resisting rebalancing, trade barriers will provide an
equally powerful incentive to invest directly in order to circumvent tariffs, as
happened with Japan in the United States during the 1990s.
Figure 12: Sources of Foreign Exchange Accumulation, 1982-2011
USD billion
700
Net E&O
FA: Direct Investment Balance
FA: Other Investment Balance
Capital Account Balance
CA: Current Transfer Balance
CA: Income Balance
CA: Goods and Services Trade Balance
Reserves Accumulation
600
500
400
300
200
100
0
2011
2010
2009
2008
2007
2006
2005
2004
2003
2002
2001
2000
-100
Sources: PBOC, Rhodium Group.
Policy support for outbound FDI continues to grow; local and central officials
recognize that competitive transnational corporations are vital in China’s new
economic growth model. Finally, foreign exchange pressures have reversed from too
little to too much. China now sits on foreign exchange reserves of more than $3
21
See Lardy (2012) and He and Kujis (2007).
DRIVERS 26
trillion, and the pile is growing every month. Figure 12 shows that the trade surplus is
still the biggest driver of foreign exchange accumulation, but the financial account
has emerged as an important factor in recent years. Greater outward FDI to balance
the direct investment account is one way to slow down the accumulation of new
reserves.
These changes in the macroeconomic and policy environment will increase the
internationalization pressures on firms across all sectors of the Chinese economy.
The extractive sector will be impacted by an erosion of investment-led growth, but
natural resources acquisitions will remain a major driver of Chinese outbound FDI in
the years ahead. Rebalancing will likely have a moderating impact on the growth of
capital investment, particularly in infrastructure and housing, driving down the
resource intensity of Chinese growth. It will also strip some capital from the big
state-owned enterprises (SOEs), increasing the cost of capital for financing overseas
natural resources acquisitions. At the same time, the structural drivers for Chinese
resource demand are still in effect. China is only halfway through its urbanization
efforts, and its reliance on imports will only grow in the future. And despite massive
investment in recent years, the share of Chinese firms in global production of most
materials is still minor; for instance, Figure 13 shows that Chinese oil companies are
still lagging far behind their counterparts in the US and Europe.
Figure 13: Liquids Production by Chinese Oil Companies vs. US and EU Majors
Thousands of barrels per day, international production as % share of total national net imports
3,500
21%
3,000
18%
724
2,500
15%
2,000
12%
1,500
1,000
370
261
855
6%
1,424
1,071
1,043
3%
390
489
408
269
285
177
Exxon
Total
Shell
BP
0
Sinopec
2,197
1,434
2,174
866
500
9%
2,014
CNOOC
CNPC
ConocoPhillips Chevron
CHINESE
International Production (LHS)
AMERICAN
Domestic Production (LHS)
0%
EUROPEAN
International/Net Imports (RHS)
Sources: Company reports, IEA, Rhodium Group.
The catch-up process is far from over, and there is a substantial appetite for further
acquisitions. Furthermore, there is plenty of room for upside growth in other
27 CHINA INVESTS IN EUROPE
commodity classes. And in other areas (such as in many soft commodities,
agricultural land and non-conventional oil and gas), the catch-up process has not
even begun yet. Assets other than reserves are gaining appeal, too, like new
exploration technology, human talent and know-how in cutting edge areas such as
shale gas development. Interest will further expand if rebalancing leads to more
competition in the domestic market in these sectors. Political support is still there,
though fears about bad investments, political risks and greater capital constraints
will discipline SOEs’ overseas investment decision-making.
The manufacturing sector will suffer disproportionately from economic rebalancing.
Over the past two decades, China has become the workbench of the world– partially
due to cheap labor costs, but also because of political distortions in the marketplace
causing the mispricing of various factors of production (for example, environmental
regulations, land dispossession and labor rights). At the same time, firms could grow
sales relatively easily by expanding their domestic consumer base and serving
foreign consumers through the export channel. Distribution inside China had long
been primitive-- potential customers outside of “tier 1” cities were barely considered- so there was vast opportunity to broaden the scale of operations by simply
expanding distribution networks. China’s 2001 WTO accession protected its exports
from arbitrary barriers, allowing its firms to sell abroad without investments other
than logistics operations and representative offices. This development strategy has
paid off in terms of economic growth, but it has also left Chinese firms in an
increasingly vulnerable position as input costs and the competitive environment
change. Figure 14 depicts China’s position in today’s global value chain. China is very
strong in the middle segment of the value chain -- the production of goods – which
has relatively low profit margins. And it is relatively weak when it comes to parts of
the value chain with high profit margins: upstream research and development and
branding, as well as downstream in distribution and retail.
The pitfalls of China’s global value chain positioning were not a major cause for
concern in the past, as increasing productivity, surging demand and greater
economies of scale allowed firms to maintain profitability. However, this position is
increasingly unsustainable. Shifting costs for labor and other input variables and a
stronger RMB exchange rate puts pressure on low value-added light manufacturing
activities, forcing Chinese producers to move up the value chain into higher valueadded products. Increasing sales under the old model will also get more complicated.
Demand from traditional export markets such as the US and Europe is slowing, trade
frictions are growing, and selling higher value-added goods such as machinery
requires a different approach than selling toys and underwear. At home,
consumption is growing fast, but so is competition from both domestic firms and
foreign multinationals with strong brands and vast experience, which are shifting
their focus from sluggish home markets to the booming and lucrative Chinese
market. Over the next decade, firms will need to branch out from midstream
manufacturing activities and move up and down the value chain to capture more of
the value added in these more profitable segments.
DRIVERS 28
To do so, firms will need to go beyond China’s borders. Offshoring some of the
manufacturing activity at the lower end will require investments in Southeast Asia
and other locations with low-cost labor. Moving into higher value-added
manufacturing and upstream value creation can be achieved through organic
growth, but overseas acquisitions that give firms access to competitive assets and
human talent are quicker. Capturing more of the value added in the downstream
segment (distribution and retail) also requires a greater investment abroad – not only
to serve customers in overseas markets directly, but to strengthen competitiveness in
the fast-growing domestic market.
Figure 14: China in the Global Value Chain
Stylized Illustration
CHINA
PROFIT MARGINS
High
Low
UPSTREAM
Resources, R&D, Branding
MANUFACTURING
Assembly
DOWNSTREAM
Distribution and Retail
Sources: Rhodium Group.
Rebalancing away from manufacturing will also significantly boost outward FDI in
the services sector. Exporting toys and underwear only required hiring a ship in
Shanghai or Hong Kong, and maybe establishing rep offices abroad. Exporting
higher-quality goods such as machinery or self-branded electronics will require an
on-the-ground presence of a much greater scope, significant investments in brands
and marketing, sophisticated distribution networks, and the provision of after-sales
services. Outward investment in services will also increase in areas other than
exports. Service firms in old growth model industries such as construction, utilities,
shipping and real estate are expanding overseas as they have increased their
competitiveness, accumulated funds, and sought to diversify outside the domestic
market. Service firms are also increasingly following their clients from other sectors
abroad: the recent wave of natural resources investments, for example, incentivized
service firms such as banks, insurance companies and providers of drilling and
construction services to make the same move.
29 CHINA INVESTS IN EUROPE
A major incentive for service sector firms to go abroad is to strengthen
competitiveness in the fight for domestic market share. The old growth model’s
heavy emphasis on investment and production has left China’s service sector
underdeveloped both in size and depth (Figure 15). In order to rebalance the structure
of the Chinese economy, the service sector will have to grow faster than industry and
agriculture in the next decade. High growth prospects will increase competition
among Chinese firms for market share, while also attracting foreign firms, whose
experience gives them a significant advantage. Outward investment is one way for
domestic firms to strengthen competitiveness for the coming services boom,
particularly for players in service sectors that are currently closed to private and
foreign investment, such as telecommunications or financial services.
Figure 15: Composition of Gross Domestic Product (GDP) by Sector, 2010
Percent of total, selected Economies
100%
90%
1%
20%
1%
27%
80%
1%
6%
4%
19%
28%
27%
10%
37%
70%
Agriculture
26%
47%
60%
Services
50%
40%
Industry
78%
72%
71%
30%
67%
59%
55%
43%
20%
10%
0%
U.S.
Japan
Germany
Brazil
Russia
India
China
Sources: World Bank, Rhodium Group. Data for Japan from 2009.
Structural adjustment will boost another form of outward FDI: foreign direct
investment stakes as part of asset management strategies. China accumulated
gargantuan foreign exchange reserves under its old growth model, and the central
bank must now put them to work. This is the job of the State Administration of
Foreign Exchange (SAFE) and the China Investment Corporation (CIC). In light of
the sovereign debt crisis in Europe and growing concerns about the value of the US
dollar, SAFE and CIC have begun to diversify their investments away from “low risk,
low return” government securities and into other instruments, including equities
and other portfolio investments. In recent years, CIC has massively expanded
allocation of funds into alternative investments and started to take stakes in public
and private foreign companies that qualify as direct investment. Other funds such as
the National Social Security Fund (NSSF) are expected to take a similar route,
DRIVERS 30
increasing overseas investment significantly once they have built up sufficient
capacity to make direct investments.
In addition to sovereign players, investment funds and high net-wealth individuals
are increasingly looking to deploy their capital abroad. Quality investment
opportunities within China are becoming harder to find, leading to overinvestment
in already “bubbly” classes of assets such as property development. Furthermore,
overseas investment is a sanctuary from the bumpy road ahead in China, as
rebalancing risks causing a downturn in Chinese growth. Outward investment by
individuals is tightly controlled, but there are pilot projects in China to allow
entrepreneurs and high net-wealth citizens to invest abroad, and individuals manage
to find ways to siphon money out of the country and into foreign assets. The most
attractive choice is usually property in prime foreign cities, but productive assets are
an increasingly popular investment as well – particularly if it leads to immigration
benefits, such with the EB-1 visa program in the US.
31 CHINA INVESTS IN EUROPE
3. Patterns: Chinese Direct Investment in
the EU-27
The patterns of Chinese direct investment provide a window into firms’ evolving
motives and capabilities. Official data, marred by time lags and inaccuracies, fail to
reflect recent trends evident in data collected by alternative measures: a profound
post-2008 surge in which OFDI flows tripled from less than US$1 billion per year
from 2004-2008 to roughly $3 billion in 2009 and 2010, before tripling again to
almost $10 billion in 2011. The trend line change is what matters, since the absolute
values remain puny by global standards. The number of investments, however, is no
longer small: we could identify fewer than 20 FDI operations a decade ago, while
today we count at least 573. Geographically, China’s OFDI preferences in Europe
look typical, with the troika of France, the United Kingdom and Germany in the lead.
In terms of sector mix, a telling shift is underway from natural resources and trade
facilitation toward a far broader range of industries and assets spread widely across
Europe. And the majority of Chinese firms investing in Europe are private, though
state-owned firms account for two-thirds of investment value as they dominate in
capital intensive sectors.
In this chapter we discuss and illustrate these and many of the other patterns
emerging from the growth of Chinese direct investment in Europe.
3.1 THE INFLECTION POINT: FAST GROWTH FROM LOW BASE
The European Union as a whole has been the world’s biggest recipient of foreign
direct investment for two decades. By year-end 2010, member states had an
accumulated inward FDI stock of $11.8 trillion -- 36% of the world’s total. 22 The great
majority of these flows originated from other European countries; extra-EU
investment accounts for just one-third of Europe’s total, with North American firms
preponderant (Figure 16).
Direct investment from Asia accounts for 4% of the EU’s inward FDI stock, with
Japan, Singapore and Hong Kong in the lead. China’s FDI stock in Europe remains
trivial compared to the aggregate. By official Eurostat statistics (which are
problematic, as discussed in detail below), China’s European OFDI stock stood at $8.9
billion in 2010 – well under one-tenth of 1% of the EU’s total, and under 0.3% of the
stock from outside Europe. Statistics from China’s Ministry of Commerce put total
Chinese OFDI stock in Europe slightly higher, at $12.5 billion by year-end 2010, but
by either measure, the figure is tiny.
22
The first figure is from Eurostat and includes intra-European FDI. The percentage share is based on UNCTAD’s
global FDI data, which has slightly different figures for inward FDI stock in the EU.
PATTERNS 32
Figure 16: Composition of the European Union’s Inward FDI Stock by Source Region, 2010
Percent of total EU inward FDI Stock of $11.78 trillion
Non-EU
Europe
7.7%
Africa
0.4%
North
America
15.1%
Latin
America
5.9%
Other
0.8%
China
0.1%
Japan
1.5%
Asia
3.8%
EU-27
66.6%
Singapore
0.8%
Oceania
0.4%
South
Korea
0.2%
Hong
Kong
0.5%
India
0.1%
Source: Eurostat, Rhodium Group.
Official figures provide an important historical perspective, but, for many reasons,
are useless in assessing recent flows. First, they are published with significant delay –
as of this writing, comprehensive data are available only through 2010, a lag of 1.5
years. Second, statistics on stocks and annual flows vary greatly. For 2010, Eurostat
records $0.98 billion of FDI inflows from China, whereas MOFCOM puts it at $5.96
billion, six times greater. Third, official FDI data is often inaccurate as global crossborder investment becomes increasingly complicated by, for example, the extensive
use of offshore financial centers and tax havens. This explains why countries with
favorable tax regimes such as Luxembourg and the Netherlands have such a
prominent role in Eurostat’s figures, and why 85% of China’s global OFDI stock is
ostensibly in Hong Kong and Caribbean tax havens. Finally, official statistics repress
information for confidentiality reasons, and often lack important metrics such as
distribution by industry and country, ownership of the ultimate beneficiary owner,
or operational characteristics such as assets, revenue or jobs created. 23 Table 1
presents figures on Chinese OFDI stock in the EU from the two available official
sources. Besides a nearly two year time lag, the data varies significantly -- sometimes
dramatically -- making it almost impossible to draw an accurate picture of recent
trends in Chinese foreign investment.
23
For a detailed review of existing data sets and their advantages and weaknesses, see Appendix.
33 CHINA INVESTS IN EUROPE
Table 1: Chinese OFDI Stock and Flows in Europe, Official Data, 2010
USD million, percent difference
FDI Stock (2010)
Euro Area (16)
EU-27
Austria
Belgium
Bulgaria
Cyprus
Czech Republic
Denmark
Estonia
Finland
France
Germany
Greece
Hungary
Ireland
Italy
Latvia
Lithuania
Luxembourg
Malta
Netherlands
Poland
Portugal
Romania
Slovakia
Slovenia
Spain
Sweden
United Kingdom
Eurostat
5,833
8,927
184
-742
23
N/A
72
506
7
68
472
1,060
5
139
-1,182
423
1
3
N/A
7
345
325
N/A
69
49
0
N/A
1,468
618
MOFCOM
8,802
12,502
2
101
19
N/A
52
42
8
27
244
1,502
4
466
140
224
1
4
5,787
3
487
140
21
125
10
5
248
1,479
1,358
FDI Flows (2010)
∆
-2,968
-3,575
182
-843
4
N/A
19
463
-1
40
229
-442
1
-326
-1,322
199
1
-1
N/A
4
-142
185
N/A
-56
39
-5
N/A
-12
-740
Eurostat
-261
977
4
147
7
N/A
3
19
-3
86
33
445
N/A
131
-1,060
-27
0
0
73
3
252
11
3
-9
23
0
N/A
N/A
13
MOFCOM
3,850
5,963
0
45
16
N/A
2
2
N/A
18
26
412
N/A
370
33
13
N/A
N/A
3,207
-2
65
17
11
0
N/A
29
1,367
330
∆
-4,112
-4,986
4
102
-10
N/A
1
17
N/A
68
7
32
N/A
-239
-1,093
-40
N/A
N/A
N/A
5
188
-6
N/A
-20
22
N/A
N/A
N/A
-317
Sources: PRC Ministry of Commerce, Eurostat. N/A=not available. Currency conversions from Euro into USD are based on the IMF’s 2010
EUR/USD exchange rate of 1.3269.
For these reasons, we decided to compile our own dataset. Using a bottom-up
approach, we put together a database covering acquisitions and greenfield projects
by Chinese-owned firms in the EU-27 with an estimated value of more than $1
million. The data stemming from this approach are not directly comparable to the
traditional balance of payments approach to collecting FDI data, as they neglect
reverse flows and miss intra-company loans and other follow-up flows. However the
Rhodium method overcomes many of the weaknesses of the traditional approach –
most importantly the use of offshore financial centers for acquisitions – and allows a
PATTERNS 34
detailed, real-time assessment of Chinese investment flows and ownership in
Europe. 24
For the period 2000-2011, we recorded 573 transactions worth $21 billion (Figure 17).
Before 2004, there were fewer than 10 deals per year, with an average annual
investment value below $100 million. From this modest beginning a significant
upward trend has developed. The period 2004-2008 saw the annual average number
of acquisitions and greenfield investments grow to 50, with investment value
averaging around $800 million per year. For 2009-2010, the number of deals
increased to 100, and annual inflows hit $3 billion. For 2011, we recorded 54
greenfield investments and 37 acquisitions with a total investment volume of almost
$10 billion – a threefold increase over the previous two years.
Figure 17: Chinese Direct Investment in the EU-27, 2000-2011
Number of deals and USD million
90
12,000
Value of Acquisitions, USD mn (RHS)
80
Value of of Greenfield Projects, USD mn (RHS)
10,000
Number of Greenfield Projects (LHS)
70
Number of Acquisitions (LHS)
60
8,000
50
8,594
40
30
6,000
4,000
20
2,074
2,000
1,970
10
0
2000
2001
2002
2003
606
306
254
301
2004
2005
625
170
2006
1,042
337
443
353
820
2007
2008
2009
1,539
1,217
2010
2011
0
Source: Rhodium Group. For a detailed explanation of sources and methodology, please see Appendix.
While these numbers are impressive, they must be put in perspective. A few largescale transactions -- and alarming reports -- have left some with the impression that
China is “buying up” Europe. 25 This is far from true. Our figures are higher than
official data, but they are still small by any standard. Using official figures (since our
Rhodium database does not collate FDI from other countries into Europe) and
assuming that FDI into Europe remained roughly flat in 2011, China’s $10 billion
would still be a mere 4% of total EU FDI inflows. 26 Chinese direct investment is also
tiny when compared to China’s financial fire power: the amount that China invested
See Appendix for a detailed discussion of our methodology.
See for example Godement and Parello-Plesner (2011).
26
The assumption that OFDI flows remained flat in 2011 is based upon estimates from the OECD.
24
25
35 CHINA INVESTS IN EUROPE
in European hard assets over the past eleven years equals the average weekly increase
in Beijing’s foreign exchange reserves during the first months of 2011.
Of course Europe is not alone in seeing a sharp increase in Chinese investment. The
European picture mirrors China’s US investment patterns in recent years. Using the
same methodology to track investment, we registered $17 billion in investment in the
US for the period of 2003-2011, close to the European figure (Figure 18). In 2011,
patterns diverged somewhat as inflows to the United States came in flat at $5 billion
while in Europe they more than tripled, from $3 billion to $10 billion. Yet several
large-scale transactions in the first half of 2012 indicate that the 2011 weakness was a
temporary blip and that 2012 will be another strong year for Chinese investment in
the United States – probably a record in fact. Seen together, these figures confirm
that Chinese investment in developed economies has taken off, and that both the US
and EU are on track to receive substantial capital flows from this emerging investor.
Figure 18: Chinese Direct Investment in the United States vs. EU-27, 2003-2011
USD billion
10.0
9.0
EU-27
United States
8.0
7.0
6.0
5.0
4.0
3.0
2.0
1.0
0.0
2003
2004
2005
2006
2007
2008
2009
2010
2011
Source: Rhodium Group. For a detailed explanation of sources and methodology, please see Appendix.
3.2 GEOGRAPHIC DISTRIBUTION: NEW INVESTORS ON OLD PATHS
The geographic distribution of China’s FDI in Europe largely follows the patterns for
intra-European FDI stock. Most Chinese investment heads for “old Europe”: the EU15 attracted more than 85% of total investments between 2000 and 2011. The top three
destinations are Europe’s three largest economies: France, the United Kingdom and
Germany. France is the number one destination for Chinese money with 70 deals
worth $5.7 billion, though a single sizeable transaction accounts for almost twothirds of this amount: China Investment Corporation’s $3.2 billion investment in Gas
de France in 2011. Without this transaction, France would be in 4th place. 2nd place
PATTERNS 36
goes to the United Kingdom, which registered 95 deals together worth $3.7 billion.
The UK hosts investments in autos, banking, and real estate as well as stakes in UKlisted firms that only have small-scale operations in Europe-- mostly mining firms
with assets in Africa, Latin American and Central Asia. In 3rd is Germany, which
attracted more than one-third of all European deals (146) totaling $2.5 billion.
Germany pulled not only the most Chinese investments but also the most diverse
mix of investments by sector, ranging from machinery to telecommunications and
consumer goods. A detailed analysis of investments in the top 10 recipient countries
by sector follows in the next section.
Figure 19: Chinese Direct Investment in the EU-27, 2000-2011
Accumulated deal value from 2000-2011, USD million
Source: Rhodium Group. For a detailed explanation of sources and methodology, please see Appendix.
Table 2 details Chinese investment by country and compares each country’s rank as a
recipient of foreign direct investment from China with their rank as a recipient of
global direct investment. It confirms the impression that Chinese money largely
37 CHINA INVESTS IN EUROPE
follows in the paths of other foreign investors, with most countries deviating no
more than five ranks.
Table 2: China’s FDI in the EU-27 by Country, 2000-2011
USD million, number of deals
Country
1
2
3
4
5
6
7
8
9
10
11
12
13
14
15
16
17
18
19
20
21
22
23
France
United Kingdom
Germany
Sweden
Hungary
Netherlands
Belgium
Greece
Italy
Austria
Romania
Poland
Spain
Czech Rep.
Finland
Portugal
Bulgaria
Luxembourg
Ireland
Denmark
Latvia
Cyprus
Estonia
Lithuania
Malta
Slovakia
Slovenia
Investment
Value
(USD million)
Rank Compared to
FDI from the Rest of
the World*
Number of
Greenfield
Projects
5,722
3,684
2,543
2,251
2,065
1,164
847
714
554
391
299
190
187
76
48
47
47
46
44
30
3.8
3
0
0
0
0
0
20,957
+2
-1
-1
+4
+14
0
-3
+14
-2
+1
+4
-3
-8
0
+1
+1
+1
-5
-9
-7
+5
-1
-
46
69
113
14
14
32
12
5
31
6
13
15
22
10
1
5
6
1
6
6
1
0
0
0
0
0
0
428
Number of
Acquisitions
24
26
33
6
4
15
3
0
16
5
1
1
1
1
4
0
1
1
1
1
0
1
0
0
0
0
0
145
Total
Number of
Deals
70
95
146
20
18
47
15
5
47
11
14
16
23
11
5
5
7
2
7
7
1
1
0
0
0
0
0
573
Source: Rhodium Group, UNCTAD. For a detailed explanation of sources and methodology, please see Appendix. *Difference to
country’s position in the ranking of total inward FDI flows in the EU-27 by value, 2000-2010, compiled with data from UNCTAD.
Outliers on the upside are Hungary and Greece. Both countries attracted one largescale investment that pushed them up the rankings. Hungary received a $1.9 billion
investment in the chemical sector from the sale of Borsodchem to Yantai Wanhua
Polyurethanes. Greece awarded China’s COSCO a long-term lease in the port of
Piraeus, which was tied to an investment of more than $700 million for the
modernization of the port’s container terminal. Sweden fares well in the European
ranks, thanks to the $1.5 billion acquisition of Volvo Cars by Geely and related followup investments. Another high performer is Romania, attracting several greenfield
PATTERNS 38
manufacturing investments, among them a plant by Shantuo Agricultural
Machinery Equipment to produce tractors.
Countries punching below their weight are Spain, Luxembourg, Denmark and
Ireland, each of which received substantially less investment from China than their
position in the total inward FDI table would predict. Spain and Ireland have been
major recipients of foreign investment over the past decade, but their economies
stumbled just as Chinese investment started booming. Other smaller European
countries with major fiscal and structural problems have also not gotten much
attention from Chinese investors thus far, with the aforementioned exception of
Greece. Looking forward, the privatization of state assets in fiscally troubled
countries provides an attractive opportunity for Chinese buyers. Assets with a longterm stable return on investment such as infrastructure are the focus of Chinese
long-term investors, as the sale of two billion-dollar stakes in Portuguese utilities
firms to Chinese companies in early 2012 shows.
Box 2: Chinese Investment in the EFTA States
Western European economies outside of the European Union – the four states of the
European Free Trade Association (EFTA) -- also attracted significant Chinese
investment in recent years. Norway and Switzerland together pulled in US$13 billion
between 2000 and 2011, more than half of the EU’s total for that same period; three
large multi-billion dollar acquisitions in the energy and metal sectors accounted for
90% of the total investment value. Iceland and Liechtenstein have seen few
investments in the same period.
Norway attracted five acquisitions for a total value of more than $5 billion. Two deals
account for the bulk of this investment. One was the $2.2 billion acquisition of Elkem
AS, an energy-efficient producer of high-grade silicon for solar technology and
computers, by China Bluestar Group (a subsidiary of Sinochem) in 2011. The other
was the 2008 acquisition of Awilco Offshore ASA, which provides oil and gas drilling
services and operates oil tankers, by COSL Norwegian AS (a subsidiary of CNOOC),
who gained access to modern offshore drilling platforms and a tanker fleet in the
deal. In a smaller acquisition, Sinochem purchased oil and gas stakes of Atlantis from
Norway's Petroleum Geo-Services (PGS) for $55 million. Chinese greenfield
investments in Norway total less than $100 million and mostly went into the
telecommunications sector: Huawei entered Norway in 2005 and today operates two
offices with over 150 employees. ZTE, the other Chinese telecommunications giant,
has also expanded into Norway.
In Switzerland, we recorded three acquisitions between 2003 and 2011, including one
mega deal. In 2008, Sinopec subsidiary Mirror Lake Oil & Gas purchased Addax
Petroleum, a Geneva-based oil and gas company, for $7.2 billion. The transaction,
one of the biggest Chinese overseas acquisitions to date, drastically raised Sinopec’s
39 CHINA INVESTS IN EUROPE
global profile by adding oil assets in Africa and Middle East. The other two
acquisitions were targeting Swiss high-end consumer product industries—textile
and watch manufacturing. Greenfield investments into Switzerland total around
$100 million and mostly focused on higher value added services. Naturally, financial
services were a large draw: Bank of China opened offices to serve private and
institutional investors. Green technology was another appealing sector, with
investments from Chinese firms including Trina Solar and Suntech Technology.
While we were not able to identify any substantial investments in Liechtenstein, it
may be used by Chinese investors as a springboard for investments in other
countries. Iceland attracted a $200 million investment by a Chinese real estate
tycoon to develop a tourism project in 2011, but the deal was delayed by the
government on national security grounds as the proposal included the acquisition of
a large patch of land.
3.3 INDUSTRIES TARGETED BY CHINESE INVESTORS
Chinese investors have the same diverse motives for coming to Europe as other
foreign investors do: to sell products in the world’s largest single market, expand
their global production chains, and tap into a rich base of technology, brands and
human talent.
Table 3 gives an overview of China’s OFDI in the EU by sector. It shows that Chinese
investments are spread across a wide range of sectors in both manufacturing and
services. Nine of the 30 sectors we track registered $1 billion of investment or more.
The top four industries by value have all seen at least one large-scale acquisition –
utilities (CIC-Gas de France), chemicals (Wanhua-Borsodchem), automotive (GeelyVolvo) and coal, oil and gas (Sinochem-Emerald).
In number terms, communication equipment and services, industrial machinery and
renewable energy attracted the largest Chinese investment values. However these
sectors not the most capital intensive, hence average deal size is smaller. Automotive
components, financial services and software and IT services have also received a
significant number of investments across Europe.
PATTERNS 40
Table 3: China’s FDI in the EU-27 by Industry, 2000-2011
USD million and number of deals
Sector
1
2
3
4
5
6
7
8
9
10
11
12
13
14
15
16
17
18
19
20
21
22
23
24
25
26
27
28
29
30
Chemicals, Plastics & Rubber
Utility and Sanitary Services
Automotive OEM & Components
Coal, Oil & Gas
Communications Equip. & Services
Transportation Services
Metals Mining & Processing
Consumer Electronics
Industrial Machinery & Equipment
Food, Tobacco & Beverages
Financial Services & Insurance
Real Estate
Pharmaceuticals
Electronic Equip. & Components
Software & IT Services
Aerospace, Space & Defense
Textiles & Apparel
Alternative/Renewable Energy
Healthcare & Medical Devices
Paper, Printing & Packaging
Leisure & Entertainment*
Other Transport Equipment
Business Services
Minerals Mining & Processing
Semiconductors
Biotechnology
Consumer Products & Services
Furniture & Wood Products
Engines & Turbines
Construction Services
Total
Value (USD mn)
Greenfield
M&A
TOTAL
126
3,505
3,631
0
3,259
3,259
655
1,961
2,615
18
1,603
1,621
1,180
177
1,357
784
546
1,329
25
1,200
1,225
187
983
1,170
495
499
993
110
570
679
495
31
526
146
340
486
21
280
300
133
152
285
256
13
269
79
174
253
137
96
233
145
84
229
30
63
93
74
0
74
48
0
48
31
15
46
43
1
44
1
42
43
18
17
35
24
10
34
28
0
28
0
27
27
14
4
18
6
0
6
5,306
15,650 20,957
Number of Projects
Greenfield M&A TOTAL
13
9
22
0
1
1
23
12
35
4
7
11
95
5
100
9
7
16
13
14
27
33
9
42
34
23
57
10
9
19
26
2
28
4
1
5
4
3
7
22
5
27
21
5
26
7
4
11
8
4
12
45
7
52
9
2
11
2
1
3
3
0
3
4
1
5
13
2
15
1
2
3
4.0
3
7
6
2
8
9
1
10
0
3
3
2
1
3
4
0
4
428
145
573
Source: Rhodium Group. For a detailed explanation of methodology and industry categories, please see Appendix.
The distribution of Chinese investment in Europe underscores the changing drivers
of Chinese outward FDI as described in chapter 2.
China’s global OFDI boom has focused on extractive industries, but natural resources
naturally do not play a huge role in the European story. Investments in fossil fuels
and metals assets total $2.6 billion, some 15% of the 2000-2011 total, but only because
many global mining firms are headquartered and listed in London even if they hold
most of their assets elsewhere. The biggest transactions were the $877 million
takeover of Emerald Energy by Sinochem Resources in 2009, the $406 million
acquisition of Caledon Resources by Guangdong Rising in 2011, and the $256 million
investment by China Railway Materials in African Minerals in 2010. Chinese firms
41 CHINA INVESTS IN EUROPE
have also struck deals in the resources sector in non-EU member states, for example
Sinopec’s $7.2 billion purchase of Switzerland-based Addax Petroleum in 2008, and
CNOOC’s $2.5 billion purchase of Awilco Offshore ASA. Only a few deals were
recorded in agriculture and farmland. Premium vineyards in France have attracted
interest from Chinese buyers—Longhai International’s purchase of the Chateau
Latour-Laguens in Bordeaux in 2008, for example. In 2011, Tianjin State Farms
Agribusiness Group invested $14 million in a farming project in Bulgaria. Over the
past five years investment by Chinese manufacturing firms has increased markedly.
A clear investment focus of these firms is access to European technology and
innovation, which allows them to move up the value chain. The acquisition of highly
specialized European firms allows them to gain core technology assets and the knowhow for utilizing this technology and the expertise for operating in global markets.
Often, this is not primarily about competing in overseas markets, but strengthening
competitiveness against foreign multinationals and domestic competitors in the fastgrowing home market back in China. Prime examples are acquisitions of small and
medium-sized firms in industrial machinery (Beijing No.1 Machine Tool-Coburg
Waldrich), auto parts (BAIC- Weigl), general aviation (AVIC-FACC), renewable
energy (Goldwind-Vensys) and chemicals and plastics (Chongqing Light IndustrySaargummi).
In addition to acquiring technology assets, Chinese manufacturers have also started
to tap into Europe’s human talent and research infrastructure by establishing
research and development (R&D) centers on the continent. Many firms have ramped
up R&D operations after acquiring European firms. Geely, for example, significantly
expanded engineering staff in Sweden after the acquisition of Volvo, and AVIC
subsidiary FACC announced plans to invest tens of millions of dollars in new R&D
facilities in Austria. Greenfield investment in R&D operations without previous
acquisitions has also grown in recent years, in cases such as telecommunications
equipment supplier Huawei, which runs multiple R&D centers across Europe, and
auto maker Changan, which has opened R&D offices in the UK and Italy.
Greenfield investments in manufacturing are still rare, but more frequent in recent
years. Some firms have invested in manufacturing to reduce the sting of European
import tariffs. After the Union changed the classification of flat panel display
monitors from computers to displays in 2004, excluding them from the Information
Technology Agreement (ITA) and making them subject to a 14% tariff, several
Chinese producers including Hisense and Changhong Electronics built facilities in
Eastern Europe. Eastern European member states are also attracting Chinese
greenfield FDI from firms that need a local presence to serve markets but require
relatively cheap labor cost structures (because their products occupy the lower end of
the market – see Great Wall’s joint venture in Hungary for the final assembly of cars
for the European market). A few firms have also built greenfield manufacturing
operations in Western Europe, such as construction machinery maker Sany’s $77
million facility in Cologne, and Greatview Aseptic Packaging’s new production plant
in Halle, Germany.
PATTERNS 42
In the service sector, we see a clear evolution away from trade-facilitating
investments towards a broad range of different activities. Chinese presence in Europe
started with early service sector investments in small-scale representative offices and
sales operations. A large share of the 428 greenfield investments in our database are
operations related to marketing and sales, and there are probably hundreds if not
thousands of small-scale trading firms that we do not count because the total
investment volume is lower than our $1 million threshold. 27 These market-seeking
investments range across Europe and all industries, as firms need to build up an
extensive network of operations within Europe’s single market due to barriers such as
language. Not surprisingly, big markets such as Germany attract the greatest number
of such investments.
In recent years Chinese firms have also started to invest in local trade-facilitating
infrastructure and logistics operations. For example, China’s largest shipping firm,
COSCO, has invested heavily in European ports, including Naples, Piraeus and
Antwerp. Smaller investments include the purchase of the airport of Parchim in
Germany by LinkGlobal Logistics. A second trend is that export-facilitating
investments are gradually shifting from trade offices to more sophisticated
operations. Firms trying to move closer to the European customer are increasingly
investing in modern sales infrastructure, including branding and the provision of
after-sales services. For firms selling technologically-advanced goods to European
customers under their own brand names, like Huawei, setting up shop in Europe is
indispensable. We increasingly see Chinese service providers follow their domestic
clients abroad to provide support with overseas operations. Chinese banks, now
present in all major European markets, are an example.
As in the manufacturing sector, investments in the service sector have a strong focus
on technology and know-how. Firms have started to take minority positions in
European services companies to learn more about managing modern services firms
in sectors that are expected to grow quickly in China in coming years, like financial
and business services. Chinese services companies are also increasingly interested in
the European market itself, rather than seeing it as a conduit for increasing
competitiveness in the home market. The few service sector firms that flourished in
China’s capital-intensive growth model have started investing in Europe to compete
there; telecommunications services providers China Unicom and construction and
infrastructure services firm COVEC are examples. COVEC’s rocky experience in
Poland illustrates the enormous challenges such firms still face. Traditional service
sectors (utilities, infrastructure) are also attractive targets for financial investors
seeking FDI stakes for long-term returns, as in the cases of China Investment
Corporation’s investments in Gas de France and Thames Water. 28
The city of Hamburg claims to host more than 400 Chinese enterprises alone: see Matz (2012). For a good
analysis of the European activities of smaller scale Chinese businesses, see Zhang et al. (2011).
28
CIC’s stake in Thames Water does not qualify as direct investment as it remains below the 10% threshold.
27
43 CHINA INVESTS IN EUROPE
Figure 20: China’s FDI in the EU-27 by Industry, 2000-2011
Bubble size represents investment value*; share of greenfield projects in light blue, acquisitions in dark blue
Source: Rhodium Group. For a detailed explanation of sources and methodology, please see Appendix.*Bubble sizes represent the
proportions of the accumulated value of investments in each industry in the period of 2000-2011.
PATTERNS 44
Figure 20 presents Chinese investment by country and industry, with the size of the
bubble representing the total investment value and the color indicating the share of
greenfield and acquisitions. The geographic and sectoral breadth of these 573 deals
demonstrates that Chinese interests are broad, not limited to a handful of niches.
This array of the data also shows that Chinese investors are increasingly entering the
European market through greenfield investments, supposedly a hallmark of more
advanced economies, not less developed ones. And finally, M&A is largely confined
to the old EU core, while the new Eastern European member states mostly attract
greenfield investments as Chinese firms set up from scratch.
3.4 INVESTORS AND OWNERSHIP STRUCTURES
Many people assume, mistakenly, that all Chinese firms are tied to the government.
The reality is that ownership in China is diverse, and this is reflected in foreign
investment patterns. In Europe, investors run the gambit from the state sovereign
wealth fund (China Investment Corporation, or CIC), to state-owned enterprises
(e.g., Three Gorges), firms with hybrid ownership structures (e.g., Lenovo), and
wholly private firms and wealthy Chinese individuals.
State-owned enterprises (SOEs) are less important in China’s investment portfolio in
Europe than in the global picture. SOEs have dominated China’s global OFDI
activities in the past, accounting for some 70% of the 2010 stock, according to official
figures. 29 This is not surprising, given their advantage in getting approved to venture
overseas and dominance in extractive industries and other capital intensive sectors.
In Europe, the overwhelming majority of deals are done by private players – which
we define as having 80% or greater nongovernment ownership. Table 4 shows that
359 of 573 deals (63%) from 2000-2011 were done by privately owned companies.
They dominate the greenfield space and the more dynamic sectors such as services.
Private sector acquisitions mostly target small and medium-sized enterprises, like
German machinery makers. The average deal size is of course much smaller than for
state-owned enterprises.
29
According to the Ministry of Commerce’s most recent Bulletin on Outward Foreign Direct Investment, stateowned enterprises accounted for around 70% of total Chinese OFDI stock. The authors’ interviews with
economists and researchers at China’s State-Owned Assets Supervision and Administration Commission
suggest that the share of state-owned enterprises in total OFDI stock could be even higher.
45 CHINA INVESTS IN EUROPE
Table 4: China’s FDI in the EU-27 by Ownership of Investing Company, 2000-2011
USD million and number of deals
Government Controlled
State-Owned Enterprises
Sovereign Wealth Fund
Private and Public*
Government Controlled
State-Owned Enterprises
Sovereign Wealth Fund
Private and Public*
Number of Deals
Greenfield
% share M&A
148
35%
66
% share
46%
All Deals
214
% share
37%
148
0
35%
0%
64
2
44%
1%
212
2
37%
0%
280
428
65%
79
145
54%
359
573
63%
Total Investment (USD mn)
Greenfield
% share M&A
2,738
52%
12,413
% share
79%
All Deals
15,151
% share
72%
2,738
0
52%
0%
8,814
3,599
56%
23%
11,552
3,599
55%
17%
2,569
5,307
48%
3,238
15,650
21%
5,807
20,958
28%
Source: Rhodium Group. *May include minority stakes by government-owned investors below 20% of voting shares.
The top five private Chinese investors in Europe are: Geely, Huawei, Lenovo, Sany
and Wolong Group (Table 5). Several reforms might further increase the role of
private sector investors in the future. First, the reform of China’s outward
investment regulatory framework has simplified procedures for smaller scale
investments. Second, reforms in China’s financial sector might make it easier for
smaller and medium-sized private firms to raise capital for overseas investment.
Third, individuals were to date banned from taking direct investment stakes
overseas, but a pilot program to allow entrepreneurs and individuals from the city of
Wenzhou to engage in OFDI was launched in 2012. Finally, private equity funds are
becoming more prominent in outbound FDI, which will open another channel for
private flows.
Table 5: Top 5 Private Investors*, EU-27, 2000-2011
By total investment value
1
Zhejiang Geely
Group
The high-profile acquisition of carmaker Volvo and subsequent investments in the
company have made Geely one of the biggest private investors in the European
Union.
2
Huawei
Technologies
Although lacking a single big-ticket investment comparable to Geely’s acquisition of
Volvo, Huawei has engaged in a tremendous amount of investment in sales, R&D,
support, and small-scale manufacturing operations in the EU, accounting for perhaps
the most greenfield projects of any private Chinese firm across Europe.
3
Lenovo Group
Lenovo’s acquisition of the German company Medion in 2011 was one of the largest
single investments made by a private Chinese firm in the EU from 2000 to 2011.
Lenovo also operates a handful of retail and support operations in the EU.
PATTERNS 46
4
Sany Group
Sany is currently constructing a massive manufacturing, R&D and support facility in
Bedburg, Germany, which has proved to be one of the largest greenfield investments
made in the EU by a private Chinese firm. In 2012 Sany also acquired German
concrete pump maker Putzmeister.
5
Wolong Holding
Group
The Zhejiang-based manufacturer of electric motors acquired Austrian ATB Drive
Technology in 2011 in one of the most valuable M&A transactions by a nongovernment controlled Chinese company in the EU in the period of 2000-2011.
Source: Authors’ compilation. *May include minority stakes by government-owned investors below 20% of voting shares.
State-owned firms account for only one-third of deals, but they are more important
in terms of total deal value. 72% of the total $21 billion originates from state-owned
enterprises. This high share mostly can be attributed to a handful of large-scale
acquisitions in capital intensive sectors. Seven deals account for the overwhelming
share of the total SOE deal value: CIC’s purchase of GDF Suez’s exploration business
($3.2 billion), Yantai Wanhua Polyurethanes’s purchase of BorsodChem Zrt ($1.7
billion), PetroChina’s purchase of INEOS Group’s European assets ($1.0 billion),
Sinochem’s acquisition of Emerald Energy ($878 million) and ChemChina’s
acquisition of Rhodia Silicones ($504 million) and Drakkar Holdings ($507 million).
These firms also top the ranking of biggest government-controlled investors,
together with China Ocean Shipping Group (Table 6).
Table 6: Top 5 State-Controlled Investors, EU-27, 2000-2011
By total investment value
1
China Investment
Corporation (CIC)
Investment activities in the EU include a large stake in French GDF Suez'
Exploration Business, and England’s Songbird Estates, the developer of
London’s Canary Wharf district.
2
Yantai Wanhua
Polyurethanes Co
The high-profile acquisition of the Hungarian firm BorsodChem was one of
the most valuable Chinese investment transactions in the EU from 2000 to
2011.
3
China National Petroleum
Corporation (PetroChina)
PetroChina now operates refining businesses in Scotland and France
through an acquisition investment in French-based INEOS Group.
4
China National Chemical
Corporation (ChemChina)
China Bluestar has been very active in the EU, executing a handful of M&A
deals and greenfield investments primarily engaged in manufacturing of
various chemical products including silicone and nutritional food additives.
5
China Ocean Shipping
Group Company (COSCO)
The only firm to make this list by merit of its greenfield investments,
COSCO has large port operations in Piraeus, Naples, and Antwerp, as well
as support operations in Hamburg and other E.U. cities.
Source: Authors’ compilation.
47 CHINA INVESTS IN EUROPE
Sovereign investment entities have kept a low profile to date when it comes to direct
investment stakes, but their activities are ramping up. China’s primary sovereign
wealth fund, the China Investment Corporation (CIC), is an active investor in
Europe, but it has only made two investments in Europe that meet the direct
investment threshold: in 2009, CIC injected $340 million in Songbird Estates PLC,
the owner of London’s Canary Warf; in 2011, CIC invested $3.2 billion in Gas de
France’s gas and oil exploration and production business. CIC also has also several
big portfolio investment stakes in European companies, such as its 9% ownership of
UK utility Thames Water. By the end of 2010, CIC had around one-quarter of its
diversified equities portfolio allocated to Europe. 30 Beijing’s second major foreign
exchange manager, the State Administration of Foreign Exchange (SAFE), does not
release any information on its portfolio. From regulatory filings, it is known that one
of its investment arms, SAFE Investment Company, has substantial holdings of
European equities. However, we did not register any stake in a European company by
a SAFE-related firm that would come close to the FDI threshold.
Several other government-controlled entities have also recently started to channel
foreign exchange reserves through private equity structures into direct investment
stakes in Europe. Private equity fund Mandarin Capital Partners, for example, has
taken stakes in several European companies, partly financed with capital from China
Development Bank and China Exim Bank. 31 A small number of comparable ChinaEurope funds exist, but most of them have not taken stakes that would qualify as FDI.
There are a couple of government entities that might become relevant players in the
future. Guoxin Asset Management (GAM), an investment arm under the Stateowned Assets Supervision Administration Commission (SASAC), has reportedly
secured $10 billion of funds from the central bank to support Chinese firms going
abroad. Local governments have also started to set up funds to co-invest with local
companies, for example Sailing Capital International, an investment fund dedicated
to supporting Shanghai companies with overseas investment projects. Finally,
China’s National Social Security Fund (NSSF) could become a direct investor or coinvestor in the future, as it is planning to increase the allocation of money into
overseas assets.
30
31
Figures from CIC’s 2010 annual report (China Investment Corporation 2010).
For more information on Mandarin Capital Partners, see http://www.mandarincp.com/.
PATTERNS 48
4. Impacts: Benefits and Risks
We see the steep uptick in Chinese FDI flows, and we can begin to trace the patterns
and understand the forces driving funds toward Europe. But what are the
implications? Can we tally the benefits to press the case for openness, or measure
downside risks to justify limits? Everyone -- leaders, politicians, bureaucrats,
diplomats, executives, activists and average citizens – wants a straightforward
calculus of benefits and risks. Unfortunately, there are no easy answers. Like other
offshoots of globalization, Chinese investment in Europe can be both positive and
negative at the same time, depending on who you are. Huawei’s success in
Scandinavia portends consumer welfare gains for millions of mobile users, but
disruptive new competition for European incumbents and their employees, and
challenges for traditional national security screeners. China Ocean Shipping Group’s
engagement in the port of Piraeus may threaten the privileges of unionized Greek
labor, but it will provide hundreds of millions of Euros to modernize container
terminals and expand freight traffic and related jobs. These cases are not exceptional
– they are typical.
While not unique to Chinese investment, this bipolarity is particularly unnerving in
the case of China, for several reasons. It has sprung up quickly, outpacing the
sensibilities of academics and pundits. As a result, analysis of the issue was until
recently laden with ill-informed suspicions and emotional allegations. Further, the
take-off in Chinese interest coincides with severe European instability, as a
combination of political, institutional, fiscal and banking crises roil the Union. The
concern that Chinese buyers are looking for extractable assets, not a long-term
position, therefore cannot be dismissed lightly. Finally, even if China were moving
slower and Europe were past the crisis, Europeans would be right to have suspicions
about Beijing’s self-proclaimed “capitalism with Chinese characteristics”.
In this section we examine the impact of Chinese OFDI in Europe on three fronts:
economics, politics and national security. Some impacts can be quantified based on
direct evidence, such as the FDI-related employment reported in chapter 3, or
projected based on historical experience. In many cases, the impacts on market
functioning, political discourse and national security can only be discussed
qualitatively. Approaching the topic armed with a comprehensive database, rather
than just inferences and instincts, will facilitate more effective and informed
reactions from policymakers, business leaders and other interested Europeans.
4.1 ECONOMIC IMPACTS
In the aggregate, Chinese FDI to Europe should provide the same benefits as other
direct investment flows, whether from inside or outside the EU. Foreign direct
investment increases the welfare of both producers and consumers. It allows firms to
explore new markets and operate more efficiently across borders, reducing
production costs, increasing economies of scale and promoting specialization. It is
particularly important when serving overseas markets requires an on-the-ground
49 CHINA INVESTS IN EUROPE
presence (for example, in the provision of services). Foreign direct investment also
means better prices for firms looking to divest assets, thanks to a bigger and more
competitive pool of bidders. For consumers, foreign investment increases the contest
for buyers' attention, leading to more choices, lower prices and innovation. And in
local communities, foreign investment brings new jobs, tax revenue, and knowledge
spillovers from worker training, technology transfers and R&D activities.
Modern Europe is a case study of these economic forces and benefits at work. IntraEuropean cross-border FDI has been one of the most important drivers of economic
growth and integration, creating “European multinationals” with operations
stretching from design in Italy, research in Germany and production in Eastern
Europe.
Investment from beyond European borders raised specters of ravenous foreign
acquirers at several points in past decades, but in the end it also yielded tremendous
benefits. In addition to creating new jobs and demand, it has spurred innovation by
introducing new technology, products and management methods – such as Japanese
supply chain management techniques, and innovative IT solutions from California.
Equally important, thousands of European firms ranging from German auto makers
to Italian fashion labels to French vineyards and British investment banks today rely
on FDI openness abroad to service foreign markets with specialized products and
services.
Investment from China brings the same positive macroeconomic and
microeconomic impacts as money from elsewhere. Here, we consider the most
important benefits of foreign investment from China.
New capital: With Europe entrenched in a compound crisis and austerity and
structural reform likely to require reduced headline growth for some years to come,
external capital infusions are more important than ever. While OFDI from traditional
investors has fallen off severely—global FDI flows almost halved from a peak of $2.3
trillion in 2007 to $1.3 trillion in 2010—Chinese OFDI is growing rapidly, amplifying
China’s importance to capital-hungry Europe.
We project $1-2 trillion in global OFDI from China over the decade 2010-2020, based
on an extrapolation of historical outbound investment growth for other nations,
China’s current position, and its expected GDP performance. If Europe maintains its
average intake of global FDI flows in the 2000s – around 25% -- then to 2020 Europe
would look for a cumulative $250-500 billion in new Chinese M&A and greenfield
investment. Even if China underperforms the global average takeoff in OFDI and
Europe underperforms its past track record in attracting new global flows, a 20122020 annual average of at least $20-30 billion would be expected.
Employment: By injecting capital into the European economy, either via new
greenfield projects or positions in existing ones, Chinese investment will generate
employment. Data provided by national statistical agencies and Eurostat offer a
fragmented and outdated picture of foreign affiliate operations in Europe and are of
IMPACTS 50
limited use for analyzing recent trends. 32 Our database offers alternative estimates.
The 428 greenfield projects in our 2000-2011 dataset created an estimated 15,000 new
jobs, not counting employment at smaller firms with less than $1 million investment
values.
Mergers and acquisitions create fewer new jobs, as employment can remain the same
or shrink in the case of restructuring or integration. However, Chinese acquisitions
can preserve jobs in at-risk firms on the brink of shutdown, or lead to job growth
once a marginal firm is turned around: Geely’s 2010 acquisition of Volvo not only
saved 16,000 local jobs, but also sparked an ambitious $11 billion job-creating
investment program in Sweden and the rest of Europe. Chinese firms have also saved
jobs by turning around ailing smaller firms; for example, German machinery maker
Waldrich Coburg’s staff soared from 500 to 800 after it was bought by Beijing No. 1
Machine Tools in 2005. Based on M&A transactions in our 2000-2011 database, we
estimate that majority-owned subsidiaries of Chinese firms support at least 30,000
additional jobs across Europe. 33 This brings our total employment figure from
majority-owned subsidiaries to more than 45,000. Adding in firms that China
finances through non-majority direct investment stakes – like Gas de France or
Songbird Estates– would swell this figure by several tens of thousands.
These are much higher figures than what is captured in official data, but still low -unsurprisingly, given that inflows from China are still only in their infancy -compared to the total EU labor force of 240 million. Economists have a less than
stellar record of accurately projecting the employment impacts of economic shocks,
but it is helpful to consider the future job potential based on historical and current
comparators. Through the beginning of 2009 US firms alone employed 4.3 million
EU citizens with a total paycheck of $273 billion. 34 If our extrapolation for Chinese
investment in Europe proves accurate, $250-500 billion of new investment by 2020
will create or support a significant number of jobs across Europe. Employment levels
in Europe, of course, will depend not only on investment flows, but on overall
macroeconomic conditions now dependent on structural adjustment.
Consumer welfare: Through gains from trade, Chinese firms deliver European
consumer welfare in the form of lower prices, product diversity and selection, and
faster innovation cycles. These gains extend beyond traditional goods trade to
product segments that require a more active presence in consumer markets, and –
especially – to services. Chinese firms have already developed strong global positions
in several service industries. In telecommunications infrastructure, for example,
The latest Eurostat Foreign Affiliates Statistics (FATS) count 1,728 Chinese and Hong Kong subsidiaries in
Europe through 2009, employing 9,100 Europeans with a total payroll of $1.3 billion. However, these figures are
largely useless for analyzing current employment provided by mainland Chinese firms as they mix mainland
and Hong Kong entities, have a huge time lag and report for only a third of EU member states. See Appendix.
33
The most significant employers include Volvo Cars, Borsodchem, Bluestar Silicones, Medion, KSM Castings,
CIFA Spa, FACC, Inalfa Roof Systems, and Saargummi.
34
Figures are from the United States Bureau of Economic Analysis (BEA), as comparable data is not available
from Eurostat for all EU-27 states.
32
51 CHINA INVESTS IN EUROPE
enhanced competition from Huawei and ZTE has brought fixed investment down
from trend, and thus reduced pass-along costs for the consumer.
Shareholder value: Greater investment interest from China increases competition
for assets, and thus raises prices for European sellers. While more efficient asset
pricing is always desirable, this is especially important as Europe moves through a
cycle of asset sales as part of the broad debt restructuring underway. The Portuguese
government’s sale of a 21% stake in Energias de Portugal SA (EDP) under its austerity
program is a case in point. China Three Gorges Corporation outbid other interested
firms by offering a 53% premium to the firm’s share price, well beyond what other
bidders were willing to pay. The auction brought the Portuguese government total
revenue of $3.5 billion, much more than originally expected.
Much has been speculated about whether Chinese investors are willing to “overpay”
for direct investment assets, but far less is understood. While China’s firms are
certainly not as experienced at factoring global pricing variables into their deal
making, they often enjoy some positive information asymmetries to offset that.
Chinese firms are often much better briefed on market conditions in China, and since
Chinese marginal demand growth has become a huge share of total global growth,
they are often in a strong position to value productive assets. Another way to put this
is that FDI asset valuation fluctuates with the global growth cycle, and China is a
heavier and heavier weight in that cycle, putting China’s real economy firms and
their investment bankers in a strong analytical position. For unlocking European
shareholder value, the impact of Chinese OFDI might be more than additive, it might
be definitive.
Productivity effects: Given their lower starting level of technology and more
modest management skills, it might seem premature to expect Chinese firms to
bring to Europe the intellectual property and business know-how that fuels total
factor productivity growth. 35 However, Japan is a historical example of how quickly
emerging market firms can swing from students to leaders. Japanese auto and
electronics firms were dismissed as primitive when they arrived in Europe in the
1960s and 70s, but little more than a decade later they were at the forefront of
technology, promoting important new management techniques, such as just-in-time
logistics. A few Chinese firms have already moved beyond reverse engineering and
imitation toward technological leadership in their industries, and they are investing
heavily in European R&D capacities.
Keeping China’s market open: There are several important indirect impacts
associated with growing Chinese FDI in Europe. By keeping its door open to Chinese
investment, Europe encourages China to keep its door open to European investment.
While China has embraced an exceptionally open stance toward foreign investment
since the late 1980s, European firms have been outspoken about recent signs of
Studies of business innovation in China generally conclude that manufacturers take low-tech approaches,
reverse-engineer foreign innovation rather than make breakthroughs, and rely on foreign talent and inputs for
a high share of advanced capabilities. See, e.g., the OECD’s review of China’s innovation system (OECD 2008b).
35
IMPACTS 52
backsliding as China’s firms graduate from relying on partnerships with
multinationals to possessing more home-grown capabilities. 36 These concerns are
not hallucinatory: there are indeed factions in China counseling less liberal
treatment for foreign firms in the domestic economy. We are optimistic that prointernational arguments will prevail, but their success – and the plethora of
economic and security benefits dependent on continuing Chinese convergence with
liberal international norms – relies in part on Europe’s continuing demonstration of
the virtues of openness.
The consequences of sealing Europe off from Chinese investment would be felt
beyond the realm of bilateral investment. China is a critical export market for many
European firms: as Figure 21 shows, China’s share in EU exports tripled from 3% in
2000 to almost 10% in 2011. For many firms, China is now the single most important
overseas market, particularly for high value-added products. With private
consumption in China projected to grow by $8-10 trillion over the next decade, China
will overtake the US as the world’s largest consumer market by around 2025. 37 The
negative impacts of investment protectionism on European market access in China
would be huge.
Figure 21: China’s Role in EU-27 Exports, 1999-2011
USD billion and % share of total
10%
200
Total EU Exports to China, USD bn (LHS)
180
9%
China's % Share of Total EU Exports (RHS)
160
8%
140
7%
120
6%
100
5%
80
4%
60
3%
40
2%
20
1%
0%
0
1999
2000
2001
2002
2003
2004
2005
2006
2007
2008
2009
2010
2011
Source: Eurostat, Rhodium Group.
Convergence: Finally, Chinese firms investing in Europe by necessity absorb the
global business norms and habits characteristic of OECD markets. These practices
will spread across China as firms realize that being able to comply with stricter
36
37
See European Union Chamber of Commerce in China (2011).
See World Bank (2012).
53 CHINA INVESTS IN EUROPE
regulatory supervisions gives them a strong competitive advantage over their
homebound rivals. If Chinese firms holding assets in Europe fail to internalize
Western business norms, they will be more vulnerable to litigation in EU courts,
something they were immune from when serving EU markets solely through
exports.
Along with benefits come risks. The global financial crisis and the European
sovereign debt crisis have revived the critique of free-flowing cross-border
investment, an argument that focuses on the distributional implications of capital
mobility in a world with little labor mobility, due to limitations in education, skills,
language, and culture, and general restrictions on international migration. This is an
important discussion to have, but it is beyond the scope of this study. We assume that
Europe will stick to its commitment to the four freedoms, including the free
movement of capital across borders, knowing that FDI brings risks along with its
many benefits. Thus our focus is not on the general case for or against cross-border
investment but on factors particular to the Chinese case.
Four major China-related points are fueling anxiety in Europe. First, a large inward
FDI presence could expose Europe to China’s wild macroeconomic swings -- both
upside and downside. Second, industrial policy or government ownership might
cause Chinese firms to ship newly acquired assets back to China rather than
maintaining them in Europe. Third, China’s firms could reinforce unfair competitive
advantages by operating and investing more freely in Europe than their EU rivals can
in China. Fourth, Chinese firms accustomed to lax regulations at home will bring
poor labor, environmental and other practices to Europe, and EU governments will
be too eager to attract jobs and investments to robustly hold them to account. These
concerns spring from the exceptional size and velocity of China’s growth, its residual
non-market elements, and the revival of interest in state capitalism and nationalism
as alternatives to Western consumer-centric models. Non-democratic politics are
not unique to China, but in combination with state ownership of globally active
businesses this factors into the analysis of economic impacts as well. We examine
each of these economic issues in light of these characteristics.
Exposure to macroeconomic volatility: Direct investment flows can add to both
inbound and outbound capital flow volatility. FDI can also have a negative impact on
the economic structure of recipient countries if it leads to overinvestment in a
particular sector and causes related asset price inflation. These concerns are mostly
related to natural resources investments due to the proportionately large investment
values of projects in that sector, and can cause distortions in host economies
sometimes called “Dutch Disease” or “Resource Curse”. 38 The recent surge in
resources demand in China and rising Chinese investment in global mining assets
poses such risks for certain developing countries and resource-rich developed
economies such as Australia and Brazil. However, such concerns are less worrisome
in Europe today. The EU is economically diverse and has no frontier natural resource
reserves liable to attract a tsunami of overnight capital. The total scope of Chinese
38
See Sachs (1995).
IMPACTS 54
investment is far too small to have such distortive impacts. Chinese OFDI in Europe
from 2000-2011 is still smaller than what Switzerland invests in the EU in a single
year. 39 So it is clearly misguided to worry on this score – for now.
In the longer term higher levels of Chinese investment could expose Europe to
significant vulnerability should China experience a serious disruption. China is at the
beginning of a difficult economic rebalancing process. If China experiences a hard
landing, its foreign invested firms could pull money back from overseas to fill gaps at
home, and an outflow of Chinese “hot money” could destabilize Europe. While such
concerns about exposure to vulnerability are universal, they are probably more acute
in the case of China due to the outsized growth of Chinese OFDI flows and the
possible severity of an internal Chinese correction. On the other hand, unlike shortterm portfolio investment flows direct investment from China (or elsewhere) is
largely illiquid and immobile. Of course, as James Kynge colorfully illustrated in the
opening pages of his 2006 China Shakes the World, actually it is possible to disassemble
and cart off to China an entire factory; but such undertakings are hardly responses to
short-term conditions. Direct investment is generally “sticky” and long-term, and
there is no reason to believe that Chinese FDI is different.
Headquarters effects: A common fear related to the inflow of foreign direct
investment is that buyers could reorganize assets after an acquisition, to the benefit
of the acquirer’s home country and the disadvantage of the target economy. 40 Newer
research show that such concerns are overstated, as liberalization of cross-border
investment and lower transportation costs offer multinationals increasing freedom
to organize their operations according to comparative advantages of different
locations.
However Chinese firms might behave differently due to the unique characteristics of
China’s political economy. Government and commercial entities have intervened for
decades to exploit foreign technology for the benefit of Chinese firms and induce
foreign players to locate production inside of China. Beijing openly advertises its
intent to bolster national champions through industrial policy, and exerts significant
control through SOE ownership and formal and informal influence over the financial
system. These characteristics feed concerns that Chinese firms are more likely than
investors from elsewhere to acquire European assets, move technology and valuable
assets back home, and shut down European operations. Such worries were on display
in the strong reaction of EU Industry Commissioner Antonio Tajani to Tianjin
Xinmao’s takeover offer for Dutch cable maker Draka in 2010.
The record of Chinese investments in European high-tech businesses thus far
provides little evidence of such behavior. While Chinese firms have moved assets
from Europe to China these transactions were in sunset industries without a future in
Europe – for instance, the well-known case of the Kaiserstuhl coking coal plant in
Germany’s Ruhr Valley, sold to a Chinese buyer in 2003 and then disassembled and
39
40
Refers to data on Swiss FDI in the EU-27 in 2010 by Eurostat.
See Cantwell (2000).
55 CHINA INVESTS IN EUROPE
rebuilt in Shandong province. 41 Examples of Chinese firms acquiring assets in
developed economies to vacuum out technology and shut down local operations are
rare. Technology in most cases depends on intangible skilled staff and know-how
which do not travel well. China’s weakness in innovation is a major factor pushing
Chinese firms to Europe and the United States in the first place, so Chinese acquirers
are generally set on retaining an experienced local workforce. In most recent cases
Chinese acquirers actually increased local staff—for instance, a few months after
taking over Volvo, Geely hired 1,200 people in Sweden and Belgium. 42 Chinese
telecommunications equipment maker Huawei invested heavily in local R&D
operations, and now employs more than 5,000 people in Europe. The key
shortcoming for many emerging Chinese multinationals is human talent, and if
Europe and its workforce remain competitive in high-skilled activities, there is no
reason to expect Chinese or other foreign firms to let these assets slip through their
fingers.
Market-based competition: There are concerns that China’s state capitalism will
undermine the market-based valuation of assets globally. That is obviously a
profound and far-reaching notion, and it must receive further consideration in the
years ahead. Chinese firms operate under different cost and incentive structures than
European or American firms. The structure of China’s state-controlled financial
system and industrial policy differ vastly from Europe’s, resulting in very different
costs of capital, risk taking incentives and consequences for behaviors that might be
harmful to shareholder interests or other stakeholders. 43 The advantageous features
of China’s political economy could put European firms at a disadvantage in
competitive bidding for global assets, and that adverse position might redound
negatively to constituents in their home economies – labor, shareholders, taxcollectors and consumers.
China’s government-controlled financial system does not allocate capital based on
market forces alone, but political relationships and industrial policy imperatives as
well. With lower capital constraints, such as low-cost home loans for overseas
expansions, China’s firms could outcompete competitors with higher costs of capital,
threatening European industries. This was the central argument in congressional
objections to CNOOC’s proposed acquisition of US oil firm Unocal; it has surfaced in
other debates as well. 44
These departures from competitive bidding for setting the price of and access to
capital are reinforced by other characteristics. Foreign firms are more limited by
Chinese inward investment regimes than China’s firms are in Europe or the US,
41
The disassembly of the Kaiserstuhl coking plant is captured in the formidable documentary “Losers and
Winners” (2006) by Ulrike Franke and Michael Loeken.
42
See “Geely’s Volvo says to hire 1,200 new staff”, Reuters, March 29, 2011, available at:
http://www.reuters.com/article/2011/03/29/volvocars-idUSWEA137720110329
43
See for example Owen (2012). Of course, some nations still have explicit national industrial policies – see
France, though limited by EU institutions, most importantly the DG Competition and its state aid unit.
44
For example the investment of Chinese steelmaker Anshan in a slab steel factory in Mississippi in 2010. For an
in-depth academic discussion of capital subsidies in cross-border mergers and acquisitions, see Hufbauer, Moll,
and Rubini (2008).
IMPACTS 56
despite the fact that there is more FDI in China than Chinese OFDI abroad. That
differential is a function of the development stage, not foreign closure to China.
Figure 22 illustrates this with quantitative measures of investment restrictions
compiled by the OECD. Now that China’s firms are capable of competing abroad,
head to head with the world’s best, the unequal non-market elements not yet
liberalized in China will surely lure attention. In addition to formal restrictions, of
course, informal barriers and discrimination against foreign firms remain a real
concern. 45 Ultimately, we predict that Europe’s greatest misgiving about these
residual differences will not be that $5,000 and $50,000 per capita economies have
different resource allocation mechanisms, but that China’s post-1978 move toward
contestable market mechanisms is now being pulled backward by Chinese neomercantilists. 46
Figure 22: Formal FDI Restrictiveness, 2012
Index, 1=Closed; 0=Open
0.45
0.40
0.35
0.30
0.25
0.20
0.15
0.10
0.05
EU Average*
OECD Average
United States
Australia
Korea
Canada
Mexico
Japan
Argentina
South Africa
Brazil
NON-OECD average
Russia
India
China
0.00
Source: OECD, Rhodium Group. *Calculated based on available OECD data for 24 of 27 EU member countries.
The distortions in China’s domestic marketplace could not only threaten fair
competition among firms, but also the global market-based pricing system. Most
countries are price takers: even if they distort their home markets, they are too small
to affect world prices. However, there are concerns that China is large and influential
enough to be a price maker, whose state interventions will distort world prices and
markets. For the time being, China’s FDI outflows are not nearly large enough to
distort global asset prices in the aggregate, but this will change in the years ahead.
See European Union Chamber of Commerce in China (2011) or European Commission (2012).
See e.g. quotes of Sun Liping, in: “China’s reforms stalled by powerful vested interests”, The Telegraph,
January 12, 2012, available at: http://www.telegraph.co.uk/news/worldnews/asia/china/9009915/Chinasreforms-stalled-by-powerful-vested-interests.html
45
46
57 CHINA INVESTS IN EUROPE
And in specific niche areas, China’s presence is already dominant in terms of price
setting.
Government involvement, primitive corporate governance, and the lack of an
independent legal system can subvert a healthy market structure in ways other than
oligopsony power as well. While Chinese firms generally operate in a market system
at home and abroad, and make overseas investments based on commercial
motivations, Chinese leaders have de facto control over both state-owned (through
ownership and nomination of executives) and private (through financial system
domination, capital controls, and regulatory control) firms when they want to exert
it. This is already impacting thinking about global merger control. In seminal review
of chemical company China Bluestar’s acquisition of Norwegian Elkem, EU
competition policy authorities decided to treat all firms managed by China Stateowned Assets Supervision and Administration Commission (SASAC) operating in
the same industry as a single corporate entity for purposes of assessing market share,
since they report to the same controlling shareholder and are disciplined by no procompetitive agency to prevent collusion or other abuse of market power. 47 We think
these debates over market structure impact are appropriate and will need to go
further.
Downward convergence: While state coordination can be an advantage to some
Chinese players with lower input costs, it breeds regulatory weakness and inefficient
handling of the healthy functions of a market economy. This is a common worry
among policy makers in Europe and Western business professionals acquainted with
the incongruities of Chinese business ethics, which depend less on law than on the
interpretation of law by one’s powerful friends. Signature Chinese business
undertakings in Europe seem to underscore these concerns: labor rights violations,
copyright infringement and tax evasion in the experiment with Chinese textile
entrepreneurs in the Italian city of Prato 48; disputes and contract violations leading
to Chinese construction company COVEC’s pull-out from a major project in Poland
in 2011 49; and Huawei’s troubles with Swedish labor regulators for alleged violations
in 2011. 50
These cases illustrate the missteps that Chinese firms can make when they come to
Europe for the first time, but they are far from evidence of systematic attempts to
undermine existing labor laws and other regulations. Europe has strong rules
safeguarding labor rights and other social standards, and Chinese firms must comply
just like everyone else when they invest in Europe. Prato is an example of lax
enforcement of law on the local level, not Chinese criminality.
See European Commission (2011).
See “Chinese Remake the ‘Made in Italy’ Fashion Label”, the New York Times, September 12, 2010, available
at: http://www.nytimes.com/2010/09/13/world/europe/13prato.html?_r=1&pagewanted=all
49
See “Poland cuts Chinese firm from road key to Euro 2012,” June 13, 2011, available at:
http://www.reuters.com/article/2011/06/13/poland-euro2012-china-idUSLDE75C1D520110613.
50
See “‘Bullying’ claim prompts probe of Chinese IT firm”, The Local, June 9, 2011, available at:
http://www.thelocal.se/34262/20110609/
47
48
IMPACTS 58
4.2 POLITICAL IMPACTS
Rising Chinese OFDI in Europe brings political impacts as well. Political science
liberals argue that conflict is less likely between countries with high mutual FDI. 51
Cross-border ownership of assets can stabilize relationships, as engagement deepens
beyond mere facilitation of goods and services trade. Firms can stop trading with one
another in short order, and portfolio investments can be withdrawn, but direct
factory and warehouse investments cannot be removed overnight. Firms with direct
investments are pressed into closer alignment, and FDI promotes understanding on
the individual level through multiethnic workforces and collaboration between
different cultures. Countries with a significant FDI stock abroad also tend to have a
greater interest in political stability in recipient countries. The European Union itself
is a prime example of such a peace dividend from greater FDI flows and economic
integration.
Taking this liberal view, increasing Chinese investment offers plenty of political
opportunities for Europe. Seeing Europe as a destination for direct investment rather
than a market for exports will require Beijing to take a more holistic and nuanced
perspective on bilateral relations with the EU and its members. It can also have
positive feedback loops for the Chinese political system. For instance, having assets
worth hundreds of billions of dollars in foreign jurisdictions for the first time should
affect firms’ appreciation of the merits of law-based limits on political power. Greater
levels of Chinese investment also have the potential to further align foreign policy
interest and make Beijing a more responsible stakeholder in the global arena. It
becomes clear that overseas investment interests increasingly undermine Beijing’s
long-held foreign policy dogma of not interfering in other states’ internal affairs and
keeping a low profile on the international level. Greater presence of Chinese firms
abroad will also make Beijing more vulnerable to economic sanctions and other
political pressures – just imagine Beijing’s dilemma in the current Iran crisis if its
banks had significant operations in Europe and the United States. This new situation
will give Europe and the US more opportunities to work with China on a bilateral and
multilateral level.
From a realpolitik school perspective on the other hand, the story is virtually the
opposite. The influx of investment from far-flung overseas commercial interests is a
strategic move to project political and military power from home shores. In addition,
FDI inflows, or the threat of withholding them, might be used by the source country
in an attempt to influence the target country’s domestic politics or foreign policy.
OECD economies have used influence over FDI to pursue foreign policy objectives,
with fairly limited success. 52 China too has a record of trying to use financial
firepower for foreign policy goals. In 2007, China reportedly bought $300 million of
Costa Rica’s sovereign debt to persuade the country to shift diplomatic recognition
See Mansfield and Pollins (2003) for an overview of liberal and realist arguments on economic
interdependence and conflict.
52
See, for instance, Hufbauer et al (2007).
51
59 CHINA INVESTS IN EUROPE
from Taiwan to the PRC. 53 China has employed economic leverage to compel
European political behavior on Taiwan, relations with the Dalai Lama and Uyghur
political activists; economic policy preferences such as market economy status; and
security policy issues such as the post-Tiananmen Square arms embargo. In exchange
for Beijing’s contribution to an international fund to stave off financial distress,
Chinese pundits suggested that Europe should lift its arms embargo, and in 2011
Premier Wen Jiabao explicitly offered China’s financial support in return for
recognition of China’s market economy status. 54
It is natural that Chinese officials would directly or indirectly threaten to withhold
direct investment if they believed doing so could affect European politics. Based on
our analysis, however, Chinese firms are less subject to Beijing’s puppetry than many
observers believe. As noted above, direct investment (unlike portfolio investment)
cannot be easily liquidated or withdrawn to communicate short-term political
signals. The selection of investment targets requires arduous work by Chinese firms,
and is undertaken for commercial reasons, not at the behest of back-room political
strategists. These firms aren’t investing in Europe out of charity or with a foreign
policy goal in mind; they are trying to defend market share in the rich world, acquire
technologies and brands to stave off fierce competitors back home, or achieve some
other commercial imperative. State-owned enterprises only obey the state up to a
point – the point at which they are asked to do something that is not costless. And, at
this point, the magnitude of Chinese direct investment, while rising quickly, is still
way too small to give Beijing any leverage over European politics. However, the
promise of new Chinese investment is already captivating the imagination of
European politicians, and some are already whispering about moderating their
behavior toward China to better their prospects.
Both the liberal and realpolitik schools are useful in understanding China’s rise
today, as they were at the time of America’s rise, German unification, and Japanese
militarism. Which impulse prevails – the emphasis on preserving assets, or on
minimizing vulnerabilities – is not preordained. This overarching insight can be
applied specifically to Chinese FDI in Europe as well: it can be good, or bad,
depending on what we choose to make of it.
4.3 NATIONAL SECURITY
Foreign ownership of assets presents a narrow set of concrete national security
threats, which must be considered separately from domestic and foreign policy
concerns. There are four major concerns: control over strategic assets (e.g., ports,
pipelines); control over the production of critical defense inputs (such as military
semiconductors); the transfer of sensitive technology or know-how to a foreign
53
See “Cash Helped China Win Costa Rica’s Recognition”, the New York Times, September 12, 2008, available at:
http://www.nytimes.com/2008/09/13/world/asia/13costa.html
54
See Bradsher, Keith (2011): “China Ties Aiding Europe to Its Own Trade Goals”, the New York Times, September
14, 2011, available at: http://www.nytimes.com/2011/09/15/business/global/china-ties-aiding-europe-to-itsown-trade-goals.html?adxnnl=1&pagewanted=all&adxnnlx=1338493596-DNdqHWSmF+CszNJBZ48DXw
IMPACTS 60
power with hostile intent; and espionage, sabotage, or other disruptive action. 55
International investment agreements and bilateral investment treaties respect
exceptions to the free movement of capital for security grounds. 56 In EU treaties,
national security and defense is explicitly named as one of the few legitimate and
legal exceptions to the free movement of capital from both other EU states and third
countries. These concerns are real and legitimate, and merit European attention.
While national security fears related to foreign investment are not new, China
presents particular concerns, for at least five reasons. 57 First, China will likely be the
world’s largest economy within two decades, lending it huge leverage and power to
shape global national security. Second, China is a one-party authoritarian state with
values and commercial norms at variance and sometimes at odds with those of OECD
countries. The related state ownership and influence creates special concerns about
government-driven, non-commercial motives for investing. Third, unlike other FDI
majors such as Japan or the United States, China is not an ally of Europe, but an
emerging power with a rapidly modernizing military. China and Europe have good
relations but there is uncertainty about Beijing’s direction in the future. China has a
stated aspiration to displace the existing global power balance in favor of a greater
strategic role for itself as well as greater voting share in international organizations,
most likely at the expense of European votes. Fourth, China has a troubled record on
export control rules, and a reputation as a major proliferator of sensitive
technologies to rogue regimes such as Iran, North Korea, and Pakistan. 58 This raises
the potential for discord over the obligations of China’s firms in Europe. Finally,
China is considered a heightened threat for economic and political espionage by the
intelligence communities in Europe and North America, and not without reason. The
unclassified and classified records of Chinese espionage in the West are extensive. 59
There is no indication that Chinese investment is damaging European national
security today, but the purpose of security screening is to minimize the probability of
problems before they happen. The need for a regime is clear, but since security and
defense policy remain national domains, the current European situation is a
fragmented patchwork rather than streamlined and coherent. The European Treaties
allow, but do not require, national governments to maintain differential frameworks
for screening FDI for security; some countries do and others do not. Even the
definition of national security is treated differently by individual member states, not
to mention institutional setups, processes and timelines. 60 There is little panEuropean, let alone trans-Atlantic, coordination. It is questionable if this approach is
the right one to address the potential security impacts described above, thus we
discuss policy options in the following chapter.
See Graham and Marchick (2006) for an extensive discussion of national security risks from FDI and Moran
(2009) for an analytical framework for assessing national security risks from foreign investment.
56
See, for example, Yannaca-Small (2007).
57
This paragraph draws heavily from Graham and Marchick (2006), chapter 4.
58
See Kan (2011).
59
See Metzl (2011), and Graham and Marchick (2006).
60
See OECD (2008).
55
61 CHINA INVESTS IN EUROPE
4.4 NET ASSESSMENT: IS CHINA DIFFERENT?
Europe cannot simultaneously react to Chinese direct investment positively in
economic terms and negatively in political or national security terms. To some
extent, that is what the United States is unwisely doing, leaving Chinese investors
confused and uncomfortable with the true intentions of their potential host. Our net
assessment strikes some as surprising, but is quite straightforward. We do not think
embracing Chinese firms as direct investors requires choosing profit over security:
we think that an open stance is favorable on economic, political and security grounds
as well.
China is unquestionably different from traditional direct investors in Europe. But the
economic benefits are the same, or, in an era of European adjustment and BRICS-led
global growth, greater, while the risks are almost entirely manageable through
domestic rules and institutions which Europe controls. The challenges of Chinesestyle firms, industrial policy and state capitalism do indeed have the potential to
distort markets in unhealthy ways if China does not continue to marketize and reform.
But it is even more disconcerting if Europe is affected by it through trade and
competition in third markets, without the benefit of regulatory reach and investment
from Chinese firms.
Few things are as likely to help bring about a pan-European perspective as the impact
of Chinese OFDI, and that may be true across the Atlantic as well. The net effect of
“letting” Chinese investment into Europe cannot be measured just from the status
quo either: if Europe decides to eschew these inflows, then instead of standing as a
model of reform for China, the continent’s firms will likely be adversely affected by
mercantilist reciprocation from China as well.
On politics and security, the argument is similar. If there are marginal risks
associated with the presence of Chinese firms in Europe, in terms of political will to
maintain a European position, or national security resolve to deny a dual-use
technology, they are partly offset by the political and security leverage that Europe
enjoys by hosting potentially hundreds of billions of dollars in Chinese assets, within
reach of European courts and politicians, and under the careful watch of security
community assessors.
With few exceptions, Europe has opened its borders to foreign capital because the
potential benefits exceed the risks, and risks can be addressed through specific
policies. Whether that assessment applies in the era of China’s OFDI takeoff depends
on if those specific policies can be rationalized and standardized across Europe.
IMPACTS 62
5. Policies and Politics: Priorities in the Era
of Chinese Investment
We have assessed China’s global direct investment boom, and the details of how that
buying spree is showing up across the EU. We have examined the drivers and motives
behind the investment surge. And we have projected new flows to 2020, and outlined
the stakes and risks for Europe. Our final task is to consider the policy landscape.
In our impact assessment we concluded that the net effect of growing Chinese OFDI
for Europe was positive, provided that a small set of policy concerns can be managed
effectively, namely that:
•
Europe’s commitment to deepening internal and cross-border capital flows
can be maintained, and investment protectionism can be restrained;
•
Damage to European interests stemming from any non-market distortions of
China’s state-capitalism – such as distortion of asset prices, unfair
competition through abuse of market power, or damage to consumer welfare
-- can be remedied at the European level;
•
Effective, clearly-defined national security screening can be established,
preventing either member state resignation or protectionism veiled under
the guise of security, assuring Chinese trust in EU motives, and promoting
compatibility between European and other OECD regimes;
•
Healthy and effective investment promotion is maintained, while unhealthy
member state competition based on under-enforcement of labor,
environmental or other social standards is prevented.
While this list of criteria is modest, implementation will prove challenging. And
finally, in addition to these specific policy recommendations, at many points in this
study we have pointed to an overarching policy priority: European crisis
management and recovery. Whether Chinese investors land at Elefthérios Venizélos,
Charles de Gaulle and Warsaw Chopin looking to invest in long-term growth or make
short-term vulture acquisitions depends on whether Europe gets its act together,
reforms its Union, repairs balance sheets, endures austerity, writes-down
entitlements and restores competitiveness. Which Chinese investors turn up will be a
result of how well Europe does this housekeeping, not the cause or solution.
5.1 KEEPING THE DOOR OPEN
The slogan of China’s post-1978 reforms was gaige kaifang! – reform and opening up.
Financial integration and opening to foreign capital were hallmarks of the European
project as well, and periodic outbursts of economic nationalism have been
consistently batted back. The rise of Chinese investment is simply the latest in a long
63 CHINA INVESTS IN EUROPE
line of ostensible reasons to deviate from principles of openness – but as discussed
above, China is different than previous sources of protectionist pressure in
significant ways, and recent reactions to Chinese bidders is casting a long shadow.
Protectionist rhetoric is dangerous and could damage the hard-won reputation for
openness the European investment climate enjoys, particularly during a time of
economic crisis. The United States still labors under the burdensome legacy of the
Unocal transaction seven years after CNOOC was rebuffed after outbidding Chevron,
despite an otherwise stellar record of liberality. Europe should be mindful of how
easy it would be to fall into the same hole.
Integration has made Europe’s members cross-border investment fans. The 1957
Treaty of Rome called for members to “progressively abolish between themselves all
restrictions on the movement of capital belonging to persons resident in Member
States”. 61 Intra-European capital flows were gradually liberalized in the years to
follow, as EEC directives unconditionally liberalized direct investment (1960), longterm lending (1985) and other channels. Some members didn’t wait for EEC action
and instead abolished restrictions unilaterally (Germany in 1961, United Kingdom in
1979). Full liberalization was achieved with EEC directive 88/361 requiring member
states to eliminate all national barriers to capital movement by July 1990.
Figure 23: Formal FDI Restrictiveness, OECD Economies, 2012
OECD FDI Restrictiveness Index, 1=Closed; 0=Open
0.30
0.25
0.20
0.15
0.10
0.05
Japan
Canada
Korea
Australia
Poland
Austria
United States
OECD Average
Denmark
Latvia
United Kingdom
Ireland
Sweden
Czech Republic
Italy
Hungary
Slovak Republic
France
Lithuania
Belgium
Greece
Germany
Estonia
Spain
Finland
Netherlands
Romania
Slovenia
Portugal
Luxembourg
0.00
Source: OECD.
The Maastricht Treaty of 1993 expanded Europe’s achievements on internal freedom
of capital movements to third countries. Article 63 of the Treaty on the Functioning
of the European Union (TFEU) stipulates that “…all restrictions on the movement of
capital between Member States and between Member States and third countries shall be
61
See “Restrictions on property ownership” in European Commission (2011).
POLICIES AND POLITICS 64
prohibited." The legal framework allows only a few, narrowly defined limits on such
flows, namely grandfathered provisions, tax differentiation, restrictions of property
ownership under national law, public security and balance of payments remedies.
This process has left EU member states with the most liberal economies when it
comes to formal restrictions on foreign investment (Figure 23).
Moreover, institutions generally backed these ideas. Member states were not beyond
attempting to discriminate against foreign investors, but under its mandate to
protect the single market the Commission monitored restrictions to capital
movements diligently. 62 Cases involving economic nationalism against foreign
takeovers of local companies (Table 7 lists notable instances) were typically met with
an ultimatum for compliance and a filing with the European Court of Justice (ECJ).
Though nascent, and still trivial in stock and flow, Chinese investment in Europe is
testing this tradition. Rhetoric in reaction to Chinese bids has grown tense, with
some of the strongest calls for restriction coming from within the EU bureaucracy. In
a prime example, Chinese cable maker Xinmao’s 2010 takeover bid for Dutch fibercable producer Draka prompted Industry Commissioner Antonio Tajani to call for an
EU-wide foreign investment review to protect European know-how and technology
from Chinese investors. 63 Together with his colleague Michel Barnier, he later
followed up with a letter to EU Commission President Barroso emphasizing the need
for a pan-European investment review regime. His justification typified European
concerns about China and impulses to use investment controls to restrain
competition: “[W]e have to make sure it’s not a front for something else, in terms of
taking our know-how abroad…” 64 The European Parliament echoed such concerns in
calling for a European body “entrusted with the ex ante evaluation of foreign strategic
investment”. 65
These reactions show that concerns about the nature of Chinese investment causes
European policymakers to consider an expansion of the current scope of investment
reviews (on the national or potentially a European level) to include threats to
“economic security”. While Europe’s posture thus far has been liberal and limits to
foreign investments could only be justified on national security grounds, the rise of
China puts this consensus to a new test.
See European Commission (2011).
See Interview with Industry Commissioner Tajani, Handelsblatt, December 27, 2010, available at:
http://www.handelsblatt.com/politik/international/eu-kommissar-tajani-der-schutz-unseres-wissens-istunverzichtbar-seite-all/3748796-all.html
64
See Miller, John W. (2011): “Bid Dropped as EU Raises China’s Wall”, the Wall Street Journal, January 7, 2011,
available at: http://online.wsj.com/article/SB10001424052748704415104576065313773996124.html
65
See European Parliament (2012).
62
63
65 CHINA INVESTS IN EUROPE
Table 7: Selected Cases of Economic Nationalism toward Foreign Acquisitions in Europe
Year
Investor / Target
Summary
1999
Banco Santander
Central Hispano
(BSCH) (Spain) /
Champalimaud
Group (Portugal)
When BSCH attempted to acquire a stake in Champalimaud Group, Portugal blocked the deal under the
pretense of protecting national interests. The European Commission found that this action violated EU
rules on freedom of establishment and the free movement of capital. The transaction was completed in
2000.
2000
Holderbank; Secil
(Belgium;
Switzerland) /
Cimpor (Portugal)
Portugal blocked the 2000 acquisition of Cimpor in the name of protecting the public interest. The
European Commission found that the Portuguese government had no basis for such an action, and
litigation continued through 2003.
2005
PepsiCo (United
States) / Danone
(France)
PepsiCo's interest in Danone incited considerable backlash from French politicians. France later
published a list of “strategic” and “sensitive” industries subject to screening which the European
Commission deemed discriminatory.
2006
Abertis (Spain) /
Autostrade (Italy)
The merger of Autostrade and Abertis was abandoned after Italy blocked the deal. The European
Commission found that Italy violated EU regulations by not sufficiently demonstrating how this
defended the public interest.
2006
Mittal
(Netherlands) /
Arcelor (France,
Luxembourg,
Spain)
Mittal's bid to acquire Arcelor met with considerable resistance from Arcelor's directors and the
governments of Spain, France, and Luxembourg. Arcelor finally assented to the merger after a series of
failed attempts to be acquired by other steel companies to fend off the takeover.
2006
Gazprom (Russia)
/ Centrica (UK)
2007
E-On; Gas
Natural;
(Germany; Spain)
/ Endesa (Spain)
2007
Sacyr (Spain) /
Eiffage (France)
Sacyr's 2007 hostile takeover bid of French Eiffage met with bitter French resistance. Although the
European Commission approved the deal, Sacyr instead opted to sell its stake in Eiffage in 2008
following a lengthy legal battle.
2007
OMV (Austria) /
MOL (Hungary)
OMV’s interest in acquiring MOL led to the creation of "Lex MOL", a Hungarian law meant to protect
strategic firms from hostile takeovers. It was amended in 2008 to comply with E.U. rules, but the deal
fizzled due to competition concerns.
Gazprom’s interest in acquiring a stake in Centrica in 2006 incited outspoken criticism from UK officials
seeking to protect UK energy security. Although Prime Minister Tony Blair indicated his displeasure with
this "economic patriotism," an acquisition bid never materialized.
Following a hostile takeover bid by Gas Natural, Spain blocked E-On’s acquisition of Endesa by imposing
burdensome regulatory conditions. Endesa was ultimately sold to Acciona and Enel instead. The
European Commission found that Spain’s actions violated multiple EU Treaty rules.
Source: Authors’ compilation. Selected M&A cases only. A full list of cases in which the EU Commission took action against member
states for violation of the freedom of capital movements can be found at:
http://ec.europa.eu/internal_market/capital/news/index_en.htm
Two characteristics are disconcerting: first, although interpreted conservatively thus
far, EU provisions admit exceptional treatment for third party FDI for a range of nonnational security reasons related to broader public policy, such as guarding against
serious difficulties for the operation of the economic and monetary union (Art. 66
TFEU). There exists far greater potential for interference in inward foreign
investment on economic or competitiveness grounds in Europe than in the US,
where the scope for screening is severely delimited to national security, narrowly
POLICIES AND POLITICS 66
defined. Second, there is no common definition of national security threats across
Europe, and the interpretation is left to member states. Our concern is that the liberal
tendency in EU policy is not fully enshrined in EU law, and that in the face of a rash of
hostile takeover bids from a non-democratic, emerging China, member states could
easily assert the right to employ public policy or public security grounds to oppose
bids. Only then would we see whether Europe or the US has a regime more hardwired for openness. Already in 2011-2012, Europe has shown a startling willingness to
switch demeanor on trade, with challenges to Huawei and ZTE afoot in telecoms; an
investment volte face cannot be dismissed lightly.
In the long term, Europeans will be most embracing of foreign investment if they
know a thorough, Union-wide process to address concerns is in place, guided by the
principles of openness and non-discrimination. Calls for a European investment
review for threats to “economic security” go far beyond that scope, and would open
the door for protectionism given the lack of clear metrics and frameworks for
assessing such risks. Concerns about economic efficiency and welfare are, as
discussed next, better addressed by other regimes and legal instruments. A necessary
complement to such efforts is a new pan-European approach to national security
reviews, which is discussed thereafter.
5.2 ADDRESSING REAL ECONOMIC CONCERNS
Our advice to unburden the investment screening process from “economic security”
demands is only useful if any real and deleterious impacts from a surge in Chinese
investment can be addressed through other means. In rough terms we see three
categories of economic impacts from Chinese FDI that need to be addressed. First,
pressure from market competition will arise from more entrants in the European
marketplace, from which some will win (consumers, the newly employed), and some
will lose (less competitive firms and their employees). Welfare and redistributive
policies -- not investment policy -- can help with the adjustment to the extent needed
and desired. Second, problems may arise from poor operating behavior on the
ground, such as tax avoidance, labor rights abuse or environmental non-compliance.
These concerns can be handled as they would be for any other foreign investor, or for
any European firm, will the full force of European or local law. Third and more
challenging is damage to European interests stemming from China’s state capitalism,
such as distortion of asset prices, unfair competition through abuse of market power,
or damage to consumer welfare. This is where the focus of attention should be.
Europe’s consensus in favor of open investment presumes a level playing field and
fair competition. Direct investment from US multinationals was seen as ferociously
competitive but demonstrably fair in terms of capital costs, the role of subsidies, and
other factors. Japan’s global competitiveness benefited from an unlevel playing field
in many respects, but its scale never grew large enough to seriously threaten global
efficiencies and its political leadership was amenable to self-restraint. China’s current
uneven system presents a unique problem, especially considering that it will soon be
large enough to distort markets globally, and that adequate political change is not
assured.
67 CHINA INVESTS IN EUROPE
Firms can distort asset prices if they have access to low-cost or free capital with which
to make acquisitions, thereby outbidding and outgrowing rivals. A resulting
concentration of market power can then lead to monopoly rents, coercive foreign
policy behavior, predatory pricing to further depress competition, or severe supply
disruptions if, after amassing such a position, advantageous supports are withdrawn.
All of these concerns are in the minds of EU and other OECD policymakers grappling
with the implications of Chinese FDI. The Commission has already considered
treating all Chinese SOEs under the aegis of the SASAC as related entities for
calculations of market concentration, since they ostensibly serve a single controlling
interest -- the Communist Party of China. The OECD, taking up an Australian
framework for analysis, is developing a corporate government system focused on
whether governments practice “competitive neutrality” between the regulation and
treatment of state and non-state owners (or related) firms. 66
The aspects of Chinese support for its SOEs are widely examined, though still much
debated. In many areas there is no global consensus: for example, on the distortions
caused by SOEs and capital subsidies. 67 A financial environment that ensures
affordable capital and – moreover – little risk of default or bankruptcy is, in our
opinion, the most critical. However it will be a long time before these debates are
settled, and by then European interests may be impaired. The best course lies in an
expansive utilization of competition policy at the European level, and coordination
of analytical approaches measuring the welfare implications of investment across
OECD economies and, indeed, with Beijing as well.
Even after a fulsome application of competition policy regimes to prevent harmful
impacts in Europe from the non-market conditions enjoyed by Chinese firms –
optimally in concert with like-minded market economies such as the United States –
concerns will remain. Even if China eschews any nationalistic industrial policy
objectives, it will be a decade or more before financial conditions at home are leveled,
leaving some Chinese firms with very different incentives from European firms.
Despite this reality, there are two reasons to stay calm. First, in our extensive analysis
of nearly 1,000 Chinese outbound deals to the United States and Europe, we see
vanishingly few which seem senseless from the perspective of commercial logic.
Chinese firms, including centrally-controlled SOEs, may take advantage of state
support with enthusiasm, but they do not appear to lumber abroad no matter how
strategically encouraged if they cannot make money from it. So, in theory, Chinese
firms could pervert the sanctity of our Western markets, but there is little—if any—
evidence of that happening now. Second, while China will very likely soon be large
enough to distort asset prices in target markets, the volumes of investment today and
for at least 3-5 years are not nearly large enough to play a distorting role in general.
Our analysis of deal flow in Europe, as with our previous US research, makes that
clear. Rather than contemplate special screening procedures for Chinese capital,
Europe is right to look for specific subsectors where China is liable to become a price
setter in the near-term (such as occurred in rare earths on the export side), and to
66
67
See Capobianco and Christiansen (2011).
On the tricky task of agreeing on what capital subsidies are, see Hufbauer, Moll, and Rubini (2008).
POLICIES AND POLITICS 68
take time to join hands with others – including in China – to better examine the
implications of non-market priced OFDI of major volumes in a five year timeframe.
Finally, Europe should try to work towards better market access in China (for
example, through a bilateral investment treaty with pre-establishment rights), but it
must not be obsessed with reciprocity, a buzz word that arises frequently in
conversations about the challenges of global Chinese investment. We do not think
that formal mutuality in market access need be a Western demand, for several
reasons. First, imposing formal investment reciprocity would not only be illegal
under EU treaties, but also technically extremely difficult to implement. Second,
China is already more open than almost any developing nation ever was – indeed,
more than many advanced Asian economies. Third, Europe benefits from expanded
capital formation regardless of what China does, as discussed in the previous chapter.
Fourth, the advent of Chinese operations in advanced economies will both show
their stakeholders the virtues of transparent, market-driven norms, and show the
world that Chinese firms are not magical, and face the same challenges as other
enterprises. Finally, we believe that if advanced nodes of China such as Shanghai fail
to achieve a more advanced level of inward FDI openness, China will fall into a
middle-income trap. Openness to FDI is something China must maintain for its own
welfare, not offer as a concession. In a recent report on China’s future policy
priorities prepared jointly by the World Bank and the Development Research Center
of China’s State Council, Beijing’s economists underscored the need for reciprocal
approaches to maximizing China’s global interests: “Achieving stronger protection
for Chinese investors would require granting reciprocal concessions to foreign
investors in China, implying a dismantling of most restrictions on FDI inflows and
continued improvements in the autonomy of state enterprises. These policies are in
the long-term interest of China’s development.” 68
5.3 RE-THINKING THE EUROPEAN APPROACH TO NATIONAL SECURITY
SCREENING
While Europe has a centralized competition policy regime, it is lacking the second
important element of a comprehensive safety check: a coherent EU approach to
national security screening. The current approach is to delegate positive screening to
national governments, which risks a race to the bottom in the sense of underscreening to avoid offense, fails to address pan-European national security risks and –
conversely – could permit room for protectionist abuse in the name of security. A
common European legislative framework, most likely involving a greater degree of
international coordination as well, would help to address these problems.
Under European Community law, screening foreign investments for national
security is not required, though it is permitted in order for members to address public
security and “take any necessary measures for the protection of the essential interests
of their security.” 69 The existing exceptions to free movement of capital, which apply
68
69
See World Bank (2012).
See European Commission (2011).
69 CHINA INVESTS IN EUROPE
to investors from both member states and external parties (but to different degrees),
are not to be used for protectionism. However, the Treaty does not define national
security clearly, leaving the door open to broad interpretations. Investment security
regimes at the member level vary widely across Europe (Table 8). France specifies 11
sectors for review and reserves the right to exclude whole particular industries that
include both defense-related and entirely non-strategic elements from foreign
investment, for example aerospace; the Netherlands has no review at all, other than
for the banking sector. Each member can and does define its own understanding of
“essential security interests”.
There are three cases to be made that Europe’s existing approach is not adequate to
manage the growing impact of Chinese investment. First, member states could wind
up in a “race to the bottom” to attract Chinese money, abandoning any attempt to
screen for security in the rush to accommodate Chinese sensibilities. Many European
countries are in dire need of foreign investment and governments cannot afford to
turn away foreign investors lightly. If left to the discretion of national governments,
standards and diligence could be softened to gain an advantage in the competition for
Chinese capital. 70 We do not in fact see evidence in our data that Chinese investors
are favoring countries with weaker security reviews or playing European
governments against each other, but Chinese officials do very frequently insinuate
that the US will lose out to Europe because the latter is laxer. It is entirely possible
that such tactics are recapitulated within the EU.
70
See Godement and Parello-Plesner (2011).
POLICIES AND POLITICS 70
Table 8: Security-Related Investment Control Measures, Selected EU States, 2011
Austria
Non-EEA investors acquiring at least a 25% stake in firms in certain sectors must obtain
Ministry of Economy approval. These sectors include defense, power, telecommunications,
transportation, and other industries.
Cyprus
A mandatory security review process was abandoned, but restrictions still apply in mass
media, property and construction sectors.
Denmark
The Ministry of Justice must approve foreign investments that result in ownership of more
than 40% of firms producing defense materials or voting rights exceeding 20%.
Finland
Finland restricts foreign acquisition of influence in companies that produce defense materials
or provide goods and services vital to national defense.
France
The Minister of Economy and Finance reviews acquisitions in certain sectors when investors
will surpass certain ownership thresholds. These sectors include aerospace construction,
nuclear energy, communications interception and detection, cryptology, arms, munitions and
war materials, gambling and casinos, and other industries.
Germany
The Federal Ministry of Economic Affairs and Technology may review and block acquisitions
by non-EU/non-EFTA investors that result in 25% or greater ownership. This review process is
not confined to certain sectors.
Lithuania
Lithuania prohibits foreign investment in state security and defense sectors. The State
Defense Council may make exceptions for investors from EU and NATO countries.
Poland
Foreign enterprises require government approval to acquire real estate in border areas and to
invest in an enterprise managing an airport. Enterprises with foreign participation may not
establish airports.
Portugal
Slovenia
Spain
Foreign firms may not engage in maritime cabotage between Portugal and the Azores and
between the Azores.
Foreign firms may not produce or trade in armaments.
Foreign investors seeking to participate in Spanish companies related to defense must first
seek government authorization.
Sweden
A government permit is required for foreign-controlled enterprises to produce war munitions.
United
Kingdom
The Secretary of State may intervene in merger deals that could adversely affect national
security or certain public interest considerations. There exist additional regulations on
investment in Aerospace, Energy, and Maritime sectors.
Source: Authors’ compilation based on the OECD’s work on investment openness (www.oecd.org/daf/investment/instruments) and
national government sources.
Second, security is hardly a purely “national” issue, given Europe’s single market and
increasing attempts to streamline and coordinate a common foreign policy. Perhaps
the most consequential debates over direct investment today concern critical
national infrastructure – a term variously defined but which usually includes the
energy grid, communication networks, financial systems, transportation networks,
water and gas utilities, healthcare infrastructure, and other systems. Our world is
increasingly interconnected: energy and other critical resources flow across borders,
as do cyber-network disruptions. Fragmented approval processes for Chinese
vendors seeking participation in national critical infrastructure risk balkanizing
OECD markets. Chinese telecommunications network vendors have been brushed
back from the US and Australia, permitted in Scandinavia and accepted with
71 CHINA INVESTS IN EUROPE
conditions in Britain. Such a fragmented approach within Europe and the whole
OECD will likely fail to deliver meaningful comfort in terms of national security.
Importantly, our preference is absolutely not to impose blunt blanket exclusions on
Chinese firms from any particular industry – including telecommunications.
Upgrading national security screening should prevent such ham-fistedness, not
facilitate it.
Third, what has appeared thus far to be a liberal regime in fact has the potential to be
protectionist. European regimes are graded highly for the transparency and
predictability of their national security screening practices, whereas many today
think the Committee on Foreign Investment in the United States (CFIUS) process is
arbitrary and restrictive. Actually, the criteria for national security screening in the
US are clearer and more narrowly defined than in Europe, and if European attitudes
toward Chinese acquisitions sour, there is probably more potential for abuse in a
regime run by 27 sub-systems than there would be from a unified one like the US. For
all but the largest EU members, the cost and infrastructure needed for effective
screening is individually prohibitive. As our dataset demonstrates, the inflection in
Chinese investment in Europe is really no more than 3 years old, and has coincided
with a period of European distress. Incumbent firms are increasingly expressing
strong discontent over Chinese business practices and the lack of sufficient
“competitive neutrality” on the part of China’s government. Like all allergic
reactions, this one might take time to incubate, but once it does it could be more
restrictive than currently realized given the relative ambiguity of the national
security definition and the fragmented nature of review in Europe.
A uniform screening framework could address these risks and put Europe in a better
position on investment policy debates internationally. Such a pan-European
mechanism would best be limited to narrow national security screening, and not
include “economic security” notions. Political hurdles are inevitable in such an
approach, including member state reluctance to transfer individual responsibility for
these issues, as set out by the Treaty. And, crucially, the European Union
bureaucracy does not presently have the in-house capacity to conduct independent
national security assessments. Such reviews rely on reliable input from intelligence
and military sources, which are still national domains.
A second best solution would therefore be to establish a common European
legislative framework for security screening, providing a blueprint for national
reviews. In a 2008 Bruegel policy brief, Lars-Hendrik Röller and Nicolas Véron came
up with such a proposal in the midst of the debate on sovereign investment in
Europe. 71 They argue that a single market directive could establish a common
framework with clear definitions of key terms, rules for the review process and the
negotiation of mitigation agreements. Provided each EU member has access to
adequate mechanisms to assure intelligence and analysis capabilities, this approach
could help prevent “regime shopping” for EU hosts least able to screen. Still, other
problems, such as sharing of assessment across the Union and the potential race to
71
See Röller and Veron (2008).
POLICIES AND POLITICS 72
the bottom, would remain. But given the political and technical difficulties of a fullfledged European review mechanism at the start, we think this is a sensible first step.
The evolution of European security should be done in consultation and perhaps
coordination with others, internationally. There is a huge discrepancy of national
security concepts and the implementation of reviews between the US, Europe and
other developed economies. The OECD is working on best practices for investment
review, but beyond that there is surprisingly little coordination among OECD
governments on this front. As emerging economies move from outright investment
controls toward more sophisticated regimes of their own -- including national
security and competition reviews -- the problem of regime balkanization is becoming
global. China enacted its own national security review regime in 2011, and its
specifications are unclear and largely untested. Without a proactive effort to
converge international norms on these issues, serious discord over what ought to be
a good news story seems almost certain.
5.4 ATTRACTING CHINESE INVESTMENT
In addition to preventing potentially negative impacts from Chinese investment,
European policymakers must also be concerned with attracting Chinese investment.
In the past, the European Commission’s job was to keep the door open, but
investment promotion and protection was left to national governments. The Lisbon
Treaty changed that situation by making FDI policy part of the EU’s common
commercial policy, transferring the rights of concluding international investment
agreements (IIAs) to the European Commission. While a bilateral investment treaty
between the EU and China replacing the 26 individual BITs is a desirable outcome,
such a treaty will have very little impact on investment flows from China. More
important are tailored investment promotion approaches that help Chinese investors
overcome their key impediments and structural reforms that restore faith in the
long-term competitiveness of Europe.
Despite economic integration and liberalization of capital controls, investment
promotion and protection were (until recently) the responsibility of national
governments, resulting in a patchwork of IIAs among member states and third
countries. By 2010, EU countries had concluded more than 1,100 bilateral investment
treaties (BITs) with third countries. In addition to such legal instruments,
governments try to attract foreign investment using investment promotion agencies
(IPAs) or special tax incentives for foreign investors on the national, state, regional
and even municipal level. The intensity and approaches to investment promotion
vary strongly across Europe.
The evolution of European investment policy has gained new momentum with the
Treaty of Lisbon, which entered into force in December 2009. The Lisbon Treaty
transferred the exclusive competence for investment policy to the European
Commission, making FDI the “new frontier for the common commercial policy”. 72
72
European Commission (2010).
73 CHINA INVESTS IN EUROPE
Since then, the EU Commission has made clear that a unified EU investment policy
has two main goals: first, to replace the current patchwork of national BITs in order
to streamline the quality and content of these treaties; second, to increase the
leverage of Europe to reach better conditions for its companies when it comes to
market access abroad. 73 A bilateral investment treaty with China replacing the 26
existing individual BITs is among the top priorities of the EU Commission, and an
impact assessment is under way. 74 While a China-EU BIT would help address market
access problems and harmonize other significant legal aspects such as international
arbitration, it would not achieve much when it comes to promoting Chinese
investment. Given the EU’s openness and strong legal system, such agreements play
a very minor role in Chinese firms’ investment decisions. 75 Our database of Chinese
investments in Europe does not show any signs that the existence or strength of BITs
is a factor shaping location decisions of Chinese firms in Europe. 76
More important in our view is that member states and local governments adjust the
investment promotion efforts to the needs of Chinese companies. The most
important impediment to greater Chinese investment in Europe is not regulatory or
legal barriers in Europe, but the inexperience of Chinese firms operating in a
sophisticated market economy. Until recently, trade was the only form of Chinese
global engagement, so the Chinese have little experience operating overseas. There is
a large regulatory gap between the home market in China and mature OECD
economies. Running operations in Europe requires Chinese managers to bridge
cultural divides, acquire the necessary market knowledge, comply with sophisticated
regulatory standards, manage local staff, negotiate with organized labor and other
stakeholders not present in China, meet higher quality and safety standards, adhere
to different tax and accounting rules, and develop suitable communications and
public relations strategies. Chinese firms will have to learn to cope with these new
challenges, but special approaches to investment promotion on the local and
national level pay off. It is noticeable that the top recipients of Chinese investment in
Europe all have strong investment promotion regimes with a local presence in China.
Regions and cities with particular programs, such as the city of Hamburg, have been
successful attracting capital from China.
Yet the best and most promising way to attract sustainable long-term investment
from China is to bring Europe’s economic competitiveness back on track. Foreign
investors have come to Europe for decades because of its competitive economy and
commercial prospects. The inflection of Chinese investment comes at a time of deep
structural crisis in Europe. The crisis and related privatization offers opportunities
for Chinese investors to get a foot in the door, as recent investments in Greece and
European Commission (2010).
See European Commission (2011c).
75
Based on numerous interviews with executives of private and state-owned Chinese firms in the period of
2009-2011.
76
The fact that Ireland, the only country that does not have a BIT with China, is a negative outlier in attracting
Chinese investment is not enough to support this argument. We attribute the lack of Chinese investment
interest in Ireland to other factors, most importantly the dismal economic situation that Ireland has been in
since the take-off of Chinese investment in 2009.
73
74
POLICIES AND POLITICS 74
Portugal illustrate. At the same time, our data shows that most countries with weak
economic fundamentals do not fare well in attracting Chinese investment outside of
these large-ticket investments. Countries that have held up well despite the crisis,
such as Germany and Sweden, are succeeding in attracting long-term investments
across a broad spectrum of industries. Only a European Union with a healthy
economy, political stability, and clear vision for the future will be able to attract
foreign investors that contribute to its long-term prosperity.
75 CHINA INVESTS IN EUROPE
6. Conclusions and Policy
Recommendations
Considering how small China's global outward investment stock is today, it is
amazing how many upside dreams and downside fears it elicits. But of course it is not
the current stock, but looming future growth that matters. China’s global outward
investment boom has just reached Europe; several large-scale transactions across the
continent signal that the rush has in fact started.
As with any new development, many questions come along with Chinese FDI -- and
official data does not give us many answers. The more we look at the official
numbers, the more we are aware of how little they respond to what policymakers,
business professionals and interested citizens want to know. Most of us have known
China only as a far-away exporter of goods: what is motivating them to invest in our
backyards? Is this just a reactive fire sale caused by the crisis, or a deliberate
establishment of beachheads from which to take control of markets? Or maybe these
flows represent not strengths but weaknesses, and portend an era of capital flight?
In many European quarters, it is assumed that answering these and myriad other
questions is impossible. The behavior of China’s legions of firms and dealmakers is
simply too inscrutable and ponderous for us to understand; and even if we could,
Europe is too atomized and incapable of providing aggregate accuracy for us to be
definitive about. But we believe that – to some extent -- this study proves such
defeatism wrong. By fitting all publicly available information on Chinese FDI in
Europe together in a matrix, and undertaking a careful analysis of the results in
consultation with many deeply involved Europeans, Chinese and others, clear
conclusions about the patterns, motives, impacts and policy significance of the
advent of Europe-bound Chinese direct investment can be offered.
Our key findings follow. We do not at all consider this set of observations
comprehensive; our database is nascent and we are sure that there is a tremendous
amount of utility not yet wrung from it.
1. The Chinese investment boom has arrived. Flows from China started to take off
in 2009, with investment for greenfield projects and acquisitions rising from an
annual average of below $1 billion prior to the mid-2000s to $3 billion in 2009 and
2010, and a record of $10 billion in 2011. Even leaving aside smaller deals, the number
of investments – 573 – is surprising.
2. China’s new interest is driven by commercial motives. This new investment
boom is overwhelmingly driven by commercial realities, in equal parts by the pressure
cooker of competition inside China and the prospect of attractive deals in Europe.
3. Chinese investment is rising across the OECD. Other advanced economies are
experiencing a similar uptick in Chinese investment interest. The United States saw a
CONCLUSIONS AND POLICY RECOMMENDATIONS 76
similar upward trend in Chinese FDI, from less than $500 million before 2008 to
more than $5 billion in 2010 and 2011. The US and EU are on parallel, not competing,
tracks.
4. There is enormous welfare potential from Chinese investment. We estimate
that through 2020 Chinese firms will put to work $1-2 trillion in FDI, and if it plays its
cards right, the EU-27 could get more than $250 billion, or $20-30 billion annually.
This investment yields the same benefits as FDI from other countries: fresh capital,
jobs, taxes and innovation spillovers. Chinese firms already employ more than
45,000 Europeans and these figures are expected to rise further, given the
complementarity between China’s needs and Europe’s workforce.
5. Chinese FDI is different to some extent. Chinese firms operate in a different
political and economic environment than firms from other countries, and bring
additional political and economic risks that merit attention: a distortion of global
asset prices, unfair competition through abuse of market power, or damage to
consumer welfare.
Given the stakes and the different risk profile, a European policy response is crucial.
Policymakers need to grapple with these questions now to be prepared to deliver
answers once they are needed. Our analysis yields four key policy recommendations:
1. Keep the door open. Europe must not risk losing its hard-earned reputation for
openness by imposing additional barriers to capital inflows based on economic
security considerations. Several cases have already raised that specter. There may be
more loopholes for veiled protection in the European framework than admitted, and
the reaction to China is not yet fully tested. Europeans will embrace foreign
investment if they know a thorough, EU-wide process to address concerns is in place,
guided by the principles of openness and non-discrimination.
2. Address market distortions forthrightly. There are concerns about China’s longterm evolution, and the prospect of China’s economic model spilling out with
Chinese firms’ movement abroad. Our advice is not to burden the investment
screening process with “economic security” demands arising from legitimate worries
about China’s system. Nor do we think that reciprocity demands are practical or
productive. Ideally, China will redress aspects of domestic distortion such as
preferential capital costs for state firms, but given the potential risks if this scenario
does not materialize, policy should be in place to protect EU interests via internal
processes including competition policy review. A rationalized and systematized
game plan for handling the concerns sure to arise over China’s system without
risking investment protectionism is best for Europe; it also lends itself to the prospect
of better coordination internationally to manage the advent of emerging market
OFDI. By standardizing its internal approach, Europe maximizes its role in joint
efforts to discuss competitive neutrality, state capitalism and other concepts.
3. Take national security seriously. Europe’s current fragmented approach to
screening foreign investment for security threats risks a race to the bottom, fails to
77 CHINA INVESTS IN EUROPE
address pan-European national security risks, and offers room for protectionist
abuse in the name of security. A common European concept and legislative
framework for investment review is needed to address these problems and hedge
against a protectionist fallback in the false name of security. Greater transatlantic and
international coordination is needed to reach a consensus on legitimate investment
restrictions and global best practices for investment reviews.
4. Set the right priorities for investment promotion. An EU-China bilateral
investment treaty will help to address market access problems on the European side,
but it will do very little to promote investment flows from China. Tailored
investment promotion approaches that help Chinese investors overcome the hurdles
they have in entering mature market economies are important to sustain the inflow
of Chinese investment. In the long run, it is critical that Europe finds a way out of its
current crisis. Only a competitive EU economy can sustain foreign investment from
China and other places - and in turn better cope with any challenges it raises.
These findings and policy recommendations are far from comprehensive, but we
hope they will contribute to a better understanding of growing Chinese investment
in Europe and help inform the policy debate. While the growth in recent years is
impressive, many chapters in the story of Chinese EU investment have yet to be
written. Securing the right policy response is crucial, given the potential for future
investment flows and China’s role as test case for a wider range of emerging market
investors.
CONCLUSIONS AND POLICY RECOMMENDATIONS 78
References
Abdelal, Rawi (2007): “Capital Rules: The Construction of Global Finance”, Harvard
College Press, 2007.
Åslund, Anders (2008): “Russia Energy and the European Union: Perspectives on
Gazprom”, speech before the European People’s Party, European Parliament, May 15,
2008, available at: http://www.iie.com/publications/papers/aslund0508.pdf
Bakker, Age (1995): “The liberalization of capital movements in Europe: the
Monetary Committee and financial integration”, Kluwer Academic Publishers, 1996.
Berger, Axel (2011): “The politics of China's investment treaty-making-program”,
The Politics of International Economic Law, Cambridge University Press, 2011.
Burghard, Nora and Vanessa Rossi (2009): “China’s Overseas Direct Investment in
UK”, International Economics, Chatham House, December 2009, available at:
http://www.chathamhouse.org/sites/default/files/public/Research/International%2
0Economics/1209pp_china_odi.pdf
BusinessEurope (2011): “Rising to the China Challenge”, BusinessEurope, October
2011, available at:
http://www.businesseurope.eu/content/default.asp?PageID=568&DocID=29298
Cai, Kevin G. (1999): “Outward Foreign Direct Investment: A Novel Dimension of
China’s Integration into the Regional and Global Economy”, China Quarterly, v160,
1999.
Cantwell, John A. and Ram Mudambi (2000): “The Location of MNE R&D Activity:
The Role of Investment Incentives”, Management International Review, 2000.
Capobianco, Antonio and Hans Christiansen (2011): “Competitive Neutrality and
State-Owned Enterprises: Challenges and Policy Options”, OECD Corporate
Governance Working Papers, No. 1, 2011, available at:
http://dx.doi.org/10.1787/5kg9xfgjdhg6-en
China Council for the Promotion of International Trade (2010): “Survey on Current
Conditions and Intention of Outbound Investment by Chinese Enterprises”, April
2010, available at:
http://www.ccpit.org/yewu/docs/Survey_on_Current_Conditions_and_Intention_of_
Outbound_Investment_by_Chinese_Enterprises.2010.en.pdf
Chase, Peter H. (2011): “The United States, European Union and International
Investment”, Economic Policy Program, The German Marshall Fund of the United
States, July 2011, available at: http://www.gmfus.org/archives/the-united-stateseuropean-union-and-international-investment
79 CHINA INVESTS IN EUROPE
China Investment Corporation (2010): Annual Report, 2010, available at:
http://www.china-inv.cn/cicen/include/resources/CIC_2010_annualreport_en.pdf
Corr, Christopher F. (1994): “A Survey of United States Controls on Foreign
Investment and Operations: How Much is Enough?”, American University Journal of
International Law and Policy, v417, 1994, available at: http://www.auilr.org/pdf/9/92-1.pdf
Department of Treasury (2008): “CFIUS Reform: The Foreign Investment & National
Security Act of 2007 (FINSA)”, 2008, available at:
http://www.treasury.gov/resource-center/international/foreigninvestment/Documents/FINSA.pdf
Donadio, Donald (2010): “Chinese Remake the ‘Made in Italy’ Fashion Label”, New
York Times, September 12, 2010, available at:
http://www.nytimes.com/2010/09/13/world/europe/13prato.html?_r=1&pagewanted
=all
Dunning, John H. (1981): “Explaining the international direct investment position of
countries: towards a dynamic or developmental approach,” Review of World
Economics 117, 1981, available at:
http://www.springerlink.com/content/76m75q45nu788478
Dunning, John H., Changsu Kim and Donghyun Park (2008): “Old Wine in New
Bottles: a Comparison of Emerging Market TNCs Today and. Developed Country
TNCs Thirty Years Ago”, The Rise of Transnational Corporations from Emerging
Markets: Threat or Opportunity?, June 2008, available at:
http://www.qeh.ox.ac.uk/pdf/pdf-slptmd/SLPTMD%20WP%20011-Dunning.pdf
Dunning, John H. and Sarianna M. Lundan (2008): Multinational Enterprises and the
Global Economy, 2nd ed., Edward Elgar, 2008.
Ebbers, Haico and Zhang Jianhong (2010): “Chinese Investment in the EU”, Eastern
Journal of European Studies, Volume 1, Issue 2, December 2010.
European Council on Foreign Relations (2012): “Facing the Risks of the ‘Going Out
Strategy’”, January 2012, available at:
http://ecfr.eu/content/entry/china_analysis_facing_the_risks_of_the_going_out_strat
egy
European Union Chamber of Commerce in China (2011): “European Business in
China Position Paper 2011/12”, July 2011, available at:
http://www.europeanchamber.com.cn/view/media/publications/#pp2011
European Commission (2008): “A common European approach to Sovereign Wealth
Funds”, 2008, available at:
http://ec.europa.eu/internal_market/finances/docs/sovereign_en.pdf
REFERENCES 80
European Commission (2010): “Towards a comprehensive European international
investment policy”, July 7, 2010.
European Commission (2011a): “Free movement of capital”, the EU Single Market,
updated February 15, 2011, available at:
http://ec.europa.eu/internal_market/capital/index_en.htm
European Commission (2011b): “China National Bluestar/ELKEM: Case No.
COMP/M.6082”, March 31, 2011, available at:
http://ec.europa.eu/competition/mergers/cases/decisions/m6082_20110331_20310_1
967334_EN.pdf
European Commission (2011c): “Consultation on the future investment relationship
between the EU and China,” May 2, 2011, available at:
http://trade.ec.europa.eu/doclib/docs/2011/may/tradoc_147866.pdf
European Commission (2011d): “Foreign affiliates statistics – FATS”, updated March
17, 2011, available at:
http://epp.eurostat.ec.europa.eu/statistics_explained/index.php/Foreign_affiliates_s
tatistics_-_FATS
European Commission (2012a): “Foreign Direct Investment Statistics”, 2012, available
at:
http://epp.eurostat.ec.europa.eu/statistics_explained/index.php/Foreign_direct_inv
estment_statistics
European Commission (2012b): “Trade and Investment Barriers Report 2012”,
available at: http://trade.ec.europa.eu/doclib/docs/2012/february/tradoc_149143.pdf
European Parliament (2012): Resolution on “EU and China: Unbalanced Trade?”, May
23, 2012, available at: http://www.europarl.europa.eu/sides/getDoc.do?pubRef=//EP//TEXT+TA+P7-TA-2012-0218+0+DOC+XML+V0//EN
European Union and United States (2008): “EU-US Open Investment Statement”,
May 13, 2008, available at:
http://europa.eu/rapid/pressReleasesAction.do?reference=MEMO/08/301&format=
HTML&aged=0&language=EN&guiLanguage=en
European Union and United States (2012): “Statement of the European Union and the
United States on Shared Principles for International Investment”, April 10, 2012,
available at: http://trade.ec.europa.eu/doclib/html/149331.htm
Fagan, David N. (2010): “The U.S. Regulatory and Institutional Framework for FDI”,
Deloitte: Investing in the United States: A Reference Series for Chinese Investors,
Volume 2, 2010, available at:
http://www.vcc.columbia.edu/pubs/documents/FaganFinalEnglish_001.pdf
81 CHINA INVESTS IN EUROPE
Freeman, Charles W. (2009): “Remember the Magnequench: An Object Lesson in
Globalization,” Washington Quarterly, January 2009, available at:
http://www.twq.com/09winter/docs/09jan_Freeman.pdf
Gartzke, Erik, Quan Li and Charles Boehmer (2001): “Investing in the peace:
Economic interdependence and international conflict”, International Organization,
55(2), 2001.
Globerman, Steven and Daniel Shapiro (2007): “Is the U.S. Ready for FDI From
China?: Economic Considerations,” Western Washington University, 2007, available
at: http://www.cbe.wwu.edu/CIBNEW/docs/Is%20The%20US%20Ready%20for%20FDI%20From%20China%20Econo
mic%20Considerations.pdf
Godement, Francois and Jonas Parello-Plesner, with Alice Richard (2011): “The
Scramble for Europe”, European Council on Foreign Relations, July 2011, available
at: http://www.ecfr.eu/page/-/ECFR37_Scramble_For_Europe_AW_v4.pdf
Graham, Edward M. and Paul R. Krugman (1995): “Foreign Direct Investment in the
United States”, Peterson Institute for International Economics, 1995.
Graham, Edward M. and David M. Marchick (2006): “US National Security and
Foreign Direct Investment”, Peterson Institute for International Economics, 2006.
Hanemann, Thilo (2011): “Chinese FDI in the United States and Europe: Implications
and Opportunities for Transatlantic Cooperation”, Stockholm China Forum, German
Marshall Fund of the United States, June 2011, available at:
http://www.gmfus.org/archives/chinese-fdi-in-the-united-states-and-europeimplications-and-opportunities-for-transatlantic-cooperation
Hanemann, Thilo (2012): “Going Going Global Starts at Home”, Wall Street Journal,
February 23, 2012, available at:
http://online.wsj.com/article/SB10001424052970203960804577238561603657148.ht
ml
He, Jianwu, and Louis Kujis (2007): “Rebalancing China’s Economy—Modeling a
Policy Package”, World Bank China Research Paper No. 7, September 2007.
Hufbauer, Gary, Thomas Moll and Luca Rubini (2008): “Investment Subsidies for
Cross-Border M&A: Trends and Policy Implications,” United States Council
Foundation Occasional Paper, April 2008, available at:
http://www.uscib.org/docs/usc_foundation_investment_subsidies.pdf
Hufbauer, Gary, Jeffrey J. Schott, Kimberley Ann Elliott and Barbara Oegg (2007):
“Economic Sanctions Reconsidered”, Peterson Institute for International Economics,
November 2007.
REFERENCES 82
International Monetary Fund (2011): “People's Republic of China: Staff Report for the
2011 Article IV Consultation,” IMF Country Report No. 11/192, July 2011, available at:
http://www.imf.org/external/pubs/ft/scr/2011/cr11192.pdf
International Monetary Fund (2010): “Sixth Edition of the IMF's Balance of Payments
and International Investment Position Manual,” January 2010, available at:
http://www.imf.org/external/pubs/ft/bop/2007/bopman6.htm
James K. Jackson (2010): “The Committee on Foreign Investment in the United States
(CFIUS)”, Congressional Research Service, July 2010, available at:
http://www.fas.org/sgp/crs/natsec/RL33388.pdf
Kalinova, Blanka, Angel Palerm and Stephen Thomsen (2010): “OECD’s FDI
Restrictiveness Index: 2010 Update”, OECD Working Papers on International
Investment, No. 2010/3, 2010.
Kan, Shirley A. (2011): “China and Proliferation of Weapons of Mass Destruction and
Missiles: Policy Issues”, Congressional Research Service, February 3, 2011, available
at: http://fpc.state.gov/documents/organization/156523.pdf
Lane, Philip R. and Gian M. Milesi-Ferretti (2007): “External Wealth of Nations”,
dataset 1970-2007, available at: http://www.philiplane.org/EWN.html
Lardy, Nicholas R. (2012): “Sustaining China's Economic Growth after the Global
Financial Crisis”, Peterson Institute for International Economics, January 2012.
Larson, Alan P. and David M. Marchick (2006): “Foreign Investment and National
Security: Getting the Balance Right”, Council on Foreign Relations, 2006.
Mann, Catherine (2009): “International Capital Flows and the Sustainability of the
US Current Account Deficit,” The Long-term International Economic Position of the
US International Capital Flows, Peterson Institute of International Economics, 2009,
available at:
http://www.piie.com/publications/chapters_preview/4327/03iie4327.pdf
Mansfield, Edward D. and Brian M. Pollins (eds.) (2003): Economic Interdependence
and International Conflict: New Perspectives on an Enduring Debate, University of
Michigan Press, 2003.
Matz, Stefan (2009): “Chinese Direct Investments in Europe”, presentation at the
International Workshop, June 28-29, 2009, available at: http://www.gigahamburg.de/dl/download.php?d=/content/ias/chinese%20direct/matz_ppt.pdf
Metzl, Jamie (2011): “Strategic Challenges: China and Cyber-Espionage”, Asia
Society, 2011, available at: http://asiasociety.org/policy/strategic-challenges/chinaand-cyber-espionage?gclid=CLGD_ZOWg60CFRDHKgodAllaTA
83 CHINA INVESTS IN EUROPE
Ministry of Commerce, People’s Republic of China (2011): “2010 Statistical Bulletin of
China’s Outward Foreign Direct Investment”, September 2011, available at:
http://hzs.mofcom.gov.cn/accessory/201109/1316069604368.pdf
Ministry of Commerce, People’s Republic of China (2010): “2009 Statistical Bulletin
of China’s Outward Foreign Direct Investment”, September 2010, available at:
http://hzs.mofcom.gov.cn/accessory/201009/1284339524515.pdf
Ministry of Commerce, People’s Republic of China (2009): “2008 Statistical Bulletin
of China’s Outward Foreign Direct Investment”, September 2009, available at:
http://hzs.mofcom.gov.cn/accessory/200909/1253868856016.pdf
Moran, Theodore H, (2009): “Three Threats: An Analytical Framework for the CFIUS
Process: Identifying Genuine National Security Risks and Threats, Dismissing
Implausible Allegations”, Peterson Institute for International Economics, 2009.
Morozov, Evgeny (2011): “A Walled Wide Web for Nervous Autocrats,” Wall Street
Journal, January 8, 2011, available at:
http://online.wsj.com/article/SB10001424052748704415104576065641376054226.ht
ml
Nanto, Dick K., James K. Jackson, Wayne M. Morrison and Lawrence Kumins (2005):
“China and the CNOOC Bid for Unocal: Issues for Congress,” CRS Report for
Congress, September 15, 2005, available at:
http://www.policyarchive.org/handle/10207/bitstreams/2571.pdf
Naughton, Barry (1995): “Growing out of the plan: Chinese economic reform, 19781993”, Cambridge University Press, 1995.
Nicolas, Francoise (2010): “Chinese Direct Investment in France: No French
Exception, No Chinese Challenge”, International Economics, Chatham House,
January 2010, available at:
http://www.chathamhouse.org/sites/default/files/public/Research/International%2
0Economics/0110pp_nicolas.pdf
OECD (2007): “Freedom of Investment, National Security and ‘Strategic’ Industries:
An Interim Report”, March 2007, available at:
http://www.oecd.org/dataoecd/1/58/40473798.pdf
OECD (2008): “Benchmark Benchmark Definition of Foreign Direct Investment - 4th
Edition,” May 2008, available at:
http://www.oecd.org/document/33/0,3343,en_2649_33763_33742497_1_1_1_1,00.htm
l
OECD (2008): “Proportionality of Security-Related Investment Instruments: A
Survey of Practices”, May 2008, available at:
http://www.oecd.org/dataoecd/2/25/40699890.pdf
REFERENCES 84
OECD (2008): “Transparency and Predictability for Investment Policies Addressing
National Security Concerns: A Survey of Practices”, May 2008, available at:
http://www.oecd.org/dataoecd/2/20/40700254.pdf
OECD (2008): “OECD Reviews of Innovation Policy: China”, September 2008,
available at: www.oecd.org/sti/innovation/reviews/china
OECD (2010): “OECD Code of Liberalization of Capital Movements”, 2010, available
at: http://www.oecd.org/dataoecd/10/62/39664826.pdf
OECD and UNCTAD (2010): “Fourth Report on G20 Investment Measures”,
November 2010, available at: http://www.oecd.org/dataoecd/20/53/46319056.pdf
OECD (2010): “Identification of Foreign Investors: A Fact Finding Survey of
Investment Review Procedures”, Freedom of Investment Process, Investment
Division, Directorate for Financial and Enterprise Affairs, May 2010, available at:
http://www.oecd.org/dataoecd/4/3/45425060.pdf
Office for Publications of the European Union (2011): “Case No COMP/M.6113 -DSM /
SINOCHEM / JV Regulation (EC) No 139/2004 Merger Procedure”, EU Commission,
May 2011, available at:
http://ec.europa.eu/competition/mergers/cases/decisions/m6113_20110519_20310_18
12856_EN.pdf
Office of the National Counterintelligence Executive (2011): “Foreign Spies Stealing
US Economic Secrets in Cyberspace—Report to Congress on Foreign Economic
Collection and Industrial Espionage, 2009-2011”, October 2011, available at:
http://www.dni.gov/reports/20111103_report_fecie.pdf.
Okano-Heijmans, Maaike and Frans-Paul van der Putten (2009): “Europe needs to
screen Chinese investment”, East Asia Forum, August 18, 2009, available at:
http://www.eastasiaforum.org/2009/08/18/europe-needs-to-screen-chineseinvestment/
Organization for Economic Co-operation and Development (2012): “Foreign Direct
Investment (FDI) Statistics - OECD Data, Analysis and Forecasts”, 2012, available at:
http://www.oecd.org/document/8/0,3746,en_2649_33763_40930184_1_1_1_1,00.html
Owen, Geoffrey (2012): “Industrial Policy in Europe since the Second World War:
What Has Been Learnt?” European Centre for International Political Economy,
Occasional Paper No. 1, 2012.
Pietrobelli, Carlo, Roberta Rabellotti and Marco Sanfilippo (2010): “The ‘Marco Polo’
Effect: Chinese FDI in Italy”, International Economics, Chatham House, February
2010, available at:
http://www.chathamhouse.org/sites/default/files/public/Research/International%2
0Economics/pp0210italy.pdf
85 CHINA INVESTS IN EUROPE
Pinto, Pablo M. and Tim Frye (2010): “The Politics of Chinese Investment in the U.S.”,
Investing in the United States: Is the US Ready for FDI from China?, Edward Elgar,
2010.
Probert, Jocelyn (1991): “Asian Direct Investment in Europe”, INSEAD, 1991,
available at: http://www.insead.edu/facultyresearch/research/doc.cfm?did=2475
Psaraftis, Harilaos N. and Athanasios A. Pallis (2012): “Concession of the Piraeus
container terminal: turbulent times and the quest for competitiveness”, Maritime
Policy & Management, 39:1, January 2012, available at:
http://www.martrans.org/documents/2012/prt/MPM2012-Psaraftis.pdf
Reich, Robert B. (1990): “Who Is Us?”, Harvard Business Review, January-February
1990.
Röller, Lars-Hendrick and Nicolas Véron (2008): “Safe and Sound: An EU Approach
to Sovereign Investment”, Bruegel, Policy Brief Issue 2008/08, November 2008.
Rosen, Daniel H. (1999): “Behind the Open Door: Foreign Enterprises in the Chinese
Marketplace”, Peterson Institute for International Economics, 1999.
Rosen, Daniel H. and Thilo Hanemann (2009): “China’s Changing Outbound Foreign
Direct Investment Profile: Drivers and Policy Implications”, Peterson Institute for
International Economics, 2009, available at:
http://www.iie.com/publications/pb/pb09-14.pdf
Rosen, Daniel H. and Thilo Hanemann (2011): “An American Open Door?
Maximizing the Benefits of Chinese Foreign Direct Investment”, Center on US-China
Relations, Asia Society, May 2011, available at:
http://asiasociety.org/files/pdf/AnAmericanOpenDoor_FINAL.pdf
Rosen, Daniel H. and Thilo Hanemann (2012): “Outward FDI from China:
Dimensions, Drivers, Implications”, Peterson Institute for International Economics,
forthcoming.
Rosen, Daniel H. and Trevor Houser (2007): “China Energy: a Guide for the
Perplexed”, Peterson Institute for International Economics, available at:
http://www.petersoninstitute.org/publications/papers/rosen0507.pdf
Sachs, Jeffrey D. and Andrew M. Warner (1999): “The Big Rush, Natural Resource
Booms and Growth,” Journal of Development Economics, v59, 1999, available at:
http://www.nber.org/papers/w5398
Saez, Lawrence (2010): “Chinese Outward Direct Investment in Spain”, International
Economics, Chatham House, March 2010, available at:
http://www.chathamhouse.org/sites/default/files/public/Research/International%2
0Economics/0310pp_saez.pdf
REFERENCES 86
Sauvant, Karl P. (ed.) (2010): “Investing in the United States: Is the US Ready for FDI
from China?”, Edward Elgar, 2010.
Setser, Brad and Arpana Pandey (2009): “China’s $1.7 Trillion Bet, China’s External
Portfolio and Dollar Reserves,” Council on Foreign Relations, 2009.
State Administration of Foreign Exchange (2012): Balance of Payments and
International Investment Position data, available at:
http://www.safe.gov.cn/model_safe_en/tjsj_en/tjsj_list_en.jsp?ID=30304000000000
000&id=4
Stokes, Bruce (1991): “Staking out Europe”, National Journal, v23, May 25, 1991.
The Committee on Foreign Investment in the United States (CFIUS): Annual Reports
to Congress 2008-2010, available at: http://www.treasury.gov/resourcecenter/international/foreign-investment/Pages/cfius-reports.aspx
Tyson, Laura D'Andrea (1991): “They Are Not Us: Why American Ownership Still
Matters”, American Prospect, available at:
http://www.prospect.org/cs/articles?article=they_are_not_us_why_american_owners
hip_still_matters
United Nations Conference on Trade and Development (2012): Foreign Direct
Investment data, 2012, available at:
http://unctadstat.unctad.org/ReportFolders/reportFolders.aspx?sCS_referer=
&sCS_ChosenLang=en
United States Department of Defense (2006): Operating Manual, National Industrial
Security Program, February 2006, available at:
http://www.dss.mil/isp/odaa/documents/nispom2006-5220.pdf
United States Department of Defense (2010): “Military and Security Developments
Involving the People’s Republic of China 2010, Annual Report to Congress Pursuant
to the National Defense Authorization Act for Fiscal Year 2010”, 2010, available at:
http://www.defense.gov/pubs/pdfs/2010_CMPR_Final.pdf
USITC (2010): “China: Intellectual Property Infringement, Indigenous Innovation
Policies, and Frameworks for Measuring the Effects on the U.S. Economy”, 2010,
available at: http://www.usitc.gov/publications/332/pub4199.pdf
U.S.-China Economic and Security Review (USCC) (2011): “National Security
Implications of Investments and Products From the People’s Republic of China In the
Telecommunications Sector”, USCC Staff Report, January 2011, available at:
http://www.uscc.gov/RFP/2011/FINALREPORT_TheNationalSecurityImplicationsofI
nvestmentsandProductsfromThePRCintheTelecommunicationsSector.pdf
87 CHINA INVESTS IN EUROPE
U.S.-China Economic and Security Review (USCC) (2009): “Capability of the People’s
Republic of China to Conduct Cyber Warfare and Computer Network Exploitation”,
prepared by Northrop Grumman, 2009, available at:
http://www.uscc.gov/researchpapers/2009/NorthropGrumman_PRC_Cyber_Paper_
FINAL_Approved%20Report_16Oct2009.pdf
Yackee, Jason W. (2008): “Bilateral Investment Treaties, Credible Commitment, and
the Rule of (International) Law: Do BITs Promote Foreign Direct Investment?”, Law &
Society Review, Volume 42, Issue 4, December 2008.
Weddle, Rick (2009): “Funding for Invest in America to Attract Investment, Create
Jobs and Stimulate Growth Industries: A Comparative Review of the Structure,
Funding and Program Focus of Competitor Nation Investment Promotion
Agencies”, Supplemental Report to Testimony before the Subcommittee on
Economic Policy, U.S. Senate Committee on Banking, Housing & Urban Affairs,
December 18, 2009, available at:
http://strengtheningbrandamerica.com/docs/Weddle_Supplemental%20Report_Inv
est%20in%20America_Final.pdf
Wen Jiabao (2012): “Report on the Work of the Government,” delivered at the Fifth
Session of the Eleventh National People’s Congress, March 5, 2012, available at:
http://online.wsj.com/public/resources/documents/2012NPC_GovtWorkReport_Eng
lish.pdf
Wilkins, Mira (2004): “The History of Foreign Investment in the United States, 19141945”, Harvard University Press, June 2004.
World Bank (2012): “China 2030: Building a Modern, Harmonious, and Creative
High-Income Society”, World Bank and the Development Research Center of the
State Council of the People’s Republic of China, February 2012, available at:
http://wwwwds.worldbank.org/external/default/WDSContentServer/WDSP/IB/2012/02/28/000
356161_20120228001303/Rendered/PDF/671790WP0P127500China020300complete.p
df
World Bank and International Finance Corporation (2010): “Doing Business 2011:
Making a Difference for Entrepreneurs”, November 2011, available at:
http://www.doingbusiness.org/reports/doing-business/doing-business-2011
Wortzel, Larry M. (2010): “China’s Approach to Cyber Operations: Implications for
the United States”, testimony before the Committee on Foreign Affairs, House of
Representatives, March 10, 2010, available at:
http://www.uscc.gov/testimonies_speeches/testimonies/2010/LarryWortzeltestimo
ny-March2010.pdf
Xu, Ting, Theiss Peterson and Tianlong Wang (2012): “Cash in hand: Chinese Foreign
Direct Investment in the U.S. and Germany”, Bertelsmann Foundation, April 12,2012,
REFERENCES 88
available at:
http://www.bfna.org/sites/default/files/publications/Cash%20In%20Hand.pdf
Yannaca-Small, Katia (2007): “Essential Security Interests under International
Investment Law”, International Investment Perspectives: Freedom of Investment in
a Changing World, OCED, 2007, available at:
http://www.oecd.org/dataoecd/59/50/40243411.pdf
Zhang, Haiyan, Zhi Yang and Daniël Van Den Bulcke (2011): “Euro-China Investment
Report 2011-2012”, Antwerp Management School, 2012, available at:
http://www.antwerpmanagementschool.be/en/faculty-research/publications/eurochina-investment-report-2011-2012.aspx
89 CHINA INVESTS IN EUROPE
Appendix: Data on Chinese Investment in
Europe
Direct investment flows from China to the European Union can be analyzed using
three sets of data: (1) official data from European statistical authorities, (2) official
data from the Chinese government, and (3) Rhodium Group’s data set on Chinese
greenfield projects and M&A transactions in Europe. The three data sets are not
directly comparable with one another, as they differ in compilation methods,
underlying definitions, quality, and timelines. But each is helpful for describing
different aspects of Chinese investment in Europe.
Chinese authorities publish two datasets that include information on outward FDI
flows and stocks: first, the balance of payments (BOP) and international investment
position (IIP) statistics compiled by the People’s Bank of China (PBoC, China’s central
bank) and its foreign exchange regulator, the State Administration of Foreign
Exchange (SAFE); second, the annual statistical bulletin on outward FDI published
by the Chinese Ministry of Commerce (MOFCOM). 77 The balance of payments and
international investment position statistics record annual outward FDI flows and
stocks based on the principles outlined in the fifth edition of the IMF’s Balance of
Payments and International Investment Position Manual. However, Chinese
statistics only provide aggregate numbers for outward FDI to the world, and do not
contain any detailed breakdowns by country or industry. Such details can be found in
the Ministry of Commerce’s annual OFDI report, which has been published since
2004. The reports provide OFDI flows and stocks in current cost terms, including
breakdowns by industry and geographic distribution.
Although the collection and dissemination of data on OFDI have improved markedly
in recent years, there are still significant concerns about the accuracy and reliability
of data from the Chinese side. Not surprisingly, Chinese authorities have little
experience in compiling statistics on outward investment flows. Furthermore, the
Ministry of Commerce collects data based on information submitted by firms in the
mandatory approval process instead of surveys (which is the international standard).
Firms often submit incomplete information or find ways to completely avoid
bureaucratic screening, which distorts the statistics. 78 Because of this and other
problems with data collection, the Ministry of Commerce’s statistics on outward FDI
are of questionable quality, with regard to aggregate data and key metrics such as
distribution by industry or country. China’s MOFCOM reports a Chinese OFDI stock
of $12.5 billion in the European Union by year-end 2010, accounting for 4% of China’s
global OFDI stock (Table A-1).
China’s balance of payments and international investment position statistics can be found at
http://www.safe.gov.cn; the Ministry of Commerce’s OFDI reports can be found at http://hzs.mofcom.gov.cn.
78
For a detailed discussion of some of the shortcomings and problems, see Rosen and Hanemann (2009).
77
91 CHINA INVESTS IN EUROPE
Table A-1: Chinese OFDI Stock and Flows in Europe, Official Sources, 2010
USD million, percent difference
FDI Stock (2010)
Euro Area (16)
EU-27
Austria
Belgium
Bulgaria
Cyprus
Czech Republic
Denmark
Estonia
Finland
France
Germany
Greece
Hungary
Ireland
Italy
Latvia
Lithuania
Luxembourg
Malta
Netherlands
Poland
Portugal
Romania
Slovakia
Slovenia
Spain
Sweden
United Kingdom
Eurostat
5,833
8,927
184
-742
23
N/A
72
506
7
68
472
1,060
5
139
-1,182
423
1
3
N/A
7
345
325
N/A
69
49
0
N/A
1,468
618
MOFCOM
8,802
12,502
2
101
19
N/A
52
42
8
27
244
1,502
4
466
140
224
1
4
5,787
3
487
140
21
125
10
5
248
1,479
1,358
FDI Flows (2010)
∆
-2,968
-3,575
182
-843
4
N/A
19
463
-1
40
229
-442
1
-326
-1,322
199
1
-1
N/A
4
-142
185
N/A
-56
39
-5
N/A
-12
-740
Eurostat
-261
977
4
147
7
N/A
3
19
-3
86
33
445
N/A
131
-1,060
-27
0
0
73
3
252
11
3
-9
23
0
N/A
N/A
13
MOFCOM
3,850
5,963
0
45
16
N/A
2
2
N/A
18
26
412
N/A
370
33
13
N/A
N/A
3,207
-2
65
17
11
0
N/A
29
1,367
330
∆
-4,112
-4,986
4
102
-10
N/A
1
17
N/A
68
7
32
N/A
-239
-1,093
-40
N/A
N/A
N/A
5
188
-6
N/A
-20
22
N/A
N/A
N/A
-317
Sources: PRC Ministry of Commerce, Eurostat. N/A=not available. Currency conversions from Euro into USD are based on the IMF’s 2010
EUR/USD exchange rate of 1.3269.
In Europe, national statistical agencies and central banks are responsible for
collecting and disseminating data on FDI. EU institutions such as Eurostat or the
European Central Bank then aggregate and disseminate EU-wide figures. Eurostat
publishes two key data sets that include relevant information for the analysis of
direct investment: figures for inward FDI flows and stocks compiled in accordance
with Balance of Payment statistical principles, and data on the operations of
multinational enterprises, the Foreign Affiliate Statistics (FATS, Table A-2). 79
79
See European Commission (2011d).
APPENDIX 92
Table A-2: Chinese and Hong Kong-Owned Affiliates in the EU, 2008/2009*
USD million, percent difference
Austria
Belgium
Bulgaria
Cyprus
Czech
Republic
Denmark
Estonia
Finland
France
Germany
Greece
Hungary
Ireland
Italy
Latvia
Lithuania
Luxembourg
Malta
Netherlands
Poland
Portugal
Romania
Slovakia
Slovenia
Spain
Sweden
United
Kingdom
Number of
Enterprises
Turnover
($mn)
Value
Added
($mn)
Personel
Cost ($mn)
Number of
Employees
R&D
Expenditure
($mn)
8
423
153
102
1,645
38
51
0
15
0
1
0
0
0
160
43
5
0
6
59
110
155
4,347
3,715
0
10
1,193
849
0
6
577
298
0
45
277
204
16
17
1,172
38
548
72
43
647
1
5
17
6
423
114
98
2,376
3
995
379
34
14
2,389
0
17
11
33
5
542
517
2
74
58
1
46
56
113
0
546
49
1,728
11,279
119
2,695
84
1,342
9,093
0
0
0
38
Source: Eurostat, Foreign Affiliates Statistics (FATS). *Latest available year; includes companies from Hong Kong. Original EUR values
have been converted into USD using an average 2008/2009 exchange rate of 0.7.
While FDI statistics from Europe can be considered more accurate than those from
China, there are several shortcomings. For one, Eurostat’s figures are published with
significant delay – as of this writing, comprehensive FDI data are available only
through 2010, a lag of 1.5 years. Second, the data compiled by Eurostat is of very
mixed quality. There is a significant difference in the scope and quality of statistical
data compilation across European countries. Tables A-1 and A-2 illustrate that
smaller countries, Southern European countries, and the new member states in the
East still do not provide FDI-related data through Eurostat. Further, accurate
compilation of FDI statistics has become more complicated in recent years due to the
extensive use of offshore financial centers and tax havens. These practices lead to
93 CHINA INVESTS IN EUROPE
over-counting FDI flows to countries with favorable tax regimes, such as
Luxembourg and the Netherlands, and undercounting FDI flows from countries
whose firms prevalently employ offshore financial centers. In China, capital controls
and the lack of legal and financial infrastructure force firms to channel their overseas
investment through Hong Kong, the Cayman Islands and other Caribbean tax
havens. Finally, European FDI statistics lack important metrics such as distribution
by industry and country or nationality of the investing company.
Given that the scope, timelines, quality and results vary substantially, and
sometimes drastically, official data from both the Chinese and the European sides are
not sufficient for an in-depth, real-time analysis of Chinese investment patterns.
Therefore, we decided to compile our own dataset on Chinese direct investment in
Europe based on a bottom-up collection of investment projects and deals. 80 Our
dataset captures expenses by Chinese-owned firms for investment projects that
qualify as direct investment, i.e. a greenfield project or the acquisition of a stake in an
existing company that exceeds 10% of voting rights. Such an alternative approach is
not comparable to the traditional balance of payments method, but it avoids some of
the problems of official data – namely issues with time lags and pass-through
locations – and allows a real-time assessment of investment trends.
Online-based research strategies provide a fertile ground for such alternative data
collection attempts. A range of commercial databases are available for information
on mergers and acquisitions, for example Bloomberg, ThomsonONE, Dealogic,
Mergermarket, ISI Emerging Markets or CapitalIQ. Raw data on greenfield projects
can be sourced from subscription-based services such as the Financial Times’ fDi
Markets database or the European Investment Monitor by Ernst and Young.
Specialized company databases such as Bloomberg, Orbis, Hoover, Nexis or
Zoominfo offer additional information on companies’ operations in different
countries and their financials. Our strategy to derive raw data on FDI projects is
mostly based on M&A data from Bloomberg and a news monitoring system for
greenfield deals, which is based on specific search algorithms for news services such
as Nexis, Factiva and Google. Media reports, official documents such as SEC filings or
annual reports, business registries, information from investment promotion
agencies, and industry-specific lists of investment projects from business
associations and industry research firms complement our data collection strategy.
After collecting raw data on deals, we refined the sample by excluding deals that
were announced but never commenced and those that do not meet the generally
accepted threshold for qualifying as direct investment—10%. We also defined an
estimated investment value of $1 million as a minimum threshold for deals in our
database. There are hundreds if not thousands of small-scale operations with an
investment value below $1 million, which are impossible to capture and diligently
analyze. Qualifying M&A deals were added to the list at the date of their completion.
Greenfield projects were added at the date of their announcement, as most are
The authors are grateful to Jacob Funk Kirkegaard at the Peterson Institute for International Economics for
numerous valuable discussions regarding global FDI data and our alternative compilation methodology.
80
APPENDIX 94
impossible to track down to the date of opening. Finally, we assigned values to each
deal, based on the officially announced investment value or the most convincing
analyst estimate. If no estimate was available and possible, acquisitions were
included in the database with a zero value. For smaller-scale greenfield operations
with missing investment figures, we estimated them based on a formula derived
from similar projects in a similar location with known value. Using this approach, we
recorded 573 transactions worth $21 billion for the period 2000-2011 (FigureA-1).
Figure A-1: Chinese Direct Investment in the EU-27, 2000-2011
Number of deals and USD million
90
12,000
Value of Acquisitions, USD mn (RHS)
80
Value of of Greenfield Projects, USD mn (RHS)
10,000
Number of Greenfield Projects (LHS)
70
Number of Acquisitions (LHS)
60
8,000
50
8,594
40
30
6,000
4,000
20
2,074
2,000
1,970
10
0
2000
2001
2002
2003
606
306
254
301
2004
2005
625
170
2006
1,042
337
443
353
820
2007
2008
2009
1,539
1,217
2010
2011
0
Source: Rhodium Group. For a detailed explanation of sources and methodology, please see Appendix.
Each investment was also coded with the country in which the investment was made,
which allows us to draw an accurate picture of Chinese investment in Europe
independent from tax-optimizing flows and other distortions. Table A-3 summarizes
the distribution of Chinese investment in Europe by country.
95 CHINA INVESTS IN EUROPE
Table A-3: China’s FDI in the EU-27 by Country, 2000-2011
Country
1
2
3
4
5
6
7
8
9
10
11
12
13
14
15
16
17
18
19
20
21
22
23
France
United Kingdom
Germany
Sweden
Hungary
Netherlands
Belgium
Greece
Italy
Austria
Romania
Poland
Spain
Czech Rep.
Finland
Portugal
Bulgaria
Luxembourg
Ireland
Denmark
Latvia
Cyprus
Estonia
Lithuania
Malta
Slovakia
Slovenia
Investment
Value
(USD million)
Rank Compared to
FDI from the Rest of
the World*
Number of
Greenfield
Projects
5,722
3,684
2,543
2,251
2,065
1,164
847
714
554
391
299
190
187
76
48
47
47
46
44
30
3.8
3
0
0
0
0
0
20,957
+2
-1
-1
+4
+14
0
-3
+14
-2
+1
+4
-3
-8
0
+1
+1
+1
-5
-9
-7
+5
-1
-
46
69
113
14
14
32
12
5
31
6
13
15
22
10
1
5
6
1
6
6
1
0
0
0
0
0
0
428
Number of
Acquisitions
24
26
33
6
4
15
3
0
16
5
1
1
1
1
4
0
1
1
1
1
0
1
0
0
0
0
0
145
Total
Number of
Deals
70
95
146
20
18
47
15
5
47
11
14
16
23
11
5
5
7
2
7
7
1
1
0
0
0
0
0
573
Source: Rhodium Group, UNCTAD. *Difference to country’s position in the ranking of total inward FDI flows in the EU-27, 2000-2010,
compiled with data from UNCTAD.
In addition to providing an alternative view of aggregate investment flows, our
dataset allows us to analyze Chinese investment using important metrics not
available in the official data. All deals were assigned employment figures based on
company information, analyst estimates or our own estimates based on similar
projects or operations. We also coded each investment by ownership of the investing
company. For government ownership, we applied a conservative threshold of 20% or
more of total outstanding shares for listed companies. Table A-4 gives an overview of
Chinese investment in Europe in 2000-2011 by the ownership structure of the
ultimate beneficiary owner.
APPENDIX 96
Table A-4: China’s FDI in the EU-27 by Ownership of Investing Company, 2000-2011
USD million and number of deals
Government Controlled
State-Owned Enterprises
Sovereign Wealth Fund
Private and Public*
Government Controlled
State-Owned Enterprises
Sovereign Wealth Fund
Private and Public*
Number of Deals
Greenfield
% share M&A
148
35%
66
% share
46%
All Deals
214
% share
37%
148
0
35%
0%
64
2
44%
1%
212
2
37%
0%
280
428
65%
79
145
54%
359
573
63%
Total Investment (USD mn)
Greenfield
% share M&A
2,738
52%
12,413
% share
79%
All Deals
15,151
% share
72%
2,738
0
52%
0%
8,814
3,599
56%
23%
11,552
3,599
55%
17%
2,569
5,307
48%
3,238
15,650
21%
5,807
20,958
28%
Source: Rhodium Group. *May include minority stakes by government-owned investors below 20% of voting shares.
We also defined our own industry categories based on Standard Industrial
Classification (SIC) codes and assigned one of these categories to each deal in the
sample, based on the main activity of the greenfield facility or target firm. The
distribution of Chinese investment by industry is summarized in Table A-5. The
categories and the underlying SIC codes are summarized in Table A-6.
What are the strengths and weaknesses of this approach? First, our data set is not
compatible with existing international balance of payments norms for compiling
direct investment data. Unless specifically announced as a separate investment, we
do not capture any follow-up flows, such as reinvested earnings or intra-company
transfers. We also do not exclude investments of capital from non–mainland China
sources, for example, financing raised from local banks. Hence, our dataset is not
directly comparable with data from Eurostat, the State Administration of Foreign
Exchange, or the Ministry of Commerce. It cannot be used to analyze balance of
payments–related problems and other issues based on the national accounting
framework. Second, although we certainly caught a large number of deals, our
dataset hardly captured all Chinese investments in Europe. Our database should
include most deals with an investment value of $1 million or more, but there are
hundreds or even thousands of small-scale transactions every year that are
impossible to follow—for example, small trading operations or private investment in
real estate and other assets. Finally, some of our figures are based on estimates, and
for a small number of deals even estimates were not possible, so there are several
transactions with blank values in our dataset.
However, by recording investment flows from a bottom-up perspective, we avoid the
problems commonly related to balance of payments data. Official statistics on FDI
and other cross-border capital flows are heavily distorted by transfer pricing and
97 CHINA INVESTS IN EUROPE
other tax optimization strategies and thus often do not reflect economic realities. By
tracking gross investment expenses of firms based on sources outside firms and
national statistics offices, we avoid such distortions and present a very useful
alternative measure for investment flows. Furthermore, our dataset offers more
variables and a greater level of disaggregation, which makes it superior for analyzing
certain aspects of Chinese investment in the Europe that are very prominent in the
current policy debate. Finally, our approach allows us to come up with an almost
real-time assessment of investment flows, bypassing the significant time lag in
official data. We hope our dataset will prove an important analytical addition to the
debate on Chinese investment in Europe.
APPENDIX 98
Table A-5: China’s FDI in the EU-27 by Industry, 2000-2011
USD million and number of deals
Sector
1
2
3
4
5
6
7
8
9
10
11
12
13
14
15
16
17
18
19
20
21
22
23
24
25
26
27
28
29
30
Chemicals, Plastics and Rubber
Utility and Sanitary Services
Automotive OEM and Components
Coal, Oil & Gas
Communications Equip. & Services
Transportation Services
Metals Mining and Processing
Consumer Electronics
Industrial Machinery & Equipment
Food, Tobacco and Beverages
Financial Services and Insurance
Real Estate
Pharmaceuticals
Electronic Equip.0 & Components
Software & IT services
Aerospace, Space and Defense
Textiles and Apparel
Alternative/Renewable energy
Healthcare and Medical Devices
Paper, Printing & Packaging
Leisure & Entertainment*
Other Transport Equipment
Business Services
Minerals Mining and Processing
Semiconductors
Biotechnology
Consumer Products and Services
Furniture and Wood Products
Engines & Turbines
Construction Services
Total
Source: Rhodium Group.
99 CHINA INVESTS IN EUROPE
Value (USD mn)
Greenfield
M&A
TOTAL
126
3,505
3,631
0
3,259
3,259
655
1,961
2,615
18
1,603
1,621
1,180
177
1,357
784
546
1,329
25
1,200
1,225
187
983
1,170
495
499
993
110
570
679
495
31
526
146
340
486
21
280
300
133
152
285
256
13
269
79
174
253
137
96
233
145
84
229
30
63
93
74
0
74
48
0
48
31
15
46
43
1
44
1
42
43
18
17
35
24
10
34
28
0
28
0
27
27
14
4
18
6
0
6
5,306
15,650 20,957
Number of Projects
Greenfield M&A TOTAL
13
9
22
0
1
1
23
12
35
4
7
11
95
5
100
9
7
16
13
14
27
33
9
42
34
23
57
10
9
19
26
2
28
4
1
5
4
3
7
22
5
27
21
5
26
7
4
11
8
4
12
45
7
52
9
2
11
2
1
3
3
0
3
4
1
5
13
2
15
1
2
3
4.0
3
7
6
2
8
9
1
10
0
3
3
2
1
3
4
0
4
428
145
573
Table A-6: Breakdown of Industry Categories by SIC Codes
1
2
3
4
5
6
7
8
9
10
11
12
13
14
15
16
17
Industry
Aerospace, Space and Defense
Alternative/Renewable energy
Automotive OEM and Components
Biotechnology
Business Services
Chemicals, Plastics and Rubber
Coal, Oil & Gas
Communications Equipment and
Services
Construction Services
Consumer Electronics
Consumer Products and Services
Electronic Equipment and
Components
Engines & Turbines
Financial Services and Insurance
18
19
20
Food, Tobacco and Beverages
Furniture and Wood Products
Healthcare and Medical Devices
Industrial Machinery, Equipment &
Tools
Leisure & Entertainment
Metals Mining and Processing
21
22
23
24
25
26
27
28
29
30
Minerals Mining and Processing
Other Transport Equipment
Paper, Printing & Packaging
Pharmaceuticals
Real Estate
Semiconductors
Software & IT services
Textiles and Apparel
Transportation Services
Utility and Sanitary Services
SIC codes
372,376, 3812
2819, 2869
3711, 3713, 3714, 551, 552, 553, 501, 75
2836, 8731
731, 732, 733, 734, 735, 736, 738, 81, 82, 86, 871, 872, 8732,
8733, 874, 89
281, 2833, 284, 285, 286, 287, 289, 8731, 282, 30
12, 13, 29, 517, 554,
366, 481, 482, 483, 484, 489,
17
363, 365, 386, 5045, 5064
387, 391, 393, 394, 395, 396, 399, 509, 523, 525, 526, 527, 53,
563, 569, 57, 59, 76
357, 362, 364, 3671, 3672, 3677, 3678, 3679, 369, 5063, 5065
351
60, 61, 62, 63, 64, 67
01, 02, 07, 08, 09, 201, 202, 203, 204, 205, 206, 207, 208, 209,
21, 54, 514, 515, 518
24, 25, 5031
80, 83, 384, 385
352, 353, 354, 355, 356, 358, 359, 361, 382,508 (except 5088)
58, 70, 78, 79, 84
10, 33, 34,5051
14, 321, 322, 323, 324, 325, 326, 327, 328, 329, 5032, 5033,
5039, 5211
3715, 3716, 373, 374, 375, 379, 555, 556, 557, 558, 559, 5088
26, 27
2834, 2835, 5122, 5047, 8731, 8734,
15, 16, 65
3674, 3675, 3676
737
22, 23, 31, 513, 561, 562, 564, 565, 566,
40, 41, 4212, 4213, 4215, 43, 44, 45, 46, 47, 4214, 422, 423
49
Source: Rhodium Group.
APPENDIX 100
www.rhgroup.net
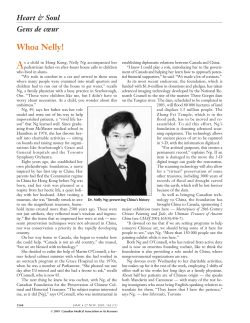


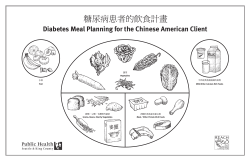

© Copyright 2026