
Simulating Counterfactual Representation
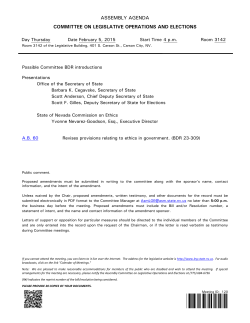
Simulating Counterfactual Representation
Andrew C. Eggers
Benjamin Lauderdale
April 13, 2015
ABSTRACT
We show how to use multilevel modeling and post-stratification to
estimate legislative outcomes under counterfactual representation
schemes that e.g. boost the representation of women or translate
votes into seats differently. We illustrate this technique by assessing
polarization in a counterfactual U.S. Congress in which state delegations are formed according to the principle of party proportional
representation.
1. INTRODUCTION
How would the voting outcomes of a legislature be different if it had more female
members (Simon and Palmer 2010; Bump 2015; Sides 2015), more working-class
members (Carnes 2012; Carnes and Lupu 2015), or more minority members
(Cameron, Epstein, and O’Halloran 1996)? Answering these questions could
help us understand existing variation in legislative voting and evaluate potential
institutional reforms.
While counterfactuals about systems of representation can be illuminating,
they can also be challenging to assess. A natural starting point is to estimate
a behavioral model of legislative voting as a function of gender, class, race,
or other features of interest, along with party and other predictors of voting
decisions; we then want to predict the voting outcomes in a counterfactual
legislature with a different distribution of legislator characteristics (e.g. more
females). Complications arise, however, because the change being considered
takes place at the aggregate level, while the model focuses on the individual level.
For simple cases with linear models one can generate appropriate predictions
(and confidence intervals) using algebra, but neither estimation nor inference is
straightforward for models involving nonlinearities and interactions. It can also
be challenging to incorporate the different kinds of uncertainty one can imagine
in such a comparison, including uncertainty about the model and about the
details of the counterfactual scenario being considered.
1
In this paper, we discuss a technique by which researchers can estimate and
analyze aggregate counterfactual outcomes using legislative voting data. Our
approach involves estimating a multilevel behavioral voting model and then
using post-stratification to simulate representation under counterfactual distributions of legislator attributes. Post-stratification is most commonly used to
address problems of statistical representation that arise in survey analysis with
non-response (S¨
arndal and Lundstr¨om 2005) and small-area estimation (Gelman and Little 1997; Park, Gelman, and Bafumi 2004). We suggest that this
method may be more broadly useful in the counterfactual analysis of political
representation.1
As an application, we consider how polarization in the U.S. Congress would
change if state congressional delegations were chosen by proportional representation, such that e.g. 30% of the Massachusetts delegation would be Republican
if 30% of voters in Massachusetts voted Republican. In recent years both parties have been under-represented in areas of the country where their members
are relatively moderate. (Massachusetts is a good example: its Republicans
are likely relatively moderate, but in recent years it has sent no Republicans
to Congress.) This suggests that remedying state-level party disproportionality
might reduce the much-discussed polarization of Congress (McCarty, Poole, and
Rosenthal 2006). Our approach is well-suited to evaluating how much (if any)
reduction in polarization would result. As with any such counterfactual exercise, our analysis can only capture part of what would change if such a reform
were actually implemented; our application thus highlights both our suggested
approach for analyzing such applications and some of the necessary limitations
involved in doing so.
The methods we discuss, if more broadly used, could improve the literature on legislative voting in three main ways. First, in many cases researchers
establish that legislator characteristics such as gender or class predict voting
behavior; although such studies tend to imply that aggregate changes in representation (due to e.g. changes in recruitment or campaign finance rules) would
therefore have substantial impacts on aggregate legislative outcomes, they often
do not provide explicit counterfactual analysis that demonstrates these impacts.
Our suggestions may encourage researchers to explicitly carry out these counterfactual analyses. Second, researchers who do provide these counterfactuals
have often failed to grapple with the uncertainty in their estimates. We identify
three types of uncertainty that one can consider incorporating into counterfactual analysis and illustrate a useful framework for incorporating them into
estimation. Third, our approach enables researchers to explore counterfactuals
that are not easily dealt with simply by examining coefficients in a behavioral
model; post-stratification is a more suitable approach when there are multiple
features that change in the counterfactual and/or when those features enter into
the behavioral model non-linearly or with interactions.
1 Multilevel regression with poststratification for small area estimation involves estimating
a general model using all the data and then simulating from the model given the known
distribution of attributes for each small area. Our application is similar, except that in the
second (post-stratification) step we use a counterfactual distribution of attributes.
2
2. METHODOLOGY
The first step to simulating counterfactual representation is building a behavioral model of how the legislator’s behavior of interest Yi (voting, fundraising,
etc) varies as a function of the variables Xi with respect to which the counterfactual is to be formed. This model should take the form of probability model
p(Yi |Xi , Θ) describing the conditional distribution of the outcome as a function of the measured variables and estimated parameters Θ. While a variety of
modeling techniques could be applied here, multilevel models are particularly
attractive for this type of application for the same reasons they are attractive
elsewhere (Gelman and Little 1997; Park, Gelman, and Bafumi 2004). Representation often occurs within states, electoral districts, or other blocs, but often
particular types relevant to the counterfactual (e.g. Massachusetts Republicans)
are absent from the data. Multilevel models provide a framework for incorporating the necessary assumptions to fill in these gaps while also accounting for
heterogeneity due to unobserved factors at the individual and district/state levels.
The second step is to generate a post-stratification scheme that reflects
the counterfactual representation scheme. For legislative counterfactuals, this
means specifying the count Ns corresponding to each type s (e.g. Republicans
from New York) in the counterfactual legislature.2 As in applications of of multilevel regression and post-stratification (i.e. MRP) to small-area estimation,
each type s specifies values of all attributes Xi in the behavioral model. One
needs to specify the full joint distribution of all the attributes in the behavioral model so that outcome values can be simulated for each individual in the
hypothetical legislature. Then, a single simulated counterfactual legislature is
achieved by drawing Ns individuals of each type from p(Yi |Xi , Θ).
There are at least three logically distinct sources of uncertainty that could
be incorporated into the model. The first of these is modelling uncertainty: how
certain are we about how behavior varies as a function of representatives’ attributes? This is taken into account either by simulating draws from the normal
approximation to the MLE of the probability model (Gelman and King 1994;
King, Tomz, and Wittenberg 2000) or by simulating draws from the Bayesian
posterior of the probability model given some priors. The second is finite legislature uncertainty: if we view a given legislature of e.g. 435 or 650 members
as a draw from a stochastic data generating process, then how much will one
simulated legislature differ from the next due to sampling variation? This is
taken into account by drawing a series of counterfactual legislatures using the
estimated p(Yi |Xi , Θ) rather than by deterministically setting each member of
the counterfactual legislature to E(Yi |Xi , Θ). The third is post-stratification
uncertainty: do we know the exact values of the post-stratification weights or
are they uncertainty in some relevant way? This is taken into account by constructing a probability distribution over Ns , or explicitly modeling the counts.
2 These counts correspond to the weights typically used for post-stratification in the survey
context. Using weights rather than counts would correspond to a hypothetical “infinite”
legislature, where the granularity of individuals is ignored.
3
This type of uncertainty would be important to include if one were modeling the
outcomes of electoral reforms on who will be elected (e.g. Cameron, Epstein,
and O’Halloran 1996). Depending on the application, it may not be necessary
to incorporate each of these types of uncertainty into the simulation, but the
relevance of each to the desired counterfactual should be considered.
3. CONGRESSIONAL POLARIZATION UNDER STATE-LEVEL
PROPORTIONAL REPRESENTATION
As an example of the kind of analysis we propose, we examine how polarization
in the U.S. House of Representatives would differ if state congressional delegations were formed based on party proportional representation (PR) rather than
on district-level plurality results. The basic approach is to model voting behavior by state and party and use post-stratification to estimate counterfactual
outcomes in a legislature in which the number of Republicans and Democrats
in each state delegation reflects state-level voting patterns.
We emphasize that counterfactual exercises of this sort can only partially
capture the likely effects of reforming a system of representation. If congressional
elections were based on state-wide PR, we might expect different candidates to
be nominated and elected, different party vote shares by state, different voting
behavior in the legislature, and different kinds of bills coming up for votes.
The counterfactual scenario we consider does not address any of these possible
indirect effects of changing the current system of representation. Still, such
counterfactual exercises clarify how individual-level behavioral variation relates
to aggregate features of representation (e.g. are moderates under-represented,
and to what extent?) while also giving insight into the first-order effects of
possible reforms.3
We focus on legislators’ DW-NOMINATE scores (Poole and Rosenthal 1997);
we model this as a function of state-party means. Because some states have
single-party delegations, we cannot fit a fully-saturated regression model including all of the state-party interactions; even if we could fit such a model, it might
perform poorly because most delegations are small. Instead, we pool information across different states by modeling the state-party means hierarchically as
a linear function of state-level presidential vote share Pj and congressional vote
share Cj in the preceding election, for each party p. Thus, where j(i) is the
state j of representative i, and r(j) is the region (Northeast, South, Midwest,
West) of state j,
Yi ∼ N αj(i),p , σp
(1)
αj,p ∼ N δr(j),p + β1,p Pj + β2,p Cj , ωk
(2)
This model is a minimal one that linearly relates state-level electoral results
to legislative behavior for each party, with region-specific intercepts. Clearly
3 One can make an analogy to Duverger’s classic distinction between mechanical and psychological effects: a change in the electoral system affects electoral outcomes through both
channels, but studying each in isolation yields insights nonetheless (Duverger 1954).
4
these relationships could be modeled in many ways. We could, for example,
allow nonlinearities in the relationship between electoral outcomes and voting
behavior, or incorporate other predictors of congressional voting behavior such
as measures of the relative locations of parties in state-legislatures (Shor and
McCarty 2011).
For the post-stratification stage of the simulation, we calculate proportional
representation at the state level by applying the D’Hondt method to party vote
shares in the previous congressional election in the state.4 We chose to carry
out the post-stratification step deterministically (i.e. simply applying the formula to fixed electoral results), but one could model election outcomes and use
simulation to incorporate uncertainty into the process of generating the counterfactual legislatures. We then simulate 4,000 legislatures for each Congress
from the 87th to the 112th, incorporating behavioral model uncertainty and
finite legislature uncertainty through the Bayesian posterior simulation of the
model.
In Figure 1 we show the trends in polarization, as measured by the distance between the average Republican and average Democrat. It has been well
documented that polarization has risen over this period (McCarty, Poole, and
Rosenthal 2006). Figure 1 shows that a large increase also would have taken
place under the PR simulation over the same period, but with important differences. First, since about 1995 Congress would been less polarized in our PR
counterfactual: in particular, the gap between the average Democrat and the
average Republican would have been about 5% smaller. (Put differently, the
increase in polarization between 1994 and 2010 would have been about 25%
lower.) Second, between about 1975 and 1995 polarization would have been
about the same in the actual and the counterfactual scenario. Third, before
1975 a hypothetical PR Congress would have been more polarized than the
actual Congress was.
To explain these patterns, consider Figure 2. The left panel shows the average ideal point of Democrats and Republicans by region (South, Northeast,
Midwest, and West) as estimated by our model. It shows that northern Republicans and (especially in the early period) southern Democrats have consistently
been more moderate than the rest of their parties throughout the period we
examine. The right panel shows the extent to which Republicans have been
over-represented (and thus Democrats have been under -represented) in each region over time. The most striking pattern relates to the South (dotted line):
southern Republicans were consistently under-represented compared to PR (and
thus southern Democrats were over-represented) until the early 1990s, at which
point Democrats came to be over-represented. (Republicans also appear to have
been under-represented in the North fairly consistently throughout the whole
4 We
also ran the simulation using presidential vote shares, with similar results. A possible
downside to using congressional results is that some races are uncontested and others are so
lopsided that turnout and results may diverge from voting under a hypothetical PR system.
The presidential and congressional results are most dissimilar in the South of the 1960s,
when Republican presidential candidates were popular but congressional delegations remained
solidly Democratic.
5
1960
1970
1980
1990
2000
2010
0.7
0.8
0.9
1.0
1.1
1.2
1.3
Simulated Effect of PR on Polarization
Simulated Polarization / Actual Polarization
0.6
0.7
0.8
0.9
1.0
Observed Distance
PR Simulation
0.5
Mean Republican − Mean Democrat
1.1
Polarization in
Observed & Hypothetical Congresses
1960
1970
1980
1990
2000
2010
Year
Year
Figure 1: The left plot shows the distance between the average Republican
and average Democrat as measured by DW-NOMINATE score, from the 87th
to the 112th Congress, using the actual Congresses (black) and hypothetical
Congresses elected by PR (blue). The 95% posterior bands around each line
reflect uncertainty in the behavioral model and finite legislature uncertainty.
The right plot shows the simulated effect of switching to PR on distance between
the average Republican and average Democrat.
period, though to a lesser extent.) Combining this pattern with the one shown
in the left panel, we apparently have our explanation for the overall pattern:
addressing disproportionality makes outcomes more polarized in the 1960s primarily by reducing the representation of moderate Democrats from southern
states, while it makes outcomes less polarized since the 1990s by boosting the
representation of moderate Democrats from southern states.
4. CONCLUSION
The statistical methods we have discussed in this paper offer a convenient way to
communicate the implications of models of legislative behavior and to investigate
the impacts of possible institutional reforms, subject to the soundness of our
behavioral model and a number of ceteris paribus assumptions. These methods
also allow us to convey our uncertainty about these implications.
These methods do not, of course, liberate the researcher from the usual difficulties of trying to say something about hypothetical scenarios. The approach
we have highlighted tells us what would happen in a counterfactual legislature in
which legislators behave as they do in reality but the mix of legislators is altered.
Of course, a huge literature on legislative politics tells us that agenda-setting
and legislative voting behavior would change in response to such a change in the
composition of the legislature. Still, counterfactual analysis that holds behavior
6
Disproportion by Region
20
0
−20
Midwest
Northeast
South
West
−40
Excess Republicans vs PR
0.5
0.0
Midwest
Northeast
South
West
−0.5
Mean DW−NOMINATE Score
40
Mean Party Positions by Region
1960
1970
1980
1990
2000
2010
1960
Year
1970
1980
1990
2000
2010
Year
Figure 2: The left panel shows mean party position by region and party; northern Republicans and southern Democrats have consistently been more moderate
than the rest of their party. The right panel shows the degree to which Republicans are over-represented in each region compared to a PR counterfactual;
Democrats tended to be over-represented in the South before the 1990s and
under-represented since then.
fixed can be useful (as in the application we presented) for clarifying the relationship between legislative behavior and the elements of representation that
one wants to vary. One could, of course, carry out counterfactual analysis that
incorporates one’s assumptions about how legislative behavior would respond
to a given change in the system of representation; researchers hoping to do so
would probably want to use an approach incorporating many of the features we
have presented.
7
References
Bump, Philip (2015). What would change if Congress were as lopsidedly female
as it is male? Not much. url: http://www.washingtonpost.com/blogs/
the-fix/wp/2015/03/06/what-would-change-if-congress-were-aslopsidedly-female-as-it-is-male-not-much/.
Cameron, Charles, David Epstein, and Sharyn O’Halloran (1996). “Do MajorityMinority Districts Maximize Substantive Black Representation in Congress?”
In: American Political Science Review 90.04, pp. 794–812.
Carnes, Nicholas (2012). “Does the Numerical Underrepresentation of the Working Class in Congress Matter? Evidence from Roll Call Voting in the House
of Representatives”. In: Legislative Studies Quarterly 37.1, pp. 5–34.
Carnes, Nicholas and Noam Lupu (2015). “Rethinking the comparative perspective on class and representation: Evidence from latin america”. In: American
Journal of Political Science 59.1, pp. 1–18.
Duverger, Maurice (1954). Political Parties: Their Organization and Activity in
the Modern State. Methuen & Company Limited.
Gelman, Andrew and Gary King (1994). “A Unified Method of Evaluating Electoral Systems and Redistricting Plans”. In: American Journal of Political
Science 38.2, pp. 514–554.
Gelman, Andrew and T C Little (1997). “Postratification into Many Categories
Using Hierarchical Logistic Regression”. In: Survey Methodology 23, pp. 127–
135.
King, Gary, Michael Tomz, and Jason Wittenberg (2000). “Making the Most of
Statistical Analyses: Improving Interpretation and Presentation”. In: American Journal of Political Science 44, pp. 341–355.
McCarty, Nolan, Keith T Poole, and Howard Rosenthal (2006). Polarized America: The dance of ideology and unequal riches. Vol. 5. mit Press.
Park, David K, Andrew Gelman, and Joseph Bafumi (2004). “Bayesian Multilevel Estimation with Poststratification: State-Level Estimates from National Polls”. In: Political Analysis 12.4, pp. 375–285.
Poole, Keith T. and Howard Rosenthal (1997). Congress: A Political-economic
History of Roll Call Voting. Oxford University Press, Oxford.
S¨
arndal, Carl-Erik and Sixten Lundstr¨om (2005). Estimation in surveys with
nonresponse. John Wiley & Sons.
Shor, Boris and Nolan McCarty (2011). “The Ideological Mapping of American
Legislatures”. In: American Political Science Review 105.3, pp. 530–551.
Sides, John (2015). What would change if there were more women in Congress?
More than you think. url: http : / / www . washingtonpost . com / blogs /
monkey- cage/wp/2015/03/07/what- would- change- if- there- weremore-women-in-congress-more-than-you-think/.
Simon, Dennis M and Barbara Palmer (2010). “The roll call behavior of men
and women in the US house of representatives, 1937–2008”. In: Politics &
Gender 6.02, pp. 225–246.
8


© Copyright 2026