
Software Design Patterns for Information Visualization Jeffrey Heer and Maneesh Agrawala
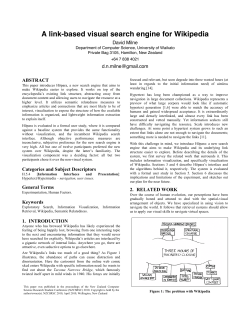
IEEE TRANSACTIONS ON VISUALIZATION AND COMPUTER GRAPHICS, VOL. 12, NO. 5, SEPTEMBER/OCTOBER 2006
Software Design Patterns for Information Visualization
Jeffrey Heer and Maneesh Agrawala
Abstract—Despite a diversity of software architectures supporting information visualization, it is often difficult to identify, evaluate,
and re-apply the design solutions implemented within such frameworks. One popular and effective approach for addressing such
difficulties is to capture successful solutions in design patterns, abstract descriptions of interacting software components that can
be customized to solve design problems within a particular context. Based upon a review of existing frameworks and our own
experiences building visualization software, we present a series of design patterns for the domain of information visualization. We
discuss the structure, context of use, and interrelations of patterns spanning data representation, graphics, and interaction. By
representing design knowledge in a reusable form, these patterns can be used to facilitate software design, implementation, and
evaluation, and improve developer education and communication.
Index Terms—Design patterns, information visualization, software engineering, object-oriented programming
1
INTRODUCTION
As recognition of the value of visualization has increased and the
demand for visual analytics software has risen, visualization
researchers have developed numerous software frameworks to meet
these needs. By changing the cost structure governing the design and
implementation of visualizations, such frameworks carry the
potential to lower barriers to entry and increase the space of feasible
visualization designs. Still, there is never a single tool or framework
that is appropriate for all problems in a given domain. Developers
often migrate between tools (e.g., when developing on a new
platform) or build their own systems (e.g., to achieve functionality
not available elsewhere). In either case, an understanding of the
design solutions employed within existing tools could aid the
programmer in learning and evaluating other frameworks and
furthering their own development efforts. However, inspection of
source code and design documents, if available, can prove difficult
and tedious. Descriptions in the research literature often place more
emphasis on novel features than on recurring design patterns. As a
result, it can be difficult to identify, evaluate, and re-apply the design
solutions implemented within existing frameworks.
Similar issues permeate any discipline steeped in design.
Originally developed by Christopher Alexander and his colleagues in
architecture [2], design patterns have proven to be a useful means of
capturing time-tested design solutions and facilitating their reuse.
Patterns aim to explicitly represent design knowledge that is
understood implicitly by skilled practitioners.
Perhaps nowhere has the pattern approach been more effective
than in software engineering. Gamma et al. [13] describe software
design patterns as “descriptions of communicating objects and
classes that are customized to solve design problems within a
particular context.” Such patterns document object-oriented software
design solutions in a fashion independent of specific programming
languages. Patterns typically consist of a name, a purpose, a
description of when and why to apply the pattern, structural
diagrams, examples of use, and a discussion of interactions with
other patterns.
• Jeffrey Heer is with the Computer Science Division of the University of
California, Berkeley. E-Mail: [email protected].
• Maneesh Agrawala is with the Computer Science Division of the
University of California, Berkeley. E-Mail: [email protected].
Manuscript received 31 March 2006; accepted 1 August 2006; posted
online 6 November 2006. For information on obtaining reprints of this
article, please send e-mail to: [email protected].
Schmidt [18] has noted a number of benefits gained from
incorporating design patterns into the development process. He
found that patterns enabled widespread reuse of software architecture
designs, improved communication within and across development
teams, facilitated training of new programmers, and helped transcend
ways of thinking imposed by individual programming languages.
Schmidt also recommends that practitioners focus on developing
patterns that are strategic to a domain of interest, while reusing
general-purpose patterns (e.g., those of [13]) as much as possible—
an approach we now adopt for the design of information
visualization software.
Previous research has applied the design pattern approach to
visualization problems. Stolte et al. [21] introduce design patterns
describing different forms of zooming within multi-scale
visualizations. Chen [7] takes a more ambitious approach, suggesting
high-level visualization patterns addressing general visualization
concerns. He lists patterns such as Brushing, Linking, and Encoder,
the latter encompassing in a single pattern the visual encoding
principles (e.g., use of spatial position, color, size, and shape)
advocated by Bertin [4], Cleveland [10], Mackinlay [17], and others.
In contrast, this paper considers patterns at a lower level of
abstraction, building upon the approaches of Gamma et al. [13] and
Schmidt [18] to focus specifically on software design patterns for
information visualization applications. We present a set of twelve
design patterns that have proven themselves in existing visualization
frameworks, spanning issues of application structure, data handling,
graphics, and interaction. The patterns were chosen based upon a
review of existing frameworks and our own experiences building
prefuse [14], an open source toolkit for building interactive
visualizations. As Schmidt warns [18], not everything should be cast
as a pattern, even if it is possible to do so. We have attempted to
select only those patterns whose recurrence and/or significance
warrants their inclusion.
2
DESIGN PATTERNS
We describe a set of twelve design patterns for information
visualization software. Each pattern consists of a name, a summary
description (in italics), and a more detailed description describing the
context of use, examples, and relations to other patterns. Each pattern
is also accompanied by a structural diagram that uses the
conventions of Gamma et al. [13] to depict the classes and the
relations between them, such as inheritance, reference, and
aggregation. Figure 1 provides a legend for interpreting the structural
diagrams. The structural diagrams do not specify full-blown
implementations; they provide an abstracted view to communicate
the essence of the pattern.
IEEE TRANSACTIONS ON VISUALIZATION AND COMPUTER GRAPHICS, VOL. 12, NO. 5, SEPTEMBER/OCTOBER 2006
Figure 1. Structural diagram legend. Classes are depicted as boxes,
potentially listing attributes and method signatures. Abstract classes are titled
using italics. Arrows indicate relationships between classes. These relations
include inheritance, denoted by a large empty triangle; object reference,
denoted by an unadorned arrow; aggregation, denoted by a diamond base; and
creation, denoted by a dotted, labeled arrow. A circle at the arrow endpoint
indicates a 1-to-many relation. Notes, depicted as a box with a folded corner,
are used to communicate implementation information in pseudocode.
2.1
Reference Model
Separate data and visual models to enable multiple visualizations of
a data source, separate visual models from displays to enable
multiple views of a visualization, and use modular controllers to
handle user input in a flexible and reusable fashion.
Information visualization application development requires
balancing issues of data management, visual mappings, computer
graphics, and interaction. Determining the right separation of
concerns has serious consequences for the complexity, extensibility,
and reusability of software architectures. The Reference Model
pattern provides a general template for structuring visualization
applications that separates data models, visual models, views, and
interactive controls.
specifying concrete classes. Update notifications can be passed
between objects using the Observer (or Listener) pattern [13]. For
example, Views can listen for update events issued by the
Visualization. Control objects represent components in a Strategy
pattern [13], as each represents a strategy for handling user input that
can be added or removed at run-time. Each of the remaining patterns
presented in this paper also contribute to the implementation of this
model.
2.2
Data Column
Organize relational data into typed data columns, providing flexible
data representations and extensible data schemas.
The most common data representation used in visualization is the
relational model or “data tables” [6], with a table row representing a
single data record (also called a relation or tuple) and table columns
representing individual data fields. The description of a table’s
column structure, including each column’s name and its contained
data type, is called a schema. Database management systems
regularly store relational data in row-major order, as keeping the
contents of a relation in a contiguous block helps minimize disk
usage when evaluating queries. Information visualization systems,
however, primarily manage data sets in main memory and are faced
with the design decision of internally grouping data by row or by
column.
A row-based approach has the advantage of treating data records
as individual objects, enabling easy grouping and sorting of
relations. A column-based approach, however, often simplifies data
management. Columns can be added and removed more easily, and
columns can be shared across tables, facilitating data reuse. Each
column can implement its own data management policy to more
efficiently store data. When representational flexibility and
extensible schemas are needed, the Data Column pattern can be
applied to implement column-based relational tables.
Figure 2. The Reference Model Pattern. A visualization manages visual
models for one or more data sets, separating visual attributes (location, size,
color, geometry, etc) from the abstract data. One or more views provide a
graphical display of the visualization, while control modules process user input
and may trigger updates at any level of the system.
The structure of the Reference Model pattern is shown in Figure
2. A DataSource component, such as a formatted file reader or a
database connectivity interface, loads data sets to be visualized. One
or more data sets can then be registered with a visualization. This
mechanism allows abstract data to be separated from visual attributes
such as location, size, shape, and color, thereby allowing a single
abstract data set to be used in multiple visualizations. A common
approach is to create visual items: lightweight components
representing an interactive visual object in the visualization.
The Visualization, View, and Control classes employ the
standard Model–View-Controller (MVC) pattern [16] of user
interface development. A visual model can be shown in one or more
views, with user input processed by controls that can affect change at
any level of the system. One way of interpreting this pattern is as a
tiered version of MVC, with the model divided into separate
abstractions for the data and visual properties.
The Reference Model pattern has been widely used and
advocated. Both Chi et al’s data state model [8] and Card et al’s
infovis reference model [6] proscribe the use of this pattern. In their
exploration of design choices for architecting visualizations, Tang et
al. [22] also discuss the importance of separating data and visual
models. Finally, numerous software frameworks adopt this template
of application structure, including Advizor [11], Improvise [23],
Polaris [20, 21], prefuse [14], and SAS/JMP [7].
The Reference Model pattern provides a high-level template for
application design whose implementation can be informed by other
patterns. The DataSource components may use the Abstract Factory
or Factory Method patterns of [13] to instantiate objects without
Figure 3. The Data Column Pattern. Relational data tables are implemented
as a collection of column objects. Data columns encapsulate data representation
and can be shared among tables, propagating value updates using the Observer
pattern [13]. A factory pattern can be used to facilitate column creation.
The structure of the Data Column pattern is shown in Figure 3.
Tables are represented as an aggregation of column objects. Column
objects can be shared across multiple tables, with update
notifications provided to each enclosing table. Data representation
strategies can vary by column (an instance of the Strategy pattern
[13]). For example, integers might be stored in an array, boolean
values in a compact bit vector, while sparse data representations
could be applied in situations of low data density. Furthermore, table
schemas can be modified with little overhead, by simply adding or
removing column instances from the table.
Tables can handle column access in multiple ways. Data columns
can be referenced by number (using an array look-up) or by name
(using an associative map). It is also useful to include a row
manager, which tracks the currently occupied rows and, if needed,
maintains a map between table row numbers and column row
numbers. These numbers may differ if filtered tables are supported, a
possibility discussed later (§2.3). A row manager can also be used to
track added and deleted rows, supporting dynamic tables by reusing
memory occupied by a deleted row.
The Data Column pattern has been applied in many visualization
frameworks, including Advizor [11], the InfoVis Toolkit [12],
prefuse [14], and SAS/JMP [7]. However, row-based frameworks
such as Polaris [20] are more amenable to tasks such as sorting and
HEER ET AL.: SOFTWARE DESIGN PATTERNS FOR INFORMATION VISUALIZATION
grouping table rows. Creating sorted indices of column values
relieves some of these issues. An additional solution is to apply the
Proxy Tuple pattern (§2.5), creating an object-oriented interface to
individual table rows. Finally, the Abstract Factory or Factory
Method patterns [13] can be applied to instantiate polymorphic data
columns based on criteria such as data type and sparsity.
2.3 Cascaded Table
Allow relational data tables to inherit data from parent tables,
efficiently supporting derived tables.
In many cases, it is necessary to extend the contents of a table
without modifying it. A motivating example is the creation of visual
abstractions, which add visual attributes such as location, color, size,
and shape to an existing data model. In accordance with the
Reference Model pattern, a separation between the visual data and
the original data should be maintained. Another example is the
creation of small multiples displays, which might vary a single visual
property such as color across each display. It is desirable to reuse the
remaining properties across each of the display models and
coordinate updates to these properties. The Cascaded Table pattern
provides a solution to this problem for relational data by extending
an existing table without modifying it.
Figure 4. The Cascaded Table Pattern. A cascaded table inherits values
from a parent table instance. The cascaded table may manage its own set of
data columns, potentially shadowing columns in the parent. Column references
not found in the child table are resolved against the parent table.
The structure of the Cascaded Table pattern is shown in Figure 4.
A CascadedTable subclasses Table and also maintains a reference to
a parent table. If a requested column is not found in the child table,
the request is forwarded to the parent. CascadedTables may contain
data columns that shadow columns in the parent table. For example,
adding a new column with the same name as a column in the parent
will override access to the parent’s column. Update notifications are
relayed from parent tables to child tables, achieving coordination
between parent and child. By extending a parent table with
additional data, the Cascaded Table pattern is an example of Gamma
et al’s Decorator pattern [13].
Proper use of the Cascaded Table pattern requires a row manager
that maps between the rows of the child table and its parent table.
Such management is especially useful when cascaded tables provide
filtered views of the parent. For example, clients might specify a
filter predicate to limit the rows accessible from the cascaded table
(see the Expression pattern in §2.6).
The Cascaded Table pattern is used extensively in the prefuse
visualization toolkit [14] to form visual abstractions, decorating a
data set with visual properties. The resulting cascaded table provides
easy access to both visual properties and the underlying data through
a unified interface. Cascaded tables are also applied to create derived
visual tables that override only a subset of visual properties, enabling
reuse both within a display (e.g., adding labels onto shapes) or across
displays (e.g., the small multiples example discussed earlier).
2.4
Relational Graph
Use relational data tables to represent network structures,
facilitating data reuse and efficient data processing.
Second to relational data tables, network structures such as
graphs and trees are amongst the most common data structures used
in information visualization. These structures are typically
implemented in an object-oriented fashion, with node objects storing
adjacency lists of connected node and edge objects. However, in
visualization frameworks this representation creates an incongruity
between network and table data structures and sacrifices benefits of
relational data management (e.g., optimized query processing). The
Relational Graph pattern addresses the issue by implementing
network structures using relational data tables. Relational graph
structures allow the machinery of relational tables to be used on
network data and enable a level of data reuse unsupported by the
typical object-oriented model.
Figure 5. The Relational Graph Pattern. Network structures are
implemented using relational data tables to represent node and edge data. Edge
tables maintain foreign keys which reference incident nodes.
The structure of the Relational Graph pattern is shown in Figure
5. A network structure such as a graph or tree can be represented
using a set of tables. Each table stores the various data attributes of
nodes and edges in the network. The edge table additionally
maintains columns referencing source and target nodes, storing
identifiers (called foreign keys) that map into a node table. This
model mirrors the standard format of linked structures within
relational database management systems. Tree structures can enforce
topological constraints on the edge table, allowing only parent/child
relationships. Multiple node tables may be used to model partite
graphs or nodes with varying data schemas. In these cases, separate
edge tables can be used to record edges between each pair of node
tables.
There are numerous advantages to the relational graph approach.
First, it helps unify data representation issues in multi-purpose
visualization frameworks. Machinery for processing and
manipulating relational tables can be applied to network data,
including query processing, creation of derived columns (e.g., using
the Expression pattern, §2.6), and the use of Cascaded Tables (§2.3).
The same node table can be reused across multiple graphs, while
edge data can be swapped in and out of an existing graph.
Furthermore, this representation directly maps to the format
commonly used in database systems, facilitating visualization of
network data stored in a relational format.
However, use of the Relational Graph pattern does introduce new
obstacles. First is the issue of performance, particularly for traversing
the graph structure. Properly indexing the key fields can significantly
improve performance, but involves an overhead that may be
unacceptable for large graphs. As a result, Relational Graph
implementations often include acceleration structures. The InfoVis
Toolkit [12] adds auxiliary columns to node and edge tables,
maintaining references to “next” and “previous” edges and storing
statistics such as node degrees. Prefuse [14] maintains a separate
table within the Graph object, storing adjacency lists and node
statistics. Finally, the Relational Graph pattern replaces the familiar
object-oriented model of graphs, potentially complicating
programming tasks. This deficit can be addressed using the Proxy
Tuple pattern (§2.5).
2.5
Proxy Tuple
Use an object-relational mapping for accessing table and network
data sets, improving usability and data interoperability.
While patterns such as Data Column (§2.2) and Relational Graph
(§2.4) improve efficiency, reusability, and extensibility, they
introduce abstractions more complicated than the naïve approaches
they replace. In particular, working with table relations and graph
nodes and edges as simple objects is a more familiar and intuitive
model to many programmers. The Proxy Tuple pattern provides a
solution to this problem, using an object-relational mapping to
IEEE TRANSACTIONS ON VISUALIZATION AND COMPUTER GRAPHICS, VOL. 12, NO. 5, SEPTEMBER/OCTOBER 2006
provide a simple interface for accessing, manipulating, grouping, and
reordering table and graph data.
The structure of the Proxy Tuple pattern is shown in Figure 6.
Instead of accessing table or graph data directly, Tuple instances
constitute a proxy object that allows programmers to work with
rows, nodes, and edges as simple objects. A Proxy Tuple is a
lightweight object storing its row number and references to backing
data sets—a table and, if appropriate, a graph. Tuples also provide
methods for accessing and manipulating underlying data. Tuple
instances can be sorted irrespective of their ordering in the backing
table, and can be aggregated and grouped as desired, even combining
Tuples from different tables or graphs. Tuples can be created by and
stored within a tuple manager associated with the backing table or
graph. The manager initializes Tuples as needed and invalidates
them when records are deleted.
Figure 6. The Proxy Tuple Pattern. Tuples provide an object-oriented proxy
for accessing a row of table data. The Node and Edge subclasses play a similar
role for graphs, also enabling traversal of the network structure.
Proxy Tuples can also be used to improve data safety. Consider
the case of using an integer value to refer to a table row. If that row
is deleted and then later repopulated by a newly inserted row, access
using the stored row number will not result in an exception and
operations may carry unexpected consequences. A Proxy Tuple,
however, can be invalidated immediately upon deletion of its
backing row, preventing future access through that object and thus
promoting data consistency.
The Proxy Tuple pattern is used throughout the prefuse
visualization toolkit [14] to manage both abstract data elements and
visual items displayed in a visualization. By providing a simplified
interface to a complex subsystem, Proxy Tuple applies the Facade
pattern of [13]. Tuple managers associated with a table or graph can
employ the Factory Method pattern [13] to control the concrete types
of instantiated tuples.
2.6
Expression
Provide an expression language for data processing tasks such as
specifying queries and computing derived values.
Many visualization frameworks require a basic level of database
functionality. Either programmers or end-users may need to specify
queries or calculate derived measures from existing data fields. By
including an Expression language, a visualization framework can
support such functionality in a general fashion that can be
reconfigured at run-time.
The structure of the Expression pattern is shown in Figure 7. The
pattern is a direct application of Gamma et al’s Interpreter pattern
[13], customized for data processing needs. Language statements are
represented as a tree of Expression objects that perform calculations
over data elements. Common expression objects include literal
values, arithmetic or comparison operations, and data field
references. A Predicate is a special type of Expression that returns
values of type boolean.
Figure 7. The Expression Pattern. Expression language statements are
constructed as a tree of processing objects. Expressions perform calculations
over data elements and return the result. Predicate expressions returning values
of type boolean can be used to specify queries.
Invocation of an expression causes recursive invocation of subexpressions, with resulting values propagating up the expression tree
to calculate the final result. Expressions may be used to specify
selection queries (as Predicate expressions), create derived data
fields (e.g., using a concrete Data Column (§2.2) instance that refers
to an Expression instance), or perform other data processing tasks.
The structural diagram depicts Expressions that take a single tuple as
input. Single tuple expressions are sufficient for a range of useful
calculations, though expanded contexts may be desired, for example
to compute joins across tables.
Operations upon the expression tree itself can also be of great
use. For example, traversals of the tree can be used to identify
referenced data fields, compute optimized query plans for a
Predicate, or print a text representation of the expression (also useful
for generating queries to external databases). Such operations could
be encapsulated within objects in accordance with Gamma et al’s
Visitor pattern [13].
There are multiple means of constructing an expression tree.
Individual objects can be manually instantiated and assembled into
the expression tree. An ExpressionParser can be provided to compile
text strings written in a textual expression language into the tree of
objects. This approach is used in both Polaris (now Tableau) [20]
and prefuse [14]. Another possibility, used in the Improvise
framework [23], is to graphically represent the expression tree and
allow users to edit expressions in a direct manipulation fashion.
2.7
Scheduler
Provide schedulable activities for implementing time-sensitive,
potentially recurring operations.
Dynamic visualizations often make use of time-sensitive,
recurring operations. The most common example is animation,
which requires updating visual properties and redrawing the display
at regular time intervals, usually over a specified duration. Other
examples include time-sensitive responses to user input and
computations bounded to a specified time duration (e.g., an iterative
graph layout). The Scheduler pattern provides a solution that enables
time sensitive operations and supports extensibility.
Figure 8. The Scheduler Pattern. Activity instances are registered with a
centralized scheduler that runs the activities over a specified time interval,
repeatedly running the activity at requested time steps.
HEER ET AL.: SOFTWARE DESIGN PATTERNS FOR INFORMATION VISUALIZATION
The structure of the scheduler pattern is shown in Figure 8.
Custom operations are created by subclassing the abstract Activity
class and implementing the “run” method (an example of the
Template Method pattern [13]). An Activity has a specified start
time, a duration, and a step time defining the desired length of time
to wait between repeated invocations. The run method takes as a
single argument a fractional value between zero and one that
indicates the progress of the Activity within its duration. This value
can increase linearly as time elapses or can be modified through the
use of a pacing function. Slow-in, slow-out animation can be
achieved using a pacing function with a sigmoidal shape.
The Scheduler pattern has been used extensively in visualization
and user interface frameworks. The Information Visualizer [5]
included a “governor” that oversaw animation and adjusted the level
of detail when activities took longer than desired. Hudson and Stasko
[15] used the Scheduler pattern to provide animation within the
Artkit user interface toolkit, introducing the use of pacing functions.
More recent frameworks, including Piccolo [3] and prefuse [14], use
the pattern.
An important issue in implementing the Scheduler pattern is
choosing how to handle concurrency. A common approach is for the
Scheduler’s dispatch loop to run in a dedicated thread. The Piccolo
toolkit takes a different approach. Its scheduler runs within the user
interface event loop, resulting in a single-threaded model that frees
programmers from explicitly handling concurrency issues. However,
this approach carries the drawback that greedy activities with longrunning “run” methods will leave all user interface components
unresponsive, regardless of their relation to the visualization. Prefuse
attempts a compromise between these models, maintaining a
separate scheduling thread but performing automatic locking in both
input controllers and schedulable visualization operators to help
shelter programmers from concurrency issues.
2.8
Operator
Decompose visual data processing into a series of composable
operators, enabling flexible and reconfigurable visual mappings.
When designing object-oriented visualization software,
developers must decide upon the appropriate level of granularity for
the visualization components of their system. Visualization
frameworks such as Advizor [11] and the InfoVis Toolkit [12] adopt
a model similar to traditional user interface toolkits, encapsulating
different visualization designs into monolithic “widgets”. The result
is a library of interactive components such as scatterplots, time-series
charts, or treemaps that can be directly instantiated and then added to
the user interface. Creating new visualizations requires subclassing
existing widgets or writing entirely new components. An alternative
approach is to target a finer level of granularity using an Operator
pattern. The idea is to deconstruct visualization tasks into
composable operators whose configuration can be modified at runtime. Example operators include layout algorithms, visual encodings,
and distortion techniques. New visualizations can be constructed by
composing existing operators and/or introducing new operators,
facilitating reuse at the level of individual visualization techniques.
The prefuse toolkit [14], for example, includes a demonstration of
composing layout operators to create custom hybrid layout schemes.
Operators also simplify many customization tasks, allowing clients
to directly modify the set of operators that constitute the
visualization.
The structure of the Operator pattern is shown in Figure 9. The
basic structure is intentionally quite simple. An operator has a single
required method that performs the operation (an instance of the
Template Method pattern [13]), simplifying the creation of new,
general-purpose operators. An operator performs processing on a
Visualization instance. Operators may maintain a reference to the
Visualization (as pictured), or have the Visualization passed as a
parameter to the “operate” method (if stateless operators are desired).
An individual operator may have any number of additional
parameters, depending on its function. For example, a color encoder
might include a color palette used to determine color values of items
retrieved from the visualization. Operators can be aggregated into
composites, enabling sequential batch execution or conditional
evaluation of operators.
Figure 9. The Operator Pattern. Operators are modules that perform a
specific processing action, updating the contents of a visualization in accordance
with a data state model [8]. Possible operators include visual encodings (for
size, shape, color, etc), spatial layout algorithms, visibility filters, and animated
interpolation. Composite operators aggregate individual operators to enable
sequential or conditional execution.
Operators may be implemented as Activity instances in the
Scheduler pattern (§2.8), enabling time-sensitive or recurrent
invocation. Once schedulable, operators can additionally be used to
implement animated transitions, as done within the prefuse toolkit
[14]. Operators can also employ Expressions (§2.6). For example, a
Predicate could be used to select a group of visual items for the
operator to process. It is possible to implement operators within the
Expression language itself, an approach partially supported in
Improvise [23].
As described here, the use of operators fits squarely within the
data state model defined by Chi [8]. The operators act upon the
visualization, whose state updates as a result. Another variant of the
operator pattern is the data flow model. Data flow operators have
specific input and output types and are chained together in directed
acyclic graphs to define processing flows. This approach is used in a
number of 3D visualization frameworks, including the Visualization
Toolkit [19]. Chi [9] has demonstrated that applications written in
one model can be equivalently formulated in the other. We focus on
the data state model due to its greater prevalence in information (as
opposed to scientific) visualization.
2.9
Renderer
Separate visual components from their rendering methods, allowing
dynamic determination of visual appearances.
Standard user interface toolkits use a component or “widget”
model, in which interactive components are represented as individual
objects responsible for drawing themselves and handling user input.
Typically, such components include a “paint” method that issues the
drawing commands for rendering the object onscreen. Changing the
appearance of a component often requires subclassing that
component and overriding the paint method. This approach is
common in many visualization frameworks. For example, each
visual item in the Piccolo toolkit [3] has its own paint method, and
each visualization provided by the InfoVis Toolkit [12] is
implemented as a stand-alone widget. This approach has the
advantages of low overhead, familiarity, and simplicity. However, it
also limits dynamic changes in appearance. For example,
implementing a semantic zoom in the standard model requires either
(1) creating entirely new sets of objects and swapping them based on
the current zoom level or (2) creating a subclass with a custom paint
method that explicitly handles each zoom level. The Renderer
pattern solves this problem by decoupling the representation of a
visual item from its rendering, enabling dynamic, run-time changes
in visual appearance.
The structure of the Renderer pattern is shown in Figure 10.
Rendering of visual items is performed by dedicated, reusable
modules responsible for mapping the item’s visual attributes into
actual pixels. Renderers perform the view transformation step of
Card et al’s infovis reference model [6]. In addition to a drawing
IEEE TRANSACTIONS ON VISUALIZATION AND COMPUTER GRAPHICS, VOL. 12, NO. 5, SEPTEMBER/OCTOBER 2006
routine, a Renderer should also provide access to the pixel-level
geometry, testing if a given point is contained within the item (useful
for identifying when an item is underneath the mouse pointer), and
calculating bounding boxes. Visual items might contain a direct
reference to their current Renderer, or, as illustrated in Figure 10, a
RendererFactory can be used. The RendererFactory dynamically
assigns Renderers to items based on current conditions. The
Renderer pattern supports extensibility through the introduction of
new Renderers.
Figure 10. The Renderer Pattern. The mapping between items and their
visual appearance is determined using Renderer modules, responsible for
drawing, interior point testing, and bounds calculation. A RendererFactory can
be used to assign Renderers to items based on current conditions, such as data
attribute values or the zoom level.
Modular renderers have been applied in various frameworks to
allow clients to extend or change rendering behaviours of provided
widgets. For example, the Java Swing user interface toolkit uses a
Renderer pattern to allow clients to specify the rendering behavior of
individual items within Swing JTable and JTree widgets. The prefuse
toolkit [14] uses the Renderer pattern for drawing visual items, using
a RendererFactory to dynamically assign Renderers to visual items.
The Renderer pattern can also be used in conjunction with other
patterns. RendererFactory instances can apply the Production Rule
pattern (§2.10) to provide customizable rule sets for Renderer
assignment. By pooling and reusing individual Renderers for use
with any number of items, a RendererFactory applies the Flyweight
pattern [13].
Rule sets can begin with a default value; new conditions and values
can then be added to handle special cases. The result is a dispatching
structure employing Gamma et al’s Chain of Responsibility pattern
[13]. Production rules can be modified at run-time, allowing the rule
set to change while an application is running, possibly as a result of
user interaction. As formulated here, the implementation of
Production Rule uses predicate objects to encapsulate the rule
conditions. When used in conjunction with the Expression pattern
(§2.6), not only the predicates, but the entire rule structure may be
implemented using expression constructs (i.e., using “if” statements).
Other visualization software patterns can benefit from the use of
production rules. An implementation of the Renderer pattern (§2.9)
may use production rules to assign renderers to visual items. The
Operator pattern (§2.8) can use production rules for visual encoding
operators. For example, a color encoding might use a production rule
that evaluates to a specific color value in one condition (e.g., a color
indicating a mouse-over event) but to a delegate color encoding by
default (e.g., a nominal color encoding based upon a data attribute).
Both of these approaches are used within the prefuse toolkit [14].
2.11 Camera
Provide a transformable camera view onto a visualization,
supporting multiple views and spatial navigation of data displays.
Spatial navigation operations, such as panning and zooming, are
often used to explore large data sets. Such techniques are often
applied in conjunction with multiple views, for example to create
overview+detail displays. A common approach to implementing
such functionality is to treat the data display as a camera within the
geometric space of the visualization. Moving, zooming, or rotating
the camera accordingly changes the viewpoint seen by users.
Multiple cameras can be used with a single visualization, enabling
multiple views with unique perspectives.
2.10 Production Rule
Use a chain of if-then-else rules to dynamically determine visual
properties using rule-based assignment or delegation.
In many design scenarios, a designer may specify numerous
default settings and then override these settings to deal with special
cases. For example, Cascading Style Sheets (CSS) are a widely-used
technology enabling web designers to specify document properties
such as typeface, color, and alignment and then override these
settings as needed. Special cases could include custom settings for a
particular class of document elements or events such as a mouse
over. Similar needs arise in visualization software. For example, a
particular color encoding may be desired by default, but overridden
in special cases such as user interaction or inclusion in search results.
Writing a custom color encoding to handle these cases would be an
inefficient use of time and unnecessarily bloat the software with
more class definitions. The Production Rule pattern provides a
flexible solution to this need.
Figure 11. The Production Rule Pattern. A series of nested rules can be
used to return individual values that meet desired conditions.
The structure of the Production Rule pattern is shown in Figure
11. Given a data item (e.g., a Tuple instance) as input, a rule set tests
the data item against the conditions and returns a matching value.
Figure 12. The Camera Pattern. A view component maintains an affine
transformation matrix that is applied to visual items when rendering. The affine
transform matrix can be used to specify translation, rotation, scale, and shearing
transformations on the geometry of the view.
The structure of the Camera pattern is shown in Figure 12. A
view instance (a user interface component providing a graphics
canvas) maintains an affine transformation matrix describing the
current position, scale, and orientation of the camera view. When the
display draws itself, all graphics operations are subject to this
transform. As most modern 2D and 3D graphics libraries allow
transformation matrices to be applied directly to a graphics context,
this can be implemented in a straightforward way. Multi-view
displays are created by instantiating any number of view components
and setting their transforms.
The camera pattern has a long history of use in graphics libraries
such as OpenGL and is found in nearly any framework that supports
geometric zooming, such as Piccolo [3] and prefuse [14]. One
limitation of the pattern is that it only supports affine geometric
transformations. Non-geometric techniques, such as semantic
zooming, can instead be implemented by changing the rendering
behavior of visual items in response to the transform settings.
Dynamic rendering behavior can be implemented in a modular and
extensible manner using the Renderer pattern (§2.9). Animated view
transitions can be achieved using the Scheduler pattern (§2.7);
activity instances can incrementally update the view transformation
and trigger repaints.
HEER ET AL.: SOFTWARE DESIGN PATTERNS FOR INFORMATION VISUALIZATION
2.12 Dynamic Query Binding
Allow data selection and filtering criteria to be specified
dynamically using direct manipulation interface components.
Dynamic queries are a central technique in information
visualization, allowing users to refine a data view through direct
manipulation [1]. Any number of user interface widgets, such as
sliders, range sliders, checkboxes, and text boxes may be used to
input query conditions. The Dynamic Query Binding pattern
describes the mechanisms by which one can easily create one or
more widgets bound to a general-purpose query predicate,
automatically updating both the predicate and any other bound
components when interaction occurs.
The structure of the Dynamic Query Binding pattern is shown in
Figure 13. As pictured, a particular data set and a field of interest are
used as input to a dynamic query binding that maintains both a
selection predicate and a data model. The data model participates in
a Model-View-Controller pattern [16] and provides coordinated state
for any number of dynamic query widgets. The concrete
implementation of the model might store a bounded range of values,
a list of selected items, or a textual search query. By providing
Factory Methods [13], the dynamic query binding can instantiate and
configure user interface widgets at the client’s request. For example,
a range query binding might provide methods for creating
appropriately configured range sliders. As users interact with these
widgets, changes to the data model result in notifications to the
dynamic query binding, which then updates the query predicate.
Other observers can in turn be notified of changes to the predicate
and take action accordingly. By explicitly representing query criteria
as a predicate (possibly applying the Expression pattern, §2.6),
dynamic queries can be used in a very general fashion. The predicate
could be used to control item visibility, as is typically done, or as
criteria for any number of alternative visual encoding or data
processing operations.
3
REFERENCES
[1]
Figure 13. The Dynamic Query Binding Pattern. Given a data set and data
field as input, a dynamic query binds a selection predicate to a data model. The
data model can be used as the backing state for any number of user interface
widgets. The binding also serves as a factory for creating and configuring an
appropriate set of dynamic query widgets.
Although most infovis frameworks provide support for dynamic
queries, not all implement them in full generality. Some frameworks,
such as the InfoVis Toolkit [12], do not provide generalized query
predicates and so instead must update data structures directly,
reducing the applicability of the pattern. An implementation might
also forego using the Factory Method pattern, instead requiring
clients to instantiate and configure the user interface widgets on their
own. Alternatively, one might maintain a single instantiated widget
instead of a backing model. By maintaining a backing data model,
the general form of the pattern supports any number of coordinated
components. Various widgets can be generated from a single binding
and incorporated into different parts of an interface. All affect the
same query predicate and simultaneously update in response to
changes originating at any of the other bound widgets.
CONCLUSION
While many of the patterns presented can be fruitfully applied in
isolation, it is often in the relationships among patterns that their
greatest value is realized. For example, combining the Scheduler
(§2.7) and Operator (§2.8) patterns enables the creation of reusable
animation operators, while combining the Relational Graph (§2.4)
and Proxy Tuple (§2.5) patterns provides a programmer-friendly
interface to a powerful and flexible data representation. Figure 14
provides a partial illustration of the relationships between the
patterns discussed in this paper, including both the proposed
visualization patterns and related patterns from Gamma et al. [13].
The figure provides a roadmap to applying patterns in a holistic
fashion.
Given the limited format of this paper, a great deal of discussion
and a rich space of examples had to be curtailed. Each pattern
warrants a longer discussion than we have provided here. In addition,
some candidate patterns have been left out. For example, the
Scenegraph abstraction used in 3D toolkits such as VTK [19] and 2D
toolkits such as Piccolo [3], can be usefully described in a pattern
format. We would also note that observing patterns within real world
source code plays an important part in understanding the value of
pattern-infused design. Interested readers may wish to explore one or
more of the visualization frameworks freely available online,
including Improvise [23], the InfoVis Toolkit [12], Piccolo [3],
prefuse [14], and the Visualization Toolkit [19].
Finally, we reiterate that patterns are not static entities, but
evolving descriptions of best practices. We make no claims as to the
finality or completeness of the patterns presented here, only to their
observed effectiveness in visualization contexts. We look forward to
these and other patterns being proposed, challenged, refined, and
applied.
Ahlberg, C., C. Williamson, and B. Shneiderman. Dynamic Queries for
Information Exploration: An Implementation and Evaluation. ACM
Human Factors in Computing Systems (CHI), 1992.
[2] Alexander, C., S. Ishikawa, M. Silverstein, M. Jacobson, I. FiksdahlKing, S. Angel. A Pattern Language: Towns, Buildings, Construction.
Oxford University Press. 1977.
[3] Bederson, B. B., J. Grosjean, J. Meyer. Toolkit Design for Interactive
Structured Graphics. IEEE Transactions on Software Engineering,
30(8): 535-546. 2004.
[4] Bertin, J. Semiology of Graphics: Diagrams, Networks, Maps.
translated by W. J. Berg. University of Wisconsin Press. 1983.
[5] Card, S. K., J. D. Mackinlay, G. G. Robertson, The Information
Visualizer: An Information Workspace. ACM Human Factors in
Computing Systems (CHI), 1991.
[6] Card, S. K., J. D. Mackinlay, B. Schneiderman (eds.). Readings in
Information Visualization: Using Vision To Think. Morgan-Kaufman,
1999.
[7] Chen, H. Towards Design Patterns for Dynamic Analytical Data
Visualization. Proceedings Of SPIE Visualization and Data Analysis,
2004.
[8] Chi, E. H., J. T. Riedl. An Operator Interaction Framework for
Visualization Systems. IEEE Symposium on Information Visualization
(InfoVis), 1998.
[9] Chi, E. H. Expressiveness of the Data Flow and Data State Models in
Visualization Systems. Advanced Visual Interfaces (AVI), 2002.
[10] Cleveland, W. S., R. McGill. Graphical Perception: Theory,
Experimentation, and Application to the Development of Graphical
Methods. Journal of the American Statistical Association, 79(387): 531554. September 1984.
[11] Eick, S. G. Visual Discovery and Analysis. IEEE Transactions on
Visualization and Computer Graphics, 6(10). January 2000.
[12] Fekete, J.-D. The InfoVis Toolkit. IEEE Symposium on Information
Visualization (InfoVis), 2004.
IEEE TRANSACTIONS ON VISUALIZATION AND COMPUTER GRAPHICS, VOL. 12, NO. 5, SEPTEMBER/OCTOBER 2006
Figure 14. Design Pattern Relationships. The network depicts interactions between design patterns, intending a more holistic pattern of how the various
patterns apply or mutually reinforce each other. Patterns with italicized text (e.g., Flyweight) are taken from Gamma et al. [13]; those with a standard typeface
were introduced in this paper. To simplify the diagram, patterns used extensively by the visualization patterns (e.g., Observer) have been omitted.
[13] Gamma, E., R. Helm, R. Johnson, and J. Vlissides. Design Patterns:
Elements of Reusable Object-Oriented Software. Addison-Wesley,
1994.
[14] Heer, J., S. K. Card, J. A. Landay. prefuse: A Toolkit for Interactive
Information Visualization. ACM Human Factors in Computing Systems
(CHI), 2005.
[15] Hudson, S. E., J. T. Stasko. Animation Support in a User Interface
Toolkit: Flexible, Robust, and Reusale Abstractions. ACM Symposium
on User Interface and Software Technologies (UIST), 1992.
[16] Krasner, G. E., S. T. Pope. A Cookbook for Using the Model-ViewController User Interface Paradigm in Smalltalk-80. Journal of ObjectOriented Programming, 1(3):26-49, August 1988.
[17] Mackinlay, J. D. Automating the Design of Graphical Presentations of
Relational Information. ACM Transactions on Graphics, 5(2): 110-141.
1986.
[18] Schmidt, D. C. Using Design Patterns to Develop Re-usable ObjectOriented Communication Software. Communications of the ACM,
38(10), October 1995.
[19] Schroeder, W. J., K. M. Martin, W. E. Lorensern. The Visualization
Toolkit: An Objecct-Oriented Approach to 3D Graphics. Prentice Hall,
1996.
[20] Stolte, C., D. Tang, and P. Hanrahan. Polaris: A System for Query,
Analysis and Visualization of Multi-dimensional Relational Databases.
IEEE Transactions on Visualization and Computer Graphics, 8(1),
January 2002.
[21] Stolte, C., D. Tang, and P. Hanrahan. Multiscale Visualization Using
Data Cubes. IEEE Symposium on Information Visualization (InfoVis),
2002.
[22] Tang, D., C. Stolte, and P. Hanrahan. Design Choices when
Architecting Visualizations. IEEE Symposium on Information
Visualization (InfoVis), 2003.
[23] Weaver, C. Building Highly-Coordinated Visualizations In Improvise.
IEEE Symposium on Information Visualization (InfoVis), 2004.


© Copyright 2026