
Survival after myocardial infarction in the rat. Role of tissue... enzyme inhibition.
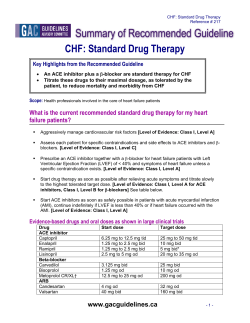
Survival after myocardial infarction in the rat. Role of tissue angiotensin-converting
enzyme inhibition.
K C Wollert, R Studer, B von Bülow and H Drexler
Circulation. 1994;90:2457-2467
doi: 10.1161/01.CIR.90.5.2457
Circulation is published by the American Heart Association, 7272 Greenville Avenue, Dallas, TX 75231
Copyright © 1994 American Heart Association, Inc. All rights reserved.
Print ISSN: 0009-7322. Online ISSN: 1524-4539
The online version of this article, along with updated information and services, is located on the
World Wide Web at:
http://circ.ahajournals.org/content/90/5/2457
Permissions: Requests for permissions to reproduce figures, tables, or portions of articles originally published
in Circulation can be obtained via RightsLink, a service of the Copyright Clearance Center, not the Editorial
Office. Once the online version of the published article for which permission is being requested is located,
click Request Permissions in the middle column of the Web page under Services. Further information about
this process is available in the Permissions and Rights Question and Answer document.
Reprints: Information about reprints can be found online at:
http://www.lww.com/reprints
Subscriptions: Information about subscribing to Circulation is online at:
http://circ.ahajournals.org//subscriptions/
Downloaded from http://circ.ahajournals.org/ by guest on June 9, 2014
2457
Survival After Myocardial Infarction in the Rat
Role of Tissue Angiotensin-Converting Enzyme Inhibition
Kai C. Wollert, MD; Roland Studer, PhD; Bodil von Bulow, BS; Helmut Drexler, MD
Background Chronic treatment with high doses of angiotensin-converting enzyme (ACE) inhibitors prolongs survival after myocardial infarction. Since the plasma reninangiotensin system (RAS) is not consistently activated in the
chronic phase after myocardial infarction, the beneficial effects
of ACE inhibition have been attributed, in part, to inhibition
of an activated tissue RAS. However, a relation between tissue
ACE inhibition and long-term efficacy (ie, concerning left
ventricular [LV] hypertrophy and survival) has not been
established. The present study was designed to evaluate the
impact of low-dose ACE inhibition (predominant inhibition of
plasma ACE) and high-dose ACE inhibition (associated with
substantial tissue ACE inhibition) on reversal of LV hypertrophy and 1-year mortality after myocardial infarction in the rat.
Methods and Results Infarcted rats were randomized to
placebo, low-dose lisinopril, or high-dose lisinopril (each,
n=80) and compared with sham-operated animals (n=40). In
a separate group of animals, tissue ACE activity was determined after 6 weeks of therapy, demonstrating that both
regimens were effective with regard to both plasma and
pulmonary ACE inhibition; however, only high-dose lisinopril
inhibited renal ACE. Neither dose affected LV ACE activity
and ACE mRNA levels as determined by competitive polymerase chain reaction, whereas LV ANF mRNA levels were
significantly reduced by high-dose lisinopril. High-dose lisinopril reduced arterial blood pressure and normalized right
ventricular and LV weight and resulted in a substantial
reduction of 1-year mortality, whereas the low dose did not (1
year mortality: placebo, 56.3%; low dose, 53.3%; high dose,
22.9%, P<.0001 versus low dose and versus placebo).
Conclusions Hemodynamically effective ACE inhibition is
required for reduction of LV hypertrophy and long-term
mortality after myocardial infarction in the rat. Sustained
inhibition of renal ACE during long-term therapy may contribute to the beneficial effect of high-dose lisinopril. Low-dose
lisinopril, although exerting sustained inhibition of the plasma
ACE, does not improve survival after myocardial infarction.
(Circulation. 1994;90:2457-2467.)
Key Words * hypertrophy * angiotensin enzymes RNA .
lisinopril * polymerase chain reaction
T he rat model of chronic myocardial infarction
(MI) induced by coronary artery ligation represents a well-characterized animal model of
chronic congestive heart failure. MI in the rat model
results in a profound alteration of ventricular architecture characterized by early expansion of the infarcted
area,' ventricular dilatation,2 and hypertrophy of the
noninfarcted left ventricle (LV).3 This cardiac remodeling process can be attenuated by long-term treatment
with the hemodynamically effective angiotensin-converting enzyme (ACE) inhibitor captopril,4 resulting in
improved long-term survival.5 On the basis of this
beneficial effect of captopril in the rat infarct model,
clinical trials have now provided convincing evidence
that this therapeutic principle also applies for patients
with large MI.6 Since the plasma renin-angiotensin
system (RAS) is not consistently activated after MI,7.8
the beneficial effects of ACE inhibition have been
attributed, in part, to inhibition of an activated tissue
RAS. Indeed, recent studies strongly suggest a selective
activation of the tissue RAS in the heart and in the
kidneys after MI in the rat, which could represent a
target for ACE inhibitors.9"10 Evidence is accumulating
that the cardiac RAS is involved in the stretch-mediated
hypertrophic response of cardiac myocytes.1"-3 Conceivably, interfering with the activated cardiac RAS may
prevent the development of LV remodeling and hypertrophy after MI. However, data demonstrating a relation between the degree of cardiac tissue ACE inhibition and the effect of ACE inhibitors on LV
hypertrophy and survival are lacking. Alternatively, the
beneficial effects of long-term ACE inhibition on survival after MI may be predominantly due to systemic
effects and inhibition of renal tissue ACE, thereby
reducing preload and afterload.
In the clinical setting, ACE inhibitors are often
prescribed in very low doses, assuming that low doses
may be as effective and have fewer side effects compared with the recommended dose.14 Indeed, experimental data obtained from a high renin-pressure overload model suggested that ACE inhibitors can prevent
LV hypertrophy in nonhypotensive doses.'5 To the
contrary, most clinical trials have used high target doses
of ACE inhibitors for the treatment of chronic heart
failure.616"7 Accordingly, the present study was designed to evaluate the impact of low-dose ACE inhibition (predominant inhibition of plasma RAS) and highdose ACE inhibition (associated with substantial tissue
ACE inhibition) on reversal of LV hypertrophy and
1-year mortality after MI in the rat.
Received February 23, 1994; revision accepted June 4, 1994.
From the Medizinische Klinik III, Universitat Freiburg,
Germany.
Correspondence to Helmut Drexler, MD, Medizinische Klinik,
Abteilung Kardiologie, Universitat Freiburg, Hugstetterstr 55,
79106 Freiburg, Germany.
© 1994 American Heart Association, Inc.
Methods
Experimental Infarction
Male Sprague-Dawley rats weighing 250 to 300 g were
obtained from the Zentralinstitut fur Versuchstierkunde, Hannover, FRG, and housed in our animal facility for at least 4
Downloaded from http://circ.ahajournals.org/ by guest on June 9, 2014
2458
Circulation Vol 90, No 5 November 1994
days before operation. The animal studies were approved by
the Ethical Committee for Animal Research at the University
of Freiburg, FRG. Coronary artery ligation was performed as
previously described.18 19 Briefly, rats were anesthetized with
pentobarbital and ketamine. The left coronary artery was
ligated approximately 2 mm distal to its aortic origin with a 6.0
Prolene suture. There was an '40% mortality rate within the
first 48 hours. In sham-operated animals, the suture was tied
loosely so as not to obstruct coronary flow. Animals were
allowed free access to a 0.5% sodium standard rat chow.
Drinking water was provided ad libitum.
Administration of Lisinopril
The ACE inhibitor lisinopril was dissolved in the drinking
water at concentrations of 3.85 mg/L (low dose) and 38.5 mg/L
(high dose). The dose selection was based on a pilot study
demonstrating that these dosages result in serum lisinopril
levels comparable to a low dose of approximately 2.5 to 5 mg/d
or a high dose of approximately 20 mg/d.20,21 The high dose
was equivalent to the target dose in large clinical trials.1416 The
pilot study also documented an effective inhibition of plasma
ACE activity and a significant rightward shift of the angiotensin (Ang) I pressure-response curve during both low- and
high-dose treatment.
Instrumentation
Rats were anesthetized with halothane (1% in oxygen).
Saline-filled catheters (PE 50) were inserted into the right
carotid artery and jugular vein. The arterial line was connected
to a Statham P231D pressure transducer. Blood pressure
tracings were displayed on a recorder screen (Elema Mingograph, Siemens). After closure, rats were allowed to recover
for a minimum of 3 hours before hemodynamic measurements
were performed. This recovery period is of sufficient duration
to ensure a return to baseline conditions in the rat.22
Angiotensin Challenges
To document effective and sustained plasma ACE inhibition
(particularly during low-dose lisinopril therapy), Ang I and
Ang II dose-response curves were obtained at 2 weeks and 1
year of therapy. Baseline arterial blood pressure and heart rate
were recorded. Subsequently, pressure responses to Ang I and
Ang II (Sigma) were determined. Increasing doses of Ang I
and Ang 11 (1, 3, 10, 30, 100, 300, and 1000 ng) were injected
intravenously in 0.1 mL saline. A 5-minute interval was
maintained between pressure stimuli. The angiotensin dosages
were increased until a 20 mm Hg peak change in mean arterial
blood pressure was observed. Dose-response curves for Ang I
and Ang II were derived from the peak changes in mean
arterial pressure.
Determination of Infarct Size
The LV was fixed in 10% formalin and embedded in
paraffin. Six transverse slices were cut from apex to base. A
5-,um section was cut from each slice and mounted. The
sections were stained with sirius red (0.1% solution in saturated aqueous picric acid) to provide a clear discrimination
between fibrous scar and noninfarcted tissue.23 Infarct size was
determined by planimetric measurement4 with a digital image
analyzer (Leitz). To calculate infarct size, the ratios of scar
length to circumference from each of the six slices were
averaged and expressed as percentage.
Tissue Sampling
Rats were killed in the early morning by decapitation. Trunk
blood was collected into chilled tubes containing either heparin (200 IU/mL) or EDTA disodium salt (1 mg/mL). The tubes
were immediately centrifuged at 4°C. Plasma containing heparin was snap-frozen and stored in liquid nitrogen until assay
of ACE activity. Plasma containing EDTA was divided into
two samples. The first sample was stored at -80°C for later
determination of plasma renin activity. Aprotinin (500
KIU/mL plasma, Bayer) was added to the second sample,
which was then stored in liquid nitrogen for later assay of atrial
natriuretic peptide (ANF). The thoracic contents were removed en bloc. Major pulmonary trunks were removed from
the lungs. The atria and the right ventricle were dissected from
the LV. The infarct scar and the border zone were separated
from viable LV myocardium. In sham-operated animals, corresponding parts of the LV were discarded. Only viable LV
myocardium (representing the inferior wall and the interventricular septum) was used for the subsequent analyses. The
kidneys were freed of their capsules. All tissues were rinsed in
ice-cold saline, blotted dry, weighed, and snap-frozen. Tissues
were either stored in liquid nitrogen for subsequent assay of
ACE activity or stored at -80°C for later isolation of RNA.
Biochemical Measurements
Serum lisinopril concentration was determined by radioimmunoassay.24 Plasma renin activity was measured by radioimmunoassay of Ang I generated by incubation with an excess of
rat renin substrate.25 After extraction, plasma ANF concentrations were determined by radioimmunoassay as previously
described.26 Plasma and tissue ACE activities were measured
by the rate of generation of [14C]-hippuric acid from ['4CIHipHis-Leu (HHL) substrate using the optimal incubation conditions for cleavage of HHL.27 Tissues were homogenized in
ice-cold 0.3% Triton X-100 by use of a 12-second impulse from
an Ultra Turrax homogenizer. After centrifugation (20 000g,
20 minutes, 4°C), 50 piL of the supernatant or 50 4L of plasma
was incubated with 150 ,uL of assay buffer at 37°C in a water
bath. The assay buffer consisted of 300 mmol/L NaCI, 100
mmol/L Na2HPO4 (pH 8.3), 5 mmol/L HHL (Sigma), and 0.1
mmol/L [14C]HHL (specific activity, 3 mCi/mmol; Amersham).
The [14C]-hippuric acid generated was extracted with ethylacetate and quantified in a scintillation counter. Tissue ACE
activity was expressed as nmoles HHL turnover. mg -1 * min-m
tissue protein. The protein content of the tissue supernatant
was determined by the method of Bradford. Plasma ACE
activity was expressed as nmoles HHL turnover* mL min1
plasma.
Preparation and Quantification of RNA
Frozen LV tissue samples were disintegrated with a Mikro
Dismembrator (B. Braun). Total cellular RNA was isolated by
the acid guanidinium thiocyanate/phenol/chloroform extraction
method as described by Chomczynski and Sacchi.28 The RNA
was dissolved in diethylpyrocarbonate-treated water and quantified by absorbance at 260 nm in triplicate. Aliquots were subjected to agarose gel electrophoresis and stained with ethidium
bromide to confirm absence of RNA degradation by demonstrating the integrity of the ribosomal 18s and 28s bands.
Northern Blot Analysis
Total RNA was subjected to formaldehyde agarose gel
electrophoresis29 and transferred to a nylon membrane by
overnight capillary blotting. The filters were successively hybridized with a 0.6-kb rat ANF cDNA probe (Pst I/Pst 1)30 and
a 1.2-kb chicken f8-actin cDNA probe (EcoRl/HindIII).31
Before cDNA hybridization, the filters were preincubated for
4 hours at 65°C in hybridization buffer containing 50 ,.g/mL
sonicated and denatured Escherichia coli DNA (Sigma), 2x
standard saline citrate (SSC; 1x SSC is 15 mmol/L sodium
citrate and 0.15 mol/L NaCl), 10x Denhardt's solution, 0.1%
SDS, 0.1% sodium pyrophosphate, 2 mmol/L EDTA, and
2.5% dextran sulfate. The cDNA probes were labeled with
[a32P]dCTP by random priming (Multiprime DNA Labeling
Kit, Amersham). Approximately 1x 10⁷ cpm of the labeled
cDNA probe was added to 10 mL of hybridization buffer, and
the filters were hybridized overnight at 65°C. Subsequently, the
filters were washed under appropriate conditions of stringency
(2x SSC/0.1% SDS, 0.5x SSC/0.1% SDS, 0.1x SSC/0.1%
Downloaded from http://circ.ahajournals.org/ by guest on June 9, 2014
Wollert et al Tissue ACE and Survival After Myocardial Infarction
SDS, 30 minutes each, at 65°C). The filters were exposed to
x-ray films (X-OMAT AR, Kodak), and the autoradiograms
were scanned with a laser densitometer (Personal Densitometer, Molecular Dynamics). The extent of ANF cDNA hybridization was normalized to the hybridization signals obtained
with the f3-actin cDNA to correct for differences in loading
and/or transfer efficiencies.
Competitive Reverse Transcription-Polymerase
Chain Reaction
The expression of ACE mRNA in the noninfarcted LV was
measured by competitive reverse transcription-polymerase
chain reaction (RT-PCR). In competitive RT-PCR, the template mRNA and definite numbers of competitor RNA molecules are first reverse transcribed and subsequently amplified
in the same reaction tube.32,3334 A deletion within the competitor RNA molecules allows the PCR products of the
competitor and the template to be separated by gel electrophoresis. The PCR products generated by the competitor and
the template are then quantified to calculate the initial amount
of template mRNA molecules.
Construction of the Competitor RNA
To obtain an internal control competitor RNA, a shortened
fragment of the human ACE cDNA was constructed and
transcribed into cRNA. The human ACE cDNA35 was subjected to a PCR with the sense primer 5'-CGCTACAACTTCGACTGGTGG-3' and the antisense primer 5'-CGGGTAAAACTGGAGGATGG-3'. The PCR yielded a 951-bp
(1481 to 2431) cDNA fragment. The cDNA fragment was
phosphorylated, blunted, ligated into a blunt-ended, dephosphorylated Bluescript SK(-) vector (Statagene), and amplified on GM 2929 (dcm-) E. coli bacterial strain. A 315-bp
fragment was removed by digestion with the restriction enzyme PpuMI. The shortened cDNA fragment was separated
on a low-melting-point agarose gel, blunted, and religated. The
shortened cDNA clone was linearized with EcoRI. Subsequently, 1 jig was transcribed into cRNA with a T3-/T7-RNA
polymerase in vitro transcription kit (Amersham). The cDNA
template was then removed by addition of 15 U RNase-free
DNase (Life Technologies) and incubation at 37°C for 30
minutes. The competitor cRNA was recovered by phenol
extraction and ethanol precipitation and quantified by absorption at 260 nm. The cRNA solution was stabilized by addition
of 30 ug/mL of yeast tRNA (Life Technologies) and stored at
-20°C. No remaining cDNA could be detected when the
competitor cRNA was subjected to RT-PCR with reverse
transcriptase omitted in the first step.
Selection and Synthesis of the PCR Primers
The cDNA sequence of the rat ACE has not been published.
We therefore selected sense and antisense oligonucleotide
primers from the human ACE cDNA sequence35 that showed
a complete sequence homology to the murine ACE cDNA36,37:
sense primer 1481 to 1501 5'-CGCTACAACTTCGACTGGTGG-3', antisense primer 2342 to 2361 5'-TATTTCCGGGATGTGGCCAT-3'. The primers were selected by computer
analysis (Oligo program, National Biosciences) and were
synthesized by use of a DNA synthesizer (Applied Biosystems). To ensure that no genomic DNA contamination was
present in the LV RNA solutions subjected to RT-PCR, the
oligonucleotide primers spanned several splice junctions.38
Reverse Transcription
For first-strand cDNA synthesis, a set of reactions was
prepared by addition of increasing quantities of competitor
cRNA molecules (0.25 x 10⁷ to 6.Ox 107) to a constant amount
of total LV RNA (1.25 pg). Reactions were carried out in a
final volume of 25 ,L containing lx reverse transcription
buffer (50 mmol/L Tris-HCl, pH 8.3, 75 mmol/L KCl, 3
mmol/L MgC12), 0.5 mmol/L dNTPs (Pharmacia), and 250
2459
pmol of random hexanucleotide primers. The mixtures were
heated at 72°C for 3 minutes followed by cooling to 42°C.
Subsequently, dithiothreitol (final concentration, 10 mmol/L),
RNase inhibitor (2 U/100 ng of total RNA, Life Technologies),
and Moloney murine leukemia virus reverse transcriptase (10
U/100 ng of total RNA, Life Technologies) were added, and
the reaction mixtures were incubated at 42°C for 60 minutes.
As a negative control, one additional reaction mixture was set
up omitting the reverse transcriptase.
PCR Amplification
Duplicate samples of PCR reaction were performed in a total
volume of 50 ,L, respectively, each containing 10 uL of reverse
transcription reaction, 35 pL of a PCR master mix (20 mmol/L
Tris-HCl, pH 8.3, 50 mmol/L KCl, 0.5 mmol/L MgCl2, 20 pmol
sense and antisense primer), and 2.5 U Thermus aquaticus DNA
polymerase (Amersham Buchler Ltd). Twenty-eight PCR amplification cycles were run with the following cycle profile:
denaturation (1 minute at 94°C), annealing (2 minutes at 65°C),
and extension (3 minutes at 72°C).
Quantitative Analysis
See Fig 1. Ten microliters from each PCR reaction was
loaded onto 1.5% agarose gels containing 0.5 ,g/mL ethidium bromide. After electrophoresis, the amplification products of the template and the competitor were visualized by
UV illumination, and a photograph was taken. The negative
films were used to evaluate the band intensities by laser
densitometry (Personal Densitometer). To correct for the
difference in molecular weight, the band densities of the
ACE competitor product were multiplied by 1.56 (881 bp
divided by 566 bp). The ratios of the corrected band densities
of the competitor products to the band densities of the
template products were calculated, and the logarithmic
values were plotted against the logarithm of the known
number of competitor cRNA molecules. At the point at
which the products of the competitor cRNA and the template RNA are in equivalence (log ratio=0), the starting
concentration of the template RNA equals the starting
concentration of the competitor RNA. The linearity of the
competitive RT-PCR was verified by subjecting five dilutions
of LV RNA (0, 0.313, 0.625, 1.25, and 1.875 ,ug) to reverse
transcription and subsequent PCR amplification. This resulted in a linear relationship (r=.99, P<.001). The competitive RT-PCR was reproducible with repetitive measurements from individual samples differing <15% from each
other.
Protocol 1
Six to 8 days after coronary artery ligation, rats were
randomly assigned to vehicle (MI-V) or low-dose (MI-L) or
high-dose lisinopril (MI-H, n=7 to 10 per group). After
treatment for 14 days, catheters were inserted into the right
carotid artery and jugular vein. A 0.4-mL venous blood sample
was withdrawn for determination of serum lisinopril concentration. After recovery (>3 hours), baseline arterial blood
pressure and heart rate were measured in resting conscious
rats. Subsequently, blood pressure response curves to intravenous Ang I and Ang II were recorded. At the end of the
protocol, the hearts were removed under halothane anesthesia
and placed in 10% formalin for later determination of infarct
size. The same protocol was carried out after treatment for 1
year using animals that completed protocol 3 (n=6 to 8 per
group).
Protocol 2
Six to 8 days after coronary artery ligation, rats were
randomized to receive vehicle (MI-V, n= 16) or low-dose
(MI-L, n=17) or high-dose lisinopril (MI-H, n=14). Shamoperated animals were treated with vehicle (SH-V, n=16).
After treatment for 6 weeks, rats were killed by decapitation,
Downloaded from http://circ.ahajournals.org/ by guest on June 9, 2014
2460
Circulation Vol 90, No 5 November 1994
total RNA ( ng )
500
M
24
12
8
6
4
2
1
ACE competitor RNA
molecules ( x 106 )
881 bp _
ACE target
566 bp
ACE competitor
0
cc
0
U
CL
,50
0
:!h.
o
10
E
0
-1,
5,5
60
65
7,0
7.5
80
log competitor RNA molecules
FIG 1. Blot and graph showing angiotensin-converting enzyme (ACE) mRNA quantification by competitive RNA polymerase chain
reaction (PCR). Top, A constant amount of total RNA was mixed with an increasing number of ACE competitor RNA molecules, reverse
transcribed into cDNA, and amplified in duplicate samples by PCR (variation between duplicate samples <5%). The PCR products,
indicated as ACE target (881 bp) and ACE competitor (566 bp), were separated by gel electrophoresis, stained with ethidium bromide,
and visualized by UV irradiation. On the right, a molecular-weight DNA standard (M) was loaded. Bottom, The band densities of the ACE
target and competitor DNA were evaluated by use of a laser densitometer and a computer-based imaging system. The mean values of
duplicate samples were plotted as logarithm of the ratio of competitor to gene target PCR products vs the logarithm of the known number
of competitor molecules. At the competition equivalence point (log ratio=0), the original number of target mRNAs corresponds to the
initial number of competitor RNA molecules used.
and trunk blood was collected for measurement of plasma
ACE activity. The noninfarcted parts of the LV, the lungs, and
the kidneys were used for determination of tissue ACE
activities. In a subset of animals, we used one half of the
noninfarcted LV for isolation of total RNA and measurement
of ACE mRNA and ANF mRNA levels (MI-V, MI-L, MI-H,
n=9 per group; SH-V, n=12). In addition, plasma renin
activities and plasma ANF concentrations were determined in
these animals. Since LV tissue was used for biochemical
analyses, a crude estimate of transversal length of the infarct
size was determined from the fixed transverse sections sampled at the middle (equatorial) part of each LV. Additional
groups of animals (n=4 per group) were treated as outlined
above for 1 day only, then killed, and cardiac tissue ACE
activities were measured.
Protocol 3
To assess the influence of low-dose and high-dose lisinopril
on 1-year mortality, 378 rats underwent coronary artery
ligation. One hundred thirty-eight rats died within the first 3
days (mortality, 36.5%). Six to 8 days after the operative
procedure, the surviving 240 animals were randomly assigned
to vehicle (MI-V) or low-dose (MI-L) or high-dose lisinopril
(MI-H, n=80 per group). A sham operation was performed in
40 rats, and these animals were treated with vehicle (SH-V).
All animals were followed until death
Cages
or
for up to 1 year after
inspected daily for dead animals. The
date of each death and the weight of the dead animal were
recorded. The lungs, the atria, the right ventricle, and the LV
were weighed, and the LV was placed in 10% formalin for
planimetric determination of infarct size. One year after
surgery, all surviving animals were weighed and anesthetized
with halothane. The thoracic contents were removed, and
surgery.
were
again, the organ weights were recorded and the LVs were
collected for measurement of infarct size. According to a
classification used by Pfeffer et al,5 infarcts were classified as
small (<20%), moderate (20 to <40%), and large (>40%).
Statistical Analyses
Data are presented as mean±SEM. Intergroup variables
first compared by one-way ANOVA. Four prespecified
comparisons were subsequently made by Bonferroni's t test
(MI-V versus SH-V, MI-L versus MI-V, MI-H versus MI-V,
and MI-H versus MI-L). Linear regression analysis was performed to test for a correlation between two variables. Survival
data are presented as Kaplan-Meier curves. The survival
curves of individual groups were compared by the log-rank
test. To account for multiple testing in pairwise comparisons,
a closed test procedure was used.39 In addition, the mortality
data from protocol 3 were stratified according to infarct size
and analyzed by a Cox proportional-hazard model. A twotailed value of P<.05 was considered to indicate significance.
were
Results
Protocol 1
The effects of low-dose and high-dose lisinopril on
resting arterial blood pressure, heart rate, and pressure
responses to Ang I and Ang II were determined in two
separate sets of animals after treatment for 2 weeks or
for 1 year, respectively (Table 1, Fig 2). There were no
significant differences in infarct size between the treatment groups. Plasma lisinopril concentrations were significantly higher in high-dose compared with low-dose
treatment (P<.05, Table 1). With low-dose lisinopril, a
Downloaded from http://circ.ahajournals.org/ by guest on June 9, 2014
Wollert et al Tissue ACE and Survival After Myocardial Infarction
2461
TABLE 1. Effects of Low-Dose and High-Dose Lisinopril on Blood Pressure, Heart Rate, and
Serum Lisinopril Concentration
Diastolic BP,
Systolic BP,
mm Hg
mm Hg
HR, bpm
Lis, ng/mL
Ml, %
2-Week treatment
n.d.
110±5
410±15
142±6
26±4
MI-V (n=8)
92±2*
20.3±1.5
360±18
122±2t
MI-L (n=10)
26±3
44.0±3.6§
377±12
28±4
MI-H (n=7)
107±3t§
76±5t§
1-Year treatment
n.d.
22±2
100±4
357±18
134±5
MI-V (n=6)
129±4
13.5±2.8
19±2
96±5
350±28
MI-L (n=6)
31.7±5.1§
80±3t§
326±12
111±3t§
MI-H (n=8)
23±4
Values are mean±SEM. MI indicates infarct size; BP, arterial blood pressure; HR, heart rate; bpm, beats
per minute; Lis, serum lisinopril concentration; MI-V, MI-L, MI-H, infarcted rats treated with vehicle or
low-dose or high-dose lisinopril, respectively; and n.d., not determined. Treatment was initiated 6 to 8 days
after surgery and lasted for either 2 weeks or 1 year. *P<.05, tP<.01, tP<.001 vs MI-V; §P<.05 vs MI-L.
significant decrease in systolic (P<.01) and diastolic
(P<.05) blood pressures was observed only at 2 weeks
(Table 1). High-dose lisinopril caused a significant
decrease of systolic and diastolic blood pressure at 2
weeks (P<.001) and at 1 year (P<.01) (Table 1).
Reduction of blood pressure with high-dose lisinopril
was significantly stronger compared with low-dose treat-
ment (P<.05). There were no significant changes in
heart rate during lisinopril treatment. The pressureresponse curves to Ang I and Ang II are shown in Fig 2a
through 2d. Both low- and high-dose lisinopril caused a
significant, dose-dependent rightward shift of the Ang I
pressure-response curve, whereas the pressure response
to Ang II was well preserved. The pressure-response
b
a
40
40
Ang 1. 2 weeks
I
I
30
I
20
,1
S
10
,Z
-
A
1
-
1
A- .-e',-,..
....T.....
0.1
-I D~
-
........
M!-V
.....
.....
.....
....
1000
1000
100
10
1
~a DUOom
W
-
-H
L
--- M
"-V
---
I-H
l-L
d
c
40
r
o
Ang 11. 1 year
Ang 1. 1 year
I
I
301-
'i///
/
20 1
A
A
/
/
./
r
10 -
/
._,/^41 '
100
1000
0.1
---
MI-L
10
1
D~ h
M-V
...... ....
.....
.....
,,
10
0.1
la-
--
Ml-H
-
Ml-V
---
D
I-L
100
1000
hi
--
Ml-H
FIG 2. Graphs showing effects of low-dose and high-dose lisinopril on pressure responses to angiotensin (Ang) and 11. Values are
mean+SEM. Ml-V, MI-L, and MI-H indicate infarcted rats treated with vehicle or low-dose or high-dose lisinopril, respectively. Same
animals as in Table 1. Angiotensin and 11 challenges were performed in two different sets of animals after treatment for 2 weeks or for
1 year. Both low and high doses caused a significant rightward shift (P<.05 for low dose vs placebo and P<.01 for high dose vs
placebo). MAP indicates mean arterial pressure.
Downloaded from http://circ.ahajournals.org/ by guest on June 9, 2014
2462
Circulation Vol 90, No
5
November 1994
TABLE 2. Effects of Low-Dose and High-Dose Lisinopril on Plasma and Tissue ACE Activities
Kidney,
Plasma,
Infarct
nmol * min'1 * mg prot-1
nmol * min-1 * mL-1
Lungs
Size, %
BW, g
0.65±0.07
179±19
0
475±8
48+7
SH-V (n=16)
0.82±0.14
128±18
57+5
492±15
43+4
MI-V (n=16)
0.63±0.08
45+6*
39±2
27+2*
461±10
MI-L (n=17)
nLV
0.25±0.03
0.45+0.04t
0.45+0.06
0.43+0.04
0.21±0.04*t
26+5*
13±2*
42+4
471±14
MI-H (n=14)
rats
left
ventricular
sham-operated
noninfarcted
SH-V,
tissue;
ACE indicates angiotensin-converting enzyme; BW, body weight; nLV,
treated with vehicle; MI-V, MI-L, MI-H, infarcted rats treated with vehicle or low-dose or high-dose lisinopril, respectively. Treatment was
initiated 6 to 8 days after surgery and lasted for 6 weeks. Same animals as in Table 2. Values are mean±SEM. ACE activities are
expressed as nanomoles of HHL turnover per minute per milliliter of plasma or per milligram of tissue protein.
*P<.001 vs MI-V; tP<.05 vs Ml-L; and tP<.05 vs SH-V. Infarct size determined in the equatorial plane of the left ventricle.
curves were similar after treatment for 2 weeks and for
1 year. The rightward shift of the Ang I dose-response
curve was more pronounced with high-dose lisinopril.
Protocol 2
To assess the impact of chronic lisinopril treatment
on ventricular weights and plasma and tissue ACE
activities, infarcted rats were treated with vehicle
(MI-V, n=16) or low-dose (MI-L, n=17) or high-dose
(MI-H, n=14) lisinopril for 6 weeks. Sham-operated
animals received vehicle only and served as a control
group (SH-V, n=16). A treatment period of 6 weeks
was chosen because the mortality rate of placebotreated rats increases substantially beyond 2 months
after MI. Therefore, an investigation at a later stage
would have resulted in a selection in favor of treated
animals. To confirm an equal distribution of infarct sizes
among the three infarcted groups, a crude estimate of
transversal length of the infarct size was obtained from
fixed transverse sections sampled at the equatorial part
of the LV. These estimates of infarct size did not differ
significantly between the three groups (Table 2). Body
weights did not differ between the experimental groups.
There were no significant differences in ventricular
weights in vehicle-treated infarcted rats compared with
sham-operated rats. Compared with vehicle treatment,
only high-dose lisinopril caused a significant decrease in
the absolute and relative weights of the LV (LV per
body weight: placebo, 2.18+0.08; low dose, 2.14±0.08;
high dose, 1.90±0.05 g/kg; P<.05 for high dose versus
placebo). Right ventricular weights were not affected
significantly by either high-dose or low-dose lisinopril
treatment for 6 weeks.
Plasma and tissue ACE activities are displayed in
Table 2. Compared with sham-operated animals, the
ACE activity in the noninfarcted parts of the LV
significantly increased in infarcted animals receiving
vehicle (P<.05), whereas the ACE activities in the
lungs, in the kidney, and in plasma did not differ
significantly between these two groups. Plasma and
pulmonary ACE activities were significantly inhibited by
high-dose and by low-dose lisinopril treatment
(P<.001). A significant inhibition of renal ACE activity
was achieved only by high-dose lisinopril (P<.001 versus
placebo and P<.05 versus low-dose lisinopril). The
ACE activity in the noninfarcted parts of the LV
remained unchanged during low-dose and high-dose
lisinopril treatment.
Chronic MI was associated with a significant elevation
of plasma ANF levels (P<.01) (Table 3). ANF levels
tended to decrease with lisinopril treatment. Plasma
renin activity in vehicle-treated infarcted and shamoperated rats did not differ significantly. An increase in
plasma renin activity was observed during low-dose and
high-dose lisinopril treatment (P<.001, Table 3).
By use of competitive RT-PCR, ACE mRNA levels
were measured in the noninfarcted parts of the LV. As
shown in Fig 3, the number of ACE transcripts per 500
ng total RNA significantly increased in vehicle-treated
infarcted rats compared with sham-operated rats
(4.7±0.5 x 10⁶ versus 2.6±0.3 x 10⁶, P< .02). Infarcted
animals treated with low doses or high doses of lisinopril
did not differ from vehicle-treated infarcted animals
with regard to LV ACE mRNA expression. There was a
significant positive correlation between LV ACE
mRNA expression and ACE activity (n=21, r=.57,
P=.007, Fig 4).
A 25-fold increase in LV ANF mRNA expression was
observed in infarcted animals treated with vehicle
(P<.001). Only treatment with high-dose lisinopril
caused a significant reduction in ANF mRNA expression (P<.05). Similar results were obtained when ANF
mRNA was normalized to /3-actin (Fig 5). The expression of /8-actin did not differ significantly between the
four experimental groups (data not shown).
In separate groups of animals treated for only 1 day,
cardiac ACE activity was increased in placebo-treated
infarcted rats compared with sham-operated animals.
Both low- and high-dose lisinopril inhibited cardiac
ACE activity (SH-V/MI-V/MI-L/MI-H, 0.44 ± 0.07/
0.78±0.19/0.18±0.03/0.11±0.07 nmol . min-1 . mg proTABLE 3. Effects of Low-Dose and High-Dose Lisinopril
on Plasma Renin Activity and Atrial Natriuretic
Peptide Concentration
MI Size,
PRA,
ANF,
pg/mL
%
ngmL-' *min-'
128+25
4.6+1.0
0
SH-V(n=12)
505±106*
MI-V (n=9)
6.4+1.3
43+3
424±85
MI-L (n=9)
23.4±1.3t
38±3
316±69
MI-H (n=9)
20.2+1.7t
39±3
Ml size indicates infarct size determined in the equatorial
plane of the left ventricle; PRA, plasma renin activity; ANF, atrial
natriuretic peptide; SH-V, sham-operated rats treated with vehicle; and MI-V, Ml-L, MI-H, infarcted rats treated with vehicle or
low-dose or high-dose lisinopril, respectively. Treatment was
started 6 to 8 days after surgery and lasted for 6 weeks. Same
animals as in Figs 2, 3, and 4. Values are mean±SEM.
*P<.01 vs SH-V; tP<.001 vs MI-V.
Downloaded from http://circ.ahajournals.org/ by guest on June 9, 2014
Wollert et al Tissue ACE and Survival After Myocardial Infarction
2463
26 F
jx
6.
0~
~~p00
.
P<O.05
p<O.oo 1
0
:;
U
20 F
1S h
0
.3
10 1
5
AL
F,
v
0O
MI-L
MI-V
SH-V
OK
SM-V
MI-H
FIG 3. Bar graph showing ACE mRNA expression in the noninfarcted parts of the left ventricle. Values are mean ±SEM. SH-V
indicates sham-operated rats treated with vehicle (n=12); MI-V,
Ml-L, and MI-H, infarcted rats treated with vehicle or low-dose or
high-dose lisinopril, respectively (n=9 in each group). Treatment
was initiated 6 to 8 days after surgery and lasted for 6 weeks.
ACE mRNA expression was quantified by competitive reverse
transcription-polymerase chain reaction. ACE indicates angiotensin-converting enzyme.
tein-1; P<.05 for SH-V versus MI-V and P<.01 for
MI-L and MI-H versus MI-V).
Protocol 3
The survival curves of the four experimental groups
are depicted in Fig 6. None of the sham-operated rats
died during the 1-year observation period. Vehicletreated infarcted animals exhibited a 1-year mortality
rate of 56.3% (P<.00001 MI-V versus SH-V). Treatment with low-dose lisinopril did not result in a reduction of the 1-year mortality rate (MI-L, 53.3%; P=.48
MI-L versus MI-V). However, the 1-year mortality rate
was significantly reduced by high-dose lisinopril (MI-H,
22.9%; P<.00001 MI-H versus MI-V). High-dose treatment was superior to low-dose treatment (P<.0001
MI-H versus MI-L). In an additional analysis, the
mortality data from the three infarcted groups were
stratified according to infarct size and analyzed by a Cox
proportional-hazards model. In relation to the MI-V
group, the relative risk to die within the 1-year obser0
-.'
.'A
'/,l
t
WM-H
FIG 5. Bar graph showing influence of low-dose and high-dose
lisinopril on atrial natriuretic peptide (ANF) mRNA expression
(normalized to f3-actin mRNA) in the noninfarcted parts of the
left ventricle. Values are mean±SEM. SH-V indicates shamoperated rats treated with vehicle (n=12); MI-V, MI-L, and MI-H,
infarcted rats treated with vehicle or low-dose or high-dose
lisinopril, respectively (n=9 in each group). Treatment was
initiated 6 to 8 days after surgery and lasted for 6 weeks.
vation period equaled 0.801 in the MI-L group (95%
confidence interval, 0.524 to 1.223, P=.30 versus MI-V)
and 0.289 in the MI-H group (95% confidence interval,
0.166 to 0.502, P<.001 versus MI-V). Based on the
planimetric determination of infarct size, rats were
classified as having small (<20%), moderate (>20%,
<40%), or large (>40%) infarcts. Infarct sizes did not
differ significantly within these three groups. High-dose
lisinopril caused a significant reduction in the 1-year
mortality rate of rats with small and moderate infarcts.
Although there were no significant differences in survival for large infarcts, the number of animals in each
treatment group was too small to allow definite conclusions. Low-dose treatment did not prove to be effective
in any of the three groups (Table 4). In all animals of
protocol 3, body weights and ventricular weights were
determined after death or after 1 year (Table 5).
Compared with sham-operated rats, the relative LV
weight and the absolute and relative right ventricular
weights were increased in placebo-treated infarcted
100-
'' ' '~~~~......
................
750
0.60
I
0
00
0.40
20
o'
AM-L
0.80
IL
I
MI-V
0
020
00
0
0.00 1
0
25-
0
0
Us
0
p<O.0OOO1 M-V vs SH-V
p<0.0000 1 M-H vs I-V
p<O.0001 IA-H vs M-L
p=0.48 M-L vs. MI-V
.1
0
365
0
0
2
ACE nm
3
4
5
6
7
8
transrpts (xlOOxpISOOng RM)
FIG 4. Graph showing correlation between angiotensin-convert-
ing enzyme (ACE) mRNA expression and ACE activity in the
noninfarcted parts of the left ventricle. Treatment was initiated 6 to
8 days after surgery and lasted for 6 weeks. Combined analysis
from vehicle-treated sham-operated (n = 12) and infarcted animals
(n=9).
50-
0
Time (Days)
---- MI-L - - M-H. SH-V
FIG 6. Bar graph showing influence of low-dose and high-dose
lisinopril on 1-year mortality in infarcted rats. SH-V indicates
sham-operated rats treated with vehicle (n=40); MI-V, Ml-L, and
MI-H, infarcted rats treated with vehicle or low-dose or high-dose
lisinopril (n=80 per group). Treatment started 6 to 8 days after
surgery. Rats were followed until death or for up to 1 year after
- M-V
surgery.
Downloaded from http://circ.ahajournals.org/ by guest on June 9, 2014
2464
Circulation Vol 90, No 5 November 1994
TABLE 4. Effects of Low-Dose and High-Dose Lisinopril
on 1-Year Mortality Rates in Rats With Small, Moderate,
and Large lnfarcts
n
MI,%
1-Year
Mortality
Rate,%
31
26
23
13±1
14+1
12+1
38.7
35.4
8.9
P
Small infarcts
MI-V
MI-L
MI-H
Moderate infarcts
MI-V
MI-L
MI-H
45
43
50
27+1
29-1
29±1
64.4
56.6
22.0
.58 vs MI-V
<.02 vs MI-V;
<.05 vs MI-L
.26 vs MI-V
<.0001 vs MI-V;
<.001 vs MI-L
Large infarcts
NS for all
100.0
4 43±2
MI-V
comparisons
1 1 43±1
81.8
MI-L
83.3
7 44±2
MI-H
MI indicates infarct size, mean±SEM; MI-V, MI-L, MI-H, infarcted rats treated with vehicle or low-dose or high-dose lisinopril, respectively. Treatment started 6 to 8 days after surgery.
Rats were followed until death or for up to 1 year. Rats were
classified according to infarct size as having small (<20%),
moderate (>20% to <40%), or large (>40%) infarcts.
rats. High-dose treatment resulted in a significant reduction of ventricular weights compared with placebo
and low-dose treatment. Since more rats of the placebo
and low-dose infarct groups died before the end of the
1-year treatment period compared with the high-dose
group, the development of higher cardiac weights in the
placebo and low-dose groups is likely to underestimate
the extent of cardiac hypertrophy that might have
emerged if these animals had lived longer.
TABLE 5. Effects of Low-Dose and High-Dose Lisinopril
on Absolute and Relative Right and Left Ventricular
Weights After 1 Year of Treatment
MI, %
BW, g
RV, g
RV/BW,
g/kg
LV, g
LV/BW,
g/kg
SH-V
(n=40)
0
MI-V
MI-L
MI-H
(n=80)
(n=80)
26+1
(n=80)
22±1
546±6
630±8
554±8§
0.44±0.02
0.30±0.01 0.47±0.02§
25±1
581±6*#
0.38±0.01tff
0.48±0.01 0.87±0.04§ 0.83±0.04 0.66±0.03t¶
1.30±0.02 1.35+0.02 1.28±0.02* 1.14±0.02t#
2.08±0.04 2.48+0.04§ 2.36±0.04 1.98±0.03t#
SH-V indicates sham-operated rats treated with vehicle; MI-V,
Ml-L, MI-H, infarcted rats treated with vehicle or low-dose or
high-dose lisinopril, respectively; MI, infarct size in percent of the
left ventricle; BW, body weight; RV and LV, absolute right and left
ventricular weights; and RV/BW and LV/BW, relative right and left
ventricular weights. Values are mean±SEM. Treatment was
initiated 6 to 8 days after surgery. Rats were followed until death
or up to 1 year.
C
IP<.05,
*DP<Q5, tP<.01, tP<.001 vs Ml-V; §P<.001 vs SH-V;
¶P<0.01, #P<.001 vs MI-L.
Discussion
The present study provides the first evidence that the
effect of long-term ACE inhibition on survival after MI
is dose-dependent. Low doses of an ACE inhibitor,
although exerting effective inhibition of the plasma
RAS, may not improve survival. In contrast, high doses
(equivalent to doses used in clinical trials), associated
with renal tissue ACE inhibition, sustained reduction of
blood pressure, and prevention of LV hypertrophy,
result in a dramatic decrease of long-term mortality in
the rat model.
Influence of Low-Dose and High-Dose Lisinopril on
Long-term Mortality
The beneficial effects of chronic ACE inhibition on
long-term survival after MI were first demonstrated in
the rat infarct model.5 The results of this animal study
provided the basis for the design of the subsequent
clinical trials,6 which, in turn, confirmed the experimental findings demonstrating that ACE inhibitors reduce
mortality in patients after MI. Thus, this animal model
has proved to be extremely useful for studying pharmacological aspects of LV dysfunction after MI. The
impressive results of the clinical trials have been obtained with fairly high target doses of ACE inhibitors,
ie, 100 to 150 mg captopril.6 On the assumption that low
doses might be as effective as high doses while reducing
side effects, low doses are commonly used in clinical
practice,14 although the optimal dose regimen for improvement of survival remains to be defined and may
differ from doses that alleviate symptoms.
In the present study, we used the rat model of chronic
MI to compare two dosages of lisinopril that resulted in
serum drug concentrations comparable to the drug
levels seen in heart failure patients receiving a low dose
of ~2.5 to 5 mg/d or a high dose of :20 mg/d.2021 The
latter dose is equivalent to the target dose of enalapril
used in large clinical trials.6'1617 Treatment with the high
dose resulted in a substantial reduction of the 1-year
mortality rate, whereas the low dose did not. Importantly, the 1-year mortality rate of rats receiving highdose lisinopril was significantly lower than the mortality
rate of rats on low-dose treatment. In an additional
analysis, the mortality data were stratified according to
infarct size and analyzed with a Cox proportionalhazards model. In relation to the 1-year mortality of
vehicle-treated infarcted rats, low-dose treatment
caused a nonsignificant 19.9% risk reduction, whereas
high-dose treatment resulted in a highly significant risk
reduction of 71.1%. To analyze whether the effects of
low-dose or high-dose lisinopril depend on infarct size,
rats were classified as having small, moderate, and large
infarcts. Low-dose treatment did not reduce long-term
mortality in any of the three groups, whereas the high
dose prolonged survival in rats with small and moderate
infarcts. These findings are consistent with earlier results of Pfeffer et al,5 who demonstrated that a hypotensive dose of captopril reduced the long-term mortality
of rats with moderate but not with large infarcts.
Plasma and Tissue ACE Activities During Chronic
Lisinopril Treatment
What are the mechanisms that underlie the therapeutic efficacy of the "high" dose, and why did the "low"
Downloaded from http://circ.ahajournals.org/ by guest on June 9, 2014
Wollert et al Tissue ACE and Survival After Myocardial Infarction
dose fail to reduce long-term mortality? The rat model
of chronic MI represents an animal model of chronic
compensated congestive heart failure. Similar to the
hormonal profile of patients with asymptomatic LV
dysfunction after MI, the circulating levels of renin,
ACE, and Ang II are not elevated in the chronic
compensated stage of this model.7,8 In agreement with
these earlier results, plasma ACE activities and plasma
renin activities were similar in untreated infarcted and
sham-operated rats in the present study. The tissue
RAS, however, is activated in the heart of rats with
chronic MI. In the heart, right ventricular and interventricular septal ACE activities, right ventricular ACE
mRNA levels, and LV angiotensinogen mRNA levels
are elevated in relation to infarct size.9,40 Consistent
with these data, we observed a selective increase in LV
ACE activity and ACE mRNA in infarcted rats. Conceivably, an upregulation of the ACE in the heart may
lead to an increased intracardiac Ang I to Ang II
conversion rate. Ang II generated locally may cause
impairment of diastolic relaxation41 and might be a
mediator of ventricular hypertrophy via its growthpromoting effects.42,43 In the kidneys, the expression of
angiotensinogen mRNA is upregulated in relation to
infarct size.10 The resulting increase in renal Ang II
levels may contribute to sodium and fluid retention in
heart failure.10 It has been speculated that interference
with the activated tissue RAS in the heart and kidney
might, in part, mediate the beneficial effects of ACE
inhibitors.44
Both dosages of lisinopril resulted in a profound
inhibition of plasma and pulmonary ACE activities.
Moreover, both dose regimens exerted a significant
rightward shift of the Ang I pressure-response curve,
indicating a sustained inhibition of the plasma RAS
during the 1-year treatment. Our observation that lowdose lisinopril did not affect mortality after MI indicates
that inhibition of the plasma and pulmonary ACE alone
does not necessarily improve survival after MI in the
rat. Importantly, renal ACE activity was inhibited only
by high-dose lisinopril, possibly representing an important mechanism involved in the beneficial effect on
survival. In the rat infarct model, inhibition of renal
ACE by enalapril has been shown to be associated with
a normalization of renal angiotensinogen mRNA levels
and a higher daily sodium and fluid excretion.44 Moreover, blood pressure reduction during chronic enalapril
treatment correlates with the degree of renal ACE
inhibition.44 Consistent with these recent findings, highdose lisinopril caused a stronger reduction in arterial
blood pressure compared with low-dose treatment.
Cardiac ACE activity was not affected by long-term
high-dose lisinopril therapy but was profoundly depressed after acute administration. Consistent with the
present study, both captopril and enalapril failed to
suppress interventricular septal ACE activity during
chronic administration in the rat infarct model, although a significant inhibition after acute gavage was
achieved by both agents.44 It should be noted that the
measurement of tissue ACE activities ex vivo underestimates the degree of functional ACE inhibition in
vivo.45 On the basis of these recent observations, it is
quite likely that a partial inhibition of cardiac ACE by
lisinopril (or captopril44) was achieved in vivo. This
assumption is consistent with recent observations that
2465
long-term ACE inhibition in the rat infarct model is
associated with reduced cardiac Ang II content,
whereas plasma angiotensin levels remained unchanged.46 However, the lack of inhibition of cardiac
ACE activity ex vivo after long-term therapy in the face
of profoundly depressed cardiac ACE activity ex vivo
after acute administration indicates that other factors
are involved in the blunted inhibition of cardiac ACE
activity during long-term lisinopril therapy. Hirsch et
al"4 speculated that the cardiac ACE might be induced
during chronic treatment. In fact, recent data suggest
that ACE inhibitor treatment stimulates ACE gene
expression in the lungs by reducing the synthesis of Ang
II, thereby removing a negative feedback mechanism.47
By using a competitive RT-PCR, we demonstrate that
LV ACE mRNA levels are upregulated by ='80% in
infarcted rats. Importantly, ACE mRNA expression
correlated with ACE activity, suggesting that increased
mRNA levels are translated into increased LV ACE
activity in these rats. However, the expression of ACE
mRNA was similar in infarcted rats treated with lisinopril and vehicle over 6 weeks. Although the present
study does not show induction of ACE mRNA in the LV
with long-term ACE inhibitor treatment, our findings do
not exclude the possibility that a transient induction of
the enzyme occurs after initiation of ACE inhibitor
therapy. Studies are currently under way in our laboratory to address this issue. Conceivably, increased LV
expression of ACE mRNA early after administration of
ACE inhibitors may be offset during long-term therapy
by sustained unloading of the LV due to systemic effects
of ACE inhibitors. Indeed, the present study shows that
the expression of LV ANF mRNA, a marker gene
whose expression is upregulated in cardiac hypertrophy
and failure, was reduced during long-term high-dose
lisinopril.
Influence of Low-Dose and High-Dose
Lisinopril on Ventricular Weights and
LV ANF mRNA Expression
A reduction of LV weights was achieved by high-dose
but not by low-dose lisinopril. This effect was present in
analysis of the data of the 1-year treatment protocol as
well as in rats treated for 6 weeks (ie, before the onset
of excess mortality in the infarcted animals). This
suggests that the high-dose regimen prevented the
development of reactive hypertrophy of the LV. Conversely, the LV weights of placebo- and low-dosetreated infarcted rats were similar compared with sham
animals, indicating the presence of reactive cardiac
hypertrophy compensating for the loss of myocardium
after infarction, which is replaced by scar tissue of low
mass density. Thus, improved survival after MI
achieved by high-dose treatment was associated with
prevention of LV hypertrophy, and the failure of lowdose lisinopril to improve survival was associated with
development of LV hypertrophy. Although the association does not prove a causal relation, it is tempting to
speculate that reduction in LV hypertrophy during ACE
inhibitor therapy is a marker for a beneficial effect on
survival. Our results on the ventricular expression of
ANF, an established molecular marker of LV hypertrophy and increased wall stress, would support our notion.
The ANF gene expression is very low in the normal
Downloaded from http://circ.ahajournals.org/ by guest on June 9, 2014
2466
Circulation Vol 90, No S November 1994
adult ventricle but high in the ventricles during embryonic development and in ventricular hypertrophy. An
upregulation of ventricular ANF expression has been
demonstrated in the rat model of chronic MI as well as
in other animal models of ventricular hypertrophy.48-50
In agreement with an earlier study from our group,48
plasma ANF levels and LV ANF mRNA expression
were elevated in infarcted rats. Plasma levels of ANF
tended to decrease with lisinopril treatment. Only highdose lisinopril treatment significantly reduced the expression of ANF mRNA in the LV, consistent with a
previous study using a hypotensive dose of an ACE
inhibitor.51 An increase in ventricular wall stress is
considered to represent an important trigger mechanism for the upregulation of LV ANF mRNA expression.49,52 Since high-dose but not low-dose lisinopril
caused a sustained reduction in arterial blood pressure
over a period of 1 year, it is quite likely that the
reduction in ANF mRNA expression was primarily
attributed to LV unloading. Notably, low- and high-dose
lisinopril differed in their ability to reduce arterial blood
pressure, LV ANF expression, and LV hypertrophy.
Therefore, the results from the present study as well as
the data reported by Pfeffer et al4,5 suggest that hypotensive dosages are required so as to reduce the
long-term mortality in rats with chronic MI. It should be
noted that this may not necessarily be true for other
animal models of heart failure or pressure overload. In
rats made hypertensive by aortic banding, a reduction of
LV hypertrophy and interstitial myocardial fibrosis was
achieved by a very low dose of ramipril that did not
affect arterial blood pressure.15,53 Thus, the relative
contributions of afterload reduction and direct cardiac
action for the beneficial effects of ACE inhibitors may
vary depending on the animal model and/or the end
point studied.
In summary, high-dose ACE inhibition, characterized
by a sustained reduction of arterial blood pressure,
inhibition of renal ACE activity, and reduction of LV
hypertrophy, reduced long-term mortality after MI in
the rat. Low doses, although exerting significant inhibition of circulating and pulmonary ACE, do not affect
LV hypertrophy and long-term mortality after MI.
Persistent inhibition of renal ACE may play an important role in this respect by limiting sodium retention.
The present observations may have important clinical
implications by providing experimental evidence for the
requirement of high-dose ACE inhibition to improve
survival after MI. The results of a small clinical pilot
study are consistent with this notion, suggesting that
high doses of captopril are more effective compared
with doses that are commonly used in clinical practice
with regard to improvement of functional status and
survival in patients with heart failure.54
Acknowledgments
This work was supported by grants from the Deutsche
Forschungsgemeinschaft (Dr 148/6-1) and Zeneka, Macclesfield, UK. Dr Drexler is an Established Investigator of the
Deutsche Forschungsgemeinschaft (Dr 148/5-2). We are indebted to Alex Oldham, MD, and Anita Low, MD, for
technical assistance and support in performing this study.
References
1. Weisman HF, Bush DE, Mannisi JA, Weisfeldt ML, Healy B.
Cellular mechanisms of myocardial infarct expansion. Circulation.
1988;78:186-201.
2. Pfeffer JM. Progressive ventricular dilation in experimental myocardial infarction and its attenuation by angiotensin-converting
enzyme inhibition. Am J Cardiol. 1991;68:17D-25D.
3. Olivetti G, Capasso JM, Meggs LG, Sonnenblick EH, Anversa P.
Cellular basis of chronic ventricular remodeling after myocardial
infarction in rats. Circ Res. 1991;68:856-869.
4. Pfeffer JM, Pfeffer MA, Braunwald E. Influence of chronic captopril therapy on the infarcted left ventricle of the rat. Circ Res.
1985;57:84-95.
5. Pfeffer MA, Pfeffer JM, Steinberg C, Finn P. Survival after an
experimental myocardial infarction: beneficial effects of long-term
therapy with captopril. Circulation. 1985;72:406-412.
6. Pfeffer MA, Braunwald E, Moye LA, Basta L, Brown EJ, Cuddy
TE, Davis BR, Geltman EM, Goldman S, Flaker GC, Klein M,
Lamas GA, Packer M, Rouleau J, Rouleau JL, Rutherford J,
Wertheimer JH, Hawkins CM, on behalf of the SAVE Investigators. Effect of captopril on mortality and morbidity in patients
with left ventricular dysfunction after myocardial infarction: results
of the Survival and Ventricular Enlargement Trial. N Engl J Med.
1992;327:669- 677.
7. Hodsman GP, Kohzuki M, Howes LG, Sumithran E, Tsunoda K,
Johnston CI. Neurohormonal responses to chronic myocardial
infarction in rats. Circulation. 1988;78:376-381.
8. Rouleau JL, de Champlain J, Klein M, Bichet D, Moye L, Packer
M, Dagenais GR, Sussex B, Arnold JM, Sestier F, Parker JO,
McEwan P, Bernstein V, Cuddy TE, Lamas G, Gottlieb SS,
McCans J, Nadeau C, Delage F, Hamm P, Pfeffer MA. Activation
of neurohumoral systems in postinfarction left ventricular dysfunction. JAm Coll Cardiol. 1993;22:90-98.
9. Hirsch AT, Talsness CE, Schunkert H, Paul M, Dzau VJ. Tissuespecific activation of cardiac angiotensin converting enzyme in
experimental heart failure. Circ Res. 1991;69:475-482.
10. Schunkert H, Ingelfinger JR, Hirsch AT, Tang SS, Litwin SE,
Talsness CE, Dzau VJ. Evidence for tissue-specific activation of
renal angiotensinogen mRNA expression in chronic stable experimental heart failure. J Clin Invest. 1992;90:1523-1529.
11. Sadoshima J, Izumo S. Molecular characterization of angiotensin
Il-induced hypertrophy of cardiac myocytes and hyperplasia of
cardiac fibroblasts: critical role of the ATI receptor subtype. Circ
Res. 1993;73:413-423.
12. Sadoshima J, Izumo S. Signal transduction pathways of angiotensin
Il-induced c-fos gene expression in cardiac myocytes in vitro: roles
of phospholipid-derived second messengers. Circ Res. 1993;73:
424-438.
13. Sadoshima J, Izumo S. Mechanical stretch rapidly activates
multiple signal transduction pathways in cardiac myocytes:
potential involvement of an autocrine/paracrine mechanism.
EMBO J. 1993;12:1681-1692.
14. Cohn JN. The prevention of heart failure: a new agenda. N Engl J
Med. 1992;327:725-727.
15. Linz W, Schaper J, Wiemer G, Albus U, Scholkens BA. Ramipril
prevents left ventricular hypertrophy with myocardial fibrosis
without blood pressure reduction: a one year study in rats. Br J
Pharmacol. 1992;107:970-975.
16. The SOLVD Investigators. Effect of enalapril on survival in
patients with reduced left ventricular ejection fractions and congestive heart failure. N Engl J Med. 1991;325:293 -302.
17. The CONSENSUS Trial Study Group. Effects of enalapril on
mortality in severe congestive heart failure: results of the Cooperative North Scandinavian Enalapril Survival Study (CONSENSUS). N Engl J Med. 1987;316:1429-1435.
18. MacLean D, Fishbein MC, Braunwald E, Maroko PR. Long-term
preservation of ischemic myocardium after experimental coronary
artery occlusion. J Clin Invest. 1978;61:541-551.
19. Drexler H, Depenbusch JW, Truog AG, Zelis R, Flaim SF. Effects
of diltiazem on cardiac function and regional blood flow at rest and
during exercise in a conscious rat preparation of chronic heart
failure (myocardial infarction). Circulation. 1985;71:1262-1270.
20. Till AE, Dickstein K, Aarsland T, Gomez HJ, Gregg H, Hichens
M. The pharmacokinetics of lisinopril in hospitalized patients with
congestive heart failure. Br J Clin Pharmacol. 1989;27:199-204.
21. Case DE. The clinical pharmacology of lisinopril. J Hum
Hypertens. 1989;3:127-131.
22. Flaim SF, Nellis SH, Toggart EJ, Drexler H, Kanda K, Newman
ED. Multiple simultaneous determinations of hemodynamics and
flow distribution in conscious rat. J Pharmacol Methods. 1984;
11:1-39.
23. Dolber
PC, Spach MS. Picrosirius red staining of cardiac muscle
following phosphomolybdic acid treatment. Stain Technol. 1987;62:
23-26.
Downloaded from http://circ.ahajournals.org/ by guest on June 9, 2014
Wollert et al Tissue ACE and Survival After Myocardial Infarction
24. Hichens M, Hand EL, Mulcahy WS. Radioimmunoassay for angiotensin converting enzyme inhibitors. Ligand Q. 1981;4:43. Abstract.
25. Menard J, Catt KJ. Measurement of renin activity concentration
and substrate in rat plasma by radioimmunoassay of angiotensin I.
Endocrinology. 1972;90:422-430.
26. Munzel T, Drexler H, Holtz J, Kurtz S, Just H. Mechanisms
involved in the response to prolonged infusion of atrial natriuretic
factor in patients with chronic heart failure. Circulation. 1991;83:
191-201.
27. Cushman DW, Cheung HS. Spectrophotometric assay and properties of the angiotensin-converting enzyme of rabbit lung.
Biochem Pharmacol. 1971;20:1637-1648.
28. Chomczynski P, Sacchi N. Single-step method of RNA isolation by
acid guanidinium thiocyanate-phenol-chloroform extraction. Anal
Biochem. 1987;162:156-159.
29. Rosen KM, Lamperti ED, Villa-Komaroff L. Optimizing the
Northern blot procedure. Biotechniques. 1990;8:398-403.
30. Seidman CE, Duby AD, Choi E, Graham RM, Haber E, Homcy C,
Smith JA, Seidman JG. The structure of rat preproatrial natriuretic factor as defined by a complementary DNA clone. Science.
1984;225:324-326.
31. Cleveland DW, Lopata MA, McDonald RJ, Cowan NJ, Rutter WJ,
Kirschner MW. Number and evolutionary conservation of alphaand beta-tubulin and cytoplasmic beta- and gamma-actin genes
using specific cDNA probes. Cell. 1980;20:95-105.
32. Becker-Andre M, Hahlbrock K. Absolute mRNA quantification
using the polymerase chain reaction (PCR): a novel approach by a
PCR aided transcript titration assay (PATTY). Nucleic Acids Res.
1989;17:9437-9446.
33. Gilliland G, Perrin S, Blanchard K, Bunn F. Analysis of cytokine
mRNA and DNA: detection and quantitation by competitive polymerase chain reaction. Proc Natl Acad Sci USA. 1990;87:
2725-2729.
34. Siebert PD, Larrick JW. Competitive PCR. Nature. 1992;359:
557-558.
35. Soubrier F, Alhenc-Gelas F, Hubert C, Allegrini J, John M,
Tregear G, Corvol P. Two putative active centers in human angiotensin I-converting enzyme revealed by molecular cloning. Proc
NatlAcad Sci USA. 1988;85:9386-9390.
36. Bernstein KE, Martin BM, Bernstein EA, Linton J, Striker L,
Striker G. The isolation of angiotensin-converting enzyme cDNA.
J Biol Chem. 1988;263:11021-11024.
37. Bernstein KE, Martin BM, Edwards AS, Bernstein EA. Mouse
angiotensin-converting enzyme is a protein of two homologous
domains. J Biol Chem. 1989;264:11945 -11951.
38. Hubert C, Houot AM, Corvol P, Soubrier F. Structure of the
angiotensin I-converting enzyme gene: two alternate promotors
correspond to evolutionary steps of a duplicated gene. JBiol Chem.
1991;266:15377-15383.
39. Marcus R, Peritz E, Gabriel K. On closed testing procedures with
special reference to ordered analysis of variance. Biometrika. 1976;
63:655-660.
40. Lindpaintner K, Lu W, Niedermajer N, Schieffer B, Just H,
Ganten D, Drexler H. Selective activation of cardiac angiotensinogen gene expression in post-infarction ventricular remodeling
in the rat. J Mol Cell Cardiol. 1993;25:133-143.
2467
41. Schunkert H, Dzau VJ, Tang SS, Hirsch AT, Apstein CS, Lorell
BH. Increased rat cardiac angiotensin converting enzyme activity
and mRNA expression in pressure overload left ventricular hypertrophy. J Clin Invest. 1990;86:1913-1920.
42. Baker KM, Aceto JF. Angiotensin II stimulation of protein synthesis and cell growth in chick heart cells. Am J Physiol. 1990;259:
H610-H618.
43. Dostal DE, Baker KM. Angiotensin II stimulation of left ventricular hypertrophy in adult rat heart: mediation by the AT1
receptor. Am J Hypertens. 1992;5:276-280.
44. Hirsch AT, Talsness CE, Smith AD, Schunkert H, Ingelfinger JR,
Dzau VJ. Differential effects of captopril and enalapril on tissue
renin-angiotensin systems in experimental heart failure.
Circulation. 1992;86:1566-1574.
45. Kinoshita A, Urata H, Bumpus FM, Husain A. Measurement of
angiotensin I converting enzyme inhibition in the heart. Circ Res.
1993;73:51-60.
46. Yamagishi H, Kim S, Nishikimi T, Takeuchi K, Takeda T. Contribution of cardiac renin-angiotensin system to ventricular remodelling in myocardial-infarcted rats. J Mol Cell Cardiol. 1993;25:
1369-1380.
47. Schunkert H, Ingelfinger JR, Hirsch AT, Pinto Y, Remme WJ,
Jacob H, Dzau VJ. Feedback regulation of angiotensin converting
enzyme activity and mRNA levels by angiotensin II. Circ Res.
1993;72:312-318.
48. Drexler H, Hanze J, Finckh M, Lu W, Just H, Lang RE. Atrial
natriuretic peptide in a rat model of cardiac failure: atrial and
ventricular mRNA, atrial content, plasma levels, effect of volume
loading. Circulation. 1989;79:620-633.
49. Mercadier JJ, Samuel JL, Michel JB, Zongazo MA, de la Bastie D,
Lompre AM, Wisnewsky C, Rappaport L, Levy B, Schwartz K.
Atrial natriuretic factor gene expression in rat ventricle during
experimental hypertension. Am J Physiol. 1989;257:H979-H987.
50. Knowlton KU. Atrial natriuretic factor: a molecular marker for
cardiac specific, embryonic, inducible gene expression. Heart
Failure. 1992;8:121-128.
51. Michel JB, Lattion AL, Salzmann JL, de Lourdes Cerol M,
Philippe M, Camilleri JP, Corvol P. Hormonal and cardiac effects
of converting enzyme inhibition in rat myocardial infarction. Circ
Res. 1988;62:641-650.
52. Takemura G, Fujiwara H, Horike K, Mukoyama M, Saito Y,
Nakao K, Matsuda M, Kawamura A, Ishida M, Kida M, Uegaito T,
Tanaka M, Matsumori A, Fujiwara Y, Fujiwara T, Imura H, Kawai
C. Ventricular expression of atrial natriuretic polypeptide and its
relations with hemodynamics and histology in dilated human
hearts: immunohistochemical study of the endomyocardial biopsy
specimens. Circulation. 1989;80:1137-1147.
53. Linz W, Scholkens BA, Ganten D. Converting enzyme inhibition
specifically prevents the development and induces regression of
cardiac hypertrophy in rats. Clin Exp Hypertens. 1989;A11:
1325-1350.
54. Pacher R, Bergler-Klein J, Teufelsbauer H, Wutte M, Baumgartner
W, Ogris E, Glogar D. Clinical and neurohumoral response of
patients with severe congestive heart failure treated with two different captopril dosages. Eur Heart J. 1993;14:273-278.
Downloaded from http://circ.ahajournals.org/ by guest on June 9, 2014


© Copyright 2026