
- LSTM Online Archive
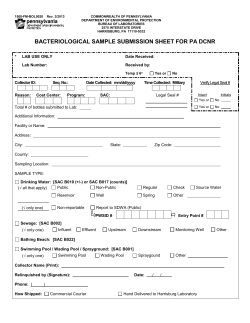
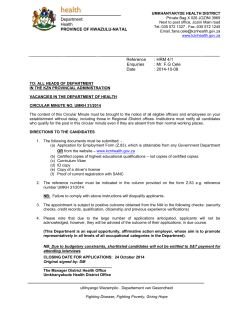
Downloaded from http://rstb.royalsocietypublishing.org/ on April 8, 2015
The coverage and frequency of mass drug
administration required to eliminate
persistent transmission of soil-transmitted
helminths
rstb.royalsocietypublishing.org
Review
Cite this article: Anderson R, Truscott J,
Hollingsworth TD. 2014 The coverage and
frequency of mass drug administration required
to eliminate persistent transmission of
soil-transmitted helminths. Phil. Trans. R. Soc.
B 369: 20130435.
http://dx.doi.org/10.1098/rstb.2013.0435
One contribution of 12 to a Theme Issue
‘After 2015: infectious diseases in a new
era of health and development’.
Subject Areas:
health and disease and epidemiology
Keywords:
soil-transmitted helminths, modelling,
elimination, chemotherapy,
school-based intervention
Author for correspondence:
Roy Anderson
e-mail: [email protected]
Electronic supplementary material is available
at http://dx.doi.org/10.1098/rstb.2013.0435 or
via http://rstb.royalsocietypublishing.org.
Roy Anderson1, James Truscott1 and T. Deirdre Hollingsworth2,3,4
1
London Centre for Neglected Tropical Disease Research, Department of Infectious Disease Epidemiology,
School of Public Health, Faculty of Medicine, Imperial College London, St Marys Campus, Norfolk Place,
London W2 1PG, UK
2
Mathematics Institute, and 3School of Life Sciences, University of Warwick, Coventry CV4 7AL, UK
4
Department of Clinical Sciences, Liverpool School of Tropical Medicine, Pembroke Place, Liverpool L3 5QA, UK
A combination of methods, including mathematical model construction,
demographic plus epidemiological data analysis and parameter estimation,
are used to examine whether mass drug administration (MDA) alone can
eliminate the transmission of soil-transmitted helminths (STHs). Numerical
analyses suggest that in all but low transmission settings (as defined by
the magnitude of the basic reproductive number, R0), the treatment of
pre-school-aged children ( pre-SAC) and school-aged children (SAC) is unlikely to drive transmission to a level where the parasites cannot persist. High
levels of coverage (defined as the fraction of an age group effectively treated)
are required in pre-SAC, SAC and adults, if MDA is to drive the parasite below
the breakpoint under which transmission is eliminated. Long-term solutions to
controlling helminth infections lie in concomitantly improving the quality of
the water supply, sanitation and hygiene (WASH). MDA, however, is a very
cost-effective tool in long-term control given that most drugs are donated
free by the pharmaceutical industry for poor regions of the world. WASH
interventions, by lowering the basic reproductive number, can facilitate the
ability of MDA to interrupt transmission.
1. Introduction
Funding for the control of soil-transmitted helminths (STHs) by mass or targeted
chemotherapy in developing countries has increased steadily in the past 10 years
(figure 1). This is due to generous donations from international aid agencies in the
richer countries, philanthropic organizations and pharmaceutical companies. The
spirit of this expanded effort is captured in the London Declaration in January
2012, and the progress reported 1 year later [2,3]. The effort is part of a broader
push to bring a range of neglected tropical diseases (NTDs) under control, and
in some cases to aim for elimination [4].
Many questions remain about how best to deliver community-based treatment programmes for the various treatable NTDs to obtain the greatest impact
from recent drug donations to the World Health Organization (WHO) and
specific countries. These include the following: who should be treated, how
often should they be treated, can treatment intervals be increased as worm
loads fall, and can transmission be eliminated by repeated treatment alone [5]?
To answer these questions, a detailed understanding of the transmission
dynamics of the parasites is required, because community-based treatment acts
as a perturbation to the parasite’s population dynamics and stability.
WHO guidelines for the community-based treatment of STHs are based on
the consensus views of experts. WHO has chosen prevalence as the main measure
for programme design at initiation of chemotherapy, and for monitoring impact
& 2014 The Authors. Published by the Royal Society under the terms of the Creative Commons Attribution
License http://creativecommons.org/licenses/by/3.0/, which permits unrestricted use, provided the original
author and source are credited.
Downloaded from http://rstb.royalsocietypublishing.org/ on April 8, 2015
60
2
50
40
30
20
10
0
2003
2004
2005
2006
2007
2008
2009
year
Figure 1. Coverage of preventive STH chemotherapy in pre-school-aged children (pre-SAC) and school-aged children (SAC). WHO African Region, by year, 2003–2009 [1].
(Online version in colour.)
in the community. As discussed in §2, this is not the ideal
measure owing to a highly nonlinear relationship between
prevalence and the mean worm load created by the aggregated
distributions of worm numbers per person [5–8]. WHO does
suggest intensity measures where possible, and this may
become the preferred outcome measure for monitoring
impact in the near future.
Four drugs are recommended by WHO for treatment:
albendazole (dose of 400 mg) and mebendazole (dose of
500 mg), which are most widely used in programmes, levamisole (dose of 2.5 mg kg21) and pyrantel (dose of 10 mg kg21),
which are less commonly used. All are well-known, safe and
effective drugs that have been used widely in recent years for
the treatment of Ascaris lumbricoides, Trichuris trichiura and
hookworm (Ancylostoma duodenale and Necator americanus). A
single dose oral anthelminthic treatment can also be given to
pregnant and lactating women, but, as a general rule, drugs
should not be given in the first trimester of pregnancy. In practice, however, few countries have included anthelmintics
in their antenatal care programmes, with only Nepal and
Sri Lanka doing so routinely.
Three strategies are suggested for the use of chemotherapy
in the treatment of infections of STH in the community. The
first is universal population-level application of anthelminthic
drug, in which the community is treated irrespective of age,
sex, infection status or other social characteristic. The second
is targeted group-level application of anthelminthic drug
where the group may be defined by age, attendance at school
or other social characteristic, typically occupation, irrespective
of infection status. The third is selective individual-level application of anthelminthic drug where selection is based on
diagnosis of current infection (see [9,10] for early analyses of
the relative impact of these approaches). This is not considered
in our analyses because of the many practical issues associated
with its delivery.
Six questions are examined in detail in this paper through
data analysis, mathematical model development, parameter
estimation and numerical analysis. A key aim is to evaluate
current WHO guidelines on STH control by anthelmintic
drug administration. The questions are as follows.
Can community-based chemotherapy alone stop transmission of STHs within defined populations? How frequently
should treatment be administered? What level of treatment
coverage is required to lower average worm burdens to low
levels? Can the intervals between treatments be lengthened
once worm burdens fall to low levels? Can transmission be
halted by treating school-aged children (SAC) alone, or by
treating both SAC and pre-SAC? What are the most appropriate measures of control impact? All questions are assessed for
different transmission settings (as measured by R0—low,
medium and high), different values of key parameters (severity
of density dependence, z, different age group contributions
and exposure to infective stages in the habitat, the degree
of parasite aggregation, k) and for different species mixes of
STHs in a given location. We address these questions by both
reviewing existing work and presenting novel analyses.
2. Methods
(a) Outcome measures
A variety of outcome variables can be measured via crosssectional (stratified by age) or longitudinal epidemiological
studies. The most commonly recorded is the prevalence of infection, but for the reasons outlined below, this is of limited value.
The best measure is the intensity of infection measured either
directly by counting worms expelled in the faeces of treated
persons, or indirectly by eggs per gram measures (epgs). The
latter is most frequently used owing to the workload involved
in collecting faeces and counting worms by sieving the faecal
material. For hookworm and Trichuris, such counts are subject
to error owing to the small size of the expelled worms. Counts
of eggs by Kato Katz or McMaster methods are also subjected
to much variability in observation [11], and repeated counts
on the same faecal output or pooling methods are required to
attempt to minimize these [12]. The distribution of epg in
repeated counts from the same faecal output from one patient
follows a negative binomial distribution. Compounding this
variability across counts from different patients, even when in
the same age class, results in greater degrees of aggregation
with very low k-values.
Phil. Trans. R. Soc. B 369: 20130435
percentage coverage of target age groups
rstb.royalsocietypublishing.org
pre-SAC
SAC
Downloaded from http://rstb.royalsocietypublishing.org/ on April 8, 2015
3
800
795
790
785
780
775
770
765
760
755
750
rstb.royalsocietypublishing.org
net parasite egg output
(a)
50
100
worm burden
(b)
200
(c)
7000
eggs per gram of faeces per worm
7000
eggs per gram of faeces per worm
150
Phil. Trans. R. Soc. B 369: 20130435
0
6000
5000
4000
z = 0.921
3000
2000
1000
0
10
20
burden of female worms
30
6000
5000
4000
z = 0.968
3000
2000
1000
0
10
20
burden of worms
30
Figure 2. (a) Relationship between total egg output per host and worm burden for hookworm predicted by observed density-dependent relationships between egg
output and worm load per patient (z ¼ 0.95, where z ¼ exp(2g)). (b) Density-dependent fecundity for Ascaris from the studies of Holland et al. [13] in Nigeria
and (c) Elkins et al. [14] in India with z-values inset. (Online version in colour.)
A further complication arises from the density-dependent
nature of egg production by helminths, where per female
worm egg output falls (often exponentially [7]) as worm load
in the host rises. Figure 2 illustrates this effect by reference to
total egg output per host as a function of worm load for hookworm. An obvious consequence of this effect is that reductions
in mean worm load have a reduced effect on egg intensity
measures, unless the mean load is close to the breakpoint in
transmission (where R0 is close to unity).
In assessments of control impact, a number of different outcome measures can be used. These are the epidemiological
statistics of prevalence and mean intensity of infection, and a
number of other measures such as the force or rate of infection
per host (see §2b for definition), the basic reproductive number
that measures transmission success in the absence of control, R0
and the effective reproductive number that measures transmission
success under the impact of control, Re. In this study, we use temporal changes in average worm loads over the period of the control
programme and post its cessation to assess impact of a defined
control programme as predicted by mathematical models.
We also include our simulated treatment programmes in the
context of WHO guidelines on low, medium and heavy infection
categories based on epg counts, using published data on egg
production per worm.
Given the observed aggregated distributions of worm numbers
per person [7,8], which are well described by the negative binomial
frequency distribution, the relationship between prevalence (as a
proportion infected), p, and the mean worm burden, M, is given by
M k
p¼1 1þ
:
k
Here, k denotes the aggregation parameter of the negative binomial,
which inversely measures the degree of clumping. Typical values
for intestinal helminths lie in the range 0.1–0.9, which reflects a
high degree of aggregation. One consequence of this is that changes
in the mean intensity by many factors (four or more), perhaps
owing to community-based chemotherapy programmes, have
little impact on the prevalence of infection. This feature leads to
the conclusion that prevalence is a very poor outcome statistic by
which to measure the impact of control programmes [8].
The approximate relationship between the fraction of a population treated per unit of time, g, with a drug of efficacy, h, and
mean intensity of infection, M*, at the new equilibrium created
by the repeated treatment after many rounds of chemotherapy
is given by [6]
1=(kþ1)
M ¼ k
{[R0 /(1 L1 ln (1 gh))/t]
(1 z)
1}
:
(2:1)
Here, z ¼ exp(2g), where g denotes the severity of decay in egg
output per worm as mean load rises (figure 2), t is the interval
separating treatments and L1 is adult parasite life expectancy.
A plot of this function (M* versus g) is presented in figure 3,
with parameter values to mimic hookworm infection, with
drug efficacy set at 0.8 (80%), density dependence as defined in
figure 2 with R0 varying from 1.5 to 2.5.
Note that despite the apparent complexity of equation (2.1),
the relationship between M* and g is roughly linear. Also
note that for low R0 values (e.g. 1.5), less than 100% of the community need treating repeatedly to eradicate infection (eliminate
transmission where R0 . 1).
transmission. Numerical studies are required to delineate this
trend, and fuller details are presented in a future publication.
70
60
50
40
30
20
10
0
(c) Data sources
0.6
0.8
0.2
0.4
fraction of population treated, g, per year
1.0
(b) Force of infection
The per capita force of infection, L, is defined as the rate at which
humans acquire mature worms, taking into account survival
from infection to maturity (delay t2) in the human host when
the worm starts to produce eggs—believed to be around 50 – 80
days for Ascaris and 28– 50 days for hookworm. It is an important measure of the transmission potential of the parasite prior to
and post-treatment, and can be measured in a variety of ways.
Typically, it is dependent on host age [15], but for the purpose
of simplicity, we assume an average rate over all age classes. In
these circumstances
L ¼ (m þ m1 )[R0 exp( L(t1 þ t2 )) 1].
(2:2)
Here, R0 is the basic reproductive number, 1/m human life
expectancy, 1/m1 adult parasite life expectancy, t1 the average
time from egg release to maturation to the infective state and
t2 is the maturation delay of the parasite in the human host.
Where the maturation delays (t1 and t2) are short with
respect to adult worm life expectancy (1/m1), this simplifies to
L ¼ (m þ m1 )(R0 1):
(2:3)
If worm life expectancy (L1 ¼ 1/m1) is short (a year or two) in
relation to human life expectancy (many decades), equation (2.3)
simplifies to
L¼
(R0 1)
:
L1
(2:4)
The per host time unit of equation (2.4) is set by the unit of time
set to measure worm life expectancy.
For a study of Ascaris in a rural community in Taiwan [16],
Anderson [15] estimated the per capita per annum infection
rate, L, to lie between 0.5 and 9 depending on host age (large
values for older age groups). From a study of Ascaris in Iran
where transmission was intense, Croll et al. [17] gave an estimate
of the per annum infection rate of 22 worms per host.
The magnitude of the force of infection (hence the magnitude
of R0) sets the time over which worm loads will bounce back to precontrol levels after a round of chemotherapy. The higher the value
of L, the faster is the bounce back time. The force of infection therefore determines the optimal intervals between rounds of treatment.
For a simple deterministic model, equation (2.4) makes clear how
this rate of reinfection depends simply on the basic reproductive
number, R0, and parasite life expectancy, L1. The higher the
value of R0, the more frequent must be treatment rounds to sustain
low average worm burdens. Long adult worm life expectancies
imply less frequent rounds of treatment for a fixed R0. This is
because adult worm life expectancy acts inversely to determine
the rapidity of turnover of the adult parasite population, and as
such dictates how often treatment needs to be administered.
More complex models that represent mating probabilities
and age class-dependent exposure reveal more complex relationships for bounce back times, with the rate of reinfection being
low when worm loads are reduced near to a ‘breakpoint’ in
(d) Demography
Demographic data are obtained from the US Census Bureau to
calculate the fraction of total country populations in the infant
class (0– 1), pre-SAC class (2– 4 years), SAC (5– 14 years) and
Phil. Trans. R. Soc. B 369: 20130435
Figure 3. Relationship between the proportion of the population treated per
year, g, and the post-treatment equilibrium worm load (for, from bottom to
top, R0 ¼ 1.5, 2.0 and 2.5). (Online version in colour.)
At present, our knowledge of the key parameters controlling the
transmission dynamics (and hence response to community-based
chemotherapy) of STHs is limited, with many of the published
estimates deriving from studies in the 1980s or earlier [7].
Table 1 presents estimates of the four major epidemiological
parameters, namely parasite life expectancy, density dependence
in fecundity, parasite aggregation (negative binomial parameter, k)
and the basic reproductive number, R0. In the numerical studies
of mathematical model behaviour under various assumptions concerning treatment intensity and frequency, we use the estimates
listed in table 1, unless otherwise stated.
The expanded efforts to control STHs currently underway present opportunities to add to our knowledge of these key
parameters. For example, monitoring reinfection (by intensity
measures, not prevalence), as illustrated by the studies of Ascaris
by Hliang et al. [32] and Elkins et al. [14], can provide information
on which to estimate the force of infection, L. Observed patterns
of change of prevalence and intensity with age vary greatly by
species of STH and by study location. However, some general
trends are apparent from a wide range of published surveys
from many different countries as illustrated in figure 4. Ascaris
tends to rise to peak intensity in 5–14 year olds and then decline
in adults. By contrast, hookworm intensity tends to continue to
rise through adult life, where most parasites are harboured in the
adult age classes. Trichuris is somewhat intermediary between
the two—but perhaps more towards the convex curves for Ascaris
where intensity falls in adult age classes. For all three species,
prevalence rises rapidly and approaches a plateau in SAC to
remain at a plateau in adult life. This contrast between the two epidemiological statistics (two parameters of the frequency
distribution of parasite numbers per host) highlights why intensity is a much better measure than prevalence as a reflection of
burden, transmission activity and the impact of control measures
throughout the age groups.
The reasons for convexity in age–intensity profiles remain
poorly understood. The question of whether it is due to ‘ecology
(age-dependent exposure) or immunology (acquired immunity)’
remains unanswered [35]. The truth is likely to be a combination
of both processes. For each STH species, these patterns of change
with age appear to change very little with respect to the overall
intensity of transmission in a given habitat. This observation may suggest that acquired immunity is less important than
age-dependent exposure.
Age-dependent exposure may result from a variety of factors,
but for the STHs, movement behaviour and defecation behaviour
with respect to the spatial distribution of infective stages in a habitat, is clearly very important. The mathematical model defined
below takes explicit account of such behavioural and spatial factors
by the three major age groups of individuals (pre-SAC, SAC and
adults). Statistical fitting procedures (Monte Carlo Markov chain
(MCMC) methods) are used to estimate these age-dependent
rates of exposure to infective stages for the three age groupings
from age–intensity profiles. MCMC methods are used to fit the
model to age-related patterns of infection, to estimate both transmission intensity (measured by the basic reproductive number,
R0, the average number of offspring produced by one female
worm that survive to reproductive maturity) and age-related
exposure to the common infective stage pool.
4
rstb.royalsocietypublishing.org
mean worm burden M*
Downloaded from http://rstb.royalsocietypublishing.org/ on April 8, 2015
Ascaris lumbricoides (worm burden)
16
14
12
10
8
6
4
2
0
Trichuris trichuria (epg)
600
hookworm (epg)
50
500
5
40
400
rstb.royalsocietypublishing.org
mean intensity (wormload or epg)
Downloaded from http://rstb.royalsocietypublishing.org/ on April 8, 2015
30
300
20
200
10
100
prevalence (%)
0–1
2–4
0
100
90
80
70
60
50
40
30
20
10
0
100
90
80
70
60
50
40
30
20
10
0
5–9 10–14 15–24 25–34 35–49 50+
age categories
<5
5–9
10–19 20–29
age categories
30–44
45+
<5
5–9
10–19 20–29
age categories
30–44
45+
Figure 4. Age– intensity profiles for mean intensity and prevalence (%) for Ascaris [19], Trichuris [33] and hookworm [34]. (Online version in colour.)
Table 1. Estimates of the key epidemiological parameters.
parasite
R0
Ascaris
Ascaris
density dependence,
z [5exp(2l )]
adult worm life
expectancy (years)
0.81
0.968
0.927
1
0.991
k
region
reference
India
Nigeria
[14]
[13]
Iran
Bangladesh
[17]
[18]
Ascaris
Ascaris
4–5
0.57
0.6 – 0.7
Ascaris
1–3
0.46
Myanmar
[19]
1–2
0.59
0.44
St Lucia
Bangladesh
[20]
[21]
Ascaris
Ascaris
0.36 – 0.54
0.54
South Korea
many countries
[22]
[23]
Ascaris
Ascaris
—
0.2 – 0.5
Malaysia
Japan
[24]
hookworm
0.45
Papua New Guinea
[25]
India
[26,27]
Ascaris
Ascaris
hookworm
Ancylostoma
Necator
2–3
0.992
—
1
0.03 – 0.6
3– 4
Necator
0.16 – 0.24
India
[7,28]
Necator
Necator
0.05 – 0.4
3–4
Taiwan
China
[15]
[29]
Necator
Trichuris
2
8 – 10
Zimbabwe
St Lucia
[30]
[20]
Trichuris
4–6
Jamaica
[31]
0.35
0.2 – 0.4
0.92
adults (15þ years) [36]. A representative summary of this information is presented in table 2, and these figures are used in
our analyses of different treatment programmes targeted at
some combination of these three age groups. For countries
with endemic STH infection, typical figures are 10 – 15% in preSAC, 20 – 30% in SAC and 55 – 75% in adult age groups. Depending on the age profiles for the intensity of infection (figure 4),
these figures suggest that less than 50% of worms will be
exposed to treatment if chemotherapy is only targeted at the
pre-SAC and SAC [8].
(e) WHO guidelines
The current guidelines for community-based treatment for STH
infections based on repeated rounds of chemotherapy are
detailed in two reports published in 2002 and in 2011 [37,38].
In brief, these documents define low – medium and high
transmission locations as ones in which the prevalence of infection with any STH is less than 50% and at least 50%. If
intensity measures based on epgs of faeces are performed, then
the classification suggested is detailed in table 3 of light,
medium and heavy epg counts. Average epgs may be used
Phil. Trans. R. Soc. B 369: 20130435
100
90
80
70
60
50
40
30
20
10
0
0
Downloaded from http://rstb.royalsocietypublishing.org/ on April 8, 2015
Table 2. Percentages of total population in pre-school-aged classes, schoolaged classes and all .15 years of age in 2013.
5 – 14
(school
age)
151
(adults)
Bangladesh
4.2
6.4
22.4
67.0
Botswana
Ethiopia
4.4
7.1
6.6
9.8
22.2
27.5
66.9
55.7
India
Iran
3.9
3.5
5.8
5.0
19.2
15.2
71.2
76.3
Jamaica
Kenya
3.7
6.0
5.6
9.3
19.7
27.1
71.1
57.7
Myanmar
3.6
5.3
17.8
73.3
St Lucia
Uganda
2.8
8.2
4.2
11.0
14.6
29.7
78.4
51.1
UK
Zimbabwe
2.4
6.0
3.6
8.0
11.2
25.4
82.7
60.6
Table 3. Classification of intensity of infection for individuals by STH
species based on WHO guidelines.
parasite
light
epg
medium
epg
heavy
epg
Trichuris trichuria
1 – 999
1000– 9999
10 000
Ascaris lumbricoides
hookworm
1 – 4999
1 – 1999
5000– 49 999
2000– 3999
50 000
4000
(f ) Mathematical model
We use a deterministic model to represent the dynamics of worm
burden in four contiguous age classes: infants (0 – 1 years of age),
pre-SAC (2– 4 years), SAC (5– 14 years of age) and adults (all
more than 15 years old). The 0 – 4 age range is split into two,
because only the pre-school categories (2 – 4) are eligible for treatment. Previous work [39] has analysed the dynamics of two age
class models (less than and greater than 15 years) under regular
treatment. However, in the present case, the short age ranges that
are a feature of this model are comparable to worm lifespans
(1– 2.5 years). Hence, we use an explicitly age-structured model
and superimpose our desired age structure on it.
The fundamental model used to describe the evolution of the
worm burden of individuals of age a is taken from Anderson &
May [6].
9
@M @M
>
>
þ
¼ b(a)L m(a)M sM
=
@t
@a
(2:5)
ð amax
>
dL
c
;
¼
H(a)r(a)f(M(a))f(M(a))da mL, >
and
dt HT a¼0
where M(a) is the mean worm burden in age group a and L is the
volume of infectious material in the environment to which
individuals are exposed. The function f (.) captures the density
dependence of fecundity, and f is a reduction factor accounting
for the effects of sexual reproduction of worms in the host [6].
lMz
f(M) ¼
either across multiple samples per stool or multiple samples from
stools collected on different days from the same patient.
These classifications are designed to guide country-based
programmes on the frequency of treatment required in given settings. Current practice is the treatment of SAC twice a year where
prevalence is more than 50% and once a year where prevalence is
20 – 49%. Many alternatives exist such as (i) treatment of SAC and
pre-SAC once or twice a year; (ii) treatment of an entire community once or twice a year; (iii) treatment of SAC at more frequent
intervals than once/twice a year and (iv) treatment of SAC at less
frequent intervals than once/twice a year. We examine these
alternatives in §3. However, from a methodological standpoint,
careful examination of the prevalence classification raises a
number of issues of great importance to the design of effective
treatment and monitoring programmes. These are illustrated in
figure 5, which displays the relationship between the prevalence
of infection and two epidemiological parameters, the mean
intensity of infection and the basic reproductive number, R0
(both are direct measures of the intensity of transmission). The
relationship shown is based on a negative binomial distribution
of parasites per host with an aggregation parameter, k, assigned
a value of 0.6 which is typical for many STHs (table 1).
These relationships are highly nonlinear and imply that the
low and medium prevalence band (less than 50% prevalence)
reflects low transmission intensity areas (not low and medium).
The high prevalence band (more than 50% prevalence) reflects
both medium, high and very high transmission intensity areas,
and as such a finer stratification of this class is suggested if the
right frequency of treatment is to be calculated to reduce burdens
to very low levels or below the transmission breakpoint (created by
the mating frequency issue for dioecious parasites; see [7]). If the
[1 þ M(1 z)/k](kþ1)
"
#
1 þ M(1 z)/k (kþ1)
:
f(M) ¼ 1 1 þ M(2 z)/k
Here, k is the shape parameter of the assumed negative binomial distribution of worms among hosts (varying inversely with
the degree of clumping) and z is the density-dependent fecundity
parameter as above (it is assumed that the model is in terms of
female worms and that the effect of fecundity is dependent on
the host burden of female worms).
The effects of host behaviour are encapsulated in the agedependent parameters r(a), which govern what fraction of an
individual’s egg output enters the reservoir, and the b(a),
which govern the degree of exposure of the various age groups
to the reservoir. Only the relative values of these parameter vectors are important. The absolute size of overall exposure is just
one element of the parameter grouping that defines R0 and
hence is a factor of the R0 value chosen. In the simulations
used in this paper, we have used a demographic profile to
match the population of Uganda [34]. The demography of the
host population is described by the survival function, H(a), representing the probability for an individual to reach age a. The
survival function is related to the mortality, m(a), through
ða
m(t)dt:
ln (H(a)) ¼ t¼0
Ð
The parameter HT ¼ H(a)da. For this model, the value of R0
is given by the expression
R0 ¼
clz
HT m
ð amax
a¼0
b(a)
S(a)
amax
ð
r(t)H(t)S(t)dtda:
t¼a
Phil. Trans. R. Soc. B 369: 20130435
country
6
rstb.royalsocietypublishing.org
2–4
(preschool)
0–1
(infants)
parasites are more highly aggregated (k-values around 0.2–0.1;
table 1), as is often the case for hookworm and Trichuris infections,
this problem becomes more acute, with more than 50% prevalence
covering low, medium and high transmission intensity communities. Some revision of the guidelines is suggested by figure 5,
with intensity measures replacing prevalence to define low,
medium and high transmission intensity communities.
low and medium risk
(<50% prevalence)
0
R0 - basic reproductive number
k = 0.6
high risk
(>50% prevalence)
0.1 0.2 0.3 0.4 0.5 0.6 0.7 0.8 0.9 1.0
proportion infected
44
42
40
38
36
34
32
30
28
26
24
22
20
18
16
14
12
10
8
6
4
2
0
7
k = 0.6
low and medium risk
(<50% prevalence)
high risk
(>50% prevalence)
0.1 0.2 0.3 0.4 0.5 0.6 0.7 0.8 0.9 1.0
proportion infected
Figure 5. Approximate relationships for soil-transmitted helminths between prevalence (as a proportion) and the mean worm burden, and prevalence and the basic
reproductive number R0 (simple relationship—no mating function, no age structure, see Anderson & May [7]). (Online version in colour.)
The parameter S(a) is the survival function for a worm
recruited into a host at birth.
ln (S(a)) ¼ ða
(m(t) þ s)dt:
t¼0
Owing to stratification of the data, we use a discretized version of the evolution equations with separate equations for the
worm burden in annual age classes. The model has the form
9
>
>
>
>
>
>
>
>
=
dMi
Mi Mi1 >
¼ bi L (s þ mi )Mi þ
dt
Di
Di1 >
>
>
>
N
>
X
>
dL
Hi ri
>
¼c
and
f(Mi )f(Mi )Di mL, >
>
;
H
dt
dM1
M1
¼ b1 L (s þ m1 )M1 ,
dt
D1
i
(2:6)
T
where 1 i N. The parameter 4i is the width of the ith age
class. We use annual age classes, so 4i ¼ 1 and N ¼ 70. Agedependent parameters, such as b and r, are discretized into
N-values, one for each age class. Similarly, the expression for
R0 is approximated by summations in the place of integrals.
Age-dependent parameters have distinct values within each of
the broad age classes described above (infant, pre-SAC, SAC,
adult). For example, b2, b3 and b4 all have the b-value assigned
to the pre-SAC age group. Because only the relative values of b
and r are important, we arbitrarily define b- and r-values to be
unity for the SAC group.
Treatment efficacy in an age group is the product of the fraction of the age group enrolled in treatment, and the mean fraction
of worms eliminated from treated hosts. Treatment efficacy is
treated in the same manner as b and r, with distinct levels of
treatment in each of the four age categories giving an efficacy,
gi, in the ith annual age group (treatment efficacy for infants is
zero, by definition). Treatment is applied at regular intervals
and reduces the mean worm burden in a class by a factor gi.
To ascertain whether a particular treatment age profile and interval resulted in eradication of the parasite, the model was run
from its treatment-free equilibrium through a sequence of treatment intervals lasting 25 years. For a given level of treatment
in the pre-SAC and adult age groups, a bisection algorithm
was used to identify the lowest level in treatment for the SAC
group that resulted in long-term eradication.
(g) Parameter estimates
The majority of parameter values for the model described in §2f
were taken from within the ranges found in the literature. Parameter estimates are quite sparse owing to the difficulties of
measurement. Table 1 gives a brief survey of values for k, z and
R0 across different studies and species. While variability is wide,
there are clear differences between species. However, data for the
age-specific contact rate of hosts with the infectious reservoir (b)
and age-specific contribution of hosts to the reservoir (r) are
unknown. These were estimated by fitting the model to worm
burden age profile data [14,30]. The age-dependent variable, M,
in our model represents the mean of a negative binomial distribution, making it straightforward to construct a likelihood for a
given set of data. In each case, other parameters were chosen to
match species natural history and the survival profile of the host
population in the area of the study and at the time it was carried
out. Using MCMC methods, we identified the maximum-likelihood estimators for R0 and b in the three observed age
categories. The MCMC chain was constructed using the MCMC
package in R (v. 2.15.1). The values of r have no effect on the
shape of the endemic worm burden age profile, but do have an
effect on the transmission dynamics following treatment and
reinfection. We therefore investigate two scenarios, first that the
rate of contact with the infectious reservoir is proportional to
the contribution to the reservoir of a given age class: hence
bi / ri for observed age class, i, following the analysis first
presented by Truscott et al. [40]; second, as a contrast, the assumption that the deposit rate into a shared pool is the same for r ¼ 1 for
all groups, we further investigate not only a fixed programme
duration, but also variable programme duration.
3. Results
We present the critical treatment coverage as a threedimensional surface of the effective treatment combinations of
pre-SAC, SAC and adults that results in crossing the critical
treatment surface to extinguish parasite transmission (values
equal to or above the surface cross the ‘breakpoint’ (an unstable
equilibrium) and lead to long-term extinction in the absence of
immigration). Results in the format of look-up tables of the
values within these plots may be more useful to public health
Phil. Trans. R. Soc. B 369: 20130435
80
75
70
65
60
55
50
45
40
35
30
25
20
15
10
5
rstb.royalsocietypublishing.org
mean worm burden
Downloaded from http://rstb.royalsocietypublishing.org/ on April 8, 2015
Downloaded from http://rstb.royalsocietypublishing.org/ on April 8, 2015
(c)
R0 = 3
1.00
0.75
0.50
0.25
0.25
0.50
0.75
-SA
C
1.00
pre
lts
adu
0.75
0.25
0
0.50
0.25
0.50
0.75
-SA
C
1.00
0.50
pre
lts
adu
0.75
0
0.25
0.25
0.50
0.75
1.00
-SA
C
0.75
0.50
0.25
0
pre
0.50
0.25
0
0
0.25
0.75
SAC
SAC
0.75
0.50
1.00
0.75–1.00
0.50–0.75
s
dult
a
0.25–0.50
0–0.25
(c)
R0 = 3
1.00
1.00
0.75
0.75
SAC
1.00
0.75
0.50
-SA
C
lts
adu
0.25
0.50
0.75
0.50
pre
1.00
0
0.75
lts
adu
0.25
0.25
0.25
0.50
0.75
-SA
C
1.00
0.50
pre
0.75
lts
adu
0
0.25
0.25
0.50
0.75
1.00
-SA
C
0.75
0.50
0.25
0
0.50
0.25
0
0
0.25
0
0.50
pre
R0 = 5
SAC
(b)
R0 = 2
SAC
(a)
0.75–1.00
0.50–0.75
0.25–0.50
0–0.25
Figure 7. Critical treatment surfaces for hookworm under annual treatment with R0 ¼ 2, 3, 5 (a– c, respectively). Axes represent fraction effectively treated in each
age group. Points above the surface lead to elimination within 20 years. Parameters: z ¼ 0.92, k ¼ 0.4, s ¼ 0.5 per year, b ¼ r ¼ (0.5, 0.5, 1, 2). (Adapted
from Truscott et al. [40].) (Online version in colour.)
workers [40]. As described below, the surfaces do not give information on the temporal dynamics of the infection, and we
therefore investigate these using both time series of repeated
treatment of different proportions of the three treatment age
groupings and summaries of the number of rounds of treatments required to reach the breakpoint for different coverages.
The proportion effectively treated that is needed to reduce
mean worm burdens below the critical level are calculated
for R0 set at low (2), medium (3) and high (5) values, and for
different parasites. The parasite with the greatest R0 value
determines the intensity, frequency and duration of treatment
required. Graphs are for Ascaris and hookworm only, because
Ascaris is assumed to be very similar to Trichuris in terms of age
intensity profiles, excepting drug efficacy against Trichuris is
known to be lower than for Ascaris.
Numerical analyses of the model where deposition is equal
to uptake (hence bi / ri for observed age class, i) reveal that
treating only SAC will rarely extinguish transmission, except
in very low Ascaris and Trichuris transmission settings [40].
For example, as illustrated in figure 6a, when R0 ¼ 2 only
if the SAC age class is treated with an efficacy above 80%
is treatment of other age groupings unnecessary to get to
the breakpoint. Once R0 . 2 some of either adults, pre-SAC
or both must be treated as well, at high coverage levels
(figure 6b,c). In most settings where Ascaris and/or Trichuris
are prevalent, R0 exceeds 2.5 in value (table 1). Treating both
SAC and pre-SAC, as is sometimes done in control programmes, with high coverage (greater than 80%) can result in
crossing the breakpoint, but only when transmission intensity is low to medium. For the highest transmission setting
(figure 6c), the model predicts that the contribution of infants
alone will prevent chemotherapy eliminating the parasite
within a 25 year time frame.
The impact of treating a particular age group is dependent
on both the contact that it has with infectious material in the
reservoir (as defined by the parameter bi in equation (2.6))
and on the fraction of the population that it contains (table 2).
In the case of hookworm, adults have the highest contact rate
and also constitute the largest part of the population. As
figure 7 shows, the required treatment levels to achieve elimination are dominated by the coverage of the adult population.
The coverage of SAC and particularly pre-SAC has little
impact on elimination [40].
In medium and high transmission settings, if either Ascaris
or Trichuris is the most prevalent infection, then the preSAC and SAC individuals appear to contribute most to
transmission (based on the MCMC estimates of age-related
infection rates from age–intensity profiles). In these circumstances, pre-SAC and adults must be treated as well as SAC,
with coverage dependent on the value of R0. For very high
values (e.g. R0 ¼ 5, figure 6c), coverage must be above 80%
for all treatable age groupings if treatment is annual.
Current guidelines recommend that treatment is administered every 12 months in low-to-medium transmission
settings and every six months in high transmission settings
(WHO, 2006, 2011). The model results show that the target
coverage level can be reduced if treatment is administered
more frequently, such as every six months. This is shown
for Ascaris in figure 8 where in low-to-medium transmission
settings the breakpoint can be attained by treating only SAC
(at more than 70% for R0 ¼ 2 and more than 90% for R0 ¼ 3).
In high settings, treatment levels that do not trigger crossing
Phil. Trans. R. Soc. B 369: 20130435
Figure 6. Critical treatment surfaces for Ascaris under annual treatment with R0 ¼ 2, 3, 5 (a – c, respectively). Axes represent fraction effectively treated in each age
group. Points above the surface lead to elimination within 20 years. Parameters: z ¼ 0.94, k ¼ 0.5, s ¼ 1 per year, b ¼ r ¼ (1.15, 1.15, 1, 0.52). (Adapted
from Truscott et al. [40].) (Online version in colour.)
rstb.royalsocietypublishing.org
1.00
8
R0 = 5
SAC
(b)
R0 = 2
0
(a)
Downloaded from http://rstb.royalsocietypublishing.org/ on April 8, 2015
(b)
R0 = 2
(c)
R0 = 3
0.50
0.25
0.50
-SA
C
0.75
0.50
0.25
0.50
0.75
pre
s
lt
adu
1.00
a
1.00
-SA
C
0.75
0.25
0.50
pre
s
dult
0
0.75
0
0.25
0
0.25
0.50
0.75
1.00
0.75
0.50
0.25
0
0
-SA
C
0.50
0.25
0.25
0.50
SAC
0.75
SAC
1.00
0.75
SAC
1.00
0.75
s
dult
a
0.75–1.00
0.50–0.75
0.25–0.50
0–0.25
(c)
R0 = 3
1.00
0.75
0.50
-SA
C
0.25
0.50
0.75
pre
lts
adu
0.75
0.25
0.50
0.25
0.50
0.75
0
1.00
ad
1.00
-SA
C
0.75
0.25
pre
ults
0.25
0
0.50
0.25
0.50
0.75
1.00
0.75
0.50
0.25
0
-SA
C
0.50
0.25
0
0
0.25
SAC
1.00
0.75
SAC
1.00
0.75
0.50
pre
R0 = 5
SAC
(b)
R0 = 2
0
(a)
0.75–1.00
0.50–0.75
lts
adu
0.25–0.50
0–0.25
Figure 9. Critical treatment surfaces for Ascaris under annual treatment with R0 ¼ 2, 3, 5 (a – c, respectively). As for figure 6, but with egg contribution rate, r,
constant across all age classes. (Online version in colour.)
(c)
R0 = 3
1.00
0.75
0.75
0.75
0.50
0.25
0.50
0.75
-SA
C
1.00
pre
lts
adu
0.75
0.25
0.50
0.75
-SA
C
lts
adu
1.00
0.50
pre
0.75
0
0.25
0.25
0.50
0.75
1.00
0.75
0.50
0.25
0.50
0
0
0.25
0
-SA
C
0.50
0.25
0.25
0.50
SAC
1.00
SAC
1.00
0.25
pre
R0 = 5
SAC
(b)
R0 = 2
0
(a)
lts
adu
0
0.75–1.00
0.50–0.75
0.25–0.50
0–0.25
Figure 10. Critical treatment surfaces for hookworm under annual treatment with R0 ¼ 2, 3, 5 (a – c, respectively). As for figure 7, but with egg contribution rate,
r, constant across all age classes. (Online version in colour.)
(c)
R0 = 3
1.00
0.75
0.50
0.25
0.25
0.50
0.75
-SA
C
1.00
0.50
pre
0.75
lts
adu
0
0.25
0.25
0.50
0.75
-SA
C
1.00
pre
0.75
0.25
0
0.50
0.25
0.50
0.75
1.00
0.50
0.75
lts
adu
0
0
0.25
-SA
C
0.50
0.25
0.25
0
SAC
1.00
0.75
SAC
1.00
0.75
0.50
pre
R0 = 5
SAC
(b)
R0 = 2
0
(a)
ts
l
adu
0.75–1.00
0.50–0.75
0.25–0.50
0–0.25
Figure 11. Identical to figure 9, but with treatment of Ascaris every six months. (Online version in colour.)
the breakpoint surface, will have to be sustained indefinitely
to avoid a return to pre-control levels. Increasing treatment
frequency (every four months) and/or changes in behaviour
and sanitation to restrict contamination of the environment
with infective stages (and hence lower the value of R0) will
be required if elimination of transmission is to occur.
As a sensitivity analysis, we performed these analyses for
the scenario in which all age-groups contribute to the infective pool only in proportion to their egg output (r ¼ 1 for all
age groups), as illustrated in figures 9–11. In comparison
with our initial assumption, this means that pre-SAC contribute fewer eggs to the reservoir while adults contribute more.
Phil. Trans. R. Soc. B 369: 20130435
Figure 8. Identical to figure 6, but with treatment of Ascaris every six months. (Adapted from Truscott et al. [40].) (Online version in colour.)
rstb.royalsocietypublishing.org
1.00
0.25
pre
9
R0 = 5
0
(a)
Downloaded from http://rstb.royalsocietypublishing.org/ on April 8, 2015
(a)
(b)
worm burden
4
10
15
8
rstb.royalsocietypublishing.org
infants 0–1 year
pre-SAC 2–4 years
SAC 5–14 years
adults 15–70 years
5
(c)
6
10
3
4
2
5
2
1
0
(d)
0
(e)
5
Phil. Trans. R. Soc. B 369: 20130435
0
(f)
15
8
worm burden
4
6
10
3
4
2
5
2
1
0
0
0
5
10
15
20
0
0
5
time (years)
10
15
20
0
5
10
15
20
time (years)
time (years)
Figure 12. Numerical solutions of the model for Ascaris in different transmission and treatment interval settings. Columns represent R0 ¼ 2, 3, 5, left to right,
respectively. Top row represents annual treatment and bottom row six-monthly treatment. Infants (black) are untreated, pre-SAC (blue) and SAC (red) have 90%
coverage and adults (orange) have 40% coverage. Other parameter values are as defined in figure 6.
(a)
(b)
6
infants 0–1 year
pre-SAC 2–4 years
SAC 5–14 years
adults 15–70 years
worm burden
5
4
(c)
7
6
10
5
8
4
3
6
3
2
2
4
1
1
2
0
0
0
5
10
15
time (years)
20
0
0
5
10
15
time (years)
20
0
5
10
15
time (years)
20
Figure 13. Graphs (a), (b) and (c) are for hookworm, where R0 is set at 2 for (a), 3 for (b) and 5 for (c). Treatment is annual; treatment coverage is as defined in the
legend to figure 9 and parameters as defined in figure 7.
In the case of Ascaris (figure 9), higher levels of SAC coverage
are required for a given adult level, and lower levels for a
given pre-SAC level, making the surface ‘twist’ in favour of
pre-SAC treatment for effective elimination. For hookworm
(figure 10), the threshold coverages are less qualitatively different than before (figure 7). This is due to the continued
dominance of adults in transmission. For six-monthly treatment of Ascaris (figure 11), the qualitative differences are
similar to those for one-yearly treatment. Overall, this comparison demonstrates that understanding who contributes most to
infection can be important in designing control programmes
and the need for additional epidemiological studies before
large-scale roll out of extended treatment guidelines.
The duration of time over which regular treatment must
take place to cross the breakpoint is illustrated in figure 12
(Ascaris) and figure 13 (hookworm). For low values of R0, the
breakpoint can be crossed with five years at high (90%) treatment coverage. For medium-to-high transmission settings
(R0 3), repeated six-monthly treatment must continue for
10–15 years or longer (at high R0 values).
We can summarize these dynamics by looking at the
number of treatments required to reach the breakpoint. As
one would expect, the higher the treatment coverage, the
fewer rounds of treatments required to reach the breakpoint.
As an example we look at six-monthly treatment of Ascaris
and coverage among pre-SAC and adults for 75% coverage
Downloaded from http://rstb.royalsocietypublishing.org/ on April 8, 2015
11
0.1
0.2
0.3
0.4
0.5
0.6
0.7
0.8
0.9
1.0
0
NA
NA
NA
NA
NA
NA
NA
NA
25
22
20
0.1
NA
NA
NA
NA
NA
NA
NA
22
19
18
16
0.2
NA
NA
NA
NA
NA
NA
22
18
16
15
14
0.3
NA
NA
NA
NA
NA
23
18
16
14
13
12
0.4
NA
NA
NA
NA
NA
19
16
14
13
12
11
0.5
NA
NA
NA
NA
22
17
14
12
11
11
10
0.6
NA
NA
NA
NA
19
15
13
11
10
10
9
0.7
NA
NA
NA
24
17
14
12
11
10
9
9
0.8
NA
NA
NA
22
16
13
11
10
9
8
8
0.9
NA
NA
NA
20
15
12
11
9
9
8
8
1.0
NA
NA
NA
18
14
12
10
9
8
8
7
Figure 14. Number of rounds of six-monthly treatment to achieve Ascaris elimination as a function of pre-SAC and adult coverage. Coverage of SAC (75%). Table in
the figure represents a horizontal slice through figure 11b. (Online version in colour.)
4. Discussion
The aims and objectives of this paper were to examine the
optimal intervals between rounds of chemotherapy and coverage levels for different species mixes of STHs, for different
age groups treated and for different transmission intensity
settings (low, medium and high), to reduce worm loads to
very low levels or to cross a breakpoint below which self-sustaining transmission ceases. Analyses were presented on
where breakpoints in transmission might lie for the different
infants 0–1 year
pre-SAC 2–4 years
SAC 5–14 years
adults 15–70 years
8
6
worm burden
among SAC (figure 14). For low coverage levels, the programme does not reach the breakpoint within 25 rounds of
treatment. As with the coverage surfaces, there is a highly nonlinear relationship between coverage levels and number of
rounds required, with the number of rounds being halved to
around 10 rounds when coverage is very high. This further
illustrates that, even with six-monthly treatment, where the
breakpoint can be reached, these programmes may have to
be in place for up to a decade to break the transmission cycle.
If worm burdens are lowered by repeated treatment, but
have not as yet been driven below the breakpoint, then lengthening the treatment interval typically serves only to generate a
bounce back to a new equilibrium worm burden above the
breakpoint where transmission continues in the community.
However, the closer the reduced worm load is to the breakpoint, the longer the bounce back time. As such, treatment
intervals can be lengthened once worm loads have been reduced
to very low levels (figure 15). A fuller treatment of this
time-dependent dynamics is presented in [39].
For all but high transmission settings, community-based
chemotherapy alone, covering more than just pre-SAC and
SAC, can interrupt the transmission of the common STHs,
providing treatment coverage is high, frequent and continued
for more than 15 years. Some lengthening of the between
treatment intervals can take place once worm loads are
reduced to low levels (means less than two per host) after
many repeated rounds of treatment.
4
2
0
0
5
10
time (years)
15
20
Figure 15. Elimination of Ascaris achieved with lengthened treatment interval in final stage (six intervals of six months followed by seven intervals of a
year). R0 ¼ 3; treatment levels and parameters as in figure 9. Treatments
represented by grey crosses.
parasites, again in different transmission intensity settings.
An attempt was made to redefine low, medium and high
transmission settings and measures of the basic reproductive
number R0, because it is believed that these epidemiological
measures are more informative than those based on the
prevalence of infection. We used a combination of methods,
including data analyses, parameter estimation and numerical
analysis based on mathematical models of the transmission
dynamics of helminth infections of humans.
The sexual nature of reproduction in human helminth
parasites creates a breakpoint in transmission owing to the
need for female worms to be fertilized by a male partner to
produce viable infective stages [7]. Analyses present in this
paper suggest that the breakpoint for STH parasites typically
occurs at a very low level (below one parasite) owing to the
Phil. Trans. R. Soc. B 369: 20130435
0
rstb.royalsocietypublishing.org
pre-SAC treatment efficacy
adult treatment efficacy
Downloaded from http://rstb.royalsocietypublishing.org/ on April 8, 2015
12
Phil. Trans. R. Soc. B 369: 20130435
The economic evaluation of any programme for helminth
elimination will depend in a complex way on the details of
drug distribution logistics, but will clearly depend strongly
on required levels of effective coverage and overall numbers
of treatments necessary. The table in figure 14 shows that
there is a trade-off between coverage and number of treatment
rounds of a subtle nonlinear nature. It is not immediately clear
what would constitute the economically optimal intervention.
Future work will use these models as a basis for investigating
this area.
In general, a relaxation in the extent or frequency of coverage will lead to a rapid recovery of the parasite population to
higher levels. However, as illustrated in figure 15, the effect
of sexual reproduction allows for some relaxation in effort
while still maintaining control, when burdens have already
been driven low. This phenomenon has potential economic
consequences for programme design. It suggests that intensive
effort in the early stages of control could result in better control
in the long term for the same expenditure of resources. To take
advantage of such an approach would require close monitoring of community worm burden levels to avoid bounce back
in the parasite population.
As repeated rounds of treatment lower the average worm
burden, increasing the interval between treatments significantly
affects both the likelihood of crossing the breakpoint and the
time taken to get to low intensity of infection levels. The numerical studies therefore suggest that a fixed interval as determined
by the intensity of transmission prior to the start of treatment
should be maintained throughout the 10 year (medium and
high transmission sites) or five year (low transmission areas)
control programmes. After that, if parasites persist at low
intensities, then longer intervals will suffice.
Coverage levels are critical to success, as are the age groups
targeted by the control programme. Even for community-wide
treatment programmes, high levels of coverage are required to
cross the breakpoint. Pre-SAC and SAC treatment programmes
combined are not predicted to be effective excepting in very
low transmission areas. This conclusion is independent of
which helminth is the dominant infection. These results may be
of help in planning mass drug administration programmes in setting out guidelines on the targets to be achieved. An important
next step is the design of longitudinal epidemiological studies
to test the predictions of the models in different communities.
These studies are being designed at present.
The analyses point to the need for some additions to the
current WHO guidelines for treating STHs by community
chemotherapy. The following suggestions are made.
First, pre-treatment assessments and subsequent monitoring should be based on intensity measures not prevalence. As
indicated in figure 5, the current threshold criteria of greater
than 50% prevalence simply separates low from medium and
high transmission intensity areas. The criterion of less than
20% prevalence seems irrelevant.
Second, once treatment is started and calculations are performed to assess treatment frequency based on how the
intensity of infection changes by age (to derive the force of
infection and the basic reproductive number), this frequency
should be maintained for the duration of the programme. The
overall duration of treatment should be for a minimum of
10 years and, irrespective of transmission intensity or parasite
species mix, the ideal treatment frequency is six months. The
treatment interval can be lengthened after control has
reduced average worm loads to very low levels.
rstb.royalsocietypublishing.org
aggregated distributions of worm numbers per host. As a
result, at baseline endemic levels, the impact of sexual reproduction is negligible [7]. However, periodic chemotherapy
regularly reduces the worm burden in sections of the population (if only temporarily) to levels at which sexual
reproduction becomes a limiting factor. Sexual reproduction
dynamics can therefore have a large effect on the parasite
in this context. It is shown in figures 6 and 7 that repeated
rounds of chemotherapy with high coverage of the whole
population can take average burdens below this breakpoint.
This situation pertains only in the absence of immigration of
infected persons from neighbouring villages and towns who
may repopulate the pool of infective stages. The level of coverage of the total population required to achieve this goal is high
for moderate to high levels of transmission prior to the start of
treatment—often being of the order of 80–90% across all age
classes. Somewhat lower levels of treatment coverage will be
adequate for low R0 values (between 1 and 1.5).
Irrespective of the dominant parasite (Ascaris or hookworm), beyond the very lowest transmission levels (R0 ¼ 2),
treating SAC alone will never lower average worm burdens
near to the breakpoint. Very high levels of coverage (greater
than 90%) will suffice if pre-SAC and SAC are treated if Ascaris
is the dominant STH and R0 is low, because a large fraction of the
total worm population is harboured in these age groupings ([8];
figure 4). This is not the case for hookworm where the majority
of the worms are harboured by adults (figure 4). The WHO
category to define high levels of infection (prevalence greater
than 50%), covers both medium and high levels of transmission.
In this case, a treatment programme that effectively covers
the adult population is essential to cross the breakpoint in
transmission for all the dominant STH species.
The example of hookworm raises a possible issue for
policy implementation. The rationale behind school-based
intervention is, in part, to alleviate morbidity and improve
developmental and educational outcomes for children in
the long term. However, reduction in the worm burden and
hence morbidity in children may be best served by treating
the adult population and indirectly reducing childhood
exposure to parasites.
The frequency of treatment required to lower mean worm
loads below the breakpoint depends on the life expectancy of
the dominant parasite (estimates suggest life expectancies
of one year for Ascaris and two or more years for Necator), and
the magnitude of the basic reproductive number R0. The shorter
life expectancy requires more frequent treatment. Every six
months is predicted to be necessary for Ascaris with moderate
to high levels of transmission (R0 values greater than 2), whereas
every year for hookworm provided transmission is not too
intense. Trichuris is similar to Ascaris in terms of life expectancy
and hence a six-monthly treatment frequency is ideal.
Comparison of figures 6–8, where egg contribution per
individual matches infectious contact, and figures 9–11,
where egg contribution is uniform across the population,
shows a significant difference. The theoretical basis for the
impact of contact rate and individual egg contribution has
already been investigated in a simpler model [39]. This feature
of the infection process is quite difficult to measure. For
example, the endemic age profile of worm burden is not dependent on it. Information can only be recovered from detailed data
on parasite bounce back after treatment or by direct
behavioural studies within affected communities. Planned
longitudinal studies will hopefully lead to better estimates.
Downloaded from http://rstb.royalsocietypublishing.org/ on April 8, 2015
Acknowledgements. The authors thank the Bill and Melinda Gates
Foundation for research grant support. T.D.H. is a member of the
Centre for Applied Health Research and Delivery (http://www.
lstmliverpool.ac.uk/research/cross-cutting-themes/cahrd/) and her
position is partly supported by a Wellcome Trust Institutional Strategic Support Award (no. 097830/Z/11/A-C) to Liverpool School
of Tropical Medicine.
References
1.
2.
3.
4.
5.
World Health Organization 2013 Preventive
Chemotherapy Database, Soil-transmitted
helminthiases. See http://www.who.int/
neglected_diseases/preventive_chemotherapy/sth/
en/index.html (20 May 2013)
Uniting to Combat NTDs 2013 From promises to
progress: the first report on the London Declaration
on NTDs. See http://unitingtocombatntds.org/
resource/promises-progress-first-report-londondeclaration-ntds.
WHO 2013 Executive Board recommendations on
neglected tropical diseases. See http://www.who.
int/neglected_diseases/EB132_R7_en.pdf.
WHO 2012 Accelerating work to overcome the global
impact of neglected tropical diseases: a roadmap for
implementation. Geneva, Switzerland: World Health
Organization.
Anderson R, Hollingsworth TD, Truscott J, Brooker S.
2012 Optimisation of mass chemotherapy to control
soil-transmitted helminth infection. Lancet 379,
289–290. (doi:10.1016/S0140-6736(12)60120-2)
6.
Anderson RM, May RM. 1985 Helminth infections of
humans: mathematical models, population
dynamics, and control. Adv. Parasitol. 24, 1 –101.
7. Anderson RM, May RM. 1991 Infectious diseases of
humans: dynamics and control. Oxford, UK: Oxford
University Press.
8. Anderson RM, Truscott JE, Pullan RL, Brooker SJ,
Hollingsworth TD. 2013 How effective is schoolbased deworming for the community-wide control
of soil-transmitted helminths? PLoS Negl. Trop. Dis.
7, e2027. (doi:10.1371/journal.pntd.0002027)
9. Anderson RM, Medley GF. 1985 Community control
of helminth infections of man by mass and selective
chemotherapy. Parasitology 90, 629 –660. (doi:10.
1017/S0031182000052288)
10. Bundy DA. 1990 Control of intestinal nematode
infections by chemotherapy: mass treatment versus
diagnostic screening. Trans. R. Soc. Trop. Med. Hyg. 84,
622–625. (doi:10.1016/0035-9203(90) 90126-Y)
11. Anderson RM, Schad GA. 1985 Hookworm
burdens and faecal egg counts: an analysis of the
biological basis of variation. Trans. R. Soc. Trop.
Med. Hyg. 79, 812– 825. (doi:10.1016/0035-9203
(85)90128-2)
12. Levecke B, Mekonnen Z, Albonico M, Vercruysse J.
2012 The impact of baseline faecal egg counts on
the efficacy of single-dose albendazole against
Trichuris trichiura. Trans. R. Soc. Trop. Med.
Hyg. 106, 128–130. (doi:10.1016/j.trstmh.2011.
09.007)
13. Holland CV, Asaolu SO, Crompton DWP, Stoddart RC,
Macdonald R, Torimiro SE. 1989 The epidemiology
of Ascaris lumbricoides and other soil-transmitted
helminths in primary school children from Ile-Ife,
Nigeria. Parasitology 99, 275–285. (doi:10.1017/
S003118200005873X)
14. Elkins DB, Haswell-Elkins M, Anderson RM. 1986
The epidemiology and control of intestinal
helminths in the Pulicat Lake region of Southern
India. I. Study design and pre- and post-treatment
observations on Ascaris lumbricoides infection.
Trans. R. Soc. Trop. Med. Hyg. 80, 774– 792.
13
Phil. Trans. R. Soc. B 369: 20130435
Improved standards of measurement will, concomitantly,
permit more precision in the design of community-based
STH control programmes,
In many poor rural areas of sub-Saharan Africa and South
East Asia, the targets outlined on coverage in these analyses
across all age classes, will be difficult to achieve in practice—
but it should be an ambition for WHO in the coming decade
given sustained drug donations from the pharmaceutical industry. The task can be made less daunting by concomitant efforts
in hygienic education and the expansion of efforts to provide
and maintain safe water and sanitation (WASH programmes).
WASH effectively reduces the value of R0 and hence can
move a high transmission setting down to a medium or low one.
In very poor regions, however, the introduction of WASH
can be fraught with problems, as can sustaining such introductions, even in school settings. The latter can have limited access
to water and little resource to maintain new sanitation facilities
to encourage continued child use.
In areas of high transmission intensity, mass chemotherapy
in all age groups plus improvements in hygiene and sanitation
are essential. Efforts should thus be made on how to costeffectively treat adults as they will need to be targeted to achieve
the interruption of transmission. Perhaps the largest population-wide treatment programme in recent years has been the
Lymphatic Filariasis Elimination Programme, whereby all individuals aged one year and above in lymphatic filariasis (LF)
endemic areas are treated with albendazole and ivermectin
[42]. As these programmes achieve their LF elimination goals,
consideration should be made to maintain the infrastructure
to control STH infections.
rstb.royalsocietypublishing.org
Third, long-term control (crossing the breakpoint) requires
community-wide treatment. Treating only pre-SAC and SAC
will not suffice even in areas of low transmission, especially
if hookworm is the dominant STH. If resources are limited,
treating only pre-SAC and SAC has reported benefits for morbidity control in children and associated longer terms benefits
for treated children. But if parasite control and possible elimination is the goal, community-wide treatment is required. In all
cases, high coverage levels are required (80–90%). This may be
difficult to achieve if school attendance levels are low or if
adults are difficult to access. However, the advice offered to
country programme managers must stress the need for high
coverage, especially in areas of medium-to-high transmission
(figure 7).
Fourth and finally, if nothing else alters (i.e. there are no
improvements in hygiene and sanitation), then the guidelines
must stress that STH populations will bounce back to pre-control
levels within a few years if treatment ceases before the breakpoint
is crossed. The numerical studies reported in this paper point to
these breakpoints for all three of the major STH parasites lying
below a mean worm burden of one parasite per host.
The methodological approach adopted in this study can be
varied and future publications will address different model
structures (e.g. individual-based stochastic formulations) and
other helminth species such as the schistosomes and filarial
worms. Initial analyses, however, suggest that our general conclusions are robust for STHs to changes in model structure due
in part to the somewhat predictable transmission dynamics of
helminth parasites (in the terminology of population ecology,
they are k selected species [41]). The most significant shortcoming is that of the accuracy of parameter estimates,
especially those concerning the calculation of the ‘breakpoint
in transmission’. With increased activity in the implementation
and monitoring of STH control by chemotherapy, a parallel
focus on improving our current estimates of key epidemiological parameters via careful monitoring of reinfection by
intensity measures post rounds of treatment is highly desirable.
Downloaded from http://rstb.royalsocietypublishing.org/ on April 8, 2015
33.
34.
35.
36.
37.
38.
39.
40.
41.
42.
Med. Hyg. 85, 519– 522. (doi:10.1016/00359203(91)90241-P)
Bundy DA, Cooper ES, Thompson DE, Anderson RM,
Didier JM. 1987 Age-related prevalence and
intensity of Trichuris trichiura infection in a
St. Lucian community. Trans. R. Soc. Trop. Med.
Hyg. 81, 85– 94. (doi:10.1016/0035-9203(87)
90293-8)
Pullan RL, Kabatereine NB, Quinnell RJ, Brooker S.
2010 Spatial and genetic epidemiology of
hookworm in a rural community in Uganda. PLoS
Negl. Trop. Dis. 4, e713. (doi:10.1371/journal.pntd.
0000713)
Warren KS. 1972 The immunopathogenesis of
schistosomiasis: a multidisciplinary approach.
Trans. R. Soc. Trop. Med. Hyg. 66, 417– 434.
(doi:10.1016/0035-9203(72)90273-8)
US Census Bureau. 2013 International data base.
See http://www.census.gov/population/
international/data/index.html (accessed 1 November
2013)
WHO 2011 Helminth control in school-age
children. Geneva, Switzerland: World Health
Organization.
WHO 2002 Prevention and control of schistosomiasis
and soil-transmitted helminthiasis. Geneva,
Switzerland: World Health Organization.
Truscott JE, Hollingsworth TD, Anderson RM. In
press. The interruption of the transmission of soil
transmitted helminths by repeated mass
chemotherapy of school aged children. PLoS Negl.
Trop. Dis.
Truscott JE, Hollingsworth TD, Brooker SJ, Anderson
RM. In press. Can chemotherapy alone eliminate the
transmission of soil transmitted helminths?
Parasites Vectors.
MacArthur RH, Wilson EO. 1967 The theory of island
biogeography. Princeton, NJ: Princeton University
Press.
Anon 2012 Global programme to eliminate
lymphatic filariasis: progress report, 2011. Wkly
Epidemiol. Rec. 87, 346–356.
14
Phil. Trans. R. Soc. B 369: 20130435
24. Sinniah B, Kan-Chua SP, Subramaniam K. 1983
Evaluating the reliability of egg counts in
determining the intensity of Ascaris infections. In
Collected papers on the control of soil-transmitted
helminthiases, pp. 5–10, 2nd edn. Tokyo, Japan:
Asian Parasite Control Organization.
25. Quinnell RJ, Slater AF, Tighe P, Walsh EA, Keymer
AE, Pritchard DI. 1993 Reinfection with hookworm
after chemotherapy in Papua New Guinea.
Parasitology 106, 379– 385. (doi:10.1017/
S0031182000067123)
26. Hoagland KE, Schad GA. 1978 Necator americanus
and Ancylostoma duodenale: life history parameters
and epidemiological implications of two sympatric
hookworms of humans. Exp. Parasitol. 44, 36 –49.
(doi:10.1016/0014-4894(78)90078-4)
27. Nawalinski T, Schad GA, Chowdhury AB. 1978
Population biology of hookworms in children in rural
West Bengal. II. Acquisition and loss of hookworms.
Am. J. Trop. Med. Hyg. 27, 1162–1173.
28. Haswell-Elkins MR, Elkins DB, Manjula K, Michael E,
Anderson RM. 1988 An investigation of hookworm
infection and reinfection following mass
anthelmintic treatment in the south Indian fishing
community of Vairavankuppam. Parasitology 96,
565 –577. (doi:10.1017/S0031182000080197)
29. Ye XP, Wu ZX, Sun FH. 1994 The population biology
and control of Necator americanus in a village
community in south-eastern China. Ann. Trop. Med.
Parasitol. 88, 635–643.
30. Bradley M, Chandiwana SK, Bundy DA, Medley GF.
1992 The epidemiology and population biology of
Necator americanus infection in a rural community
in Zimbabwe. Trans. R. Soc. Trop. Med. Hyg. 86,
73 –76. (doi:10.1016/0035-9203(92)90448-L)
31. Nokes C, Cooper ES, Robinson BA, Bundy DA. 1991
Geohelminth infection and academic assessment in
Jamaican children. Trans. R. Soc. Trop. Med. Hyg. 85,
272 –273. (doi:10.1016/0035-9203(91)90052-Z)
32. Hlaing T, Than S, Myat Lay K. 1991 The impact of
three-monthly age-targetted chemotherapy on
Ascaris lumbricoides infection. Trans. R. Soc. Trop.
rstb.royalsocietypublishing.org
15. Anderson RM. 1980 The dynamics and control of
direct life cycle helminth parasites. Lect. Notes
Biomath. 39, 278–322.
16. Chen ER, Hsieh HC. 1969 Study of ascariasis control
in Taiwan. J. Formosan Med. Assoc. 68, 411 –427.
17. Croll NA, Anderson RM, Gyorkos TW, Ghadirian E.
1982 The population biology and control of Ascaris
lumbricoides in a rural community in Iran.
Trans. R. Soc. Trop. Med. Hyg. 76, 187 –197.
(doi:10.1016/0035-9203(82)90272-3)
18. Hall A, Anwar KS, Tomkins A, Rahman L. 1999 The
distribution of Ascaris lumbricoides in human hosts:
a study of 1765 people in Bangladesh. Trans. R. Soc.
Trop. Med. Hyg. 93, 503–510. (doi:10.1016/S00359203(99)90351-6)
19. Thein H, Than S, Htay Htay A, Myint L, Thein
Maung M. 1984 Epidemiology and transmission
dynamics of Ascaris lumbricoides in Okpo village,
rural Burma. Trans. R. Soc. Trop. Med. Hyg. 78,
497–504. (doi:10.1016/0035-9203(84)90071-3)
20. Bundy DAP, Cooper ES, Thompson DE, Didier JM,
Simmons I. 1987 Epidemiology and population
dynamics of Ascaris lumbricoides and Trichuris
trichiura infection in the same community.
Trans. R. Soc. Trop. Med. Hyg. 81, 987 –993.
(doi:10.1016/0035-9203(87)90372-5)
21. Martin J, Keymer A, Isherwood RJ, Wainwright SM.
1983 The prevalence and intensity of Ascaris
lumbricoides infections in Moslem children from
northern Bangladesh. Trans. R. Soc. Trop. Med. Hyg.
77, 702 –706. (doi:10.1016/0035-9203(83)90210-9)
22. Chai JY, Kim KS, Hong ST, Lee SH, Seo BS. 1985
Prevalence, worm burden and other epidemiological
parameters of Ascaris lumbricoides infection in rural
communities in Korea. Kisaengchunghak Chapchi 23,
241–246.
23. Guyatt HL, Bundy DA, Medley GF, Grenfell BT. 1990
The relationship between the frequency distribution
of Ascaris lumbricoides and the prevalence and
intensity of infection in human communities.
Parasitology 101, 139–143. (doi:10.1017/
S0031182000079841)


© Copyright 2026