
Guidance for Industry Non-Inferiority Clinical Trials DRAFT GUIDANCE
Guidance for Industry Non-Inferiority Clinical Trials DRAFT GUIDANCE This guidance document is being distributed for comment purposes only. Comments and suggestions regarding this draft document should be submitted within 90 days of publication in the Federal Register of the notice announcing the availability of the draft guidance. Submit comments to the Division of Dockets Management (HFA-305), Food and Drug Administration, 5630 Fishers Lane, rm. 1061, Rockville, MD 20852. All comments should be identified with the docket number listed in the notice of availability that publishes in the Federal Register. For questions regarding this draft document contact Robert Temple at 301-796-2270 or Robert O’Neill at 301-796-1700 (CDER), or the Office of Communication, Outreach, and Development (CBER) at 301-800-835-4709 or 301-827-1800. U.S. Department of Health and Human Services Food and Drug Administration Center for Drug Evaluation and Research (CDER) Center for Biologics Evaluation and Research (CBER) March 2010 Clinical/Medical Guidance for Industry Non-Inferiority Clinical Trials Additional copies are available from: Office of Communication Division of Drug Information, WO51, Room 2201 Center for Drug Evaluation and Research Food and Drug Administration 10903 New Hampshire Ave. Silver Spring, MD 20993 Phone: 301-796-3400; Fax: 301-847-8714 [email protected] http://www.fda.gov/Drugs/GuidanceComplianceRegulatoryInformation/Guidances/default.htm or Office of Communication, Outreach, and Development Center for Biologics Evaluation and Research Food and Drug Administration 1401 Rockville Pike, Rockville, MD 20852-1448 Phone: 800-835-4709 or 301-827-1800 [email protected] http://www.fda.gov/BiologicsBloodVaccines/GuidanceComplianceRegulatoryInformation/default.htm U.S. Department of Health and Human Services Food and Drug Administration Center for Drug Evaluation and Research (CDER) Center for Biologics Evaluation and Research (CBER) March 2010 Clinical/Medical TABLE OF CONTENTS I. INTRODUCTION............................................................................................................. 1 II. BACKGROUND ............................................................................................................... 1 III. GENERAL CONSIDERATION OF NON-INFERIORITY STUDIES: REGULATORY, STUDY DESIGN, SCIENTIFIC, AND STATISTICAL ISSUES............................................................................................................................... 2 A. Basic Principles of a Non-Inferiority Study .................................................................................2 B. Practical Considerations in Use of NI Designs...........................................................................13 IV. CHOOSING THE NON-INFERIORITY MARGIN AND ANALYZING THE RESULTS OF AN NI TRIAL........................................................................................ 17 A. Introduction ..................................................................................................................................17 B. Statistical Uncertainties in the NI Study and Quantification of Treatment Effect of Active Control...............................................................................................................................19 C. Statistical Methods for NI Analysis ............................................................................................27 D. Considerations for Selecting M2, the Clinical Margin, and the Role of Subjective Judgment.......................................................................................................................................31 E. Estimating the Sample Size for an NI Study..............................................................................32 F. Potential Biases in an NI Study ...................................................................................................33 G. Role of Adaptive Designs in NI Studies — Sample Size Re-estimation to Increase the Size of an NI Trial ........................................................................................................................33 H. Testing NI and Superiority in an NI Study ................................................................................34 V. COMMONLY ASKED QUESTIONS AND GENERAL GUIDANCE ..................... 35 APPENDIX — EXAMPLES...................................................................................................... 40 REFERENCES - EXAMPLES .................................................................................................. 56 GENERAL REFERENCES....................................................................................................... 59 Contains Nonbinding Recommendations Draft – Not for Implementation Guidance for Industry1 Non-Inferiority Clinical Trials 1 2 3 4 5 6 7 8 9 10 11 12 13 14 15 16 17 18 19 20 21 22 23 24 25 26 27 28 29 30 31 32 33 34 35 36 37 This draft guidance, when finalized, will represent the Food and Drug Administration's (FDA's) current thinking on this topic. It does not create or confer any rights for or on any person and does not operate to bind FDA or the public. You can use an alternative approach if the approach satisfies the requirements of the applicable statutes and regulations. If you want to discuss an alternative approach, contact the FDA staff responsible for implementing this guidance. If you cannot identify the appropriate FDA staff, call the appropriate number listed on the title page of this guidance. I. INTRODUCTION This guidance provides sponsors and review staff in the Center for Drug Evaluation and Research (CDER) and Center for Biologic Evaluation and Research (CBER) at the Food and Drug Administration (FDA) with our interpretation of the underlying principles involved in the use of non-inferiority (NI) study designs to provide evidence of the effectiveness of a drug or biologic.2 The guidance gives advice on when NI studies can be interpretable, on how to choose the NI margin, and how to analyze the results. II. BACKGROUND This guidance consists of four parts. The first part is a general discussion of regulatory, study design, scientific, and statistical issues associated with the use of non-inferiority studies when these are used to establish the effectiveness of a new drug. The second part focuses on some of these issues in more detail, notably the quantitative analytical and statistical approaches used to determine the non-inferiority margin for use in NI studies, as well as the advantages and disadvantages of available methods. The third part addresses commonly asked questions about NI studies and provides practical advice about various approaches. The fourth part includes five examples of successful and unsuccessful efforts to define non inferiority margins and conduct NI studies.3 FDA’s guidance documents, including this guidance, do not establish legally enforceable responsibilities. Instead, guidance describes the Agency’s current thinking on a subject and should be viewed as recommendations unless specific regulatory or statutory requirements 1 This guidance has been prepared by the Office of Biostatistics and the Office of New Drugs in the Center for Drug Evaluation and Research (CDER) and the Center for Biologics Evaluation and Research (CBER) at the Food and Drug Administration. 2 For the purposes of this guidance, all references to drugs include both human drugs and therapeutic biologic products unless otherwise specified. 3 References: in this guidance, reference to methods or studies are not included in the text; rather they are included in a General Reference section and a separate reference section for the examples in the Appendix. Contains Nonbinding Recommendations Draft – Not for Implementation 38 39 40 41 42 43 44 45 46 47 48 49 50 51 52 53 54 55 56 57 58 59 60 61 62 63 64 65 66 67 68 69 70 71 72 73 74 75 76 77 78 79 80 81 82 are cited. The use of the word should in Agency guidances means that something is suggested or recommended, not that it is required. III. GENERAL CONSIDERATION OF NON-INFERIORITY STUDIES: REGULATORY, STUDY DESIGN, SCIENTIFIC, AND STATISTICAL ISSUES A. Basic Principles of a Non-Inferiority Study 1. Superiority Trials versus Non-Inferiority Trials to Demonstrate Effectiveness FDA’s regulations on adequate and well-controlled studies (21 CFR 314.126) describe four kinds of concurrently controlled trials that provide evidence of effectiveness. Three of them — placebo, no treatment, and dose-response controlled trials — are superiority trials that seek to show that a test drug is superior to the control (placebo, no treatment, or a lower dose of the test drug). The fourth kind of concurrent control, comparison with an active treatment (active control), can also be a superiority trial, if the intent is to show that the new drug is more effective than the control. More commonly, however, the goal of such studies is to show that the difference between the new and active control treatment is small, small enough to allow the known effectiveness of the active control to support the conclusion that the new test drug is also effective. How to design and interpret such studies so that they can support such a conclusion is a formidable challenge. These active control trials, which are not intended to show superiority of the test drug, but to show that the new treatment is not inferior to an unacceptable extent, were once called equivalence trials, but this is a misnomer, as true equivalence (i.e., assurance that the test drug is not any less effective than the control), could only be shown by demonstrating superiority. Because the intent of the trial is one-sided (i.e., to show that the new drug is not materially worse than the control), they are now called non-inferiority (NI) trials. But that too, is a misnomer, as guaranteeing that the test drug is not any (even a little) less effective than the control can only be demonstrated by showing that the test drug is superior. What non-inferiority trials seek to show is that any difference between the two treatments is small enough to allow a conclusion that the new drug has at least some effect or, in many cases, an effect that is not too much smaller than the active control. The critical difference between superiority and NI trials is that a properly designed and conducted superiority trial, if successful in showing a difference, is entirely interpretable without further assumptions (other than lack of bias or poor study conduct); that is, the result speaks for itself and requires no further extra-study information. In contrast, the NI study is dependent on knowing something that is not measured in the study, namely, that the active control had its expected effect in the NI study. This is critical to knowing that the trial had assay sensitivity (i.e., could have distinguished an effective from an ineffective drug). A successful superiority trial has, by definition, assay sensitivity. A “successful” NI trial, one that shows what appears to be an acceptably small difference between treatments, may or 2 Contains Nonbinding Recommendations Draft – Not for Implementation 83 84 85 86 87 88 89 90 91 92 93 94 95 96 97 98 99 100 101 102 103 104 105 106 107 108 109 110 111 112 113 may not have had assay sensitivity and may or may not have supported a conclusion that the test drug was effective. Thus, if the active control had no effect at all in the NI trial (i.e., did not have any of its expected effect), then finding even a very small difference between control and test drug is meaningless, providing no evidence that the test drug is effective. Knowing whether the trial had assay sensitivity relies heavily on external (not within-study) information, giving NI studies some of the characteristics of a historical control trial. FDA regulations have recognized since 1985 the critical need to know, for an NI trial to be interpretable, that the active control had its expected effect in the trial. Thus, 21 CFR 314.126(a)(2)(iv), unchanged since 1985, says: If the intent of the trial is to show similarity of the test and control drugs, the report of the study should assess the ability of the study to have detected a difference between treatments. Similarity of test drug and active control can mean either that both drugs were effective or that neither was effective. The analysis of the study should explain why the drugs should be considered effective in the study, for example, by reference to results in previous placebo-controlled studies of the active control drug. 2. Logic of the NI Trial In a placebo-controlled trial, the null hypothesis (Ho) is that the response to the test drug (T) is less than or equal to the response to the placebo (P); the alternative hypothesis (Ha) is that the response to the test drug is greater than P. Ho: T ≤ P; T – P ≤ 0 Ha: T > P; T – P > 0 In most cases, a treatment effect is established statistically by showing that the lower bound of the two-sided 95% confidence interval (equivalent to the lower bound of a one-sided 97.5% confidence interval) for T-P is > 0.4 This shows that the effect of the test drug is greater than 0. See Figure 1. 4 Ref. 4 3 Contains Nonbinding Recommendations Draft – Not for Implementation 114 115 116 Figure 1: Three Possible Results of a Placebo-Controlled Superiority Study (Point Estimate, 95% CI) 117 118 Test – Placebo (T-P) 119 120 121 1. Point estimate of effect is 2; 95% CI lower bound is 1. Conclusion: Drug is effective 122 and appears to have an effect of at least 1. 123 2. Point estimate of effect is 2; 95% CI lower bound is <0 (study perhaps too small). 124 Conclusion: Drug is not shown to be effective. 125 3. Point estimate of effect is 0; 95% CI lower bound is well below 0. Conclusion: Drug 126 shows no suggestion of effectiveness. 127 128 In an NI study whose goal is to show that the new drug has an effect greater than zero, the 129 null hypothesis is that the degree of inferiority of the new drug (T) to the control (C), C-T, is 130 greater than the non-inferiority margin M1, where M1 represents what is thought to be the 131 whole effect of the active control (C) relative to placebo in the NI study.5 132 133 Ho: C – T ≥ M1 (T is inferior to the control by M1 or more) 134 Ha: C – T < M1 (T is inferior to the control by less than M1) 135 5 M is the non-inferiority margin used in the NI study. It can be no larger than the entire effect that C is presumed to have had in the study, in which case it is called M1. As described below, the margin of interest can be smaller than M1, in which case it is called M2. 4 Contains Nonbinding Recommendations Draft – Not for Implementation 136 137 138 139 140 141 142 143 144 145 146 147 148 149 150 151 152 153 154 155 156 157 158 159 160 161 162 Again, non-inferiority is established by showing that the upper bound of the two-sided confidence interval for C-T is < M1. If the chosen M1 does in fact represent the entire effect of the active control drug in the NI study, a finding of non-inferiority means that the test drug has an effect greater than 0 (see Figure 2). Thus, in the non-inferiority setting, assay sensitivity means that the control drug had at least the effect it was expected to have (i.e., M1). Figure 2: Results of NI Study Showing C-T and 95% CI (M1 = 2) M1 Control – Test (C-T) 1. Point estimate of C-T is 0, suggesting equal effect; upper bound of the 95% CI for C T is 1, well below M1; NI is demonstrated. 2. Point estimate of C-T favors C; upper bound of the 95% CI for C-T is >2, well above M1; NI is not demonstrated. 3. Point estimate of C-T is zero, suggesting equal effect; but upper bound of the 95% CI for C-T is >2 (i.e., above M1), so that NI is not demonstrated. 4. Point estimate favors T; NI is demonstrated, but superiority is not demonstrated. 5. Point estimate favors T; superiority and NI are demonstrated. 6. Point estimate of C-T favors C and C is statistically significantly superior to T. Nonetheless, upper bound of the 95% CI for C-T<2 (M1), so that NI is also demonstrated for the NI margin M1. (This outcome would be unusual and could present interpretive problems.) 5 Contains Nonbinding Recommendations Draft – Not for Implementation 163 164 165 166 167 168 169 170 171 172 173 174 175 176 177 178 179 180 181 182 183 184 185 186 187 188 189 190 191 192 193 194 195 196 197 198 199 200 201 202 203 204 205 206 207 208 The critical problem, and the major focus of this guidance, is determining M1, which is not measured in the NI study (there is no concurrent placebo group). It must be estimated (really assumed) based on the past performance of the active control and by comparison of prior test conditions to the current test environment (see section III.A.4). Determining the NI margin is the single greatest challenge in the design, conduct, and interpretation of NI trials. The choice of the margin M1 has important practical consequences. The smaller the margin, the smaller the upper bound of the 95% two-sided confidence interval for C-T must be, and the larger the sample size that will be needed. 3. Reasons for Using a Non-Inferiority Design The usual reason for using a non-inferiority active control study design instead of a study design having more readily interpretable results (i.e., a superiority trial) is an ethical one. Specifically, this design is chosen when it would not be ethical to use a placebo, or a no treatment control, or a very low dose of an active drug, because there is an effective treatment that provides an important benefit (e.g., life-saving or preventing irreversible injury) available to patients for the condition to be studied in the trial. Whether a placebo control can be used depends on the nature of the benefits provided by available therapy. The International Conference on Harmonization guidance E10 on Choice of Control Group and Related Issues in Clinical Trials (ICH E10) states: In cases where an available treatment is known to prevent serious harm, such as death or irreversible morbidity in the study population, it is generally inappropriate to use a placebo control. [The term “generally” leaves room for a placebo control if the known effective treatment is very toxic.] In other situations, where there is no serious harm, it is generally considered ethical to ask patients to participate in a placebo-controlled trial, even if they may experience discomfort as a result, provided the setting is non-coercive and patients are fully informed about available therapies and the consequences of delaying treatment. There are, however, other reasons for using an active control: (1) interest in comparative effectiveness and (2) assessing the adequacy (assay sensitivity) of a placebo-controlled study. These are not the focus of this guidance, but will be considered briefly. a. Comparative effectiveness There is growing interest among third party payers and some regulatory authorities, on both cost effectiveness and medical grounds, in the comparative effectiveness of treatments, and an increasing number of such studies are being conducted. A critical issue is the importance of including a placebo group, as well as the active comparator, in such studies (a 3-arm trial) to assess assay sensitivity (i.e., the ability of the trial to detect differences of a specified size between treatments). When the treatment is clinically critical, it will, of course, not be ethically acceptable to include a placebo group, and the discussion of NI studies that follows will be highly relevant to such trials. Even where it would be ethical to include a placebo 6 Contains Nonbinding Recommendations Draft – Not for Implementation 209 210 211 212 213 214 215 216 217 218 219 220 221 222 223 224 225 226 227 228 229 230 231 232 233 234 235 236 237 238 239 240 241 242 243 244 245 246 247 248 249 250 251 252 253 group in addition to the active treatments (e.g., in studies of a symptomatic treatment), one is not necessarily included in these comparative trials. Such omission of a placebo group may render such studies uninformative, however, when they show no difference between treatments, unless assay sensitivity can be supported in some other way. Where comparative effectiveness is the principal interest, it is usually important—where it is ethical, as would be the case in most symptomatic conditions—to include a placebo control as well as the active control. Trials of most symptomatic treatments have a significant failure rate (i.e., they often cannot show the drug is superior to placebo). Where that is the case in a comparative trial, seeing no difference between treatments is uninformative. Inclusion of a placebo group can provide clear evidence that the study did have assay sensitivity (the ability to distinguish effective from ineffective treatments), critical if a finding of no difference between treatments is to be interpretable. For example, we have seen that approximately 50% of all placebo-controlled antidepressant trials of effective agents cannot distinguish drug from placebo. A trial in which two antidepressants are compared and found to have a similar effect is informative only if we know that the two drugs can be distinguished from the concurrent placebo group. b. Assessing assay sensitivity of a placebo-controlled study Although a successful superiority trial (e.g., placebo-controlled) is readily interpreted, a failed trial of this design is not. Failure to show superiority to placebo can mean that the drug is ineffective or that the trial lacked assay sensitivity. To distinguish between these two possibilities, it is often useful to include an active control in placebo-controlled studies of drugs in a class or condition where known effective drugs often cannot be distinguished from placebo (e.g., depression, allergic rhinitis, angina, and many other symptomatic conditions). If the active control is superior to placebo but the test drug is not, one can conclude that the test drug lacks effectiveness (or at least is less effective than the active control). If neither the active control nor the test drug is superior to placebo, the trial lacked assay sensitivity and is uninformative about the effect of the test drug. 4. The Non-Inferiority Margin As described above, the NI study seeks to show that the difference in response between the active control (C) and the test drug (T), (C-T), the amount by which the control is superior to test drug, is less than some pre-specified non-inferiority margin (M). M can be no larger than the presumed entire effect of the active control in the NI study, and the margin based on that whole active control effect is generally referred to as M1. It is critical to reiterate that M1 is not measured in the NI trial, but must be assumed based on past performance of the active control, the comparison of the current NI study with prior studies, and assessment of the quality of the NI study (see below). The validity of any conclusion from the NI study depends on the choice of M1. If, for example, the NI margin is chosen as 10 (because we are sure the control had an effect of at least that size), and the study does indeed rule out a difference of 10 (seeming to demonstrate “effectiveness” of T), but the true effect of C in this study was actually less than 10, say 5, T would not in fact have been shown to have any 7 Contains Nonbinding Recommendations Draft – Not for Implementation 254 255 256 257 258 259 260 261 262 263 264 265 266 267 268 269 270 271 272 273 274 275 276 277 278 279 280 281 282 283 284 285 286 287 288 289 290 291 292 293 294 295 296 297 298 effect at all; it will only appear to have had such an effect. The choice of M1, and assurance that this effect was present in the trial (i.e., the presence of assay sensitivity) is thus critical to obtaining a meaningful, correct answer in an NI study. Because the consequence of choosing a margin greater than the actual treatment effect of the active control in the study is the false conclusion that a new drug is effective (a very bad public health outcome), there is a powerful tendency to be conservative in the choice of margin and in the statistical analysis that seeks to rule out a degree of inferiority of the test drug to the active control of more than that margin. This is generally done by ensuring that the upper bound of the 95% two-sided confidence interval for C-T is smaller than M1. The upper bound of the confidence interval for C-T is not, however, the only measurement of interest, just as the lower bound of a 95% confidence interval for effect size of drug versus placebo is not the only value of relevance in a placebo-controlled trial. The point estimate of the treatment effect and the distribution of estimates of C-T smaller than the 95% upper bound are also relevant. Nonetheless, the upper bound of the 95% CI is typically used to judge the effectiveness of the test drug in the NI study, just as a two-sided p-value of 0.05 or less is traditionally the standard used for defining success in a superiority trial. The 95% CI upper bound for C-T is used to provide a reasonably high level of assurance that the test drug does, in fact, have an effect greater than zero (i.e., that it has not lost all of the effect of the active control). Although the NI margin used in a trial can be no larger than the entire assumed effect of the active control in the NI study (M1), it is usual and generally desirable to choose a smaller value, called M2, for the NI margin. Showing non-inferiority to M1 would provide assurance that the test drug had an effect greater than zero. However, in many cases that would not be sufficient assurance that the test drug had a clinically meaningful effect. After all, the reason for using the NI design is the perceived value of the active control drug. It would not usually be acceptable to lose most of that active control’s effect in a new drug. It is therefore usual in NI studies to choose a smaller margin (M2) that reflects the largest loss of effect that would be clinically acceptable. This can be described as an absolute difference in effect (typical of antibiotic trials) or as a fraction of the risk reduction provided by the control (typical in cardiovascular outcome trials). Note that the clinically acceptable margin could be relaxed if the test drug were shown to have some important advantage (e.g., on safety or on a secondary endpoint). The definitions used to describe these two versions of M are: M1 = the entire effect of the active control assumed to be present in the NI study M2 = the largest clinically acceptable difference (degree of inferiority) of the test drug compared to the active control M1 is based on (1) the treatment effect estimated from the historical experience with the active control drug, (2) assessment of the likelihood that the current effect of the active control is similar to the past effect (the constancy assumption), and (3) assessment of the quality of the NI trial, particularly looking for defects that could reduce a difference between 8 Contains Nonbinding Recommendations Draft – Not for Implementation 299 300 301 302 303 304 305 306 307 308 309 310 311 312 313 314 315 316 317 318 319 320 321 322 323 324 325 326 327 the active control and the new drug (this diminution of the between-treatment difference is a “bias toward the null” in a trial seeking to show a difference (i.e., superiority), but in this case is a “bias toward the alternative”). Note that because of this third element, the size of M1 cannot be entirely specified until the NI study is complete. M2 is a matter of clinical judgment, but M2 can never be greater than M1, even if, for active control drugs with small effects, a clinical judgment might argue that a larger difference is not clinically important. Even if that clinical judgment were reasonable, an M2 greater than M1 cannot be used to demonstrate that the test drug has any effect. As explained above, ruling out a difference between the active control and test drug larger than M1 is the critical finding that supports a conclusion of effectiveness. This analysis is approached with great rigor; that is, a difference (C-T) larger than M1 needs to be ruled out with a high degree of statistical assurance. As M2 represents a clinical judgment, there may be a greater flexibility in interpreting a 95% upper bound for C-T that is slightly greater than M2, as long as the upper bound is still well less than M1 (see Figure 3). Figure 3. Active Control – Test Drug differences (Point estimate, 95% CI) Control – Test (C-T) (degree of inferiority of test drug) 1. C-T point estimate = 0 and upper bound of 95% CI < M2, indicating test drug is effective (NI demonstrated). 2. Point estimate of C-T favors C and upper bound of 95% CI < M1 but > M2, indicating effect > 0 but unacceptable loss of the control effect. 3. Point estimate of C-T is zero and upper bound of 95% CI < M1 but it is 9 Contains Nonbinding Recommendations Draft – Not for Implementation 328 329 330 331 332 333 334 335 336 337 338 339 340 341 342 343 344 345 346 347 348 349 350 351 352 353 354 355 356 357 358 359 360 361 362 363 364 365 366 367 368 369 370 371 372 slightly greater than M2. Judgment could lead to conclusion of effectiveness. 4. C-T point estimate favors C and upper bound of 95% CI > M1, indicating there is no evidence of effectiveness for test drug. 5. Assay Sensitivity and Choosing M1 Assay sensitivity (AS) is an essential property of a NI clinical trial. AS is the ability of the trial to have detected a difference between treatments of a specified size, M1 (the entire assumed treatment effect of the active control in the NI trial), if such a difference were present. Stated in another way, AS means that had the study included a placebo, a control drug-placebo difference of at least M1 would have been demonstrated. As noted, the actual effect of the active control versus placebo is not measured in the NI trial; rather it is estimated (assumed) based on past studies of the drug and comparison of past studies with the current NI study. Note that AS is related to M1, our best estimate of the effect of the control in the study, even if the NI margin to be used is smaller (M2). Even if the NI margin to be used is M2, for example, and is chosen as some percentage of M1, say 50%, if the active control had an effect of less than M1 in the trial, the trial would not have shown that M2 was ruled out. As noted above, the choice of M1, and the decision on whether a trial will have AS (i.e., the active control would have had an effect of at least M1), is based on three considerations: (1) historical evidence of sensitivity to drug effects; (2) the similarity of the new NI trial to the historical trials (the constancy assumption), and (3) the quality of the new trial (ruling out defects that would tend to minimize differences between treatments). • Historical evidence of sensitivity to drug effects (HESDE) (ICH E-10) HESDE means that appropriately designed and conducted trials in the past that used a specific active treatment (generally the one that is to be used in the new NI study or, in some cases, one or more pharmacologically closely related drugs) regularly showed this treatment to be superior to placebo (or some other treatment). These consistent findings allow for a reliable estimate of the drug’s effect size compared to placebo in those past studies, a reasonable starting point for estimating its effect in the NI study. The estimate of effect size must take the variability of past results into account; one would not presume that the largest effect seen in any trial, or even the point estimate of a meta-analysis, is likely to be the effect size in the new study. Analysis of historical data will be discussed further in section IV. HESDE cannot be determined for many symptomatic treatments, where well-designed and conducted studies often fail to distinguish drug from placebo (e.g., treatments for depression, anxiety, insomnia, angina, symptomatic heart failure, symptoms of irritable bowel disease, and pain). In those cases, there is no reason to assume that an active control would have shown superiority to a placebo (had there been one) in any given NI study, and NI studies of drugs for these treatments are not informative. This is also true for some outcome effectiveness findings, such as secondary prevention of cardiovascular disease with aspirin and post-infarction beta blockade. In the case of aspirin, the largest placebo-controlled trial 10 Contains Nonbinding Recommendations Draft – Not for Implementation 373 374 375 376 377 378 379 380 381 382 383 384 385 386 387 388 389 390 391 392 393 394 395 396 397 398 399 400 401 402 403 404 405 406 407 408 409 410 411 412 413 414 415 416 417 (AMIS, the Aspirin Myocardial Infarction Study; see Example 3) showed no effect of aspirin at all, even though other trials all favored aspirin. Similarly, of more than 30 post-infarction beta-blocker trials, only a small number showed significantly improved survival or other cardiovascular benefit. • Similarity of the current NI trial to the historical studies – the “constancy assumption” The conclusion that HESDE can be used to choose M1 for the new NI study can be reached only when it is possible to conclude that the NI study is sufficiently similar to the past studies with respect to all important study design and conduct features that might influence the effect size of the active control. This is referred to as the “constancy assumption.” The design features of interest include the characteristics of the patient population, important concomitant treatments, definitions and ascertainment of study endpoints, dose of active control, entry criteria, and analytic approaches. The effect of an ACE inhibitor on heart failure mortality has repeatedly been shown in studies where the drugs were added to diuretics and digoxin, but evolution in treatment since those studies were conducted raises questions about our understanding of the present-day effect of these drugs. Since the time of those studies, new medications (beta blockers, spironolactone) have come into standard use. We do not know whether the past effect would still be present when ACE inhibitors are added to a regimen including those two drugs. Similarly, the effect of a thrombolytic on cardiovascular mortality could depend on how soon after symptoms the drug was given, concomitant use of anticoagulants and platelet inhibitors, and use of lipid-lowering drugs. As a general matter, the historical and new NI studies should be as close to identical as possible in all important respects. It is easier to be reasonably assured that endpoints in the historical trial will be similar to, and will be evaluated similarly to, endpoints in the new trial when these are well-standardized and objective. The effect of the active control could be on a single endpoint (e.g., mortality) or on a composite (e.g., death, heart attack, and stroke), but, again, it is critical that measurement and assessment of these be reasonably consistent over time. The endpoint used in the NI study need not necessarily be the one used in the original trials of the active control if data are available to estimate the occurrence rate of the new endpoint used in the NI study. For example, even if the historical studies used a mortality endpoint, the studies could be used if data could be obtained to calculate an effect size for death plus hospitalization, so long as it was possible to be confident that the circumstances leading to the hospitalization were similar in the historical studies and the NI study. Note, however, that it would not be acceptable to search through a range of endpoints to find the largest historical effect, as this could represent an overestimate of the effect to be expected in the NI study. In general, where there has been substantial evolution over time in disease definition and treatment, supporting the constancy assumption may be difficult. Although an NI study can be designed to be similar in most aspects to the historical studies, it may not be possible to assess that similarity fully until the NI study is completed and various 11 Contains Nonbinding Recommendations Draft – Not for Implementation 418 419 420 421 422 423 424 425 426 427 428 429 430 431 432 433 434 435 436 437 438 439 440 441 442 443 444 445 446 447 448 449 450 451 452 453 454 455 456 457 458 459 460 461 462 characteristics of the study population and response are evaluated. When there is known demonstrated heterogeneity of the active control treatment effect related to patient characteristics (e.g., age, gender, severity), and when that heterogeneity can be quantified, it may be necessary to adjust the estimate of the active control effect size in the NI study if the mix of patient characteristics in the historical and NI studies differ substantially. The property of constancy of the treatment effect may depend on which metric is chosen to represent the treatment effect. This issue is discussed in more depth in section IV.B.2.d. Experience suggests that when background rates of outcomes differ among study populations, metrics like hazard ratios or relative risks are more stable than is a metric like absolute effect size, which is more sensitive to changes in event rates in the population. • Good Study Quality A variety of study quality deficiencies can introduce what is known as a “bias toward the null,” where the observed treatment difference in an NI study is decreased from the true difference between treatments. These deficiencies include imprecise or poorly implemented entry criteria, poor compliance, and use of concomitant treatments whose effects may overlap with the drugs under study, inadequate measurement techniques, or errors in delivering assigned treatments. Many such defects have small (or no) effects on the variability of outcomes (variance) but reduce the observed difference C-T, potentially leading to a false conclusion of non-inferiority. It should also be appreciated that intent-to-treat approaches, which preserve the principle that all patients are analyzed according to the treatment to which they have been randomized even if they do not receive it, although conservative in superiority trials, are not conservative in an NI study, and can contribute to this bias toward the null. It is more important than usual to plan in advance steps to ensure quality during the conduct of an NI study. Finally, it should be recognized that although most investigators seek to carry out high quality trials, the incentives in an NI study are perverse, and quite different from those in superiority trials. In a superiority trial, sloppiness can lead to study failure, and major efforts in trial conduct and monitoring are therefore devoted to avoiding it. In general, sloppiness of any sort obscures true treatment differences. In an NI trial, in contrast, where the goal is to show no difference (or no difference greater than M), poor quality can sometimes lead to an apparent finding of non-inferiority that is incorrect. There is therefore a critical need for particular attention to study quality and conduct when planning and executing an NI study. 6. Regulatory Conclusions A successful non-inferiority study shows rigorously that the test drug has an effect greater than zero if it excludes an NI margin of M1, so long as M1 is well chosen and represents an effect that the control drug actually would have had (versus a placebo, had there been a placebo group). It can also show that the test drug had an effect greater than some fraction of the control drug effect, depending on the M2 that is used. It should be appreciated that in addition to the rigorous demonstration of effectiveness, the trial provides additional 12 Contains Nonbinding Recommendations Draft – Not for Implementation 463 464 465 466 467 468 469 470 471 472 473 474 475 476 477 478 479 480 481 482 483 484 485 486 487 488 489 490 491 492 493 494 495 496 497 498 499 500 501 502 503 504 505 506 507 information, just as a placebo-controlled trial supporting the effectiveness of a drug does. The point estimate of the drug effect and its confidence interval (usually 95% but could be 90% or 99% under some circumstances) provides information about how large the difference in treatment effect between the test and control drug is likely to be. In most cases a successful NI study supports effectiveness of the test drug, but it only rarely will support a conclusion that the drug is “equivalent” or “similar” to the active control, a concept that has not been well-defined for these situations. Such similarity might be concluded, however, if the point estimate of the test drug favored it over the control and the upper bound of the 95% CI for C-T was close to showing superiority. Where the chosen M2 is very small compared to the control drug effect (e.g., a 10% margin in an antibiotic trial in urinary tract infections where response rate is 80%), it might be concluded that the effectiveness of the test drug and control are very similar. B. Practical Considerations in Use of NI Designs 1. Consider Alternative Designs ICH E10 identifies a wide variety of study designs that may be better than an NI design in situations where there is difficulty or uncertainty in setting the NI margin, or where the NI margin needs to be so small that the NI study sample size becomes impossibly large. • Add-on study In many cases, for a pharmacologically novel treatment, the most interesting question is not whether it is effective alone but whether the new drug can add to the effectiveness of treatments that are already available. The most pertinent study would therefore be a comparison of the new agent and placebo, each added to established therapy. Thus, new treatments for heart failure have added new agents (e.g., ACE inhibitors, beta blockers, and spironolactone) to diuretics and digoxin. As each new agent became established, it became part of the background therapy to which any new agent and placebo would be added. This approach is also typical in oncology, in the treatment of seizure disorders, and, in many cases, in the treatment of AIDS. • Identifying a population not known to benefit from available therapy in which a placebo-controlled trial is acceptable In many outcome study settings, effectiveness is established for some clinical settings (e.g., severe disease) but not others. Therefore, it may be possible to study less severely ill patients in placebo-controlled trials. The demonstration that simvastatin was effective in hypercholesterolemic post-infarction patients (4S), for example, did not forestall studies of statins in hypercholesterolemic non-infarction patients (WOSCOPS) or in patients with lesser degrees of hypercholesterolemia (TEXCAPS). This is legitimate so long as one does not in fact know the treatment is of value in the new study population. Recently, it has been possible to study angiotensin receptor 13 Contains Nonbinding Recommendations Draft – Not for Implementation 508 509 510 511 512 513 514 515 516 517 518 519 520 521 522 523 524 525 526 527 528 529 530 531 532 533 534 535 536 537 538 539 540 541 542 543 544 545 546 547 548 549 550 551 blockers (ARBs) in heart failure in a placebo-controlled trial in patients intolerant of ACE inhibitors (known to improve survival). It would not have been possible to deny a more general population of heart failure patients an ACE inhibitor. • Early escape, rescue treatment, randomized withdrawal In symptomatic conditions, there may be reluctance to leave people on placebo for prolonged periods when effective therapy exists. It is possible to incorporate early escape/rescue provisions for patients who do not respond by a particular time, or to use a design that terminates patients on first recurrence of a symptom such as unstable angina, grand mal seizure, or paroxysmal supra- ventricular tachycardia. To evaluate the persistence of effects over time, where conducting a long-term placebo-controlled trial would be difficult, a randomized withdrawal study can be used. Such a study randomly assigns patients treated with a drug for a long period to placebo or continued drug treatment. As soon as symptoms return, the patient is considered to have had an endpoint. This design was first suggested to evaluate long-term benefit in angina. 2. Number of Studies Needed Ordinarily, with exceptions allowed by the FDA Modernization Act of 1997 (the Modernization Act), FDA expects that there will be more than one adequate and well controlled study supporting effectiveness. The Modernization Act allows one study plus confirmatory evidence to serve as substantial evidence in some cases, and FDA has discussed in guidance (Providing Clinical Evidence of Effectiveness for Human Drug and Biological Products) when a single study might be sufficient. Where there is uncertainty about the historical effect size (and thus M1) because of variability or reliance on a single historical study, it will usually be necessary to have more than one NI study to support effectiveness. Where the studies are of relatively modest size (e.g., most antibiotic NI trials), there is no impediment to conducting more than one NI trial. When the trials needed are very large (to have adequate statistical power), however, this may become a significant problem and it is worth considering what might make a single trial persuasive. Generally, two considerations might do so: (1) prior information, (2) a statistically persuasive result. • Prior information It is common in NI trials for the test drug to be pharmacologically similar to the active control. (If they were not pharmacologically similar, an add-on study would usually have been more persuasive and more practical). In that case, the expectation of similar performance (but still requiring confirmation in a trial) might make it possible to accept a single trial and perhaps could also allow less conservative choices in choosing the non 14 Contains Nonbinding Recommendations Draft – Not for Implementation 552 553 554 555 556 557 558 559 560 561 562 563 564 565 566 567 568 569 570 571 572 573 574 575 576 577 578 579 580 581 582 583 584 585 586 587 588 589 590 591 592 593 594 595 596 inferiority margin. A similar conclusion might be reached when other types of data are available, for example: • If there were a very persuasive biomarker confirming similar activity of the test drug and active control (e.g., tumor response, ACE inhibition, or extent of beta blockage) • If the drug has been shown to be effective in closely-related clinical settings (e.g., effective as adjunctive therapy with an NI study of monotherapy) • If the drug has been shown to be effective in distinct but related populations (e.g., pediatric versus adult) • Statistically persuasive result A conclusion that an NI trial can be considered statistically persuasive can be reached in several ways, including the internal consistency of the NI finding, and the margin that is ruled out with a two-sided 95% confidence interval. It is important to recognize that there are two margins of interest, M1 and M2. In an NI study, the clinically determined margin M2 is smaller, often considerably smaller, than M1, which addresses the question of whether the test drug has any effect. For example, M2 might be chosen to be 40% of M1. By meeting this M2 criterion, ruling out a loss of 40% of the effect of the control, a single NI study provides reasonable assurance that the test drug preserves a clinically sufficient fraction (at least 60%) of the effect of the control treatment. At the same time, it provides strong assurance (probably equivalent in strength to p ≤ 0.001 in a superiority trial) that the test drug has an effect greater than zero. Particularly where there is strong prior information on the effectiveness of the pharmacological class being studied in the NI trial, showing non inferiority using M2 thus provides very strong evidence, analogous statistically to the 2 studies (at p ≤ 0.05) standard for difference–showing trials, that the new drug has an effect. In such cases, a single such trial would usually be a sufficient basis for approval. Where the effect of the drug is particularly critical, of course, it might be considered necessary to demonstrate that loss of M2 has been ruled out in more than one study. In some cases, a study planned as an NI study may show superiority to the active control. ICH E-9 and FDA policy has been that such a superiority finding arising in an NI study can be interpreted without adjustment for multiplicity. Showing superiority to an active control is very persuasive with respect to the effectiveness of the test drug, because demonstrating superiority to an active drug is much more difficult than showing superiority to placebo. Similarly, a finding of less than superiority, but with a 95% CI upper bound for C-T considerably smaller than M2, is also statistically persuasive. 3. Statistical Inferences The designer of an NI trial might hope that the test drug is actually superior to the control. It is possible to design the NI study to first test the hypothesis of NI with the pre-specified margin, and then if this test is successful, proceed to analyze the study for a superiority conclusion. This sequential strategy is entirely acceptable. No statistical adjustment is required. A possibility that has thus far had relatively little attention is to have different endpoints with different goals (e.g., superiority on the composite endpoint of death, AMI, 15 Contains Nonbinding Recommendations Draft – Not for Implementation 597 598 599 600 601 602 603 604 605 606 607 608 609 610 611 612 613 614 615 616 617 618 619 620 621 622 623 624 625 626 627 628 629 630 631 632 633 634 635 636 637 638 639 640 641 and stroke, but NI on death alone). The multiple endpoints would require some alpha adjustment in such a case, but the procedures here are not well defined. Similarly, if a study had several doses, with interest in NI on each of them and, at the same time, interest in a potential superiority finding for one or more doses, the analytical approach is not yet fully established, although it is clear that some correction for multiplicity would be needed. Seeking an NI conclusion in the event of a failed superiority test would almost never be acceptable. It would be very difficult to make a persuasive case for an NI margin based on data analyzed with study results in hand. If it is clear that an NI conclusion is a possibility, the study should be designed as an NI study. 4. Choice of Active Control The active control must be a drug whose effect is well-defined. The most obvious choice is the drug used in the historical placebo-controlled trials. Where studies of several pharmacologically similar drugs have been pooled, which is often done to obtain a better estimate of effect and a narrower confidence interval, and thus a larger M1, the choice may become complicated. In general, if the drugs in a meta-analysis of placebo-controlled trials seem to have similar effects, any of them could be used as an active control. If their observed treatment effects differ, however, even if not significantly, the one with the highest point estimate of effect should ordinarily be used. 5. Choice of NI Method The various approaches to calculating the NI margin and analyzing an NI study will be discussed in detail in section IV, but the most straightforward and most readily understood approach will be described here. This method is generally referred to as a fixed margin method and the 95%-95% method (or 90%-95% method, depending on the CIs used to calculate the NI margin) method. The first 95% refers to the confidence interval used to choose the effect size from the historical data, and the second 95% refers to the confidence level used to reject the null hypothesis in the NI study. This approach is illustrated by FDA’s evaluation of thrombolytics (TPA). To calculate the NI margin, all available placebo controlled trials of streptokinase, the active comparator or control, were pooled, giving a point estimate for the effect on survival of a 25% reduction in mortality, with a one-sided 95% lower bound of 22%. As 22% represented the risk reduction by streptokinase compared to placebo, this was translated to the risk increase from being on placebo (1 ÷ .78, or 1.28). The NI study would therefore have had to rule out a 28% increase in risk (the risk increase from a placebo) from not being on TPA. There was a clinical decision to ensure that not more than 50% of the effect of streptokinase was lost, giving an NI margin (M2) of 1.14, the 95% upper bound of the relative risk for TPA versus streptokinase (see section IV.B.2.c for further discussion of this calculation). This approach is relatively conservative, as it keeps separate the variability of estimates of the treatment effect in the historical studies and the variability observed in the NI study, and uses a fixed value for the estimate of the control effect based on historical data (the 90% or 16 Contains Nonbinding Recommendations Draft – Not for Implementation 642 643 644 645 646 647 648 649 650 651 652 653 654 655 656 657 658 659 660 661 662 663 664 665 666 667 668 669 670 671 672 673 674 675 676 677 678 679 680 681 682 683 684 685 686 95% CI lower bound), a relatively conservative estimate of the control drug effect. On the other hand, a conservative estimate of an important endpoint such as mortality is not necessarily unreasonable, particularly given the uncertainties associated with an NI design. IV. CHOOSING THE NON-INFERIORITY MARGIN AND ANALYZING THE RESULTS OF AN NI TRIAL A. Introduction This section will discuss how to determine the magnitude of the largest acceptable non inferiority margin, M1, and the clinical margin, M2, and how to analyze the NI study. M1 is the effect the active control (also called positive control) is thought to have had in the NI study. As the effect of the active control in the NI study is not measured (there is no placebo group), this effect must be assumed. The assumed value is based on the analysis of the effect of the active control seen in past controlled studies. M2 reflects the clinical judgment about how much of M1 should be preserved by ruling out a loss of M2. Thus, if it were concluded that it would be necessary for a test drug to preserve 75% of a mortality effect, M2 would be 25% of M1, the loss of effect that must be ruled out. It must be appreciated that subjectivity and judgment are involved in all aspects of these determinations, a fundamental difference from a superiority study where all the critical information is measured and no assumptions are needed. This guidance will address how these judgments should be made in selecting the margin selection specified in the NI analysis. As described in section III, the selection of a margin for an NI study is a two-step process. The first step involves making a reasonable assumption about the effect of the active comparator in the NI study. M1 is chosen to equal that treatment effect. If the advantage of the control over the test drug in the NI study is larger than M1, then the test drug has not been shown to have any effect. Effectiveness is therefore demonstrated by showing that the advantage of the control over the test drug (C-T) is smaller than M1. This can be demonstrated by showing that the upper bound of the 95% CI of C-T is below M1. This is very similar to testing a superiority finding at P ≤0.05. If we rule out loss of the entire assumed effect of the control, we can conclude that the test drug is superior to placebo. In most situations where active control studies are used, however, assuring some effect greater than zero is not clinically sufficient, and the second step in selecting the NI margin is choosing a specified portion of the control effect (M1) whose loss by the test product must be ruled out. This new non-inferiority margin is called M2, and is based upon clinical judgment. The multiple steps and assumptions that are made in determining an NI margin are all potential sources of uncertainty that may be introduced into the results and conclusions of an NI study. This guidance attempts to identify these sources and suggest approaches to accounting for these uncertainties so that we can reduce the possibility of drawing false conclusions from an NI study. Conceptually, the NI study design provides two comparisons: (1) a direct comparison of the test drug with the active comparator drug, and (2) an indirect comparison of the test drug to 17 Contains Nonbinding Recommendations Draft – Not for Implementation 687 688 689 690 691 692 693 694 695 696 697 698 699 700 701 702 703 704 705 706 707 708 709 710 711 712 713 714 715 716 717 718 719 720 721 722 723 724 725 726 727 728 729 730 731 placebo, based on what is known about how the effect of the active comparator compares to placebo. The entire NI trial concept depends on how much is known about the size of the treatment effect the active comparator will have in the NI study compared to no treatment, but this effect size is not measured in the NI study and must be assumed, based on an analysis of past studies of the control. The validity of the NI trial depends wholly on the accuracy of the assumed effect on the control. The assumed effect size of the active control in the NI study is based on evidence of that effect derived from past trials, usually trials comparing control with placebo, but trials assessing dose-response, active comparison trials, and even historically controlled trials could play a role. Having assessed the effect of the active control in the past and establishing HESDE (Historical Evidence of Sensitivity to Drug Effect – ICH E-10), it is then necessary to decide whether that effect can be presumed to be present in the new study (the constancy assumption) or must be adjusted in some way based on differences between present-day and historical trials that would reduce the active control effect size. This will be discussed further in section IV.B.2.d. It is also critical to ensure study quality in the NI trial, because poor quality can reduce the control drug’s effect size and undermine the assumption of the effect size of the control agent, giving the study a “bias toward the null,” which in this case represents the desired outcome. Having established a reasonable assumption for the control agent’s effect in the NI study, there are essentially two different approaches to analysis of the NI study, one called the fixed margin method (or the two confidence interval method) and the other called the synthesis method. Both approaches are discussed in later sections of section IV and use the same data from the historical studies and NI study, but in different ways. Briefly, in the fixed margin method, the margin M1 is based upon estimates of the effect of the active comparator in previously conducted studies, making any needed adjustments for changes in trial circumstances. The NI margin is then pre-specified and it is usually chosen as a margin smaller than M1 (i.e., M2), because it is usually felt that for an important endpoint a reasonable fraction of the effect of the control should be preserved. The NI study is successful if the results of the NI study rule out inferiority of the test drug to the control by the NI margin or more. It is referred to as a fixed margin analysis because the past studies comparing the drug with placebo are used to derive a single fixed value for M1, even though this value is based on results of placebo-controlled trials (one or multiple trials versus placebo) that have a point estimate and confidence interval for the comparison with placebo. The value typically chosen is the lower bound of the 95% CI (although this is potentially flexible) of a placebo-controlled trial or meta-analysis of trials. This value becomes the margin M1, after any adjustments needed for concerns about constancy. The fixed margin M1, or M2 if that is chosen as the NI margin, is then used as the value to be excluded for C-T in the NI study by ensuring that the upper bound of the 95% CI for C-T is < M1 (or M2). This 95% lower bound is, in one sense, a conservative estimate of the effect size shown in the historical experience. It is recognized, however, that although we use it as a “fixed” value, it is in fact a random variable, which cannot invariably be assumed to represent the active control effect in the NI study. 18 Contains Nonbinding Recommendations Draft – Not for Implementation 732 733 734 735 736 737 738 739 740 741 742 743 744 745 746 747 748 749 750 751 752 753 754 755 756 757 758 759 760 761 762 763 764 765 766 767 768 769 770 771 772 773 774 775 776 The synthesis method, derived from the same data, combines (or synthesizes) the estimate of treatment effect relative to the control from the NI trial with the estimate of the control effect from a meta-analysis of historical trials. This method treats both sources of data as if they came from the same randomized trial, to project what the placebo effect would have been had the placebo been present in the NI trial. The process makes use of the variability from both the NI trial and the historical trials and yields one confidence interval for testing the NI hypothesis that the treatment rules out loss of a pre-specified fixed fraction of the control effect, without actually specifying that control effect or a specific fixed NI margin based on the control effect. B. Statistical Uncertainties in the NI Study and Quantification of Treatment Effect of Active Control 1. What are the Sources of Uncertainty in an NI Study? There are three major sources of uncertainty about the conclusions from an NI study. Two of these relate to estimating the size of the effect the active control will have in the NI study because that value is the basis for choosing M1, the non-inferiority margin whose exclusion will be used to conclude that the test drug has an effect. The third is the degree of statistical assurance needed in the NI study itself to determine whether the chosen NI margin has in fact been ruled out. The first source of statistical uncertainty involves the precision (or variability) of the estimate of the active comparator treatment effect that is derived from an analysis of past data (HESDE), whether this is based on a single randomized active comparator placebo-controlled trial or from multiple trials. The uncertainty of this treatment effect estimate is quantified statistically by using confidence intervals to describe the range within which the true treatment effect size is likely to fall. As described in section III, assurance that the active control will produce a specific effect (at least M1) in the NI study is the single most critical determination to be made in planning the NI study. Using the point estimate of the treatment effect would not be an acceptable choice for the true treatment effect in the NI study because, on average, half of all trials, even if the historical estimate is correct, would be expected to have a smaller effect, so that one could not be reasonably sure such an effect of the control was present in the NI study. It has therefore become common practice to examine the confidence interval for the effect in historical experience and choose an effect that is reasonably sure to be present in a new study, such as the lower bound of a 95% confidence interval for the historical experience. Particular problems arise when there is only a single historical study, as there is no information about study-to-study variability (although of course, the confidence interval is likely to be wider when there is only one study), when there are multiple studies but substantial inconsistency in effect sizes among them, and when data from several pharmacologically related drugs are used to develop the estimate for the effect of the active control. When more than a single active comparator study is available, it is necessary to 19 Contains Nonbinding Recommendations Draft – Not for Implementation 777 778 779 780 781 782 783 784 785 786 787 788 789 790 791 792 793 794 795 796 797 798 799 800 801 802 803 804 805 806 807 808 809 810 811 812 813 814 815 816 817 818 819 820 821 examine the results from each of the studies to determine whether the treatment effects are consistent among studies or whether there are some studies where the estimate of the treatment effect is zero. The need for some consistency of the active comparator effect size is important and should be considered when choosing M1. There are also circumstances that might support a less conservative choice for M1 than the lower bound of the 95% CI for the historical experience. These include factors that strongly support the expectation of a similar clinical effect with the test drug, such as pharmacologic properties of the test drug that are very similar to those of the active control or an effect of the test drug on a persuasive biomarker. The second source of uncertainty is not statistically based but rather arises from the concern that the effect size estimated from past studies will be different from (larger than) the effect of the active control in the current NI study. The need to assume that the effect will be unchanged is often referred to as the “constancy assumption.” If the assumption is incorrect, and the effect size in the current NI study is smaller than the estimated effect from historical studies, M1 will have been incorrectly chosen (too large) and an apparently successful study showing NI could have given an erroneous result. Lack of constancy can occur for many reasons, including advances in adjunctive medical care, differences in the patient populations, or changes in the assessment of the endpoints under study. As noted in section III, there is some experience to support the view that in outcome studies, the absolute size of the treatment effect is more likely to be variable and sensitive to the background rates in the control group than is the risk reduction. The risk reduction may thus be a more constant (see section IV.B.2.c. on choice of metrics) measure of control drug effect than the absolute effect. How to adjust the NI margin for concerns about constancy is inevitably a matter of judgment. The third source of uncertainty involves the risk of making a wrong decision from the test of the non-inferiority hypothesis in the NI study (i.e., concluding that C-T < M1 when it is not). This uncertainty is referred to as the Type I error, or the false positive conclusion risk, and is similar to the concern in a placebo-controlled trial that one might mistakenly conclude that a drug is more effective than placebo. It is, in other words, present in any hypothesis-testing situation. In the NI case, the statistical test is intended to ensure that the difference between control and test drug (C-T, the degree of superiority of the control over the test drug) is smaller than the NI margin, meaning that some of the effect of the control is preserved (if C T < M1) or that a sufficient amount is preserved (if C-T < M2). Typically, the one-sided Type 1 error is set at 0.025, by asking that the upper bound of the 95% CI for C-T be less than the NI margin; this is roughly similar to the usual statistical test for a placebo-controlled trial. If only one NI study is going to be conducted, the probability of a Type 1 error can be made smaller by requiring that the upper bound of a CI greater than 95% be calculated and be less than the margin. This is similar to what is a commonly done for a single placebo controlled trial (e.g., testing at an alpha of 0.001 instead of 0.05). As noted earlier, however, there may be prior information that eases this concern, and a single study at the usual Type 1 error boundary (0.025) may be considered sufficient if, for example, the drug and active control are pharmacologically similar. 20 Contains Nonbinding Recommendations Draft – Not for Implementation 822 823 824 825 826 827 828 829 830 831 832 833 834 835 836 837 838 839 840 841 842 843 844 845 846 847 848 849 850 851 852 853 854 855 856 857 858 859 860 861 862 863 864 865 866 This guidance will discuss the impact of the first two sources of uncertainty on the quantitative approaches to estimating the control treatment effect under different assumptions for these uncertainties, as well as the choice of margin to use in hypothesis testing. 2. Quantification of the Treatment Effect of the Active Comparator Past controlled studies of the active control provide the empirical data for estimating the size of the treatment effect of the active comparator drug. The magnitude of that treatment effect, which will be the initial basis for determining the control drug effect that can be assumed to be present in the NI study, is critical to determining whether conducting an NI study is feasible. If the active comparator has a small treatment effect, or an effect only marginally distinguished from placebo, or an inconsistent effect, an active controlled study designed to show non-inferiority is likely to require a very large sample size or not be practical at all. The magnitude of the treatment effect of the active comparator may be determined in several ways, depending upon the amount of data and the number of separate studies of similar design available to support this determination. The availability of many independent studies is generally more informative for this determination, because the estimate of the active comparator treatment effect size can be more precise and less subject to uncertainty, and because it becomes possible to judge the constancy of the effect for at least the period of the studies. a. Determining HESDE from a single study The most common situation in which an NI design is used involves outcome studies where the active control drug has been approved for use to reduce the risk of major events (death, stroke, or heart attack). It is not unusual for such approval to have been based on a single study in a specific setting, although there may be other pertinent data in related conditions or in different populations, or with pharmacologically similar drugs. Generally, basing an NI margin on a single randomized placebo-controlled superiority study would need to take into account the variability of the data in that study. The estimate of the treatment effect is usually represented by some metric such as the difference between the event rate in the active treatment group and the placebo control group, which can be an absolute difference in event rates or a risk ratio. The treatment effect has an uncertainty that is usually measured by the confidence interval, a representation of where the result is likely to be 95% of the time (for a 95% CI) in a future study. As a crude gauge, the lower bound of the 95% CI is approximately the effect size demonstrated at a p-value of 0.025 one-sided. It is common to use this value as the effect size we can be reasonably sure the active control had in the historical study and is very likely to have in a future NI study. It is, on average, a low estimate of the effect of the drug, and is “conservative” in that sense, but it is an effect size that has a high probability of being achieved by the active control in the NI study. In contrast, the point estimate of the effect seen in the historical study represents an effect size that may be closer to the true effect of the active control but is one that may not be obtained in a substantial fraction of any new studies. It is critical to choose the estimate of effect size conservatively (i.e., one that previous studies show is very likely to be attained in the NI 21 Contains Nonbinding Recommendations Draft – Not for Implementation 867 868 869 870 871 872 873 874 875 876 877 878 879 880 881 882 883 884 885 886 887 888 889 890 891 892 893 894 895 896 897 898 899 900 901 902 903 904 905 906 907 908 909 910 study) because the entire logic of the NI study rests on assurance that the active control in the NI study has an effect size at least equal to M1, the largest possible NI margin. Generally, therefore, for the fixed margin approach to setting the NI margin, the lower bound of the confidence interval of the effect size of the active comparator in its historical placebo controlled experience is used to determine M1 in order to be reasonably sure that the active control will have at least the effect defined as the M1 in the NI study. The situation improves if the p-value of the estimated treatment effect is much smaller than 0.05, say in the range of 0.01 or 0.001 or even smaller, because in that case the lower bound of the 95% CI will generally be well above zero (in absolute value) or 1.0 (for hazard ratio and other risk estimates). In this case, we are more certain that the treatment effect is real and that the effect of the control in the NI study will be of reasonable size. When there is only a single trial, there is no objective assessment of study-to-study variability, and there is inevitably concern about the level of assurance we can have that the control will have an effect of a particular size in the NI study. A potential cautious approach to account for this possible variability is to use the lower bound of a wider CI, such as the 99% CI. This is possible where the effect is very large, but will often yield an M1 that necessitates a very large NI trial. It may be reassuring in such cases if closely related drugs, or the control drug in closely related diseases, have similar effects. A high level of internal consistency in subpopulations (e.g., if the effect of the control drug is similar in subgroups based on gender or age), could also provide some reassurance as to the reproducibility of the result. Such findings might support use of the 95% CI lower bound even if there is only a single study of the active control drug in the population to be studied in the NI trial. b. Determining HESDE from multiple trials Identical clinical trials in identical populations can produce different estimates of treatment effect by chance alone. The extent to which two or more studies produce estimates of treatment effect that are close is a function of the sample size of each study, the similarity of the study populations, the conduct of the studies (e.g., dropout rates), and other factors that are probably not measurable. Therefore, another source of uncertainty to be considered when choosing a margin for the current NI study is the study-to-study variability in the estimate of treatment effect. When there are multiple studies of the active comparator treatment relative to a placebo or no treatment, the opportunity exists to obtain an overall estimate of the active control treatment effect as well as a measure of the study-to-study variability of that treatment effect. When multiple studies of the active control are available, meta-analytic strategies may be used to obtain a more precise estimate of the active control effects. But study-to-study variability in the active comparator treatment effect is a critical consideration as well, because one of the basic assumptions in NI studies is the consistency of the effect size between the historical studies and the current NI study. 22 Contains Nonbinding Recommendations Draft – Not for Implementation 911 912 913 914 915 916 917 918 919 920 921 922 923 924 925 926 927 928 929 930 931 932 933 934 935 936 937 938 939 940 941 942 943 944 945 946 947 948 949 950 951 952 953 954 955 Several special cases illustrate the use of multiple studies and problems that can arise. In some of these, when the study-to-study variability is great, the need to provide assurance that the control will have a definable effect size in the NI study (M1) makes it necessary to adopt a conservative estimate of the effect size. 1. The ideal case is one where there are many studies, each of sufficient size to demonstrate the effect of the active control, or where there are several large outcome studies, each of which has demonstrated an effect of the control, and where the effect sizes derived from these studies are reasonably consistent, so that a pooled estimate, obtained by a meta-analytic approach, provides a very stable and precise estimate of the control effect size (narrow 95% confidence bounds) and allows a choice of M1 that is large enough to allow a reasonable choice for an M2 margin and for the design of an NI study of reasonable size. 2. If there are many small studies, where some of them have not demonstrated an effect of the active control, a pooled estimate of the active control effect size and its confidence interval using a random effects model can still be useful, provided there is no evidence of statistical heterogeneity among the study effect sizes. 3. If there are several large outcome studies, some variation of effect sizes is expected, but it would be inappropriate to have the point estimate for one of these fall below the 95% CI lower bound of the pooled study data, suggesting that an explanation of these differences is needed and, in the absence of such an explanation, that it is not possible to determine an NI margin. In this case, a clear failure of one study to show any effect, again, without good explanation, such as wrong choice of endpoint or study population or inadequate sample size, would also argue against the use of an NI design. 4. There are sometimes several large trials of different drugs in a pharmacologic class. Pooling them may allow calculation of a 95% CI lower bound with a narrower CI that yields a higher estimate of the active control drug effect than would any single study. The presumption that the pharmacologically similar drugs would have similar effects may be reasonable, but care should be exercised in extending this assumption too far. If the effect size of these different drugs varies considerably in the trials, it may be reasonable to use the pooled data to estimate effect size, but it appears desirable to use the drug with the largest effect (point estimate) as the active control in the NI study, even if the pooled data (95% CI lower bound) are used to estimate the active control effect size. When an analysis is based on multiple studies, it is important to consider all studies and all patients. Dropping a study that does not show an effect, unless there is a very good reason, can overestimate the control drug effect and give a falsely high M1. As noted above, the existence of properly designed and sized studies that show no treatment effect of the active comparator may preclude conducting NI studies with that active comparator unless there are valid reasons to explain these results. 23 Contains Nonbinding Recommendations Draft – Not for Implementation 956 957 958 959 960 961 962 963 964 965 966 967 968 969 970 971 972 973 974 975 976 977 978 979 980 981 982 983 984 985 986 987 988 989 990 991 992 993 994 995 996 997 998 999 1000 Examples 1, 3, and 4 in the Appendix illustrate in more detail how multiple historical placebo-controlled trials of the active comparator studies are evaluated. c. Metrics of treatment effect There are several different metrics that can be used to assess the treatment effect estimated in an NI study. These include the following: • • • • • The absolute difference between test and control groups in the proportions of outcomes, cure rates, success rates, survival rate, mortality rate, or the like. This metric is typically used in antibiotic trials. The relative risk, or risk ratio (RR), which is the ratio of the rate of events such as death in the treatment and control groups. The risk reduction is 1-RR. Thus, if a treatment has a relative risk of 0.8 compared to placebo, it gives a risk reduction of 20%. The hazard ratio is the ratio of the hazards with the test treatment versus the control, much like relative risk, but it is a metric that represents the time specific rate of an event. It is usually employed for time to event or survival type studies. The odds ratio is a ratio of the odds of success or survival (or failure/death) of one treatment relative to the other. Note that when event rates are low, as is the case for many cardiovascular outcome studies, risk ratios and odds ratios are quite similar. The log of the relative risk, the odds ratio, or the hazard ratio can be used to make the metrics normally distributed and easier to evaluate in the analysis. The metric used in calculating HESDE need not be the one used in the original study. If placebo response rates differ markedly among several studies in a meta-analysis, it is generally more sensible to analyze relative risk than absolute risk. It seems far more likely that in the NI study it will be the risk reduction, not the absolute effect, that will be constant. Another consideration that is important for characterizing the treatment effect for time to event studies (which many mortality studies are) is the proportionality of the hazard ratio over the time domain of study treatment exposure. Since the treatment effect is reduced to a single estimated hazard ratio that expresses the treatment effect over the entire time period of exposure, it is important to be aware of and check that the assumption of a proportional or constant hazard ratio is appropriate for the drug and disease situation. The metric that is chosen will determine how the metric behaves in different scenarios, and may be critical in choosing the duration of the NI study. Note that we are using the convention that for the ratio of risks (bad outcomes such as failure rates or deaths) in the historical trials, risks are shown as control drug/placebo (i.e., the drug is the numerator), so that the RR (or HR) will be less than 1. In an NI study, the control drug becomes the denominator and the test drug is the numerator, with a risk increase to be ruled out. For example, if the control gives a 25% risk reduction relative to placebo, what must be ruled out to show that the NI margin is excluded is an increased risk of 33%, or an RR of 24 Contains Nonbinding Recommendations Draft – Not for Implementation 1001 1002 1003 1004 1005 1006 1007 1008 1009 1010 1011 1012 1013 1014 1015 1016 1017 1018 1019 1020 1021 1022 1023 1024 1025 1026 1027 1028 1029 1030 1031 1032 1033 1034 1035 1036 1037 1038 1039 1040 1041 1042 1043 1044 1045 1.33, calculated by dividing the active drug effect versus placebo into 1 (1÷0.75=1.33). How to calculate M2 is not entirely straightforward. If we take half of the control effect versus placebo, for an HR of 0.875, then convert that to the risk increase to be ruled out, we get 1÷0.875 or 1.14. If, on the other hand, we take half of the 33% increase calculated earlier, we get 1.165. Whether to calculate M2 before or after changing numerator and denominator is not settled. A way to calculate the margin without this asymmetry is to convert the HR to the natural logarithm scale. When the natural logarithm transformation of the risk ratio is used, that is, log (A/B) and log (B/A), the two logs have the same magnitude except that the signs are opposite. In the previous example, for 50% retention of the 25% risk reduction in the NI study, the non-inferiority margin for log (T/C) is the mid-point between log (4/3) and zero. By converting log risk ratio back to risk ratio, the non-inferiority margin for T/C is the square root of 4/3, giving a value of 1.155. The margin calculated that way then falls between the 1.14 and 1.165 calculated previously. The difference between expressing the treatment effect as the absolute difference between success rates in treatment groups and as the relative risk or risk ratio for success on the test treatment relative to the active comparator is illustrated in the following two examples. For the first example, consider a disease where the cure rate is at least 40% in patients receiving the selected active control and 30% for those on placebo, a 10% difference in cure rates. If the purpose of an NI study is to demonstrate that the test product is effective (i.e., superior to a placebo), then the difference between the test product and active control in the NI study must be less than 10%. The margin M1 would then be 10%. If the additional clinical objective is to establish that the test product preserves at least half of the active control’s effect, then the cure rate of the test product must be shown to be less than 5% worse than the control, the M2 margin. This approach depends on the control drug’s having an effect of at least 10% greater than a placebo (had there been one) in the NI study. If the population in the NI study did not have such a benefit (e.g., if the patients all had viral illnesses such that the benefit was less than 10%), then even if the 5% difference were ruled out, that would not demonstrate the desired effectiveness (although it would seem to). Note that in this case, if the true effect of the control in the study were 8%, then ruling out a 5% difference would in fact show some effect of the test drug, just not the desired 50% of control effect. The second example illustrates a non-inferiority margin selected for the risk ratio (test/control) metric. Let C and P represent the true rates of an undesirable outcome for the control and a placebo, respectively. The control’s effect compared to placebo is expressed by the risk ratio, C/P. A risk ratio of 1 represents no effect; a ratio of less than 1 shows an effect, a reduction in rate of undesirable outcomes. Metrics like the risk ratio may be less affected by variability in the event rates in a placebo group that would occur in a future study. For example, a risk ratio for the event of interest of 25 Contains Nonbinding Recommendations Draft – Not for Implementation 1046 1047 1048 1049 1050 1051 1052 1053 1054 1055 1056 1057 1058 3/4 =0.75 can be derived from very different absolute success results from different studies, as shown in the table below. While the risk ratio is similar in all four hypothetical studies, the absolute difference in success rates ranges from 5% to 20%. Suppose that the NI margin were based on historical studies showing control drug effects like those in the fourth study. The NI margin would then be chosen as 20%. Now suppose that under more modern circumstances the NI study had a control rate more like Study 1 and an effect size vs. placebo of far less than 20%. An NI margin (M1) of 20% would then be far greater than the drug effect in the NI study, and ruling out a difference of 20% would not demonstrate effectiveness at all. Thus, if the NI margin were chosen as ruling out an inferiority of 33% (or a relative risk of 1.33, i.e., 1 ÷ 0.75), if the control rate were 15%, the difference (M1) between test and control would need to be less than 5% (15% x 1.33 = 20%, or 5% > the 15% rate in the active control group). Study Number Study 1 Study 2 Study 3 Study 4 1059 1060 1061 1062 1063 1064 1065 1066 1067 1068 1069 1070 1071 1072 1073 1074 1075 1076 1077 1078 1079 1080 1081 1082 1083 1084 1085 Risk Ratio (C/P) 3/4 3/4 3/4 3/4 Control rate 15% 30% 45% 60% Placebo rate 20% 40% 60% 80% In this case, where absolute effect sizes vary but risk reductions are reasonably constant, the risk ratio metric provides a better adjustment to the lower event rate in the NI study. These examples illustrate the importance of understanding how a particular metric will perform. The choice between a relative metric (e.g., risk ratio) and an absolute metric (e.g., a difference in rates) in characterizing the effects of treatments may also be based upon clinical interpretation, medical context, and previous experience with the behavior of the rates of the outcome. d. The Concept of “Discounting” the Treatment Effect Size to Account for Various Sources of Uncertainty One of the strategies employed in choosing the margin M1 for the NI study design is that of “discounting” or reducing the magnitude of the margin size that is used in the NI study from what is calculated from the analysis of HESDE. Such discounting is done to account for the uncertainties in the assumptions that need to be made in estimating, based on past performance, the effect of the active control in the NI study. This concept of discounting focuses on M1 determination and is distinct from a clinical judgment that the effect that can be lost on clinical grounds should be some fraction of M1 (i.e., M2). As discussed above, there are uncertainties associated with translating the historical effect of the active control (HESDE) to the new situation of the active control NI trial, and it is tempting to deal with that uncertainty in the constancy assumption by discounting the effect (“take half”). To the extent possible, concerns about the active control effect should be as specific as possible, should use available data (e.g., magnitude of possible differences in effect in different patient population, consistency of past studies, and consistency within studies across population subsets should be examined), and should take into account factors that reduce the need for a 26 Contains Nonbinding Recommendations Draft – Not for Implementation 1086 1087 1088 1089 1090 1091 1092 1093 1094 1095 1096 1097 1098 1099 1100 1101 1102 1103 1104 1105 1106 1107 1108 1109 1110 1111 1112 1113 1114 1115 1116 1117 1118 1119 1120 1121 1122 1123 1124 1125 1126 1127 1128 1129 conservative estimate, such as the pharmacologic similarity of the test and control drugs and pharmacodynamic effects of the new drug, rather than reflecting “automatic” discounting. Having considered these matters, if significant uncertainties remain, an approach that further discounts or reduces, say by 25%, the magnitude of the active control effect based on HESDE can be considered. A closely related issue is adjustment of M1 to reflect a finding that the population in the NI study was different from the historical study in such a way that what the historical experience shows would lead to a smaller effect size (e.g., a finding of a smaller effect in women would need to be considered in assessing the validity of M1 if the NI study had substantially more women than the historical studies). In general, the assessment of the historical data should identify such differences so that plans for the NI study take this into account or so that the value of M1 can be revisited in light of the study population included in the NI study. C. Statistical Methods for NI Analysis Several approaches are used to demonstrate statistically that the NI objective is met. Each statistical approach to demonstrating NI depends upon a number of factors including: • • • What assumptions are made and how verifiable or empirically demonstrable these assumptions are The degree to which judgment, both statistical and clinical, is exercised in accounting for the various uncertainties in the data from the current NI study and also from the clinical trials of the active control that are the basis for estimating its effect The clinical judgment of how much of the treatment effect of the active comparator can be lost (M2 selection) As noted earlier, the two main approaches to demonstrating non-inferiority are the fixed margin method and the synthesis method. Each of these statistical approaches uses the same data from the previously conducted controlled trials of the active control and the same data from the current NI study, but the approaches are different in several ways. The first is with regard to their emphasis on the specific determination for M1 before determining M2. There is also a difference between them in how the data from the historical studies and the NI study are used or combined. What follows is a guide to the differences between the two approaches. Examples 1(A) and 1(B) in the Appendix provide more detailed illustrations of how each of these approaches is used and interpreted. In general, the fixed margin approach is more conservative and treats the variance of the NI study and historical evidence distinctly. That is, a very large historical database will give a narrower CI and larger 95% lower bound for M1, but it will not directly figure into the test drug versus placebo calculation, as is done in the synthesis method. Concern about using the synthesis approach reflects our view that the method incorporates too much certainty about the past results into the NI comparison. We believe the fixed margin approach is preferable for ensuring that the test drug has an effect greater than 27 Contains Nonbinding Recommendations Draft – Not for Implementation 1130 1131 1132 1133 1134 1135 1136 1137 1138 1139 1140 1141 1142 1143 1144 1145 1146 1147 1148 1149 1150 1151 1152 1153 1154 1155 1156 1157 1158 1159 1160 1161 1162 1163 1164 1165 1166 1167 1168 1169 1170 1171 1172 1173 1174 placebo (i.e., the NI margin M1 is ruled out). However, the synthesis approach, appropriately conducted, can be considered in ruling out the clinical margin M2. 1. The Fixed Margin Approach for Analysis of the NI Study Sections IV.B.2.a and B.2.b contain discussions of the basic statistical approach to estimating the active comparator treatment effect size from past controlled trials. The goal of these analyses is to define the margin M1, a fixed value, based on the past effect of the active control, which is intended to be no larger than the effect the active control is expected to have in the NI study. Whether M1 is based on a single study or multiple studies, the observed (if there were multiple studies) or anticipated (if there is only one study) statistical variation of the treatment effect size should contribute to the ultimate choice of M1, as should any concerns about constancy. The selection of M2 is then based on clinical judgment regarding how much of the M1 active comparator treatment effect can be lost. The exercise of clinical judgment for the determination of M2 should be applied after the determination of M1 has been made based on the historical data and subsequent analysis. All relevant studies of the active comparator and all randomized patients within these studies should generally be used in determining the margin M1 because that provides a more reliable and, possibly, conservative estimate. The actual selection of which studies are used in a meta-analysis and how that selection is made can be complex and itself subject to judgment. See Examples 1(A), 3, and 4 that illustrate these points in the Appendix. The design and analysis of the NI study, and its analysis using the fixed margin approach, is well known and described in ICH E9, section 3.3.2. This statistical approach relies upon the choice of a fixed non-inferiority margin that is pre-specified and part of the NI design. There is very little, however, in ICH E9 or ICH E10 that discusses just how to determine the margin. Although the constancy assumption and study quality issues are recognized, there is little discussion about how to adjust the margin because of such statistical or study data uncertainties. Any discounting of the historical evidence of the effect of the active control based on uncertainty of the constancy of the effect (e.g., because of changes in practice or concomitant treatment), which is an attempt to improve the estimate of the control effect in the NI study, affects the M2 as well, as in most cases M2 is a fraction of M1. M2 might not be affected when it is very small compared to M1, as is the case in considering very effective drugs. It is critical to note that M2 is a judgment that is made after M1 is chosen, but M2, of course, can never be larger than M1. It is perhaps tempting to make up for uncertainty in M1 by demanding assurance of preservation of a larger fraction of M1 by ruling out a smaller loss of effect (i.e., using a smaller M2), but the temptation should be avoided. The first and most critical task in designing an NI study is obtaining the best estimate of the effect of the active control in the NI study (i.e., M1). Operationally, the fixed margin approach usually proceeds in the following manner. The active comparator effect size is calculated from past placebo-controlled studies. The lower bound of the confidence interval describing the effect of the active control in past studies, a single number, is selected as a conservative choice for the active comparator effect size. 28 Contains Nonbinding Recommendations Draft – Not for Implementation 1175 1176 1177 1178 1179 1180 1181 1182 1183 1184 1185 1186 1187 1188 1189 1190 1191 1192 1193 1194 1195 1196 1197 1198 1199 1200 1201 1202 1203 1204 1205 1206 1207 1208 1209 1210 1211 1212 1213 1214 1215 1216 1217 1218 1219 While traditionally the 95% confidence interval is used, there can be flexibility in this choice, such as a 90% confidence interval or even narrower, when the circumstances are appropriate to do so (e.g., strong evidence of a class effect, strong biomarker data). It is recognized that use of a fixed margin to define the control response is conservative as it picks a “worst case” out of a confidence interval that consists of values of effect that are all larger. This choice, however, is one response to the inherent uncertainty of estimates based on past studies, including the variability of those past estimates, and the possibility that changes in medical practice, or hard to recognize differences between the past studies and the current NI study, have made the past effect an overestimate of the active control effect in the new study. Although some of the uncertainty about applicability of past results to the present is reflected in a conservative choice of margin (95% of CI lower bound) used to initiate consideration of M1, there may be further concerns about past variability and constancy that lead to a determination to discount this lower bound further in choosing M1 to account for any sources of uncertainty and dissimilarities between the historical data and the NI study to be conducted, as discussed in the earlier sections. Following this, a clinical judgment is made as to how much of this effect should be preserved. This clinical judgment could choose M2 to be the same as M1, but as noted, where the treatment effect is important (e.g., an effect on mortality) it is usual to ask that a reasonable fraction of the control effect be preserved, by making M2, the loss of effect to be ruled out, smaller than M1. Choosing M2 as 50% of M1 has become usual practice for cardiovascular (CV) outcome studies, whereas in antibiotic trials, where effect sizes are relatively large, a 10-15% NI margin for M2 is common. Note that the M2 of 50% of M1 is on a relative scale, whereas the 10-15% is on the absolute scale for antibiotic drugs. The analysis of the NI study involves only the data from the NI study, and the test of the hypothesis that inferiority greater than the M2 margin has been excluded is statistically similar to showing that the 95% CI in a superiority study excludes a difference of zero. Thus, there are two confidence intervals involved in the fixed margin approach, one from the historical data, where one uses the lower bound to choose M1, and one from the NI study (to rule out C-T > M2); in this example both intervals are 95% confidence intervals. That is why this fixed margin approach is sometimes called the 95%-95% method. It should be appreciated that the analysis of the NI study (ruling out a difference > M2 by examining the lower bound of the CI for C-T) is the analysis that is based on the randomized comparison in the NI study, in contrast to the determination of M1, which is not based on a concurrent randomization. Separating the process of estimating the treatment effect of the active comparator based upon the historical data (i.e., choice of M1) from the analysis of the NI study has some advantages and disadvantages. Two important advantages are that it provides a single number that is clinically understandable for an M1 (and derived M2) and that it provides a basis for planning the sample size of the NI study to achieve statistical control of Type 1 error and the power needed for the NI study to meet its objective for the pre-specified NI margin. One arguable disadvantage is that the method is statistically not efficient because it uses the two confidence interval approach rather than a combined estimate of the statistical variability of the historical 29 Contains Nonbinding Recommendations Draft – Not for Implementation 1220 1221 1222 1223 1224 1225 1226 1227 1228 1229 1230 1231 1232 1233 1234 1235 1236 1237 1238 1239 1240 1241 1242 1243 1244 1245 1246 1247 1248 1249 1250 1251 1252 1253 1254 1255 1256 1257 1258 1259 1260 1261 1262 1263 1264 and NI study data. Nevertheless, use of the fixed margin is readily understood, particularly by non-statisticians, and is only somewhat conservative compared to an analysis using the synthesis approach. Decisions to discount the M1 further or, where appropriate, to use a narrower confidence interval, are easily explained, and can make the fixed margin approach more or less conservative. Deciding on the NI clinical margin M2 is also a relatively straightforward concept. It is plainly a matter of judgment about how much of the treatment effect must be shown to be preserved, a consideration that may reflect the seriousness of the outcome, the benefit of the active comparator, and the relative safety profiles of the test and comparator. It also has major practical implications. In large cardiovascular studies, it is unusual to seek retention of more than 50% of the control drug effect even if this might be clinically reasonable, because doing so will usually make the study size infeasible. The fixed margin approach considers the NI margin as a single number, fixed in advance of the NI study. The hypothesis tested in the NI study determines whether the comparison of the test drug to the active control meets the specified NI criterion, assuming, of course, that the active control had at least its expected effect (equal to M1) and that the study therefore had assay sensitivity. A successful NI conclusion, ruling out a difference > M1, shows that the test drug is effective (just as a superiority study showing a significant effect at p ≤ 0.05 does) and, if a difference > M2 is also ruled out, shows that the new drug preserves the desired fraction of the control drug’s effect. This statistical test of hypothesis is not formally directed at determining whether the test drug would have been superior to a placebo, had a placebo group been included in the NI study, but it leads to a similar conclusion by ruling out the possibility that the test drug is inferior to the control by more than an amount equal to the whole effect of the control compared to placebo (that effect being known from past studies). The possible outcomes of such trials are shown in Figures 2 and 3 in section III of this guidance. 2. The Synthesis Approach for Analysis of NI An alternative statistical approach is known as the synthesis approach because it combines or synthesizes the data from the historical trials and the current NI trial, reflecting the variability in the two data sets (the current NI study and the past studies used to determine HESDE). The synthesis method is designed to directly address the question of whether the test product would have been superior to a placebo had a placebo been in the NI study, and also to address the related question of what fraction of the active comparator's effect is maintained (the loss to be ruled out) by the test product. In the synthesis approach, the NI margin is not predetermined, but the outcome of the NI study, a consideration of the effect of the test agent vs. placebo, can be judged for adequacy. Although the synthesis approach combines the data from the historical trials into the comparison of the concurrent active comparator and the test drug in the NI study, a direct randomized concurrent comparison with a placebo is of course not possible, as the placebo 30 Contains Nonbinding Recommendations Draft – Not for Implementation 1265 1266 1267 1268 1269 1270 1271 1272 1273 1274 1275 1276 1277 1278 1279 1280 1281 1282 1283 1284 1285 1286 1287 1288 1289 1290 1291 1292 1293 1294 1295 1296 1297 1298 1299 1300 1301 1302 1303 1304 1305 1306 1307 1308 1309 group is not a concurrent control and there is no randomization to such a group within the NI study. The imputed comparison with a placebo group that is not in the NI study thus rests on the validity of several assumptions, just as the fixed margin approach does. The critical assumption of the constancy of the active control effect size derived from the historical controlled trials is just as important when the synthesis method is used. Because of the way the variance of the historical data and the NI data are combined for the synthesis test, the synthesis test is more efficient (uses a smaller sample size or achieves greater power for the same sample size) than the fixed margin approach but requires assumptions that may not be appropriate. The statistical efficiency of the synthesis approach derives primarily from how the standard error of the comparison of test product to active comparator is dealt with. See Appendix, Example 1(B), for a comparison of the two methods and the variance calculations. The synthesis approach does not specify a fixed NI margin. Rather, the method combines (or synthesizes) the estimate of treatment effect relative to the control from the NI trial with the estimate of the control effect from a meta-analysis of historical trials. The method treats both sources of data as if they came from the same randomized trial, to project where the placebo effect would have been had the placebo been present in the NI trial. The synthesis process makes use of the variability from the NI trial and the historical trials and yields one confidence interval for testing the NI hypothesis that the treatment preserves a fixed fraction of the control effect, without actually specifying that control effect or a specific fixed NI margin based on the control effect. Clinical judgment is used to pre-specify an acceptable fraction of the control therapy’s effect that should be retained by the test drug, regardless of the magnitude of the control effect. A disadvantage of the synthesis approach, however, is that it does not allow for a pre specification of the actual size or magnitude of the NI margin M1, so the clinical judgment to determine the choice of M2 is difficult and is generally not made until results are seen. Moreover, it may be unrealistic to assign the same weight to the variance of the historical outcome data and to that of the concurrent randomized NI treatment As also noted, the efficiency of the fixed margin approach can sometimes be enhanced either formally, by including more trials (e.g., of related drugs) in the historical meta-analysis, and thereby increasing the margin M1, or, as a matter of judgment, by considering pharmacologic similarities between the control and test drugs, effects on pertinent biomarkers (e.g., tumor response rate), all of which could lead to choice of a fixed margin based on a less extreme boundary of the confidence interval (e.g., 80% instead of 95%). D. Considerations for Selecting M2, the Clinical Margin, and the Role of Subjective Judgment M2 is the margin that is the pre-specified NI margin that should be met in an NI study. The determination of M2 is based on clinical judgment and is usually calculated by taking a percentage or fraction of M1. The clinical judgment in determining M2 may take into account the actual disease incidence or prevalence and its impact on the practicality of sample sizes 31 Contains Nonbinding Recommendations Draft – Not for Implementation 1310 1311 1312 1313 1314 1315 1316 1317 1318 1319 1320 1321 1322 1323 1324 1325 1326 1327 1328 1329 1330 1331 1332 1333 1334 1335 1336 1337 1338 1339 1340 1341 1342 1343 1344 1345 1346 1347 1348 1349 1350 1351 1352 1353 that would have to be accrued for a study. There can be flexibility in the M2 margin, for example, when: (1) The difference between the active comparator response rate and the spontaneous response rate is large; (2) The primary endpoint does not involve an irreversible outcome such as death (in general, the M2 margin will be more stringent when treatment failure results in an irreversible outcome); (3) The test product is associated with fewer serious adverse effects than other therapies already available; (4) The test product is in a new pharmacologic category and has been shown to be tolerated by patients who do not tolerate therapies that are already available. There is also a difference in implication when the study NI conclusion is “not quite” significant (M1 is not excluded) for M1 and when this is the case for M2. Failure to exclude inferiority equal to M1 means there is no assurance of any effect. Just as, for a placebo controlled trial, it would be most unusual to accept as positive a study with p > 0.05, it would be most unusual to accept an NI study where the upper bound of 95% CI was > M1. On the other hand, failing to exclude M2 by a small amount means that instead of ruling out a loss of 50% of M1, you have ruled out, say, a 48% loss, not necessarily a definitive failure. As noted above, we would also consider the less conservative synthesis approach in assessing M2. E. Estimating the Sample Size for an NI Study It is important to plan the sample size for an NI clinical trial so that the trial will have the statistical power to conclude that the NI margin is ruled out if the test drug is truly noninferior. This is not always an easy task. At the protocol planning stage, using the fixed margin approach, the magnitude of the NI margin will be specified; the sample size must be based on the need to rule out inferiority greater than M2. This should usually be based on an NI using a fixed margin approach. The margin to be ruled out is the most critical component of the sample size planning, but the variance of the estimate of the treatment effects will not be known and it is also critical. A further problem is posed by the possibility that event rates will be lower in the new study. In this case, if the NI margin is expressed as, for example, ruling out (at the upper bound of the 95% CI for C-T) an increase in risk of 25%, this will be far easier when the event rate on active control is 8% than when it is 4%, even if the active control is superior to placebo by the same absolute 20% difference. This problem is not different from specifying sample size in a superiority trial. It too depends on the event rate, and it is common to examine blinded data during the trial to see if the event rate is unexpectedly low. A similar approach could be applied in an NI trial with upward adjustment of the sample size if the event rate is unexpectedly low. There is one further consideration. If, in reality, the test drug is somewhat more effective than the control, it will be easier to rule out any given NI margin and a smaller sample size could be used. A somewhat less effective test drug will, of course, require a larger sample size. 32 Contains Nonbinding Recommendations Draft – Not for Implementation 1354 1355 1356 1357 1358 1359 1360 1361 1362 1363 1364 1365 1366 1367 1368 1369 1370 1371 1372 1373 1374 1375 1376 1377 1378 1379 1380 1381 1382 1383 1384 1385 1386 1387 1388 1389 1390 1391 1392 1393 1394 1395 1396 1397 1398 F. Potential Biases in an NI Study Traditionally, analysis of the results of randomized clinical superiority trials follows the intent-to-treat principle, namely, that all randomized patients are analyzed according to the treatment to which they were randomized. This analysis is intended to avoid various biases associated with patients switching treatment, selection bias, and dropout/withdrawal patterns that may confound the observed treatment effect. This is recognized as a potentially conservative analysis. Including patient outcomes that occur after a patient has stopped the treatment, for example, or show poor compliance with treatment, would be expected to bias the analysis toward the null (no treatment difference). Intent-to-treat )ITT) analyses in superiority trials are nonetheless preferred because they protect against the kinds of bias that might be associated with early departure from the study. In non-inferiority trials, many kinds of problems fatal to a superiority trial, such as non-adherence, misclassification of the primary endpoint, or measurement problems more generally (i.e., “noise”), or many dropouts who must be assessed as part of the treated group, can bias toward no treatment difference (success) and undermine the validity of the trial, creating apparent non-inferiority where it did not really exist. Although an “as-treated” analysis is therefore often suggested as the primary analysis for NI studies, there are also significant concerns with the possibility of informative censoring in an as-treated analysis. It is therefore important to conduct both ITT and as-treated analyses in NI studies. Differences in results using the two analyses will need close examination. The best advice for conducting an NI study is to be aware at the planning stage of these potential issues and to monitor the trial in a manner that minimizes these problems, as they can seriously affect the validity of an NI study. Other sources of bias that could occur in any study are also of concern in the NI study and are of particular concern in an open label study. For such open label NI studies, how best to ensure unbiased assessment of endpoints, unbiased decisions about inclusion of patients in the analysis, and a wide variety of other potential biases, need particular attention. G. Role of Adaptive Designs in NI Studies — Sample Size Re-estimation to Increase the Size of an NI Trial Because it may be difficult to adequately plan the sample size for any study, including an NI study, especially when assumptions like the event rate may change from the planning phase to the study conduct, adaptive study designs that can allow for the prospective re-estimation of a larger sample size can be considered. The most critical single consideration in such designs is precise knowledge about whether there is unblinding as to treatment. Sample size re-estimation, if based on a blinded analysis of the overall variance estimate or the overall event rate, without knowledge of or a comparison of the unblinded treatment group response rates or the differences between treatment groups, is not only acceptable but generally advisable. It is critical to provide reassurance and procedures that ensure maintenance of blinding. If an adaptive design that allows unblinding is contemplated, then the design features and procedures for protection of the integrity of the trial need to be clearly stated in the protocol 33 Contains Nonbinding Recommendations Draft – Not for Implementation 1399 1400 1401 1402 1403 1404 1405 1406 1407 1408 1409 1410 1411 1412 1413 1414 1415 1416 1417 1418 1419 1420 1421 1422 1423 1424 1425 1426 1427 1428 1429 1430 1431 1432 1433 1434 1435 1436 for the trial. Some adaptive designs may include an independent Data Monitoring Committee (DMC) to monitor the planned adaptation. The DMC charter should address procedures for the sharing and blinding of data, and the procedures used to maintain a firewall between those who do, and those who do not view unblinded data. Some of these issues will be addressed in a companion guidance on Adaptive Study Designs. H. Testing NI and Superiority in an NI Study In general, when there is only one endpoint and one dose of the test treatment, a planned NI study can be tested for superiority without a need for Type 1 error alpha correction. That is, the same 95% or higher confidence interval employed for testing non-inferiority with the pre specified fixed margin can be used to test superiority. One can also think of this as a two stage analysis in which the showing of NI using a 95% confidence interval (invariably successful if the test drug is actually superior), is then followed sequentially by superiority testing. This sequential testing has the Type I error rates for both non-inferiority and superiority controlled at a level of no more than 5%. A non-inferiority showing after a failed superiority study, in contrast, gives a generally uncertain result, and such a study would generally be considered a failed study. Thus, successful showing of non-inferiority allows superiority testing but a failed showing of superiority would yield credible evidence of non inferiority only if the study were designed as a non-inferiority study (e.g., the NI margin must be pre-specified, and assay sensitivity and HESDE must be established). When there are multiple endpoints or multiple doses of the test treatment evaluated in an NI study, the valid statistical decision tree can be very complex. Using the same 95% confidence interval to test non-inferiority and superiority at each endpoint level or at each dose may inflate the overall Type I error rate associated with drawing one or more false conclusions from such multiple comparisons, regardless of whether they are non-inferiority or superiority testing. Thus, for any statistical decision tree composed of tests of superiority and non-inferiority in multiple comparison settings, it is imperative to evaluate the overall Type I error rate for all the comparisons involved in the testing and make appropriate statistical adjustments. Some of the problems in interpreting the results of non-inferiority analyses are more subtle than those with superiority testing. In particular, as noted previously, design or conduct problems such as medication non-compliance or misclassification/measurement error, errors that would be fatal to success in a superiority study, can lead to apparently favorable (results) in a non-inferiority study. 34 Contains Nonbinding Recommendations Draft – Not for Implementation 1437 1438 1439 1440 1441 1442 1443 1444 1445 1446 1447 1448 1449 1450 1451 1452 1453 1454 1455 1456 1457 1458 1459 1460 1461 1462 1463 1464 1465 1466 1467 1468 1469 1470 1471 1472 1473 1474 1475 1476 1477 1478 1479 1480 1481 V. COMMONLY ASKED QUESTIONS AND GENERAL GUIDANCE 1. Can a margin be defined when there are no placebo-controlled trials for the active control for the disease being assessed? If the active control has shown superiority to other active treatments in the past, the difference demonstrated represents a conservative estimate of HESDE, one that can certainly serve as a basis for choosing M1. It may also be possible that trials of the active control in related diseases are relevant. The more difficult question is whether historical experience from nonconcurrently controlled trials can be used to define the NI margin. The answer is that it can, but the circumstances are similar to those in which a historically controlled trial can be persuasive (see ICH E-10). First, there should be a good estimate of the historical spontaneous cure rate or outcome without treatment. Examination of medical literature and other sources of information may provide data upon which to base these estimates (e.g., historical information on natural history or the results of ineffective therapy). Second, the cure rate of the active control should be estimated from historical experience, preferably from multiple experiences in various settings, and should be substantially different from the untreated rate. For example, if the spontaneous cure rate of a disease is 10-20% and the cure rate with an active control is 70-80%, these are substantially different and an acceptable margin, generally chosen conservatively, can probably be identified for M1. The clinically acceptable loss of this effect can then be determined for M2. Estimates of the cure rate of the active control should be based upon data from clinical trials, even if these are not controlled, and it is critical to be sure the trial patients and untreated patients are similarly defined and selected. Example 2 in the Appendix illustrates a case of this kind, in which it was concluded that a margin could be defined despite the absence of placebo-controlled trials of the active control. It becomes more difficult to identify a margin when the difference between the spontaneous cure rate and active drug cure rate is smaller. For example, if the historical spontaneous cure rate is 40% and the active control rate is 55%, it would not be credible to identify the NI margin in this case as 15%, as such a small difference could easily be the result of different disease definition or ancillary therapy. When the historical cure rates for the active control and the cure rate in patients who receive no treatment are not known at all from actual studies (i.e., are just based on clinical impressions), it will be difficult or impossible to define an NI margin. 2. Can the margin M2 be flexible? As indicated in sections III and IV, there is a critical difference between demonstrating in the NI study that the margins M1 and M2 have been met. M1 is used to determine whether the NI study shows that the test drug has any effect at all. Accepting a result in which the 95% CI did not rule out loss of M1 would be similar to accepting, as showing effectiveness, a superiority study whose estimated treatment effect was not significant at p ≤ 0.05. M2, in contrast, represents a clinical judgment about what level of loss of the active control effect is acceptable. A typical value for M2 is often 50% of M1, at least 35 Contains Nonbinding Recommendations Draft – Not for Implementation 1482 1483 1484 1485 1486 1487 1488 1489 1490 1491 1492 1493 1494 1495 1496 1497 1498 1499 1500 1501 1502 1503 1504 1505 1506 1507 1508 1509 1510 1511 1512 1513 1514 1515 1516 1517 1518 1519 1520 1521 1522 1523 1524 1525 1526 partly because the sample sizes needed to rule out a smaller loss become impractically large. In this case, there is a better argument for some degree of flexibility if the study did not quite rule out the M2 margin; there might be reason to consider, for example, assurance of 48% retention (but not the expected 50%) for M2 as acceptable. We have also concluded that the fixed margin method, more conservative but with fewer assumptions, should generally be used in ensuring that loss of M1 is ruled out but that the synthesis method can be used to assess M2. Of course, allowing too much inferiority of the test drug to the standard, especially for endpoints of mortality and serious morbidity, would clearly not be acceptable. 3. Can prior information or other data (e.g., studies of related drugs, pharmacologic effects) be considered statistically in choosing the NI margins or in deciding whether the NI study has demonstrated its objective? Prior information could be characterized in a statistical model or in a Bayesian framework by taking into account such factors as evidence of effects in multiple related indications or on many endpoints. Such information might be used in determining M1 in a more flexible (less conservative) manner. For example, if multiple studies provide very homogeneous results for one or more important endpoints it may be possible to use the 90% lower bound rather than the 95% lower bound of the CI to determine the active control effect size. Similarly, if there were additional supporting evidence for the clinical effect of the test drug, such as prior information on the efficacy of the test drug in related diseases or in a compelling animal model, or an effect on an important biomarker (e.g., tumor response rate), or evidence that pharmacologically related drugs were clearly effective in the condition being studied, such prior information would increase the evidence for the plausibility of the intended NI effect of the test drug, which might allow use of a less conservative estimate of effect than the 95% lower bound of the confidence interval for C-T in the NI study. Finally, a statistical model such as a regression adjustment may be applied to the NI study analysis if the covariates for patients in the historical clinical studies are distributed differently from those of patients in the current NI study. This adjustment may, in some situations, reduce the variance of the NI test and increase the ability of the comparison to meet the NI margin. In other situations, where there is more heterogeneity of the covariates, the variance may be increased, adversely impacting the comparison. 4. Can a drug product be used as the active comparator in a study designed to show non-inferiority if its labeling does not have the indication for the disease being studied, and could published reports in the literature be used to support a treatment effect of the active control? The active control does not have to be labeled for the indication being studied in the NI study, as long as there are adequate data to support the chosen NI margin. FDA does, in some cases, rely on published literature and has done so in carrying out the meta-analyses of the active control used to define NI margins. An FDA guidance for industry on Providing Clinical Evidence of Effectiveness for Human Drug and Biological Products 36 Contains Nonbinding Recommendations Draft – Not for Implementation 1527 1528 1529 1530 1531 1532 1533 1534 1535 1536 1537 1538 1539 1540 1541 1542 1543 1544 1545 1546 1547 1548 1549 1550 1551 1552 1553 1554 1555 1556 1557 1558 1559 1560 1561 1562 1563 1564 1565 1566 1567 1568 1569 1570 1571 describes the approach to considering the use of literature in providing evidence of effectiveness, and similar considerations would apply here. Among these considerations are the quality of the publications (the level of detail provided), the difficulty of assessing the endpoints used, changes in practice between the present and the time of the studies, whether FDA has reviewed some or all of the studies, and whether FDA and the sponsor have access to the original data. As noted above, the endpoint for the NI study could be different (e.g., death, heart attack, and stroke) from the primary endpoint (cardiovascular death) in the studies if the alternative endpoint is well assessed (see also question 6). 5. If the active control drug is approved for the indication that is being studied, does the margin need to be justified, or if the active control drug has been used as an active comparator in the past in another study of design similar to the current study and a margin has been justified previously, can one simply refer to the previous margin used? When an active control drug is approved, the effect size for the indication is not usually identified in a pooled analysis, nor is the variability of that effect size in the various trials calculated. It would therefore be difficult to base the NI margin on the label of the active control drug. On the other hand, FDA’s reliance on the studies for approval would support the view that the quality of the studies was acceptable and that the studies could contribute to a determination of the NI margin. In general, approval of a drug is based on showing superiority to placebo, usually in at least two studies, but FDA may not have critically assessed effect size and may not have closely analyzed “failed” studies. In general, FDA will usually not have carried out a meta-analysis of the trials. It is therefore essential to use the data from all available controlled trials (unless a trial has a significant defect), including trials conducted after marketing, to calculate a reasonable estimate of the actual control effect size, as described above. If the active-control data have been used to define a NI margin for another study, it is important to determine that the previous conclusion is applicable to the new study, but in general such prior use should indicate that FDA has assessed the NI margin for a NI study with similar endpoints and population. 6. What are the choices of endpoints to be aware of before designing a non-inferiority trial design? The endpoints chosen for clinical trials (superiority or NI) reflect the event rate in the population, the importance of the event, and practical considerations, notably whether the event rates will allow a study of reasonable size. In NI studies, the endpoint must be one for which there is a good basis for knowing the effect of the active control. The endpoint used need not necessarily be the endpoint used in the historical trials or the effectiveness endpoint claimed in labeling. Past trials, for example, with mortality endpoints could, if data were available, be the basis for estimating an effect on a composite endpoint (cardiovascular mortality, myocardial infarction, and stroke), if that were the desired endpoint for the NI study. Such a change might be sought because it would permit a smaller study or was more feasible given current event rates. 37 Contains Nonbinding Recommendations Draft – Not for Implementation 1572 1573 1574 1575 1576 1577 1578 1579 1580 1581 1582 1583 1584 1585 1586 1587 1588 1589 1590 1591 1592 1593 1594 1595 1596 1597 1598 1599 1600 1601 1602 1603 1604 1605 1606 1607 1608 1609 1610 1611 1612 1613 1614 1615 1616 7. Are there circumstances where it may not be feasible to perform an NI study? Unfortunately, these are many, including some where a placebo-controlled study would not be considered ethical. Some examples include the following: • • • • The treatment effect may be so small that the sample size required to do a non inferiority study may not be feasible. There is large study-to-study variability in the treatment effect. In this case, the treatment effect may not be sufficiently reproducible to allow for the determination of a sufficiently reliable estimate of M1. There is no historical evidence to determine a non-inferiority margin. Medical practice has changed so much (e.g., the active control is always used with additional drugs) that the effect of the active control in the historical studies is not clearly relevant to the current study. 8. In a situation where a placebo-controlled trial would be considered unethical, but a non-inferiority study cannot be performed, what are the options? In that case it may be possible to design a superiority study that would be considered ethical. These possibilities are discussed in section III of this guidance and ICH E-10, and include the following: • • • • • When the new drug and established treatment are pharmacologically distinct, an add on study where the test drug and placebo are each added to the established treatment. A study in patients who do not respond to the established therapy. It may be possible to do a placebo-controlled trial in those patients. To establish specific effectiveness in non-responders, the study should randomize to test drug and the failed therapy and show superiority of the test drug. A study in patients who cannot tolerate the established effective therapy. A study of a population in which the effect of available therapy is not established. For a drug with dose-related side effects, and where a dose lower than the usual dose would be considered ethical, a dose-response study may be possible. 9. When will a single NI study be sufficient to support effectiveness? Several sections above touch on this question, notably III.B.2, which discusses it in detail. Briefly, reliance on a single study in the NI setting is based on considerations similar to reliance on a single study in the superiority setting, with the additional consideration of the stringency of showing NI using the M2 NI margin. Many of these factors are described in the guidance for industry on Providing Clinical Evidence of Effectiveness for Human Drugs and Biological Products, and include prior supportive information, such as results with pharmacologically similar agents (a very common consideration, as the NI study will often compare drugs of the same pharmacologic class), support from credible biomarker information (tumor responses, ACE inhibition, 38 Contains Nonbinding Recommendations Draft – Not for Implementation 1617 1618 1619 1620 1621 1622 1623 beta blockade), and a statistically persuasive result. With respect to the latter, it is noted above that a finding of NI based on excluding a treatment difference > M2 provides very strong evidence (generally equivalent to a p < 0.001 in a superiority setting) that the test treatment has an effect > 0. For all these reasons, most NI studies with outcome endpoints, if clearly successful, will be supportive as single studies. Of course, the importance of the study endpoint will influence the level of assurance needed, in a single study or multiple studies, that no more than M2 has been lost. 39 Contains Nonbinding Recommendations Draft – Not for Implementation 1624 1625 1626 1627 1628 1629 1630 1631 1632 1633 1634 1635 1636 1637 1638 1639 1640 1641 1642 1643 1644 1645 1646 1647 1648 1649 1650 1651 1652 1653 1654 1655 1656 1657 1658 1659 1660 1661 1662 1663 1664 1665 1666 1667 1668 APPENDIX — EXAMPLES The following five examples derived from publicly available information (see references following examples) illustrate different aspects of the process of choosing a NI margin, of the application of a method of NI analysis, and other considerations relevant to whether it is possible to conduct and interpret the results of a NI study Example 1(A): Determination of an NI Margin for a New Anticoagulant — Fixed Margin Approach This example will demonstrate the following points: • The determination of the NI margin (M1) using the fixed margin approach • How to select and assess the randomized trials of the active control on which to base the estimate of active comparator treatment effect. • How to assess whether the assumption of assay sensitivity is appropriate, and whether the constancy assumption is reasonable for this drug class. • Why it is appropriate to use a conservative choice (e.g., 95% lower bound) for estimating the treatment effect size of the active comparator, accounting for between study variability, and considering other uncertainties in the randomized trial data. • The use of the lower bound of the 95% confidence interval in the NI study for C-T to demonstrate non-inferiority. SPORTIF V is an NI study that tested the novel anticoagulant ximelagatran against the active control warfarin. Warfarin is a highly effective, orally active anticoagulant that is approved in the United States for the treatment of patients with non-valvular atrial fibrillation at risk of thromboembolic complications (e.g., stroke, TIA, etc.). There are six placebo-controlled studies of warfarin involving the treatment of patients with non-valvular atrial fibrillation, all published between the years 1989 and 1993. The primary results of these studies are summarized in Table 1 and provide the basis for choosing the NI margin for SPORTIF V. The point estimate of the event rate on warfarin compared to placebo is favorable to warfarin in each of the 6 studies. The upper bound of the 95% confidence interval of the risk ratio calculated in each study is less than one in five of the six studies, indicating a statistically demonstrated treatment effect in each of these studies. The one exception is the CAFA study. However, this study was reportedly stopped early because of favorable results published from the AFASAK and SPAF I studies (Connolly et al. 1991). Although the CAFA study was stopped early, a step that can sometimes lead to an overestimate of effect, the data from this study appear relevant in characterizing the overall evidence of effectiveness of warfarin because there is no reason to think it was stopped for early success, introducing a possible favorable bias. These placebo controlled studies of warfarin in 40 Contains Nonbinding Recommendations Draft – Not for Implementation 1669 1670 1671 1672 1673 1674 patients with non-valvular atrial fibrillation show a fairly consistent and reproducible effect. Based on the consistent results from the six studies, it can reasonably be assumed that were placebo to be included in a warfarin-controlled NI study involving a novel anticoagulant, warfarin would have been superior to placebo. Table 1: Placebo-Controlled Trials of Warfarin in Non-Valvular Atrial Fibrillation Study Summary Events/Patient Years Risk Ratio (95% CI) Warfarin Placebo AFASAK open label. 1.2 yr follow-up 9/413 = 2.18% 21/398 = 5.28% 0.41 (0.19, 0.89) BAATAF open label. 2.2 yr follow-up 3/487 = 0.62% 13/435 = 2.99% 0.21 (0.06, 0.72) EAFT open label. 2.3 yr follow-up patients with recent TIA 21/507 = 4.14% 54/405 = 13.3% 0.31 (0.19, 0.51) CAFA* double blind. 1.3 yr follow-up 7/237 = 2.95% 11/241 = 4.56% 0.65 (0.26, 1.64) SPAF I open label. 1.3 yr follow-up 8/260 = 3.08% 20/244 = 8.20% 0.38 (0.17, 0.84) SPINAF double blind. 1.7 yr follow-up 9/489 = 1.84% 24/483 = 4.97% 0.37 (0.17, 0.79) 1675 * CAFA was stopped early because of favorable results observed in other studies. 1676 1677 1678 1679 1680 1681 1682 1683 1684 As can be seen from the summary table, most of these studies were open label. It is not clear how great a concern this should be given the reasonably objective endpoints in the study (see Table 2), but to the extent there is judgment involved, there is some possible bias. The event rate on placebo in the EAFT study was strikingly high, perhaps because the patient population in that study was different from the patient population studied in the remaining five studies in that only patients with a recent TIA or stroke were enrolled in EAFT. That would clearly increase the event rate, but in fact the risk reduction in EAFT was very similar to the four trials other than CAFA, which is relatively reassuring with respect to constancy of risk reduction in various AF populations. 1685 1686 1687 1688 1689 1690 1691 1692 1693 1694 1695 1696 1697 1698 1699 1700 1701 Even if the historical studies are consistent, a critical consideration in deciding upon the NI margin derived from these studies is whether the constancy assumption is reasonable. The constancy assumption must consider whether the magnitude of effect of warfarin relative to placebo in the previous studies would be present in the new NI study, or whether changes in medical practice (e.g., concomitant medications, skill at reaching desired INR), or changes in the population being tested may make the effect of warfarin estimated from the previous studies not relevant to the current NI study. To evaluate the plausibility of this constancy assumption, one might compare some features of the six placebo-controlled warfarin studies with the NI study, SPORTIF V. There is considerable heterogeneity in the demographic characteristics of these studies. While some study subject characteristics can be compared across the studies (e.g., age, race, and target INR) certain characteristics cannot be compared (e.g., concomitant medication use, race, mean blood pressure at baseline) if they are not consistently reported in the study publications. Whether these are critical to outcomes is, of course, the critical question. Table 2 indicates that for some characteristics, such as a history of stroke or TIA, there are inter-study differences. One of the important inclusion criteria in the EAFT study was that 41 Contains Nonbinding Recommendations Draft – Not for Implementation 1702 1703 1704 1705 1706 1707 1708 1709 1710 1711 1712 1713 1714 1715 1716 1717 1718 1719 1720 1721 1722 1723 1724 1725 1726 1727 subjects had a prior history of stroke or TIA. None of the other studies had such a requirement. Subjects enrolled into the EAFT study were thus at higher risk than subjects in the other studies, presumably leading to the higher event rates in both the warfarin and placebo arms, shown in Table 1. The higher event rates in the EAFT study may also have been influenced by the relatively long duration of follow-up or the fact that the primary endpoint definition was broader, including vascular deaths and non-fatal myocardial infarctions, which might have been less affected by coumadin, leading to a lower risk reduction. This was not in fact seen. All in all, the results are quite consistent (with the exception of CAFA), a relatively reassuring outcome. Table 2: Demographic Variables, Clinical Characteristics, and Endpoints of Warfarin AF Studies AFASAK BAATAF CAFA SPAF VA EAFT SPORTIF V Age years 73 69 68 65 67 71 72 (mean) Sex (%) Male 53% 75% 76% 74% 100% 59% 70% h/o stroke or 6% 3% 3% 8% 0% 100% 18.3% TIA (%) h/o HTN (%) 32% 51% 43% 49% 55% 43% 81% >65 years old 8% 10-16% 12-15% 7% 17% 7% 41% & CAD (%)* >65 years old 7-10% 14–16% 10-14% 13% 17% 12% 19% & DM (%)* h/o LV 50% 24-28% 20-23% 9% 31% 8% 39% dysfunction (%)* Mean BP at NA NA NA 130/78 NA 145/84 133/77 BL (mm Hg) Target INR 2.8-4.2 1.5-2.7 2-3 2-4.5 1.4-2.8 2.5-4.0 2-3 Primary Stroke, Ischemic Ischemic Ischemic Ischemic Vascular Stroke (ischemic + endpoint TIA, stroke stroke and stroke and stroke death, NF hemorrhagic) and systemic systemic systemic MI, stroke, systemic embolism embolism embolism embolism systemic embolism * = Not possible to verify whether definitions of CAD, DM, and LV dysfunction were the same in comparing the historic studies and SPORTIF V. NA = Not available At the time the SPORTIF V study was reviewed, concerns about whether the constancy assumption held and other factors led to the consideration of whether discounting of the effect size would be appropriate (see discussion of discounting in section IV of this guidance). We now believe the historic results are reasonably likely to be consistent with results that would be seen today so that discounting was not necessary. To calculate M1, the relative risks in each of the six studies were combined using a random effects model to give a point estimate of 0.361 for the relative risk with a confidence interval of (0.248, 0.527). The 95% CI upper bound of 0.527 represents a 47% risk reduction, which translates into a risk increase of about 90% from not being on warfarin (1/0.527 = 1.898) (i.e., what would be seen if the test drug had no effect). Thus, M1 (in terms of the hazard ratio favoring the control to be ruled out) is 1.898. 42 Contains Nonbinding Recommendations Draft – Not for Implementation 1728 1729 1730 1731 1732 1733 1734 1735 1736 1737 1738 1739 1740 1741 1742 1743 1744 1745 It was considered clinically necessary to show that the test drug preserved a substantial fraction of the warfarin effect. The clinical margin M2 representing the largest acceptable inferiority of the test to control, was therefore set at 50% of M1. As described in section IV of the guidance, we calculate M2, using the log hazard risk ratios, as 1.378, 95% CI for C-T < 1.378. In the SPORTIF V study, the point estimate of the relative risk was 1.39 and the two-sided 95% confidence interval for the relative risk was (0.91, 2.12). Thus, in this example, the non-inferiority of ximelegatran to warfarin is not demonstrated because the upper limit (2.12) is greater than M2 (=1.378). Indeed, it does not even demonstrate that M1 (=1.898) has been excluded. This example illustrates the fixed margin approach and what is often called the “two 95% confidence interval approach.” That is, a two-sided 95% confidence interval is used for the historical data to select M1, and a two-sided 95% confidence interval is used to test whether M2 has been ruled out, similar to controlling the Type 1 error of the NI study at one-sided 2.5%. 43 Contains Nonbinding Recommendations Draft – Not for Implementation 1746 1747 1748 1749 1750 1751 1752 1753 1754 1755 1756 1757 1758 1759 1760 1761 1762 1763 1764 1765 1766 1767 1768 1769 1770 1771 1772 1773 1774 1775 1776 1777 1778 1779 1780 1781 1782 1783 1784 1785 1786 1787 1788 Example 1(B): Application of the Synthesis Method to the Above Example 1(A) This example demonstrates the following: • The critical features of the synthesis approach to demonstrating the NI of a new anticoagulant. • The calculations and sources of statistical variability that are incorporated in the synthesis approach. • The main differences in interpretation of the fixed margin and the synthesis approaches when applied to the same set of studies and data. In this example, we illustrate the synthesis method using the same data as Example 1(A), which consist of six studies comparing warfarin to placebo and one NI study comparing ximelegatran to warfarin. In contrast to the fixed margin method in Example 1(A), the synthesis method does not use a separate 95% confidence interval for this historical estimate of the effect of warfarin versus placebo and for the comparison in the NI study. Rather, the synthesis method is constructed to address the questions of whether ximelegatran preserves a specified percent, in this case 50% or one-half (versus placebo), of the effect of warfarin, and whether ximelegatran would be superior to a placebo, if one had been included as a randomized treatment group in the NI study. To accomplish this goal, the synthesis method makes a comparison of the effect of ximelegatran in the NI study to historical placebo data, an indirect comparison that is not based upon a randomized current placebo group. The synthesis method combines the data from the placebo-controlled studies of warfarin with the data from the NI study in such a way that a test of hypothesis is made to demonstrate that a certain percent of the effect of warfarin is retained in the NI study. A critical point distinguishing the synthesis method from the fixed margin method is that the M1 effect size of warfarin is not specified in advance and is not required to be fixed prior to carrying out the synthesis method. But to carry out the analysis, an assumption needs to be made regarding the placebo comparison, namely, that the difference between control drug and placebo (had there been one) in the NI trial is the same as what was seen in the historical placebo controlled trials of warfarin. The assumption is needed because there is no randomized comparison of warfarin and placebo in the NI trial. As a point of reference, we know from the previous example, 1(A), that the warfarin effect M1 was estimated from the historical placebo studies to be a 47% risk reduction. In this case, the synthesis method statistically tests the null hypothesis that the inferiority of ximelegatran compared to warfarin is less than 50% or one half of the risk reduction of warfarin compared to placebo, a question that the fixed margin method does not directly address because in the fixed margin method, the placebo is only present in the historical studies and not in the NI study. We carry out this test on the log relative risk scale, so that the null hypothesis can be written as: 44 Contains Nonbinding Recommendations Draft – Not for Implementation 1789 1790 1791 1792 1793 1794 1795 1796 1797 1798 1799 1800 1801 1802 1803 1804 1805 1806 1807 1808 1809 1810 1811 1812 1813 1814 1815 1816 1817 1818 1819 1820 H0: {log-Relative Risk of ximelegatran versus warfarin} ≥ − ½ {log-Mean Relative Risk of warfarin versus placebo} A test of this hypothesis is performed by the expression below (the statistical test) that has the form of a quotient where the numerator is an estimate of the parameter defined in the null hypothesis by {log-Relative Risk of ximelegatran versus warfarin} + ½ {log-Mean Relative Risk of warfarin versus placebo} and the denominator is an estimate of the standard error of the numerator. In this case, the estimated log-Relative Risk of ximelegatran versus warfarin is 0.329 (log of 1.39) with a standard error of 0.216 while the estimated log-Relative Risk of warfarin versus placebo is -1.02 (log of .527) with a standard error of 0.154. The estimate of the log warfarin effect is -1.02, and the standard error of this estimate is 0.154; these estimates are combined with the NI data as if all the data were in a randomized comparison with placebo. The synthesis test statistic is calculated as: {−1.02} 2 = −0.789 2 2 1 {0.154} 0.216 + 2 0.329 + 1 { } Assuming the statistic is normally distributed, it is then compared to -1.96 (for one-sided Type 1 error rate of 0.025). For this case, the value, -0.789, is not less (more negative) than 1.96, so we cannot reject the null hypothesis. Therefore, it cannot be concluded that an NI margin of 50% retention is satisfied. To compare the fixed margin method with the synthesis method, recall that the fixed margin compares the upper or lower limits of two 95% confidence intervals, one for the NI study and one for the meta-analysis of the effect of warfarin. One might consider the fixed margin approach as conservative, as it compares to statistically “worst cases.” The synthesis method does not use two such worst cases. To provide a more detailed comparison of the approaches, the fixed margin approach can be expressed as using a test statistic similar to that of the synthesis approach. The synthesis method concludes non-inferiority if {−1.02} 2 < −1.96 2 2 0.216 + 1 {0.154} 2 0.329 + 1 { } 1821 45 Contains Nonbinding Recommendations Draft – Not for Implementation 1822 1823 1824 1825 1826 1827 1828 1829 1830 1831 1832 1833 1834 1835 1836 1837 1838 1839 1840 1841 1842 1843 1844 1845 1846 1847 1848 1849 1850 1851 1852 1853 1854 1855 1856 1857 1858 1859 1860 1861 1862 1863 1864 The fixed margin method concludes non-inferiority if {−1.02} 2 < −1.96 0.216 + 1 {0.154} 2 0.329 + 1 The critical difference between these two procedures is the form of the denominator, which expresses the standard errors of the expressions in the numerator. The synthesis standard error is always smaller than that of the fixed margin method when expressed in this manner. In most situations, the synthesis is therefore statistically more efficient (and would require a smaller sample size) than the fixed margin approach. Of course, the approach can be considered useful and valid only if the assumptions of the synthesis method can be considered satisfied. This is not always possible, generally because of concerns about constancy, that is, whether the historical differences from placebo would accurately describe the current differences from placebo. The two procedures also cannot be directly compared because they have other differences that make their comparison problematic, notably the differences in how the statistical error rates, or Type 1 errors, are calculated and interpreted. The synthesis method, because of the way it makes the comparisons with a placebo, gives equal weight to the variance (or variability of the outcome data) in this historical estimate and the variance of the data obtained from the randomized comparison of the test drug and active comparator in the NI study. When the historical database is very large relative to the NI database, combining the historical data and NI together may suggest greater precision in the overall assessment of the NI study than is warranted given the fact that the placebo comparisons were from studies conducted in a different population, usually at a different time. In contrast, the fixed margin method controls a Type 1 error rate within the NI study that is conditioned on the pre specified fixed NI margin, separately estimated from the historical active comparator data. The synthesis test method also does not estimate a fixed NI margin to be excluded (i.e., one depending only on the prior placebo-controlled data for the active comparator). A general principle expressed in this guidance is the need to be conservative in the selection of the margin M1 because that margin is critical to establishing that a test drug is effective in an NI study design. The M1 margin is usually chosen conservatively because of the uncertainties associated with the validity of assumptions in an NI study and the reliance on historical active control comparisons. As noted, the fixed margin approach can be considered conservative in that several worst case situations (lower bounds of 95% confidence intervals) are used, one evaluating the historical evidence and another in the NI comparison. We recommend use of this conservative fixed margin approach to selecting the M1 margin and to demonstrating in the NI study that the M1 margin is excluded at the acceptable Type 1 error. The synthesis method, on the other hand, as described above, is less conservative. But this is reasonable, given that M2 is considerably smaller (a more demanding margin) and that the presence of a control drug effect has been well established by ruling out loss of M1 using the fixed margin approach. We therefore believe the NI study 46 Contains Nonbinding Recommendations Draft – Not for Implementation 1865 1866 1867 should utilize a fixed margin approach to ruling out loss of M1 but can use the synthesis method to establish that loss of effect greater than the clinically relevant margin M2 has been ruled out. 47 Contains Nonbinding Recommendations Draft – Not for Implementation 1868 1869 1870 1871 1872 1873 1874 1875 1876 1877 1878 1879 1880 1881 1882 1883 1884 1885 1886 1887 1888 1889 1890 1891 1892 1893 1894 1895 1896 1897 1898 1899 1900 1901 1902 1903 1904 1905 1906 1907 1908 1909 1910 1911 1912 Example 2: The Determination of a Non-Inferiority Margin for Complicated Urinary Tract Infection (cUTI) — Fixed Margin Approach This example will illustrate the following points: • • • • • The use of the absolute difference in cure rates as the metric of treatment effect. The determination of a non-inferiority margin when there are no randomized active comparator placebo-controlled studies available for the indication of interest (in this case, cUTI). Estimating the placebo response rate in cUTI based upon data from uncomplicated urinary tract infections (a generally less severe form of urinary tract infection leading to a high, therefore conservative, estimate). The importance of seeking out all relevant studies for the margin determination and incorporating the limitations of the studies, the analyses, and the resulting estimates in the consideration of the resulting estimate of the non-inferiority margin. This approach (i.e., relying on data other than controlled trials of the active control) is credible only when the effect size is large, given its limitations. The following steps were used to estimate the effectiveness of the active control. 1. Evaluation of the placebo response rate in uncomplicated urinary tract infection (uUTI) 2. Evaluation of outcomes in patients receiving inadequate or inappropriate therapy for complicated urinary tract infection (cUTI)/acute pyelonephritis (AP) 3. Evaluation of the active comparator's response rate (levofloxacin, in this case) for cUTI. Step 1: Placebo Response Rate for Uncomplicated Urinary Tract Infection (uUTI) Although there were no placebo-controlled complicated UTI studies available, three placebo controlled studies in women with uncomplicated UTI were identified. Among these three studies there were differences in the duration of study drug, endpoints assessed, and the diagnostic criteria for significant bacteriuria. There were no placebo-controlled trials identified in men with UTI without significant co-morbid conditions, and the pathophysiology and natural history of UTI are different in men and women. It would be expected that placebo response rates would therefore be high in such studies compared to the untreated rate in cUTI and represent a conservative (high) estimate of the spontaneous cure rate in cUTI. Microbiological eradication rate is generally used as the primary endpoint for UTI studies. In the three placebo-controlled studies identified for UTI, the bacteriological response rates were 95/227(42%) for the combined 8-10 and 35-49 days (Ferry et al.), 9/27(33%) at day 3 (Christiaens et al.), and 8/18(44%) in 1 week (Dubi et al.). The bacteriologic criteria for entry used in the Ferry study were ≥103 CFU/ml for primary pathogens, whereas ≥104 CFU/ml was used for the Christiaens study. Because a count of ≥105 CFU/ml is more 48 Contains Nonbinding Recommendations Draft – Not for Implementation 1913 1914 1915 1916 1917 1918 1919 1920 1921 1922 1923 1924 1925 1926 1927 1928 1929 1930 1931 1932 1933 1934 typically used as diagnostic criteria for a uropathogen, the studies could overestimate the placebo response rates by including patients whose colony counts would not cause them to be considered infected. The results are summarized in the following table. Table 3: Historical Placebo Data from Published uUTI Studies Author Type of UTI Placebo Ferry et al. uUTI 95/227 (42%) Christiaens et al. Acute uUTI 9/27 (33%) Dubi et al. uUTI 8/18 (44%) 1 Exact Confidence Intervals 95% CI1 (35.4 %, 48.6%) (16.5%, 54.0%) (21.5%, 69.2%) Because of the unequal study population sizes, a weighted analysis is needed. The weighted non-iterative method for random effects model using logit of the event rates described by DerSimonian and Laird was used to obtain the estimate and its 95% CI; the weighted estimate is 41.2% with 95% CI of (35.5%, 47.2%). Step 2: Outcomes Subsequent to Inadequate or Inappropriate Antibacterial Therapy for Complicated Urinary Tract Infection (cUTI)/AP Three studies were identified in which some patients were treated with an antimicrobial drug to which the bacteria causing their UTI were resistant (inadequate therapy). Eradication rates for pathogens resistant to the antimicrobial drug may be considered as another way to estimate the placebo effect in cUTI/AP. It should be noted, however, that the use of data from inadequate therapy may result in an estimate that is higher than a true placebo, once again a conservative estimate of effect, because even “inadequate” therapy may have some effect on the patient’s infection. Table 4: Eradication Rates in Patients Receiving Inadequate Therapy Author Type of UTI Eradication Rates 95% CI1 1935 1936 1937 1938 1939 1940 1941 1942 1943 1944 1945 1946 Allais et al. cUTI/AP Fang et al. cUTI/AP Talan et al. AP 1 Exact Confidence Intervals 12/23 (52.2%) 4/28 (14.3%) 7/14 (50.0%) (30.6%, 73.2%) (4.0%, 32.7%) (23.0%, 77.0%) The data from the historical studies in Table 4 were combined to obtain a weighted estimate of the inadequate therapy eradication rate and its corresponding two-sided 95% CI. The weighted estimate using the DerSimonian and Laird approach (random effect model) is 36.8% with 95% CI of (15.4%, 64.9%). Step 3: Active Comparator's Eradication Rate for Complicated UTI (cUTI) To assess the eradication rates for the active comparator, levofloxacin, four cUTI studies were considered, including two published studies and two studies submitted to the Agency (Study A and Study B) that involved men and women ≥18 years old. The two studies from 49 Contains Nonbinding Recommendations Draft – Not for Implementation 1947 1948 1949 1950 1951 1952 1953 1954 1955 1956 1957 1958 1959 1960 1961 1962 1963 1964 1965 1966 1967 1968 1969 1970 1971 1972 1973 1974 1975 1976 1977 1978 1979 1980 1981 1982 the medical literature had limitations. In the Peng study, the microbiological eradication rate was evaluated on Day 5, while antibiotic therapy was still ongoing. This could have falsely elevated the response rate. The Klimberg study was an open-label study, and was excluded from the analysis because of concern about potential bias. The other two studies, Study A and Study B, were blinded controlled studies using levofloxacin for the treatment of cUTI. In Study A, the microbiological eradication rate for levofloxacin was 84.2% (154/183). In Study B, the microbiological eradication rate for levofloxacin was 78.2% (252/321). The levofloxacin eradication rates for the Peng study and Studies A and B are shown in Table 5. The weighted estimate of eradication rates using the DerSimonian and Laird approach is 81.6% with 95% CI of (75.8%, 86.3%). Table 5: Historical Levofloxacin Data from Published cUTI Studies Author Type of UTI Levofloxacin Microbiological 95% CI1 Eradication Rate Peng et al. cUTI 18/20 (90%) (68.3%, 98.8%) Study A cUTI and AP 154/183 (84.2%) (78.0%, 89.1%) Study B cUTI and AP 252/321 (78.2%) (73.6%, 82.9%) 1 Exact confidence intervals Step 4: Estimated Non-Inferiority Margin for Complicated UTI (cUTI) Using Levofloxacin as the Active Comparator The placebo eradication rate is estimated from the upper bound of the two-sided 95% CI for the placebo eradication rate in uUTI (47%) and this estimate is supported by evidence based on outcomes subsequent to inadequate or inappropriate therapy in cUTI (65%). The estimated levofloxacin cure rate for sensitive organisms is 76% (using the lower bound of the 95% CI for the weighted levofloxacin response rate). Using the placebo eradication rate for uUTI, the historical treatment effect can be calculated as 29% (=76%-47%). The treatment effect based on outcomes following inadequate antibacterial therapy can be calculated as 11% (=76%-65%), providing supportive evidence. Major Limitations in This Example: Apart from the lack of a direct comparison of active control and placebo in cUTI, there were various uncertainties in the historical estimates described above because of problems with data quality, study design, population size, prognostic factors, and differences in the timing of the microbiological endpoint assessments. On the other hand, the placebo eradication rate was estimated based on placebo-controlled clinical studies assessing the antibacterial treatment in a population (female subjects with uUTI) that would almost certainly give an overestimate of the spontaneous or placebo eradication rate in cUTI, leading to a conservative (low) estimate of the effect of the active control. 50 Contains Nonbinding Recommendations Draft – Not for Implementation 1983 1984 1985 1986 1987 1988 1989 1990 Discounting and Preservation of the Levofloxacin Treatment Effect: The various limitations and uncertainties in the historical data led to discounting of the calculated treatment effect of 29%. Thus, the active control treatment effect over placebo (M1) was estimated as 14.5% based on a 50% discounting. For a serious illness, a substantial portion (at least 50% or more) of M1 should be preserved. Accordingly, an NI margin of 7% was specified as M2 based on clinical judgment. 51 Contains Nonbinding Recommendations Draft – Not for Implementation 1991 1992 1993 1994 1995 1996 1997 1998 1999 2000 2001 2002 2003 2004 2005 2006 2007 2008 2009 2010 2011 2012 2013 2014 2015 2016 2017 2018 2019 2020 2021 2022 2023 2024 2025 2026 Example 3: Aspirin to Prevent Death or Death/MI After Myocardial Infarction This example demonstrates the following: • When it may not be possible to determine the NI margin because of the limitations of the data available. By 1993, the effect of aspirin in preventing death after myocardial infarction had been studied in six large randomized placebo-controlled clinical trials. A seventh trial, ISIS-2, gave the drug during the first day after the AMI and is not included because it addressed a different question. The results are summarized and presented in chronological order in Table 6. Table 6. Results of six placebo-controlled randomized studies (listed in chronological order) of the effect of aspirin in preventing death after myocardial infarction Study Year published MRC-1 CDP MRC-2 GASP PARIS AMIS 1974 1976 1979 1978 1980 1980 Aspirin N 615 758 832 317 810 2267 Death rate 8.0% 5.8% 12.2% 10.1% 10.5% 10.9% Placebo N 624 771 850 309 406 2257 Death rate 10.7% 8.3% 14.8% 12.3% 12.8% 9.7% Relative Risk (95% CI) 0.74 (0.52, 1.05) 0.70 (0.48, 1.01) 0.83 (0.65, 1.05) 0.82 (0.53, 1.28) 0.82 (0.59, 1.13) 1.12 (0.94, 1.33) The results suggest: (1) (2) The effect of aspirin on mortality as measured by the relative risk seems to attenuate over the time the studies were conducted. The largest trial, AMIS, showed a numerically adverse effect of aspirin. The relative risk in the AMIS study is significantly different from the mean relative risk in the remaining studies (p ≤ 0.005). The validity of pooling the results of AMIS with those of the remaining studies is therefore a concern. It would be invalid to exclude AMIS from the meta-analyses because its effect differed from the effect in the remaining studies, unless there were adequate clinical or scientific reasons for such exclusion. At a minimum, any meta analysis of all studies would need to reflect this heterogeneity by using a random-effect analysis. Although a fixed effect analysis of the six studies gives a point estimate of 0.91 (95% CI 0.82 to 1.02), the random-effects analysis gives a point estimate of 0.86 with 95% confidence interval (0.69, 1.08). The effect of aspirin on prevention of death after myocardial infarction in these historical studies is thus inconclusive (i.e., the upper bound of the 95% CI for effect is > 1.0). Therefore, it would be difficult, indeed not really possible, to select aspirin as the 52 Contains Nonbinding Recommendations Draft – Not for Implementation 2027 2028 2029 2030 2031 2032 2033 2034 2035 2036 active control for evaluating the mortality effect of a test drug in a non-inferiority trial. Apart from this calculation, it seems difficult to accept an NI endpoint that is not supported by the largest of the six trials. The same six studies can also be examined for the combined endpoint of death plus AMI in patients with recent AMI. This endpoint reflects the current physician-directed claim for aspirin based on the positive finding in two studies (MRC-2, PARIS). Table 7. Results of six placebo-controlled randomized studies of the effect of aspirin in secondary prevention of death or MI after myocardial infarction Study Year published Aspirin N 2037 2038 2039 2040 2041 2042 2043 2044 2045 MRC-1 CDP MRC-2 GASP PARIS AMIS 1974 1976 1979 1978 1980 1980 615 758 832 317 810 2267 Event rate 9.9% 9.5% 16.0% 13.6% 17.4% 18.6% Placebo N 624 771 850 309 406 2257 Event rate 13.1% 12.5% 22.2% 17.5% 22.7% 19.2% Relative Risk (95% CI) 0.75 (0.55, 1.03) 0.76 (0.57, 1.02) 0.72 (0.59, 0.88) 0.78 (0.54, 1.12) 0.77 (0.61, 0.97) 0.97 (0.86, 1.09) *the event rate of either group needs further verification from each article The results indicate that the effect of aspirin on death or MI after myocardial infarction is small to absent in the latest trial (AMIS). Random-effect analyses give, depending on the specific analysis, point estimates of the relative risk of 0.81-0.85, with 95% CI upper bounds of 0.96-1.02. The NI margin based on these six studies ranges from 4% to zero (without reducing it further to represent M2) is so small that a trial to rule out loss at this effect would be unrealistically large. Again, as with the mortality endpoint, it would be troubling even to consider an NI approach when the largest and most recent trial showed no significant effect. 53 Contains Nonbinding Recommendations Draft – Not for Implementation 2046 2047 2048 2049 2050 2051 2052 2053 2054 2055 2056 2057 2058 2059 2060 2061 2062 2063 2064 2065 2066 2067 2068 2069 2070 2071 2072 2073 2074 2075 2076 2077 2078 Example 4: Xeloda to Treat Metastatic Colorectal Cancer - the Synthesis Method This example of Xeloda for first-line treatment of metastatic colorectal cancer illustrates: • The use of the synthesis method to demonstrate a loss of no more than 50% of the historical control treatment’s effect and a relaxation of this criterion when two NI studies are available. • The use of supportive endpoints in the decision making process. • The use of a conservative estimate of the control treatment effect size, because a subset of the available studies to estimate the margin was selected and the effect was measured relative to a previous standard of care instead of placebo. The U.S. regulatory standard for first-line treatment of metastatic colorectal cancer, the use sought for Xeloda, is the demonstration of improvement in overall survival. Two separate clinical trials, each using an NI study design, compared Xeloda to a Mayo Clinic regimen of 5-fluorouracil with leucovorin (5-FU+LV), the standard of care at the time. Xeloda is an oral fluoropyrimidine, while 5-fluorouracil (5-FU) is an infusional fluoropyrimidine By itself, bolus 5-FU had not demonstrated a survival advantage in first-line metastatic colorectal cancer. But with the addition of leucovorin to bolus 5-FU, the combination had demonstrated improved survival. A systematic evaluation of approximately 30 studies that investigated the effect of adding leucovorin to a regimen of 5-FU identified ten clinical trials that compared a regimen of 5-FU+LV similar to the Mayo clinic regimen to 5-FU alone, thereby providing a measure of the effect of LV added to 5-FU, a conservative estimate of the overall effect of 5-FU+LV, as it is likely 5-FU has some effect. Table 8 summarizes the overall survival results, using the metric “log hazard ratio” for the ten studies identified that addressed the comparison of interest. Table 8: Selected studies comparing 5FU to 5-FU+LV Study Hazard Ratio1 Historical Study 1 1.35 Historical Study 2 1.26 Historical Study 3 0.78 Historical Study 4 1.15 Historical Study 5 1.39 Historical Study 6 1.35 Historical Study 7 1.38 Historical Study 8 1.34 Historical Study 9 1.03 Historical Study 10 1.95 1 All log hazard ratios are 5-FU/5-FU+LV Log Hazard Ratio1 .301 .235 -.253 .143 .329 .300 .324 .294 .0296 .670 54 Standard Error .232 .188 .171 .153 .185 .184 .166 .126 .165 .172 Contains Nonbinding Recommendations Draft – Not for Implementation 2079 2080 2081 2082 2083 2084 2085 2086 2087 2088 2089 2090 2091 2092 2093 2094 2095 2096 2097 2098 2099 2100 2101 2102 2103 2104 2105 2106 2107 2108 2109 A random effects model applied to the survival results of these ten studies yielded the historical estimate of the 5-FU versus 5-FU+LV survival comparison of log hazard ratio of 1.264 with a 95% confidence interval of (1.09, 1.46) and a log hazard ratio of 0.234. The NI margin is therefore 1.09 for a fixed margin approach ruling out M1. A summary of the survival results based on the intent-to-treat populations for each of the two Xeloda NI trials is presented in Table 9. Study 2 rules out M1 using a fixed margin approach, but Study 1 does not. Table 9: Summary of the survival results Study Hazard Ratio1 NI Study 1 NI Study 2 1.00 0.92 1 Log Hazard Ratio1 -0.0036 -0.0844 Standard 95% CI for the Error Hazard Ratio1 0.0868 0.0867 (0.84, 1.18) (0.78, 1.09) Hazard ratios and log hazard ratios are Xeloda/5-FU+LV The clinical choice of how much of the effect on survival of 5-FU+LV should be shown not to be lost by Xeloda was determined to be 50%. The synthesis approach was used to analyze whether the NI criteria of 50% loss was met. This synthesis approach to the non-inferiority test procedure for each study combines the results of each NI study with the results from the random effects meta-analysis into a normalized test statistic. Based on this NI synthesis test procedure, NI Study 1 failed to demonstrate that Xeloda retained at least 50% of the historical effect of 5-FU+LV versus 5-FU on overall survival, but NI study 2 did demonstrate such an effect. It was then decided to determine what percent retention might be satisfied by the data in a statistically persuasive way. By adapting the synthesis test procedure for retention of an arbitrary percent of the 5-FU+LV historical effect, it was determined that NI Study 1 demonstrated that Xeloda lost no more than 90% of the historical effect of 5-FU+LV on overall survival and that NI Study 2 demonstrated no more than a 39% loss of the historical effect. The evidence of effectiveness of Xeloda was supported by the observation that the tumor response rates were statistically significantly greater for the Xeloda arm and the fact that Xeloda and 5-FU were structurally and pharmacologically very similar. 55 Contains Nonbinding Recommendations Draft – Not for Implementation 2110 2111 2112 2113 2114 2115 2116 2117 2118 2119 2120 2121 2122 2123 2124 2125 2126 2127 2128 2129 2130 2131 2132 2133 2134 2135 2136 2137 2138 2139 2140 2141 2142 2143 2144 2145 2146 2147 2148 2149 2150 2151 2152 2153 2154 REFERENCES - EXAMPLES Example 1(A) The Boston Area Anticoagulation Trial for Atrial Fibrillation Investigators (1990). “The Effect of Low-Dose Warfarin on the Risk of Stroke in Patients with Nonrheumatic Atrial Fibrillation.” New Engl J Med 323, 1505-1511. Connolly, S.J., Laupacis, A., Gent, M., Roberts, R.S., Cairns, J.A., Joyner, C. (1991). “Canadian Atrial Fibrillation Anticoagulation (CAFA) Study.” J Am Coll Cardiol 18, 349 355. EAFT (European Atrial Fibrillation Trial) Study Group (1993). “Secondary Prevention in Non-Rheumatic Atrial Fibrillation After Transient Ischemic Attack or Minor Stroke.” Lancet 342, 1255-1262. Ezekowitz, M.D., Bridgers, S.L., James, K.E., Carliner, N.H., et al. (1992). “Warfarin in the Prevention of Stroke Associated with Nonrheumatic Atrial Fibrillation.” N Engl J Med 327, 1406-1412. Food and Drug Administration, Dockets home page. Available at: http://www.fda.gov/ohrms/dockets/AC/04/briefing/2004-4069B1_07_FDA-Backgrounder-C R-stat%20Review.pdf. Halperin, J.L., Executive Steering Committee, SPORTIF III and V Study Investigators (2003). “Ximelagatran Compared with Warfarin for Prevention of Thromboembolism in Patients with Nonvalvular Atrial Fibrillation: Rationale, Objectives, and Design of a Pair of Clinical Studies and Baseline Patient Characteristics (SPORTIF III and V).” Am Heart J 146, 431-8. Jackson, K., Gersh, B.J., Stockbridge, N., Fleiming, T.R., Temple, R., Califf, R.M., Connolly, S.J., Wallentin, L., Granger, C.B. (2005). Participants in the Duke Clinical Research Institute/American Heart Journal Expert Meeting on Antithrombotic Drug Development for Atrial Fibrillation (2008). “Antithrombotic Drug Development for Atrial Fibrillation: Proceedings.” Washington, D.C., July 25-27, 2005. American Heart Journal 155, 829-839. Petersen, P., Boysen, G., Godtfredsen, J., Andersen, E.D., Andersen, B. (1989). “Placebo Controlled, Randomised Trial of Warfarin and Aspirin for Prevention of Thromboembolic Complications in Chronic Atrial Fibrillation.” The Lancet 338, 175-179. Stroke Prevention in Atrial Fibrillation Investigators (1991). “Stroke Prevention in Atrial Fibrillation Study: Final Results.” Circulation 84, 527-539. 56 Contains Nonbinding Recommendations Draft – Not for Implementation 2155 2156 2157 2158 2159 2160 2161 2162 2163 2164 2165 2166 2167 2168 2169 2170 2171 2172 2173 2174 2175 2176 2177 2178 2179 2180 2181 2182 2183 2184 2185 2186 2187 2188 2189 2190 2191 2192 2193 2194 2195 2196 2197 Example 1(B) Refer to ”General Reference” Section for synthesis methods. Example 2 Allais, J.M., Preheim, L.C., Cuevas, T.A., Roccaforte, J.S., Mellencamp, M.A., Bittner, M.J. (1988). “Randomized, Double-Blind Comparison of Ciprofloxacin and Trimethoprim Sulfamethoxazole for Complicated Urinary Tract Infections.” Antimicrob Agents Chemother. 32(9), 1327-30. Christiaens, T.C., De Meyere, M., Verschraegen, G., et al (2002). “Randomised Controlled Trial of Nitrofurantoin Versus Placebo in the Treatment of Uncomplicated Urinary Tract Infection in Adult Women.” Br J Gen Pract. 52(482), 729-34. DerSimonian, R., Laird, N. (1986), “Meta-Analysis in Clinical Trials,” Controlled Clinical Trials. 7, 177-188. Dubi, J., Chappuis, P., Darioli, R. (1982). “Treatment of Urinary Infection with a Single Dose of Co-trimoxazole Compared with a Single Dose of Amoxicillin and a Placebo.” Schweiz Med Wochenschr. 12(3), 90–92. Fang, G.D., Brennen, C., Wagener, M. et al (1991). “Use of Ciprofloxacin Versus Use of Aminoglycosides for Therapy of Complicated Urinary Tract Infection: Prospective, Randomized Clinical and Pharmacokinetic Study.” Antimicrob Agents Chemother. 35(9), 1849-55. Ferry, S.A., Holm, S.E., Stenlund, H., Lundholm, R., Monsen, T.J. (2004). “The Natural Course of Uncomplicated Lower Urinary Tract Infection in Women Illustrated by a Randomized Placebo-Controlled Study.” Scan J Infect Dis. 36, 296-301. Ferry, S.A., Holm, S.E., Stenlund, H., Lundholm, R., Monsen, T.J. (2007). “Clinical and Bacteriological Outcome of Different Doses and Duration of Pivmecillinam Compared with Placebo Therapy of Uncomplicated Lower Urinary Tract Infection in Women: The LUTIW Project.” Scan J of Primary Health Care. 25(1), 49-57. Klimberg, I.W., Cox, C.E. 2nd, Fowler, C.L., King, W., Kim, S.S., Callery-D'Amico, S. (1998). “A Controlled Trial of Levofloxacin and Lomefloxacin in the Treatment of Complicated Urinary Tract Infection.” Urology. 51(4), 610-5. Peng, M.Y. (1999). “Randomized, Double-Blind, Comparative Study of Levofloxacin and Ofloxacin in the Treatment of Complicated Urinary Tract Infections.” J Microbiol Immunol Infect. 32(1), 33-9. 57 Contains Nonbinding Recommendations Draft – Not for Implementation 2198 2199 2200 2201 2202 2203 2204 2205 2206 2207 2208 2209 2210 2211 2212 2213 2214 2215 2216 2217 2218 2219 2220 2221 2222 2223 2224 2225 2226 2227 2228 2229 2230 2231 2232 2233 2234 2235 2236 2237 2238 Talan, D.A., Stamm, W.E., Hooton, T.M. et al (2000). “Comparison of Ciprofloxacin (7 Days) and Trimethoprim-Sulfamethoxazole (14 Days) for Acute Uncomplicated Pyelonephritis in Women.” JAMA. 283(12), 1583-1590. Example 3 Aspirin Myocardial Infarction Study Research Group (1980). “A Randomized Controlled Trial of Aspirin in Persons Recovered from Myocardial Infarction.” JAMA 243, 661-669. Breddin, K., Loew, D., Lechner, K., Uberia, E.W. (1979). “Secondary Prevention of Myocardial Infarction. Comparison of Acetylsalicylic Acid, Phenprocoumon and Placebo. A Multicenter Two-Year Prospective Study.” Thrombosis and Haemostasis 41, 225-236. Coronary Drug Project Group (1976). “Aspirin in Coronary Heart Disease.” Journal of Chronic Disease 29, 625-642. Elwood, P.C., Cochrane, A.L., Burr, M.L., Sweetnam, P.M., Williams, G., Welsby, E., Hughes, S.J., Renton, R. (1974). “A Randomized Controlled Trial of Acetyl Salicylic Acid in the Secondary Prevention of Mortality from Myocardial Infarction.” British Medical Journal 1, 436-440. Elwood, P.C., Sweetnam, P.M. (1979). “Aspirin and Secondary Mortality After Myocardial Infarction.” Lancet ii, 1313-1215. Fleiss, J.L. (1993). “The Statistical Basis of Meta-Analysis.” Statistical Methods in Medical Research 2,121-145. ISIS-2 Collaborative Group (1988). “Randomized Trial of Intravenous Streptokinase, Oral Aspirin, Both, or Neither Among 17187 Cases of Suspected Acute Myocardial Infarction: ISIS-2.” Lancet 2, 349-360. Persantine-Aspirin Reinfarction Study Research Group (1980). “Persantine and Aspirin in Coronary Heart Disease.” Circulation 62, 449-461. Example 4 FDA Guidance for Industry: Oncologic Drugs Advisory Committee Discussion on FDA Requirements for the Approval of New Drugs for Treatment of Colon and Rectal Cancer. FDA Medical-Statistical review for Xeloda (NDA 20-896) dated April 23, 2001. (http://www.fda.gov/cder/foi/nda/2001/20896s6_Xeloda_Medr_Statr_P1.pdf). 58 Contains Nonbinding Recommendations Draft – Not for Implementation 2239 2240 2241 2242 2243 2244 2245 2246 2247 2248 2249 2250 2251 2252 2253 2254 2255 2256 2257 2258 2259 2260 2261 2262 2263 2264 2265 2266 2267 2268 2269 2270 2271 2272 2273 2274 2275 2276 2277 2278 2279 2280 2281 2282 2283 GENERAL REFERENCES Blackwelder, W.C. (1982). “Proving the Null Hypothesis in Clinical Trials.” Controlled Clinical Trials 3, 345-353. Blackwelder, W.C. (2002). “Showing a Treatment is Good Because it is Not Bad: When Does “Noninferiority” Imply Effectiveness?” Control Clinical Trials 23, 52–54. Brittain, E., Lin, D. (2005). “A Comparison of Intent-to-Treat and Per Protocol Results in Antibiotic Non-Inferiority Trials.” Statistics in Medicine 24, 1-10. Brown, D., Day, S. (2007). Reply. Statistics in Medicine 26, 234-236. CBER/FDA Memorandum (1999). Summary of CBER Considerations on Selected Aspects of Active Controlled Trial Design and Analysis for the Evaluation of Thrombolytics in Acute MI, June 1999. Committee for Proprietary Medicinal Products (CPMP) (2000). Points to Consider on Switching Between Superiority and Non-Inferiority. http://www.emea.europa.eu/pdfs/human/ewp/048299en.pdf. Committee for Medicinal Products for Human Use (CHMP) (2006). “Guideline on the Choice of the Non-Inferiority Margin.” Statistics in Medicine 25, 1628–1638. Chow, S.C., Shao, J. (2006). “On Non-Inferiority Margin and Statistical Tests in Active Control Trial.” Statistics in Medicine 25, 1101–1113. D’Agostino, R.B., Massaro, J.M., Sullivan, L. (2003). “Non-Inferiority Trials: Design Concepts and Issues – the Encounters of Academic Consultants in Statistics.” Statistics in Medicine 22, 169–186. D’Agostino, R.B., Campbell, M., Greenhouse, J. (2005). “Non-Inferiority Trials: Continued Advancements in Concepts and Methodology.” Statistics in Medicine 25, 1097-1099. DerSimonian, R., Laird, N. (1986). “Meta-Analysis in Clinical Trials.” Controlled Clinical Trials 7, 177-188. Ellenberg, S.S., Temple, R. (2000). “Placebo-Controlled Trials and Active-Control Trials in the Evaluation of New Treatments - Part 2: Practical Issues and Specific Cases.” Annals of Internal Medicine 133, 464-470. Fisher, L.D., Gent, M., Büller, H.R. (2001). “Active-Control Trials: How Would a New Agent Compare with Placebo? A Method Illustrated with Clopidogrel, Aspirin, and Placebo.” American Heart Journal 141: 26-32. 59 Contains Nonbinding Recommendations Draft – Not for Implementation 2284 2285 2286 2287 2288 2289 2290 2291 2292 2293 2294 2295 2296 2297 2298 2299 2300 2301 2302 2303 2304 2305 2306 2307 2308 2309 2310 2311 2312 2313 2314 2315 2316 2317 2318 2319 2320 2321 2322 2323 2324 2325 2326 2327 2328 Fleming, T.R. (1987). “Treatment Evaluation in Active Control Studies.” Cancer Treatment Reports 71, 1061-1064. Fleming, T.R. (2000). “Design and Interpretation of Equivalence Trials.” American Heart Journal 139, S171-S176. Follmann, D.A., Proschan, M.A. (1999). “Validity Inference in Random-Effects Meta Analysis.” Biometrics 55, 732-737. Freemantle, J., Cleland, J. Young, P., Mason, J., Harrison, J. (1999). “B Blockade After Myocardial Infarction: Systematic Review and Meta Regression Analysis.” British Medical Journal 318, 1730-1737. Gould, A.L. (1991). “Another View of Active-Controlled Trials.” Controlled Clinical Trials 12, 474-485. Holmgren, E.B. (1999). “Establishing Equivalence by Showing That a Prespecified Percentage of the Effect of the Active Control Over Placebo is Maintained.” Journal of Biopharmaceutical Statistics 9(4), 651-659. Hasselblad, V., Kong, D.F. (2001). “Statistical Methods for Comparison to Placebo in Active-Control Trials.” Drug Information Journal 35, 435-449. Hauschke, D. (2001). “Choice of Delta: A Special Case.” Drug Information Journal 35, 875-879. Hauschke, D., Hothorn, L.A. (2007). Letter to the Editor: An Introductory Note to the CHMP Guidelines: Choice of the Non-Inferiority Margin and Data Monitoring Committees. Statistics in Medicine 26, 230-233. Hauschke, D., Pigeot, I. (2005). “Establishing Efficacy of a New Experimental Treatment in the ‘Gold Standard’ Design (with discussions).” Biometrical Journal 47, 782-798. Holmgren, E.B. (1999). “Establishing Equivalence by Showing that a Prespecified Percentage of the Effect of the Active Control Over Placebo is Maintained.” Journal of Biopharmaceutical Statistics 9, 651-659. Hung, H.M.J., Wang, S.J., Tsong, Y., Lawrence, J., O’Neill, R.T. (2003). “Some Fundamental Issues with Non-Inferiority Testing in Active Controlled Clinical Trials.” Statistics in Medicine 22, 213-225. Hung, H.M.J., Wang, S.J., O’Neill, R.T. (2005). “A Regulatory Perspective on Choice of Margin and Statistical Inference Issue in Non-Inferiority Trials.” Biometrical Journal 47, 28-36. 60 Contains Nonbinding Recommendations Draft – Not for Implementation 2329 2330 2331 2332 2333 2334 2335 2336 2337 2338 2339 2340 2341 2342 2343 2344 2345 2346 2347 2348 2349 2350 2351 2352 2353 2354 2355 2356 2357 2358 2359 2360 2361 2362 2363 2364 2365 2366 2367 2368 2369 2370 2371 2372 2373 Hung, H.M.J., Wang, S.J., O’Neill, R.T. (2008). “Non-Inferiority Trial.” Wiley Encyclopedia of Clinical Trials. Wiley, New York. Hung, H.M.J., Wang, S.J., O’Neill, R.T. (2007). “Issues with Statistical Risks for Testing Methods in Noninferiority Trial Without a Placebo Arm.” Journal of Biopharmaceutical Statistics 17, 201-213. International Conference on Harmonization: Statistical Principles for Clinical Trials (ICH E-9), Food and Drug Administration, DHHS, 1998. International Conference on Harmonization: Choice of Control Group and Related Design and Conduct Issues in Clinical Trials (ICH E-10), Food and Drug Administration, DHHS, July 2000. Jones, B., Jarvis, P., Lewis, J.A., Ebbutt AF (1996). “Trials to Assess Equivalence: the Importance of Rigorous Methods.” British Medical Journal 313, 36-39. Julious, S.A., Wang, S.J. (2008). “How Biased are Indirect Comparisons Particularly When Comparisons Are Made Over Time in Controlled Trials?” Drug Information Journal 42, 625-633. Koch, A., Röhmel, J. (2004). “Hypothesis Testing in the Gold Standard Design for Proving the Efficacy of an Experimental Treatment Relative to Placebo and a Reference.” Journal of Biopharmaceutical Statistics 14, 315-325. Kaul, S., Diamond, G.A. (2006). “Good Enough: A Primer on the Analysis and Interpretation of Non-Inferiority Trials.” Annals of Internal Medicine 145, 62-69. Lange, S., Freitag, G. (2005). “Choice of Delta: Requirements and Reality – Results of a Systematic Review.” Biometrical Journal 47; 12-27. Laster, L.L., Johnson, M.F., Kotler, M.L. (2006). “Non-Inferiority Trials: the ‘at least as good as’ Criterion with Dichotomous Data.” Statistics in Medicine 25, 1115-1130. Lawrence, J. (2005). “Some Remarks About the Analysis of Active Control Studies.” Biometrical Journal 47, 616-622. Ng, T.H. (1993). “A Specification of Treatment Difference in the Design of Clinical Trials with Active Controls.” Drug Information Journal 27, 705-719. Ng, T.H. (2001). “Choice of Delta in Equivalence Testing.” Drug Information Journal 35, 1517-1527. Ng, T.H. (2008). “Noninferiority Hypotheses and Choice of Noninferiority Margin.” Statistics in Medicine 27, 5392-5406. 61 Contains Nonbinding Recommendations Draft – Not for Implementation 2374 2375 2376 2377 2378 2379 2380 2381 2382 2383 2384 2385 2386 2387 2388 2389 2390 2391 2392 2393 2394 2395 2396 2397 2398 2399 2400 2401 2402 2403 2404 2405 2406 2407 2408 2409 2410 2411 2412 2413 2414 2415 2416 2417 2418 Pledger, G., Hall, D.B. (1990). “Active Control Equivalence Studies: Do They Address the Efficacy Issue?” Statistical Issues in Drug Research and Development, Marcel Dekker, New York, 226-238. Röhmel, J. (1998). “Therapeutic Equivalence Investigations: Statistical Considerations.” Statistics in Medicine 17, 1703-1714. Rothmann, M., Li, N., Chen, G., Chi, G.Y.H., Temple, R.T., Tsou, H.H. (2003). “Non Inferiority Methods for Mortality Trials.” Statistics in Medicine 22, 239-264. Rothmann, M. (2005). “Type I Error Probabilities Based on Design-Stage Strategies with Applications to Noninferiority Trials.” J. of Biopharmaceutical Statistics 15; 109-127. Sanchez, M.M., Chen, X. (2006). “Choosing the Analysis Population in Non-Inferiority Studies: Per Protocol or Intent-to-Treat.” Statistics in Medicine 25, 1169-1181. Sheng, D., Kim, M.Y. (2006). “The Effects of Non-Compliance on Intent-to-Treat Analysis of Equivalence Trials.” Statistics in Medicine 25, 1183-1190. Siegel, J.P. (2000). “Equivalence and Noninferiority Trials.” American Heart Journal 139: S166-S170. Simon, R. (1999). “Bayesian Design and Analysis of Active Control Clinical Trials.” Biometrics 55, 484-487. Snapinn, S.M. (2004). “Alternatives for Discounting in the Analysis of Noninferiority Trials.” Journal of Biopharmaceutical Statistics 14, 263-273. Snapinn, S.M., Jiang, Q. (2008). “Controlling the Type I Error Rate in Non-Inferiority Trials.” Statistics in Medicine 27, 371–381. Temple, R. (1987). “Difficulties in Evaluating Positive Control Trials.” Proceedings of the Biopharmaceutical Section of American Statistical Association, 1-7. Temple R. (1996). “Problems in Interpreting Active Control Equivalence Trials.” Accountability in Research 4: 267-275. Temple, R., Ellenberg, S.S. (2000). “Placebo-Controlled Trials and Active-Control Trials in the Evaluation of New Treatments - Part 1: Ethical and Scientific Issues.” Annals of Internal Medicine 133, 455-463. Wang, S.J., Hung, H.M.J., Tsong, Y. (2002). “Utility and Pitfalls of Some Statistical Methods in Active Controlled Clinical Trials.” Controlled Clinical Trials 23, 15-28. 62 Contains Nonbinding Recommendations Draft – Not for Implementation 2419 2420 2421 2422 2423 2424 2425 2426 2427 2428 2429 2430 2431 2432 2433 Wang, S.J., Hung, H.M.J. (2003). “Assessment of Treatment Efficacy in Non-Inferiority Trials.” Controlled Clinical Trials 24, 147-155. Wang S.J., Hung H.M.J. (2003). “TACT Method for Non-Inferiority Testing in Active Controlled Trials.” Statistics in Medicine 22; 227-238. Wang, S.J., Hung, H.M.J., Tsong, Y. (2003). “Non-Inferiority Analysis in Active Controlled Clinical Trials.” Encyclopedia of Biopharmaceutical Statistics, 2nd Edition. Marcel Dekker, New York. Wiens, B. (2002). “Choosing an Equivalence Limit for Non-Inferiority or Equivalence Studies.” Controlled Clinical Trials 23, 2-14. Wiens, B. (2006). “Randomization as a Basis for Inference in Noninferiority Trials.” Pharmaceutical Statistics 5, 265-271. 63


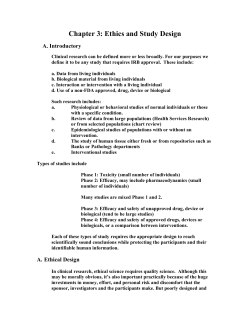


© Copyright 2026