
Sense and Sensibility in a Pervasive World
Sense and Sensibility in a Pervasive World
Christos Efstratiou1 , Ilias Leontiadis1 , Marco Picone1,2 , Kiran K. Rachuri1 , Cecilia
Mascolo1 , and Jon Crowcroft1
1
2
Computer Laboratory, University of Cambridge, Cambridge, UK
Department of Information Engineering, University of Parma, Italy
Abstract. The increasing popularity of location based social services such as
Facebook Places, Foursquare and Google Latitude, solicits a new trend in fusing social networking with real world sensing. The availability of a wide range
of sensing technologies in our everyday environment presents an opportunity to
further enrich social networking systems with fine-grained real-world sensing.
However, the introduction of passive sensing into a social networking application disrupts the traditional, user-initiated input to social services, raising both
privacy and acceptability concerns. In this work we present an empirical study of
the introduction of a sensor-driven social sharing application within the working
environment of a research institution. Our study is based on a real deployment of
a system that involves location tracking, conversation monitoring, and interaction
with physical objects. By utilizing surveys, interviews and experience sampling
techniques, we report on our findings regarding privacy and user experience issues, and significant factors that can affect acceptability of such services by the
users. Our results suggest that such systems deliver significant value in the form
of self reflection and comparison with others, while privacy concerns are raised
primarily by the limited control over the way individuals are projected to their
peers.
1
Introduction
Social networks are becoming part of our lives, as an increasing percentage of Internet users interact with them on a daily basis. The interaction with social networks is
steadily moving beyond the typical desktop environment, with a significant number of
users interacting with such services through their mobile devices. At the same time the
wide availability of location sensing on smart-phones and the increasing popularity of
location based social services such as FourSquare, Gowalla and Google Latitude, are
introducing a new trend in fusing social networking with real-world sensing.
Recently, a number of experimental systems exploit the sensing capabilities of mobile phones in order to further enrich user experience. For example, in CenceMe [1]
a range of the phone’s sensing modalities (such as accelerometers, microphone, light,
location) are used in order to detect user activities and upload this information to various social networks like Facebook, Twitter and MySpace. Similarly, in CitySense [2]
crowd-sourced sensed information is used to analyze human behavior so as to produce a
live map of city-wide social activities. Although there is real value in detecting a range
of contextual information through mobile phone sensing, the limited battery life and
the fixed types of sensing modalities available on mobile phones, impose restrictions
on the type and the accuracy of sensing that can be employed. In certain environments
however, such as public buildings [3], the presence of static sensors embedded in the environment can offer significantly more accurate detection of similar types of events, or
even new sensing capabilities not available on a mobile device. For instance, automated
RFID based access doors, nowadays installed in several working environments, can detect the arrival of a person at their workplace more accurately and without expending
the battery life of the user’s mobile device. Furthermore, a coffee machine augmented
with embedded sensing capabilities, is able to detect the fact that the user is having a
coffee, an activity that may not easily be detected through a mobile phone.
The increasing availability of sensing technologies within our everyday environment, along with the vision of augmented physical objects with embedded intelligence
[4], are creating a fertile opportunity for the design of a new class of social sensing
services. We envisage a scenario where static sensors, as well as sensing offered by
individual mobile devices can enhance the experience offered by social networking services. Apart from the technical difficulties of designing such an integrated social sensing architecture, there are usability challenges and privacy concerns that arise when
users live and interact within an environment where sensed information can be shared
with other people. Embedded sensing is inherently passive, performed without the explicit decision of the user. Moreover, the physical device that is collecting information
is typically not owned by the user that is being sensed. Both of these characteristics are
expected to generate significant privacy concerns. An important challenge in deploying such services is to strike a balance between the value that users are getting out of
such service and the level of privacy that they are expected to relinquish. In this work
we attempt to investigate significant factors that can affect both the perception of value
and concerns about privacy, in sensor-enhanced social sharing services deployed in the
working environment of a research institution.
We conducted an empirical study based on a real deployment of such service installed in a research institution in the United Kingdom. The service relied on location sensing, conversation detection, and interaction with physical object in the target
working environment. Users were allowed access to real-time high-level social interaction information along with game-like comparisons of different activities, between
colleagues in the institution. A two weeks study, involving 21 participants, was aimed
at investigating parameters that influence the perceived value that users find in such system, and factors that affect their concern about privacy in that particular environment.
Using a combination of surveys, experience sampling techniques, and interviews we
are reporting on the significant findings of this study.
2
Motivation
The wide availability of sensing technologies in our everyday environment, presents an
opportunity for passive real-world sensing of human activities and social interactions.
From as early as 1992 the design of the Active Badge [5] system was motivated by the
need for location based services in business environments. Multiple sensor networks
embedded in our physical environments, as well as sensing offered by individual devices (mobile phones, augmented physical objects) can be fused in order to allow the
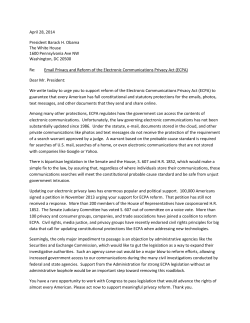
Fig. 1. Infrastructure deployment: Sensor nodes attached to coffee machines and desks, and mobile phones used for localization and information visualization.
monitoring and sharing of our social interactions and everyday activities (Figure 1).
The significant value that users can extract from such systems, is best illustrated when
considering social spaces where multiple people interact on a daily basis. Shared social sensing in the working environment can foster a new application domain for social
networking. Users can have the opportunity to monitor their personal behavioral patterns [6] and share it with their colleagues. Game-like features, where colleagues can
see who is the most social or most chatty person in their working environment, can
potentially enhance personal reflection and motivate social cohesion and efficient collaboration [7]. However, activity sensing in the working environment is typically faced
with suspicion and concerns about privacy and surveillance [8]. Although there are
valid concerns about employing such technologies in the workplace, it is our belief that
most of these concerns are driven by the fact that sensed information collected in such
environment is accessible only to the upper management for performance monitoring
purposes. A challenging issue is to discover the extent by which a transparent shared
social sensing infrastructure can mitigate privacy concerns and deliver significant value
to the users.
Motivated by these issues, we conducted an empirical study that involved the deployment of a sensor-enhanced social sharing service. The service offered a flat structure where all users could see information about the location of colleagues and their
social interactions, as well as value-added features such as personal statistics (who they
interact with the most, how many coffees they had), and “social games” where they
were compared with their colleagues according to their social patterns. The aim of the
study was to investigate parameters that can affect the acceptability of such services,
from privacy concerns and perceived value, to usability issues.
3
Requirements Capturing
The aim of the requirements capturing process was to identify the sensing modalities
that are necessary for capturing social interactions in the workplace, and the users’
expectation from such service. By conducting a survey of systems that have been deployed in working environments, such as [9,10], we identified that important modalities
include: (i) location tracking, (ii) co-location sensing, and (iii) conversation detection.
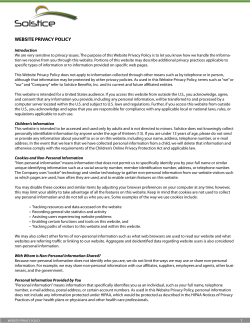
Fig. 2. System Architecture
We decided to further enrich the sensed information with detection of interaction with
physical objects.
A group discussion and consultation with potential users of the system was used to
discover important functionality that should be offered by such service. A group of 10
potential users was consulted in this process. The users commented both in terms of
functionality and usability. The key points that came out of these discussions were: (i)
preference towards diffusing sensing in the environment rather than relying on mobile
devices, to make the system less intrusive, (ii) an interest in offering a visualized “personal log” about their daily activities in the workspace, (iii) added-value services could
include social “games” where people can compete with others on different aspects of
their social behavior, (e.g. how much they talk to others, or how much time they spent
working at their desk), and (iv) an interest for detecting social gatherings (e.g., meetings, group lunch breaks) that are currently taking place in the building. We designed
and deployed our system based on these requirements.
4
System Design & Deployment
The primary objective is to deploy a system that is able to deliver high level social events
to users in real-time by employing multiple sensing technologies that are distributed in
the users’ working environment. The overall system consists of a social event detection system, a range of deployed sensing technologies, and web-based applications that
allow users to interact with the service (Figure 2).
4.1
Social event detection system
We implemented a system that offers an abstraction interface between the physical sensor networks and the social sensing events that applications are interested in (Figure 2).
This system acts as a reconfigurable sensor fusion engine, that combines low-level information from one or more sensor networks to generate composite high-level social
activity events. For example, information from bluetooth scanning and sensors embedded on a coffee machine can be combined to detect when a user is having a coffee,
while microphones and location tracking can be combined to infer when two people are
having a conversation.
More specifically, in our implementation the running applications can specify an
interest to a certain event by subscribing to one of the high-level social events that the
system supports (e.g., find users in a room, detect conversations, detect a meeting). The
Query Manager is then responsible for decomposing these high-level subscriptions into
the low-level sensing events that are required to detect them. Sensor networks can register and offer their services to the system via a web service API (Figure 2). Each network
registration includes the type of the offered sensing and the geographic area that the
network covers. This latter piece of information is required to identify when a user is
within an area covered by the specific sensor network. The registered sensor networks
communicate with the deployed service (either directly or via a broker) through a publish/subscribe communication interface. The subscriptions define interests for certain
events in a particular geographic area that is populated by users. The resulting lowlevel events that are collected from the registered sensor networks are stored in an SQL
database inside the service. As most events depend on the physical location of the users,
the Location Manager is responsible for dynamically adapting the area of interest for
these subscriptions as people move about. In essence, the service maintains a sensing
space around each user, collecting relevant sensing events from their environment.
The Query Manager is also responsible for notifying the application when low-level
events can satisfy a high-level subscription. In this case high-level events of the form
{user id, time stamp, location, activity type, activity details} are generated and
stored at the database. Applications are then able to further aggregate and visualize
these events to the users.
4.2
Sensor Deployment
The deployed system consisted of the following sensing modalities: a localization infrastructure, a conversation sensing infrastructure, a network of sensors attached to
physical objects and specifically to desks in offices and coffee machines in communal areas.
Bluetooth Indoor Localization: To monitor the location of the participants, a number
of static bluetooth devices were deployed as anchor points covering 12 offices, and 5
communal areas such as a common room, kitchens and coffee rooms. The localization
service relied on an Android mobile phone application installed on the participants’
phones that could discover their location through bluetooth scanning. Using the RSSI
value of the responses received by the anchors, the application could localize users with
an accuracy of a few meters. Users that did not have a personal Android phone were
offered one for the duration of the study. Overall, the deployment included 11 Samsung
Galaxy S, 7 HTC Desire and 3 HTC G2 phones.
Speech Recognition: 17 Nokia 6210 phones were installed inside each room (as
static sensors) to detect whether a conversation was taking place. The voice recognition
is based on the Hidden Markov ToolKit (HTK) which can deliver over 90% accuracy
in conversation detection [9]. Two Gaussian Mixture Models representing speech and
silence models are trained under similar background conditions. Immediately after processing, all voice samples were erased from the system.
Sensors: A range of physical objects were augmented with sensors that could detect
interactions with the users. Specifically, 21 Imote-2 sensor nodes were attached on the
participants’ desks. The sensors were used to detect when users were spending time
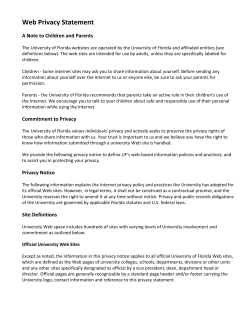
(a) Personal Timeline.
(b) Social Friend-Finder
(c) Social Rankings
Fig. 3. Some of the Web-Based Applications. User names have been anonymized.
at their desk by detecting vibration patters using the 3-axis accelerometers. Furthermore, additional sensors were attached to coffee machines in communal kitchens, as
many users during the requirements capturing phase indicated that they would consider
interesting to detect coffee breaks. All sensor nodes were deployed as a wireless sensor network, utilizing a tree-based collection routing protocol that could deliver sensed
events to the system.
4.3
Web interface
A web based interface was developed to allow users to view personal information, and
social interactions as they were recorded by the sensing service. The users could access
the application from their desktop or their mobile phone if needed. The information that
the application could deliver can be divided into three main categories: (i) personal,
showing all social activities of an individual as it was captured from the system, (ii)
social, allowing the user to see aggregate information related to other people in the
working environment, (iii) all, where user’s could see detailed information about all
users in the system.
Personal Information The personal page of the web application, allowed participants
to see all the details that the system was capturing about their social activity. The information included:
– The location of the user in room-level granularity, over time.
– The time period the user was present in their working environment (when they came
and left the building).
– The exact time periods the user spent working at their desk.
– The interactions the user had with others based on co-location sensing.
– The amount of time they spent with others in conversations.
– The number of coffee breaks they had during the day.
The page uses a range of visualization techniques to present such information to the
user. Timeline graphs allowed users to see how their activities progressed during the
day. This visualization was implemented to satisfy the requirement expressed by some
users, to be able to see a log of their activities during the day. Furthermore, aggregated
information, such as average daily and weekly time at work, on desk, etc. were presented in the form of pie-charts, while bar-charts were used to identify the people they
were socializing with most frequently. A snapshot of the personal web page can be seen
in Figure 3.a.
Social Information The social page of the web application, allowed participants to
see information related to the social activity of people participating in the study. The
section offered two types of information: (i) Real-time details about people’s location
and about their current activity, such as if they are at their desk, or if they are having
a coffee; (ii) Social rankings where users were compared on different aspects of their
social activity.
The real-time information were offered mostly for utilitarian purposes, as users had
identified such tools as useful added-value services. The social rankings were implemented in order to introduce a gaming concept into the system. These include ranking:
(i) according to the time each person spends working at their desk, (ii) how much time
people spend with other colleagues (most social), (iii) who is the highest consumer of
coffee, (iv) who is spending most time chatting with colleagues. Their purpose is to
allow the participants to compare certain social activities with each other, creating a
social gaming experience similar to the features found in services like FourSquare. An
example is shown in Figure 3.c.
All information This section allowed open access to the details of all people participating in the study. A user could see the time-lines of all participants including the time
they came and leave work, the time spent working at their desk, the rooms they visited
during the day, etc. Essentially this section gave the user the opportunity to examine detailed information about all other participants, effectively giving complete transparency
over the information collected about all people involved in the study.
The different features supported by the application were mainly derived by the requirements that the users expressed during the consultation phase. However, the presented information were organized in increasing levels of detail that user’s can have
access too, with a clear awareness on our behalf, that these differences might lead to
different levels of privacy concern.
5
User Study
Using the social sensing system that was described, we conducted a two weeks user
study with 21 participants within a research institution. The target environment was
selected for two main reasons. Firstly, reflecting on the adoption process of on-line social networks such as Facebook, we consider educational and research institutions as
the most probable environments to be early adopters of such services. Secondly, technological research institutions, are either already instrumented with a range of sensing
technologies, or have the capacity to easily introduce such technologies in their environment. The main research questions that we tried to address were:
1. Is there enough value for users so that social sensing in working environments can
be considered a typical application, beyond the context of short-term sociological
studies?
2. How does visibility of sensed information affect acceptability and privacy concerns?
3. Are there feasible techniques to mitigate privacy concerns without harming the
perceived value offered by the system?
In the context of this study we consider acceptability as a function of two main factors:
(i) the value that users find in a given service, (ii) the concerns in terms of privacy that
they have by the introductions of such service.
5.1
Methodology
The overall methodology that we employed in this study can be broken down into the
following steps:
– Recruiting: A process of selecting participants with the aim of maintaining a balance in demographics (age and sex) and their job role in the institution.
– Preliminary Survey: Participants were asked to fill in a questionnaire that allowed
us to capture their experience in social networking systems, and their initial attitude
towards the system they were asked to use.
– Empirical Study: During the period that participants were interacting with the system, we introduced an interactive feedback tool where participants could indicate
their concerns in terms of privacy and usefulness of the system.
– Interviews: After the completion of the empirical study, semi-structured interviews
with all participants allowed us to capture both experiences and attitudes towards
the system.
The following sections describe in detail each of these stages.
5.2
Recruiting Users
In selecting participants we used stratified sampling with snowball sampling within
each stratum. During the recruiting process we identified three primary groups of users
that represent three main roles of workers in that environment. The three groups were:
– Research students: Typically, have flexible working patterns. Their working progress
is usually supervised by research and academic staff.
– Researchers & academics: More structured working patterns compared to students.
– Administrative staff: Strict working patterns, working environment that may be
more similar to a corporate working environment.
As we had no prior knowledge about the expected variability within each group, in
the recruiting process we tried to have a relatively balanced representation of all three
groups. We decided to use snowball sampling within the groups in order to recruit
participants that had some form of social relationship with each other. We eventually
recruited 21 participants, after discarding a number of users that volunteered, in order to
maintain a balanced representation across categories. The group of participants include
8 students, 7 researchers & academics, and 6 administrative staff. Furthermore, the user
sample was balanced in terms of gender (with 10 female and 11 male participants), and
age with 11 participants in the age group 18-35, and 10 participants in 36-65 group.
Before a user decided to join the study, they were briefed individually, given a description of the sensing technologies that has to be put in place, how data will be collected and who will be able to see sensed data about them. It was explained that they
could opt-out and ask the system to cease collecting data at any time during the study.
Each participant was compensated with a £5 gift card.
5.3
Preliminary Survey
Before allowing the participants to interact with the system, a short survey was conducted in order to capture some background information about the user group. The
Facebook
Twitter
LBS
Track location
Track activities
Track social interactions
Usefulness
4.94 (1.06)
4.92 (1.61)
5.25 (1.16)
4.42 (1.66)
4.14 (1.46)
4.23 (1.55)
Privacy
4.86 (1.36)
4.77 (2.13)
6.13 (1.36)
5.00 (1.73)
5.09 (1.48)
4.71 (1.38)
Risk
4.38 (1.36)
4.46 (1.90)
4.36 (1.60)
3.85 (1.52)
4.14 (1.15)
3.90 (1.04)
(a) Survey Ratings. Scale 1 - 7. Usefulness: 7 extremely
useful, Privacy: 7 extremely concerned, Risk: 7 benefit outweighs risk
Days Run
Participants
Website Visits
Times Feedback given
Low Level Events
High Level Events
Conversations Detected
Meetings Detected
User Locations Tracked
Coffee Breaks
Desk Activity
14
21
2,809
743
408,455
25,431
3,380
1,058
1,940
384
9,969
(b) Summary of system traces results during the study
Table 1. Preliminary survey results (a) and system traces results during the study (b).
main aim was to record their experience with other social networking services and their
attitude towards them. The survey consisted of 33 closed questions. 18 questions were
related to the users’ attitude towards different technologies in terms of usefulness, privacy concerns and risk, formatted in a 7 point Likert scale.
Social Networks: 76% (16) of our participants use Facebook. In fact, 58% (12) of
them visit Facebook at least once a day but only 33% of them post information at least
once a week. More than half (62%) of the participants are Twitter users, however, this
value drops significantly when considering participants of higher age groups (only 1 of
the 5 participants aged over 45 use Twitter). Considering location based services like
Google Latitude, Gowalla and Foursquare, 38% of the participants reported that they
are users of such services, with no one from the higher age groups (more than 45). In
terms of usefulness, as seen at Table 1(a), participants consider location based services
more useful than Facebook and Twitter and yet, at the same time they raise more privacy
concerns.
Expectation for the upcoming study: During the recruitment phase of this study,
and in particular during the briefing phase, certain participants expressed concerns about
their privacy when they would be using the system. We thought it would be useful to
capture these concerns before the participants were exposed to the system. We extended
the preliminary survey with a set of questions that would allow the users to offer their
view about the system, before they actually use it. The questions were presented as hypothetical scenarios where particular sensing technologies are introduced. For example,
we asked: “Assume that you are working in an environment where a sensing technology
is able to track your location and the location of your colleagues. Consider that such information can become available to you”. The participants were asked to comment about
their concerns about privacy, usefulness and risk. After analyzing the responses, we
identified that users were quite neutral about the usefulness of such services (average
4.2), and moderately concerned about privacy (average 4.9) (Table 1(a)).
5.4
Empirical Study
The twenty one participants were allowed to interact with the system for a period of
2 weeks. 6 of the participants, that form a very close social group, were selected for
a focused study on how information visibility can affect privacy concerns and value.
Specifically, the 6 participants were only allowed to see information within their close
social group. The remaining 15 participants could see information about all other users
in the system. The two groups will be referred as “Closed access” and “Open access”
groups respectively in the rest of the paper.
After collecting the participants’ background information, we commenced the 2week study. Each participant was given an android phone that had to carry at all times.
Furthermore, each user was supplied with a private login and password to access the
website. The participants could access the web site as often as they wanted, however
they were advised to do it at least twice per day. During the study we had 2,809 visits in
total from the 21 users (about 10 pages views per day per person) as shown in Table 1(b).
On the website, a “feedback” button was added next to each block of displayed
information (an example can be found in Figure 3). When this button was clicked, a
form allowed the participants to rate and comment on the usefulness and the privacy
concerns of the displayed information. The feedback mechanism was used as a form of
experience sampling. It allowed us to observe any possible changes in the participants’
attitude during the study. The users were encouraged to use these buttons whenever they
felt it was appropriate to offer their opinion. During the study, feedback was given 743
times (Table 1(b)).
The actual running of the study was broken into three stages. At each stage users
were allowed access to more functionality and potentially more privacy sensitive information. For the first three days, the users were only given access to their own personal
information. This stage allows the participants some time in order to familiarize themselves with what is collected, without inducing significant privacy concerns. At the end
of the third day, the “Social” section was enabled allowing users to directly compare
themselves with others. The “All” tab was enabled during the last three days of the
study. As that tab was allowing access to potentially more sensitive information, we did
not want to trigger serious privacy concerns early in the study. The participants were
informed by e-mail when more functionality was becoming available to them.
After the study, for each user we collected the results from the questionnaire, the
website feedback, and the observed behavior of the users (e.g., how many times they
logged in, how much time the were at work, etc). The collected data was used in preparation for the interviews that were conducted. This dataset allowed us to structure the
interviews according to the information we had about each individual participant.
5.5
Interviews
The interviews consisted of 31 questions, including 6 closed questions where participants were asked to give markings on a 7-point Liker scale. The interview questions
covered the following subjects: (i) overall experience, (ii) perceived value, (iii) privacy
concerns, (iv) social impact. Each interview lasted approximately 45 minutes. The interviews were audio recorded and then transcribed into text. The analysis used an open
coding scheme that allowed us to discover common themes across participants. In the
following section the participants are referred with code names P1 - P21.
6
Results
The analysis of our results builds upon privacy regulation theory developed by social
psychologist Irwin Altman [11]. Altman understands privacy to be a dialectic and dy-
namic boundary regulation process. According to his work privacy is a dynamic response to circumstances rather than a static enforcement of rules; and it is defined by a
set of tensions between competing needs. Privacy as a continuous negotiation process is
trying to balance the needs of individuals to retain information as private, while explicitly disclosing or publicizing information as means of declaring allegiance or even of
differentiating ourselves from others. In [12] Palen and Dourish explore how Altman’s
theory is applied in the design of novel interactive technologies. According to Palen
and Dourish technology plays a disruptive role in this boundary control process. We see
the deployment of passive social sensing technologies as such a disruptive technology.
In our experimental study our primary aim was to explore the main tensions between
competing needs that can affect the specification of privacy boundaries. The presence
of passive social sensing allows participants to gain visibility to other’s social behavior
while exposing their social life to public view. In our analysis we aim to explore the
users’ experiences that reveal these contradicting needs.
6.1
Demand for information
During the interviews when participants were asked to explain their experience with
the system, it became clear that there was a distinction between practical use and “fun”.
Practical uses were referred for example to ways were the system helped participants
to discover where their colleagues are: P3 mentioned using the service to find out when
their close collaborators are in the lab, to meet them. The term “fun” was mainly used
in the context of monitoring others’ social behavior. P14: “I liked the ranking games. It
was an interesting stimuli. For example chattiness and social encounters. In that sense
it was a bit more intriguing and playful.”
Fun: checking “others” The participants were asked to comment on the type of information they most commonly viewed through the web application. 57% of the participants mentioned that they were mostly interested in data from specific individuals.
Throughout the interviews comments from the “open access” group, indicated an interest on people that they did not have close social ties with: P7: “I preferred checking on
people that I didn’t know. Stalking strangers can help you build new bonds in the lab”.
Similar comments were also given by P12 and P14.
Motivated by these findings we decided to investigate further this trend. Using the
co-location data that were collected by the sensing infrastructure we constructed a social graph of the “open access” group (Figure 4). The thickness of the graphs edges
reflect the amount of time the participants spent together during the study, and therefore the social bond between participants. We then mapped on top of the social graph,
the interest the participants identified when discussing interest on social behavior. As it
became apparent the participants showed a clear interest in people outside their close
social circle. However, people in the work place are never complete strangers. P13 mentioned that he was observing P14: “It was interesting to watch the ranking of people.
Especially [P14]. We are both writing our thesis and it was interesting to see who is
the hardest worker”. However, according to the social networking data, the two participants are not close contacts (and they are not currently friends on Facebook). P7 is quite
clear on his intentions when monitoring social behavior in the work place: “Knowing
the time people spend with others is very important information as this can help people
Fig. 4. Social Network and interest between participants (red arrows)
collaborate and spread ideas. [...] You can find important persons, persons that can
influence a lot of others.”
Practical: helps me do my job The significance of monitoring “others” is revealing
when considering the results from the “closed group”. The comments from the close
access group were overwhelmingly related to the practical uses of the system. P17:
“There might be some use of the desk sensor for people with special needs... monitoring
how long you are on your desk and need to have a break”. P16: “It was quicker to pop
into the reception for me instead of using the system. If it was large scale it would
have been useful as we would know if people are in, so as to reach them”. The social
networking graph showed that the particular group spent significant amounts of time
together. In fact, the particular group had a tendency to have the same coffee breaks and
lunch breaks and spend them together. Practically, there were not a lot of information
that the system could reveal that they didn’t already know. Interestingly, when asked to
rate the usefulness of the system, the closed group gave significantly lower markings
than the open group: 92% of the open group found the system useful versus 60% of the
closed group.
Me vs “others” In addition to practical uses and social monitoring, all participants
commented on the value of using such system for self monitoring. The fact that environmental sensing is inherently passive (users do not need to remember to “checkin”),
gives people a more objective view on the activities they perform. Participants made
comments on their behavior that they didn’t expect. P10 commented that although he
was cutting down on coffee, he could see that over time he didn’t actually make much
progress. P6 mentioned that she was spending too much time socializing compared to
others, while P14 had the opposite comment; not socializing that much. In most personal comments, the comparison was with the general trend they observed with other
people. Typically personal monitoring is commonly contrasted with the social behavior
of others, not necessarily from within their close social circle.
Relating to the actual system functionality, both personal observation and social
behavior, were mostly concerned with general trends in people’s behavior, while practical value derived from the system was mainly attributed to the real-time aspects of the
system. However, the differences between the open and the closed group, reveal that
Time on desk vs privacy concern
A*er (interview) 9.00
8.00
7.00
6.00
5.00
4.00
3.00
2.00
r2 = 0.083
P = 0.359
1.00
0.00
0
2 3 4 5 6 7 Average diversion from 9:00am
Students Researchers Admin Average time on desk per day
During (feedback) 1 Arival time vs privacy concern
10.00
Before (survey) 1
2
3
4
5
Privacy concern
6
7
8:24
7:12
6:00
4:48
3:36
2:24
r2 = 0.670
P < 0.0001
1:12
0:00
0
1
2
3
4
5
6
7
Privacy concern
(a) Privacy concern changes (b) Correlation between pri- (c) Correlation between priduring the study.
vacy concern and time spent on vacy concern and time of artheir desk.
rival to work.
Fig. 5. Results.
acceptability of such systems is highly depended on opportunities to monitor social behavior of people beyond their close social ties. Also some of the comments indicated
an interest for general behavioral trends of certain role groups in the workplace: e.g.
what is the social pattern of research students on writing-up, what is the social pattern
of researchers within the lab.
6.2
Privacy concerns
Overall the exposure of the participants to the system reduced their privacy concern
about the system. Figure 5(a), shows the average trend in privacy concern before, during and after the study (scale 1-7 where 7 is extremely concerned). The average level of
concern dropped from 5 as recorded in the preliminary survey, to 2.93 during the interviews after the study. During the interviews most participants made comments like: “...
I didn’t feel more concerned about privacy, but it made me more aware about it”. The
distinction between concerned and aware can potentially be interpreted as a tendency
of the participants to self-censor their activities knowing that they are being monitored.
Although when asked explicitly only 14% of the participants said that they changed
their behavior due to the system that was put in place.
How others see me The actual comments that participants made about privacy varied
according to the different types of information that is captured. During the recruitment
phase, many participants expressed concerns about privacy regarding the conversation
detection system that was put in place, although it was made clear that no actual audio
recording would be involved. Surprisingly, at the end of the study, none of the participants expressed any strong concerns about the conversation detection sensing. The most
controversial piece of information that was captured was actually the desk occupancy
sensing. During the interviews those readings in particular were directly associated by
the participants with work performance. P2 mentioned “When the desk sensor says that
I am not on my desk, it does not mean that I don’t work”, while P11 mentioned “... often
I work from home, so the desk sensor did not mean much in my case”. P10 gives a better
explanation on what is the actual concern “if the statistics do not represent me the way I
would like to be represented then there is a problem. Then I will be concerned”. In fact,
most participants claimed that they would not like to be shown in rankings unless they
are in a high position. It is clear that the primary concern expressed by most participants
is the lack of boundary control over the input in the system. Some participants when
discussing possible changes they would like to see in the system, they suggest mechanism that could in fact mitigate such problems. P12 and P8 suggest the possibility of
adding comments on social data collected by the system: “it would be nice if we can
add a comment on the data explaining why I am away [...] And this can also provide
some information about context.”
Real behavior vs perception Motivated by the fact that one of the primary concerns
was about the implications that sensor data made about work performance, we analyzed
their markings in terms of privacy with respect to their working patterns. As during
the interviews the actual time that participants spent on their desk was proven to be a
controversial issue, we decided to estimate the correlation between their desk time and
the marking in terms of privacy, however the analysis showed no correlation (Fig. 5(b)).
Digging further, we tried to find other factors that are related to the picture of a “good
worker”. Figure 5(c) illustrates a comparison between the time people arrive in the
morning (the time distance from 9:00 am) and privacy concerns. The results identify
a strong correlation of the two values. Interestingly these results show that although
privacy concern can be related to arrival time, the complains were mostly about the
desk sensor readings. We attempt to explain the contradiction between the reported
concern during interviews and the results from the data analysis, by considering the
prior knowledge that users may have about particular pieces of information. Arrival
time does appear to be a privacy concern, but is never expressed as it is typically already
known to the participants’ colleagues. On the other hand, desk sensing appears to be
controversial irrespective of the actual readings, as this is a new piece of information
that becomes public.
Unanticipated usage Privacy issues can also be exacerbated by unanticipated uses of
the system. A case of a controversial use of the system occurred during the study. Participant P12, who had a significantly different working pattern than others, mentioned
an experience she had during the study: she was confronted by another participant about
her messing with his stuff, because the system recorded activity at his desk when she
was the only person in the lab. As expected, P12 gave the highest mark on privacy
concern for the system.
The privacy concerns expressed during the interview were significantly lower for the
“closed access” group. As expected the fact that data is shared only with close contacts
reduced the participants worries. However, when members of the open access group
were asked to suggest ways of mitigating privacy concerns they went beyond simply
controlling who has access to their sensed information. Most participants concentrated
on the input boundary, and how data stream can be switched on/off on demand. Many
participants acknowledged that either delivering false or ambiguous information would
reduce the usefulness of the system.
6.3
Interacting with the system
As part of the study a number of minor results were produced:
Usability The use of mobile phones for indoor localization proved to be a poor choice
in terms of usability. A significant number of participants complained about the requirement to carry their phone all the time. Such concerns were expressed primarily
by female participants explaining that they do not usually wear clothes with pockets.
Anecdotally we witnessed some participants carrying the phone in their hand during
the study. In contrast, participants made positive comments on the limited intrusiveness
of passive sensing: P16 brought as an example the desk sensor saying “I liked the fact
that it worked without having to carry anything”. P11 suggested a system where all the
functionality is encapsulated in a single device: “Something I can put on my desk and
make everything work”.
Data capture The participants were asked to mark on a 7-point Likert scale, how
much of their social life in the workplace was captured by the fusion of the deployed
sensor networks. The results was a rather high 5.18. Although many participants mentioned that the combination of the deployed technologies was enough to capture most
aspects of their social behavior, their experience was hampered by the limited scale of
the deployment. If more areas were instrumented and more people participated, the rating would have been higher. Participants P3, P5 and P7 said that it would have been
preferable if the context of social interactions were captured by the infrastructure (e.g,
detecting if a conversation is work related or not).
Interactivity Finally, participants, primarily from the students and researchers groups,
expressed a desire for more interaction with the system. Participants P4, P7, P8 and P9
argued that they would like to have notifications pushed to the mobile device when an
important social activity is detected by the deployed sensors. For instance, P4 asked to
be notified when members of his group are having a lunch-break or a meeting. Others
mentioned that they would like be able to actuate devices: for example to put their
phone in silent mode when in a meeting, or to automatically switch off lights when the
last person exits a room. These results further indicate that there is a need for additional
applications that can be built on top of our framework that further exploit the collected
information.
7
Discussion
Following the completion of the study we were in a position to identify key factors
that could affect the balance between perceived value and privacy intrusion in a social
network that relies on passive environmental sensing.
The introduction of environmental sensing into a social networking application disrupts the traditional, user-initiated input to social services. With respect to research
question 1, the key factor that affects the perceived value of the system is primarily
related to self monitoring and comparison with others. Although the public sharing of
information is the major factor that affects privacy concern (as contrasted by the low
privacy markings by the “closed access” group), at the same time it is one of the factors
that added more value to the experience of the participants. Sharing information with
others did not necessarily mean complete strangers, but rather colleagues that participants had only limited knowledge about their social behavior. To a significant extent
the value was mainly extracted by comparing “others” with themselves. At the same
time participants expect different levels of functionality for practical purposes, namely
real-time, accurate sensor readings, while social behavior is mainly related to either
aggregates, or generic trends for given groups of colleagues. Regarding research question 2, the primary causes of privacy concern relates to the lack of control over the
input stream, as an inherent aspect of passive sensing, and the limited control over the
possible interpretation of the sensed information by others.
In addressing research question 3, these observations allow us to identify possible
system design approaches that have the potential of improving acceptability of such
systems. We consider two main categories of data recipients within the system: close
social circle, and organization. For the close social circle the delivery of accurate realtime information is a service that can support the practical aspects of the system. As
this group is considered more trusted by the participants privacy concerns are typically
more relaxed. For the organization circle, it is important to maintain a certain level
of visibility in order not to diminish the value derived from “checking on others”, or
comparing attitudes with general trends. One of the key factors that affect the attitude
of users towards the system, is the perceived objectivity. Continuous passive sensing
means that people do not have the opportunity to either construct an image for their
social networking audience or control the details of what is revealed. Potential techniques for mitigating this aspect can include typical obfuscation mechanisms, although
the uniform obfuscation of all information could reduce the perceived value. Through
the study it became clear that people are happy to share aspects of their lives that show
a positive side of their social behavior. At the same time participants show an interest to
compare themselves with the general trends of people similar to them. Applying these
findings to the event distribution framework, could include the delivery of more accurate information for positive social situations, while data obfuscation and aggregation
could be applied to deliver general statistics for the whole population for comparative
reasons.
One obvious level of control that many participants requested, is a global “on/off”
switch to control the collection of data from the infrastructure. Furthermore, the request for people to access personal data before being released was also hinted by the
participants by requesting the ability to add comments to pieces of information. Possible techniques that could be used include delayed data delivery, in combination with
learning techniques that can detect unexpected behavior. Delaying the stream of potentially sensitive events for a period of time, allows the implementation of mechanisms
for tagging or deleting the information before it is publicized. However, the possibility
of allowing users to delete or alter information bears the risk of reducing trust to the
system and the validity of the reported data. The successful introduction of such mechanisms should only be considered with the appropriate modifications to the UI where,
for example, deleted or altered information is clearly marked.
The results of this study can only be considered within the context of the target
environment where it was executed. A research institution is typically more relaxed
compared to other working environments and this had a significant impact limiting
the concerns people had about the use of such technology for surveillance purposes.
Furthermore, the target country where the study was executed implies a specific cultural
and political context that affects the participants acceptability. We consider this study
as an early probe that will lead to long-term deployments of such systems in a wider
range of business environments as part of our future work.
8
Related Work
User studies in sensor enabled social networking have been primarily concerned with
location based services (LBS). Early work in the Reno system [13] considers the in-
volvement of the user in disclosing location to their friends. In [14], the authors investigate how and why people use LBS, concluding that main reason that LBS are popular is
that they provide both elements of fun and added value to the user. Other studies in the
field of social networks show similar findings [15,16]. We contribute to these findings
by understanding the value that users find in using sensor-rich social services in the
context of a working environment.
In terms of privacy, similar to our findings in [14] the authors concluded that users
had few privacy concerns when using an LBS system. This is contrary to previous
works [17,18] where it has been found that privacy implications can be a barrier on the
adoption of such services. In [17] the type of information that users were willing to
share with certain people was further examined. Finally, in [18] the authors found significant differences in privacy settings depending on whether this is for a given purpose
(e.g., work related) or just socially-driven. In [13] Mancini et al. explores the implications of location disclosure between family members and concludes that closer bonds
can increase privacy concerns. Our work builds on this literature by providing an understanding of privacy implications in a more challenging environment where sensors
are embedded in the environment. This is significantly different to LBS as such sensing
is inherently passive, performed without the explicit consent of the user.
Finally, apart from location based services, there are novel mobile phone applications where a variety of sensors is used to detect social interactions. In CenceMe [1]
the user’s mobile phone sensors (accelerometers, light, location, etc) are used to detect a range of social activities. In SoundSense [19], the microphone is used to classify
people’s social activities where as in emotionSense [9] the user’s conversations and
emotional status can be detected. In Sensible Organizations [10] wearable sensing devices were used to capture location information, conversation detection, and peoples’
co-location to be used for posterior analysis. Findings of such analysis include whether
a user carries a disease, the user’s financial status, productivity, or even her political
preferences. Clearly these applications are valuable to the researchers and the application developers but there is no indication about whether they are useful to the end users.
In this work we fill this gap by understanding the value and the privacy concerns from
the monitored user’s point of view.
9
Conclusions
Passive sensing can be considered an objective recorder of human behavior, as sensing
is not initiated by the user and therefore does not suffer from selective reporting. This
fact makes it a significant value multiplier for social networking services as users can
observe the real behavior of their colleagues; while at the same time raises significant
privacy concerns as users loose control over what is reported about their behavior. Our
empirical study of the introduction of a sensor-driven social sharing application within
a research institution illustrates the contradicting trends that affect acceptability of such
services. Users find value in comparing their behavior with others, typically not from
within their close social circle, while privacy concerns are raised when the system shares
behavior that is considered less favorable by the participants. In our future work we
intend to explore the feasibility of applying techniques to protect users’ privacy while
maintaining the value of such services.
References
1. Miluzzo, E., Lane, N.D., Fodor, K., Peterson, R., Lu, H., Musolesi, M., Eisenman, S.B.,
Zheng, X., Campbell, A.T.: Sensing meets mobile social networks: the design, implementation and evaluation of the cenceme application. In: SenSys ’08, New York, NY, USA, ACM
(2008) 337–350
2. Murty, R., Mainland, G., Rose, I., Chowdhury, A.R., Gosain, A., Bers, J., Welsh, M.: Citysense: An urban-scale wireless sensor network and testbed. In: 2008 IEEE International
Conference on Technologies for Homeland Security. (May 2008)
3. Wood, A., Virone, G., Doan, T., Cao, Q., Selavo, L., Wu, Y., Fang, L., He, Z., Lin, S.,
Stankovic, J.: ALARM-NET: Wireless sensor networks for assisted-living and residential
monitoring. University of Virginia Computer Science Department Technical Report (2006)
4. Kortuem, G., Kawsar, F., Fitton, D., Sundramoorthy, V.: Smart objects as building blocks for
the internet of things. IEEE Internet Computing 14(1) (2010) 44–51
5. Want, R., Hopper, A., Falcao, V., Gibbons, J.: The active badge location system. ACM
Transactions on Information Systems 10(1) (1992)
6. Li, I., Day, A., Forlizzi, J.: Understanding my data, myself: Supporting self-reflection with
ubicomp technologies. In: Proceedings of Ubicomp’11, Beijing, China. (2011) 405–414
7. Wu, L., Waber, B., Aral, S., Brynjolfsson, E., Pentland, A.: Mining Face-to-Face Interaction
Networks Using Sociometric Badges: Predicting Productivity in an IT Configuration Task.
In SSRN’08
8. Sewell, G.: The discipline of teams: The control of team-based industrial work through
electronic and peer surveillance. Administrative Science Quarterly 43(2) (June 1998)
9. Rachuri, K.K., Musolesi, M., Mascolo, C., Rentfrow, P.J., Longworth, C., Aucinas, A.: EmotionSense: a mobile phones based adaptive platform for experimental social psychology research. In: Ubicomp ’10, New York, NY, USA, ACM (September 2010) 281–290
10. Olguı́n, D.O., Waber, B.N., Kim, T., Mohan, A., Ara, K., Pentland, A.: Sensible organizations: technology and methodology for automatically measuring organizational behavior.
Trans. Sys. Man Cyber. Part B 39 (February 2009) 43–55
11. Altman, I.: Privacy regulation: Culturally universal or culturally specific? Journal of Social
Issues 33(3) (1977) 66–84
12. Palen, L., Dourish, P.: Unpacking “privacy” for a networked world. In: Proceedings of
CHI’03, Fort Lauderdale, FL, USA. (2003)
13. Mancini, C., Rogers, Y., Thomas, K., Joinson, A., Price, B., Bandara, A., Jedrzejczyk, L.,
Nuseibeh, B.: In the best families: tracking and relationship. In: Proceedings of ACM
CHI’11, Vancouver, Canada. (2011)
14. Lindqvist, J., Cranshaw, J., Wiese, J., Hong, J., Zimmerman, J.: I’m the mayor of my house.
CHI’11, IEEE, Vancouver, BC, Canada (2011)
15. Ames, M.: Why we tag: motivations for annotation in mobile and online media. In: In CHI
07: Proceedings of the SIGCHI conference, ACM Press (2007) 971–980
16. Lampe, C., Velasquez, A., Ozkaya, E.: Motivations to participate in online communities. In:
Computer Human Interaction. (2010) 1927–1936
17. Lederer, S., Mankoff, J., Dey, A.K.: Who wants to know what when? privacy preference
determinants in ubiquitous computing. In: CHI ’03 extended abstracts on Human factors in
computing systems. CHI EA ’03, New York, NY, USA, ACM (2003) 724–725
18. Tang, K.P., Lin, J., Hong, J.I., Siewiorek, D.P., Sadeh, N.: Rethinking location sharing:
exploring the implications of social-driven vs. purpose-driven location sharing. In: Proceedings of the 12th ACM international conference on Ubiquitous computing. Ubicomp ’10, New
York, NY, USA, ACM (2010) 85–94
19. Lu, H., Pan, W., Lane, N.D., Choudhury, T., Campbell, A.T.: Soundsense: scalable sound
sensing for people-centric applications on mobile phones. In: MobiSys ’09s, New York, NY,
USA, ACM (2009) 165–178


© Copyright 2026