
Separation of Water and Isopropyl Alcohol Mixtures with Graphene
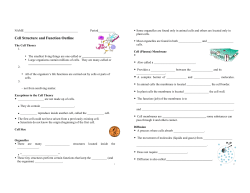
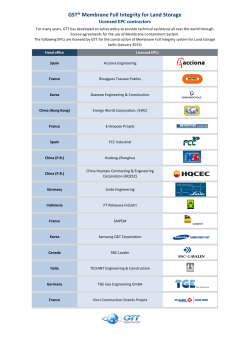
Proceedings of the 2nd International Conference on Fluid Flow, Heat and Mass Transfer
Ottawa, Ontario, Canada, April 30 – May 1, 2015
Paper No. 141
Separation of Water and Isopropyl Alohol Mixtures with
Graphene Oxide Membranes
Mindaugas Paulauskas, Frans Muller
Institute of Process Research and Development
Leeds, United Kingdom
[email protected]; [email protected]
Abstract- Hydrophilic, water selective, Graphene Oxide (G.O.) membranes were prepared by coating aqueous
G.O. solution on a hydrophilic PVDF (polyvinylidene fluoride) polymeric support. G.O. membranes were found to
provide competitive permeate flux and purity when compared to other state-of-the-art and commercial membranes.
Membranes were tested by pervaporation using water/isopropyl alcohol (IPA) mixtures at 50 to 70 °C. We observed
water fluxes ranging from 0.1 to 2 kg/m2/hr, with the water flux increasing linearly with water vapour pressure and
decreasing linearly with the thickness of the GO layer. The permeate consisted of 97.0 – 99.3 wt% water, with no
discernable trend line in the investigated temperature and membrane thickness region.
Nomenclature
𝐽
𝑘𝑚. 𝑝
𝛿𝐺𝑂
𝑃𝐿
𝑃𝑃
𝑥
𝑇
𝛾(𝑇)
∆W
VGO
𝐶𝐺𝑂
Permeability, kg/h/m2
Mass transfer coefficient, kg µm/h/m2/bar
Membrane thickness, µm
Water partial pressure on the liquid side, bar
Water partial pressure on the permeate side
Water mole fraction, dimensionless
Temperature, K
Water activity coefficient at temperature 𝑇, dimensionless
Weight difference, mg
Volume of the G.O. solution, L
Concentration of the G.O. solution, mg/L
1. Introduction
Concentration driven separation using membranes with ultra – fast water permeation rates and high
selectivities are highly sought after in the chemical industry. Currently, polymeric membranes exhibit
high selectivities and economically feasible transport rates (White, 2006). However, they are prone to
rapid degradation during the membrane surface cleaning operation and swelling if exposed to organic
solvents at elevated temperatures (Van der Bruggen et al., 2008, Ulbricht, 2006). Porous inorganic
membranes (ceramic, zeolite) have circumvented these issues. They tend to have good chemical
compatibility with organic materials across a wide range of temperatures and a strong rigid structure able
to withstand harsh environments.(van Veen et al., 2011). However, their manufacturing process is time
consuming and complex resulting in a high cost, which limits their economic feasibility in the chemical
industry.(Choi et al., 2006, van Veen et al., 2011, Verweij, 2012) In 2012 ,(Nair et al., 2012) reported a
submicron thick G.O. membrane capable of facilitating highly selective water transport. Since then,
highly selective and cheap G.O. has caught researcher attention as a potential hydrophilic membrane
material (Huang et al., 2014a).(Yeh et al., 2013, Liu et al., 2014, Huang et al., 2014b).
141-1
The main aim of our research is to investigate water flux and permeate purity via pervaporation
through G.O. – PVDF membranes and evaluate the competitiveness of GO membranes with commercial
membranes.
2. Theory
Typically, G.O. is obtained by an oxidation of graphite using Hummers method or Improved
Hummers method (Hummers and Offeman, 1958, Chen et al., 2013, Marcano et al., 2010) The method
uses Sulphuric acid, H2SO4, Sodium Nitrate, NaNO3, and Potassium Permanganate, KMnO4 all of which
are mass produced chemicals and can be purchased at a low price. The oxidised graphite is then exfoliated
to yield G.O. suspension containing predominantely single layer sheets. This, in turn, can be used to
produce a semipermeable hydrophilic membrane with an extraordinary affinity for water.(Nair et al.,
2012). The permeability has been attributed to the formation of nanoscale wrinkles and structural defects
in the basal plane of the G.O. material which is a result of the amorphous oxygenated regions.(Huang et
al., 2013) Interestingly, no gas molecules like helium can pass through the membrane.(Nair et al., 2012)
The key membrane performance characteristics are permeation flux and permeate purity which are
affected by: i) mass transport through the liquid boundary layer, ii) preferential sorption of the permeating
species into a membrane matrix, iii) diffusion through the GO layer, iv) desorption from the GO layer, v)
vapour transport through a porous PVDF support, vi) mass transport through a vapour boundary
layer.(Baker, 2004) All of these steps can be mathematically combined (Wijmans and Baker, 1995) to
yield the solution diffusion model, which stems its roots from the Fick’s law. An alternative version of the
solution – diffusion model is shown in equation (1).
𝐽 = 𝑘𝑀.𝑃 /𝛿𝐺𝑂 ∗ (𝑃𝐿 − 𝑃𝑃 )
(1)
1838.675
𝐽 = 𝑘𝑀.𝑃 /𝛿𝐺𝑂 (𝑥𝑤𝑎𝑡𝑒𝑟 ∗ 𝛾𝑤𝑎𝑡𝑒𝑟 (𝑇)105.40221− −31.737+𝑇 )
(2)
In this equation (1), 𝐽 is the permeation flux (kg/h/m2), 𝑘𝑀.𝑃 is the permeation coefficient, which is
the product of all aforementioned parameters involved in the membrane permeation flux and permeate
purity (kg µm/h/m2/bar) and 𝛿𝐺𝑂 is the membrane thickness (µm). 𝑃𝐿 − 𝑃𝑃 is the permeation driving
force expressed as the difference of the partial pressure of water on the liquid and vacuum sides
respectively (bar). The absolute pressure on the permeate side is significantly smaller than the water
vapour pressure on the process side, and can thus ignored as a contributing factor. Further in equation
Error! Reference source not found., 𝑥 is the water mole fraction in the fluid, 𝑇 is the temperature of the
liquid on the process side (K), and 𝛾(𝑇) is water activity coefficient (dimensionless). 𝛾(𝑇) is computed
from the NRTL model using Aspen Plus.
3. Experimental
3. 1. Membrane Coating
A circular hydrophilic polyvinylidene fluoride (PVDF) membrane (GVWP04700 Durapore,
purchased from Millipore). was placed in the middle of a three piece Whatman filter funnel (70mm
diameter, 210 mL reservoir volume). The funnel was filled with 20 ± 1 mL of DI water to pre-wet the
PVDF membrane. A vacuum was applied to initiate filtration. Once the water passed through the filter the
vacuum was switched off and the funnel was filled with a desired amount of G.O. suspension (±1 mL)
obtained from Graphene Supermarket (3 – 25 mg/L diluted with deionised water) . To filter the G.O.
suspension the vacuum was applied either by water vacuum tap (460 mbar) or by vacuum pump
(10 mbar); the vacuum was measured using manometer (FB57057 Fisher Scientific). As the liquid passed
through the PVDF a graphene oxide film was deposited on the surface. On completion of the filtration,
the three piece filter funnel was disassembled and the membrane was carefully removed and placed in an
oven (STATUS) at 76 °C for at least 2 h. This produced golden - brown graphene oxide coating on a
141-2
PVDF polymeric support. The thickness of the membrane was varied by changing the amount of the G.O.
used to produce the film.
The concentration of the G.O. suspension was determined by measuring the weight gain of a support
membrane after G.O. coating with a known volume of GO suspension. A fresh PVDF membrane was
weighted using a Mettler Toledo AB 304 S microbalance with an accuracy of ±0.1 mg before and after
the coating process described in section 3.1. The concentration of the GO solution can be calculated using
equation Error! Reference source not found.:
∆W
𝐶𝐺𝑂 = V
(3)
GO
Where ∆W is the weight difference (mg), VGO is the suspension volume used to produce a
membrane (L), and 𝐶𝐺𝑂 is the concentrantion of the G.O. solution (mg/L). Thereafter, thickness of the
films were calculated by diving the mass placed on the support polymer by the surface area coated and the
G.O. density.
3. 2. Pervaporation
The pervaporation setup used in all experiments is
shown in Fig. 1. It compromises of: i) a conical flask
(250 mL) which was used as a feed tank (T1) ii) a pump
P1, (Knauer Smartline two piston pump) to circulate the
fluid through the cell, iii) a back pressure regulator BPR
(2.8 bar) was used to keep the system from boiling. (iv)
In – house developed agitated stainless steel
pervaporation cell PERVAP (74 mL,9.08 cm2 active
membrane surface area). Agitation in the cell was
provided by a magnetic stirrer bar rotating at 900 rpm.
and iv) the permeate side is connected to two cold traps
TRAP1 and TRAP2 which were set – up in parallel to
ensure continuous operation. Liquid nitrogen was used
as a cooling liquid for the permeate condensation (-195
°C). The vacuum side pressure was set at <5 mbar at all
times using vacuum pump P2, (EDWARDS RV3).
Fig. 1. – Pervaporation setup
A conical flask,T1, was filled with 65 ± 1 mL of
deionised water and 150 ± 1 mL IPA, analytical grade purchased from VWR International, resulting in a
30 wt% water/IPA solution. A vacuum on a pervaporation cell vacuum side was then applied by
EDWARDS RV3 vacuum pump, P2. Once < 5 mbar pressure was reached on the vacuum side of the
pervaporation cell the process fluid pump P1 was used to fill the process side with the water/IPA solution.
The full pervaporation cell was then placed in a hot oil or water bath set at 50 – 70 °C. This was
followed by approximately 1 hour of pre – equilibrium stage allowing pervaporation cell to reach process
temperature and pervaporation flux gain steady state. Thereafter, samples were taken every 1 – 3 hours
and analysed by Karl Fischer (Metler Toledo DL38) and GC (HP 6890Series coupled with HP5 30m
length, 0.25 µm film thickness, reversed – phase column).
4. Results and Disccusion
4. 1. Effect of Liquid Side Water Vapour Pressure on Water Flux And Permeate Purity
To gain an insight into the G.O. – PVDF membrane permeation performance in a presence of 30
wt% water/IPA mixture pervaporation tests were performed in a temperature range of 50 – 70 °C. To test
if the GO membrane behaviour is consistent with equation (1), the pervaporation flux through a
141-3
60
40
20
0
0.05
a)
0.1
0.15
0.2
0.25
20
18
16
14
12
10
8
6
4
2
0
0.3
Partial Pressure of Water (bar)
Pervaporation Flux
Permeate Purity
b)
100
80
60
40
20
Permeate Purity (wt%)
80
Flux [kg/m2/h/bar]
100
2.0
1.8
1.6
1.4
1.2
1.0
0.8
0.6
0.4
0.2
0.0
Permeate Purity (wt%)
Flux (kg/h/m2)
membrane with a 2.1 µm GO layer is plotted first against the driving force PL(Figure 2, a). The permeate
flux increases linearly with the driving force PL, whilst maintaining the purity of the water on the permeate
side at unpresedented levels between 97.9 to 99.5 w%. In all experiments the observed permeate quality
was considered to be very pure and is comparable purity with other research or commercial
membranes.(Han et al., 2014, Qiao et al., 2005) The variations in water purity do not follow any observed
trend. and are most likely caused by a variation in the membrane quality.
0
0.2
0.7
1.2
1.7
2.2
Inverted Membrane Thickness (1/μm)
Thickness (1/μm)
Purity (wt%)
Fig. 2. a) Pervaporation Flux vs Partial Pressure (2.1 um), b) Pervaporation Flux vs Thickness
4. 2. Effect Of Membrane Thickness On Water Flux And Permeate Purity
To test pervaporaton flux change with respect to the membrane thickness the pervaporation flux in
equation (2) was divided by the partial pressure of water over the solution to yield equation Error!
Reference source not found.:
𝐽
𝑃𝐿
= 𝑘𝑀.𝑃
1
𝛿𝐺𝑂
(4)
To test the impact of GO layer thickness, we evaluated the flux at different temperatures for a
range of 3 different membranes (
Fig. 2, b). The pervaporation flux linearly increased with a decrease in the selective membrane layer
which was anticipated and is in agreement with well established membrane research.(Wijmans and Baker,
1995) Pervaporation flux was extremely high with a pervaporation constant 𝑘𝑀.𝑃 having a value of 12.4
kg μm/h/m2/bar) ± 24%;. It was estimated that a 1.2 μm membane at one bar pressure and 30 wt% water
in IPA would result in a 10 kg/h/m2 water flux.
The purity of the permeate remained high in the entire region studied and was in a range of 97 – 99
wt%; There was, again, no observable trend for the permeate purity in the studied thickness range.
5. Conclusions
Hydrophilic water selective G.O. membranes were successfully coated on a hydrophilic PVDF
support layer. The GO layer was stable in a temperature range of 50 – 70 °C. Pervaporation tests with the
membranes demonstrated excellent, and consistently high (>97%) water purity of the permeate and high
water transport fluxes. The highest pervaporation flux was found to be 1.87 kg/h/m2 and a permeate purity
of 97.04 wt%. using 1 μm G.O. membrane at 60 °C. The water flux was modelled as function of water
vapour pressure and GO layer thickness. The model indicates GO membranes can potentially reach a
141-4
water flux greater than 10 kg/h/m2 at submicron thick GO layers, making them comparable to the
commercial and the state-of-the-art membranes.(Qiao et al., 2005)
Acknowledgements
The research was conducted at the University of Leeds Institute of Process Research and
Development (IPRD) and supported by the Engineering and Physical Sciences Research Council
(EPSRC). I would like to thank to my former supervisor Simon Biggs and current second supervisor
Charlotte Willans.
Reference
Baker R. 2004, Membrane Technology And Applications, 2nd Edition, John Wiley & Sons.
Chen J., Yao B., Li C. & Shi, G. 2013, An Improved Hummers Method for Eco-Friendly Synthesis of
Graphene Oxide, Carbon, 64, 225-229.
Choi H., Stathatos E. & Dionysiou D. D. 2006, Sol–Gel Preparation of Mesoporous Photocatalytic Tio2
Films and Tio2/Al2o3 Composite Membranes for Environmental Applications, Applied Catalysis B:
Environmental, 63, 60-67.
Han Y-J., Wang K-H., Lai J-Y., and Liu Y-L. 2014, Hydrophilic Chitosan-Modified Polybenzoimidazole
Membranes For Pervaporation Dehydration Of Isopropanol Aqueous Solutions, Journal Of
Membrane Science, 463, 17-23.
Huang H., Song Z., Wei N., Shi L., Mao Y., Ying Y., Sun L., Xu Z. & Peng X. 2013, Ultrafast Viscous
Water Flow Through Nanostrand-Channelled Graphene Oxide Membranes, Nat Commun, 4.
Huang H., Ying Y. & Peng X. 2014a, Graphene Oxide Nanosheet: An Emerging Star Material for Novel
Separation Membranes, Journal Of Materials Chemistry A, 2, 13772-13782.
Huang K., Liu G., Lou Y., Dong Z., Shen J. & Jin W. 2014b, A Graphene Oxide Membrane with Highly
Selective Molecular Separation of Aqueous Organic Solution, Angewandte Chemie International
Edition, 53, 6929-6932.
Hummers W. S. & Offeman R. E. 1958, Preparation of Graphitic Oxide, Journal of the American
Chemical Society, 80, 1339-1339.
Liu R., Arabale G., Kim J., Sun K., Lee Y., Ryu C. & Lee C. 2014, Graphene Oxide Membrane For
Liquid Phase Organic Molecular Separation, Carbon, 77, 933-938.
Marcano D. C., Kosynkin D. V., Berlin J. M., Sinitskii A., Sun Z., Slesarev A., Alemany L. B., Lu W. &
Tour J. M. 2010, Improved Synthesis Of Graphene Oxide, Acs Nano, 4, 4806-4814.
Nair R. R., Wu H. A., Jayaram P. N., Grigorieva I. V. & Geim A. K. 2012, Unimpeded Permeation of
Water Through Helium-Leak–Tight Graphene-Based Membranes, Science, 335, 442-444.
Qiao X., Chung T.-S., Guo W. F., Matsuura T. & Teoh M. M. 2005, Dehydration of Isopropanol and its
Comparison with Dehydration of Butanol Isomers from Thermodynamic and Molecular Aspects,
Journal Of Membrane Science, 252, 37-49.
Ulbricht M. 2006, Advanced Functional Polymer Membranes, Polymer, 47, 2217-2262.
Van Der Bruggen B., Mänttäri M. & Nyström M. 2008, Drawbacks of Applying Nanofiltration and How
to Avoid Them: A Review, Separation And Purification Technology, 63, 251-263.
Van Veen H. M., Rietkerk M. D. A., Shanahan D. P., Van Tuel M. M. A., Kreiter R., Castricum H. L.,
Ten Elshof J. E. & Vente J. F. 2011, Pushing Membrane Stability Boundaries with Hybsi®
Pervaporation Membranes, Journal Of Membrane Science, 380, 124-131.
Verweij H. 2012, Inorganic Membranes, Current Opinion In Chemical Engineering, 1, 156-162.
White L. S. 2006, Development of Large-Scale Applications in Organic Solvent Nanofiltration and
Pervaporation for Chemical and Refining Processes, Journal Of Membrane Science, 286, 26-35.
Wijmans J. G. & Baker R. W. 1995, The Solution-Diffusion Model: A Review, J. Membr. Sci., 107, 1-21.
Yeh T.-M., Wang Z., Mahajan D., Hsiao B. S. & Chu B. 2013, High Flux Ethanol Dehydration Using
Nanofibrous Membranes Containing Graphene Oxide Barrier Layer, Journal Of Materials Chemistry
A.
141-5


© Copyright 2026