
Document 93424
JAMES M. POTERBA
MassachusettsInstituteTechnology
ANDREW A. SAMWICK
Dartmouth College
Stock Ownership Patterns,
Stock Market Fluctuations, and
Consumption
the last year has raisedthe total value of corporate
stock in the United States by nearly a trillion dollars. While many
analystshave tried to explain or interpretthe recent movementsof the
stock market, there has been less attentionto the link between rising
stock prices and real economic activity. How are the gains from an
increasein shareprices distributedacrosshouseholds?Whatfractionof
these gains accrues to a small set of wealthy investors?How do rising
stock prices affect consumerspending?
The standardtextbooktreatmentof aggregateconsumptionholds that
consumptiondepends on labor income and financialwealth.' The marginal propensity to consume out of wealth is typically taken to be
approximately0.04 per year. In this framework,the wealth effect of a
stock marketrally should have an importantstimulativeeffect on consumption.Althoughthis view neglects some potentiallyimportantfactorsthatmight also affect consumptiondirectly(notably,the possibility
that stock prices may rise as a result of a decline in real interestrates),
THE BULL MARKET of
We are gratefulto Rochelle Antoniewicz, JohnCampbell,Joel Dickson, JerryHausman, N. Gregory Mankiw, Thomas Morley, Chris Probyn, James Shapiro, Robert
Shiller, AndreiShleifer, David Shulman,ChristopherSims, JustinSmith, MarthaStarrMcCluer, David Wilcox, and participantson the BrookingsPanel and at a seminarat
the FederalReserve Boardfor helpful discussions. We also thankAlex David for data
on share repurchasesand, especially, ArthurKennickellfor assistance with the 1992
Survey of ConsumerFinances. This researchwas supportedby the National Science
Foundation.
1. See, for example, Dornbuschand Fischer(1994).
295
296
BrookingsPapers on EconomicActivity, 2:1995
many economic forecastersembracethe textbook view. For example,
a recent Wall Street research report explains that "as long as asset
prices are rising, the risk of a significantdrop in consumerspendingis
small," and notes that the rising numberof stockholdershas "made
real economic activity more tied to the performanceof financialassets
than ever before."2
This paperdescribes the changingpatternof stock ownershipduring
the last three decades, investigates whether changing ownership patterns have, in fact, altered the links between stock values and consumption,and explores the "wealth effect" of stock price fluctuations.
At the outset it is importantto recognize that an increase in consumer
spendingfollowing a rise in shareprices could be attributableto either
of two factors. First, stock prices may rise in anticipationof strong
economic activity, including consumer spending. The role of share
prices as a leading indicatoris well documented.In this case changes
in stock marketvalues are not a source of subsequentchanges in consumption, but merely an indicator that subsequent changes are expected. A second, and not necessarily exclusive, link between stock
prices and consumptionis the wealth effect; that is, changes in share
values cause changes in consumption by relaxing the resource constraintsthat households face. Over long horizons, theremust be such a
wealth effect; we consider whether there is also an importantwealth
effect on consumptionat horizons of one to four quarters.It is difficult
to distinguishbetween the leading indicatorand causativeviews of the
relationshipbetweenshareprices andconsumptionbecausethis requires
identifying autonomousmovements in share prices that are not attributable to changing expectations of futuredividends or interestrates.
This paperpresents new evidence on the association between share
price movements and consumption. It summarizesthe changes in consumptionthathave typically followed substantialchanges in stock market values, and presentsseveral tests directedat disentanglingthe leading indicatorand wealth effect views. If the leading indicatorview is
correct, the patternof consumptionchanges following stock price fluctuations should be independentof the distributionof stock ownership
and there is no reason to expect differentconsumptionresponses from
householdsthat do and do not own corporatestock. This paperpresents
2. Shulman,Usem, and Brown (1995).
James M. Poterba and AndrewA. Samwick
297
empiricaltests of both of these propositions. It finds little evidence of
an importantwealth effect of share prices on consumption.The strong
positive correlationbetweenconsumptiongrowthandlagged stock market returns,therefore, appearsto be primarilydue to the leading indicator featureof stock price movements.
We begin by placing the 1995 stock marketincrease in context. We
reporton the evolution of price-to-dividendand price-to-earningsratios, Tobin's q, and the ratio of stock marketvalue to GDP duringthe
post-World War II period. Some of these measures, notably Tobin's
q, suggest that the stock marketof 1995 is at a postwarvaluationhigh.
Others, notably the price-to-earningsratio, suggest a less extreme situation.
We next investigate the fraction of stock marketcapital gains that
accrue directly to individual investors, in contrastto gains that accrue
to them indirectly, through financial intermediariessuch as defined
benefit pension plans or life insurancecompanies. A range of recent
behavioralmodels of consumptionsuggest thatthe marginalpropensity
to spend out of different types of assets depends not only on their risk
and returncharacteristics,but also on the way in which they are held.3
Households may exhibit lower marginalpropensitiesto spend out of
capital gains on assets that are held in retirementplans than on assets
that are held directly.
Popular discussions sometimes note that the fraction of corporate
stock owned by householdshas declined duringthe postwarperiod and
is currentlyless than 50 percent.4In fact, the principalpostwar trend
has been away from direct individual stock ownership and toward indirect ownership throughvarious financial intermediaries.This paper
reanalyzesthe widely cited Flow of Fundsdata of the FederalReserve
Boardthat show householdsowning less than50 percentof outstanding
shares. Combining individual ownership of equities through mutual
funds, definedcontributionpension plans, and other financialintermediaries, it is apparentthat individuals have direct control over nearly
two-thirdsof outstandingcorporatestock.
To describe the changing incidence of stock ownershipwe examine
3. Thaler(1994) providesa summaryof this literature.
4. See, for example, "IndividualsLose MarketShare," New YorkTimes, July 18,
1995, p. D21, and "Small Investor Continuesto Give Up Controlof Stocks," Wall
StreetJournal, May 11, 1992, p. C1.
298
BrookingsPapers on EconomicActivity, 2:1995
data from the 1962 Survey of FinancialCharacteristicsof Consumers,
and the 1983 and 1992 Surveys of ConsumerFinances. While share
ownership patternschanged relatively little between 1962 and 1983,
therehas been a substantialincrease in the prevalenceof shareownership duringthe last decade. This growth is the result of rising rates of
indirect share ownership. The fraction of stock held by the largest
stockholders,those in the top 0.5 percentof the distributionof equity
investors, has also declined duringthis period.
To develop evidence that can distinguish between the leading indicator and the wealth effect views of how shareprices affect consumption, the paper explores the correlationbetween stock returnsand the
compositionof consumerspending. If there is a wealth effect, positive
stock returnsshould increase the share of consumptionaccountedfor
by luxury goods. We consider aggregatedata on several categories of
consumption that are disproportionatelypurchased by high-income
households, including "upperluxury" vehicles, andfindlittle evidence
that luxury spending rises in the wake of rising stock prices.
The paper considers whether changing patternsof stock ownership
affect the linkages between consumptionand stock marketfluctuations.
The leading indicatorview suggests that ownershippatternsshould not
affect this relationship, while the wealth effect at least admitsthe possibility. We explore the effect of changes in stock prices, as well as
changesin the dividend-to-priceandearnings-to-priceratios, on various
measures of consumption.5We recognize that stock prices and consumptionarejointly determined,and simply try to describethe typical
patternof economic activity following substantialstock price movements. Ourresults suggest thatchanges in stock prices have significant
predictivepower for futureconsumptionspending. A permanentstock
price rise of 17 percent (roughly the same magnitudeas the price increase in the first six months of 1995) forecasts an increase of about
1.1 percent in consumption in mid-1996, relative to what it would
otherwisehave been. Increases in consumerspendingon new automobiles and other durableswould be particularlylarge.
We find little evidence to suggest thatthe shift fromdirectto indirect
ownershipof corporatestock has alteredthe link between stock price
5. Fama(1981), FischerandMerton(1984), andBarro(1990) also estimatereducedform equations measuringthe predictivepower of stock price movementsfor various
macroeconomicaggregates.
James M. Poterba and AndrewA. Samwick
299
fluctuationsand consumptionspending, and more generally, little evidence of an importantwealth effect on consumption. Since the timeseries variationin the patternof corporatestock ownershipyields tests
with low statisticalpower, we also use household survey datafrom the
Panel Study of Income Dynamics to comparethe correlationbetween
stock marketfluctuationsand growth in consumptionfor stockholders
with direct and indirectholdings. We find some evidence that the consumptionof individuals who hold stocks throughthrift plans, such as
401(k)s, 403(b)s, and ESOPs, is more sensitive to stock price movements than the consumptionof those who do not hold any stock; but
once again, the available tests have low power.
We do not find any evidence that the effect of share prices on consumption depends on the source of stock price movements. This is
somewhatsurprising,given the substantialbody of researchin financial
economics suggesting that price fluctuationsthat change the value of
the dividend-to-priceor earnings-to-priceratios are often reversedover
a period of several years.
Recent Stock Market Fluctuations in Perspective
The stock markethas climbed to record heights in the last year. In
the six monthsafterthe Dow Jones IndustrialAverage firstreachedthe
historic four thousandlevel on February23, 1995, it climbed another
seven hundredpoints. And before the end of 1995, the Dow index had
closed at well above five thousand. Between January1 and June 30,
1995, the Standardand Poor's 500-stock index (S&P 500) rose by
nearly 17 percent.6Although the news media have depicted the recent
bull marketas unprecedented,recent returnsare not extraordinary.In
twenty of the sixty-eight years between 1926 and 1993, the real return
on stocks of large corporationsexceeded 20 percent. In five of those
years the real returnexceeded 40 percent.7
To provide backgroundfor analyzing the aggregateeffects of stock
price movements, table 1 presentsseveral summarystatistics. The first
column shows the real value of the S&P 500 in units comparableto its
6. We calculate this as ln(539.4/455.2) = 0. 1697, which we approximateas 17
percent.
7. These statistics are based on IbbotsonAssociates (1994).
300
BrookingsPapers on EconomicActivity, 2:1995
Table 1. Real Valueof the Stock Market, 1955-95
Unitsas indicated
Year
Real value
of S&P 500"
1955
253.4
...
1,643.5
1956
1957
1958
1959
1960
1961
1962
1963
1964
1965
1966
1967
1968
1969
1970
1971
1972
1973
1974
1975
1976
1977
1978
1979
1980
1981
1982
1983
1984
1985
1986
1987
1988
1989
1990
1991
1992
1993
1994
1995c
251.9
212.6
277.1
300.7
285.3
358.0
308.5
359.3
402.8
431.8
370.1
420.8
449.0
361.8
338.7
361.2
413.9
307.1
193.5
239.3
269.2
226.2
212.5
210.4
231.5
197.1
213.8
242.9
233.8
283.9
336.8
312.6
343.5
413.8
367.8
421.8
459.6
478.4
455.2
539.4
-0.6
- 15.6
30.3
8.5
-5.1
25.5
- 13.8
16.5
12.1
7.2
- 14.3
13.7
6.7
- 19.4
- 6.4
6.6
14.6
- 25.8
- 37.0
23.7
12.5
- 16.0
-6.0
- 1.0
10.1
- 14.9
8.4
13.6
- 3.7
21.4
18.6
- 7.2
9.9
20.5
-11.1
14.7
9.0
4.1
-4.9
18.5
1,712.1
1,479.9
2,039.2
2,169.8
2,134.7
2,710.7
2,339.0
2,719.3
3,105.6
3,459.7
3,005.0
3,687.8
4,200.4
3,374.7
3,164.8
3,597.0
3,978.3
2,875.5
1,730.4
2,158.4
2,721.8
2,271.9
2,191.9
2,293.7
2,662.2
2,265.5
2,471.2
2,837.1
2,631.3
3,232.3
3,743.8
3,604.9
3,849.9
4,522.7
3,949.7
5,279.8
5,763.2
6,352.0
6,048.8
7,167.8
Percentagechange
in real S&P 500
Real valueof
corporatestock"
Source: Data on the S&P 500 and the CPI-U are from Data Resources Inc. The real value of corporate stock is from the
Federal Reserve, Flow of Funds Accounts.
a. Real S&P 500 is benchmarked for June 1995. Earlier values are computed using the average S&P index for each
December and the CPI-U.
b. Billions of 1994 dollars.
c. Entries for 1995 relate to June; the real value of corporate stock for this year is the authors' estimate.
James M. Poterba and AndrewA. Samwick
301
1994 value. The second column presents the real annual percentage
change in the index. This column does not correspondto the returnon
the marketbecause it excludes income from dividends. It confirmsthat
there have been other years with returnscomparableto those in 1995.
The thirdcolumn shows the real value of corporatesharesat the end of
each year, in 1994 dollars, as reportedin the Flow of Funds accounts.
Real equity values increasedby morethan$ 1.1 trillionin the six months
ending June 30, 1995.8
While the increase in shareprices duringthe last year is not unprecedented, some measuresof stock marketvaluationdo suggest that the
stock marketis currentlyat a post-World WarII high. Table 2 reports
four different valuation measures. The first column shows the ratio of
the marketvalue of corporatestock to GDP. On June 30, 1995, this
ratio was 1.039, a level that has been exceeded only once since the
early 1950s, in 1968. It has more than doubled in just over ten years.
The table records one previous move of similar magnitude, when the
ratio doubled between the early 1950s and the early 1960s.9
The second column of table 2 shows the year-endprice-to-earnings
ratio for the S&P 500; this ratio is also plotted in figure 1. Price-toearningsratiosdo not suggest that stocks are currentlyat historichighs.
The recent stock price rise has coincided with rapidly increasingcorporateearnings, so that while the price-to-earningsratio in mid-1995
(16.3) is above its postwaraveragevalue, it is substantiallylower than
at the end of 1991 (26.2) or of 1992 (22.8). Since late 1991 shareprices
have increased by nearly 30 percent, while earnings have more than
doubled. Because earnings fluctuatesubstantiallyfrom year to year, it
can be helpful to construct alternativevaluation measuresthat divide
share prices by a moving average of real earnings. We do this with a
ten-year arithmetic average of real earnings for the S&P 500. The
8. The change in the marketvalue of equity duringany periodreflectsthe change in
the value of the shares that were outstandingat the beginning of the periodplus the
valueof any new sharesissuedduringthe period.If firmsare issuingsubstantialamounts
of new equity, changes in the marketvalue of stock can overstatethe rateof shareprice
appreciation.In each quarterof 1994 and in the first two quartersof 1995, however,
nonfinancialcorporationswere net repurchasersof shares, so this concern does not
apply.
9. A similar patternemerges if we consider the marketvalue of corporateequity
plus an estimateof the marketvalue of corporatedebt, which is computedby capitalizing
corporateinterestpaymentsby the BAA bond rate, relativeto GDP.
302
Brookings Papers on Economic Activity, 2:1995
Table2. RelativeMeasures of CorporateShare Values, 1947-95
Unitsas indicated
Year
1947
1948
1949
1950
1951
1952
1953
1954
1955
1956
1957
1958
1959
1960
1961
1962
1963
1964
1965
1966
1967
1968
1969
1970
1971
1972
1973
1974
1975
1976
1977
1978
1979
1980
1981
1982
1983
1984
1985
1986
1987
1988
1989
1990
1991
1992
1993
1994
1995d
Market
valueof
shareslGDP"
...
...
...
...
...
0.470
0.450
0.628
0.709
0.723
0.625
0.834
0.851
0.832
0.989
0.820
0.908
0.981
1.006
0.838
1.000
1.090
0.868
0.820
0.880
0.899
0.633
0.399
0.481
0.578
0.460
0.421
0.456
0.542
0.459
0.504
0.541
0.478
0.570
0.637
0.593
0.614
0.713
0.631
0.839
0.885
0.955
0.877
1.039
Price-to-earnings
ratio'
9.5
6.6
7.2
7.2
9.7
11.1
9.9
13.0
12.6
13.7
11.9
19.1
17.7
17.8
22.4
17.2
18.7
18.6
17.8
14.5
18.1
18.0
15.9
18.0
17.9
18.4
12.0
7.7
11.3
10.8
8.7
7.8
7.3
9.2
8.0
11.1
11.8
10.1
14.5
16.7
14.1
11.7
15.5
15.5
26.2
22.8
21.3
15.0
16.3
Price-to-dividend
ratio"
18.0
16.0
14.8
13.8
16.7
18.3
17.2
22.5
24.1
23.6
21.6
30.0
31.5
29.3
35.1
29.4
32.0
32.8
32.8
27.9
32.4
34.1
28.4
28.9
32.3
37.0
27.0
18.4
24.2
25.5
19.6
18.5
18.1
21.1
18.0
20.3
23.2
21.4
25.8
29.6
27.0
27.2
30.0
26.7
32.2
34.5
36.8
34.4
39.2
Tobin'sq
0.437
0.396
0.418
0.475
0.510
0.483
0.452
0.656
0.756
0.742
0.593
0.819
0.830
0.808
0.954
0.832
0.942
1.056
1.080
0.897
1.070
1.111
0.846
0.778
0.828
0.835
0.575
0.319
0.390
0.470
0.371
0.343
0.350
0.413
0.336
0.360
0.417
0.387
0.472
0.556
0.574
0.617
0.761
0.733
1.068
1.264
1.361
1.268
1.467
Source: Market value of stock is from Federal Reserve, Flow of Funds Accounts. Price-to-earnings and price-to-dividend
ratios are from Data Resources Inc. Tobin's q is from the Balance Sheetsfor the U.S. Economy'.
a. The market value of corporate stock (year-end value) divided by the fourth-quarterGDP for each year.
b. The price-to-earnings ratio for the S&P 500, averaged for the last month of each calendar year.
c. The price-to-dividend ratio for the S&P 500, averaged for the last month of each calendar year. The price-to-dividend
ratio is the market value of equity in nonfinancial corporations divided by the replacement cost of their net assets, net of
debt outstanding.
d. Tobin's q for June 1995 is estimated by the authors.
James M. Poterba and AndrewA. Samwick
303
Figure 1. Price-to-Earningsand Price-to-DividendRatios for the S&P 500, 1947-95
Ratio
Price-to-dividend
ratio
35
3025-
A
20 -
15
Vr~
Price-to-earnings
,r/
I
\
ratio
10
V J~V
5 I-
I
1950
I
1955
I
1960
I
1965
I
1970
I
1975
1980
I
1985
I
1990
1
1995
Source: Data Resources Inc.
resultingP-Eavgratio is 22.3 at the end of June 1995, up from 9.8 in
1980, 11.9 in 1985, and 15.7 in 1990. The June 1995 value is higher
than any year-end value in the 1990s, although it is not the highest
value recorded in the postwar period; it reached 23.3 at the end of
1965.10 Nevertheless, this valuationindicatorsuggests thatstock prices
are high, relative to historical patterns.
The rise in corporate earnings is evident in the national income
accounts where corporateprofits adjustedfor capital consumptionand
inventoryvaluationhave increasedas a shareof GNP from 5.6 percent
in 1991 to 7.2 percentin 1994. The rateof returnon tangibleassets has
also increased. Table 3 presentsrecentestimatesof a standardmeasure
of the pretax rate of returnon the tangible assets of nonfinancialcor10. The values of PIEavgfor the early 1990s are as follows: 1990 = 15.7, 1991 =
18.4, 1992 = 20.3, 1993 = 21.2, and 1994 = 19.9.
Table3. Rates of Return to NonfinancialCorporateCapital, 1947-95a
Percent
Year
Unadjusted rate
Cycle-adjusted rate
1947
1948
1949
1950
1951
1952
1953
1954
1955
1956
1957
1958
1959
1960
1961
1962
1963
1964
1965
1966
1967
1968
1969
1970
1971
1972
1973
1974
1975
1976
1977
1978
1979
1980
1981
1982
1983
1984
1985
1986
1987
1988
1989
1990
1991
1992
1993
1994
1995
11.0
12.4
10.8
12.6
12.8
10.9
10.3
9.6
11.9
10.3
9.4
8.1
10.1
9.3
9.3
10.5
11.3
11.9
13.1
12.9
11.6
11.3
10.0
8.0
8.4
8.6
8.5
6.7
7.0
7.4
7.8
7.8
6.9
5.8
6.0
5.2
6.0
7.4
7.2
6.8
7.5
8.1
7.7
7.6
7.4
7.9
9.1
10.2
10.3
...
11.4
10.9
12.4
11.5
9.4
8.8
9.6
11.2
9.5
8.6
8.6
9.9
9.1
9.8
10.4
11.2
11.6
12.4
11.9
10.6
10.2
8.8
7.6
8.5
8.6
8.0
6.6
8.5
8.4
8.5
8.0
6.9
6.6
7.0
7.2
8.1
8.3
8.0
7.4
7.8
7.9
7.5
7.5
7.9
8.8
9.7
10.3
10.2
Averages
1950-59
1960-69
1970-79
1980-89
10.6
11.1
7.7
6.8
10.0
10.6
8.0
7.6
Source: National Income and Product Accounts of the United States (NIPA) and Balance Sheels for ihe U.S. Economy.
a. The return is computed as the ratio of pretax profits for the nonfinancial corporate sector, with the capital consumption
adjustment and inventory valuation adjustment, plus net interest payments by nonfinancial corporations, divided by an
estimate of the midyear value of the tangible assets held by these corporations. The value for 1995 is based on two quarters
of profits and interest payouts, and an estimate of nonfinancial corporations' tangible assets as of March 31, 1995.
James M. Poterba and AndrewA. Samwick
305
porations." In additionto the rate of returnshown in the first column,
the table also reportsa business cycle-adjusted rate of return.To construct the adjusted return, we first regress the rate of return on the
civilian unemploymentrate (RU), using a first-orderserial correlation
correctionwith an autocorrelationcoefficient, p. This yields the following equation(with standarderrorsin parentheses):
Return =
0.124 -
0.0052(RUt),
(0.010)
(0.0013)
p = 0.845.
(0.085)
We then compute fitted values at the sample average unemployment
rate of 5.61 percent.'2The adjustedand unadjustedseries are plotted
in figure 2.
The unadjustedrateof returnrose nearly3 percentagepointsbetween
1991 and 1994, and while the rate of returnin 1994 and 1995 is not as
high as it was throughoutthe 1960s, it is higherthanat any point in the
last twenty-fiveyears. The change in the cycle-adjustedreturnbetween
1992 and 1994 is less dramaticthan that of the unadjustedseries, but
still suggests an increase of 1.5 percentagepoints.'3
In spite of this sharpincrease in earnings, corporatedividends have
not risen during the last few years. The third column of table 2, and
also figure 1, shows the price-to-dividendratio on the S&P 500. This
reaches39.2 at the end of June 1995, the highest year-endvalue during
the postwar period. Values of the price-to-dividendratio in excess of
30 have been recordedonly a few times duringthe last forty years: in
the late 1950s and early 1960s, in the late 1960s, and in the mid-1990s.
Onepotentialexplanationof risingprice-to-dividendratiosis a grow11. This measureof the rate of returnwas analyzedby Nordhaus(1974) and Feldstein and Summers(1977). For a discussionof alternativemeasuresof the rateof return,
and of the effective tax rate on corporateearnings, see Feldstein, Dicks-Mireaux,and
Poterba(1983).
12. Adding a time trendto this equationdoes not change the coefficienton RU. The
time coefficient, -0.00051 (0.00034), provides weak supportfor a seculardecline in
the corporateprofitrate.
13. We have also estimatedthe cycle-adjustmentequation,usingthe dummyvariable
DUM94&95to allow for a shift in the level of profitsin 1994 and 1995. The resultsare:
Return = 0.123 -
(0.010)
0.0052(RU) +
0.0073(DUM94&95), p
(0.0013)
(0.0088)
=
0.842.
(0.086)
If we also include a time trend, the coefficient on the trendis - 0.00067 (0.00031),
and the coefficienton DUM94&95rises to 0.0136 (0.0093).
306
BrookingsPapers on EconomicActivity, 2:1995
Figure 2. Return to Capital for NonfinancialCorporations, 1948-95
Percent
r Unadjusted
13
1950
1955
1960
1965
1970
1975
1980
1985
1990
1995
Source: Authors' calculations using data from National Product and Income Accounts of the United States (NIPA) and
Balancn
e Sheets for the U.S. Economy.
ing reliance on nondividend alternatives for returning cash to shareholders, such as share repurchases and cash purchases of stock in other
companies. Repurchases, which historically had been very limited, became an important source of cash payout during the mid-1980s. Their
importance declined in the late 1980s and early 1990s, and although it
has increased in the last two years, it has not reached the level of the
mid-1980s\.14
Table 4 tracks the role of nondividend cash payouts over the last
fifteen years and suggests that these payouts cannot explain the recent
rise in price-to-dividend ratios. The first column in table 4 shows the
ratio of all cash payouts-to-cash dividends for nonfinancial corporations.
This ratio, which was very close to one at the beginning of the 1980s,
rose above 2 in the mid-1980s. It declined in the early 1990s, and has
14. Bagwell and Shoven (1989) describe the growth of share repurchasesin the
1980s, and the tax incentives for repurchasesratherthancash dividends.
James M. Poterba and AndrewA. Samwick
307
Table4. Dividends and Other Cash Payoutsfor NonfinancialCorporations,1980-95
Year
1980
1981
1982
1983
1984
1985
1986
1987
1988
1989
1990
1991
1992
1993
1994
1995d
Totalcash
payoutslcashdividends"
0.993
1.488
1.204
1.109
2.285
2.334
2.409
2.238
2.712
2.312
1.602
1.169
1.080
1.154
1.462
1.206
Priceldividendb
21.1
18.0
20.3
23.2
21.4
25.8
29.6
27.0
27.2
30.0
26.7
32.2
34.5
36.8
34.4
39.2
Priceltotal
cashpayouts"
21.2
12.1
16.8
20.9
9.4
11.0
12.3
12.0
10.0
13.0
16.7
27.5
31.9
31.9
23.5
32.5
Source: Data on dividend payments for nonfinancial corporations are from N IPA, table 1. 16. Data on gross share purchases
are from the Federal Reserve Board. The price-to-dividend ratio is from Data Resources Inc.
a. Total cash payouts divided by cash dividends is the ratio of dividend payments plus gross share purchases by nonfinancial corporations, including both share repurchases and shares bought in corporate control transactions, to dividend
payments by nonfinancial corporations.
b. The price-to-dividend ratio for the S&P 500.
c. Price divided by total cash payouts equals the price-to-dividend ratio (column two) divided by the ratio of total cash
payouts to cash dividends (column one).
d. Values for 1995 are estimates based on data for the first two quarters;price divided by dividends and price divided by
total cash payouts are as of June 30, 1995.
rangedbetween 1 and 1.5 in recentyears. The second andthirdcolumns
present the price-to-dividendratio and the price-to-totalcash payout
ratio, respectively, for the S&P 500. They show an even more rapid
increasein shareprices relativeto total cash payoutsthanin shareprices
relativeto dividends over 1988-95, because nondividendcash payouts
have declined relative to cash dividends duringthe mid-1990s.
The fourth column of table 2, as well as figure 3, shows Tobin's q
ratiofor nonfinancialcorporations;thatis, the ratioof the marketvalue
of their equity to the replacementcost of their tangible assets, net of
outstandingdebt.'5 This ratio, which falls below 0.40 for a numberof
15. This ratio is computed by the Federal Reserve Board and published in the
Balance Sheetsfor the U.S. Economy,June 8, 1995, table B 104, p. 37. Tangibleassets
include plant, equipment, and residentialstructures,the replacementvalues of which
are estimatedby the CommerceDepartmentusing a perpetualinventorymethod with
adjustmentfor changingprices of investmentgoods, inventories,and land. The market
value of land is estimated by the Federal Reserve Board. The book value of debt is
308
BrookingsPapers on EconomicActivity, 2:1995
Figure 3. Stock Market-to-GDP Ratio and Tobin'sq, 1952-95
Marketvalue/GDP
q ratio
_ 2.50
1.10
A Stockmarket-to-GDP
(left axis)
2.25
~~~~~~~~~~~~~~
07
\
1.00 _/
I' / 'I
.90.
0.90
0.80
0.70[_
0.00 -
(right axis)
I
I
J
I
\
I
1.50
I
A
I
I
I- 01.25
0.40 -
1.00
0.300.75
0.20 -Tbn
(right axis)
~~~~~~0.50
0.10
0.00 F0.25
1950
1955
1960
1965
1970
1975
1980
1985
1990 1995
Source: Authors' calculations using data from Federal Reserve, Flow of Funds Accounts.
years between the mid-1970s and the early 1980s, is 1.27 at the end of
1994, and 1.47 at the end of June 1995. 16 The change in q over 199095 is unusual. The only comparablepercentagechange, a decline of
more that 50 percent over a two-year period, took place between late
1972 and late 1974, the period of the first oil embargo. Moreover, the
recent values are the highest recordedfor q duringthe postwarperiod.
There are good reasons for suspecting that "average" q measures,
subtractedfrom this estimateof asset replacementcost. This measureof q suffers from
several limitations, notably, the failure to compute the marketvalue of debt and the
absence of any correction for the present-discountedvalue of future tax shields, as
implementedby Summers(1981). These factors are unlikely to result in large changes
in the short-runmovementsin q.
16. Revisions to the Flow of Funds that are expected on December 15, 1995 will
reducethe estimatedmarketvalue of equity in nonfinancialcorporations,therebyreducing the estimateof q for recentyears. The rise in the value of q in 1994-95, relativeto
otherrecentyears, will not be affected.
James M. Poterba and AndrewA. Samwick
309
such as those in table 2, are poor measuresof relative value for some
types of firms. BronwynHall's extensive studyof the marketvalue and
replacementcost of corporateassets in the 1980s makes it possible to
illustratethis.'7 At the end of 1987, when the aggregatevalue of q was
0.574, many high-technologyand high-growthstocks exhibitedqs that
were many times greaterthan the aggregate, as the following informal
table shows:
Company
Average q,
December 1987
Coca-Cola
Compaq
2.89
2.65
IBM
1.53
Intel
Kodak
Motorola
2.79
1.53
1.59
If a rising fraction of firms' high-value assets is intangibles such as
patents, specialized workforces with particularhuman capital attributes, or brandloyalty, ratherthan property,plant, and equipment, q
will rise on this account. In addition, noise will enter q measurements
as an increasing fraction of corporateearnings is generatedoverseas,
since the replacementcost of foreign assets is probablymeasuredwith
more errorthan that of domestic assets.'8
The market value of equity relative to GDP has increased more
slowly thanTobin's q duringthe recent stock marketrise. This implies
a decline in the ratio of tangible corporateassets to GDP. At the end of
1994 the replacementcost of tangible assets for the nonfinancialcorporatesector was 0.77 times GDP. This value was morethan20 percent
below the value of the ratio at the end of 1989 (1.016), and 40 percent
below the value in the early 1980s (1.23 in 1982). From the end of
WorldWar II until 1973 this ratio fluctuatedbetween 0.86 and 0.96. It
rose between 1974 and 1982, and has been declining since.
It is difficultto distill a simple conclusion from table 2. While price17. The q values shown below are drawnfrom the researchand developmentdatabase describedand analyzed in Hall (1993).
18. Hines (1991) documentsthe rising shareof internationalearningsfor U.S. nonfinancialcorporations.
310
Brookings Papers on EconomicActivity, 2:1995
to-earningsratios are not unusually high at present, other measuresof
stock price valuation are at, or near, historical highs. To determine
whethercurrentstock prices can be justifiedby fundamentalsis beyond
the currentproject.19Table 2 does suggest, however, that in assessing
the macroeconomicconsequences of stock price movements, it may be
importantto distinguishbetween stock price fluctuationsthat are associated with movements in the price-to-earningsor price-to-dividends
ratios and those that are not.
A numberof recent studies suggest that variationsin the earningsto-price ratio are correlatedwith prospectivestock marketreturns,and
one concludes that "shocks to [stock]prices holdingdividendsconstant
are almost entirely transitory."20Sharpincreasesin eitherthe price-toearningsor the price-to-dividendsratio, otherthings equal, are associated with lower prospective returns. If households view differently
increasesin shareprices thatarenot supportedby increasesin dividends
or earningsand those that are, these two types of shareprice movement
might have divergenteffects on consumption.
Aggregate Trends in the Ownership of Corporate Stock
All corporate stock is ultimately owned by individuals. With the
exception of sharesheld by foreigners(currentlyabout5 percentof the
total), U.S. equities representnet worth of U.S. citizens. Yet if individuals adjusttheirconsumptionmore in responseto fluctuationsin the
price of shares that they own directly than in response to shares that
they hold throughfinancialintermediariesor in accountsthat are dedicated to retirementsaving, then the way in which stock prices affect
real economic activity may depend on stock ownershippatterns.2'
19. One of the authors,having concluded in Frenchand Poterba(1991) that fundamentalfactorscould explain why Tokyo's Nikkei stock indexwas approximately39,000
in 1989 (high real estate values for corporateland made Tobin's q for Japaneseshares
nearlyone), is hesitantto ventureagain into analyzingstock marketfundamentals!
20. Cochrane(1994, p. 241). Campbelland Shiller (1988a, 1988b)presentclosely
relatedevidence on earnings-to-priceand dividends-to-priceratios and stock returns.
21. Behavioralmodels suggest that the form in which sharesare held, and even the
particularrecord-keepingconventionthat is appliedto them, may affect the magnitude
of the wealth effect on consumerspending (see, for example, Thaler, 1994). Because
James M. Poterba and AndrewA. Samwick
311
Differential transactions costs associated with different types of
equity accounts, such as penaltytaxes for early withdrawalsfrom IRAs
or 401(k)s, can also induce divergences in the consumptionresponse
to capitalgains on stock held differentways. Accumulationin accounts
that are "off-limits" may not lead to the same spending response as
increases in the value of directly held assets that can be tapped for
currentconsumption. Investmentthroughthis type of account has become particularlyimportantin recentyears. In the firsteight monthsof
1995, more than two-thirdsof the cash inflows to leading mutualfund
managerswere directed to funds held in retirementplans. Retirement
plan assets now representnearly one-thirdof all mutualfund assets.22
For some categories of indirectstock ownership, the link between a
currentcapital gain and benefits to the indirect individual holders is
complicated. Considerthe example of equity held by a state and local
governmentretirementplan, a definedbenefitplan for the retirementof
state and local employees. Individuals as taxpayers are the ultimate
beneficiariesof gains in the value of this pensionfund's holdings, since
higher asset values imply that future tax burdenscan be lowered and
will still fund future pension liabilities. Yet individuals may not be
awareof the increase in the value of their locality's pension portfolio,
andthey may not be confidentenough thattheirfuturetaxes will decline
to raise consumptionin responseto such gains.23The perceivedchange
in net worth may be quite different for changes in the value of stock
owned directly, or stock owned throughmutualfunds that continually
provide informationon net asset value.
Before considering whether changes in stock ownership patterns
have affected the link between share prices and consumerspending, it
is helpful to summarizethe postwarhistory of individualstock ownership. The standardclaim that individualinvestorsnow accountfor less
thanhalf of equity ownershipin the United States is based on datafrom
individualinvestorsreceive quarterlystatementsfrom mutualfunds and otherfinancial
intermediaries,they may be more aware of their gains on these investmentsthan on
directstock investmentsthat requireinitiativeto evaluate.
22. Ellen E. Schultz, "Tidal Wave of RetirementCash Anchors MutualFunds,"
WallStreetJournal, September27, 1995, p. C1.
23. There is an inconclusive literatureon the extent to which unfundedstate and
local governmentpension liabilities are capitalized into house values (see Epple and
Schipper, 1981).
312
BrookingsPapers on EconomicActivity, 2:1995
the FederalReserveBoard's Flow of Fundsaccounts.24These datashow
"household" ownership of corporatestock declining from nearly 90
percentin the 1950s to less than 50 percentin the mid-1990s.
Although widely used, the Flow of Fundsdata do not measurewhat
many analysts think they measure. They do not apply to listed equity
on stock exchanges but rather,to a broaderconceptof corporateequity,
including stock in closely held companies.25Moreover, they do not
describeholdings of individualinvestorsbut rather,of a groupof economic actors, the "household sector," which includes nonprofitinstitutions.
The entry for household sector holdings in the Flow of Funds table
for corporateequity balances also excludes equity held throughmutual
funds, defined contributionpension plan accounts, and other financial
products, such as variable annuities. These forms of individualequity
ownership are allocated to other sectors in the Flow of Funds, and as
they have become more importantin the last decade, the potentialfor
misinterpretationof the household sector data has grown. The growth
of institutionalholdings does not necessarilyimply that shocks to stock
marketvalues now have smallereffects on individualnet worththanin
previous periods.
Table 5 summarizesthe Flow of Fundsdataon the shareof outstanding equity held by variousclasses of investors. The householdsector is
shown in the first column.26The column for mutual funds combines
ownershipby open-endand closed-end investmentcompanies, andthat
for pension funds includes private pension funds as well as state and
local government retirement systems. The pension fund column includes both defined contributionplans, in which the plan participants
have distinct accounts that change in value along with the price of the
underlyingassets, as well as defined benefitplans, which promiseparticular benefit streams to retirees as a function of their age, years of
service, and wage history at retirement.
24. See, for example, Blume and Zeldes (1993) and Friedman(1996).
25. The total marketvalue of corporatestock in the Flow of Fundsexceeds that on
the NYSE, AMEX, and NASDAQ. The value of closely held sharesat the end of 1994
was approximately$1.2 trillion.
26. The sharpdecline in the shareof equity held by householdsbetween 1968 (81.9
percent) and 1969 (69.1 percent) is due to the creation of a separateFlow of Funds
categoryfor bank personaltrusts, which accountedfor 10.5 percentof equity holdings
in 1969.
Table5. Stock Ownership Shares, UnadjustedFlow of Funds, 1952-94
Percent
Year
Households"
1952
1953
1954
1955
1956
1957
1958
1959
1960
1961
1962
1963
1964
1965
1966
1967
1968
1969
1970
1971
1972
1973
1974
1975
1976
1977
1978
1979
1980
1981
1982
1983
1984
1985
1986
1987
1988
1989
1990
1991
1992
1993
1994
89.7
88.6
89.3
88.6
88.6
87.5
87.6
86.8
85.8
85.7
84.7
84.2
84.1
83.8
83.0
81.7
81.9
69.1
68.0
65.9
64.1
60.4
56.1
56.7
61.8
59.0
56.9
58.7
60.9
59.0
56.1
53.5
51.4
51.3
50.6
49.8
48.8
48.0
48.6
50.8
51.4
49.7
47.7
Pension
funds"
1.1
1.5
1.4
2.1
2.3
2.8
3.0
3.5
4.0
4.4
4.8
5.2
5.5
5.9
6.4
6.6
6.8
8.1
9.2
10.5
11.5
12.8
15.2
16.5
14.7
16.3
18.5
18.1
17.4
18.7
21.3
22.9
24.6
24.8
25.4
25.5
26.8
27.2
27.0
26.2
25.8
25.6
25.7
Mutual
funds"
3.1
3.5
3.3
3.3
3.5
3.9
4.0
4.3
4.6
4.6
4.8
4.9
4.9
5.0
5.2
5.3
5.3
5.5
5.2
5.5
5.1
5.1
5.4
4.9
4.1
3.9
3.7
3.4
3.1
2.9
3.3
4.1
4.6
5.0
6.1
6.9
6.5
7.0
7.1
7.7
8.7
11.5
13.6
Foreign
Insurance
companies"
2.2
2.2
2.2
2.2
2.2
2.2
2.1
2.2
2.2
2.2
2.2
2.2
2.1
2.0
1.9
3.1
3.0
3.1
3.2
3.1
3.5
3.8
4.0
4.2
3.7
4.2
4.2
4.1
4.2
4.5
4.7
5.0
5.2
5.3
6.1
6.3
6.5
6.6
6.3
5.6
5.5
5.5
5.4
3.4
3.6
3.3
3.1
2.9
3.0
2.8
2.8
2.9
2.9
3.1
3.0
3.0
2.9
3.0
2.8
2.8
3.1
3.3
3.7
4.3
5.1
5.7
5.2
4.8
5.2
5.5
5.4
5.1
5.5
5.7
5.7
5.7
5.5
5.0
5.2
5.2
5.0
5.0
4.4
4.0
4.0
4.2
Source: Federal Reserve, Flow of Funds Accounts.
a. Household category includes ownership by nonprofit institutions.
b. Pension funds include private and government plans.
c. Mutual funds include closed-end as well as open-end investment companies. Entries are based on the total amount of
corporate stock held by mutual funds.
d. Insurancecompanies include both property and casualty, and life insurance companies.
314
BrookingsPapers on EconomicActivity, 2:1995
To estimate the share of corporatestock that individualshold either
directly or,indirectly, we make five adjustmentsto the Flow of Funds
household sector data:
-We subtractthe equity holdings of nonprofitinstitutions.Experimental data presented in the Flow of Funds accounts show that the
equity holdings of nonprofitinstitutionsaveraged 15.7 percent of the
household sector's equity holdings duringthe period 1987-92. Therefore we multiply the Flow of Funds household sector equity value by
0.843 in each year between 1952 and 1994 in order to remove these
holdings.
-We add stock held by bank personaltrusts, since individualsare
the beneficiariesof all of these accounts.
-We add equity held in defined contributionpension plans. At the
end of 1993, private pension plans held $1,075 billion in corporate
stock, of which $481 billion was held in defined contributionplans.
Since individuals are the owners of these accounts, we attributethis
equity to them. The share of privatepension fund equity assets held in
definedcontributionplans has increasedfromjust over a quarterat the
beginning of the 1980s to nearly a half in the mid-1990s.
-We add equity held in variable annuityreserves at life insurance
companies.Variableannuities,which have been one of the most rapidly
growing insurance products of the last decade, provide a means for
individualsto defer taxes on capital income, at the price of insurance
loads and some limitationson investmentoptions and withdrawalprovisions. Total assets held in variableannuityaccountshave grownfrom
$47.7 billion at the end of 1991 to $176.4 billion at the end of 1994,
and nearly three-quartersof variableannuitiesare invested in stock.27
-We add household ownership of open- and closed-end mutual
fundsthatinvest in corporatestock. Individualsare the ultimateowners
of most mutualfund shares. At the end of 1994, 66.2 percentof mutual
fundshareswere allocatedto householdsin the Flow of Funds. Another
13.2 percent were allocated to bank trust departments,which we aggregate with households. Given the growthin mutualfund holdings of
corporateequity over time, it is increasinglyimportantto recognize this
channel for individualequity ownership.28
27. Gentryt1994) and Poterba(1995b) discuss the growthof variableannuities.
28. Retirementaccountscompriseabouttwo-thirdsof householdmutualfund hold-
James M. Poterba and AndrewA. Samwick
315
The magnitudeof each of these correctionsto householdequity ownership is shown for the end of 1994:29
Percent of total corporate
stock outstanding
Flow of Fundshouseholdsector
less nonprofitholdings
plus bankpersonaltrusts
plus pensionplan assets
plus variableannuityaccounts
plus mutualfundholdings
equalsadjustedindividualholdings
47.7
(7.5)
2.7
7.7
2.0
11.0
63.7
The net effect of these adjustmentsis to raise substantiallythe fraction
of corporateequity that is attributedto individuals. Ratherthan suggesting that individuals hold less than half of all corporatestock, the
modifiedcalculations suggest that individualinvestors hold two-thirds
of outstandingstock, either directly or througha fiduciary.
Table 6 shows these adjustmenttermsfor the period 1952-94; figure
4 plots the adjusted and unadjustedtime series for individual stock
ownership. The adjustmentschange the trend in stock ownershippatterns. The secular decline in the share of equity owned by individuals
that emerges in the first column of table 6 is not supportedby the data
on individualdirect and indirectownership.In the expandeddefinition,
individualownershipdeclines from 75 percentof the marketin 1970 to
just over 60 percentin the late 1980s, but then startsto rebound.It has
grown by more than 3 percentagepoints during the last four years of
the period. This is largely the result of the diffusion of tax-deferred
ings. At the end of 1994, householdownershipof mutualfunds totaled$1,066 billion.
Data from the InvestmentCompanyInstituteshow that $361 billion of this was held in
IRAs, $161 billion in 401(k) plans, $76 billion in other defined contributionpension
plans, and $98 billion in 403(b) plans.
29. One of the changes that is due to be incorporatedin the December1995 revision
of the Flow of Funds accounts involves some reallocationof variable annuity assets
between the mutualfund and insurancecompany sectors. The currentFlow of Funds
procedureincludesvariableannuityequity assets in both the mutualfund and insurance
sectors, and consequentlysubtractsthese assets twica from total equity outstandingin
computinghouseholdequityholdings. Addingback variableannuityassets, as described
in the text, corrects for this. The revision is also expected to decreasethe amountof
stock held by corporatepension plans.
.
.
o
-:>
-k
rn
m 2 do
U t-
o
o
m It
It
o-
.
.
o)mv o
o
o
o
o
C
\C
00
00 C)1t
o
o
a
o
o
.
.
.
.
om
o
o
o
o
o
o
o
o
o
o
kf
\.
r-
r-
r-
C)
m
cro o ooo
o
\p
oo o
m o
c-i
o o o o o o o o o o o o o o o o o o
m
-
t -t
~
.
o
~~~~~~~
v
a
.
a, 00 00 00 00 00 00 00 r- r- r- r-
0oW a,
~~~~~~
_o
ro
oON
Cn
n
oo
w)
C
on
r- c-
Cl
Cl
t k
- o
0o
o
oo
(ON
r- a
o
to~~~~~L
.e
=
u
o <
Q
%%
X
~a.,
t
SC
) (W S) SC) W) WC)oo) oo l
oo
a,
a,
ON
lON
ON
N
c\o
c,
-o
oC \C \C
,
a,
, a,
--Cho
,
00
Ct 0-
\t
-
i -
wo r -
C
>
N
C
(ON It
C
W) m
o
lCO 0 06 CJo
C
It
0e
(Ni
-
C
C
m m
C) C) r-
C)} -;
00
r
N
w) o o
CI (ON
r-
(ON r-
"-\
\C
C
\
o
c- c- c-
k
k
w
oo
C
\
\6
6
O
-
c
W) W
- i
--
m
oo
omNn
00
?t
o
OChr
06
00
0 r-
o
nChChn
0 00
CJo Cl sC:
*h
mt
Ch
r00:
06
0-
r-
r-
z
C
~~~~~~~~~~~~~~~~~
m (O C kr
00 00 m ON ON
o
-
o w-r
w)
w) r-
n
(N
\C
a)
(O
.
-
L1
2101
0u
-
CJ
00
0C) (O
w) \p - Ccoo
r
rr- r-
o
rD
Ch(OO
o, Ch
r- w w
-
) 't
m
00
ci
w
m
w
-t
w
-)
w
o
w
-
-
-
-
-
-
-
-
-
-
-
0) \
00
It
r-
r
oo oo, ooo-C
r
00 00 00 Ctmm\
oo
-
00
,
oo
-
-
-
-
-
-
-
W
-
-
-
318
Brookings Papers on EconomicActivity, 2:1995
Figure 4. Share of Stock Owned by Households, 1952-94
Percent
90
Flow of Funds
'__
households
80
Individuals
70
60
50
I
1950
l
1955
1960
I
1965
I
1970
I
1975
I
1980
I
1985
I
1990
I
1995
Source: Authors' calculations using data from Federal Reserve, Flow of Funds Accounts.
saving plans, particularlytax-deferred401(k)s and403(b)s, throughthe
employed population.
These adjustmentsto the Flow of Funds data are necessary for understandingthe potential consumptioneffects of an increase in share
values in the "mental accounts" framework. A key concern in this
context is the degree to which individuals recognize capital gains on
equities as a potentialbasis for higherconsumption.The adjustedmeasures of individualstock ownershipmay also be importantfor gauging
the significance of "noise traders" in security markets.30
For other issues concerningstock ownership,however, these corrections may not be relevant, and the standardview that individualsown
less than half of corporatestock may be appropriate.Since corporate
stock held throughmutualfunds or definedcontributionpension plans
is voted by the fiduciaries,not by the individualswho are the beneficial
30. Shleifer and Summers(1990) describe models of financialmarketequilibrium
with noise tradersand explore their allocative effects.
James M. Poterba and AndrewA. Samwick
319
holdersof these shares, the rise of indirectownershipmay have altered
the balance of power within corporations.
The factorsthatexplain the evident trendaway fromdirectownership
of corporatestock and toward ownershipthroughfinancialintermediaries are not well understood. Tax considerationsactually encourage
directownershipof shares. Individualscan more efficiently invoke tax
strategiesthat realize capital losses and defer capital gains if they own
sharesdirectly, ratherthan througha mutualfund. Tax incentives may
explain partof the growthof corporatepensions. By investing through
401(k) plans and defined contributionpension plans, individuals can
defer taxes on both capital gains and dividend income. Many households hold equity only in these tax-deferredforms. A countervailing
incentive is the opportunityfor greaterdiversificationthat is afforded
by mutualfunds, relative to purchasesof securities in individualcompanies. Furtherwork is needed to understandthe other factors in the
financialservices marketplacethat have led investorsaway from direct
stock holding.
Evolving Patterns of Individual Stock Ownership
One of the salient features of stock ownership is its concentration
among a subset of the population. In light of the higher historical
averagereturnon stocks thanon otherinvestmentassets, the substantial
numberof households that hold no equity representsa puzzle in the
analysis of portfolio behavior.3'Holdings of corporatestock are more
concentratedthan most other components of net worth. This may be
importantfor understandingthe consumptioneffects of rising share
prices, and it is also a key input to standardanalyses of "who gains or
loses" from share price fluctuations. Because the changing roles of
directand indirectstock ownershipmay be associatedwith shifts in the
distributionof stock holdings, we interruptour analysis of aggregate
trendsto presentsummaryinformationon the changingcross-sectional
patternof equity ownership.
We use data from the 1962 Survey of Financial Characteristicsof
31. Haliassos and Bertaut(1995) provide a recent survey of the related literature.
They andKing andLeape(1984) presentcarefuleconometrictreatmentsof the incidence
of stock ownership.
320
Brookings Papers on EconomicActivity, 2:1995
Consumers, and the 1983 and 1992 Surveys of Consumer Finances
(SCF) to summarizeindividual equity ownershipduringthe last three
decades.32The Survey of Consumer Finances is a stratifiedrandom
sampleof U.S. households, administeredby the FederalReserveBoard.
Designed to gather detailed informationon assets, liabilites, and demographiccharacteristics,it has been conductedevery threeyearssince
1983. In recognition of the highly skewed distributionsof many types
of financialandreal assets, the survey oversampleshigh-incomehouseholds. Each SCF contains an area-probabilitysample, which is a stratified randomsample of householdschosen fromthe populationat large,
and a stratifiedrandomsample of householdsdrawnfrom a set of highincome tax returns. Both samples are surveyed using the same questionnaire. In 1983, 438 of the 4,103 SCF households were from the
high-income sample, comparedwith 1,450 of 3,906 in 1992.33
The presentanalysis focuses primarilyon the 1983 and 1992 Surveys
of ConsumerFinances because in these two years the specific goal of
the SCF was to provide a detailed cross-sectional sample of wealth
holdings.34In this respect, the intermediatesurveysare less useful. The
1986 SCF merely reinterviewedthe 1983 sample and was not as complete in its gatheringof stock and pension dataas the previoussurvey.35
In 1989, one of the priorities was to establish a panel with the 1983
survey. The design of the 1983 and 1992 surveys was not encumbered
by considerationsof preservinga panel data set.36
Table 7 reports the numberand percentage of households owning
stock in 1962, 1983, and 1992. Both for households with any stock
holdings and households with stock holdings greaterthan $2,000, successive rows of the table contain progressively more comprehensive
32. A systematic survey of trends in share ownershipin the early postwarperiod
may be found in Blume, Crockett, and Friend (1974). Projectorand Weiss (1966)
describethe 1962 Survey of FinancialCharacteristicsof Consumers.
33. Kennickelland Starr-McCluer(1994).
34. The 1983 survey instrumentand sample are describedin Avery, Elliehausen,
and Kennickell(1988), while the 1992 survey is describedin Kennickell(1995).
35. See Heeringa,Connor, and Woodburn(1994).
36. Curtin,Juster, and Morgan(1989) comparedifferentwealth surveys, and conclude that only the SCF has enough high-income householdsto permittabulationsof
detailed asset categories. Avery, Elliehausen,and Canner(1984) and Avery and Elliehausen(1986) tabulatebasic resultsfrom the 1983 SCF. The 1992 dataare summarized
in Kennickelland Starr-McCluer(1994). Antoniewicz(1995) describesthe link between
SCF data and aggregatedata from the Flow of Fundsaccounts.
James M. Poterba and AndrewA. Samwick
321
Table7. Stock Ownership, 1962, 1983, and 1992a
Units as indicated
Investment
form and
householdcategory
Anystockholdings
Publiclytraded
Plus mutualfund
Plus IRA/Keoghaccount
Plus 40l (k) plan
Plus all defined
contributionplan
Stockholdings> $2,000h
Publiclytraded
Plus mutualfund
Plus IRA/Keoghaccounts
Plus401(k) plan
Plus all defined
contributionplan
Total
Numberof households
(millions)
As percentageof all
households
1962
1983
1992
1962
1983
1992
10.0
11.1
. ..
.. .
16.0
16.9
19.7
23.2
17.0
21.1
26.8
31.8
17.2
19.0
.. .
.. .
19.1
20.1
23.5
27.7
17.8
22.0
28.0
33.2
...
27.9
35.7
.. .
33.2
37.4
. . .
11.5
12.3
14.4
16.8
12.4
16.3
21.5
24.8
12.6
14.3
. ..
.. .
13.7
14.6
17.1
20.0
12.9
17.0
22.5
25.9
.. .
20.7
28.0
.. .
24.6
29.3
57.9
83.9
95.6
...
...
7.3
8.3
. ..
Source: 1962 Survey of Financial Characteristics of Consumers and the 1983 and 1992 SCFs.
a. Some equity holdings may still be omitted from the analysis because the SCF does not provide detailed information on
equity held in trusts for which the respondent is a beneficiary, or in variable annuity accounts. For 1983, we have imputed
the share of mutual fund holdings that are accounted for by equity mutual funds. The SCF questionnaire for that year did
not collect information on the type of mutual fund investors held. We therefore divide reported 1983 mutual fund assets
between stock and bond mutual funds on the basis of the relative proportions of these funds in the 1989 SCF.
b. 1992 dollars.
measuresof stock ownership. The first row focuses on direct holding
of shares in publicly tradedcompanies. The second row also includes
stock held indirectly throughmutualfunds. The thirdrow adds shares
held in IRAs or Keogh accounts. The fourth row adds shares held
throughtax-deferredsaving plans, such as 401(k)s. Finally, the fifth
row adds equity held in defined contributionpension plans.
The upper panel of table 7 shows that the numberof households
owning stock increasedbetween 1962 and 1983. Institutionalchanges
and data limitations only permit calculations for two definitions of
37. Some equity holdings may still be omitted from the analysis because the SCF
does not providedetailed informationon equity held in trustsfor which the respondent
is a beneficiary,or in variableannuityaccounts. For 1983, we have imputedthe share
of mutualfund holdings that are accountedfor by equity mutualfunds. The SCF questionnairefor that year did not collect informationon the type of mutualfund investors
held. We thereforedivide reported 1983 mutual fund assets between stock and bond
mutualfunds on the basis of the relativeproportionsof these funds in the 1989 SCF.
322
BrookingsPapers on EconomicActivity, 2:1995
ownershipin 1962: directly held stock, and stock held either directly
or throughmutualfunds. Neither IRAs, nor 401(k) plans, nor Keoghs
existed in 1962, and since the Survey of Financial Characteristicsof
Consumersdid not collect informationon detailed pension plan attributes, there is no informationon equity held throughdefined contribution pension plans.
The percentageof households with direct stock ownershipdeclined
between 1983 and 1992, while the percentagewith indirect holdings
increased. By 1992 direct holdersof corporatestock accountedfor less
than half of all equity holders. While 37.4 percent of all households
owned stock either directly or throughan intermediary,only 17.8 percent of households reporteddirect stock holdings. For all but the most
limited measureof stock ownership(direct holdings) the data show an
increase in the incidence of stock ownershipbetween 1983 and 1992.
The percentageof households that own stock either directlyor through
mutualfunds, for example, rises from 20.1 to 22.0 percent. The share
of households holding equity under the most expansive definition increased by 4.2 percentagepoints, from 33.2 to 37.4 percent.38
The firstpartof table 7 indicatesthe total numberof householdswith
any exposure to stock price fluctuations. For analyzing consumption
decisions, however, it may be more appropriateto focus only on those
households with substantialexposure, as defined by an absolute level
of equity holding.39When the definition of stockholdersis limited to
only those individuals with at least $2,000 invested in stocks in 1992,
the fractionof householdscategorizedas stock ownersdeclines to 12.9
percent, and the extended measureof ownershipfalls to 29.3 percent.
Thus roughly 8 percent of households own some corporatestock, but
less than $2,000 worth. Stock price fluctuationsare not likely to have
large absolute effects on the net worth of these households, although
given the low levels of asset holdings for many households, the proportionateeffects of stock price movementsmay be substantial.40
38. SCF staff reportsome concern that some closely held stock was classified as
publicly tradedstock in the 1983 SCF, therebyoverstatingthe numberof households
owning tradedstock and understatingthe growth of shareholdingsbetween 1983 and
1992.
39. All monetaryamountsin our analysis of the Survey of ConsumerFinancesare
given in 1992 dollars.
40. Poterba, Venti, and Wise (1994) present data on the distributionof financial
asset holdings for householdsin which the head is approachingretirementage.
James M. Poterba and AndrewA. Samwick
323
One of the reasons for exploring the disaggregatepatternof stock
ownershipis to provide some informationon the marginalpropensities
to consume out of wealth for stockholders.An importantdimensionfor
such analysis is stockholderage. Table 8 presentsinformationon stock
ownershipby the age of household head for 1983 and 1992.4' Households in which the head is over the age of sixty-five hold more than40
percentof the publicly tradedstock held by individualsin 1992 (almost
50 percentin 1983). The highest probabilityof owning stock occurs in
the years immediatelyprecedingretirement.
Table 8 illustratesthe dramaticgrowthof indirectstock holdings. In
1983, for example, 17 percentof households in the 45-54 group hold
stock only indirectly.By 1992, this percentagehas grownto 28 percent.
The comparablestatistic for the households of those aged from thirtyfive to forty-fourrises from 20 to 24 percent. Comparingthe entries in
the middle and right panels of table 8 suggests that the critical growth
has taken place in mutualfund and IRA or Keogh holdings. Including
indirect holdings has a larger effect on the estimated rate of stock
ownershipfor householdswith youngerheads thanfor those with older
ones. In 1992 the proportionof householdsin the 35-44 groupthatown
shares directly is only 20 percent, comparedwith 44 percentthat own
stock directlyor indirectly.The increasein the probabilityof ownership
is smaller(18 percentto 27 percent)for householdswith headsover the
age of sixty-five.
To link the disaggregateinformationon stock ownershipto the discussion of consumptionand stock price fluctuations,the informationin
table 8 can be used to compute the age distributionof capital gains on
corporatestock. The market value of corporate stock was $6,048.8
billion at the end of 1994, and it increasedby $1,119 billion between
December 1994 and June 1995. Since 63.7 percentof outstandingequity was held in forms that we define as providing individual control
over these assets, individualsthereforereceived a capital gain of $713
billion. The distributionof this gain by age is as follows:
41. Bosworth, Burtless, and Sabelhaus(1991) and Attanasio(1994) presentinformationon age-specific saving rates. This paperuses the following conventionfor selecting a head of household. When the survey respondentis partof a marriedcouple,
the head is the spouse with higher wage, salary, or self-employmentincome. If neither
spouse reportslabor income, the head is the older spouse.
t~~~~~~~~~r
C-) M
R t
X
Y
o
o
t~~~~~;:d
m ?
C) tf
N n-
t
o
-
0-)
C)
(
-q
Y
O
X o:
t>
k
o
_
?
n
X
n
?
O
?
_a
R
<_, ?
r-
Il-o
-_N
I-
- > It
n o
C)
>
C
t
)
'I
00 CN
E~~~~~~~~~f
2
o r- r- n
~~~~~~~~~N
o Il
*2
C m
-
m
-
o
?
~~CN
cn
Il
tf
C) C)
mN
m C
C) 0
o
(N
C Ill- 0N
O t cn
~~~~~n
o
:t
c
O>
C
0C.-
0
Cu
_
C)
O
hS
R
>
0
L
X
S
O
ON
-
0
>
X
f
L
Cq >
t
>
k
C)
-N
C1 o.
~~~tf
?
0
N
X
o
t
X
2
k>
t
k~~~~~~~
o1
X~~~~~~~~~~~~1
2-
m
C)
C
o
'IC
r
C
:O
m
tf
C -
_ (m4
C)
L
>
cl
O
4~~~~~~~~~~"
)N?
0_) ?f o
O ? -
, I-oooo
O
nctln-r--
>
0dB
'IC
-4
~m
N r-
c N
tf
oo->
N o
o
o)
'I
oo o
Ct
N
?
?
_aZ
0
01
tf
ooot
00 00
C
t
oo4 _
N?? (,
)
m
s
_ c
W)
<
r-
00
=
t:
C
,In ( 4 C
n~~~~~Ci
0
C cl,_
*;~~~~~~~~~~~~,
o~~~~~~C
?
00
o
t
rCI
N
- 0? 00 (
00
00
C
00
?
m
Oo
) C)
t
t
1
1C
O
r-4
Cj ' j-
0->Z>
L o t n o o N00onON
n_o
0
C-4
James M. Poterba and AndrewA. Samwick
Age of household head
< 35
35-45
45-54
54-64
65 +
325
Billions of dollars
37
121
175
161
219
The key conclusion from this calculation is that the majorityof wealth
changes from stock marketfluctuationsaccrueto householdswith older
heads.42
Some have arguedthat households with younger heads benefit indirectly when share prices rise because they will receive substantialbequests from the currentelderly. This could even stimulatehigher consumption among households that do not hold stock. Ultimately, the
young will receive in bequests any assets that are not consumed by
elderly. Yet to develop this argumentin more detail, we consider the
timing of expected bequests. We use actualmortalitytables to compute
the expected percentageof corporatestock that will be bequeathedto
younger generationsover various horizons.43The results suggest that
bequestsare not a critical factor in the nearterm. We estimatethatover
the next five years 5.7 percent of corporatestock will be bequeathed.
Over a fifteen-yearhorizon the share is 24.4 percent, and over twentyfive years, 45.3 percent. These calculationsdo not suggest thatyounger
generations will soon receive a large fraction of outstandingequity
throughthis channel, but it is notablethatthe expectedbequestof equity
during the next fifteen years is comparableto the amount of equity
currentlyheld by households with heads underthe age of forty-five.
The concentrationof stock ownership, as well as its age distribution,
can affect the linkage between stock price fluctuationsandconsumption
42. We can translatethis into a consumptionmetricwith the crude assumptionthat
households exhibit marginalpropensitiesto consume out of wealth equal to 1I(T age), where T is expected age at the end of life. We set T = 80, assume that all
householdsheadsover age sixty-five are age seventy-two,thatall those underage thirtyfive are age thirty, and thatthe householdsin the otherage bracketsare all at the bracket
midpoint.This implies a "predicted"consumptionresponseof $45 billion (6.3 percent)
to the $713 billion share price increase.
43. For marriedcouple householdsthatown stock, we definea bequestas occurring
whenbothmembersof the couple have died. The averagemortalitytablesmayunderstate
life expectancyfor stockholders,since age-specific mortalityrates are negatively correlatedwith wealth.
326
BrookingsPapers on EconomicActivity, 2:1995
spending. The skewed nature of ownership underpinsthe view that
consumption adjustmentsby the small set of substantialstock owners cannot have detectable effects on aggregate consumer spending.
Table 9 describesthe concentrationof shareownershipwith information
from the 1962 Surveyof FinancialCharacteristics
of Consumersand the
1983 and 1992 SCFs. The results confirm well-knowncross-sectional
patterns, but suggest new conclusions about trends. In 1983 the
0.5 percentof stock owners with the largestequityportfolios,including
both direct and indirectholdings, owned 55.1 percentof total stock. In
1992, this group held only 36.8 percent. The households in this top
0.5 percentgroupin 1992 had at least $800,000 in equities.The next 0.5
percentof stockholdershadequityportfoliosworthbetween$500,000 and
$800,000 in 1992, and held 10.3 percentof all equity.
The degree of concentrationis even greaterif attentionis limited to
directly held, publicly traded stock. Over 66 percent of directly held
stock was held by the 0.5 percent of stock owners with the largest
holdingsin 1983. This percentagehaddeclinedto 58.6 percentby 1992.
Comparisonbetween the entries for "all equity" and "nonpension
equity" in table 9 suggests that growing participationin defined contributionpensionplanshas been less importantthangrowinginvestment
in mutual funds and the expansion of tax-deferredretirementsaving
vehicles, such as IRAs, in reducing the concentrationof equity ownership among the wealthiest owners.44
Table 9 permits comparisonsof inequality in equity holdings, nonequity financialasset holding, and net worth, in 1962, 1983, and 1992.
Because some of the variables that we use to construct net worth in
1992 are not available in the 1962 data, and vice versa, we reporttwo
variantsof 1983 wealth inequalityfor comparisonwith 1992 and 1962,
respectively. We then focus on pairwisecomparisonsacrossyears. The
calculations for the 1983 data, on the basis of 1962 definitions, are
shown in the last two columns of table 9.
The comparison between 1962 and 1983 suggests relatively little
change in the concentrationof equity ownership.The shareof publicly
tradedstock held by the 0.5 percentof householdswith the largeststock
44. Some assets that are accumulatedin defined contributionpension plans may
appearas assets in IRAs, if these pension assets have been "rolled over" in a lumpsum
distribution.For informationon the importanceof such rollovers, see Poterba,Venti,
andWise (1995).
Z
,,
.
.
.
:
:t
.
.
.
(N 00
.
.
.
c
)e'
rNc cn r- 00
C
:-N
t
o.W
:
o
. .
00ONt~-t..
-t
Y
o
ON
oo
00
~ ~~O ~ ~~
_b
5
-
o
~
le
I-Cl
Q
.
t
b X
<
X t
*S0
.t
t
i;
C
o
ON
_
(Z
CN mc
C
CN C"
.
(
)
:
N-Nr O r
u/Nl
00
o C
o
-
)
On 0
o
t
0
N
0N
)
~~~~~~~~~~Co
_
N
.ot
0
t
?
O ?
N t
N
00
>
>
N
o
e
X
O
X
X
O
<
?
?
oN
m ?
.
.
.
.
.
.
00 0 > t 00
C
r- O
Co
C
__
o.
.
. t . - . O
0
'
C)_o
_
N O
~
.
:
o o-
o
>
oo0
m _Z
O
00 00 e
X
tm
t)
O)CN c
N~
.
00
CO
- cn tr -) o)
C)
0 Nt
-
Z ZZ
-
?
tf ) CN -
N oo oo
- O
N~ -
O-
Cq
tf
mc
Nt
cq
CN
tNC
Ol
o
00
ONE-ZZZZ
C)
O
O
CW
00o
- ec
o
sc
r-ONuNr
e>N clIC
(,
C"
-
ONClr-.-
k ~-Cl
s2
t
O
t
~~
>eeo O '
_- _ )
CN N Nt_
>cI
~t
Y
Cq
-N-
Ocloooo
C" C" cn C" 00o
~
C0ON
CCl---
0N
O
m r C S
cl'm
--
C- tf
r-
NN1~lrt Cloo
00
-:
._~~~~~~~~~~"
,?q cl~
,0
Cl
..
tf ,I- 00 tf
S
w >~~~~~~~~~~0
~~~->
C) cn Xc On
~~~~oo
~~~
~~t ~
Cl
ON
tCl
~ ~ ~ ~ ~ ~ ~ ~~~~~~~~~0
00
-b
^
-eNeNm
.
>
ol ?
m
t
o
~
' C
..
.
.
Q
.
.
Y
328
BrookingsPapers on EconomicActivity, 2:1995
portfolios in 1962 was 63.3 percent, comparedwith 66.2 percent in
1983. Total nonpensionequity also became only slightly more unequal
between 1962 and 1983. Thus the substantialdecline in the inequality
of nonpensionequity between 1983 and 1992 (from 62.3 percentheld
by the top 0.5 percentto 43.9 percent)representsa significantdeparture
fromthe trendof the previousperiod. The datashow thatbetween 1983
and 1992, the share of equity held by the top 0.5 percentof the stockholding populationdeclined, while that of householdswith stock portfolios in the ninetieth to ninety-ninth percentiles increased substantially. The share of directly held stock accountedfor by householdsin
the eightieth throughninetieth percentiles declined slightly, while the
fractionof total equity holdings attributedto this group increased.
The central message of table 9 is that more than one-third of the
gains or losses on corporatestock accrue to the roughly half a million
householdswith the largest equity holdings, and another40 percentof
the gains accrue to the 4.5 million households with the next largest
equity stakes. If the linkage between stock returnsand consumption
turnson directlyheld equity, then the concentrationof holdings is even
more dramatic:nearly 60 percent of the capital gains on directly held
corporatestock accrueto the half a million householdswith the largest
portfolios of corporatestock.
Table 9 also presentsdistributionsof nonequityfinancialassets, real
assets such as owner-occupiedreal estate, and total net worth. These
tabulationsuse the data and sample weights that underliethe first published tabulations from the 1992 data set.45The sample weights are
subject to revision in the final version of the data set for public use.
With the exception of owner-occupiedreal estate, the shareof each of
these asset categories held by very wealthy households declines between 1983 and 1992.46 The seventhcolumnin table9 shows the income
distributionin 1983 and 1992 as computed from the Survey of ConsumerFinances. It shows a growing share(from 7.6 percentin 1983 to
45. Kennickell and Starr-McCluer(1994). The tabulationsare subject to revision
because the final version of the 1992 Survey of ConsumerFinanceswas not available
whenthis study was conducted.The dataunderlyingthe reportedtabulationscontainno
missing values, but use a preliminarysampleweight to constructthe asset distributions.
46. Ournet worthcalculations,andmost othersdirectedat measuringthe inequality
of wealth, exclude the actuarialpresent-discountedvalue of defined benefit pension
benefits. Includingthese benefits would probablyreducethe shareof net worthheld by
the most wealthy households.
James M. Poterba and AndrewA. Samwick
329
9.7 percent in 1992) of family income accruing to households in the
top 0.5 percent of the income distribution, and a substantialdecline
(from 49.6 percent in 1983 to 43.4 in 1992) in the share of income
reportedby the bottom 80 percent of the distribution.47This finding,
andthe growing concentrationof housing equity, is importantin showing that the diminishing inequality of equity holding is not simply an
artifactof the Survey of ConsumerFinances data set, nor of our computational algorithms. Net worth is distributedmore unequally than
income, nonequityfinancialassets are distributedmore unequallythan
net worth, and equity holdings are distributedless equally than nonequity financialassets.
The findingthatthe fractionof corporatestock and of net worthheld
by the top 0.5 percent and top 1 percent of the distributiondeclined
between 1983 and 1992 contrasts with recent studies of wealth inequality that suggest that the inequality of financial asset holdings increased duringthe period 1983-89.48 The result is striking, given the
rise in share prices during this period and the unequal distributionof
share ownership. An increase in the relative value of an asset that is
distributedless equally thannet worth shouldincreasethe inequalityof
net worth; in principle, it is even possible for the distributionof each
component asset to become more equal while the distributionof net
worthbecomes less equal, with such asset price changes.49
47. Levy and Murnane(1992) describe and discuss recent changes in the U.S.
income distribution.
48. Wolff (1994, 1995) reportsthe changes in wealth inequalitybetween 1983 and
1989. These studies adjustthe SCF datato align the total reportedassets with aggregate
totals in the Flow of Fundsaccounts. Because the SCF totals are typically below those
of the Flow of Funds, these correctionsinflate the amountof each asset held by each
householdthat reportsit. They do not change the set of householdswho have a given
asset, nor the inequalitywithin asset categories, althoughthey can affect the measured
inequalityof broadercomposite measuresof financialassets or net worth.
49. Consideran economy with two assets, A andB. Householdsin the top 1 percent
of the wealthdistributionown SA and SB percentof these assets respectively.The market
value of asset A is VA and that of B is V,. Let WA = VA/(VA + V,) and w11= Vi/(VA +
V,1).The percent of net worth held by the richest 1 percentof households is SAWA +
Assume thatA is distributedless equally thanB, such thatSA > SB. At a different
SBWB3.
date, the top 1 percentof householdshold SA' and SB' percentof A andB, respectively.
Assume SA' < SA and s,1' < s,. It does not follow that net worth is more equally
distributed.If WA' > WA,wealth could still be more equal at the second date then the
first. In the simple case of s,,' = s,], the inequalityof net worthrises if SA'/SA > SB/SA
+ (1 - sR/SA)(wA/WA,'). If SB/SA = 0.25, and asset A appreciates50 percent,so that WA!
WA' = 0.67, then the inequalityof net worth will rise for any SA'/SA above 0.75.
330
BrookingsPapers on EconomicActivity, 2:1995
To assess the contributionof rising share prices to inequality, we
estimate the change in the inequality of net worth between 1983 and
1992 that would have resulted only from changes in asset prices.50We
adjustthe reported1983 values of corporatestock holdings and closely
held businesses by the real appreciationof the Standardand Poor's
CompositeSharePrice Index, andthe value of owner-occupiedhousing
by the real change in the Commerce Department's price index for
constant-qualityhomes. The resulting shares of net worth are as follows:
Wealthpercentile
Actual 1983
(percent)
Predicted 1992
(percent)
Actual 1992
(percent)
Top 0.5
Next 0.5
Next 4.0
Next 5.0
Next 10.0
Remaining80.0
23.74
7.12
22.86
12.12
13.08
21.08
25.63
7.70
23.11
11.71
12.10
19.75
21.68
6.99
24.37
13.77
14.10
19.20
Thus the actual share of wealth holdings by the most wealthy households in 1992 was substantiallyless than the extrapolationof the 1983
wealth distributionwould have predicted. Ceteris paribus,the relative
rise in corporate stock prices would have contributedto increasing
inequality. Other changes, however, were more importantthan asset pricechangesin generatingchangesin the distributionof equityholdings andnet worth;in particular,the diffusionof substantialstockholdings
to householdsnear, but not at, the top of the wealthdistribution.
The difference between these findings and others showing rising
inequalityappearsto be due to our reliance on 1992, ratherthan 1989,
data. When we apply our methodsto the 1989 SCF data, we find rising
wealth inequality between 1983 and 1989. Our estimates suggest that
the shareof total net worth held by the 0.5 percentof householdswith
the highest net worth increased from 23.7 percentto 26.1 percentbetween 1983 and 1989. This makes the decline from 26.1 percent in
50. Weicher(1995) explores the effect of rising sharepriceson net worthinequality
duringthe period 1983-89 and concludes that favorablestock returnsdid not substantially exacerbate inequality at that time, because they were paralleledby rising real
estate values.
James M. Poterba and AndrewA. Samwick
331
1989 to 21.7 percent in 1992 all the more striking. A critical question
is whether the change in wealth inequality recordedby the 1989 and
1992 Surveys of ConsumerFinances is a reliable indicatorof actual
changes in the U.S. wealth distribution.5'
The asset distributionamong the households with highest net worth
in 1983, 1989, and 1992 raises some questions aboutthe datafrom the
1989 SCF. Among the top 0.5 percentof households, for example, the
share of net worth held in corporatestocks was 21.2 percentin 1983,
8.0 percentin 1989, and 14.4 percent in 1992. The shareof net worth
in closely held businesses was 34.6 percent, 42.1 percent, and 38.4
percent in these years, respectively. At a minimum, the negatively
correlatedfluctuationsin the shares of these two assets suggests that
there may be some misclassification of closely held equity in some
years. It is not clear whetherthis could have any effect on the measured
inequalityof net worth, but it could affect the inequalityof component
assets, such as corporatestock.
The 1989 and 1992 Surveys of ConsumerFinance both show a decline in the share of net worth held by the 80 percent of households
with the lowest net worth. This group's share of net worth fell from
21.1 percent in 1983 to 19.2 percent in 1992. The gain in net worth
sharefor households between the eightieth and ninetiethpercentilesin
the wealth distributionwas approximatelyhalf of the decline for the
lowest 80 percent of households. A key conclusion to emerge from
table 9 is that there have been nontrivialrecent changes in the distribution of wealth among the households that are high in the net worth
distribution.
To complete the disaggregateanalysis of stock ownership, we considerthe income and nonequitywealth holdings of householdsthatown
stock.52Tables 10 and 11 provide summaryinformationon these dimensions of stock ownership, drawn from the 1983 and 1992 SCFs.
They show a strong positive relationship between income, financial
assets other than equity, and the probabilityof stock ownership.
51. Even though the SCF is the best available data source on the distributionof
wealth, the small numberof high-wealthhouseholdson which the SCF resultsare based
still makes these tabulationspotentiallysensitive to outliers. Analysis of the 1983-89
SCF panel might providefurtherinformationon the changingpatternsof asset holdings
betweenthese years.
52. Poterba (1995a) presents more detailed informationon the characteristicsof
stockholders.
-
>
~~~~~~~~~oocn
>
o
r-
S~~~~~~~~~~0
11 C- C- ooi
>
rN CN rXON
r- -t rl:
00 0,,
-q
-
c
0l
t
0
-) c
_'~~~~~~~~~
C,
S0 > k
X
N
m
m
m --
W
m
C-
C
7l
0 o-
rq
w
00
cs E
-
w
r0
_C_)
0o
m
o
C
"C"C\CNI_\C
00
e)
m 0
oN
-
~0qr
r-(N c,
1
>N t
IN
5
IN
.C
-
-0
W) 'I 00 IC
C-_w2ot?N
~c
rit-
r-
t~~~~~~~~~~~~~~~n
Vkc;0
Ct
- ^':;
W
m
sz
oo C)<
(,,
oc
6
O) V- (71
--
O m
r
It
--
00
o
-~
t
E
>
o.
o
oO
NC
00
o_
v~~~~~~~~~~~~~~~~~~C
C4
CX
tu
S
0
XE-.Z X ?-k
~~~~~~~~
Y
X
~
S
E
-X
CA..
_
tn
Y
1
C
0
e
=
g
~6
cl
o
\1
6
ro
N
e
\m
C>V_
o
tn
m C>C>
m _
?
o
_N
o
oooo m
u
U
N
>
N
e
e
w
^
o
~ ~ ~0Clfl ~ --~ ~ ~ ~ ~ ~r: Cl
00 Cl
>
Q
o
m
~~~~~~~~~~~~~~~C>
<
:c<
0
o 6\o
06
"
"m
tt
>? o1 ot.i- eI \o o
~~~~~~i~~-
~~~~~~~~
o
_X
U
X
>St
w .S <
I
Io
m
r' r- 06 ';~ot ot
NDoNo>0o
Hor
o
W
Io
>
?
i
{
Io
V
C,; o, o o8e
oo8-i
eD0N000o
o
Z~~~~~C
0
0 0 00
Io=
C
C
->
_66Cf Z
-^
o
#
-
X Y z o
~~~~~~)
t
It
(Z)
-
O It m
kr
o
C(
r
CN
C)
rn
-
(
-
Q >
0 0
ow
oN
en
-
rt
C
C,,
rvn
) ?
00r.
0
i-r
t
0f)
C
s
k
Il
o
t
m
s~~~~~~~~- Z
S
X
X
O
Wo
C-,
>
N
C
n
-rNoq40
-ro
o
X
I
C
-vn?
oo mO r
-0r
0
\OmO>
o
>
-
t
-
m
-o
40 roq
0
X
t
_
->
o
-
Xk
ON
C
--
OC cq CN rn 0Vk)
Nmt
4
C_)>
s
ibi>>
-
t
oIr O
oo
1
(
-
X
oo
N
t
kr
r
V)
6
N
rjo
?
N
0
kr C
?o
m
-
C)C-
00
OV
r-
O-r
-
U
_n
ri
Z
ONoo
Im
C
~ ~~~~~~~~~~~~~~~~~~~~~~~~~~~~
xk)
kr I
g~~~~~~~~~~~~~~~~~~~C
-
oo
cq
s
~~~~~~~
X
-
-
>~~~~~~~~~~~~~~~~~C
{_\ ?
s
O N
o o
C))
oo >
ooo)
q
w-r)
-t
?
\o
s~~~~~~~~~~~r
0<) r-,
-
v
0
>~~~~~~~~~~~~r
-Cl00000(5N rn0 rtn C"\
)to> t
kO
-
X
C-
0v
r-
It
O
-
o
noo
roq
O
r;o i;o i;o
v)
>
OC
O
I
o
?
O
r
C
334
Brookings Papers on EconomicActivity, 2:1995
Table 10 shows that in 1992, 61 percentof householdswith a family
income of more than $250,000 owned stock directly. The probability
of direct or indirect stock ownership was 79 percent for this group.
Both of these probabilitieswere much higher a decade earlier;in 1983
the probabilityof direct or indirect equity ownershipfor a household
with an income of $250,000 (in 1992 dollars) was 92 percent. In 1992
approximately23 percentof corporatestock was owned by households
with family incomes of more than $250,000; another23 percent was
held by households with incomes between $100,000 and $250,000.
Thusconsumptiondecisions by these householdsplay an importantpart
in linking stock price fluctuationsto overall consumerspending. However, table 10 also shows the rising equality of share ownership. In
1983, households with family incomes of $100,000 and above (in 1992
dollars) held 75 percent of all directly held equity; that share had declined to 50 percentby 1992.
Table 11 presents similar information on the nonequity financial
assets of the householdsthatown corporatestock. Publiclytradedstock
is the most unequally distributedequity measurethat we consider;43
percent of directly held stock is owned by households with nonequity
financialasset holdings above $250,000. The comparisonbetween 1983
and 1992 again reveals a substantialincrease in ownershipof stock at
lower wealth levels, consistent with the previous data on the family
incomes of stock holders. On the most expansive definition of equity
holdings, which includes equity in defined contributionplans as well
as sharesheld throughfinancialintermediaries,27 percentof corporate
stock is held by households with less than $50,000 in other financial
assets, and 34 percentby those with nonequityfinancialassets between
$50,000 and $250,000 in 1992.
The conclusion thatemerges fromthis analysisof the cross-sectional
data is that stock ownership has become more equal over time, but
remainshighly concentrated.The propositionthat equity capital gains
accrue to only a small set of households is not supportedby the data,
since 37.4 percentof householdsowned some corporatestock in 1992.
The concentrationof stock holdings nevertheless implies that a small
subset of the population (about 5 percent of all households) receives
roughly three-quartersof the capital gains and losses associated with
stock price movements.
James M. Poterba and AndrewA. Samwick
335
Stock Market Fluctuations and Consumption
To analyze the relationshipbetween stock marketreturnsand consumption,we test whetherthe stock markethas a causalwealtheffect on
consumption,or is simplya leadingindicatorthatforecastsfuturechanges
in consumerspending.53We considerthe effect of rising stock priceson
consumptionoutlaysin severalsteps. We begin by summarizingthe time
series relationshipbetweenstock pricechangesandsubsequentconsumption fluctuations.The difficultyof interpretingthese time-seriesrelationships is illustratedby referenceto the consumptioneffects of the stock
marketcrashes of 1987 and 1929. We then study four issues that are
motivatedby the foregoingdiscussionof shareownershippatterns.First,
we examine whetherstock price fluctuationsaffect the compositionof
consumptionspending, in terms of "luxury goods" that are disproportionatelyconsumedby high-incomehouseholdsand all othergoods. Second, we use householdsurvey data to investigatewhetherconsumption
by householdsthatown stock is moreclosely correlatedwith changesin
shareprices than is consumptionby nonstockholdinghouseholds.Third,
we investigatewhetherthe changingpatternof directversusindirectstock
ownershipaffects the relationshipbetweenstock marketfluctuationsand
movementsin consumptionspending.Specifically,we test whetherstock
pricechangesin the early postwaryearshad greaterpredictivepowerfor
consumptiongrowth than analogousfluctuationsin more recent years,
when individualdirectstock ownershiphas representeda smallershareof
total marketcapitalization.Fourth,we explore whetherchangesin share
pricesthatare associatedwith changesin dividends(thatis, pricefluctuations with a constant dividend-to-priceratio) have differenteffects on
consumptionspendingthanfluctuationsthatarenot supportedby dividend
movements.
Aggregate Statistics
We begin by regressing the growth rate in real per capita consumption (Aln c,) on lagged changes in real share prices, Aln P,_ :
53. This leading indicatorview closely resemblesthe "passive informant"hypothesis that Morck, Shleifer, and Vishny (1990) develop with respectto stock price movements and investment spending. Detailed evidence on the predictivepower of stock
returnsas leading indicatorsmay be found in Stock and Watson(1990).
336
Brookings Papers on Economic Activity, 2:1995
Table12. Aggregate ConsumptionSpending and Stock Price Fluctuations!
Dependentvariable
Constant
One quarter
lagged change
in real stock
price
Totalconsumption
0.0037
(0.0011)
0.031
(0.008)
0.0036
(0.0011)
Consumptionof durables
Consumptionof nondurables
R2
.. .
0.068
0.064
(0.014)
0.101
...
0.0017
(0.0057)
0.139
(0.041)
.. .
0.058
-0.0011
(0.0057)
.. .
0.290
(0.076)
0.091
0.0021
(0.0011)
0.032
(0.008)
.
...
0.0023
(0.001 1)
Consumptionof services
Four quarter
sumof lagged
changesin
stockprice
0.007
(0.006)
0.0055
(0.0008)
...
0.0056
(0.0008)
.
.
0.065
0.054
(0.015)
0.070
.. .
0.009
0.025
(0.010)
0.015
Source: Authors' regressions based on data from NIPA.
a. Each row reports estimates of the coefficient oi,
or
oas, from an equation of the form Aln c, = ao +
a(L)Aln P,_ I + e,. All equations are estimated from 1947:3 to 1995:2, and include seasonal dummy variables. Standard
errors are shown in parentheses.
(1)
Aln c,= oz0 + 0(L) Aln Pt,I
+ Et.
We consider equations with only the most recent lagged stock price
change on the right-handside, as well as equationswith a fourth-order
lag polynomial, oL(L).We estimateequationsusing seasonally adjusted
quarterlydata from the second quarterof 1947 to the second quarterof
1995
1 9 .54
Table 12 presents the results of estimating equation 1 for several
broad consumption aggregates. The results in the first row, for total
consumptionwith only a single lagged stock return,suggest that stock
54. Fischer and Merton (1984) report some results for consumptiongrowth as a
functionof lagged stock returns.Hall (1978) finds that lagged stock marketreturnsare
the only variableknownat the beginningof each quarterwith predictivevalue for future
consumptionchanges.
James M. Poterba and AndrewA. Samwick
337
marketfluctuationsforecast increases in real consumptionoutlays. A
10 percentrise in real stock prices predictsan increasein real per capita
consumptionof approximately0.3 percent.55Furtherlagged changes in
share prices also have predictive power for consumptiongrowth. The
second row of table 12, which also relates to total consumption,shows
the sum of the coefficients on the four lagged values of stock price
changes. Four quarters after a stock price increase the cumulative
change in aggregate consumptionis 0.064, more than twice the firstquartereffect.56
In orderto considerthe predictionsthatstock price fluctuationsmake
for various categories of consumption, table 12 also presents results
with one lagged value and four lagged values of Aln P,__ for each of
the three major subcategoriesof consumption:durables, nondurables,
and services. The results in the lower rows of table 12 show that stock
price changes predict the largest percentage change in spending for
consumer durables. A 10 percent increase in share prices predicts an
increase in durableoutlays of 1.4 percent in the first quarter,and 2.9
percentafter four quarters.Rising stock prices predicta proportionate
increase in durable outlays that is between four and six times larger
than that for nondurables,which, in turn, is several times largerthan
the increase in the consumptionof services.
To avoid the simultaneity in contemporaneousstock returns and
consumption growth, the results in table 12 focus on the change in
consumptionbeginning in the quarterafter a change in stock prices.
This may result in underestimatingthe total change in consumptionthat
is predictedby a stock price change, althoughthe use of quarterlydata
should mitigate this problem. We have explored the sensitivity of our
findings to the inclusion of contemporaneousstock marketreturns.In
an equation like that in the second row of table 12, where the sum of
the coefficients on four lagged stock marketreturnsis 0.064 (0.014),
the current stock market return has a coefficient of 0.011 (0.007).
55. We test for the possibility that stock price increasesare associatedwith proportionally different changes in subsequentconsumptionthan stock price decreases, but
find no evidence of such an effect.
56. In equationsnot reportedhere, we also include four lagged values of the real
consumptiongrowth rate in the specification. Only one of these values enters with a
statistically significant coefficient, and the predicted long-run effect of stock price
growthon consumptionis very similar to that from the equationin the second row of
table 12.
338
BrookingsPapers on EconomicActivity, 2:1995
The coefficients on the lagged stock market returnsremain virtually
unchangedwith the addition of the currentreturnto the specification.
The largest contemporaneouscorrelationis between stock returnsand
nondurableconsumption;the correlation with outlays on durables is
negative.
The point estimates in table 12 suggest that the 17 percentincrease
in share prices between December 1994 and June 1995 predicts an
increasein total consumptionof 1.09 percent,andan increasein durable
consumption of 4.9 percent, after four quarters. Since total durable
spending in 1994 was $591.5 billion and total consumption was
$4,628.4 billion, this correspondsto a $29 billion incrementto 1995
durableoutlays and a $50.4 billion increasein total consumption.Since
a 17 percent rise in share prices translatesinto just over $1 trillion of
wealth creation, the predictedchange in consumptionspending is approximately0.05 times the change in net worth.57Thus the conclusion
thatemerges from these consumptiongrowthequations,which exclude
many potential control variables, is very similar to that of traditional
aggregateconsumptionfunctionanalysis. The open questionis whether
these results reflect the stock market's role as a leading indicator, or
whether they are partly due to a wealth effect associated with stock
price fluctuations.58
Consumption and the Stock Market in 1987 and 1929
In spite of the long traditionof modeling aggregateconsumptionas
a function of labor income and household net worth, there appearsto
be some reluctanceto apply this model to the analysis of the consumption effects of large stock market movements.59This is particularly
57. One componentof the link between stock price fluctuationsand consumption
involves the "target saving" of defined benefit pension plans. When shareprices rise,
corporationsdo not needto contributeas muchto theirpensionplansto coverprospective
pension liabilities. This diminishes the flow of contributionsto these plans. In the
nationalincome accountsthese contributionsare classifiedas personalsaving. Bernheim
and Shoven (1988) discuss this linkage between asset prices and saving in more detail.
58. The ideal test for distinguishingthese views would study the reactionof consumptionto autonomouschanges in stock prices, changes that were not explainedby
revisionsto expectationsaboutfuturecash flows or discountrates. Morck,Shleifer, and
Vishny (1990) attempta related test in their analysis of how the stock marketaffects
investment.
59. Ando and Modigliani(1963) is the seminal paperon the empiricalmodelingof
James M. Poterba and AndrewA. Samwick
339
evident in discussions about the economic effects of the stock market
crashes in 1987 and 1929.
The stock marketcrash of October 1987 provides a valuable opportunity to study the effect of stock price fluctuationson consumption
spending, andto review the economic analysisof this effect. As a result
of the crash, real share prices declined by nearly 30 percentfrom their
peak in August 1987. In evaluatingthe potentialeffect of such a price
changeon consumerspending, the reportof the PresidentialTask Force
on Market Mechanisms concluded that "it is unlikely that a direct
wealth effect along the straightforwardlines usually described stands
behind . . . the observed relationship between stock price movements
and aggregate-level consumer spending."60 This statementwas based
on the fact that most householdsdo not own stock andthatamongthose
thatdo, the distributionof ownershipis highly concentrated,as well as
on the view thatthose who do own substantialstock have enoughwealth
to insulate their consumer spending from short-runshocks.6' Popular
accounts noted that the feared collapse in consumptionhad failed to
materialize in the months after the crash, and surveys indicated that
most consumershad not adjustedtheir spendingpatternsin responseto
the crash.62
Two importantfeaturesof the 1987 stock marketcrashwere the short
durationof the stock price increase that precededit and the reboundin
shareprices in the quarterafterthe crash. The growthpathof both total
anddurableconsumption,as well as the patternof stock marketreturns,
for the seven quarterscenteredon the October 1987 stock marketcrash
is shown below:
aggregateconsumptionas a functionof laborincomeandnet worth. Blinderand Deaton
(1985) providea recentdiscussion of aggregateconsumptionfunctions.
60. U.S. PresidentialTask Force on MarketMechanisms(1988, p. VII-2).
61. Mankiwand Zeldes (1991) note that householdsthatreportowning stock in the
Panel Study of Income Dynamics account for 32 percentof total food consumptionin
this database.Because the budgetshareof food is smallerfor high-income,high-wealth
households than for lower-income households, the fraction of total consumptionaccountedfor by stockholdersis presumablygreaterthanthis.
62. In a Business Week-Harrispoll, 85 percent of respondentsindicatedthat the
crash did not affect their finances. By that time some macroeconomicforecastershad
also reviseddownwardtheirview of the "wealth effect" of stockpriceson consumption.
(See KarenPennar, "It's Almost As If It Never Happened-Almost," Business Week,
April 18, 1988, pp. 56-59.)
340
Quarter
1987:1
1987:2
1987:3
1987:4(crash)
1988:1
1988:2
1988:3
BrookingsPapers on EconomicActivity, 2:1995
Log change
in stock price
14.8
1.9
4.6
- 29.0
9.1
0.6
- 2.3
Per capita growth
Total
consumption
Durables
-0.002
0.010
0.007
-0.003
0.015
0.004
0.005
-0.067
0.032
0.033
-0.034
0.047
0.002
-0.010
The stock price increases in the three quartersbefore the crash were
reversedby the crash, but stock prices finished 1987 only 7.7 percent
below their value a year earlier. The stock market rally in the first
quarterof 1988 left the marketabove its value in January1987.
The informaltable above shows that per capitaconsumptiongrowth
was slightly negative, and that growth in spending on durables was
substantiallynegative, in the quarterof the crash.63Includingindicator
variablesfor the fourthquarterof 1987 and the first quarterof 1988 in
the regressionequationsfor total consumptionoutlays reportedin table
12 yields coefficient estimates, with standarderrorsin parentheses,of
-0.0096 (0.0073) and 0.018 (0.008), respectively. Thus the first
quarterof 1988 experiencedmorerapidconsumptiongrowththanwould
have been predictedby simple models with four lagged quarterlyvalues
of stock returns. We cannot reject the null hypothesis of no unusual
effect on totalconsumptionin the fourthquarterof 1987.64 Fordurables,
the patternsare slightly different. The effect of the fourth quarterof
1987 is negative, but the coefficient for the firstquarterof 1988 is 0.071
(0.042). Expenditureon durablesdid decline in the quarterof the stock
marketcrash, but it was unusually strong during the first quarterof
1988, given the decline in share prices. The data thus suggest that the
63. Dornbuschand Fischer(1994) note thatconsumptiongrew slowly afterthe crash
and use this as evidence in supportof a wealth effect on consumption.
64. The models in table 12 relate consumptiongrowthto lagged returns.Since the
stock market crash occurred only three weeks into the fourth quarterof 1987, it is
plausibleto expect unusuallylow consumptiongrowth in this quarter.While the coefficient estimateon the dummyvariablefor the fourthquarterof 1987 confirmsthis, we
are unableto reject the hypothesisthat consumptiongrowthin this quarteris explained
by the model that excludes currentreturns.
James M. Poterba and AndrewA. Samwick
341
1987 stock marketcrash had a smaller negative effect on consumption
growththanthe regressionequationsin table 12 would have predicted.65
The events of 1929 and the early 1930s provide anotheropportunity
to study the effect of stock price fluctuationson consumption.The data
for this period are less detailed than for 1987, and the strengthof the
conclusions that can be drawn is correspondinglylower. Calculations
that assume a stable marginal propensity to consume out of wealth
suggest that the wealth effect of the 1929 crash on consumerspending
should have been small, both because the stock marketaccountedfor a
relativelysmall shareof householdnet worth, andbecausethe marginal
propensityto consume out of wealth appearsto have been small during
the interwarperiod.66Household spending on durablesdeclined more
than that on nondurables,which remainedrobustuntil 1932.67 Thus it
appearsthat the effect of a stock price decline on consumers, through
the wealth effect, was muted.
Stock Returns and Spending on Luxury Goods
We investigate whether stock price fluctuations affect consumer
spending througha wealth effect by examining whetherstock returns
forecastchanges in the compositionof consumerspending. We use the
ConsumerExpenditureSurvey published by the Bureauof LaborStatistics to identify several groups of goods that are disproportionately
consumedby high-incomehouseholdsthat are likely to own stock, and
65. Birinyi and Miller (1987) conclude that the evidence that stock marketfluctuations cause consumptionchanges is weak at best. They find a very weak association
betweenthe pricesof New YorkCity condominiumsandchangesin stock marketvalues,
despitethe fact that this is a luxuryconsumptionitem that might be demandedby stock
owners. This evidence is similar, in spirit, to ourtests for whetherstock marketfluctuations affect the shareof luxuryconsumption,discussed below.
66. A constantmarginalpropensityto consumeout of wealth is a specializedresult
thatobtains, for example, when a consumermaximizesa time-separableutility function
with per-periodutility given by ln(C). More generally, the marginalpropensityto consume out of wealth dependsupon the availablerateof return.
67. Temin (1976) discusses the effect of the 1929 stock marketcrashon consumption. Romer (1990) draws particularattentionto the role of consumeruncertaintyin
depressingconsumptionof householddurables.Wigmore(1985) examinesthe behavior
of the earningsand share prices of companies in various sectors of the economy and
notes the relatively stable earningsof retailersuntil 1932. Durablesproducers,notably
automobilecompanies, experiencedsharpdownturnsin profitsand share prices much
soonerafterthe crash.
342
BrookingsPapers on EconomicActivity, 2:1995
Table 13. Consumptionof Luxuries and Antiluxuries
Unitsas indicated
Consumption
category
Totalconsumption
Luxuries
New automobiles
Education"
OtherLodging
Entertainmentc
Householdservices
Anti-Luxuries
Renteddwellings
Tobaccoproducts
Consumptionshare
of $70,000 +
households"
Spendingratio,
$70,000 +
householdsto
$20,000-$30,000
households"
Consumption
shareby
category
0.236
1.85
1.000
0.314
0.308
0.369
0.337
0.296
3.10
3.24
3.69
3.44
2.76
0.023
0.023
0.003
0.004
0.003
0.045
0.099
0.25
0.54
0.037
0.008
Source: The consumption share of the highest-income households and the spending ratio are from the Consumer Expenditure Surveys for 1991-93, as reported in U.S. Bureau of Labor Statistics (1994). Consumption share by category is from
NIPA for 1994.
a. Households are allocated to income groups on the basis of pretax income.
b. Education is the NIPA personal consumption category for "education and research."
c. Entertainmentis the sum of the NIPA personal consumption categories for admission to "motion picture theaters,"
"legitimate theaters and opera," and "spectator sports."
test whether the share of these goods in aggregateconsumptionrises
afterstock prices increase.68Anecdotalevidence suggests a very strong
marketfor some luxuryproductsin 1995, possibly relatedto the rise in
shareprices.69
Table 13 presentsthe resultsof this analysisof consumptionpatterns.
It reportsboththe shareof spendingon particularitems thatis accounted
for by householdswith annualbefore-taxincomes of $70,000 andabove
(the value at which income in the ConsumerExpenditureSurveyis topcoded) and the ratio of spending by this group to spending by households with before-tax income between $20,000 and 30,000. For example, householdswith incomes of $70,000 andabove accountfor 31.4
percentof spending on new cars, while they account for 23.6 percent
of spendingon all goods.
Table 14 reportsthe results of estimating consumptionshare equations that are designed to evaluate whetherincreasesin shareprices tilt
68. U.S. Bureauof LaborStatistics (1994).
69. See LauraBird, "Tired of T-Shirtsand No-NameWatches, ShoppersReturnto
Tiffany and Chanel," WallStreetJournal, September6, 1995, p. B 1.
James M. Poterba and AndrewA. Samwick
343
Table 14. Consumptionof Luxuries and Antiluxuriesand Stock Price Fluctuationsa
One quarterlaggedchange
in stockprice
Four quartersumof lagged
changesin stockprice
0.250
(0.103)
0.627
(0.193)
Education
-0.022
(0.012)
-0.041
(0.024)
Otherlodging
-0.007
(0.041)
0.011
(0.082)
Entertainment
-0.086
(0.056)
-0.128
(0.109)
Householdservices
-0.000
(0.033)
0.019
(0.065)
-0.026
(0.007)
-0.051
(0.015)
-0.018
(0.024)
-0.071
(0.046)
Dependentvariable
Luxuries
New automobiles
Antiluxuries
Renteddwellings
Tobaccoproducts
Source: Authors' regressions based on data from NIPA.
a. The estimated equation is of the form ln(L,IC,) = ot( + ot lln(L,.1/C,_ I)I + 0t2(AInP,-1) + E,, where L, denotes
luxury (or antiluxury) consumption and C, denotes aggregate consumption spending. All equations are estimated from 1959:1
to 1995:2, with the exception of the equation for new automobiles, which is estimated from 1947:2 to 1995:2. All equations
include seasonal dummy variables. Standarderrors are shown in parentheses.
the composition of consumption toward goods that are consumed
by higher-income, stockholding households. The first row considers
spendingon new cars. A 10 percentrise in shareprices in the current
quarteris predictedto raise spendingon new cars as a fractionof total
consumptionby 2.5 percent in the next quarter, and by 6.3 percent
after four quarters.70After four quarters, a 20 percent rise in share
prices, similarto the rise in the firsthalf of 1995, would raise spending
on new cars from 2.3 percentto 2.6 percentof total spending.
Whetherthese findings for new car sales reflect the operationof a
wealth effect or simply the stock market'sforecastof strongconsumer
demandcan be evaluated by considering the relative demandfor differenttypes of automobiles.Ward'sAutomotiveYearbookallocatesnew
70. One difficulty with interpretingthese results is that automobilemanufacturers
and the firmsthat supply them with componentscomprisea nontrivialfractionof total
stock marketvalue. If investorsforesee an increase in new car sales, stock prices may
rise as a result.
344
Brookings Papers on EconomicActivity, 2:1995
Figure 5. Luxury Car Sales, 1980-95
Percentof new cars sold
Percentof new cars sold
16
4
A
tr
12
104
vu
cr
|
\i,
311l
0
10
Iars
Upperluxury
(rightaxis)
2
6
I
1980
I
1983
I
I
1986
1989
I
1992
l
1995
Source: Authors' calculations based on data from Ferris (1995). See text for classifications.
cars to several differentcategories, one of which is termed"luxury."71
This includes most cars with prices above $25,000 in 1994, and many
with prices below this level. Of 8.99 million cars sold in 1994, 1.22
million were classified as luxury cars. Further, the "upper luxury"
category, which accounted for 0.17 million cars in 1994, consists of
only fifteen models, including BMWs in the 5-, 6-, and 7-series, three
Jaguars,and Mercedes E- and S-class cars. The households who purchase these vehicles are almost surely in the wealth category where
stock ownership is prevalent, and many are likely to have substantial
equity portfolios. Figure 5 shows both luxuryand upperluxurycars as
a percentageof new car sales for the period 1980-95.
To study the effect of share prices on luxury car purchases, we
71. Ferris (1995).
James M. Poterba and AndrewA. Samwick
345
estimate a regression equation for the luxury fractionof new car sales
in each quarter. If share price changes affect consumer spending
througha wealth effect, then stock returnsshould affect positively the
fraction of new car sales that are classified as luxury vehicles. We
estimate this relationship for the period between the first quarterof
1980 and the second quarterof 1995:2, for which the Ward'sdatawere
available. The regressionequation, which includesunreportedseasonal
indicatorvariables, is as follows (with standarderrorsin parentheses):
ln(luxury,lallcar,) =
- 0.283 - 0.084(Aln Pt-,) + 0.821[ln(luxuryt_,/allcart_,)],
(0.130)
(0.098)
R2
(0.064)
= 0.763.
These resultsdo not supportthe existence of an importantwealtheffect.
The unreportedseasonal coefficients suggest that purchasesof luxury
cars reach their highest share of all vehicles in the fourth quarterof
each year; on average, they account for a 14.5 percentgreatershareof
total vehicle sales in the fourthquarterthanin the firstquarter,and 5.4
percentmore in the fourthquarterthan in the thirdquarter.
We estimate a similar equationfor the share of upperluxurycars in
the mix of automobilessold, with the following results (standarderrors
are in parentheses):
ln(upp luxtlallcart)
- 0.223 + 0.017(zln Pt ) + 0.900[ln(upp luxt/allcart)],
=
(0.244)
(0.046)
(0.056)
R2 = 0.824.
While stock prices are positively correlatedwith the upperluxuryfraction of new vehicle sales, the effect is not statisticallysignificant.These
results also provide little supportfor the wealth effect, as opposed to
the leading indicator, explanationof the correlationbetween stock returnsand futureconsumptiongrowth.
The results for the otherluxuryitems that we considerare consistent
with the findings for luxury cars. The regression coefficients on each
consumptioncategory are shown in table 14. We cannotreject the null
hypothesis that stock price changes do not predict any change in the
shareof aggregateconsumptionaccountedfor by education, hotel and
motel spending, domestic services, and entertainmentspending. In
346
BrookingsPapers on EconomicActivity, 2:1995
most cases the standarderrors on the estimates are large, admitting
large positive or negative effects, but the point estimates are not supportive of wealth effects.
The two "antiluxuries" consideredat the bottomof table 14 provide
more supportfor the propositionthat stock returnsaffect the composition of consumption. Rising share prices are associated with a decline
in the share of rental housing in total consumption, and exert a weak
negative effect on the share of tobacco spending. Thus, overall, this
analysis of luxury goods producestnixed results.
Stock Prices and Consumption: Household-Level Evidence
Aggregatedataappearto have limitedpowerto resolve whetherstock
returnsexert a significantwealth effect on consumption.An alternative
source of informationon this issue is household survey data. One of
the standardproblemswith basing such analysis on householdsurveys,
however, is the absence of data sets that collect informationon both
household portfolio holdings and consumption. The Panel Study of
Income Dynamics (PSID), which collects informationduringthe first
few monthsof each year, is one survey that does containboth types of
data, althoughdirect informationon consumptionis limited to outlays
on food. In an importantstudy designed to help resolve the "equity
premiumpuzzle," GregoryMankiw and StephenZeldes stratifyPSID
households into those that own stock and those that do not, and then
computethe correlationbetween growthin percapitafood consumption
andexcess returnson the stock marketfor the two groups.72The results
suggest that this correlationis substantiallyhigher for those who own
stock thanfor others. These resultscould be due to differencesbetween
stockholdersandnonstockholdersthatareunrelatedto shareownership,
per se, but they at least raise the possibility that stock returnsaffect
consumptionthroughwealth effects.
We revisit the Mankiw-Zeldesanalysis, but introducethree modifications. First, in additionto consideringgrowth in food consumption,
we analyze a broadermeasureof total consumption.JonathanSkinner
shows that informationon rent payments and house value, as well as
spendingfor food at home and away from home, can be used to obtain
72. See Mankiwand Zeldes (1991).
James M. Poterba and AndrewA. Samwick
347
a proxy for total householdconsumptionfor PSID households.73While
food consumption alone explains only 26 percent of the variation in
total consumptionfrom the ConsumerExpenditureSurvey, a consumption proxy including house value and rentalpaymentsexplains 72 percent. Thus it seems possible to substantiallyimprove upon food consumptionas an indicatorof householdconsumption.Second, we exploit
informationthat has been released since Mankiw and Zeldes's study,
notably, additional years of consumption data. Third, we use PSID
informationon participationin pension plans and employerthriftplans
to identify households that are likely to have only indirectholdings of
corporatestock. While direct ownership of tradedequity and mutual
fundscannotbe distinguishedin the PSID, the distinctionbetweenthose
with such equity holdings andthose with equity in 401(k) plans, 403(b)
plans, or definedcontributionpension plans is relevantfor our analysis
of direct versus indirectstock holdings.74
We follow previous work in defining the sample for analysis.75In
particular,we exclude PSID families who were partof the 1968 poverty
subsample, families that are living with other families (which makes
it difficult to distinguish consumptionoutlays), family-yearsin which
the identity of the household head or the head's spouse changed, and
family-yearsin which any componentof consumptionwas top-coded.
Our sample spans the period 1970-92, but because the PSID did not
collect informationon food consumption in 1973, 1988, or 1989, it
excludes the years 1973, 1974, 1988, 1989, and 1990.
We stratify PSID households along three dimensions. The first is
whether or not they report ownership of corporate stock or mutual
funds. We distinguish between households with different levels of direct equity ownership, defining as "stockholders" those with any corporatestock, those with morethan$ 1,000 in corporatestock, andthose
73. Skinner (1987) develops this broaderconsumptionmeasure and explores its
statisticalproperties.
74. The PSID survey asks households whetherthey own "any shares of stock in
publicly held corporations, mutual funds, or investment trusts, including stocks in
IRAs."
75. We follow the sample selection and datadefinitionrules describedin the appendix to Mankiw and Zeldes (1991) and Zeldes (1989). When we test for differences in
the correlationbetween consumptiongrowth and stock returnsfor householdsthathold
stock andthose thatdo not, we obtainresultsthatarebroadlysimilarto those of Mankiw
andZeldes for the sample periodthat they consider.
348
BrookingsPapers on EconomicActivity, 2:1995
with more than $10,000 (in 1984 dollars). The second dimension is
whether the head of household or the head's spouse participatesin a
thrift plan; and the third is participationin a pension plan.76We then
considerthe correlationbetween the year-to-yeargrowthof the Skinner
consumptionaggregate and stock marketreturnsfor groups of households with differentcombinationsof directequityholdings, thriftplans,
andpension coverage. While the previousanalysisfocused on quarterly
time-series data and related changes in consumptionto lagged stock
marketreturns, because the PSID data are annual we now focus on
contemporaneouschanges in share prices and consumption.77
Table 15 presentsthe resultsof our analysis. The upperpanel reports
results for growth in food consumption, while the lower panel is concerned with growth in the Skinnerconsumptionindex.78When we use
the Skinnerindex, we find small differences in the correlationbetween
growthin consumptionandstock returnsfor stockholdersandnonstockholders. For each classification of stock ownership, however, the correlation is greaterfor those who are classified as stockholdersthan for
those who are not. With the Skinner index, only one of these differences, that for stockholders with more than $10,000 in equity, approaches significance underconventional statistical tests. Most of the
findingsfor food consumption, in the upperpanel, are also imprecise.
It is disturbingthat many of the correlationsbetween the growth rate
of the Skinnerconsumptionindex andexcess stock returnsarenegative.
This appearsto be due to the nonfood componentsof the index, since
76. The PSID only collects detailed informationon pension plan characteristicsfor
workersover the age of forty-five. For youngerworkers,it does not distinguishbetween
definedbenefit and defined contributionplans. Thereforewe can only use an indicator
variable for "pension plan participant," recognizing that this includes some defined
benefitplan participantswith no equity stake along with equity holdersthroughdefined
contributionplans.
77. We have estimated the correlationbetween currentconsumptiongrowth and
lagged stock returnsfor the PSID householdsand findthatthe resultingcorrelationsare
indistinguishablefrom zero. This is due to our choice of sampleperiod;a similarresult
emergesfrom annualnationalaccountsdatafor the PSID sampleyears, even thoughour
findings in table 12 show that, over a longer period, quarterlynationalaccountsdata
suggest a positive correlationbetween changes in stock price and consumptiongrowth.
78. The differences in the correlationsbetween stock returnsand growth in food
consumptionfor stockholdersand nonstockholdersparallelthose in MankiwandZeldes
(1991). Ourresultsfromthe longerPSID sampleperiodyield less statisticallysignificant
differencesin these correlationsthanthose found by Mankiwand Zeldes.
James M. Poterba and AndrewA. Samwick
349
Table 15. Correlationof ConsumptionGrowth and Stock Returnsfor Stockholders
and NonstockholdersL
Correlation
Consumptionmeasure
and stockownership
category
Per capitafood consumption
Nonstockholders
Withoutthriftplan
Withthriftplan
Withoutpensionplan
Withpensionplan
Stockholders
Withoutthriftplan
Withthriftplan
Withoutpensionplan
Withpensionplan
Criterionfor classificationas a "stockholder"
Stock
value > 0
Stock
value > 1,000
Stock
value > 10,000
0.120
0.058
0.350
0.059
0.143
0.125
0.190
0.043
0.148
0.089
0.076
0.077
0.049
0.071
0.047
0.214
0.133
0.261
0.134
0.205
0.078
0.063
0.226
0.044
0.080
0.286
0.226
0.314
0.339
0.232
Per capitaSkinnerconsumptionindex
Nonstockholders
-0.125
Withoutthriftplan
- 0.208
Withthriftplan
0.218
Withoutpensionplan
- 0.217
Withpensionplan
-0.004
Stockholders
0.011
Withoutthriftplan
0.081
Withthriftplan
-0.095
Withoutpensionplan
0.055
Withpensionplan
-0.012
-0.146
-0.178
-0.010
-0.191
-0.090
0.068
0.042
0.094
0.026
0.092
- 0.126
- 0.182
0.048
-0.202
-0.052
0.219
0.269
0.097
0.226
0.187
Source: Authors' calculations based on data from the PSID.
a. Each entry reports the correlation of a measure of consumption growth with return on the stock market for PSID
households in each category, as described in the text. The sample period is 1970-92, excluding 1973, 1974, 1988, 1989,
and 1990. Stockholders are defined by the criteria at the column heads. The standard error of each calculation may be
computed as A/V(1where 16 denotes the degrees of freedom; these standarderrors are approximately0.25 for each
pT2)/16,
entry.
the correlationbetween food consumptiongrowthand excess returnsis
positive.
The results with respect to indirect stock ownershipare suggestive,
but not conclusive. For both food consumptiongrowthand the Skinner
index of consumptiongrowth, and for most definitionsof stock ownership, those who have thriftplans exhibit greatercorrelationbetween
consumptiongrowthand stock returnsthanthose who do not have thrift
plans. Similarly, those with pension plans, some of which are defined
contributionplans, also exhibit a higher consumptiongrowth correla-
350
BrookingsPapers on EconomicActivity, 2:1995
tion than those without such plans.79These results are consistent with
the notion that even indirect stock holding mattersin household consumption planning, but they do not reject the null hypothesis of no
effect. Moreover, some of the patternsare difficultto explain. For two
of the three definitionsof stock ownership, in the Skinnerindex, those
in thrift plans exhibit weaker consumption growth correlationsthan
those who are not.
The results of this analysis are strongerthan the findings using aggregate data, but they are still not conclusive. Stock returnsare more
closely correlatedwith the consumptiongrowthof householdsthatown
stock than of those that do not. The PSID data do not, however, have
enough power to distinguish between the view that only direct stock
ownership matters and the possibility that direct and indirect stock
ownershiphave similareffects on consumptiongrowth. The results are
consistent with the presence of a wealth effect, but they do not provide
definitive supportfor one. There is only weak evidence that the consumptiongrowth of those with larger stock portfolios is more closely
correlatedwith stock market fluctuationsthan is the consumptionof
those with small portfolios.
Share Ownership and the Consumption-Stock Price Nexus
The thirdbroadissue that we consider concernsthe effect of changing stock ownership patterns on the link between stock returns and
consumption. We study this question by interactingthe lagged stock
return variable in equation 1 with two measures of the fraction of
corporatestock held by households.80The first measure, which corresponds to direct individual ownership, is the ratio of stock ownership
for the Flow of Funds household sector (excluding nonprofitholdings)
to the total marketvalue of sharesoutstanding.This time series declines
substantiallyduringthe postwarperiod, from 72.3 percentin 1960, to
51.3 percent in 1980, to 40.2 percent in 1994. We amendequation 1
79. These findings emerge for two of the three definitionsof stockholders:those
with any equity and those with stock worth more than $10,000.
80. We also test the subsamplecoefficientstabilityof the equationsreportedin table
12, dividing the sample before and after the first quarterof 1970, and before and after
the first quarterof 1985. We cannot reject the null hypothesisof constantcoefficients
for any of the consumptioncategories;this foreshadowsourweak resultsfor the trending
shareownershipvariables.
James M. Poterba and AndrewA. Samwick
351
to include lagged stock price changes as well as the lagged price change
interactedwith the direct share ownershipmeasure,SHARE1, :
(2)
Aln c, = oxo+ (xI(AlnP,_ I) + o2(SHAREJ,t)(Aln
P,)
+
E,.
Because Aln Pt_ I andSHARE1,_l (Aln P,_ ) are collinearvariables,we
also estimate equationsthat only include the interactionterm.8'
In addition, we estimate equation 2 with a variable that captures
direct as well as indirectshareownership(SHARE2,)in the interaction
term. SHARE2,is the percentageof corporatestock owned by individuals directlyor throughbankpersonaltrusts, mutualfunds, anddefined
contributionpension plans. The time series for SHARE2,is shown in
the last column of table 6. This time series declines more gradually
over the postwar period than SHARE]. In 1970 SHARE2was 75 percent, and by 1994 it had fallen to 63.7 percent.
The results of estimatingequation2 are shown in table 16. The first
row shows an equation relating consumptiongrowth to lagged stock
returnswithout any allowance for shareownershipeffects. The second
row shows the effect of including the interactiveterm with SHARE],.
The coefficient on the lagged stock price change is negative, and that
on the interactionterm is positive and roughly twice as large as the
coefficient on the stock price change in the first row. The collinearity
of these two variablesmakes it impossible to reject the hypothesisthat
either oxlor Ot2 in equation 2 is equal to zero, although we reject the
hypothesis that these coefficients are jointly zero. The third row presents an equation that includes only the SHAREl,(AlnP, ) variable
and shows that the explanatorypower of this variablealone is greater
than that of the lagged stock price variablealone.82
The fourth and fifth rows in table 16 show results parallelto those
in the second and thirdrows, with SHARE2,insteadof SHARE],in the
interactionterms. The findings are similar to those for SHARE],; the
interactionterm is the more importantin the specification with both
variables and it has a positive effect on consumption, whereas the
81. Includinga trendingvariablesuch as SHARE],_ as a separateregressorin these
equationsdoes not affect the resultsbecausethereis little trendin the rateof consumption
growth.
82. A nonnestedhypothesis test of the model with SHAREJ,(AlnP,-,) as the dependentvariable, against the model with Aln P,_ , does not permitus to reject either
hypothesisin favor of the other.
352
Brookings Papers on EconomicActivity, 2:1995
Table 16. Regressions of Consumption on Stock Prices for Alternative Stock
Ownership Share Variablesa
Stockownership
share variable
Constant
Laggedchangein
real stockprice
Ownershipshare x
lagged changein
real stockprice
R2
None
.
.
0.0047
(0.0005)
0.030
(0.007)
0.0047
(0.0005)
- 0.003
(0.031)
0.060
(0.055)
0.098
0.0047
(0.0005)
. . .
0.056
(0.012)
0.104
0.0047
(0.0005)
-0.064
(0.069)
0.136
(0.099)
0.102
0.0047
(0.0005)
. . .
0.045
(0.010)
0.103
.
0.098
Direct individual
stock ownership
Expanded individual
stock ownership
Source: Authors' regressions based on consumption data from NIPA. Share prices and ownership are the authors'
calculations based on data in Federal Reserve, Flow of Funds Accounts.
a. The dependent variable is total consumption. Each row corresponds to an estimate of an equation of the form
An c, = oao+ ota(AlnP,_1) + _y2(SHAREI,II)AlnP,_1 + e,. All estimates correspond to the period from 1947:2 to
1995:2, representing 193 quarterlyobservations. The values ofSHAREI and SHARE2, that replaces SHARE] in the foregoing
equation, are defined on the basis of data from the Flow of Funds Accounts for the period from 1952:4 to 1994:4; they are
extrapolated at either end of the sample. All equations include seasonal dummy variables. Standard errors are shown in
parentheses.
lagged share price term alone has a negative coefficient. Yet the collinearityproblems remain. On balance, the results do not supportthe
view that changing patternsof stock ownershipalter the link between
shareprice fluctuationsand consumption."83
The Forecasting Power of Stock Returns, Dividend Movements,
and Earnings Movements
A final aspect of the linkage between stock returnsand consumption
concernswhetherthe source of stock price fluctuationsaffects the predictive power of stock returnsfor future consumptiongrowth. Given
83. One way to develop additionaltests of whetherstock ownershippatternsaffect
the wealtheffect of stock prices on consumptionwould be to analyzedatafromdifferent
countries. In Japan, for example, the fractionof shares held directly by individualsis
substantiallylower than that in the United States.
James M. Poterba and AndrewA. Samwick
353
the evidence that fluctuations in the price-to-dividend and price-toearnings ratios predict future stock returns, implying that increases in
stock prices that are not associated with rising dividends are more likely
to be transitory than similar price changes backed by dividend fluctuations, there might be differences in the predictive effects of different
stock market shocks.
To explore whether fluctuations in share prices, dividends, earnings,
or some combination of these variables have the greatest predictive
power for consumption spending, we augment equation 1, for the simple case of ox(L) = ox, with the lagged change in dividend payments
for the stocks in the S&P 500, Aln Dt_ l:
(3)
Aln c,
= oxo +
xI(AlnP,t)
+ y(Aln D,t)
+
E,.
If share price fluctuations predict the same change in future consumption regardless of their source, then Yi should equal zero. If stock prices
only predict changes in consumption when prices move while the priceto-dividend ratio remains constant, then yl should be positive and o(x
should be indistinguishable from zero.
Table 17 shows the results of estimating equation 3, with dividend
growth rates and also lagged earning growth rates in the specification.
The estimates suggest that changes in stock prices predict similar
changes in consumption, regardless of their source. The equations that
include lagged dividend growth provide no support for the view that
dividend fluctuations can predict future consumption growth. We cannot reject the null hypothesis that changes in real dividends have no
predictive power for future consumption growth, and the estimated
coefficient on real share prices is virtually unaffected by including real
dividends in these equations. These results are insensitive to our choice
of consumption aggregate.
The results with lagged earnings growth are more difficult to interpret. For two of the four broad consumption categories, total consumption and spending on durables, the lagged earnings growth variable
enters with a positive coefficient that is statistically significantly different from zero at roughly the 10 percent significance level. Controlling
for earnings growth does not reduce the coefficient on the lagged change
in real stock prices, but actually raises this coefficient in all specifications. As a further test of these results, not shown here, we have estimated models with four lagged values of real stock price changes and
354
BrookingsPapers on EconomicActivity, 2:1995
Table 17.Linkage between ConsumptionSpending, Stock Price Fluctuations,
Dividends, and Earningsa
Dependent variable
Total consumption
Consumption of durables
Consumption of nondurables
Consumption of services
Constant
Lagged
stock price
Lagged
dividends
0.0045
0.030
0.002
(0.0005)
(0.007)
(0.021)
0.0044
0.032
(0.0005)
(0.007)
0.0070
0.137
(0.0030)
(0.041)
0.0063
0.146
(0.0029)
(0.041)
...
-0.008
. . .
0.032
0.013
(0.021)
0.033
. . .
0.0059
0.008
0.001
(0.006)
(0.016)
0.0058
0.008
(0.006)
0.071
0.015
0.081
.
.
0.046
0.100
0.062
.
.
.
0.074
0.010
0.076
.
(0.011)
(0.0004)
(0.0004)
.
.
(0.056)
(0.008)
(0.008)
R2
(0.113)
0.0022
0.0021
.
_
(0.010)
(0.0006)
(0.0006)
Lagged
earnings
.
.
.
. ..
0.005
-0.001
0.001
(0.008)
Source: Authors' regressions based on consumption data from NIPA. Stock prices, dividends, and earnings are the
authors' calculations based on data in Federal Reserve, Flow of Funds Accounts.
a. Each row reports estimates of the coefficients in the equationAin c, = oao+ ota(AlnP,_l) + -yj(Aln D,_,) + El, or
this equation with E,_- replacing D,_ 1. All estimated correspond to the period from 1947:3 to 1995:2, representing 192
quarterly observations. Dividends denotes the real value of dividend payments to shares in the S&P 500; earnings denotes
the analogous measure of earnings for these firms. Standarderrors are shown in parentheses.
four lagged values of real earnings growth. The results do not support
the notion that earnings fluctuations are an important determinant of
consumption growth. The sum of the coefficients on the four lagged
stock return terms is positive and statistically significantly different
from zero. The sum of the coefficients on lagged earnings, however, is
negative and statistically insignificantly different from zero. Thus the
evidence seems to suggest that share price increases have similar effects
on consumption, regardless of their source.
We follow a separate strategy to identify the effects of shocks to
discount rates and to expected cash flows on consumption growth. We
estimate a first-order autoregression for the price-to-dividend ratio and
define the residuals from this equation as estimates of the shock to
discount rate expectations.84 For the period from the second quarter of
84. This procedurefollows the suggestion of Fama and French(1988, p. 20), who
James M. Poterba and AndrewA. Samwick
355
1947 to the second quarter of 1995, this autoregression generates an
estimated coefficient of 0.961 (0.021) on the lagged value of the dividend-to-price ratio (DIP). We then include the value of [(D/P),_ 0.961(D/P),t2] in regression equations analogous to those in table 12.
The results suggest that it is not possible to distinguish the effects of
discount rate shocks and cash flow shocks with the available data. For
example, the estimated equation for total consumption (with standard
errors in parentheses) is
Aln c,
=
0.004 + 0.013(Aln P,t-) - 0.004[(D/P),
(0.001)
(0.016)
(0.003)
R2 = 0.0719.
I - 0.961(D/P),t2],
The imprecision of the coefficient estimates makes it difficult to argue
that shocks to expected returns are more or less important than shocks
to cash flow in predicting future consumption growth.
Conclusions and Future Directions
This paper documents substantial changes in the aggregate and crosssectional patterns of corporate stock ownership during the postwar period. There has been a gradual but significant trend toward greater
ownership of equity through mutual funds and thrift plans (for example,
401(k)s, ESOPs, and 403(b)s) and defined contribution pension plans.
In each of these cases direct individual ownership has been replaced by
indirect ownership through a financial intermediary. The rise of IRAs,
thrift plans, and other related institutions has led to an increase in stock
ownership during the most recent decade, substantially reversing a decline during the previous two decades.
We explore the implications of growing ownership by intermediaries
for the effect of stock price fluctuations on consumer spending. We find
clear evidence that changes in share prices portend growth in consumer
spending, and particularly large growth in outlays on consumer durables. We then try to distinguish between two alternative explanations
arguethat "the unexpectedcomponentof DIP can be interpretedas a (noisy) measure
of the shock to expected returns."
356
Brookings Papers on EconomicActivity, 2:1995
for this finding. The first is the view that stock returnsare a leading
indicator, reflecting news that suggests a prospective increase in consumption before the change actually occurs. The second is the traditional wealth effect of asset market fluctuations, which suggests that
higher stock prices should lead to an increase in consumerspending.
We investigatethe effect of stock returnson the shareof consumption
thatis devoted to luxurygoods, and also use household-leveldatafrom
the Panel Study of Income Dynamics to study the correlationbetween
consumptiongrowth and stock returnsfor households that own corporate stock and those thatdo not. We do not find any pronouncedeffects
of stock price fluctuationson the mix of luxury and nonluxuryconsumptionwithin the following year. This evidence casts doubt on the
short-run importance of wealth effects associated with stock price
movements.85We do not find any evidence that changing patternsof
shareownershiphave alteredthe relationshipbetween stock price fluctuationsand consumption,even thoughsuch effects might be expected
in some behavioralmodels of saving and consumption.
These findings representa challenge to the traditionalmodel of the
aggregateconsumptionfunction that is found in many macroeconomic
textbooks.86The logic of budgetconstraintssuggests that stock market
rallies that increasehousehold wealth must be reflectedeither in higher
consumptionduringthe lifetimes of currentstockholders,or in greater
bequests.It is possible thatconsumptionrespondsgraduallyto increases
in stock marketwealth, and that our focus on fluctuationsin consumption within a year of stock price movements does not capture these
effects. It is also possible that the effect of stock price fluctuationson
consumptionoperates throughchannels other than a direct wealth effect, for example by altering "consumerconfidence." Moregenerally,
our findingssuggest the need to develop betterdata, andpossibly better
models, for the determinationof consumptionspendingby high-wealth
households.
While our primaryfocus is on testing for wealth effects, we also
investigate the links between the predictivepower of changes in stock
85. It is still possible that cash realizationsof past gains affect currentconsumption
outlays, as suggested in Poterba(1991).
86. In manyways, they parallelthe findingsof Morck,Shleifer, and Vishny (1990)
thatthe stock market'srole in predictinginvestmentmovementsis largelydue to its role
as a passive informantof futuredevelopments.
James M. Poterba and AndrewA. Samwick
357
prices, dividends, and earnings for future consumption growth. Substantial evidence suggests that changes in share prices that are not
associated with changes in dividends are transitory, yet we find find no
evidence that consumption evolves differently after increases in share
prices associated with dividend increases than after changes associated
with discount rate movements.
Our analysis focuses on a relatively limited set of household responses to higher stock prices and leaves many issues for further research. We have not considered the possibility that higher share prices
lead to changes in labor supply, for example, to earlier retirement by
those nearing retirement age. Rising share values that lead to increases
in household net worth may also trigger changes in occupation, such as
leaving paid employment and striking out as an entrepreneur.87 Furthermore, the influence of consumer confidence on spending decisions
is poorly understood.
Some of the most important issues that arise from changing stock
ownership patterns, and which our tests have not addressed, concern
the effect of ownership structure on the performance of asset markets.
If the switch from direct individual ownership to indirect stock ownership through a small set of financial intermediaries alters the way in
which investors respond to new information or to past stock returns,
then it could have significant implications for many aspects of macroeconomic performance, including capital availability and market volatility.88 Many discussions of noise trader models in financial economics
implicitly portray individual investors as poorly informed traders who
may be affected by fads or other investment trends, and professional
money managers as arbitrageurs who trade against this group. Exploring
these issues requires information on how institutional investors differ
from individual investors along a range of dimensions; much of the core
research remains to be done.
87. Holtz-Eakin,Joulfaian,andRosen (1994) presentempiricalevidence suggesting
that the decision to become self-employed is sensitive to changes in net worth, in their
case, the receipt of a bequest. Samwick (1995) summarizesthe availableevidence on
the effects of financialassets on retirementdecisions.
88. Friedman(1996).
Comments
and Discussion
Andrei Shleifer: James Poterba and Andrew Samwick have written a
fascinating paper in the growing literature on the (nonexistent) effects
of the stock market on real economic activity. Although they produce
many nice results, I will focus only on certain points.
The paper begins by showing how high U.S. stock prices are in mid1995, relative to traditional measures of fundamentals, such as the book
value of assets or dividends. Despite their striking evidence, the authors
do not conclude that the stock market is overvalued. I might be less
cautious. At the peak of almost every financial bubble, theories have
been advanced to explain why assets prices were not, in fact, excessively high. In Japan in the mid-1980s, some people argued that the
economy would continue to grow at 8 percent per year forever, thus
justifying stock prices that were about to fall by half. In the United
States, Irving Fisher argued that the stock prices had "reached a new
and higher plateau" shortly before the crash of 1929. Before the demise
of Drexel, Burnham, Lambert and the collapse of junk bonds, Michael
C. Jensen argued that the corporate organizational form was obsolete,
and ready to be replaced by leveraged buyouts financed by debt. In the
Florida land bubble of the 1920s, William Jennings Bryan argued that
much of American population was going to move to Florida. The list
can be expanded to suggest that plausible theories are usually advanced
to justify asset prices that seem excessive, based on historical averages,
and that typically, these plausible theories prove to be wrong.
In what is perhaps the most important contribution of the paper,
Poterba and Samwick document persuasively that most American equi358
James M. Poterba and AndrewA. Samwick
359
ties are owned by wealthy old people. This section strongly suggests
that understanding the effects of the stock market on real economic
activity would require focusing on the habits of these people. Unfortunately, the data used in the paper do not specifically address the
behavior of the wealthy elderly. Nor does the paper address the implications of this evidence for economic policies that have the potential to
increase both equality and economic growth, such as selectively cutting
social security and medicare benefits.
The most interesting theoretical question that the paper poses is
whether the stock market affects real economic activity. Answering this
question is difficult since, to the extent that the stock market is correlated with the net present value of future cash flows to equities, it will
forecast future economic activity without really affecting it. Indeed,
earlier studies of investment have concluded that the stock market looks
more like a passive predictor than a significant determinant of investment.' Poterba and Samwick ingeniously address the closely related
question of whether the wealth increases resulting from stock market
movements affect consumption. Their strongest test uses the earlier
result that the wealthy own a very high fraction of equities, and examines the effect of stock price movements on the consumption of
luxuries, such as upper luxury cars. By and large, their evidence shows
that stock price movements do not affect the consumption of luxuries
disproportionately. This, as well as most of the other evidence presented
by Poterba and Samwick, is inconsistent with the importance of the
wealth effect and consistent with the earlier findings on investment. In
the short run, at least, the stock market is a sideshow for consumption
as well as investment. The good news, of course, is that if stock prices
fall from their 1995 heights, the economy need not follow.
Robert J. Shiller: In much of the discussion of the stock market, dating
back many years, there has been a sense that it is meaningful to present
the observed relation between stock prices and macroeconomic aggregates such as consumption in very simple terms, that it is possible to
discover very simple hypotheses about the relation of the market to the
macroeconomy. James Poterba and Andrew Samwick present two such
1. See, for example, Blanchard,Rhee, and Summers(1993) and Morck, Schleifer,
and Vishny (1990).
360
BrookingsPapers on EconomicActivity, 2:1995
hypothesesand endeavorto find out whetherthere is any basic truthin
either of them. According to the wealth effect hypothesis, there is a
causal link from the stock market to consumption:when people see
stock prices rise, they feel richer and so, consume more. For this reason, an increase in the stock marketwill cause future consumptionto
increase. According to the leading indicatorhypothesis, the causality
works in reverse: from informationthat consumptionwill increase in
the future(therebyimprovingthe business situation)to the stock price
increase. Poterbaand Samwick intendto distinguishbetweenthese two
hypotheses; they are very imaginative and resourceful and provide a
large amountof relevant information.
One problem is that these two different hypotheses are not really
different.Whenchoosing how muchto consume, people areat the same
time choosing how much of theirresourcesto put into savings vehicles,
such as the stock market, instead. They make the two decisions at the
same time, and the outcome is both the level of consumptionand the
level of the stock market. How can it be meaningful to specify the
directionof causality?
Poterba and Samwick never completely explain the two causality
hypotheses, and it is not clear that the extremehypothesesreally make
any sense. Could it possibly be meaningful to say that there is, ultimately, no wealth effect from the stock marketon consumption;that
is, thatif people were given more stock, they would not consumemore?
In particular,would this make sense over long periods of time? Could
it possibly be meaningfulto say that, ultimately, the stock markethas
no tendencyto function as a leading indicatorof consumption;that is,
that if it were announcedthat people would be forced to consume less
(for example, through taxes), there would be no effect on the stock
market?Apparentlythe authors are not seriously proposing either of
these extremehypotheses, but are tryingto determinewhich hypothesis
is moreuseful for understandingthe observedcorrelationbetweenyearto-year movements in the stock market.
One interpretationof how they are trying to distinguishbetween the
two different directions of causality is that they are trying to learn
something about lengths of lags. For example, the wealth effect hypothesis could be counted as wrong, as they note in their conclusion,
if people take longer than one quarter(the forecastinghorizonin much
of this paper)to adjusttheir consumptionto theircurrentwealth. If that
James M. Poterba and AndrewA. Samwick
361
is what Poterbaand Samwick are exploring here, it is not really best
describedas an issue of causality.
Anotherinterpretationis that they are saying that it might be meaningful to suppose that there is a single direction of causality if two
different groups of people are making the two decisions, to consume
and to invest in stocks. By framingthe issues in this way, Poterbaand
Samwick take account of some very importantfacts about the U.S.
economy that many theorists wish they did not have to confront in
building their models, and the more abstracttheorists almost always
ignore: that much of the investing is done by institutionalinvestors,
and that a large proportionof the stocks are held by a small, wealthy
segment of the population.
There might be evidence suggesting something akin to the leading
indicatorhypothesis if the tendency towardinstitutionalownershipof
stocks had proceeded to such an extent that all stocks were held in
pension funds managedby professionals. The "mental compartment"
theoryof H. M. ShefrinandRichardThalercould implythatindividuals
put their institutionalizedinvestments into a certain mental category
thatis off-limits for currentconsumption,even if they actuallyare able
to get at them, and thereforeare psychologically committedto leaving
theirconsumptiondecisions to the institutionalinvestors.' The ShefrinThaler theory derives from the notion that people find it difficult to
limit their consumption;saving is a little like dieting. People find that
it is easiest to control themselves if they follow simple rules of thumb
(analogousto dieters swearing off sweets altogether). In addition, retiredpeople mightnever consumetheiraccumulatedwealth, but instead
bequeathit to the next generation. Then, conceivably, there might not
be a wealth effect; consumersmight not react to stock marketvalues.
The lack of response in domestic consumptionto the domestic stock
marketwould be even clearer if institutionalinvestors diversified all
aroundthe world, so that a country's wealth did not correspondto the
value of its stock market. If that were the situation today, then there
would, indeed, seem to be some merit to the extreme leading indicator
hypothesis. When deciding their allocationsbetween stocks and bonds
in variouscountriesandotherinvestments,institutionalinvestorsmight
react to informationabout future consumptionin the home countryof
1. See Shefrinand Thaler(1988).
362
BrookingsPapers on Economic Activity, 2:1995
the companies, wherethey tend to sell theirproducts,andtherebymake
the stock market a leading indicator;but there would be virtually no
reverse causality, from the stock marketin a countryto consumption
in that country, operatingthroughthe consumersthemselves.
As Poterba and Samwick so carefully document, there is only an
element of truthto the premisethatcontrolof stock marketinvestments
has been turnedover to people otherthanconsumers.Most U.S. stocks
are still held by U.S. citizens, not foreigners. Moreover, much of the
increasedconcentrationof holdings of stocks is in the form of mutual
funds that people are able to cash in and thus, control. It is probable
that people do not put mutual fund investments in a very different
mental category from direct investmentsin stocks.
Theremight also be evidence suggesting some version of the leading
indicatorhypothesis if the wealthy subset of the populationthat holds
stocks is very differentfrom the generalpopulationwhose consumption
dominatesin the consumptionfigures. Thenthe profitsof the companies
thatrepresentthe stock marketwould be tied to the futureconsumption
of the population at large, and thereforethe marketought to take account of informationabout this. But the future consumptionthat responds to the marketthroughthe wealth effect would be the consumption of wealthy people.
Poterbaand Samwick carefully show that the concentrationof stock
holdings does, indeed, remain in a few wealthy hands:they conclude
that about three-quartersof all stocks are currently held by only 5
percent of the population. Moreover, they provide evidence on the
consumptionof the wealthyfromdataon expenditureson luxurygoods.
The fact that their regressions fail to find any predictive power of the
U.S. stock marketon domestic luxury car sales does seem to suggest
that the wealth effect is not a strong one; if there was a rapid stock
marketwealth effect anywhere, it would be on luxurycar sales. (However, the coefficient of the stock marketis not significantlynegative,
and it is unclearhow large a coefficient should be expected from these
rathervaguely defined hypotheses.)
Poterba and Samwick carry the evidence for the leading indicator
hypothesisfurtherby using Skinner'smethodof derivinga consumption
aggregatefor groups of households that hold stocks. But the Skinner
proxy seems more than a little questionable.He createshis proxy from
the ConsumerExpenditureSurvey, by fitting a cross-sectionalregres-
James M. Poterba and AndrewA. Samwick
363
sion of total consumptionon food consumption,house value, andrental
payments. The fitted value of this regression can then be generated
using the panel data from the PSID. But it does not seem appropriate
to use quarterlychanges in such a variable as a proxy for quarterly
change in consumption. Short-runchanges in house values and rents
are not, themselves, changes in the consumptionof housing services,
since the housing stock is fixed in the short run. Skinner argues that
this same predictiveequationfits equallywell using cross-sectionaldata
from both the 1972-73 and the 1983 ConsumerExpenditureSurveys;
but this is an intervalof a decade, not a quarter.In any event there is,
in effect, only one out-of-sample observation-1983-to test the stability throughtime of the Skinnerrelation.2
PoterbaandSamwickalso reportsome interestingconsumptionfunction estimates with which they attemptto uncover an interactioneffect
between the share of households investing in stocks andthe stock market price. Unfortunately, as they themselves point out, the multicollinearity in these regressions prevents them from drawing any strong
conclusions.
Overall, Poterbaand Samwick conclude that their evidence is more
in accord with the leading indicatorthan the wealth effect hypothesis.
While thereis nothingdefinitiveaboutthis statement,they areprobably
on the right track;their most convincing evidence is their regressions
of luxury good consumption, such as luxury cars, on stock market
returns. Interpretingthis denial of the wealth effect hypothesis as an
indication that people may respond very sluggishly to changes in the
stock market,Poterbaand Samwickmay be rightto say thattheirresults
suggest that the rapideffect of the stock marketon consumptionallegedly representedin the consumptionfunctionsof some macroeconomic
models might, in fact, be spurious. I suppose that it is plausible that
wealthy people do not adjust their consumptionbehavior rapidly to
change in the stock market;they may, for example, tend to thinkof the
stock marketas mean-revertingand so, not react to it much until a lot
of time has gone by.
Still, Poterba and Samwick's models of the consumptionfunction
are only suggestive, and many other confounding factors could be
broughtto bear, possibly changingtheir conclusions. Those who work
2. Skinner(1987).
364
BrookingsPapers on EconomicActivity, 2:1995
in the macroeconometricmodel traditionwould include several other
variablesbesides the stock marketin theirregressions. For example, in
Ray Fair's model the consumptionequations also include disposable
income, the mortgage interest rate, the value of the stock of housing
(as partof a broaderwealth measure), the stock of consumerdurables
(in durables consumption), and age (baby boom) variables, as well
as lagged consumption. He finds all of these to be statistically significant in his estimation of U.S. consumptionequations for the period
1954-93, and achieves an R2 of well over 0.99 in explaining the level
of consumption.3Fromthis perspective,Poterbaand Samwick'sresults
might partly be due to the omission of certain variables in the consumptionmodel, or the failureto take accountof simultaneousequation
effects. Thus it would be risky to try to infer much from such simple
consumptionrelations.
Muchrecentliteratureon consumptionhas suggestedtheoreticalreasons for using some very simple models. The empirical literatureon
stock prices and consumption has been heavily influenced by Euler
equationmethods, which are based on first-orderconditions for a hypothesized maximizationproblem. These methods do suggest simpler
relationsthanthe complicatedconsumptionfunctionsused by the macroeconomicmodel builders. For example, it is not necessaryto include
the interestrate in the model of consumptionand stock prices because
this variabledoes not appearin the usualEulerequationfor stockprices.
But the hypotheses underconsiderationhere do not seem to fit into the
appropriatemaximization framework. Poterba and Samwick are not
estimating Euler equations, since the stock price change that they include in their regressions is lagged, ratherthan contemporaneous.
General Discussion
Several participantsdiscussed the theory and evidence behind the
idea that changes in stock price cause changes in consumption.Benjamin Friedmannoted that estimates of the traditionalModiglianiwealth
effect suggest that for every dollar of change in aggregate wealth,
aggregate consumption changes by about 5 cents within a year. To
3. See Fair (1994).
James M. Poterba and AndrewA. Samwick
365
gauge how reasonablethat estimate looks when applied to changes in
stock prices, he suggested looking at stock ownershipin termsof three
distinctgroups. The top 0.5 to 1 percentof stockholdershold very large
amountsof stocks and are unlikely to adjusttheir consumptionappreciably over shorttime horizons. The lower 80 percentof the population
owns a negligible amountof stocks andso would be unaffectedby stock
price changes in the short to medium term. This leaves the remaining
19 percent, who own noticeable amountsof stock, to account for virtually all the change in aggregateconsumptionpredictedby the aggregate wealth effect. Friedmanregardedsuch a concentratedchange in
consumptionas implausible. Gregory Mankiw, however, argued that
the marginalpropensityto consume of those in the top 20 percent of
the populationshould be expected to be high because these people are
in older households and so, in a life-cycle framework,would be predicted to consume a large proportionof incrementalwealth.
John Shoven pointed out another possible response to stock price
changes related to the concentrationof ownershipamong older, highincome, households. These individuals might spend their windfall by
bringingforwardtheir retirement,a form of consumptionthat lies outside the consumptionmeasuresin the paper. Shoven suggested looking
for real effects of changes in stock prices by examiningthe correlation
between stock prices and labor force participationfor this group of
consumers. He added that anothereffect of the recent runupin stock
prices might be found in the reduced saving of the defined benefits
sector of the pension industry. Andrew Samwick agreed with the importance of Shoven's point about retirementbehavior and suggested
extending it to examine the effect of the stock marketon new business
startupsand entrepreneurialactivity more generally.
Robert Hall noted that the life-cycle model of consumptioncould
accommodatethe fact that consumptiondid not react to the 1987 stock
marketcrash. If the utility function has an elasticity of intertemporal
substitutionof zero, people simply consume out of currentincome.
Interpretinga stock marketcrashas an increasein the discountratethat
is appliedto futureearnings, two effects on consumptionexactly offset
each other, so that thereis no consumptionresponse. With the discount
rate rising and the stock marketfalling, the productof the two, which
can be thoughtof as the underlyingflow of value fromstock ownership,
remainsthe same. Thus Hall suggested that the consumptionresponse
366
BrookingsPapers on EconomicActivity, 2:1995
to the 1987 stock market crash can be seen as a naturalexperiment
providingevidence that, in the life-cycle framework,the elasticity of
intertemporalsubstitutionshould be near zero ratherthan one.
Membersof the panel suggested alternativeapproachesto looking at
the consumptionresponseto stock price changesanddiscussedpossible
extensions of the paper. Hall questionedthe paper's focus on the predictive effect of lagged stock price changes on consumptionwhen the
life-cycle model suggests that the entire wealth effect is contemporaneous. ChristopherSims agreed, and addedthat the econometricwork
in the paper fell in some unclear middle groundbetween testing theories, such as the life-cycle model, and attemptingto find optimal forecasting relations. He suggested testing the simple stochastic life-cycle
model, with its contemporaneouseffects of wealth on consumption,to
see just how it performs in explaining the data. Because this model
relates consumptionto total wealth, it would be necessary to examine
whetherother componentsof total wealth are systematicallyrelatedto
stock wealth, a possibility that might improve the performanceof the
model. As for forecasting, Sims noted that serious forecasters used
many variables, some of which might be correlatedwith stock prices,
and that the forecasting value of stock prices alone was of limited
interest. Allen Berger underlinedthe need for making the measureof
wealthmore comprehensiveby noting thatthe large swings in the debtto-equityratios of companiesmay occur at the same time as their stock
price is changing. He advocatedcheckingwhetherthe estimationresults
are robust to including the value of debt along with equities. Sims
observedthat equity costs were an incompletemeasureof a company's
cost of capital. He noted that other natural measures of the cost of
capital might move in the same way or in an off-setting direction to
stock prices. MargaretBlair observedthatthe sharesof outputgoing to
labor and capital have not been constantover time, and that some part
of the runup in stock prices in recent years can be attributedto an
increase in the capital share. This shift away from labor should be
expected to hold down the consumptionof the 80 percentof the population that owns little or no stock, creating a negative correlationbetween consumptionand stock prices on this account.
Anil Kashyap suggested using consumptionand stock marketdata
fromJapanto supplementthe paper'sanalysis based on U. S. data. The
spectacularrise and subsequentcollapse of the Japanesemarketshould
James M. Poterba and AndrewA. Samwick
367
provide ample variation from which to identify any consumptionresponse to stock price changes. He conjecturedthatevidence fromJapan
would support the view that the stock market is a sideshow and has
little effect on people's consumptiondecisions.
368
BrookingsPapers on EconomicActivity, 2:1995
References
Ando, Albert, and FrancoModigliani. 1963. "The 'Life Cycle' Hypothesisof
Saving: Aggregate Implications and Tests." American Economic Review
53(1): 55-84.
Antoniewicz, Rochelle L. 1995. "A Comparisonof the HouseholdSectorfrom
the Flow of Funds Accounts and the Survey of Consumer Finances."
Unpublished paper. Board of Governors of the Federal Reserve System
(February).
Attanasio,Orazio P. 1994. "Personal Saving in the United States." In International Comparisons of Household Saving, edited by James M. Poterba.
Chicago:Universityof Chicago Press.
Avery, RobertB., and GregoryE. Elliehausen. 1986. "FinancialCharacteristics of High-IncomeFamilies." Federal ReserveBulletin 72(3): 164-77.
. 1988. 1983 Survey of Consumer Finances: Technical Manual and
Codebook.Washington:Boardof Governorsof the FederalReserveSystem.
Avery, Robert B., Gregory E. Elliehausen, and Glenn B. Canner. 1984.
"Survey of Consumer Finances, 1983." Federal Reserve Bulletin 70(9):
679-92.
Avery, Robert B., GregoryE. Elliehausen, and ArthurB. Kennickell. 1988.
"MeasuringWealthwith Survey Data:An Evaluationof the 1983 Surveyof
Consumer Finances." Review of Income and Wealth 34(4): 339-69.
Bagwell, Laurie Simon, and John B. Shoven. 1989. "Cash Distributionsto
Shareholders." Journal of Economic Perspectives 3(3): 129-40.
Barro, Robert. 1990. "The Stock Marketand Investment."Review of Financial Studies 3(1): 115-31.
Bernheim, B. Douglas, and John B. Shoven. 1988. "Pension Funding and
Saving." In Pensions in the U.S. Economy, edited by Zvi Bodie, John B.
Shoven, and David A. Wise. Chicago:Universityof Chicago Press.
Birinyi, Laszlo, Jr., and Keith Miller. 1987. "The WealthEffect." Salomon
BrothersEquity MarketAnalysis. New York: Salomon Brothers(November).
Blanchard,Olivier, ChangyongRhee, andLawrenceH. Summers.1993. "The
Stock Market, Profit, and Investment." Quarterly Journal of Economics
108(1): 115-36.
Blinder, Alan S., and Angus Deaton. 1985. "The Time Series Consumption
FunctionRevisited." BPEA, 2:1985, 465-51 1.
Blume, MarshallE., JeanCrockett,and IrwinFriend. 1974. "Stockownership
in the United States: Characteristicsand Trends." Surveyof CurrentBusiness 54(11): 16-40.
Blume, MarshallE., and Stephen P. Zeldes. 1993. "The Structureof Stock-
James M. Poterba and AndrewA. Samwick
369
ownership in the U.S." Unpublished paper. University of Pennsylvania,
Wharton School of Business (March).
Bosworth, Barry, Gary Burtless, and John Sabelhaus. 1991. "The Decline in
Saving: Evidence from Household Surveys." BPEA, 1:1991, 183-241.
Campbell, John Y., and Robert J. Shiller. 1988a. "The Dividend-Price Ratio
and Expectations of Future Dividends and Discount Factors." Review of
Financial Studies 1(3): 195-228.
. 1988b. "Stock Prices, Earnings, and Expected Dividends." Journal
of Finance 43(3): 661-76.
Cochrane, John H. 1994. "Permanent and Transitory Components of GNP and
Stock Prices." Quarterly Journal of Economics 109(1): 241-65.
Curtin, Richard T., F. Thomas Juster, and James N. Morgan. 1989. "Survey
Estimates of Wealth: An Assessment of Quality." In The Measurement of
Saving, Investment, and Wealth, edited by Richard E. Lipsey and Helen
Stone Tice. Chicago: University of Chicago Press.
Dornbusch, Rudiger, and Stanley Fischer. 1994. Macroeconomics, 6th ed.
New York: McGraw-Hill.
Epple, Dennis, and Katherine Schipper. 1981. "Municipal Pension Funding:
A Theory and Some Evidence." Public Choice 37(1): 141-78.
Fair, Ray C. 1994. Testing Macroeconometric Models. Cambridge, Mass.:
Harvard University Press.
Fama, Eugene F. 1981. "Stock Returns, Real Activity, Inflation, and Money."
American Economic Review 71(4): 545-65.
Fama, Eugene F., and Kenneth R. French. 1988. "Dividend Yields and Expected Stock Returns." Journal of Financial Economics 22(1): 3-25.
Feldstein, Martin, Louis Dicks-Mireaux, and James Poterba. 1983. "The Effective Tax Rate and the Pretax Rate of Return." Journal of Public Economics 21(2): 129-58.
Feldstein, Martin, and Lawrence Summers. 1977. "Is the Rate of Profit Falling?" BPEA, 1 :1977, 211-27.
Ferris, Deebe, editor. 1995. Ward's 1995 Automotive Yearbook. Southfield,
Mich.: Ward's Communications.
Fischer, Stanley, and Robert C. Merton. 1984. "Macroeconomics and Finance:
The Role of the Stock Market." Carnegie-Rochester Conference Series on
Public Policy 21: 57-108.
French, Kenneth R., and James M. Poterba. 1991. "Were Japanese Stock
Prices Too High?" Journal of Financial Economics 29(2): 337-63.
Friedman, Benjamin M. 1996. "Economic Implications of Changing Share
Ownership." Journal of Portfolio Management (forthcoming).
Gentry, William. 1994. "Annuity Markets and Retirement Saving." In Proceedings of the National Tax Association-Tax Institute of America. Columbus, Ohio: National Tax Association.
370
BrookingsPapers on EconomicActivity, 2:1995
Haliassos, Michael, and Carol C. Bertaut. 1995. "Why Do So Few Hold
Stocks?" Economic Jouirnal 105(432): 1110-29.
Hall, BronwynH. 1993. "IndustrialResearchDuringthe 1980s: Did the Rate
of Return Fall?" BPEA, Microeconomics, 2:1993, 289-330.
Hall, RobertE. 1978. "Stochastic Implicationsof the Life Cycle-Permanent
Income Hypothesis: Theory and Evidence." Journal of Political Economy
86(6): 971-87.
Heeringa,Steven G., JudithH. Connor,andR. Louise Woodburn.1994. "The
1989 Surveys of ConsumerFinances Sample Design and WeightingDocumentation."Unpublishedpaper.Universityof Michigan,Institutefor Social
Research(April).
Hines, James R., Jr. 1991. "Dividends and Profits:Some Unsubtle Foreign
Influences." WorkingPaper 3730. Cambridge,Mass.: National Bureauof
EconomicResearch(June).
Holtz-Eakin,Douglas, David Joulfaian, and HarveyS. Rosen. 1994. "EntrepreneurialDecisions and LiquidityConstraints."RANDJournalof Economics 25(2): 334-47.
Ibbotson Associates. 1994. Stocks, Bonds, Bills, and Inflation: 1994 Yearbook.
Chicago:IbbotsonAssociates.
Kennickell, Arthur B. 1995. Working Codebook for 1992 SCF. Washington:
Boardof Governorsof the FederalReserve System.
Kennickell,ArthurB., and MarthaStarr-McCluer.1994. "Changesin Family
Finances from 1989 to 1992: Evidence from the Survey of ConsumerFinances. " Federal Reserve Bulletin 80(10): 861-82.
King, MervynA., and JonathanI. Leape. 1984. "Wealth and PortfolioComposition:Theory and Evidence." WorkingPaper 1468. Cambridge,Mass.:
NationalBureauof Economic Research(September).
Levy, Frank, and Richard J. Murnane. 1992. "U.S. Earnings Levels and
EarningsInequality:A Review of Recent Trends and Proposed Explanations." Journal of Economic Literature 30(3): 1333-81.
Mankiw, N. Gregory, and Stephen P. Zeldes. 1991. "The Consumptionof
Stockholders and Nonstockholders." Journal of Financial Economics 29(1):
97-112.
Morck, Randall, Andrei Shleifer, and RobertW. Vishny. 1990. "The Stock
Marketand Investment:Is the Marketa Sideshow?" BPEA, 2:1990, 157202.
Nordhaus,William D. 1974. "The Falling Shareof Profits." BPEA, 1:1974,
169-208.
Poterba,James M. 1991. "Dividends, CapitalGains, and the CorporateVeil:
Evidencefrom Britain, Canada,and the United States." In National Saving
and Economic Performance, edited by B. Douglas Bernheimand John B.
Shoven. Chicago:Universityof Chicago Press.
James M. Poterba and AndrewA. Samwick
371
. 1995a. "CorporateStock Ownershipin the United States." In The
Extent of Shareownership Among U.S. Households. New York: New York
Stock Exchange(forthcoming).
. 1995b. "The Historyof Annuitiesin the UnitedStates." Unpublished
paper.MassachusettsInstituteof Technology (October).
Poterba,James M., Steven F. Venti, and David A. Wise. 1994. "Targeted
RetirementSaving and the Net Worth of Elderly Americans." American
Economic Review, Papers and Proceedings 84(2): 180-85.
. 1995. "Lump-SumDistributionsfrom RetirementSaving Plans: Receipt and Utilization." Working Paper 5298. Cambridge,Mass.: National
Bureauof Economic Research(October).
Projector, Dorothy S., and GertrudeS. Weiss. 1966. Survey of Financial
Characteristics of Consumers. Washington: Board of Governors of the Fed-
eral Reserve System.
Romer, Christina D. 1990. "The Great Crash and the Onset of the Great
Depression." Quarterly Journal of Economics 105(3): 597-624.
Samwick, AndrewA. 1995. "The JointEffect of Social Securityand Pensions
on the Timing of Retirement:Some New Evidence." Unpublishedpaper.
DartmouthCollege (November).
Shefrin, HershM., and RichardH. Thaler. 1988. "The BehavioralLife-Cycle
Hypothesis." EconomicInquiry26(4): 609-43.
Shleifer, Andrei, and LawrenceH. Summers. 1990. "The Noise TraderApproach to Finance." Journal of Economic Perspectives 4(2): 19-33.
Shulman,David S., Marc S. Usem, and JeffreyF. Brown. 1995. "The Ghost
of Keynes." Salomon Brothers Equity Strategy. New York: Salomon Broth-
ers.
Skinner,Jonathan.1987. "A SuperiorMeasureof Consumptionfromthe Panel
Study of Income Dynamics." EconomicsLetters23(2): 213-16.
Stock, James H., and MarkW. Watson. 1990. "Business Cycle Propertiesof
Selected U.S. Economic Time Series, 1959-1988." WorkingPaper3376.
Cambridge,Mass.: NationalBureauof EconomicResearch(June).
Summers, Lawrence H. 1981. "Taxation and CorporateInvestment:A qTheoryApproach."BPEA, 1:1981, 67-127.
Thaler,RichardH. 1994. "Psychology and Savings Policies." AmericanEconomic Review, Papers and Proceedings 84(2): 186-92.
Temin, Peter. 1976. Did Monetary Forces Cause the Great Depression? New
York:Norton.
U .S. Bureau of Labor Statistics. 1994. Consumer Expenditures in 1993. Wash-
ington:Departmentof Labor.
U.S. PresidentialTask Force on Market Mechanisms. 1988. Report of the
Presidential Task Force on Market Mechanisms. Washington: Government
PrintingOffice.
372
BrookingsPapers on EconomicActivity, 2:1995
Weicher, John C. 1995. "Changes in the Distribution of Wealth: Increasing
Inequality?" Federal Reserve Bank of St. Louis Review 77(1): 5-23.
Wigmore, Barrie A. 1985. The Crash and Its Aftermath: A Histoiy of Securities
Markets in the United States, 1929-1993. Westport, Conn.: Greenwood
Press.
Wolff, Edward N. 1994. "Trends in Household Wealth in the United States,
1962-83 and 1983-89." Review of Income and Wealth 40(2): 143-74.
. 1995. Top Heavy: A Study of the Increasing Inequality of Wealth in
America. New York: Twentieth Century Fund Press.
Zeldes, Stephen P. 1989. "Consumption and Liquidity Constraints: An Empirical Investigation." Journal of Political Economy 97(2): 305-46.
![This article was downloaded by: [Khalifa, Sherif] On: 8 March 2011](http://cdn1.abcdocz.com/store/data/000032200_2-5d0635dd9933f87aa2c8ba900272991f-250x500.png)


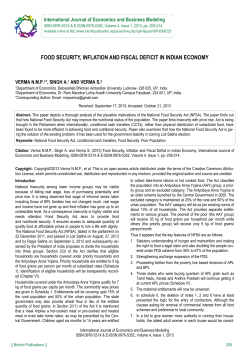


© Copyright 2026