
Proc. Intl. Soc. Mag. Reson. Med. 23 (2015) 0153.
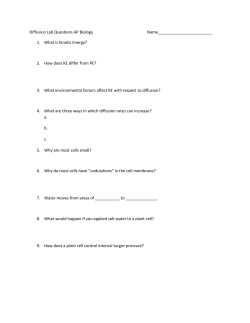
Characterization of the Wallerian degeneration process in the rat spinal cord with DIAMOND and NODDI: comparison with
histological obervations.
Damien Jacobs1, Benoit Scherrer2, Aleksandar Jankovski3, Anne des Rieux4, Maxime Taquet1, Bernard Gallez4, Simon K. Warfield2, and Benoit Macq1
ICTEAM, Universite catholique de Louvain, Louvain-La-Neuve, Belgium, 2Computational Radiology Laboratory, Boston Childrens Hospital, Massachusetts, United
States, 3Hopital universitaire Mont-Godinne, Universite catholique de Louvain, Godinne, Belgium, 4LDRI, Universite catholique de Louvain, Brussels, Belgium
1
Purpose: To investigate changes in DIAMOND1 and NODDI2 diffusion compartment imaging (DCI) models parameters after Wallerian degeneration of the spinal cord
in rats and to compare findings with histology.
Methods: A left-unilateral rhizotomy was performed on 6 rats at L2-L3 levels, inducing Wallerian degeneration in the ipsilateral gracile fasciculus. A laminectomy
was also performed on 3 control rats at identical L2-L3 levels. For each rat, diffusion weighted imaging (DWI) was performed at 11.7T, in vivo, after 51 days postinjured with 12 non-weighted DW images and 6 shells of 36 gradients directions each at b-values: 300, 700, 1500, 2800, 4500, 6000 s/mm², non collinear directions3,
voxel resolution: 0.1x0.1x1 mm³, TE: 23ms, δ: 4.5ms, Δ: 12 ms. After the acquisition, rats were perfused, spinal cord was removed, cryoprotected before being frozen
and stored at -80°C, sliced axially in 20 μm thick section using cryostat. Four immunostainings and one stain were performed for the myelin (LFB), neurofilaments
(SMI312), oligodendrocytes (ab7474), microglia (Iba1), and astrocytes (GFAP). For each imaging dataset, DW images were resampled to 0.1x0.1x0.1mm3 and
corrected for animal motion and eddy-current distortion using affine registration to the b=0 s/mm2 image. DIAMOND's and NODDI's model parameters were estimated
using respectively the CRL Toolkit and the NODDI MATLAB library, considering one isotropic compartment and one anisotropic compartments for each model.
NODDI models the diffusion arising from a fascicle using a Watson distribution of orientations of sticks with fixed axial diffusivity and null radial diffusivity, the
concentration parameter of which provides a measure of the axonal orientation dispersion (orientation dispersion index, odi). In contrast, DIAMOND estimates all the
parameters of a continuous peak-shaped 6-D distribution of diffusion tensors for each compartment. The concentration of the distribution provides a measure of the
overall heterogeneity of the corresponding compartment (heterogeneity index, hei); the expectation of the distribution reflects the overall compartment diffusivity,
providing, for each fascicle, diffusivity parameters (λ⁄⁄, λ⊥) that are not prefixed but estimated from the data. In this work, we also estimated the ADC for the isotropic
compartment (Diso). DIAMOND and NODDI model parameters were compared in identical ROIs (~5000 voxels) drawn in the ipsilateral and controlateral parts of the
spinal cords. For each diffusion model, we tested whether average parameter values in the ipsilateral and controlateral parts of the spinal cord were significantly
different after rhizotomy and compared to sham rats. Due to the non-normality of the data’s (normality test evaluation), the Kruskall-Wallis test was performed and
combined with a multi comparison post-hoc test (Tukey-Kramer) to determine the statistical significance (with α=0.05) between the shams, contralateral and ipsilateral
groups.
Results: DIAMOND: In the sham rats (Fig 1: i, red color), the estimated λ⁄⁄ of the fascicle was close to the known diffusivity of free diffusion value at 37°C (3 μm²/ms).
After rhizotomy, we observed a significant decrease in λ⁄⁄ and a significant increase in λ⊥ in the ipsilateral part (iii, green color). We also observed a significant increase
in hei in the ipsilateral and controlateral parts (ii, blue color). The value of Diso in the ipsilateral part decreased
significantly and its fraction increased significantly (fDiso). NODDI: After rhizotomy, we observed a significant
decrease of the intra-cellular volume fractions (ficvf) and the isotropic volume fraction (fiso) in the ipsilateral part.
We also observed a significant increase in odi. Histological analysis: Axonal degeneration was observed in the
ipsilateral part compared to the controlateral part (Fig 2.b vs 2.c, neurofilament staining). The fibrous structure of the
myelin was observed in the controlateral part (Fig 2.d) but not preserved in the ipsilateral part (see structural dots,
Fig 2.e). The process of myelin clearance was observed and confirmed with the microglia staining with a vesicular
activation (Fig 2.f vs 2.g).
Discussion: DIAMOND and NODDI both detected an increased heterogeneity of the tissue microstructure after
rhizotomy (significant increased odi and hei, Fig.1). However, with NODDI, the increased heterogeneity is
described as an axonal orientation dispersion increase, which is difficult to interpret in the spinal cord. In contrast,
DIAMOND provides an overall measure of heterogeneity of 3-D diffusivities in compartments and estimates
diffusivity parameters for each compartment, providing further insight into the tissue microstructure in vivo. With
DIAMOND, the increased λ⊥ is consistent with the altered fibrous structure and the myelin clearance process
(Fig.2e). The decreased Diso is consistent with the presence of both free diffusion and isotropic restricted diffusion
due the vesicular activation (Fig.2g), captured
together by the isotropic compartment. The increased
fDiso is consistent with the axonal degeneration
(Fig.2c) during the Wallerian degeneration process.
Conclusion: Because in NODDI a number of
parameters are fixed, variation of the DW signal due
to a pathology are captured by the only remaining
free model parameters, and the interpretation of these
parameters is unclear. In contrast, DIAMOND
estimates an overall measure of microstructural
heterogeneity that can be further characterized by the
estimated diffusivity parameters for each
compartment. We found that Diso, fDiso and λ⊥
reflect the Wallerian degeneration process.
[1]. Scherrer, B., et al., Characterizing the DIstribution of
Anisotropic MicrO-structural eNvironments with Diffusionweighted imaging (DIAMOND). MICCAI., 2013. 16: p.
518-526. [2]. Zhang, H., et al., NODDI: practical in vivo
neurite orientation dispersion and density imaging of the
human brain. Neuroimage, 2012. 61(4): p. 1000-16. [3].
Caruyer, E., et al., Design of multishell sampling schemes
with uniform coverage in diffusion MRI. Magn Reson Med,
2013. 69(6): p. 1534-40.
Proc. Intl. Soc. Mag. Reson. Med. 23 (2015)
Figure 1 DIAMOND and NODDI parameters for the sham
rats (i, red color), the controlateral part (ii, blue color) and
the ipsilateral part (iii, green color). For DIAMOND: λ⁄⁄ ,λ⊥:
axial and radial diffusivities, hei: heterogeneity index, Diso:
Diffusion isotropic, and fDiso: fraction of Diso. For NODDI:
ficvf: intra-cellular volume fraction, fiso: CSF volume
fraction and odi: orientation dispersion index.
* : statistically significant
0153.
Figure 2 Immunostaining in the controlateral
(left, blue color) and ipsilateral part (right, blue
color) of the gracile fasciculus. (a-b-c)
neurofilament (SMI-312), (d-e) LFB staining
for the myelin, (f-g) Microglia staining (Iba-1)
Scale bars: 100 μm and 10 μm.


© Copyright 2026