
Country Diagnostic: Malawi - The Better Than Cash Alliance
Malawi
B E T T E R THANC A S H
A L L I A N C E
COUNTRY DIAGNOSTIC
Empowering People Through Electronic Payments
Development Results
Focused Research Program
Country Diagnostic:
Malawi
By Bankable Frontier Associates (BFA) under the supervision of Jamie Zimmerman
March 2015
@ Quick Shot / Shutterstock.com
Malawi
B E T T E R THANC A S H
A L L I A N C E
COUNTRY DIAGNOSTIC
Empowering People Through Electronic Payments
March 2015
Development Results
Focused Research Program
Country Diagnostic:
Malawi
This diagnostic measures the current state of the transition to electronic payments by estimating
volumes and values of payments made in Malawi, as well as assessing the likelihood of further
movement by looking at payment use cases associated with each key shift. In so doing, the
diagnostic also identifies specific examples of attempts to shift to electronic payments that could
generate lessons for BTCA stakeholders in other contexts. It also identifies gaps in the available
data — the filling of which could give valuable insights for designing and monitoring further
efforts to shift.
B E T T E R THANC A S H
A L L I A N C E
Empowering People Through Electronic Payments
INTRODUCTION TO THE BETTER THAN CASH ALLIANCE
The Better Than Cash Alliance (BTCA) is an alliance of governments and private sector and development
organizations committed to replacing the use of cash payments with electronic payments, where
appropriate, and to promoting a `cash-lite’ economy.
Shifting payment of salaries, social welfare and relief payments, payments to suppliers, remittances, etc.
from cash to electronic has the potential to improve the lives of low-income people, particularly women,
while giving governments, the private sector and the development community a more transparent, timeand cost-efficient, and often safer means of making and receiving payments.
The Better Than Cash Alliance:
1. Advocates for the use of all forms of electronic payments where they provide a preferable payment
option to cash;
2. Collaborates with program partners to mobilize available technical expertise and resources to identify
and implement the most effective approach to make the transition from cash to electronic payments; and
3. Conducts research, documents good practices, and produces knowledge products to address the barriers
to adoption and drive the effective shift from cash to electronic payments globally.
BTCA’s Development Results Focused Research Programme (DRFRP) accelerates the generation and
dissemination of knowledge and tools for stakeholders transitioning part of their payments from cash to
electronic. The DRFRP has three components: 1) Readiness diagnostics, which compile existing data on the
volumes, values, and payment means for each kind of payment made by governments, the private sector,
and development community partners, and assess the country’s readiness to replace cash payments with
electronic payments; 2) Case studies of on-going shifts; and 3) Toolkits to provide practical steps for BTCA
stakeholders to plan, measure and implement shifts.
The DRFRP is managed, on behalf of BTCA, by a consortium led by Bankable Frontier Associates,
a Boston-based consulting firm, with advice from experts from the World Bank Payments Group
and the CGAP Technology Team, as well as local research staff.
MALAWI PROJECT TEAM
The diagnostic process involves desk research and an in-country mission by a team of experts
to gather data, assess the incentives of participants in the local payments context, and
survey the insights of local BTCA champions and stakeholders. Each diagnostic country team
includes local researchers with experience in the payments system and knowledge of relevant
institutions and individuals.
THIS REPORT WAS AUTHORED BY THE MALAWI COUNTRY PROJECT TEAM
• Country Director:
• Measurement Expert:
• Payments Expert:
• Country Analyst:
• Country Support:
Jamie M. Zimmerman
Kristy Bohling
Brian Le Sar
Brian Loeb
Neil Nyirongo, Titus Kavalo
ACKNOWLEDGMENTS
The BTCA Diagnostic Team extends its sincere gratitude to the colleagues in the Ministry of
Finance and Reserve Bank of Malawi who supported and guided our access to information
and individuals for this research. In particular, we would like to thank BTCA Champion Francis
Zhuwao, Director of the Economic Affairs Division of the Ministry of Finance, for his support
including the endorsement and facilitation of a high-level multi-stakeholder meeting to
introduce the BTCA Malawi diagnostic research to and encourage the participation of key
informants. We would like to thank Fraser Mdwazika, the Director of National Payment Systems
at the RBM, for his steadfast support of this research agenda, including facilitating access to
data and information. We are also grateful to Fletcher Chilumpha of UNCDF also provided
invaluable support with his endorsement of the research and engagement facilitation.
All photos: © MM4P / François Coupienne / Shutterstock.com
iii
BTCA vital signs
Total # of payments
per month
% payments electronic
(by volume; by value)
221.5 million
0.3%
Data Quality Index
(Scale of 5=highest; 1=lowest)
25%
Quality: 2.0 | Availability: 1.8
Context indicators
Population (World Bank, 2012)
15.9 million
Visa GEAR ranking (0-100)
Not included
World Bank income category
Lower Income
Corruption Perceptions Index
(Transparency International, 2012)
Rank: 88/174
% adults with formal account
(Findex, 2011)
17%
Mobile penetration - % of active mobile
subscribers out of population (ITU 2012)
2003: 1%
2011: 26%
State of the transition to electronic payments
Payments by payer per month
Value of payments per month USD billion
# of payments per month (million)
By volume
250
200
150
100
50
0
Government
Business
Cash
Person
By value
500
400
300
200
100
0
Government
Electronic
Cash
Business
Person
Electronic
Government and individual payments are made almost entirely in cash or checks. Business payments have shown the most marked transition to electronic means,
though these represent a tiny percentage of payments in the country by volume.
Trajectories of the shift to electronic payments
Shift 3: Purchase & other
3.9
0%
217.5
Shift 2: Bill pay
3.8
Shift 1: Bulk payment
3.6
3.1
15%
27%
0.8
The shift to a mainly electronic (‘cash-lite’) economy typically proceeds
through three stages, which can happen concurrently but at different speeds.
In Malawi, the first shift, of one-to-many (bulk) payments, has yet to
progress significantly, due to the persistence of checks for salary payments
and all government payments. The second shift, many-to-one (remote bill)
payments, is progressing for high value pension and insurance contributions
and loan repayments, but not yet for taxes or supplier payments. The third
shift, one-to-one, including purchases (P2B), has made little progress in either
the formal or informal sector and momentum is limited.
Legend: 3.8 is the trajectory score for the use case connected to each shift; where 1=full shift very likely; 3=slow upward progress; 5=shift unlikely; see Annex C & D.
Note: 15% is % of total number, in millions, of monthly payments in each shift (shown at end of bar) which are electronic as in 2012; see Annex B.
iv
COUNTRY DIAGNOSTIC: MALAWI - Development Results Focused Research Program
TABLE OF CONTENTS
I INTRODUCTION.....................................................................................................1
The BTCA diagnostic approach..........................................................................................................1
Key findings: Malawi.............................................................................................................................. 4
Outline of this report..............................................................................................................................6
II COUNTRY CONTEXT............................................................................................ 7
Limited financial inclusion, high rural population and poverty rates...................................7
Electronic payments show some growth, but values are low and usage
is concentrated in banked population...........................................................................................10
III EVOLUTION OF POLICY TOWARD ELECTRONIC PAYMENTS......................17
E-payments policy and infrastructure driven by the RBM and MoF.................................. 17
Major payment system improvements starting in 2002......................................................... 18
Financial inclusion strategy aligns with the payments vision............................................... 19
As a payer, GoM’s ability to shift has been weak......................................................................20
Recent policy emphasis on mobile, driven by donors............................................................. 21
Payments system milestones........................................................................................................... 24
IV CURRENT STATE OF TRANSITION TO E-PAYMENTS.................................... 25
Headline indicators.............................................................................................................................. 25
Data Quality Index................................................................................................................................ 25
Payments data by payer and payee.............................................................................................. 26
V TRAJECTORY OF SHIFT:
PAYMENT INFRASTRUCTURE AND INCENTIVES...........................................29
Relevant use cases............................................................................................................................... 29
Use case A: Mass electronic credits............................................................................................... 32
Use case B: Remote bill and services payments....................................................................... 34
Use case C: Debit Card at Merchant.............................................................................................. 35
VI LESSONS ABOUT SEQUENCING AND PRIORITIZING THE SHIFT............... 37
Status of the journey........................................................................................................................... 37
Inaction on government payments inhibiting Shift 1.............................................................. 38
Donor-driven efforts attempting to leap-frog Shift 1............................................................. 38
Cost, confidence and access limitations inhibit individual uptake.................................... 39
VIIPROPOSED DRFRP APPROACH IN MALAWI IN 2013/4................................ 41
Potential case studies.......................................................................................................................... 41
Annexes.......................................................................................................................45
ANNEX A: LIST OF ACRONYMS..................................................................................................... 39
ANNEX B: DETAILED PAYMENT GRID.........................................................................................46
ANNEX C: BTCA COUNTRY DIAGNOSTIC COMMON METHODOLOGY......................... 52
ANNEX D: USE CASE TRAJECTORY SCORES.......................................................................... 55
ANNEX E: SUPPORTING ANALYSIS FOR SECTION V: PAYMENTS
ANNEX F: REFERENCES................................................................................................................... 63
ANNEX G: ORGANIZATIONS AND INDIVIDUALS INTERVIEWED.................................... 65
INFRASTRUCTURE AND PROPENSITY TO SHIFT..............................................57
TABLE OF CONTENTS
v
@ Quick Shot / Shutterstock.com
MALAWI
MALAWICOUNTRY
COUNTRYDIAGNOSTIC
DIAGNOSTIC
vi
COUNTRY DIAGNOSTIC: MALAWI - Development Results Focused Research Program
COUNTRY DIAGNOSTIC
1
Introduction
The BTCA diagnostic
approach
These three objectives are achieved in
the following ways:
The BTCA Country Diagnostic is
intended to do three things:
1. Measure the baseline state of
• Measurement: The payment
grid (shown in Figure 1 below)
compiles data on the volumes
the shift from cash to electronic
and values of payments in the
payments using the best
country, as well as the proportion
available data;
of those payments made by
electronic means, for payments
2. Assess the trajectory of the shift in
made by government (G),
a way that can inform the country’s
business (B), individuals (P, for
decisions and priorities; and
person), and the development
community (D). The full grid and
3. Recommend case studies and
accompanying notes on sources
measurement activities to support
and calculations are in an annex
the development of toolkits for
to the diagnostic. That annex
BTCA stakeholders.
also includes a description of
FIGURE 1
The payment grid: types of payments by payer and payee1
PAYEE
Government
PAYER
Government
Business
Person
(Individual)
Development
community
G2G
Central government disbursements to local
level, Transfers within the central government
B2G
Taxes, Fees for licenses and permits, Payments
to gov’t utilities
P2G
Taxes, Utilities, Debit card payment of taxes,
Payments to gov’t utilities
D2G
Taxes2
Business
Person (Individual)
G2P
G2B
Supplier payments, Utility payments
B2B
Supplier payments, Utility payments,
Pension contributions
P2B
Utilities, School fees, Credit card payments,
Pension contributions, Debit card payment
at stores
D2B
Utility payments
Welfare programs, Salaries,
Pensions
B2P
Salaries and benefits
P2P
Remittances, Gifts
D2P
Cash transfers, Salaries for local
employeess
SECTION 1: INTRODUCTION
1
MALAWI COUNTRY DIAGNOSTIC
the Data Quality Index, which
market incentives are aligned
rates the quality (completeness
in regard to a given use case,
and reliability) and availability of
then shifting to greater use of
payments data in the country.
electronic payments should be
The measurement section in the
easier to accomplish.
body of the diagnostic (Section
IV) presents the headline findings
The BTCA whitepaper identified
on the remaining pools of cash in
three shifts on the journey to
the economy.
‘cash lite’ societies: a bulk payer
shift, a shift towards electronic
• Trajectory towards e-payments:
bill payment and finally, a
These sections provide a
shift for purchases. Figure 2
narrative of the evolution of
below stylizes how a country
policy on electronic payments
might progress through these
(Section III) and the trajectory
shifts; the shifts are not usually
of the shift towards electronic
sequential, hence at a given time
means (Section V), through
(such as the present depicted by
the lens of three particular use
a line), multiple shifts are likely
cases. A payment use case is
to be underway simultaneously,
an application of a certain type
although at different stages.
of payment instrument, using
certain channels, to certain
payment accounts. If the policy
priorities, infrastructure and
FIGURE 2
Shifts between stages from cash heavy to cash lite
% electronic
Maximum
Bulk payer transition
Cash lite
Time
2
Increasing e-usage
Present
COUNTRY DIAGNOSTIC: MALAWI - Development Results Focused Research Program
COUNTRY DIAGNOSTIC
Two use cases are common
• BTCA cases: Finally, each
across all the diagnostics: bulk
diagnostic recommends
EFT credits and remote bill
possible case studies of actual
payments. The first use case
shifts implemented by the
supports the shift between the
core BTCA stakeholder groups
first and second stages; the
(governments, the private
second use case supports the
sector, the development
shift between the second and
community) each of the core
third stages. In each country
BTCA stakeholders. Case studies
a third use case is chosen for
document what happened,
analysis that captures the
assess the costs and benefits,
story of the barriers to shifting
and draw lessons for the targeted
the cash pools identified in
BTCA constituency for BTCA. The
the payment grid. In Malawi,
recommended cases (Section
interviews with providers and
VII) are based on the potential
users revealed major barriers to
learning experience for BTCA,
the adoption of card payments at
the feasibility of conducting the
merchants.
case study, and fit with use cases
of particular importance for the
Figure 3 below shows the
given country.
relationship between the
payment grid and the use cases.
FIGURE 3
Mapping use cases into the payment grid
PAYEE
G
PAYER
G
B
P
1: Bulk electronic credit
2: Remote bill payment
1: Bulk electronic credit
1: Bulk electronic credit
B
2: Remote bill payment
2: Remote bill payment
P
2: Remote bill payment
2: Remote bill payment
3: Debit card payment at merchants
D
2: Remote bill payment
Note: 1: Mass electronic credit (or mass bulk payments); 2: Remote bill payment (or bulk payment collection);
3: Debit card payments at merchant (retail card purchases).
SECTION 1: INTRODUCTION
3
MALAWI COUNTRY DIAGNOSTIC
As Figure 4 below shows, Section IV of
continuum, and Section V analyzes
payment volumes (99.8%) and are
overwhelmingly cash-heavy (only 0.2%
electronic for individuals and 3.6% for
businesses).
potential future trajectories based on
This may not be entirely surprising given
underlying incentives to provide or
the country’s high poverty rates, its
adopt relevant payment instruments.
largely rural population and low access
Section III traces the evolution of the
to formal financial services (currently
shift to electronic payments while the
only 17% of adult Malawians have an
cases identified in Section VII highlight
account at a formal financial institution).
this country diagnostic report locates
the current status of country along this
specific past attempts — successful or
Nevertheless, the Government of
not — to shift.
Key findings: Malawi
Malawi is in the very early stages of
its shift to cash lite. Cash currently
dominates in Malawi and data do
not indicate a notable shift toward
electronic payments in the country.
Just 0.3% of the 221.5 million payments
made every month are through
electronic means. Individuals and
businesses initiate the majority of
Malawi has made steady progress
on the development of its payments
system infrastructure, particularly over
the last 10 years, with a long list of
accomplishments. However, some of its
landmark initiatives (such as the Malawi
Switch Centre, (MALSWITCH), and the
government’s central payments system,
the Integrated Financial Management
Information System, (IFMIS) have had
limited traction to date and important
legislation, namely the National
FIGURE 4
R
elation of diagnostic sections to
the journey to greater electronic payment
Payments System Bill, has been pending
since 2002. The political will exhibited
by the Reserve Bank of Malawi (RBM)
and the Ministry of Finance (MoF)
Cash lite
on facilitating electronic payments
has been exemplary but has been
Increasing e-usage
overshadowed by the government’s
behavior as a payer: the Government
of Malawi continues to rely on checks.
Bulk payer transition
The weakness of this check-based
central payment system was exploited
during a 2013 corruption scandal, known
Cash heavy
Past
Present
Future
as “Cashgate,” in which fraudulent
government checks were being issued
Section:
III & VII
IV
V
by a few government employees and
their collaborators.3
Note: Dotted line around marker for Section IV
represents the Data Quality Index.
4
COUNTRY DIAGNOSTIC: MALAWI - Development Results Focused Research Program
COUNTRY DIAGNOSTIC
Electronic payments initiated by or
resources from the World Bank’s
paid to business, while still low in
Financial Sector Technical Assistance
absolute terms, appear to dominate the
Program (FSTAP), the country is
e-payment landscape in Malawi at the
building a new national switch, which
moment. This is a result of infrastructure
should be fully interoperable (including
that allows for electronic payments at
both financial institutions and telcos)
the high end — particularly for payment
and launched in early- to mid-2014.
of corporates’ suppliers and creditors,
This switch could dramatically alter the
and for individual insurance and pension
payments landscape by offering more
contributions (using debit orders).
efficient and reliable opportunities
However, while the percentage of
for e-payments, particularly for card-
business-initiated electronic payments
holding consumers at merchants. The
is relatively high in terms of value (38%),
FSTAP project is also providing support
the volume of such payments as a
to strengthen the Ministry of Finance
percentage of total payments extremely
and encourage coordination among
low (only 4%). Furthermore, data reveal
payment system-related stakeholders.
very little P2P electronic payments
occurring in terms of either volume or
As mobile network penetration has
value. There are clear roadblocks and
increased from 1% in 2003 to 34% in
disincentives to shifting to electronic
20135 mobile money has also advanced
payments at present, and no particular
over the last several years, particularly
payer in this study exhibited a notable
since Airtel Money launched in early
propensity to shift.
2012 (though not as quickly as some
4
had hoped or expected). Mobile money
At the same time, the RBM has been
is gathering steam now that a second
forward-looking in its approach to
mobile network operator, TNM, has
its National Payments System: with
launched its mobile money product.
SECTION 1: INTRODUCTION
5
MALAWI COUNTRY DIAGNOSTIC
Finally, development partners,
Section IV compiles existing data and
particularly donors, are particularly
calculations to quantify the number
eager to support the advancement
and values of payments made in
of the mobile money sector for both
each cell of the payment grid in
G2P and D2P payments, as well as
Malawi, as well as the percentage of
P2P mobile money transfers and other
payments made by electronic means.
services, such as loan deployment and
Section V analyses the Malawian
repayment. While the government lags
payments system’s propensity to
behind in its shift to bulk payments
shift more payments to electronic,
into accounts (Shift 1), donors are
driving efforts to leapfrog straight into
The percentage of
Shifts 2 and 3: as indicated through
business-initiated
money demand and usage among
electronic payments
is relatively high
in terms of value
(38%), the volume
of such payments
as a percentage
of total payments
extremely low
(only 4%).
initiatives aimed at driving up mobile
and between people and businesses
(such as the USAID’s Mobile Money
Accelerator Program, the (MMAPrelated) Mobile Money Coordinating
Group, and UNCDF’s Mobile Money
for the Poor project), as well as other
initiatives to use mobile money for
D2P social transfers. Investment,
coordination and experimentation
around mobile money with lowerincome populations are increasingly
prominent.
Outline of this report
Section II describes the
macroeconomic context for
6
through the lens of three specific
use cases: mass electronic credits,
remote bill payment, and card
payments at merchants. Each of
these use cases corresponds to one
or more of the types of payments
categorized in the payment grid.
Section VI draws on the Malawian
case to offer insights on the
sequence of shifts from cash heavy
to cash lite hypothesized in the
BTCA White Paper. The diagnostic
concludes with some proposed case
studies under the BTCA umbrella
during 2013 and early 2014. Unlike
in the other DRFRP diagnostic
countries, the Malawi team does
not recommend pursuing either
of these case studies immediately;
though they could offer lessons
for BTCA stakeholders in other
payments in Malawi and the state of
contexts, the initiatives they describe
payments infrastructure. Section III
are in their infancy. Note that this
presents a chronology of key policy
section is neither a plan nor a set
initiatives, by government and the
of recommendations for Malawi to
private sector, which have to date
follow since making any specific
propelled the shift from cash to
recommendations is outside the
electronic payments.
scope of a BTCA country diagnostic.6
COUNTRY DIAGNOSTIC: MALAWI - Development Results Focused Research Program
COUNTRY DIAGNOSTIC
2
Country context
Limited financial inclusion,
high rural population and
poverty rates
reports that just 19% of Malawians
Malawi has a high population density,
are financially excluded (see Figure 5
but very little urbanization: according
below). In 2011 Findex estimated the
to the World Bank , 84% of Malawians
percentage of adults with an account
live in rural areas. And this factor,
at a formal financial institution, all of
combined with a per capita GDP
which are heavily concentrated in a
of about $750 USD PPP (2013), is
few urban centers, at 17%.
FinMark’s 2008 FinScope survey9
have bank accounts, and a full 55%
7
essential to understanding the extent
of financial inclusion8 and availability
of electronic payments in the country.
Urban and formally employed
Malawians tend to have bank
accounts. However, as later sections
of this diagnostic will describe, the
majority of banks have demonstrated
little drive to expand to the lower
end market or to push electronic
and agent networks are in their
infancy.
@ Magdanatka - Shutterstock.com
payments; mobile money products
SECTION 2: COUNTRY CONTEXT
7
MALAWI COUNTRY DIAGNOSTIC
FIGURE 5
Financial inclusion in Malawi
Malawi Access Strand (n=4993)
Percentage of adult population
Financially included – 45%
Formally Served – 26%
Banked
0%
Financially excluded
19
7
19
Bank
Formal
Other
Informal
(only)
10%
Formal Bank
20%
Formal Other
30%
55
40%
Informal only
50%
60%
70%
80%
90%
100%
Unbanked
Source: Finscope 2008.
The issue of poverty was
survey of small, medium and micro
overwhelmingly cited as a significant
enterprises11, around 8% of SMMEs
contributing factor for the low
are licensed and just 22% of SMME
degree of financial inclusion:
owners had bank accounts12. Not
surprisingly, 96% of respondents
The overwhelming reasons why
said their usual method of
people do not have bank accounts
payment is cash.
are income-related – 65% of
individuals responded that they did
Given this context, Table 1 below
not need an account since they did
shows the financial access points
not have enough funds; 24% said
available in Malawi.
that they had insufficient funds after
their expenses for a bank account.10
The same degree of informality
describes most businesses in Malawi
(outside of large corporates).
According to FinScope’s 2012
8
COUNTRY DIAGNOSTIC: MALAWI - Development Results Focused Research Program
COUNTRY DIAGNOSTIC
TABLE 1
Financial and mobile infrastructure
Malawi
Rwanda
Mozambique
Tanzania
Branches
2.16
1.87
2.89
1.84
ATMs
2.65
0.46
5.09
3.44
POS terminals
4.44
1.67
38.31
16.14
Mobile-cellular telephone subscriptions per 100 inhabitants14
28
50
33
57
Percentage of Individuals using the Internet15
4
8
5
13
@ africa924 / Shutterstock.com
Cash Handling Points/100,000 adults (2010)13
SECTION 2: COUNTRY CONTEXT
9
MALAWI COUNTRY DIAGNOSTIC
Electronic payments
show some growth, but
values are low and usage
is concentrated in banked
population
trend of ATMs is illustrative of the
electronic infrastructure in the country
in general. As Figure 6 below shows,
there are fewer than 5 ATMs in Malawi
per 100,000 adults, and just 12,815
As the data on financial inclusion
ATM cards per 100,000 adults. These
would suggest, the usage of
numbers, as well as those for the
electronic payments infrastructure
average monthly volumes and values
in Malawi is low — both in terms of
of ATM transactions, have shown little
the segment of the population using
to no growth over the past year. Note
electronic payments and in terms of
that that average transaction value
the absolute dollar values involved.
per ATM card was USD 67 in July
2013 (over 90% of Malawi’s monthly
FIGURE 6
Though most transactions at ATMs
per capita GNI).16 So not only is ATM
are cash deposits and withdrawals, as
usage flat, but this channel is only
opposed to bill payments (and thus
used by those with higher incomes
not counted as payments) the usage
who have cards in the first place.
ATM deployment and usage in Malawi
20,000
5
4
15,000
$80
2.0
$60
1.5
$40
1.0
$20
0.5
3
10,000
2
ATM cards in use/100K adults (left axis)
ATM terminals/100K adults (right axis)
Jul-13
Transaction value ($)/ATM card in use (left axis)
Transaction volume/ATM card in use (right axis)
Source: RBM data; World Bank population estimates; monthly exchange rates from www.oanda.com
10
Apr-13
Jan-13
$Oct-12
Jul-13
Apr-13
Jan-13
Oct-12
Jul-12
Apr-12
Jan-12
-
Jul-12
-
Apr-12
1
Jan-12
5,000
COUNTRY DIAGNOSTIC: MALAWI - Development Results Focused Research Program
COUNTRY DIAGNOSTIC
The data on point-of-sale (POS)
suggest either that merchants are
terminals tell a similar story: while
increasingly not accepting cards for
there has been a slight increase in
lower value transactions (because
the number of terminals, there has
of the merchant discount rate
been no corresponding increase
charged to them) or that card users
in the volume of transactions, as
are choosing to pay for only higher
Figure 7 below shows. The average
value goods with cards. Perhaps
monthly value of transactions
most notably, over the past year
fluctuated greatly from early 2012
there have been only between 125
through mid-2013 but has increased
and 225 monthly POS transactions
considerably since. These data
per 100,000 adults.
POS deployment and usage in Malawi
-
POS terminals/100K adults (left axis)
Volume of POS transactions (right axis)
15,000
$1,000,000
10,000
$500,000
5,000
$-
May-13
0
20,000
$1,500,000
Jan-13
5,000
25,000
Sep-12
2
$2,000,000
May-12
10,000
Jul-13
4
Apr-13
15,000
Jan-13
6
Oct-12
20,000
Jul-12
8
Apr-12
25,000
Jan-12
10
Jan-12
FIGURE 7
Value ($) of POS transactions (left axis)
Volume of POS transactions (right axis)
Source: RBM data; World Bank population estimates; monthly exchange rates from www.oanda.com
SECTION 2: COUNTRY CONTEXT
11
MALAWI COUNTRY DIAGNOSTIC
Internet banking and bank-based
100,000 adults. The average value
mobile banking reinforce this
of internet banking transactions is
conclusion, too. As Figures 8 and
high ($1,291 USD as of September
9 below show, the number of
2013), as expected, since the data
subscribers for internet and mobile
include corporate subscribers. Also
banking is growing, but the numbers
as expected, mobile banking has a
remain small: 254 individual internet
low average value (about $3), since
banking subscribers per 100,000
it is likely not used by corporates,
adults (or 22,013 total, compared with
cumbersome for high values, and
4,432 corporate subscribers), and
could be subject to transaction limits.
2,941 mobile banking subscribers per
FIGURE 8
Internet banking usage in Malawi
1.5
$2,000
300
250
$1,500
200
1.0
$1,000
150
100
0.5
$500
50
$-
Number of subscribers (individual/100K adults)
Jul-13
Value of transactions ($)/Transaction (left axis)
Volume of transactions/Subscriber (right axis)
Source: RBM data; World Bank population estimates; monthly exchange rates from www.oanda.com
12
Apr-13
Jan-13
Oct-12
Jul-12
Apr-12
0.0
Jan-12
Sep-13
Aug-13
Jul-13
Jun-13
May-13
Apr-13
Mar-13
Feb-13
Jan-13
0
COUNTRY DIAGNOSTIC: MALAWI - Development Results Focused Research Program
COUNTRY DIAGNOSTIC
Bank-based mobile banking
FIGURE 9
5.0
$40
3.0
1,500
$30
2.0
1,000
$20
500
$10
-
$-
Number of subscribers/100K adults
4.0
1.0
Jul-13
Apr-13
Jan-13
Oct-12
Jul-12
Apr-12
0.0
Jan-12
Jul-13
2,000
Apr-13
$50
Jan-13
2,500
Oct-12
$60
Jul-12
3,000
Apr-12
$70
Jan-12
3,500
Value of transactions ($)/Transaction (left axis)
Volume of transactions/Subscriber (right axis)
@ wlablack / Shutterstock.com
Source: RBM data; World Bank population estimates; monthly exchange rates from www.oanda.com
SECTION 2: COUNTRY CONTEXT
13
MALAWI COUNTRY DIAGNOSTIC
Turning to MNO-led mobile payments,
monthly transaction volumes and
Figure 10 shows that there has been
values per customer (though there
an increase in subscribers; but here,
are spikes). This indicates that the
too, overall usage is low (one MNO
new mobile money customers behave
launched transaction capabilities in
similarly to the existing ones — they
2012, the other in May 2013). Just
are likely testing it out. And this could
0.9% of adults have used non-
be explained by a combination of
bank-based mobile payments in
transaction limits on accounts and the
the past 30 days, and just 1.6% if a
type of people to whom the Mobile
less restrictive 90-day definition is
Money Issuers (MMIs) market their
used. At the same time, the data do
products.17
not show strong trends in average
FIGURE 10
MNO/MMI-led mobile payments
160,000
$20
80
$15
60
$10
40
$5
20
$-
0
140,000
120,000
100,000
80,000
60,000
40,000
Active customers (90-day)
Active customers (30-day)
Jun-13
Value of transactions ($)/Transaction (left axis)
Volume of transactions/Active customers (30-days) (right axis)
Source: RBM data; monthly exchange rates from www.oanda.com
14
Mar-13
Dec-12
Sep-12
Jun-12
Jun-13
Mar-13
Dec-12
Sep-12
Jun-12
Mar-12
-
Mar-12
20,000
COUNTRY DIAGNOSTIC: MALAWI - Development Results Focused Research Program
COUNTRY DIAGNOSTIC
FIGURE 12
$800,000
20,000
80%
$600,000
15,000
60%
$400,000
10,000
40%
$200,000
5,000
20%
2012
2011
2010
2009
2008
2007
Money (current LCU)/Money and
quasi money (M2) (current LCU)
FSI value ($)/FSI (left axis)
Total FSI volume (right axis)
Source: RBM data; monthly exchange
rates from www.oanda.com
2006
2003
0%
Jan-13
Jul-12
Jan-12
Jul-11
Jan-11
$-
Cash to broad money supply
2005
Funds settlement Instructions
2004
FIGURE 11
Source: RBM World Bank DataBank
FIGURE 13
Check usage in Malawi
Finally, considering payment
preferences in the overall economy,
there does not appear to have been a
consistent, large-scale decrease in cash
400,000
$5,000
$4,000
300,000
and increase in electronic payment
of the monetary supply (Figure 12) is
down somewhat since its peak in 2007,
yet check usage (Figure 13) was flat.18
This macro-picture is consistent with
the data on individual instruments
100,000
$1,000
$-
May-13
Currency in circulation as a component
Oct-12
rose and fell but were overall flat.
Mar-12
for high value payments (Figure 11),
200,000
$2,000
Aug-11
July 2013, fund settlement instructions,
$3,000
Jan-11
instruments. Between January 2011 and
Check value ($)/Check (left axis)
Total check volume (right axis)
and channels above: no notable shift
to electronic payments seems to be
occurring in Malawi.
Source: RBM data; monthly exchange
rates from www.oanda.com
SECTION 2: COUNTRY CONTEXT
15
@ urosr / Shutterstock.com
MALAWI COUNTRY DIAGNOSTIC
16
COUNTRY DIAGNOSTIC: MALAWI - Development Results Focused Research Program
COUNTRY DIAGNOSTIC
3
Evolution of policy
toward electronic payments
E-payments policy and
infrastructure driven by the
RBM and MoF
enabling regulation that complies
with internationally-accepted best
practices.
There are two specific strategy
documents that frame the Government
Real payment system reform
of Malawi’s policy objectives and
effectively began in 2001 with the
activities toward a shift to electronic
launch of the National Payment
payments: the National Payment
System (NPS) Strategy and
System Strategy (2009 to 2013) and
Framework, the blueprint upon which
the National Strategy for Financial
all NPS modernization projects in
Inclusion (2010 to 2014).19 In addition,
the country have been based. The
Malawi’s poverty reduction strategy,
NPS Strategy articulated goals
the Malawi Growth and Development
for creating safe, efficient and
Strategy (MGDS), was launched in
appropriate payment services to
2006 and renewed in 2011. It focuses
improve the functioning of finance
on reducing poverty through private
for individuals (through financial
sector-led economic growth and
inclusion, with an explicit focus on
infrastructure development, including
urban and rural access), for businesses
improving access to financial services
(through interoperable electronic
and the infrastructure and policies that
retail facilities), and for government
enable it.
(to improve efficiency by reducing
the reliance on cash for payments of
Malawi has taken a forward-looking
salaries, wages and pensions to public
approach to creating a state of the art,
sector employees).
modern national payments system:
after some 20 years of policy level
The Strategy was the culmination
reforms and systems developments,
of nearly a decade of preparation.
the country today is well on its
In 1993, just four years after the
way to having a fully interoperable
Government of Malawi (GoM)
national switch (see Annex D for
established the Reserve Bank of
details), along with supportive and
Malawi (RBM) through the RBM Act
SECTION 3: EVOLUTION OF POLICY TOWARD ELECTRONIC PAYMENTS
17
MALAWI COUNTRY DIAGNOSTIC
of 1989, RBM set up the National
settlement (RTGS) system, called
Payments Council as a multi-agency
the Malawi Interbank Transfer and
advisory body in order to foment
Settlement System (MITASS), in
coordination toward the strategy
2002; an Electronic Check Clearing
and framework.
20
Soon after
House (ECCH) in 2005; an EFT/
establishing the NPC, in 1995 the GoM
Smart Card Scheme; an Electronic
became part of the SADC Payment
Bidding System; and the Integrated
Systems Project, part of a broader
Financial Management System
financial development project of
(IFMIS) for government payments.21
SADC countries, initially focused on
implementing the RTGS and funded
The NPS Oversight Policy, which
by the World Bank.
became effective on January 1, 2008,
allows the RBM to conduct payment
Major payment system
improvements starting in
2002
system oversight activities in order to
Prior to 2002, Malawi used a
internationally recognized principles.
ensure that the modernized payment
system is efficient and conforms to
Deferred Net Settlement (DNS)
System, an antiquated system that
Also in 2008, RBM, the National
caused delays, uncertainty and
Payments Council and the Bankers
heightened payment risk. With DNS,
Association of Malawi introduced
interbank funds transfer instructions
and endorsed a revised National
were sent by the commercial banks
Payment System Vision and
to reserve banks via facsimile, with
Strategy Framework for 2009-2013.
transactions settled at the end of
It articulated the country’s vision
the business day. Check processing
for interoperability and straight
was also manual: banks would meet
through processing (STP) as core
in the clearinghouse twice per day
principles of the NPS and asserted
to exchange checks drawn on each
that the functioning of the economy
other. The clearing period for checks
depended on adequate payments
ranged from 7 to 21 days.
services infrastructure and, as
such, its design, implementation,
Between 2002 and 2008, the GoM
and management should be the
improved the electronic payment
responsibility of “all stakeholders.”
environment through the upgrade
18
and/or establishment of several
Although Malawi has implemented
modern electronic facilities,
several electronic-based payment
all discussed in detail below,
products and services, there is no
including: the Malawi Switch Centre
specific legislation that covers the
(MALSWITCH); a real time gross
operation of such facilities. The first
COUNTRY DIAGNOSTIC: MALAWI - Development Results Focused Research Program
COUNTRY DIAGNOSTIC
Draft NPS bill was prepared in 2002,
legal and regulatory factors. While
but is still pending to date due to,
banking supervision complies with
according to the RBM, a series of
the majority of Basel Core Principles,
delays resulting from modifications
the regulatory framework for non-
and reviews as priorities and
bank financial institutions is rapidly
infrastructure have evolved. Today,
developing. The MoF wants to build
the RBM’s NPS efforts appear to
its capacity for the development
center on the passage of the NPS
and coordination of financial sector
Bill and the development of a new
policies, and the oversight of state
national switch, which became a
ownership in the financial sector.
priority after the efforts around
The government policy objective is
MALSWITCH failed to gather
to build a financial sector – one that
momentum necessary to achieve
supports the MGD Strategy’s vision
its objectives to achieve greater
of inclusive and sustainable growth.
interoperability, as discussed below.
Financial inclusion strategy
aligns with the payments
vision
There is close alignment between
the Financial Sector Development
Strategy and the national payment
system vision, exemplified by the
PThe Ministry of Finance (MoF)
establishment and implementation
and RBM have established a clear
of the World Bank Financial Sector
strategy for payment system
Technical Assistance Program
development, anchored by the
(FSTAP), a $28.2 million USD
National Strategy for Financial
program tasked with providing
Inclusion (2010 – 2014). As part
“a roadmap for financial sector
of the strategy, a Financial Sector
development in Malawi.” Malawi’s
Policy Unit (FSPU) was created
FSTAP Project Concept was
within MoF in late 2010. The FSPU
introduced in September 2010 and
is responsible for the development
formally launched in February 2012.
and oversight of the national
financial inclusion strategy, a four-
The FSTAP project is financing (i)
pronged approach, which seeks to
strengthening RBM’s regulatory
strengthen financial regulation and
and institutional framework and
supervision, modernize financial
supervision capacity; (ii) developing
sector infrastructure, expand access
financial sector infrastructure
to finance and better define the role
through upgrading the payment
of government in the sector.
system and through mobile phone
banking technologies; (iii) supporting
Efforts to improve the financial
financial inclusion and consumer
sector have largely focused on
protection activities through a multi-
SECTION 3: EVOLUTION OF POLICY TOWARD ELECTRONIC PAYMENTS
19
MALAWI COUNTRY DIAGNOSTIC
donor financial sector deepening
trust; (iv) building MoF’s institutional
capacity for financial sector policy
and government cash management;
and (v) supporting RBM’s project
management unit.
Notably, FSTAP funds have paid
for the national switch (but there
is a loan agreement with the World
Bank for the banks to pay back the
loan for the switch ($3.9 million
USD)). Another $3.28 million USD
is dedicated to technical assistance
to support the establishment and
strengthening of the government’s
financial sector policy unit and
training of MoF staff on financial
sector issues.22
Lack of a national identification
system has been recognized as
another major hurdle in achieving
financial inclusion objectives.23
Finally, strong governance will be
needed to prevent the aftermath of
the Cashgate scandal from further
derailing momentum toward financial
sector development and financial
inclusion strategy implementation.
As a payer, GoM’s ability to
shift has been weak
Inside the GoM, the RBM is clearly
driving policy movement towards a
shift, along with political support and
momentum within other ministries
such as Ministry of Finance and the
Ministry of Gender. Outside of these
major reforms to modernize the
20
national payment system, however,
the Government of Malawi still makes
payments almost entirely by check
and has not been as progressive
in the shift to making electronic
payments.
Government reforms of its own
payments processes began in
199524 with a project to move from
a decentralized payment system,
in which each ministry managed its
own payments and budgets, to a
centralized payment system, via the
IFMIS (described in Box 1 below). Yet,
implementation of the IFMIS only
began in 2005. The MoF opened
five accounts at the RBM, and the
ministries closed their accounts at the
commercial banks, except for those
accounts used for donor-funded
projects, Treasury funds and local
assemblies. A main Central Payment
Office (CPO) was established at the
Accountant General’s Department,
within the MoF, and mini CPOs were
opened in the regions. By the end of
July 2006, IFMIS was rolled out to all
ministries and departments.
The IFMIS was intended to bring
efficiency and transparency to
government payments. Its completion
contributed to cancellation of
Malawi’s debt to the World Bank/IMF
in 200625 and eliminated the backlog
of bank reconciliation inherent
in the decentralized, commercial
bank-linked model. While it was
certainly an improvement over the
decentralized model that preceded
it, recent events suggest that IFMIS
has not been as effective at reducing
fraud and enforcing fiscal discipline
as many had hoped.
COUNTRY DIAGNOSTIC: MALAWI - Development Results Focused Research Program
COUNTRY DIAGNOSTIC
Box 1
Integrated Financial Management Information System (IFMIS)
The national government, through the Accountant General’s (AG) Department in the Ministry of Finance,
makes salary, pension and supplier payments centrally. However, unlike in the systems in place in Mexico
and Nigeria (described in a BTCA case study and a diagnostic, respectively) and in development in the
Philippines (BTCA diagnostic), Malawi’s centralized payments system does not make payments electronically.
Government employees are all required to have bank accounts. (As of May 2013, there were 139,477 civil
servants, though some categories, such as local chiefs on government payroll, are exempt and are paid in
cash.) Each month, the AG writes one large check to Bank A for all government employees whose accounts
are at Bank A. Then Bank A electronically disburses the correct salaries, based on schedules sent by IFMIS,
into the employees’ accounts. The same process occurs for each bank at which government employees
maintain accounts.
Government pensions for 25,000 pensioners are paid in the same way. For the remaining 2,000 pensioners
who are too old and sick to go to a bank, the AG issues a check to officers in local government, who then
cash the check and hand deliver the cash to the pensioners.
To qualify for government procurement contracts, suppliers must be registered with the Bureau of Public
Procurement. There are now about 3,000 registered suppliers, but neither the BPP nor the AG keeps a record
of how many of these suppliers are on active contracts or even how many are still in existence as companies.
The AG does actual payment, mostly by check.
Recent policy emphasis on
mobile, driven by donors
The NPS Strategy (2009-2013) hardly
Government commitment to reform
phone-based payment methods.
and development of electronic
Indeed, the provisions in the RBM Act
payment systems and facilities,
(2010) do not cover the oversight
particularly from the RBM and
of modern electronic payments
Ministry of Finance, has signaled an
systems.27 Mobile money appears to
opportunity for real progress. That
make its debut as a policy priority
momentum has been driven in large
in country-level policy documents
part by development partners.
in 2010 with its treatment in FSTAP
Development partners have been
planning. This indicates the swift
particularly aggressive recently on
shift in focus toward mobile money
advocating mobile banking as a
in recent years. Regulations on
leapfrog tool for financial inclusion
mobile banking are still nascent and
and certain payments such as G2P,
the further review and alignment
D2P, P2P and some P2B.
of related e-banking and agent
26
mentions mobile banking or mobile
regulations is ongoing.
SECTION 3: EVOLUTION OF POLICY TOWARD ELECTRONIC PAYMENTS
21
MALAWI COUNTRY DIAGNOSTIC
In 2012, Airtel launched its mobile
UNCDF also launched its own
payments product Aritel Money. That
MM4P (Mobile Money for the Poor)
same year, USAID launched a Mobile
project, which provides technical
Money Accelerator Project (MMAP)28,
assistance to RBM, and conducts
run by FHI360 and involving the
research to identify opportunities
RBM, MoF, the Bankers Association
to advance mobile payments in
of Malawi (BAM) and major
different sectors.30 The UN’s World
development partners like UNCDF in
Food Program, which coordinates
a Mobile Money Coordination Group
Malawi’s annual emergency response
(MMCG). Beyond coordination, the
to drought-stricken areas, has placed
MMAP seeks to accelerate the pace of
heavy emphasis on mobile payments
mobile money uptake though a series
to cash grant recipients for the
of interventions and investments,
2013 response, despite significant
including several pilots of mobile
challenges using Airtel Money for
money products and services for
payments in 2012. Through support
different segments, including G2P
from KfW, the Ministry of Gender is
recipients, low-wage earners, farmers,
planning to experiment with mobile
civil servants and others.29
payments for its Social Cash Transfer
Program (SCTP).
Box 2
Cash transfer programs from government and donors
The diagnostic team reviewed Malawi’s two most prominent social cash transfer programs, the Social
Cash Transfer Program (STCP) run by GoM and the INGO-led Integrated Annual Emergency Response.
To different degrees, both have started experimenting with shifting from cash in transit and OTC
payments to electronic delivery via bank accounts or mobile phones.
The SCTP is implemented by the Ministry of Gender and aims to support the poorest 10% of Malawi’s
ultra-poor through regular cash transfers, intended to reduce malnutrition and boost school enrollment.
The SCTP is currently active in 7 districts in Malawi, though there are plans to expand the program
further. Currently, the program makes payments of around USD 11 per month to approximately 30,000
households. While these are currently all cash payments, with resources from KfW and others, the
Ministry aims to experiment with electronic payments in two districts, likely beginning in 2014.
The Emergency Response aims to save lives, reduce suffering and build resiliency among food-insecure
households during Malawi’s drought season. The stipend amount is based on the market basket price
of the equivalent of in-kind aid, but is typically around USD 37. In the 2012-2013 emergency response,
which reached approximately 40,000 individuals across three districts, the consortium experimented with
electronic delivery of transfers via three different payment service providers, Airtel Money, OIBM, and G4S
Security. Although Airtel struggled to fulfill its role as a PSP in the 2012 response, which led to one NGO
abandoning the service and reverting to cash31, the World Food Programme and the INGO consortium
have decided to use Airtel Money exclusively for the 2013-2014 response.
22
COUNTRY DIAGNOSTIC: MALAWI - Development Results Focused Research Program
COUNTRY DIAGNOSTIC
In 2010 the RBM created an
the mobile money market, RBM has
E-Banking Task Force, consisting
expressed concern that the rise of
of members from its Banking
mobile money has complicated its
& National Payments System,
vision of the shift to cash lite. The
Bank Supervision, Internal Audit,
current Guidelines on Agent Banking
Information & Communication
and Mobile Payments may create an
Technology, Legal Affairs & Bank
uneven playing field for banks and
Secretariat and Exchange Control &
MNOs, particularly in the absence
Debt Management departments, to
of e-money regulations (currently in
coordinate its approach on mobile
draft and under review). Arguably,
payments. The guidelines produced
the difference could tilt the market
by the Task Force in March 2011
in favor of non-banks (i.e. MNOs)
mandated that interested non-
whose respective regulations for
bank institutions or mobile network
agents and KYC requirements are
operators (MNOs) should partner
less onerous then those that apply
with registered commercial banks
to banks.32 Through FSTAP, the
if they want to operate mobile
GoM have indicated an intention
payment services in Malawi.
to combine e-money and agent
banking guidelines into one common
While donors, and to a lesser extent
regulation and ensure a level playing
government, have placed a heavy
field moving forward.
emphasis on the development of
SECTION 3: EVOLUTION OF POLICY TOWARD ELECTRONIC PAYMENTS
23
24
COUNTRY DIAGNOSTIC: MALAWI - Development Results Focused Research Program
1995
SADC Payments
System Project
launched
2005
IFMIS and ECCH rolled out
2011
Guidelines for Mobile
Payments Drafted
2014
Draft NPS Bill likely
to become law;
National Switch
likely to lead to
interoperability
1993
National Payments
Council established
2001
National Payment
System Strategy and
Framework launched
2013
TNM launches
mobile payments
product
2012
FSTAP initiative launched through
WB to guide fin sector deepening
and financial inclusion,
including payments
2010
E-Banking Taskforce created to
guide rules around electronic
and mobile banking
2006
Malawi releases it Malawi
Growth and Development
Strategy
1989 1990 1991 1992 1993 1994 1995 1996 1997 1998 1999 2000 2001 2002 2003 2004 2005 2006 2007 2008 2009 2010 2011 2012 2013 2014
1989
Reserve Bank of Malawi
established through RBM Act
Draft National Payment
System Bill completed
2008
NPS Oversight Policy
2012
Airtel Money Launches; MMAP, MMCG both
arise from donor push for mobile money.
WFP and other DPs attempt to use Airtel
Money for payments to drought victims,
with limited success
2013
Draft NPS bill, after years of
consultation, is presented to cabinet
Payments system
milestones
2002
MITASS and MALSWITCH
launched
2010 > 2013
Financial Sector Strategy 2010-2014
2008 > 2013
NPC, BAM and RBM introduce the NPS Strategy 2009-2013
MALAWI COUNTRY DIAGNOSTIC
COUNTRY DIAGNOSTIC
4
Current state of
transition to e-payments
Headline indicators
Data Quality Index
The narrative in the previous two
sections comes from a thorough
analysis of available information and
data on payments made in Malawi.
These data indicate that the vast
majority of the payments made
in Malawi are made in cash and
checks: just 0.3% of the 221.5 million
payments made every month are
through electronic means.
Quantitatively mapping the
payments landscape is a necessary
first step to a targeted effort to
convert cash to electronic payments.
However, with large segments of
transactions taking place in cash,
aggregate estimates — especially
data on payment volumes — are
not available and need to be
constructed from multiple sources.
Figure 14 below provides an ata-glance indication of the quality
and availability of the data relating
to each payer in the grid, based
on the scoring below, and hence
the country team’s confidence in
the overall calculations. In general,
in common with many emerging
markets, the quality and availability
of data relating to government
The dominance of cash in the
country’s payment system is not
surprising considering the large
unbanked population and the
predominance of subsistence
farmers and informal sector, all
transacting in cash to buy and
sell goods.
SECTION 4: CURRENT STATE OF TRANSITION TO E-PAYMENTS
25
MALAWI COUNTRY DIAGNOSTIC
FIGURE 14
Data quality and availability: Malawi
Data availability
5.0
4.0
3.0
Malawi is in the
G
2.0
1.0 B
1.0
G = Government
P = Individuals
B = Business
D = Development
partners
D
P
2.0
3.0
4.0
5.0
Data quality
very early stages
of its shift to cash
lite. Just 0.3% of
the 221.5 million
payments made
every month are
through electronic
means.
26
payments (G) is better than for
business (B) or individuals (P), where
it is generally lacking and relies on
extrapolation based on assumptions
from a variety of estimates. However,
despite the low ranking for business
overall, some large corporates in
the agribusiness, utilities, financial/
insurance services and wholesale
and retail trade sectors were
generally willing to participate in
this research, the majority on the
basis of anonymity. For Malawi, even
obtaining government data often
required in-person meetings and
follow-up requests and estimating
the numbers using multiple data
sources. The data gathering process
encountered further challenges due
to Cashgate, discussed above, which
left many data requests ultimately
unfulfilled.
Payments data by payer and
payee
As Table 2 below shows, the estimated
221.5 million payments per month
correspond to a value of over USD
760 million per month. Individuals
and businesses initiate the majority
of payment volumes (99.8%) and are
overwhelmingly cash-heavy (only 0.2%
electronic for individuals and 3.6% for
businesses). Business payments make
up 53% of payment value and are
mostly made using cash and check.
The total value covered by these data
is much greater than Malawi’s USD 4.3
billion GDP (2012) because this analysis
follows payment streams through
multiple transactions.
COUNTRY DIAGNOSTIC: MALAWI - Development Results Focused Research Program
COUNTRY DIAGNOSTIC
TABLE 2
Payments by payer in Malawi33
Payer
No. of payments/month
% volume electronic
388,518
0.3%
36,927
$110.3
8%
5,871,911
3.6%
134,965
$403.2
38%
Government
Business
Total value MWK mil Total value USD mil
% value elec.
215,204,166
0.2%
81,451
$243.4
10%
Dev. partners34
32,530
80%
1,133
$3.4
89%
Total per month
221,497,125
0.3%
254,475
$760.3
25%
2,657,965,506
0.3%
3,053,704
$9,123.7
25%
Individuals
Total per year
The data suggest there is a cash
Table 3 below shows the volume of
pool of USD 572.2 million in monthly
monthly payments for each payer-
payments. P2B payments represent the
payee combination.
largest pool of cash value for electronic
conversion at an estimated USD 189.1
As Table 3 shows, most payment
million, followed by B2P payments,
transactions occur between
which represent an estimated USD 116.8
consumers and businesses, and
million in cash value. Another large
between businesses and other
pool of cash (USD 72.4 million per
business or corporate establishments.
month) is B2G payments.
TABLE 3
Number of monthly payments by payer and payee type
PAYEE
PAYER
Government
Business
Individuals
Development partners
35
Government
Business
Individual
298
172,099
216,121
464,191
4,149,125
1,258,595
334,503
214,481,381
388,283
32,530
SECTION 4: CURRENT STATE OF TRANSITION TO E-PAYMENTS
27
MALAWI COUNTRY DIAGNOSTIC
Tables 4 and 5 below show the
smaller payments, which are paid
percentage of payments, by volume
in cash, account for a larger share
and value, respectively, made by
of the overall payment volume.
electronic means for each of the
The low prevalence of government
cells in the payment grid.
electronic payments is due to the
nature of the payments: Although
TABLE 4
Comparing values and volumes for
the national government pays civil
all payers and payees, all payments
servants by directly depositing their
to businesses and most payments
salaries in their bank accounts, the
to individuals have a higher
government writes checks to the
percentage in value than in number
respective banks to effect these
of payments paid electronically.36
payments, which is defined for this
This suggests that payers tend
study as a non-electronic payment.
to make larger value payments
(See more in Annex B about G2P
electronically to these payees; but
payments.)
Percentage of electronic payments by volume
PAYER
PAYEE
Government
Business
Individual
Government
36%
1%
0%
Business
0%
1%
14%
Individuals
1%
0%
7%
80%
Development partners
TABLE 5
Percentage of electronic payments by value
PAYER
PAYEE
Government
Business
Individual
Government
5%
12%
0%
Business
0%
59%
36%
Individuals
2%
9%
51%
Development partners
28
COUNTRY DIAGNOSTIC: MALAWI - Development Results Focused Research Program
89%
COUNTRY DIAGNOSTIC
5
Trajectory of shift: payment
infrastructure and incentives
Relevant use cases
B. M
ass electronic credits such as
BTCA country diagnostics seek to
assess the trajectory of the shift to
electronic payment, through the lens
of particular payment use cases (see
Annex B for more information), which
are particularly relevant to the stage
of the journey of the country. This
section explains the current state and
momentum of the shift to electronic
payments in certain cells of the
payment grid.
salary payments (initiated via
many means)
C. A
ccount-based remote bill
payments across a range of
channels
D. Goods purchases with debit
cards at a merchant with POS
These use cases (color coded as
The use cases selected for analysis
per the footnote) apply to the
provide a general view of the forces
different cells of the payment grid
driving the shift in Malawi today:
as highlighted in Figure 17 below.
FIGURE 15
Use cases and payment types in Malawi
Recipient
Entity making the Payment
G
G2G
G
Central government disbursements to local
level
Transfers within the central government
B2G
B
Taxes, Fees for licenses and permits
Payments to gov’t utilities
P
Taxes, Utilities
Debit card payment of taxes
Payments to gov’t utilities
P2G
D
D2G
Taxes
B
P
G2B
Supplier payments
Utility payments
G2P
Welfare programs, Salaries, Pensions
B2B
Supplier payments, Utility payments,
Pension contributions
B2P
Salaries and benefits
P2B
Utilities, School fees, Credit card payments,
Pension contributions
Debit card payment at stores
D2B
Utility payments
P2P
Remittances, Gifts
D2P
Cash transfers
Salaries for local employees
Note: Mass electronic credit (or bulk payments); Remote bill payment (or bulk collections); Debit card payments at merchants.
G = Government; B = Business; P = Individuals; D = Development partners
SECTION 5: TRAJECTORY OF SHIFT: PAYMENT INFRASTRUCTURE AND INCENTIVES
29
MALAWI COUNTRY DIAGNOSTIC
TABLE 6
The payments are made and received
Table 6 below presents a high-level
by: government (G), business (B),
review of the availability and costs of
individuals (P, for person) and the
electronic payments for each of the
development community (D).
three use cases.
Overview of Payments Use Cases
Bulk payers (G, B, D)
Non-bulk payers (P, B)
A. Mass electronic credit – Mass
fund transfers
B. Remote bill payment
C. Debit card payment at
merchants
(a) Store of value from/to which
payment is made
Bank account or mobile money
account
Bank account or mobile money
account
Bank account
(b) Payment instrument category
Check into electronic: employer
(e.g. government) pays each
bank via check; Bank then credits
individual accounts. Therefore, not
end-to-end electronic.
Varies. Could be mobile phone e.g.
Airtel Money for water bills, or
internet (Standard Bank).
In theory could also include via
ATM, but banks in Malawi do not
appear to offer ATM bill payment.
Debit card
Varies. Could be a corporate
system ranging from paper
to electronic.
Varies. Could be a corporate
system ranging from paper to
electronic. Could also be phone,
internet or pay at counter.
POS
Credit ‘push’
Debit ‘pull’ and credit ‘push’
Debit ‘pull’
Use case defined
(b1) Payment device (acquirer)
(c) Transaction type
(d) Means used to initiate and
authorize
List provided by employer/payer.
Manual list needs to be provided
for each payment cycle.
Varies depending on access
channel/ acquiring device (hence
Track 1 and 2 data contained on
multiple use cases contained
debit card (and PIN kept on
within this one); could be internet
bank’s system)
username, data on debit card,
mobile phone number, etc.
Bulk payments (One to many); send
value then information.37
(e) Mode of clearing/ speed of
process
Is there a range of providers
who offer this?
30
Paper-based schedules still used for
making payments into accounts.
Many to one
One to one: Real-time
authorization for single
instructions.
Yes
Yes
Individual banks may have to utilize
inter-branch transfer (IBT) as part
of this process.
Yes
COUNTRY DIAGNOSTIC: MALAWI - Development Results Focused Research Program
COUNTRY DIAGNOSTIC
Bulk payers (G, B, D)
Use case defined
A. Mass electronic credit – Mass
fund transfers
Time to credit value received
T+1 across banks/ longer where
checks are involved (up to 7 days
in remote areas)
% of all accounts which can be
used with this instrument
Indicative cost to consumer per
transaction for an average size
transaction
Non-bulk payers (P, B)
B. Remote bill payment
T+1 across banks
Unclear across MMIs.
C. Debit card payment at
merchants
T+1 across banks
All bank accounts and mobile
money accounts. Note: employers
Bank accounts for which card is
are still multi-banked in that they All mobile money accounts. Bank accepted at POS, e.g. OIBM or
generally must have an account
accounts for which bank offers Indebank cards on MALSWITCH
at each bank which one or more
bill payment services.
POS, cards of the four VisaNet
employees use for salary payments
banks on Visa POS, etc.
due to lack of interoperability.
At one indicative bank:
1. Cost of card38 (~MWK 1800) borne
by employer
2. One-time processing fee per new
employee (borne by employer):
MWK 200
3. Monthly account maintenance
fee: MWK 200 (borne by employee)
At second indicative bank:
1. MWK 170 per payment, to
employer’s account
At one indicative bank:
No charge to customer;
Mobile banking—no charge
for bill payment
Merchant discount rate
between 1.8%-4.0
2. Likely additional branch/ ATM
withdrawal fees (MWK 200/ 90,
respectively) if consumer cannot use
money electronically
As % of average tx amount
Unclear—need average transaction Same—need average transaction
size to calculate.
size.
The remainder of this section is
different user groups. The detailed
a rating of the trajectory towards
ratings can be found in Annex C
shifting for these use cases. In each
and the supporting analysis in
case, several factors are assessed
Annex D. Although not assessed in
and weighted: the overall country
depth as the use cases below, the
environment and conditions to
annex also includes trajectory scores
promote shift; the interest of service
for Development Partners. Donor
providers; and incentives from
payments are an integral part of the
No cost to customer.
SECTION 5: TRAJECTORY OF SHIFT: PAYMENT INFRASTRUCTURE AND INCENTIVES
31
MALAWI COUNTRY DIAGNOSTIC
payments ecosystem in Malawi: donor
The factors that generate the ratings
aid accounts for 40% of Malawi’s
vary somewhat by the use case,
national budget, and 31 donors support
but each is rated according to the
various aid projects throughout all of
categories in Table 7 below.
Malawi’s 28 districts.
39
TABLE 7
Use case ratings
Rating
Conditions & incentives are such that it is:
1
Highly likely to support a full shift
2
Possible to achieve a full shift
3
Likely to lead to slow incremental progress
4
Likely to drift without clear upward trend
5
Unlikely to lead to shift
Use case A: Mass electronic
credits
Use case assessment:
3.6
Slow progress without clear
upward trend
This use case covers a range of
payment streams considered ‘one to
many,’ i.e. one payer paying to multiple
parties. Mass electronic credits include
a variety of payment types including
salary, pension payments and social
cash transfers, among others.
32
COUNTRY DIAGNOSTIC: MALAWI - Development Results Focused Research Program
COUNTRY DIAGNOSTIC
The key findings are mass
electronic credits in Malawi
include:
1
3
Some big businesses have
begun to make payroll
payments electronically.
The Limbe Leaf Tobacco Company
With respect to payroll:
Commercial banks are
established providers of
these services in Malawi. In
most cases, these payments
are not end-to-end electronic,
delivers an electronic file along with
as employers submit paper lists of
4
a check to individual banks where its
employees have bank accounts. Some
banks (e.g. Standard Bank) do provide
inter-bank payments in an electronic
manner for these types of payments.
employers. Employers pay individual
Most smallholder
tobacco farmers, those
not formal employees
of estates, are paid at auction
directly into accounts. However,
many of these accounts are
group accounts (for up to 20
farmers), where a designated group
banks via check or electronically
leader withdraws and disburses
for the full payroll amount and then
the payment from the purchasing
provide a paper or electronic schedule
company. Hence the payments are
(depending on the bank) to advise
initiated by check or through inter-
how the lump sum is to be distributed
bank transfer, but the farmers receive
into individual employees’ accounts.
them as cash payments. (Farmers
2
of other crops are paid by different
employees to each relevant bank for
every payment period. Standard Bank
uses a web-based platform to make
these and other bulk payments. From
the interviews for this diagnostic,
OIBM relies on inter-branch transfers
(IBT) after receiving lists from
The Malawian government
uses the same process,
issuing checks to banks to
then disburse into employees’
and pensioners’ accounts. (See
means. Tea farmers, for instance, are
mostly employed by estates; they
and farmers of legumes, cotton and
coffee are paid directly in cash.)
Section III.) With the suspension of
IFMIS, it is unclear if the lists are sent
electronically or manually, and it is
unclear how they are updated and
reconciled.
SECTION 5: TRAJECTORY OF SHIFT: PAYMENT INFRASTRUCTURE AND INCENTIVES
33
MALAWI COUNTRY DIAGNOSTIC
5
In a limited number of
instances, mobile money
services have been used
to facilitate mass electronic
credits. TNM’s mobile money
service, for example, provides
bulk salary payments to school
supervisors. However, TNM’s
Use case B: Remote bill and
services payments
Use case assessment:
3.8
Likely to drift with no clear
upward trend
corporate salary payment services
are not yet active.
6
Cash transfer payments
(G2P) under the Social
Cash Transfer Program
(SCTP) and other G2P
programs still consist of manual
disbursements at present. KfW
and other donors such as Irish Aid
are considering making part of
the process electronic (though the
disbursements will remain in cash)
in the specific districts in which they
are responsible for executing the
cash transfers — hence G2P may
emerge as an important source
of retail mass credits. However,
Remote bill payments refer to
payments made to public or private
service providers in a manner other
than in-person payments at the
service provider’s place of business.
Individuals, businesses and
government entities can affect remote
bill payments with a range of payment
instruments (e.g. card at POS, mobile
banking or mobile financial services)
from one of several stores of value
(bank account, mobile money
account). One of the most common
examples of remote bill payments is a
utility company, which enables
customers to pay their bills at a
retailer with whom it has concluded a
service agreement.
if, in the future, beneficiaries receive
Other examples of this grouping of
disbursements electronically but are
use cases (across various supported
not able to use the electronic value
channels and stores of value) include:
(for lack of development of the local
financial services infrastructure),
• Collection of taxes (P2G, B2G)
they will continue to have to cashout; the disbursements would not be
• Collection of school fees (P2B)
end-to-end electronic in this case. In
short, while migration to electronic
• Credit card payments (P2B)
disbursements might reduce costs for
the disbursers such as government
and donors, it will not necessarily
make beneficiaries’ lives easier unless
conditions are amenable to the usage
of electronic value.
34
COUNTRY DIAGNOSTIC: MALAWI - Development Results Focused Research Program
COUNTRY DIAGNOSTIC
Key findings around remote
bill payments in Malawi
include:
1
While several services
enable customers with
bank or mobile money
accounts to make remote bill
payments, few are widely used
within Malawi. For example,
although Airtel Money customers
in most parts of Malawi can pay
their water and electric utility bills
with this service, this service does
4
Web-based remote
bill payment services
(e.g. Standard Bank’s
services) are not widely used
within Malawi, given the small
proportion of the population
with Internet access. The
Lilongwe Water Board advertises
online bill payments, but its billing
staff was unaware how this service
could be accessed.
Use case C: Debit Card at
Merchant
not appear to have achieved mass
uptake, given that there are only
75,000 active users of Airtel Money.
2
Similarly, while mobile
banking services can be
used to make remote utility
payments, customer take-up
appears to be low. OIBM has about
Use case assessment:
3.9
Likely to drift without clear trend
This use case consists of an individual
making a purchase at a place of
66,000 registered customers who
business using a debit card on a POS
make between 4,000-5,000 mobile
device. This use case does not include
banking transactions monthly — across
any and all varieties of card on POS (i.e.
all types of transactions, including
prepaid or credit cards), each of which
balance inquiries.
would carry different risk and cost
3
profiles.40 The country team identified
The Limbe Leaf Tobacco Company
the latter is available) based on a range
uses Standard Bank to transfer
of factors such as trust in the service
funds into their bank accounts. The
provider, speed and efficiency of the
company noted that smaller suppliers
service and the price of the service.
and the government prefer check as a
Debit cards on POS are considered a
means of payment.
two-sided market in that consumers
Some large businesses
have begun paying large
suppliers electronically.
debit card at POS as a key use case
because consumers decide whether
to pay in cash or electronically (where
must be willing to use cards and
merchants must be willing to accept
them.
SECTION 5: TRAJECTORY OF SHIFT: PAYMENT INFRASTRUCTURE AND INCENTIVES
35
DIAGNOSTIC
MALAWI COUNTRY PLAN
Key findings for debit card
transactions at merchants in
Malawi include:
2
Lack of efficient and
effective interoperability is
a key detriment to achieving
a shift away from cash to make
payments. While some merchants
National Bank offers a smart card
1
have multiple banks’ POS devices and
are hence able to accept cards from
multiple banks, this type of functional
interoperability at merchant level
is costly and inefficient, as noted
above. Seven of Malawi’s eleven
commercial banks are not connected
via Visa. Local cards cannot be used
at a Visa POS, nor can Visa cards
be used on proprietary POS devices
— making merchants have multiple
POS machines. Similarly, cards issued
by OIBM and Indebank, the two
MALSWITCH banks, can only be used
on MALSWITCH POS devices.
36
Co-branding ventures
between banks and
retailers have not driven
significant additional adoption
and use of cards to make
purchases. MALSWITCH via
with Puma Energy, a chain of fuel
stations.41 However, the Puma card
effectively operates as a closedloop, which caused a number of
cardholders to abandon the card
when the Puma fueling stations
experienced fuel shortages in 2012.
COUNTRY DIAGNOSTIC: MALAWI - Development Results Focused Research Program
COUNTRY DIAGNOSTIC
Status of the journey
FIGURE 16
Cash currently dominates in Malawi
and data do not indicate a notable
shift toward electronic payments in the
country. Just 0.3% of the 221.5 million
payments made every month are
through electronic means. Individuals
and businesses initiate the majority
of payment volumes (99.8%) and are
overwhelmingly cash-heavy (only 0.2%
electronic for individuals and 3.6% for
businesses).
Malawi offers an interesting test of
# of payments per month (million)
6
Lessons about sequencing
and prioritizing the shift
Number of payments (millions)
300
200
100
0
Shift1
the hypothesis presented in the BTCA
whitepaper, which proposed that
Shift2
Cash
the shift to electronic occurs in three
Shift3
Electronic
stages – from cash heavy to bulk payer
transition (such as G2P); from bulk
FIGURE 17
P2B); and then from increasing e-usage
to cash lite (such as P2P). As Figures 16,
17 and 18 below show, Malawi appears
to be following the hypothesized
shift process: a higher percentage of
payments are made electronically
in shift 1 than shift 2, and shift 3 lags
even farther behind. This is a result of
infrastructure that allows for electronic
payments— particularly for payments of
corporates’ suppliers and creditors, and
for individual insurance and pension
contributions (using debit orders).
# of payments per month (million)
payer to increasing e-usage (such as
Value of payments (USD millions)
$600
$400
$200
$-
Shift1
Shift2
Cash
Shift3
Electronic
SECTION 6: LESSONS ABOUT SEQUENCING AND PRIORITIZING THE SHIFT
37
MALAWI COUNTRY DIAGNOSTIC
# of payments per month (million)
FIGURE 18
Electronic payments as a % of total
However, despite extensive efforts
within the GoM to improve the
overall enabling environment for
payments, the bulk payer transition
100%
has not occurred in Malawi. In fact,
government payments are the most
cash dominant of all payment flows
within the country. The dependency
on checks stems in part from the
50%
inadequate structure and control of
IFMIS, which does not easily enable
electronic payments and may in fact
entrench vested interests within the
Attorney General’s Office.
0%
Shift1:1
to many
Shift2:
many to 1
By number
Shift3:
many to many
By value
Efforts to move to electronic
government payments for the
country’s civil servants and SCTP
beneficiaries have yet to come to
fruition. Yet the Cashgate scandal
Inaction on government
payments inhibiting Shift 1
clearly exposed the threat of weak,
RBM’s payment system development
battle against corruption in Malawi.
and related reform initiatives (through
FSTAP and MoF) appear focused on
the right objectives to create a robust
38
cash-dependent system to good
governance, transparency and the
Donor-driven efforts
attempting to leap-frog Shift 1
enabling environment for electronic
The data reveal much more activity
payments: a fully interoperable
on electronic payments among
national switch, a national payment
and between businesses (B2B)
system bill, regulation of interchange
and individuals (bill pay (P2B) and
fees and consideration of the
remittances (P2P)). This may be a
emergence of MNOs as players in the
product of increased investment by
payments space.
donors in developing financially-
COUNTRY DIAGNOSTIC: MALAWI - Development Results Focused Research Program
COUNTRY DIAGNOSTIC
Cost, confidence and access
limitations inhibit individual
uptake
inclusive products and services,
pushing for electronic and accountbased payments opportunities for
individuals as well as businesses.
With 96% of SMME owners preferring
The MMAP is an ecosystem approach
to transact in cash, there is rather little
to advancing the mobile money
demand articulated for electronic
vision for the country, yet the systems
payments at the consumer level.
are not yet in place to support the
Merchants at which electronic
several product and service pilots
payments are accepted are rare and
under consideration. And public
consumers lack certainty as to whether
awareness campaigns aiming to drum
they can pay or cash-out at merchants,
up demand for mobile money are also
even those that purport to offer
not backed up by the accessibility and
electronic payment options. Further,
liquidity necessary to build trust and
consumers can face increased costs for
confidence in the system.
choosing to transact with electronic
instruments, as merchants will often
In fact, even what appear to be
add a “surcharge” of up to 4% for card
tech-driven D2P payments are
payments. Also, as consumers often
extremely limited given current
encounter problems with handsets or
infrastructure. WFP-coordinated
downtime on POS, they frequently
emergency response will use Airtel
default to cash.
Money this year for its payments
to around 22,000 households, yet
At the same time, ATMs occasional
these pale in comparison to G2P
go off line or run out of cash; queues
payments in both volume and values.
at banks and ATMs are incredibly
Even though beneficiaries receive
long, particularly at the end of the
disbursements electronically, they
month when payday occurs; and
are unable to use the electronic value
consumers find themselves with few
and continue to have to cash-out. In
better alternatives than carrying large
short, while migration to electronic
amounts of cash on them, even for
disbursements might reduce costs for
substantial purchases. The utility of
the disbursers such as government
electronic payments should be clear,
and donors, it will not necessarily
but the systems and incentives are
make beneficiaries’ lives easier unless
not yet in place to sufficiently support
conditions are amenable to the usage
the case for such payments at the
of electronic value.
consumer level.
SECTION 6: LESSONS ABOUT SEQUENCING AND PRIORITIZING THE SHIFT
39
@ Brendan Howard / Shutterstock.com
MALAWI COUNTRY DIAGNOSTIC
40
Lack of efficient and effective
The new national switch – should it
interoperability has been a key
roll out as planned with all banks
detriment to achieving a shift away
on board and the likelihood of
from cash to make payments,
incorporating mobile money issuers –
as it has restricted the effective
could help mitigate challenges
reach of Malawi’s financial services
around interoperability. This could
infrastructure. The prevalence
help to open up new opportunities
of closed-loop and proprietary
for electronic payment options
payment systems currently inhibits
that are affordable, trustworthy
the availability of efficient electronic
and consistently accessible to
payment opportunities for consumers.
consumers.
COUNTRY DIAGNOSTIC: MALAWI - Development Results Focused Research Program
COUNTRY DIAGNOSTIC
7
Proposed DRFRP approach
in Malawi in 2013/4
Potential case studies
Company, giving insight into how
the infrastructure and incentives of
The BTCA diagnostic for Malawi
national payments systems can shape
identified several specific stories
the payments behavior of otherwise
of shifting from cash to electronic
similar corporates.
payments in Malawi. Unlike in the
other DRFRP diagnostic countries,
however, these efforts have been
largely unsuccessful, are at a small
1. D
onor-driven shifts to
mobile-linked social cash
transfers
scale, or are at such an early stage
More so than within government,
that pursuing cases studies now
donors in Malawi are pushing more
may not have significant value for
aggressively for bulk payments,
BTCA stakeholders in other contexts.
predominantly for cash transfers for
Therefore, no case studies in Malawi
the poor, vulnerable or excluded. Yet
are recommended for in-depth study
these have to date been administered
as part of the DRFRP. Future (non-
through closed-loop propriety
DRFRP) BTCA research efforts should
solutions that have failed to achieve
note the potential opportunities
lasting e-payments usage beyond the
below.
typical monthly cash-out. This case
study would assess the implications of
However, one of the corporates
the donor push for mobile payments,
interviewed for this diagnostic could
particularly for low-income individuals
be added to the series of case-lets
through social cash transfers though
proposed for study in the BTCA
a comparative analysis of mobile
Nigeria diagnostic. The payment
payments approach in the 2012 vs.
processes and costs of Carlsberg
2013 WFP-led emergency response,
Malawi (the local Carlsberg and Coca-
in which payments are being made
Cola bottler) could be compared
by Airtel Money. By evaluating the
with those of Nigerian Bottling
relationship of emergency response
SECTION 7: PROPOSED DRFRP APPROACH IN MALAWI IN 2013/4
41
MALAWI COUNTRY DIAGNOSTIC
payments to the larger ecosystem
required for effective and efficient
shifts, development partners can begin
2. E
valuating the use case for
POS debit card payments at
merchants
to understand the extent to which
such systems can help or hinder the
One of the core impediments to
programs’ intended outcomes.
electronic payments at the individual
and business level is a dearth of
For example, the WFP cash transfer
e-payment options at merchants.
program using Airtel Money by and
This case study would examine the
large failed in its 2012 application, but
hurdles to uptake and usage (both in
WFP and the emergency response
supply and demand) of debit-card at
consortium have chosen not only
merchant POS and what is needed
to use it again, but to use it for all
to get cards working and become
payments during the 2013 response.
a desirable means of making and
A case study on the outcomes of the
accepting payment. With the national
latest response could offer lessons
switch, the infrastructure will be in
for how donors should think about
place for interoperable payments
the way these types of payment
with cards, particularly in the better-
schemes are structured such that they
connected urban areas. But merchant
feed support efforts toward a shift
uptake will be critical. The current
away from cash more sustainably. For
infrastructure and prevalence of ATM
instance, are there sequencing lessons
cards on the market would indicate
for rolling out electronic payments in
that there is more opportunity for
similar contexts, such as urban vs. rural
debit POS transactions at merchants
readiness? It also may offer insights
than there is for mobile payments
valuable to the MMAP project as it
in Malawi. At the same time, mobile
considers investments in pilots and
banking transactions currently dwarf
other initiatives related to advancing
POS transaction (by over 40 to 1, per
mobile money solutions for relatively
data collected as of July 2013), as
similar populations.
do MNO-led mobile payments (19 to
1). This may indicate the incredible
need for advancement of POS system
effectiveness, relatively higher demand
for mobile money transactions, or
perhaps most likely, a combination of
the two.
42
COUNTRY DIAGNOSTIC: MALAWI - Development Results Focused Research Program
@ gualtiero boffi / Shutterstock.com
COUNTRY DIAGNOSTIC
SECTION 7: PROPOSED DRFRP APPROACH IN MALAWI IN 2013/4
43
44
COUNTRY DIAGNOSTIC: MALAWI - Development Results Focused Research Program
@ Dennis Albert Richardson / Shutterstock.com
MALAWI
MALAWICOUNTRY
COUNTRYDIAGNOSTIC
DIAGNOSTIC
Annexes
COUNTRY DIAGNOSTIC
ANNEX A: LIST OF ACRONYMS
ACH
Automated Clearing House
MMAP
Mobile Money Accelerator Project
AG
Accountant General
MMCG
Mobile Money Coordinating Group
ATM
Automated Teller Machine
MMI
Mobile Money Issuer
B
Business
MNO
Mobile Network Operator
BAM
Bankers Association of Malawi
MoF
Ministry of Finance
BFA
Bankable Frontier Associates
mPOS
Mobile POS device
BTCA
Better Than Cash Alliance
NPC
National Payment Council
CCT
Conditional Cash Transfer
NPS
National Payment Strategy
D
Donor or Development Partner
OIBM
Opportunity International Bank
DDA
Demand Deposit Account
DNS
Deferred Net Settlement
Malawi
OTC
Over the counter
POS
Point of Sale
P
Person
RTC
Real Time Clearing
Program
RTGS
Real Time Gross Settlement
GDP
Gross Domestic Product
SADC
Southern African Development
GNI pc
Gross National Income per capita
G
Government
SCTP
Social Cash Transfer Program
GoM
Government of Malawi
SMME
Small, Medium and Micro Enterprises
IBFT
Inter-Bank Fund Transfer
SMS
Short Messaging Service
IFMIS
Integrated Financial Management
STP
Straight-Through-Processing
Information System
TSA
Treasury Single Account
IMF
International Monetary Fund
UNCDF
United National Capital Development
KYC
Know your Customer
MDR
Merchant Discount Rate
MFIs
Micro Finance Institutions
DRFRP
Development Results Focused
Research Program
FSTAP
Financial Sector Technical Assistance
MGDS
Malawi Growth and Development
Strategy
MITASS
Malawi Interbank Transfer and
Community
Fund
USAID
United States Agency International
Development
USD
United States Dollars
WB
World Bank
WFP
World Food Program
Settlement System
MM4P
Mobile Money for the Poor
Unless otherwise stated, exchange rate used is the 30-day
average exchange rate for October 2013:
$1 USD = 363.23 MKW.
ANNEXES
45
MALAWI
MALAWICOUNTRY
COUNTRYDIAGNOSTIC
DIAGNOSTIC
ANNEX B: DETAILED PAYMENT GRID
Definitions
The measurement component of the BTCA diagnostic has three main goals: The first is to evaluate the current
status of the shift to electronic payments. This snapshot of the payments landscape provides a baseline to aid the
Malawian government in its efforts to strategically shift concentrations of cash and evaluate the impact of policy
efforts. The second is to identify and catalogue best practices and cost-effective approaches to determining the
baseline. The third is to provide insight into knowledge gaps and priorities for the recommendation of additional
measurement activities.
The diagnostic includes an estimated number of payments between each pair of parties in the country: payers
(government, G; businesses, B; persons or individuals, P; and development community partners, D) and payees
(G, B and P). Though values are captured, the focus is on the volume of payments. This is to highlight the progress
of financial inclusion, a key area of interest for BTCA stakeholders, and one where payments are low-value and
high-volume; government and business payments may dominate values, but individuals make the most number of
payments in an economy. Specific payment data points included may vary slightly according to what information is
available and relevant to the payments story in each country. Note that payment figures exclude:
• Payments between financial intermediaries (interbank payments) since these are usually to settle underlying
transactions that have been made or else related to investment only; and
• Payments between accounts of the same party (inter own account transfers) or between different stores of
value (account to cash) of the same party (e.g. ATM withdrawals).
But that they include:
• Payments between overseas workers and receivers in-country (international remittances)
The estimated proportion of electronic payments refers to the proportion of the number of payments (as opposed
to value) that are initiated electronically.
46
COUNTRY DIAGNOSTIC: MALAWI - Development Results Focused Research Program
100%
0%
36%
0%
67%
236
7
11
170,000
298
57
15
64
2
160
Government: Local suppliers
Government: Ag subsidy suppliers
Government: Domestic interest
G2G
Government: Ntl intra-agency transfers
Government: National to local
Government: National to public entities
Government: Ntl to revenue authorities
Government: Local to local councils
0%
14%
1,258,595
205,600
1,050,320
B2P
Large businesses: Employees
MSMEs: Employees
197,112
3,949,920
1,768
MSMEs: Suppliers and creditors
Businesses: Pension contributions
0%
ANNEXES
0%
297,104
5,871,911
Public utilities
Business total
0%
79,428
Businesses: Local taxes, permits, fees
4%
0%
87,659
Businesses: National taxes
0%
464,191
0%
5%
B2G
326
4,149,125
B2B
Large businesses: Suppliers & creditors
Providers: Pension payouts
1%
367
Businesses: Insurance payouts
16%
71%
95%
2,675
Businesses: Pension payouts
0%
87%
0%
0%
0%
0%
0%
0%
388,518
Government total
Government: Pension contributions
1,845
Government: National suppliers
1%
G2B
0%
14,415
172,099
Government: Social transfer
0%
Government: Pensioners
0%
4,707
27,000
Government: Employees Local
0%
0%
216,121
170,000
G2P
Government: Employees National
% electronic
by volume
# payments
per month
212,419
-
-
-
-
-
81
-
31,012
31,094
349
1,899
-
179,427
181,326
117
106
-
-
-
-
106
-
11
-
-
-
11
-
-
-
-
-
# payments
electronic
344,814
32,150
4,041
163,914
66,702
1,894,605
1,388,008
1,808
201,072
871,373
84,000
42,865
12,000
234,237
96,367
106,342,904
3,198,746
347,406,151
29,124,247
106,698,605
40,472,544
105,380,059
4,421
221,235,735
620,266,379
6,486,637
6,486,637
213,618,847
3,600
20,370
47,630
47,630
29,808
Avg. value per
payment MWK
1,030
96
12
490
199
5,661
4,147
5
601
2,603
251
128
36
700
288
317,725
9,557
1,037,959
87,016
318,788
120,921
314,848
13
660,995
1,853,195
19,380
19,380
638,238
11
61
142
142
89
Avg. value per
payment USD
134,964,633,745
9,551,893,600
320,997,776
14,368,475,276
24,241,366,651
617,100,000
2,453,450,704
7,141,446,464
39,633,750,000
49,845,747,169
30,853,081
114,647,887
12,603,840,000
48,159,032,038
60,877,519,925
36,926,868,455
510,935,818
694,812,302
1,863,951,818
1,600,479,069
2,306,935,000
6,977,114,007
751,501,189
2,433,593,083
4,341,864,654
1,531,714,369
11,967,845,127
21,026,518,423
51,892,200
550,000,000
224,195,325
8,097,148,500
8,923,236,025
Total value
MWK
403,239,235
28,538,575
959,058
42,929,268
72,426,901
1,843,734
7,330,273
21,336,785
118,415,340
148,926,133
92,181
342,538
37,656,997
143,886,666
181,886,201
110,327,882
1,526,543
2,075,919
5,569,003
4,781,815
6,892,522
20,845,803
2,245,290
7,270,943
12,972,363
4,576,364
35,756,810
62,821,770
155,040
1,643,257
669,837
24,192,174
26,660,309
Total value
USD
38%
0%
0%
0%
0%
0%
5%
0%
74%
59%
95%
57%
0%
45%
36%
8%
67%
0%
0%
0%
0%
5%
0%
100%
0%
0%
0%
12%
0%
0%
0%
0%
0%
% electronic
by value
Utility company
NSO, utilities providers
Ministry of Finance
RBM, insurance providers
RBM
NSO
NSO
RBM, insurance providers
RBM, insurance providers
FinScope
NSO
Local Development Fund
Ministry of Finance
Ministry of Finance
Ministry of Finance
Ministry of Finance
Ministry of Finance
Ministry of Finance
Ministry of Finance
Ntl Local Gov Fin Committee
Ministry of Finance
Ministry of Gender
Accountant General
Ntl Local Gov Fin Committee
Accountant Gen, Min of Fin
Sources
COUNTRY DIAGNOSTIC
Payment grid
47
48
270,421
People: Loan payments (informal)
92%
0.00%
156,936
222,749
31,250
334,503
People: Pension payments
People: Life insurance payments
People: General insurance payments
P2G
COUNTRY DIAGNOSTIC: MALAWI - Development Results Focused Research Program
80%
90%
79%
32,530
2,730
29,800
32,530
D2P
Dev. Partner: Local employees
Dev. Partner: Social welfare
Donor total
80%
0.24%
215,204,166
People total
25,937
23,480
2,457
25,937
513,904
2,251
-
0%
1%
34,318
300,185
People: National taxes
People: Bill pay for gov owned utilities
2,251
-
204,573
75,078
188,347
100
14,508
482,605
-
19,424
3,730
5,893
29,047
# payments
electronic
1%
48%
12%
0.03%
357,680
1,562,213
People: Loan payments (formal)
0.01%
0.23%
21%
People: Bill pay for housing & utilities
212,150,553
94,289
People: Domestic remittances
People: Purchases
0%
17,679
People: Intl remittances incoming
214,481,381
21%
5,893
P2B
7%
388,283
P2P
People: Intl remittances outgoing
100%
% electronic
by volume
# payments
per month
101,449
12,457
278,918
101,449
39,707
23,536
37,993
30,765
34,355
957
8,087
4,561
10,078
265
9,717
3,347
6,912
26,820
277,481
78,640
Avg. value per
payment MWK
303
37
833
303
119
70
114
92
103
3
24
14
30
1
29
10
21
80
829
235
Avg. value per
payment USD
1,132,677,695
371,232,590
761,445,106
1,132,677,695
81,451,178,996
7,065,172,696
1,303,858,058
8,369,030,754
1,073,583,333
213,270,142
1,269,175,000
7,125,258,175
3,604,586,348
56,130,081,656
69,415,954,655
905,102,981
651,713,435
474,159,956
1,635,217,215
3,666,193,588
Total value
MWK
3,384,146
1,109,146
2,275,000
3,384,146
243,354,946
21,108,899
3,895,589
25,004,488
3,207,588
637,196
3,791,965
21,288,419
10,769,567
167,702,090
207,396,824
2,704,212
1,947,150
1,416,667
4,885,604
10,953,633
Total value
USD
89%
79%
95%
89%
10%
2%
0%
2%
0%
92%
48%
71%
0.06%
0.50%
9%
0%
21%
21%
100%
51%
% electronic
by value
International organization
NSO, utilities providers
Ministry of Finance
RBM, insurance providers
RBM, insurance providers
RBM
NSO
NSO
NSO
NSO
RBM
Sources
MALAWI
MALAWICOUNTRY
COUNTRYDIAGNOSTIC
DIAGNOSTIC
COUNTRY DIAGNOSTIC
Methodological deep-dives
Quantifying the payments made in the Malawi required a number of assumptions and calculations where data
were unavailable, incomplete, or unreliable. This section details the approaches used for the G2P and P2B cells in
the payment grid.42
G2P: Limited government payment data is available online
The BTCA diagnostic team calculated key metrics for G2P payments from a variety of government sources,
as shown in Tables B1 and B2 below.
TABLE B1
High level view of government-to-person payments
Total number of payments per month
% electronic (by volume)
216,121
0%
TABLE B2
Monthly G2P payments in Malawi
# pmts per month
% vol elec
# pmts elec
Avg. value
per pmt USD
Total value USD
% value elec
170,000
0%
-
142
24,192,174
0%
Employees Local
4,707
0%
-
142
669,837
0%
Pensioners
27,000
0%
-
61
1,643,257
0%
Social transfer
14,415
0%
-
11
155,040
0%
G2P Total
216,121
0%
-
89
26,660,309
0%
Employees National
This diagnostic calculated government-initiated payments using information gathered from interviews with multiple
ministries and government agencies and from national and local finance ministries’ budgets. The measurement
assumes that there are three categories for G2P payments: salary payments, pension payments and social transfers
(including subsidies).
ANNEXES
49
MALAWI
MALAWICOUNTRY
COUNTRYDIAGNOSTIC
DIAGNOSTIC
The total value for national government was obtained from the Ministry of Finance annual budget, available on
the Ministry’s website and confirmed through an in-person meeting with a Ministry official. The total value for the
local government was obtained from the National Local Government Finance Committee end of year report, which
was made available after an in-person request to the Executive Secretary National Local Government Finance
Committee. The National Local Government Finance Committee also provided the number of local government
employees, whereas the Accountant General’s office provided the number of national civil servants, emphasizing
that the number of employees fluctuates by month: In May, the Accountant General’s office reported 139,477 civil
servants, compared to August when there were about 170,000. The Accountant General’s office also provided the
information about pensioners.
Data on the Ministry of Gender’s Social Cash Transfer program, which has been driven with much international
donor influence and support, was obtained in a meeting and follow up request to the Ministry of Gender and its
partner, Ayala Consulting, which is setting up the program to move to electronic payments through mobile money.
The first electronic payments are tentatively scheduled to occur in December, with registration having begun in
September. Sources are also available online, though the Ministry of Gender and Ayala Consulting provided more
up-to-date information.
P2B: Estimating how individuals transact with business
Broken down into three categories – purchases, bill pay, and pension and insurance contributions – the diagnostic
team calculated key metrics for P2B payments from a variety of sources, as shown in Tables B3 and B4 below.
TABLE B3
50
High level view of people-to-business payments
Total number of payments per month
% electronic (by volume)
214,481,381
0.23%
COUNTRY DIAGNOSTIC: MALAWI - Development Results Focused Research Program
COUNTRY DIAGNOSTIC
TABLE B4
Monthly P2B payments in Malawi
# pmts per month
% vol elec
# pmts elec
Avg. value
per pmt USD
Total value USD
% value elec
212,150,553
0.01%
14,508
1
167,702,090
0.5%
357,680
0.03%
100
30
10,769,567
0.06%
1,562,213
12%
188,347
14
21,288,419
71%
Pension payments
156,936
48%
75,078
24
3,791,965
48%
Life insurance
payments
222,749
92%
204,572
3
637,196
92%
General insurance
payments
31,250
0%
-
103
3,207,588
0%
214,481,381
0.23%
482,605
29
207,396,824
9%
Purchases
Housing and private
utilities
Loan payments
(formal)
P2B Total
To estimate purchases and bill pay, the diagnostic team relied on information from multiple sources, primarily
the 2010/11 household survey report and 2008 census report from the National Statistics Office (NSO), available
on the NSO website, and information from RBM, Multichoice (DSTV provider) and Malawi Microfinance Network
(MAMN), provided directly to the diagnostic team.
The 2010/11 household survey provides aggregate per capita consumption for twelve expenditure categories.
The diagnostic team classified these into two categories: purchases and bill pay.43 Rental payment volumes were
derived using the 2008 census data that provide the percentage of households renting their residences. Without
Malawi-specific research on the volumes of purchases, the diagnostic team calculated the volumes of purchases
payments using proprietary data from Kenya and India on the average number of payments that households make
per month. The value and volume of electronic payments for purchases was estimated based on the RBM-reported
average monthly value and volume of POS transactions from January 2012 through July 2013.
Loan payment volumes were derived from the World Bank Findex data and include the percentage of the
population ages 15 and above who have taken a loan from a financial institution, private lender or employer in the
past year. The loan values were derived from a MAMN report that provides the average value per loan of five MFIs,
plus estimated average interest rates from the World Bank and mftransparency.org. Pension and insurance payment
estimates were derived from data provided by major pension/insurance providers following meetings and formal
requests and supported by the RBM’s 2012 Pension and Insurance Annual Report.
ANNEXES
51
MALAWI
MALAWICOUNTRY
COUNTRYDIAGNOSTIC
DIAGNOSTIC
ANNEX C: BTCA COUNTRY DIAGNOSTIC COMMON METHODOLOGY
Measurement and data quality
The measurement approaches uses all available data to compile the payments grid as accurately as possible as
described in detail in Annex B for Malawi. This process involves finding and analyzing a wide range of different data
sources of different time intervals and quality. In some cases, extrapolation or interpolation is necessary to make up
for gaps in data availability. For this reason, and to be explicit about the basis from which data is drawn, the data
relating to each payer group in the grid is assessed for data quality and availability, as shown in Table C1 below.
TABLE C1
Data quality ratings
Rating
Data quality
Data availability
5
Complete, recent, and from credible sources
Available from one or few up-to-date websites or online
publications
4
Recent and from credible sources. 1-2 components of estimate
based on expert opinion or assumptions.
Available from disparate web sites or from a combination of
scholarly and popular publications
3
Incomplete, recent, and based on expert opinion or available
data. Few assumptions required.
Available in-person through simple records requests or
interviews with public-facing officials
2
Incomplete and/or outdated, and informed by local sources, ad
hoc research, and international heuristics. Some assumptions
required.
Available from proprietary sources through non-disclosure
agreements
1
Incomplete and/or outdated, and informed by local sources, ad Additional measurement activities required to capture
hoc research, and international heuristics. Multiple assumptions meaningful data
required.
The overall scores cited on the first page are simple averages across the underlying picture.
Trajectory scores
To understand the trajectory of the move towards electronic payments in a country and the likelihood that
the momentum may change, the diagnostic focuses on selected payments use cases; and then considers the
infrastructure and incentives supporting each.
52
COUNTRY DIAGNOSTIC: MALAWI - Development Results Focused Research Program
COUNTRY DIAGNOSTIC
Use cases
A payment use case is a cluster of characteristics (the store of value, the nature of the instrument itself and the
channels through which it is initiated) around a common payment application. For example, bulk credit transfers
involve transfers across bank accounts under rules particular to the automated clearinghouse involved, which can
be initiated in branch or via channels such as Internet or dedicated line.
Ratings
The propensity for this use case to accelerate the shift to electronic payments is assessed using the scale shown in
Table C2.
TABLE C2
Use case trajectory ratings
Rating
Conditions & incentives are such for this use case that it is:
1
Highly likely to support a full shift
2
Possible to achieve a full shift
3
Likely to lead to slow incremental progress
4
Likely to drift without clear upward trend
5
Unlikely to lead to shift
To get to an overall rating, a process of interviews and in-country engagement leads to an assessment of the
infrastructure and the incentives of each of the key constituencies in the payment eco-system — government,
business, financial providers and consumers — to use this instrument for the accompanying shift. As shown in
Annex D for this country, the overall score for each use case is the simple average of the underlying ratings across
each category, although the scores for each category are not simple averages of the underlying sub-categories.
This is because the sub-categories are not weighted; so the category score is assigned based on an overall
assessment taking into account the sub-category scores.
ANNEXES
53
MALAWI
MALAWICOUNTRY
COUNTRYDIAGNOSTIC
DIAGNOSTIC
Glossary of general payment terms used44
Term
Definition
ACH/ Automated Clearing House
An electronic clearing system in which payment orders are exchanged among financial institutions,
primarily via magnetic media or telecommunications networks, and handled by a data processing centre.
Gross Settlement System
A transfer system in which the settlement of funds or securities transfer instructions occurs individually
(on an instruction by instruction basis).
Large Value (wholesale) Payments
Payments, generally of large amounts, which are mainly exchanged between banks or between
participants in the financial markets and usually require urgent and timely settlement.
“Not on us” & “On us”
Payment terms which refer to whether a payment is made in the accounts of the same financial
institution (on us) or across financial institutions (not on us).
Payment Instrument
Any instrument enabling the holder/user to initiate the transfer of funds or make a payment.
Payment scheme
A term used for a payment system which includes a brand and set of rules licensed by the owners to
the participants, such as the international card association schemes.
Payment service provider (PSP)
Entity that does not participate directly in a payments system but specializes in managing payment
transactions for the public.
Payment stream
A cluster of payment use cases.
Payments system
A payments system consists of a set of instruments, banking procedures and, typically, interbank funds
transfer systems that ensure the circulation of money.
Payment use case
A description of an individual payment that identifies the payment’s store of value, the payment
instrument used, and the channel through which payment instructions are issued.
Real-Time Gross Settlement (RTGS) The system used to effect continuous (real-time) settlement of funds or securities transfers individually
System
on an order by order basis (without netting).
Switch
54
In payment context: an electronic software program which enabled different devices and financial
operating systems to connect for the purpose of exchanging information.
COUNTRY DIAGNOSTIC: MALAWI - Development Results Focused Research Program
3
3
3
4
3
3
2
3
3
3
Country environment
Legal environment for e-payments sufficiently clear and certain to support shift
The communications and processing infrastructure supports robust transaction processing
There are a variety of providers offering the service defined in priority use cases on a competitive basis
The oversight environment for payments is clear and certain
The settlement and clearing infrastructure supports the defined use case
5
2
3
3
4
4
4
5
2
3
2
2
3
3
3
3
3
3
2
4
The lead agency has the mandate and qualified resources sufficient to coordinate the shift across departments/agencies
The national government at least monitors centrally and preferably publishes data on the extent of electronic payments
There is a law or binding regulation requiring transition to electronic for some of all of government
There are well documented credible examples of cost-benefit analysis — awareness of benefits
The payment instruments exist to service the main use cases defined by government
Service providers
Providers see value in providing this service through electronic payments
Providers can monetize the value of offering this service through electronic means
Providers are willing to make the necessary investments required to offer this service
Providers consider this service important and therefore market it appropriately
Non-financial businesses
The perceived advantages of shifting exceed disadvantages
There is no stigma attached to electronic channels as result of recent or major experience of loss
There are additional incentives offered to use electronic
Cash payments are restricted or else electronic payments required by law in defined circumstances
Cost of cash studies have been performed on categories of business payment and published
4
2
3
3
3
3
2
2
3
4
4
4
4
4
4
Government
There is a clearly identified national lead agency responsible for the shift to electronic
3
2
3
Remote bill
payment
Summary of ratings
Mass electronic
credits
TABLE D1
4
2
4
3
4
4
4
3
2
2
3
2
5
4
4
4
4
4
3
3
3
3
3
3
Debit card at
merchants
COUNTRY DIAGNOSTIC
ANNEX D: USE CASE TRAJECTORY SCORES
ANNEXES
55
56
4
3
4
4
4
3.6
There is no widespread distrust of financial institutions among the general public
There is a ubiquity of points at which cash can be exchanged for electronic value in an account and vice versa
Individuals consider the risk of electronic theft less or lower than risk of cash theft
Many people have electronic accounts through which they can conduct electronic payments
Overall
4
4
4
3
Development partners can identify success stories in the country of using electronic payments
Development partners have identified a measured benefit of electronic payments on recipients over cash
Development partners have identified a range of electronic payment providers, on a competitive basis, to partner with
3.75
Development partners measure the cost off cash in their operations or the operations of their implementing partners
Development partners
4
3
There is no history of major scandal or disrepute associated with electronic payments in the past 5 years
Mobile money
4
4
Consumers
3.8
4
3
3
Remote bill
payment
Mass electronic
credits
3.9
4
4
4
3
3
4
Debit card at
merchants
MALAWI
MALAWICOUNTRY
COUNTRYDIAGNOSTIC
DIAGNOSTIC
COUNTRY DIAGNOSTIC: MALAWI - Development Results Focused Research Program
COUNTRY DIAGNOSTIC
ANNEX E: SUPPORTING ANALYSIS FOR SECTION V: PAYMENTS
INFRASTRUCTURE AND PROPENSITY TO SHIFT
Key gaps exist in the legal infrastructure for the NPS, but some key changes are being made to rectify this
As noted in Section V, there are several key gaps in the legal infrastructure for the National Payment System
(NPS), which Malawi is trying to resolve. There is currently no NPS Act hence RBM as payment overseer must
rely on the Reserve Bank Act (updated in 2010) and the Banking Act (1989) to lay “adequate foundations for the
development of a sound banking system and financial markets” according to a review of Malawi’s NPS by the Bank
of International Settlements.45 However, the passage of the draft NPS Bill (prepared in 200246), which the Minister of
Justice was planning to present to committee in October 2013, would provide a sound legal basis for the regulation
and oversight of the payment system.47 Among other powers, the NPS Act would allow the RBM to officially
designate payment systems for direct regulation.
Several recent developments highlight the RBM’s attempts to bring greater certainty to electronic payments.
The RBM’s E-money Service Provider Regulations (2013), currently in draft form, would require all e-money service
providers to be registered with the RBM and comply with AML/KYC requirements. Similarly, the RBM’s Guidelines
for Mobile Payment Systems, issued in 2011, establish the RBM’s authority to grant approval to both bank and nonbank “payment models” while providing clarity as to customer activation procedures, messaging standards and
settlement procedures. The RBM has authorized two mobile payments schemes to date, those of Airtel and of TNM,
the principle mobile network operators (MNOs) in Malawi. These are however not yet underpinned with the legal
certainty the National Payments System Act will provide.
The RBM is currently drafting a revision of the National Payment System Vision and Strategy Framework, (covering
the period from 2014 to 2019) which will affirm the principles, objectives and priorities for Malawi’s NPS going
forward.
Architecture of the NPS
Malawi’s NPS supports a range of payment streams including electronic funds transfer (EFT) debits and credits,
checks, ATM transactions, point of sale (POS) terminals accepting debit and credit cards and mobile financial
services. The interoperable payment systems are currently cleared through the country’s two domestic switches and
settled via the RTGS. The RBM owns the Malawi Interbank Transfer and Settlement System (MITASS), Malawi’s RTGS
system, which processes high-value transactions (and settlement for checks) between financial service providers.
It relies on an Automated Transfer System (ATS) and is moving toward same-day (T+0) clearing and settlement.
MITASS currently does not feature straight-through processing (STP), which has made inter-branch RTGS bank
transfers expensive at approximately MWK 5000 per transfer. RTGS requires STP to enable the efficient and
effective movement of high value funds.
Malawi has done significant work in recent years to ensure that settlement occurs according to international ‘good
practice.’ All settlement occurs via MITASS on a net settlement basis, with each settlement bank having a prefunded account with the RBM. This includes interbank Visa related ATM and POS transactions, which are cleared
by VisaNet, an offshore international switch. The RBM is currently upgrading its RTGS and this will include add-on
modules for check and for EFT debits and credits to be cleared and then settled via MITASS.
ANNEXES
57
MALAWI
MALAWICOUNTRY
COUNTRYDIAGNOSTIC
DIAGNOSTIC
Malawi has also established a full check truncation clearinghouse in its Electronic Check Clearing House (ECCH),
which is owned by the Bankers Association of Malawi (BAM) and operated by MALSWITCH. Its clearing members
consist of nine commercial banks and the RBM, who use image and code line capture to reduce the amount of time
required to clear and settle checks. Checks generally require three days to clear and may take up to seven days in
rural areas, according to interviews with a large business operating in the agricultural sector.
Malawi’s NPS presently features two domestic switches. MALSWITCH was founded and fully funded by RBM in 1999.
For numerous reasons, it has been operating independently of RBM since 2006 and currently has only two member
banks (down from a higher number earlier), namely OIBM and Indebank. MALSWITCH was originally intended to be
the national switch but due to its structure, ownership, governance, standards and numerous other factors, did not
play that role. Banks that have used MALSWITCH in the past have moved to link to more interoperable switches,
such as China Union Pay, MasterCard, Diners and AMEX. The proposed national switch, which is in the process of
being implemented, is likely to further reduce MALSWITCH’s role (see below). In addition to clearing and closely
related services, MALSWITCH has been developing its business to support a range of electronic payments solutions
including ATM and POS devices. These services have been developed as the role of clearing payment instruments
for participants has diminished.
In terms of governance, both multilateral and bilateral clearing agreements are used for RTGS and for ECCH.
The majority of these agreements, though, have not been tested in court. The need to ensure strong and
appropriate governance in the interbank/participant arena is critical to ensure trust and certainty.
Interoperability
VisaNet, which provides processing services for interbank transactions for VISA bank members, currently counts
four commercial banks as members: NBS Bank, FMB, Standard Bank and National Bank. These are the only four
commercial banks in Malawi which are effectively interoperable at present for ATM and POS. VisaNet performs
clearing and other value-adding services offshore for member banks on POS and ATM devices but settles within
Malawi via MITASS. It remains unclear whether the VisaNet banks will be required to utilize the forthcoming national
switch to perform the clearing services for domestic Visa (ATM and POS) transactions.
Many banks issue a “local” debit card that can be utilized on proprietary networks for POS and ATM. These are
currently not interoperable. Plans are being discussed such that the national switch will provide clearing services
for these cards.
Therefore any bank card cannot be used at any bank POS or ATM, consumers are restricted to using ATM’s of
banks that either belong to the local switch (3 banks) or the Visa-linked banks (4 banks) or else they can only
utilize their banks’ infrastructure, all of which hinders convenience for the customer and creates uncertainty.
The implementation of the national switch may overcome this.
58
COUNTRY DIAGNOSTIC: MALAWI - Development Results Focused Research Program
COUNTRY DIAGNOSTIC
The manner in which banks can develop a fully interoperable solution for all bank-issued cards (local and Visa) is not
clear and may require acquirers, i.e. ATM and POS providers, to belong to both the local and Visa scheme in order to
enable interoperability.
Interchange
RBM has paid significant attention to interchange. Interchange rates on not-on-us ATM transactions had ranged
between 3%-5% of the value of the transaction, but, following recent intervention by the RBM, these are now set to
roughly USD 1 per transaction (taking into consideration reduced Visa rates for the same transactions). Interchange
fees are effectively passed on to the customer. If interchange rates are too low, they can remove incentives for
participants to allow other banks to utilize their network and may lead to a decrease in ATM and POS transactions;
equally, if interchange rates are set too high, consumers and merchants will not utilize the system, further
entrenching the use of cash.
Implementation of a national switch
The national switch, currently being implemented by the RBM and the banks through the Bankers’ Association
of Malawi (BAM), will represent a key change in Malawi’s NPS. Scheduled to go live in April or May 2014, the
national switch will be run under the auspices of BAM and will have all 11 commercial banks in Malawi as members
and shareholders. Most of the banks will be connected to the switch before the end of 2014. RBM will then issue
directives related to the switch.
The plan is for Mobile Money Issuers (MMIs) to join the national switch as members during a subsequent phase of
implementation for select transaction types; it is not currently envisaged that MMIs will be shareholders. MMOs are
not licensed under the Banking Act, although the pending NPS Act would provide RBM with the power to manage
this.
The national switch will cater to a variety of payment streams including interbank ATM and POS transactions. The
national switch will process payments for both local cards as well as for Visa- and MasterCard-branded cards.
However, as noted above, this will not improve interoperability levels. There will be one Automated Clearing House
(ACH) agreement per relevant payments use case grouping, i.e. one for each comparable risk use case, including
check clearing.
The participants will manage the switch via a holding company, with the 11 shareholding banks planning to divide
ownership of the switch equally among them. BAM intends to undertake an examination of interchange levels. The
switch will adopt a utility approach in that it will provide only clearing and closely related services; it will not offer
value-added services so as to avoid competing with its members or other payment providers.
The switch is intended to support the principle of single acquiring for all interoperable payment streams, including
cash-in/out merchants. One participant would be responsible for introducing them into the system to enable clear
management of risks. The RBM must negotiate several potential stumbling blocks if it is to achieve this objective.
ANNEXES
59
MALAWI
MALAWICOUNTRY
COUNTRYDIAGNOSTIC
DIAGNOSTIC
For one, banks may view MMIs as competition, which could be problematic given that they will be the owners of the
national switch while the MMIs will not be. This will require the RBM to ensure appropriate access to the NPS for the
relevant payment use cases for MMI’s.
Liquidity issues may also be hampering the development of an open, interoperable network of cash-in/out
merchants. Consumers lack certainty as to whether they can cash-out at merchants at the time of their choosing,
which has encouraged them to remain with cash. Additionally, consumers have found it difficult to transact
electronically rather than in cash for a range of reasons including the cost of transacting, problems encountered
with handsets (not dissimilar from problems, e.g. downtime, with POS devices). Lack of familiarity with mobile
money may also be an issue. Given the infancy of mobile money in Malawi, this will take some time to overcome
these challenges.
The RBM and the banking industry appear committed to and are taking necessary measures to fill gaps in the
NPS architecture and infrastructure to improve interoperability and governance. In addition to the pending NPS
Act which will grant the RBM specific powers such as designating payment systems, the RBM and industry have
begun having discussions around appropriate interchange levels and the use of multilateral agreements, i.e. one
interchange price for all, as well as extending ACH agreements for all payment systems. The keystone to drive
further development of the NPS is the passage of the NPS Act.
Retail payments infrastructure
The penetration of Malawi’s retail banking infrastructure remains limited: the number of bank branches, ATMs and
POS devices is low both in absolute terms and when standardized against the size of the population (as shown in
Table 1 in Section II).
Lack of efficient and effective interoperability has played a role in restricting the effective reach of Malawi’s
financial services infrastructure. While the ATMs and POS devices of the four VisaNet banks are interoperable
within this network, other banks have each put in their own devices, leading to interoperability at the merchant
level (i.e. the merchant has multiple devices to enable acceptance of various banks customers); however, this has
driven up costs. Nor are the schemes of MasterCard, Visa, China Union Pay and local card issuers interoperable at an
acquiring level. Five of Malawi’s eleven commercial banks are members of neither MALSWITCH nor VisaNet and are
effectively islanded.
MALSWITCH provides a cautionary tale of implementing interoperability. MALSWITCH’s original network of 69
ATMs now stands at just over 20 machines, with many POS devices also having been withdrawn. This underscores
the importance of achieving greater efficient and effective interoperability in Malawi to permit greater utilization
of existing infrastructure and growth.
60
COUNTRY DIAGNOSTIC: MALAWI - Development Results Focused Research Program
COUNTRY DIAGNOSTIC
Usage of non-cash payment instruments
A range of instruments is available to Malawians seeking to perform payments without the use of cash; these
transactions are however not necessarily electronic (e.g. checks) or actual payments (i.e. ATM cash withdrawals).
For instance, by transaction volumes, ATM cash withdrawals were the most frequently used transaction type,
although these are not payments but rather conversions of value from electronic to cash. Still Figure E1 below
suggests that the volume of ATM cash withdrawals greatly exceeded the number of mobile banking transactions48
as well as checks, which are not electronic and carry large risks.
1,400 billion
20 million
18 million
16 million
14 million
12 million
10 million
8 million
6 million
4 million
2 million
0 million
1,200 billion
1,000 billion
800 billion
600 billion
400 billion
200 billion
AT
M
ca
rd
g
nk
M
ob
i
le
pa
ym
M
ob
ile
Ch
ba
eq
in
ue
d
ar
tc
ar
Sm
en
ts
(M
In
NO
te
PO
rn
-le
et
d)
0 billion
Value of transactions (MWK)
Value and volume of non-cash transactions in Malawi for 201249
S
No. transactions
FIGURE E1
Transaction volume
Transaction value
Source: RBM.
Not included in the figure above are the volumes and values for wholesale/large-value payments. The aggregate
amount for these file settlement instructions (FSIs) was far higher than for the retail payment instruments listed
above (MWK 5.6 trillion in 2012). However, this resulted from a far smaller number of transactions (55,815).50
ANNEXES
61
MALAWI
MALAWICOUNTRY
COUNTRYDIAGNOSTIC
DIAGNOSTIC
There appear to be far more cardholders in Malawi than there are users of Internet banking, mobile banking or
mobile payments, as per Figure E2 below:
FIGURE E2
Number of subscribers/active customers/cards in use in Malawi (2012)
No. subscribers/ active customers/cards
1,400,000
1,200,000
1,000,000
800,000
600,000
400,000
200,000
0
Internet banking:
no. subscribers
Mobile banking:
no. subscribers
Mobile payments
(MNO-led): no.
active customers
No. ATM cards
in-use
Note: mobile payments figures use a 90-day period to define active customers
Note 2: RBM statistics on card relate only to ATM cards
Source: RBM.
Current interoperability levels provide crucial context for understanding these figures. As noted previously, seven
of Malawi’s eleven banks are not part of the VisaNet network. Most of these banks issue proprietary local cards,
which do not function on POS machines provided by the four VisaNet banks; equally, Visa cards cannot be used on
proprietary POS. A similar situation exists for ATMs.
EFT debits and credits are both processed by the relevant modules under MITASS. In general, consumer trust and
understanding of these payment mechanisms is lacking, which has limited their usage. Nor are these instruments
cheap: a standing order costs MWK 1150 to “establish” as well as an additional MWK 1100 as a “processing fee” per
payment.51 In short, in many cases EFT debits seem to be neither affordable nor trusted in Malawi.
62
COUNTRY DIAGNOSTIC: MALAWI - Development Results Focused Research Program
COUNTRY DIAGNOSTIC
ANNEX F: REFERENCES
Bank of International Settlements. 1999. The Payment System in
Malawi. “Green Book” country chapter. Available at http://www.
bis.org/cpss/paysys/Malawi.pdf.
Gourlay, Deborah and Donald Makoka. July 2013. Evaluation of
INGO Integrated Emergency Cash Transfer Program in Malawi,
2012-2013. Report to the INGO Consortium. UKAid.
Better Than Cash Alliance. 2012. The Journey Toward
‘Cash Lite’. Available at http://betterthancash.org/
wp-content/uploads/2012/09/BetterThanCashAllianceJourneyTowardCashLite.pdf.
Government of Malawi. 2006. Malawi Growth and Development
Strategy: From Poverty to Prosperity 2006-2011. Available
at http://www.malawi.gov.mw/Publications/MGDS%20
November%202006%20-%20MEPD.pdf.
Blas, Javier. November 19, 2013. “Malawi ‘cash-gate’ corruption
scandal unfolds like a thriller.” Financial Times. Available at
http://www.ft.com/intl/cms/s/0/c17480e0-50fb-11e3-b49900144feabdc0.html?ftcamp=published_links/rss/world/feed//
product&siteedition=intl&siteedition=intl#axzz2l6ilbD9B.
Government of Malawi, UNDP, UNCDF. 2012. Building An
Inclusive Financial Sector in Malawi (FIMA). Available at http://
www.uncdf.org/sites/default/files/Documents/programme_
document_-_malawi.pdf
Chibwana, Chris. September 24, 2013. “Coordination Counts:
Fostering Mobile Money in Malawi.” USAID. Available at http://
blog.usaid.gov/2013/09/coordination-counts-fostering-mobilemoney-in-malawi/.
Dionne, Kim et al. 2013. Aid Effectiveness and Allocation:
Evidence from Malawi. Princeton University. http://www.
princeton.edu/~pcglobal/conferences/aid2013/papers/Dionne_
etal_MalawiAidPaper_130417.pdf
Dermish, Ahmed et al. 2012. Mapping the Retail Payment
Services Landscape: Malawi. Bankable Frontier Associates for
FinMark Trust.
Durevall, Dick and Mattias Erlandsson. January 2005. Public
Finance Management Reform in Malawi. Sida Country Economic
Report. Available at http://www.sida.se/Publications/Import/
pdf/sv/20051-Public-Financing-Management-Reform-inMalawi_1381.pdf.
FinMark Trust. 2012. Mapping the Retail Payment Services
Landscape Malawi. Available at http://www.finmark.org.za/wpcontent/uploads/pubs/Rep_RPS_landscape_Malawi_2012.pdf.
———. 2012. Status of Agricultural and Rural Finance in Malawi.
Available at http://www.finmark.org.za/wp-content/uploads/
pubs/Rep_statofAgRfin_MALAWI.pdf.
———. 2012. Financial Inclusion Pilot Project – “Landscape
Report – Malawi.”
FinScope. 2012. FinScope MSME Survey Malawi 2012. Available
at http://www.undp.org.mw/documents/Malawi%202012%20
MSME%20Main%20Report%20-%20Final.pdf.
———. 2008. FinScope Malawi 2008. Available at http://www.
hofinet.org/upload_docs/FinScope_Malawi_2008.pdf.
Heidenhof, Guenter et al. January 2002. Design and
Implementation of Financial Management Systems: An African
Perspective. World Bank, Africa Region Working Paper Series
No. 25. Available at http://www.worldbank.org/afr/wps/wp25.
pdf.
International Monetary Fund. 2006. Malawi: Debt Relief at the
Heavily Indebted Poor Countries Initiative Completion Point and
Under the Multilateral Debt Relief Initiative. IMF Country Report
No. 06/420. Available at http://www.imf.org/external/pubs/ft/
scr/2006/cr06420.pdf.
Khunga, Suzgo. November 5, 2013. “Forensic audit takes off.”
The Nation. Available at http://mwnation.com/forensic-audittakes/.
Langhan, Sarah et al. January 2010. Alternative Payment
Mechanisms Feasibility Study and Recommendations.
Government of Malawi, UNICEF and AusAID.
Le Sar & Ahern. 2013. Feasibility Study on the Introduction
of E-Payments to the Malawi Social Cash Transfer Program.
Bankable Frontier Associates.
Masina, Lamek. January 2014. Cashgates Scandal Probe Could
Impact Malawi Elections. Voice of America (VOA) News.
Available at: http://www.voanews.com/content/cashgatescandal-probe-could-impact-malawi-elections/1821457.html
McCarthy, Phiri and Richard Chisala. November 2009.
Quick Assessment of the Integrated Financial Management
Information System: Summary of Key Findings and
Recommendations. Government of the Republic of Malawi,
Office of The President and Cabinet. Available at http://
malawiace.files.wordpress.com/2013/10/summary-of-keyfindings-and-recommendations-of-gom-ifmis-review-2.pdf.
ANNEXES
63
MALAWI
MALAWICOUNTRY
COUNTRYDIAGNOSTIC
DIAGNOSTIC
Mnthambala, NT. November 2007. IFMIS: A Case for Malawi.
ICGFM Winter Conference. Available at http://www.icgfm.org/
conferenceDocs/2007/Dec/9c-BenefitsrealizationMalawiNwazi
Mnthambala.pdf.
———. February 2008. Payment Systems Reforms in Malawi: A
Brief Historical Perspective. Available at http://www.rbm.mw/
documents/payment_systems/PAYMENT%20SYSTEMS%20
REFORMS%20IN%20MALAWI%20feb%202008.pdf.
Mtonya, Brian. 2013. Malawi – Financial Sector Technical
Assistance Project: P122616 – Implementation Status Results
Report: Sequence 04. World Bank. Available at http://wwwwds.worldbank.org/external/default/WDSContentServer/
WDSP/AFR/2013/07/06/090224b081cf4c23/1_0/Rendered/
PDF/Malawi000Malaw0Report000Sequence004.pdf.
USAID. November 30, 2011. Scaling Usage of Mobile Money
to Boost Financial Inclusion in Malawi: Summary Action Plan.
Available at http://egateg.usaid.gov/sites/default/files/Malawi_
MM_Action_Plan_FINAL.pdf.
Oxford Policy Management and Kadale Consultants.
2009. Supply Side Study of Financial Inclusion In Malawi.
Available at http://www.housingfinance.org/uploads/
Publicationsmanager/R_MalawiSupplySide.pdf.
Reserve Bank of Malawi. July 2010. The Payment Systems Bill.
Available at http://www.rbm.mw/documents/Draft%20NPS%20
Bill%20-%20July%202010.doc.
———. December 2008. Malawi National Payment System Vision
and Strategy Framework for the Period 2009 to 2013. Available
at http://www.rbm.mw/documents/payment_systems/NPS%20
Vision%20%20Strategy%20Framework%20December%20
2008%20Final.pdf.
64
World Bank. Malawi – Financial Sector Technical Assistance
Project: Overview. Available at http://www.worldbank.org/
projects/P122616/malawi-financial-sector-technical-assistanceproject?lang=en&tab=overview.
———, 2012. World Data Bank: World Development Indicators.
Available at http://data.worldbank.org/data-catalog/worlddevelopment-indicators.
———. 2010. Malawi – Financial Sector Technical Assistance
Project (FSTAP): Project Information Document. Report
No.: AB5974. Available at http://www-wds.worldbank.
org/external/default/WDSContentServer/WDSP/IB/2
011/02/09/000003596_20110209140625/Rendered/
PDF/10210811010Mal1PID01Concept0Stage1.pdf.
COUNTRY DIAGNOSTIC: MALAWI - Development Results Focused Research Program
COUNTRY DIAGNOSTIC
ANNEX G: ORGANIZATIONS AND INDIVIDUALS INTERVIEWED
Organization
Individuals
Accountant General
Martha Mkandawire, Head of Pensions
Nicodem Kalambo Jotie, Government-wide payroll and advances
Sam Kaomba, IT
Airtel Malawi
Bigboy Makoloma – Operations & Projects Manager – Airtel Money
S. Chilima-Managing Director
Alice Tenthani
Catholic Relief Services
D. Shomberg-Country Representative
Auction Holdings
E. Matabwa-CEO
Bankers Association of Malawi
L. Nkungula-CEO
CARE Malawi
G. Kumwenda
Carlsberg Malawi
Abel T. Chanje, Chief Executive Officer
Christoff Delport, Chief Financial Officer
Central Region Water Board
G. Sageme-Acting CEO
Civil Servant Trade Union (CSTU)
Eliah C.D. Kamphinda, President
Department of Human Resource Management
and Development
Mr. Madula-Principal Secretary
DFID
Hendricks Phiri, Economist
Electricity Supply Corporation of Malawi (ESCOM) Lilongwe Office
Ngwile Mwenifumbo, Regional Manager for Centre
Farmers Union of Malawi
P. Kapondamgaga-CEO
Jacob Nyirongo, Director of Policy and Institutional Development
Duncan Warren, Policy and Programs Development Advisor
FHI360
C. Hasselback-Project Director
K. Kanjo-Chief of Party, MMAP
FMB
Florence Chisambiro (CEO’s Secretary)
FSTAP
M. Mwale
Sadat Sadik
G4s
Nargis Khan
KfW
Dr P. Rudolph-Director
Indigenous Business Association
M. Mlombwa-President
Lilongwe Water Board
D. Gonani -CEO
Limbe Leaf Tobacco Company
Douglas Meisel-Assistant Managing Director
Lilongwe District Council
F. Mukandawire-District Commissioner
Local Development Fund
S. Kakhobwe-CEO
Malawi Communications Regulatory Authority
(MACRA)
L. Kambale
E. Mwapasa
Malawi Confederation of Chambers of Commerce C. Kaferapanjira-CEO
and Industry (MCCCI)
Malawi Congress Trade Union (MCTU)
M. Chauluka-President
Pontius Kalichero-Secretary General
Malawi Investment Promotion Agencies has now
merged with Malawi Export Promotion Council to C. Kumbemba-CEO
form Malawi Investment and Trade Centre (MITC)
ANNEXES
65
MALAWI
MALAWICOUNTRY
COUNTRYDIAGNOSTIC
DIAGNOSTIC
Malawi Microfinance Network
Mthwalo W. Mafuleka, Finance and Administration Officer
Malawi Posts Corporation
A. Kumbatira-Post Master General
Malawi Revenue Authority
James Manuel Kenani, Tax Policy Research Manager
Malawi Savings Bank
Ian Bonongwe-CEO
Malawi Union for the Informal Sector (MUFIS)
Mr. Mhango-President
Malawi Union of Savings and Credit Cooperatives Fumbani Nyangulu, Head of Financial Services & Business Development
Daniel Imfa, ICT Manager
(MUSCCO)
MALSWITCH
Godwin Chinseu-Branch Manager
MicroSave
Ministry of Finance
Mr. F. Zhuwao-Director of Economic Affairs
Ketttie Mbalame
Mada Mandiwa
Daniel Jenya- Economist
Ministry of Gender, Children and Community
Development
M. Shaba (Phd)-Principal Secretary 1 and Ms E.M Tembo-PS 2
Kyle Denny, Resident Consultant, Ayala Consulting
Chantal Elmont, Resident Consultant, Ayala Consulting
Ministry of Industry and Trade
A. Gomani-Principal Secretary 2
National Bank
G. Partridge-CEO
National Local Government Finance Committee
(under Ministry of Local Government)
Wezie Mjojo-Executive Secretary NLGFC
National Statistical Office of Malawi
C. Machinjiri- Commissioner for Statistics
NBS Bank
Gilford Kadzakumanja, Deputy Chief Executive Officer
NICO
Chifundo Chiundra- CFO NICO Holdings Ltd
Gerald Chima- CFO NICO Life Insurance Company Ltd
Louis Sibande – CFO NICO General Insurance Co. Ltd
Office of the Director of Public Procurement
Timothy Kalembo, Chief Legal Officer
OIBM
Wilson Moleni – COO
Arthur Nkosi – Chief of Staff and Administration
Old Mutual
Edity Jiya, General Manager
Oxfam
J. Makina-Country Director
Reserve Bank of Malawi
N. Ngwira-Deputy Governor
F. Mdwazika-Director
Mushane Mwangonde- Manger, Oversight and Compliance Division
Chikondi Chigamba – Supervisor, Payment Systems Oversight
Phindu Lipenga, Principal Examiner, ICT, Bank Supervision Department
Sopani Gondwe, Chief Examiner, Policy & Regulations, Bank Supervision Department
Save the Children
M. Pickard-Country Director
Jon Nyirenda (Director of Programs)
Standard Bank
Benedicto Kanaza-Head: Customer CHannels
Telecom Networks Malawi (TNM)
Webster Mbekeani – Head of Division – Mobile Money
Charles Kamoto
UNCDF
F. Chilumpha-Country Programme Manager
UNDP
M. Seppo-Resident Representative
USAID
Christopher Chibwana-Private Sector Specialist
WFP
Charles Ndam-Head of Finance & Administration
World Bank
S. Bloemencamp- Country Manager
66
COUNTRY DIAGNOSTIC: MALAWI - Development Results Focused Research Program
COUNTRY DIAGNOSTIC
End Notes
1
G: Government. B: Business (non-financial private sector).
P: Person (individuals). D: Development community partner.
For further explanation of the payment grid, see Better Than
Cash Alliance (2012), The Journey Toward ‘Cash Lite’, available
at http://betterthancash.org/wp-content/uploads/2012/09/
BetterThanCashAlliance-JourneyTowardCashLite.pdf
13 CGAP (2010), Financial Access 2010, available at http://www.cgap.
org/data/financial-access-2010-database-cgap. Neither CGAP nor
the World Bank’s Global Findex have average data across all lowincome countries.
14 World Telecommunication/ICT Indicators Database, available at
http://www.itu.int/en/ITUD/Statistics/Pages/publications/wtid.aspx.
2 Donors could potentially pay taxes or fees (related to their use of
real estate and payment of local employees)
15Ibid.
3 ??????????
16 $73.33 at current international $, 2012. World Bank DataBank.
4 See Section V for more details on the Shift Trajectory for each
payer.
17 Note that figure is based on limited data (Airtel Money data only
over 15 months) in a nascent mobile money market: based on the
limited experience of mobile money in Malawi and the limited data
available at the time of the research, we are reluctnant to draw any
strong conclusions about the trajectory or pace of mobile money or
comparisons to other nascent mobile money markets in the region.
5 GSMA Intelligence: https://gsmaintelligence.com/markets/2370
6 It is important to note that while some figures have been updated
to reflect the latest data available, the bulk of the research was
conducted in 2013.
7 2012 data. World Bank (2012), World Data Bank: World
Development Indicators, available at http://data.worldbank.org/
data-catalog/world-development-indicators
8 In addition to the reports directly cited in the text, see Oxford
Policy Management and Kadale Consultants (2009) Supply
Side Study of Financial Inclusion In Malawi, available at http://
www.housingfinance.org/uploads/Publicationsmanager/R_
MalawiSupplySide.pdf; FinMark Trust (2012), Mapping the Retail
Payment Services Landscape Malawi, available at http://www.
finmark.org.za/wp-content/uploads/pubs/Rep_RPS_landscape_
Malawi_2012.pdf ; FinMark Trust (2012), Status of Agricultural and
Rural Finance in Malawi, available at http://www.finmark.org.za/
wp-content/uploads/pubs/Rep_statofAgRfin_MALAWI.pdf ; and
FinMark Trust (2012), Financial Inclusion Pilot Project – “Landscape
Report – Malawi.”
9 FinScope (2008), FinScope Malawi 2008, available at http://www.
hofinet.org/upload_docs/FinScope_Malawi_2008.pdf
10 FinScope (2004). http://www.finmark.org.za/wp-content/
uploads/pubs/Pres_FS_Consumer_Malawi_2014.pdf. Though not
discussed in FinScope several other factors beyond poverty may
be contributing to low financial inclusion in Malawi, as more recent
research (Collins et al 2009), has revealed that even the poorest of
the poor can and do save and use financial services. We highlight
several such additional factors throughout this report.
11 FinScope (2012), FinScope MSME Survey Malawi 2012, available
at http://www.undp.org.mw/documents/Malawi%202012%20
MSME%20Main%20Report%20-%20Final.pdf
12 91% for medium businesses, 47% for small businesses, 35% for micro
enterprises, and 12% for businesses with no employees. FinScope
estimated that businesses with no employees accounted for 59% of
the people involved in the SMME sector.
18 Note that these data come from the central bank’s Real-Time
Gross Settlement (RTGS) system, called Malawi Inter-bank
Transfer and Settlement System, or MITASS, and the Electronic
Check Clearinghouse (ECCH), and hence do not include on-us
transactions.
19 The National Payment System Strategy was created by RBM,
the National Payments Council and BAM; The Financial Inclusion
Strategy was created by the Ministry of Finance under the UNCDF’s
FIMA project (Financial Inclusion in Malawi).
20 The National Payments Council membership is not static. However,
the NPC typically comprises the Reserve Bank of Malawi, Ministry
of Finance, a consortium of registered commercial banks,
infrastructure providers such as Electricity Supply Corporation
of Malawi Limited (ESCOM), Malawi Telecommunications Limited
(MTL) and Airtel.
21 Reserve Bank of Malawi (February 2008), Payment Systems
Reforms in Malawi: A Brief Historical Perspective, available at
http://www.rbm.mw/documents/payment_systems/PAYMENT%20
SYSTEMS%20REFORMS%20IN%20MALAWI%20feb%202008.pdf.
22 Specific FSTAP Goals include: creating a new pension regulatory
framework (a central pensions administrator); establishing a deposit
insurance fund; upgrading RTGS systems for settlement of interbank
transactions, and the development of a policy and oversight
framework; acquiring and install a central depository system for
the development of the secondary bond market and enhance the
security of the existing FX trading system; developing a regulatory
and institutional framework for financial consumer protection;
developing an appropriate regulatory structure for MFIs and
SACCOs; establishing a financial sector unit within MoF responsible
for interagency coordination for policy setting that will involve the
financial sector; and supporting the use of the national payment
system, mobile phone banking technologies and smart cards for
“more reliable and timely payments.
ANNEXES
67
MALAWI
MALAWICOUNTRY
COUNTRYDIAGNOSTIC
DIAGNOSTIC
23 “In terms of Malawi’s Money Laundering, Proceeds of Serious Crime
and Terrorist Financing Act, 2006 banks are required to verify the
identification of their customers before entering into a business
transaction. In the past, some banks required potential customers
to produce formal identification documents, either a passport or
a driving license before they could open an account. The cost and
availability of such documents was prohibitive. However, banks
have now adopted more realistic identification methods, including
customers introducing other customers, use of statements
from local chiefs and so on.” See Sarah Langhan et al (January
2010), Alternative Payment Mechanisms Feasibility Study and
Recommendations, Government of Malawi, UNICEF and AusAID.
24 For history of IFMIS development, see Phiri McCarthy and Richard
Chisala (November 2009), Quick Assessment of the Integrated
Financial Management Information System: Summary of Key
Findings and Recommendations, Government of the Republic
of Malawi, Office of The President and Cabinet, available at
http://malawiace.files.wordpress.com/2013/10/summary-ofkey-findings-and-recommendations-of-gom-ifmis-review-2.pdf;
NT Mnthambala (November 2007), IFMIS: A Case for Malawi,
ICGFM Winter Conference, available at http://www.icgfm.org/
conferenceDocs/2007/Dec/9c-BenefitsrealizationMalawiNwazi
Mnthambala.pdf; Dick Durevall and Mattias Erlandsson (January
2005), Public Finance Management Reform in Malawi, Sida Country
Economic Report, available at http://www.sida.se/Publications/
Import/pdf/sv/20051-Public-Financing-Management-Reform-inMalawi_1381.pdf; Guenter Heidenhof, et al (January 2002), Design
and Implementation of Financial Management Systems: An African
Perspective, World Bank, Africa Region Working Paper Series No.
25, available at http://www.worldbank.org/afr/wps/wp25.pdf.
25 As an indicator of improved economic governance and
commitment to reducing corruption, the completion and
implementation of IFMIS was one of several pre-conditions for the
cancellation of debt under the HIPC debt restructuring initiative
of the World Bank/IMF. See http://www.imf.org/external/pubs/ft/
scr/2006/cr06420.pdf.
26 Much of the policy and strategy development over time has come
from grants and partnerships with DPs, including the World Bank,
KfW, USAID, UN system, DFID, Financial Services Volunteer Corps,
US Treasury OTA, the FIRST Initiative and others. IMF, SADC,
Committee of Central Bank Governors and others supported NPS
Strategy. Development
30 For more information on UNCDF’s MM4P initiatives, see: http://
www.uncdf.org/en/MM4P.
31 See Deborah Gourlay and Donald Makoka (July 2013), Evaluation
of INGO Integrated Emergency Cash Transfer Program in Malawi,
2012-2013, Report to the INGO Consortium, UKAid.
32 Dermish et al (2012), Mapping the Retail Payment Services
Landscape: Malawi, Bankable Frontier Associates for FinMark Trust.
33 The methodology used to calculate payer-payee relationships is
presented in Annex A.
34 Data on salaries to local employees only provided by one
development partner.
35 Authors were unable to source D2G and D2B figures from
Development partners. D2G payments could potentially include
taxes or fees (related to their use of real estate and payment of
local employees
36 For some variables, values and volumes were assumed to be equal;
so actual differences may be greater than what is reflected here.
37 E.g. Standard Bank
38 Costs of FMB Malipiro payroll account product. Information publicly
available on FMB’s website.
39 See Dionne et al, “Aid Effectiveness and Allocation: Evidence from
Malawi” 2013. Page 13.
40 Moreover, credit cards are not included in the use case because
the choice of whether to draw on a line of credit is not comparable
to the choice of whether to pay electronically (based on funds
available) or in cash.
41 MALSWITCH has two models for the Puma, both of which are a
closed-loop system: one in which it supplies the POS, in which the
merchant pays a fee equal to 1% of the transaction amount, and
the customer pays nothing. The second model is at ATMs. Many
customers—especially corporates—have returned their cards in the
last year due to fuel shortages at Puma.
27 National Payments System Annual Report 2012. RBM, Malawi. July
2013.
28 For more information on MMAP, see http://www.fhi360.org/
projects/mobile-money-accelerator-program-mmap.
29 USAID (November 30, 2011), Scaling Usage of Mobile Money to
Boost Financial Inclusion in Malawi: Summary Action Plan, available
at http://egateg.usaid.gov/sites/default/files/Malawi_MM_Action_
Plan_FINAL.pdf.
68
COUNTRY DIAGNOSTIC: MALAWI - Development Results Focused Research Program
50
49
MALAWI
MALAWICOUNTRY
COUNTRYDIAGNOSTIC
DIAGNOSTIC
About the Better Than Cash Alliance
The Better Than Cash Alliance is an alliance of governments, private sector,
and development organizations committed to accelerating the shift from
cash to electronic payments. The Better Than Cash Alliance is funded by
the Bill & Melinda Gates Foundation, Citi, Ford Foundation, MasterCard,
Omidyar Network, USAID, and Visa Inc. The UN Capital Development Fund
serves as the secretariat.
B E T T E R THANC A S H
A L L I A N C E
Empowering People Through Electronic Payments
To learn more, visit www.betterthancash.org and follow @BetterThan_Cash.
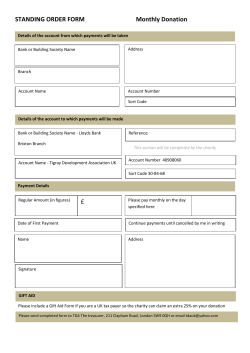


© Copyright 2026