
04-15-15 and 04-17-15 Mean Absolute Deviation
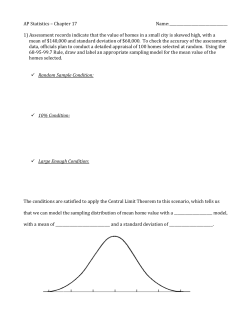
041515 and 041715 Mean Absolute Deviation (Per. 3).notebook April 17, 2015 4-17-15 Aim: SWBAT calculate and interpret the Mean Absolute Deviation (MAD) of a set a data. Do Now: Check hw HW: WS (Per. 1, 5, 7, 8) 1 041515 and 041715 Mean Absolute Deviation (Per. 3).notebook April 17, 2015 2 041515 and 041715 Mean Absolute Deviation (Per. 3).notebook April 17, 2015 This display shows how many students in the class received certain test scores. = student 70 72 74 76 78 80 82 84 86 88 90 92 94 96 98 100 Test Score 3 Test Score (%) 041515 and 041715 Mean Absolute Deviation (Per. 3).notebook April 17, 2015 This display shows the score each student actually received. 100 96 92 88 84 80 76 72 68 64 60 56 52 48 44 40 36 32 28 24 20 16 12 8 4 0 1 2 3 4 5 6 7 8 9 10 11 12 13 14 15 16 17 18 19 20 21 22 Student The difference between each students' actual score and the mean(the red line) is another measure of variation or spread that we can investigate to tell us something about the data. The Mean Absolute Deviation (MAD) is a measure of variation. Instead of measuring the full spread of the data like a range, it measures the spread between a single piece of data and the mean amount of variation. If the MAD is a small number, in context of the data, there is low variation amongst all the data. That shows more consistency amongst the data. If the MAD is a large number, in context of the data, there is a high variation amongst all the data. That shows more inconsistencies amongst the data. 4 041515 and 041715 Mean Absolute Deviation (Per. 3).notebook This display shows the mean score after data was redistributed. 100 96 92 88 84 80 76 Test Score (%) April 17, 2015 72 68 64 60 56 52 48 44 40 36 32 28 24 20 16 12 8 4 0 1 2 3 4 5 6 7 8 9 10 11 12 13 14 15 16 17 18 19 20 21 22 Student 5 041515 and 041715 Mean Absolute Deviation (Per. 3).notebook April 17, 2015 6 041515 and 041715 Mean Absolute Deviation (Per. 3).notebook April 17, 2015 7 041515 and 041715 Mean Absolute Deviation (Per. 3).notebook April 17, 2015 8 041515 and 041715 Mean Absolute Deviation (Per. 3).notebook 1. April 17, 2015 What does the MAD mean within this context? _______________________________________________________________________ _______________________________________________________________________ 2. Given the context, does the MAD value indicate a high or low variability? _______________________________________________________________________ _______________________________________________________________________ 3. Within this context, how are the mean and the MAD different? How are they related? _______________________________________________________________________ _______________________________________________________________________ _______________________________________________________________________ _______________________________________________________________________ 9 041515 and 041715 Mean Absolute Deviation (Per. 3).notebook April 17, 2015 10 041515 and 041715 Mean Absolute Deviation (Per. 3).notebook April 17, 2015 11


© Copyright 2026