
ANNUAL REPORT - Brown Capital Management
ANNUAL REPORT
March 31, 2015
Small Company Fund
International Equity Fund
Mid-Cap Fund
Ta b l e o f C o n t e n t s
The Brown Capital Management Small Company Fund.......................................................1
Management Discussion of Fund Performance...............................................................1
Schedule of Investments..........................................................................................................6
The Brown Capital Management International Equity Fund..............................................8
Management Discussion of Fund Performance...............................................................8
Schedule of Investments....................................................................................................... 13
The Brown Capital Management Mid-Cap Fund.................................................................. 16
Management Discussion of Fund Performance............................................................ 16
Schedule of Investments....................................................................................................... 21
Statements of Assets and Liabilities.......................................................................................... 23
Statements of Operations............................................................................................................. 24
Statements of Changes in Net Assets....................................................................................... 25
Financial Highlights......................................................................................................................... 27
Notes to Financial Statements..................................................................................................... 33
Report of Independent Registered Public Accounting Firm............................................ 41
Fund Expenses.................................................................................................................................. 42
Additional Information................................................................................................................... 43
Trustees and Officers...................................................................................................................... 47
The Brown Capital Management Small Company Fund
Management Discussion of Fund Performance
March 31, 2015 (Unaudited)
The Brown Capital Management Small Company Fund – Investor and Institutional Classes Performance Your Brown Capital Management Small Company Fund trailed the broad market index as measured by the S&P 500® and the stylized small cap growth index, the Russell 2000 Growth Index, for the fiscal year ending March 31, 2015. When compared to its peers in the Morningstar Small Growth Category, the Fund’s results over the same time period place it in the second quartile (36th and 39th percentile for the Institutional and Investors Classes, respectively) out of 723 peers. While favorable annual outcomes are the preference of many, your investment program focuses on a three to five year evaluation horizon. As seen in the table, your Fund outpaced the S&P 500®, Russell 2000® Growth and the Morningstar Small Growth Category over these longer and, in our view, more significant periods given the nature of the investment program. Peer Group Rankings reflect performance when compared to similarly managed funds as defined by rating agency, Morningstar. In this ratings
systems the top performer(s) is reflected in first percentile (1st Percentile) and the worst performer(s) in the one hundredth percentile (100th
Percentile). Actual numerical peer rankings unavailable via Morningstar only percentile outcomes.
S&P 500® – The S&P 500® Index is the Standard & Poor’s composite index of 500 stocks, a widely recognized, unmanaged index of common stock
prices. You cannot invest directly into an index.
The Russell 2000® Growth Index measures the performance of those Russell 2000 companies with higher forecasted growth values. You cannot
invest directly into an index.
Morningstar Small Growth Category – Small-growth portfolios focus on faster-growing companies whose shares are at the lower end of the marketcapitalization range. These portfolios tend to favor companies up-and-coming industries or young firms in their early growth stages. Because these
businesses are fast-growing and often richly valued, their stocks tend to be volatile. Stocks in the bottom 10% of the capitalization of the U.S. equity
market are defined as small-cap. Growth is defined based on fast growth (high growth rates for earnings, sales, book value and cash flow) and high
valuations (high price ratios and low dividend yields).
Small Company Investing The Brown Capital Management Small Company Team’s investment philosophy is driven by a growth approach to investing that seeks to identify exceptional small companies that have the wherewithal to become exceptional large companies. The goal is to identify publicly‐traded companies early in their corporate life cycle (with operating revenue of $250 million or less at the time of initial investment) that can produce exceptional long‐term returns. Achieving that outcome demands an in‐depth understanding of each company in the portfolio and the characteristics driving its “exceptionalness.” Companies are invested in a benchmark agnostic manner, meaning the benchmark is not considered when developing or managing the portfolio, only the merits of the underlying companies. As a result, team members must demonstrate an extraordinary level of patience and tolerance in their efforts to determine if the company will meet their expectations over the three to five year evaluation horizon. We believe the strategy’s greatest strength is a time‐tested investment philosophy and process that features company selection and a three to five year evaluation horizon. Combined with the portfolio management team’s deep industry experience, the approach favors patient investors seeking long‐term results that realize meaningful rewards may come from incurring risk associated with the earlier stage investment. The research process of your Fund’s team typically begins with an investment candidate originating from any number of sources including, but not limited to: personal reading (financial and non‐financial) of the portfolio managers/analysts, observation and analysis of business and consumer trends, broker‐sponsored investment conferences, and the occasional utilization of screening models. First, a small company must meet the initial investment criteria of having no more than $250 million in revenue, and have a product or service which your team believes saves time, lives, money or headaches (or in the consumer related area, has a strong product concept and a good value proposition). The second step requires a thorough review, analysis and evaluation of company financial and non‐financial information, and conducting an industry analysis with an emphasis on competitive forces and standings. The analytical process includes a detailed quantitative analysis of financial information as well as qualitative review of the company. The quantitative analysis involves construction of independent balance sheet, income statement and statement of cash flows, and incorporating this information into our proprietary asset utilization model. The qualitative review includes your team’s assessment of the durability of revenue growth, defensibility of market presence, deliverability of the growth plan and profitability to fuel and sustain earnings growth. As investment managers, all the conventional bases are “covered,” but what distinguishes Brown Capital Management from many others is the firm’s attention to unconventional analysis, which is particularly important in the practice of patience and tolerance. When fundamentals change adversely, positions are sold out of the portfolio. Annual Report | March 31, 2015
1
The Brown Capital Management Small Company Fund
Management Discussion of Fund Performance
March 31, 2015 (Unaudited)
Portfolio Review When evaluating a benchmark agnostic offering, traditional techniques often fall short. As a result, we provide select contributors and detractors over the fiscal year, along with newly added companies and those sold, or acquired, out of your Fund to provide insights into the fundamental research driving your investment program. Leading Contributors Incyte develops and commercializes small molecule drugs. These drugs treat serious unmet medical needs including myelofibrosis and polycythemia vera. The company continues to drive revenue growth by expanding the number of drugs on the market, the number of diseases that each drug addresses and the pipeline of future drugs. Abaxis develops rapid blood analysis tests for the human medical and veterinary markets. The company’s products can provide various test results in a matter of minutes, saving time when compared to sending samples out to a laboratory and receiving results in a number of days. The company continues to expand its menu of available tests, as well as the distribution channels for its products. Manhattan Associates provides supply chain execution software, including warehouse management, transportation management, advanced planning and scheduling and integrated logistics. The company continues to drive revenue growth and margin expansion by adding new customers, expanding relationships with existing customers and expanding product offerings for the retail space. Leading Detractors Carbo Ceramics produces high quality ceramic proppants for use in the oil and gas industry. Ceramic proppants are very high strength, uniformly sized spherical pellets used to hold open hydraulic fractures in oil and natural gas wells to increase production. During the year some of the company’s customers began experimenting with, or switching to, sand as a substitute for ceramic proppants. Together with a steep drop in oil prices, this led to a decline in the volume of products sold, pricing pressure and declining profits. Geospace Technologies develops equipment focused on increasing the efficiency and accuracy of gathering seismic data, for the exploration of oil and natural gas. Geospace Technologies’ pioneering efforts in developing a wireless system for gathering this data have led to its strong revenue growth in recent years. The company produces geophones, hydrophones, down‐hole devices for real‐time monitoring, and other equipment used for both land and offshore exploration and drilling. Declining oil prices caused Geospace Technologies to report lower than expected revenue and profitability. Moreover, the company announced that a large anticipated order would be delayed. FEI Company designs, manufactures, and sells complex microscopy workflow solutions. These solutions enable research organizations to view, manipulate and analyze objects on a nanometer scale using extremely sophisticated, high‐powered electron and optical microscopes and related products. Slow adoption of FEI solutions continues to weigh down revenue growth, profitability and performance. We believe the company is well positioned to capture market share, grow revenue and improve margins over the long‐term. Companies Purchased Cyberonics produces medical devices primarily for the treatment of epilepsy. Cyberonics’ implantable devices use electrical stimulation of the Vagus nerve to reduce the frequency and severity of seizures in epilepsy patients. The company has a dominant position in an underpenetrated market, and continues to focus on product innovation and increased functionality of its products. Proto Labs produces low volume custom parts using specialized software for a quick turn‐around. Parts are manufactured using computer numerically controlled (CNC) machines, injection‐molding presses, or 3D printing technologies, and can be made from a wide range of materials, including over 100 plastics and several metals. Proto Labs’ customers are generally design engineers who need prototypes or real parts in low volume, to help them get products to market faster, with more features and customization. SolarWinds sells Information Technology (“IT”) infrastructure management software. This software helps customers monitor performance levels across their IT infrastructure, including applications, servers, storage, virtualization and security. The company continues to exhibit attractive revenue growth and profitability through sales to its expanding customer base. Guidewire Software is the dominant provider of packaged software running core day‐to‐day processes at Property and Casualty (P&C) insurance companies including claims handling, underwriting and policy administration, and customer billing. The software replaces decades‐old Cobalt code running on mainframe computers, reducing costs, and improving decision making and agility. 2
www.browncapital.com
The Brown Capital Management Small Company Fund
Management Discussion of Fund Performance
March 31, 2015 (Unaudited)
Ellie Mae develops software for the mortgage industry. The mortgage process involves multiple documents created and reviewed by numerous people at different firms, at different times, resulting in an extremely inefficient, disorganized, repetitive process prone to mistakes and oversights. Ellie Mae addresses this issue by providing content management and workflow software solution which increases efficiency, facilitates regulatory compliance, and reduces documentation errors. Companies Sold During the year, one company, EnerNOC was sold out of the portfolio. EnerNOC provides demand response and other electricity management services to utility power companies, power grid operators and commercial end users. Electricity is difficult to store on a large scale. As a result, utilities must keep supply and demand in balance. Demand response programs pay commercial electricity users to reduce consumption. EnerNOC demand response solutions facilitate this process. We invested in EnerNOC in 2011. Since then electricity consumption has moderated due to a mass adoption of energy efficiency programs and distributed solar power, reducing the importance of demand response. We do not believe this trend will reverse. As a result, we removed EnerNOC from your investment program. Additionally, four companies were acquired out of the portfolio during the year. The four companies were Accelrys, Hittite Microwave, Measurement Specialties, and Concur Technologies. Since we began managing the Small Company Fund in 1992, over 80 portfolio holdings have been acquired and most of them at a premium. Small Company holdings are never purchased with the intent that they will be acquired. However, these acquisitions do validate, in our opinion, the security selection process of the Small Company Strategy. The characteristics that we deem essential for an exceptional small company to have the wherewithal to become an exceptional larger company, are the same as those that corporations often seek when they need product/service extensions, R&D and technology advancements, or geographical expansion. Outlook Longer‐term, lower oil prices should be, overall, beneficial to the U.S. economy and positively impact our small company portfolios. The consumer remains nearly 70% of the U.S. economy. A decline in the price of oil correlates to lower gas prices at the pump, which equates to additional disposable income for consumers. Some economists estimate that, if these oil price declines last a year, an average U.S. household would realize approximately $500 in disposable income. This should provide a good back drop for small company investing. As long‐term growth investors, we remain steadfast in our commitment to construct and manage portfolios of “exceptional companies” that can grow consistently over a three‐to‐five year time horizon. We define “exceptional companies” as those whose products and services save time, lives, money or headaches or provide exceptional value to consumers. Additionally, exceptional companies possess durable revenue streams, sustainable competitive advantages and a strong balance sheet. Their long‐term orientation is the reason that in any given year the top contributors and the largest detractors may switch places. We believe your portfolio contains a collection of exceptional small companies spread across our custom sectors of Business Services, Consumer Related, Industrial Products & Systems, Information/ Knowledge Management, Medical/ Healthcare and Miscellaneous. The top performance contributors represent many of these sectors. Additionally, many of the top contributors represent long‐term portfolio holdings as well as holdings that we added to the portfolio more recently. We feel comfortable with the level of diversification across the portfolio. Annual Report | March 31, 2015
3
The Brown Capital Management Small Company Fund
March 31, 2015 (Unaudited)
Growth of a hypothetical $10,000 investment ‐ Investor Class $40,000
The Brown Capital Management Small Company Fund - Investor Class
Russell 2000® Growth Index
Russell 2000® Index
$35,000
$30,000
$25,000
$20,000
$15,000
$10,000
$5,000
3/31/05
3/31/06
3/31/07
3/31/08
3/31/09
3/31/10
3/31/11
3/31/12
3/31/13
3/31/14
3/31/15 This graph assumes an initial investment of $10,000 at March 31, 2005. All dividends and distributions are reinvested. This graph depicts the
performance of The Brown Capital Management Small Company Fund (the “Fund”) versus the Russell 2000® Index and the Russell 2000® Growth
Index. It is important to note that the Fund is a professionally managed mutual fund while the indices are not available for investment and are
unmanaged. The comparison is shown for illustrative purposes only.
Performance (as of March 31, 2015) Average Annual Total Returns Since Inception
12/31/92 Total Annual
Fund Operating
Expenses
1 Year
3 Year
5 Year
10 Year The Brown Capital Management Small Company Fund ‐ Investor Class 9.59% 18.47% 17.71% 14.24% 12.24% 1.26% The Brown Capital Management Small Company Fund ‐
Institutional Class 9.81% 18.71% 17.87% 14.31% 12.28% 1.06% S&P 500® Index 12.73% 16.11% 14.47% 8.01% N/A Russell 2000® Index 8.21% 16.27% 14.57% 8.82% 9.59% Russell 2000® Growth Index 12.06% 17.74% 16.58% 10.02% 7.81% Morningstar Small Growth Category 8.06% 15.21% 15.12% 9.20% N/A SCF‐Investor Percentile Ranking vs Total Funds in M‐Star Small Growth Category 39/723 12/655 14/576 1/402 N/A SCF‐Institutional Percentile Ranking vs Total Funds in M‐Star Small Growth Category 36/723 10/655 13/576 1/402 N/A The performance information quoted above represents past performance, which is not a guarantee of future results. Investment return and
principal value of an investment will fluctuate so that an investor’s shares, when redeemed, may be worth more or less than their original cost.
Current performance may be lower or higher than the performance data quoted. An investor may obtain performance data current to the most
recent month-end by visiting www.browncapital.com.
The gross expense ratio shown is from the Fund’s prospectus dated July 29, 2014. This number may vary from the expense ratio shown elsewhere in
this report because it is based on a different time period.
The graph and table do not reflect the deduction of taxes that a shareholder would pay on Fund distributions or the redemption of Fund shares.
Average annual total returns are historical in nature and measure net investment income and capital gain or loss from portfolio investments
assuming reinvestments of distributions.
Investing in the securities of small companies generally is perceived to involve greater risk than investing in domestic companies. Therefore,
investments in the Fund may involve a greater degree of risk than investments in other mutual funds that seek capital growth by domestic companies.
4
www.browncapital.com
The Brown Capital Management Small Company Fund
March 31, 2015 (Unaudited)
The Institutional Class of the Fund commenced operations on December 15, 2011. The historical performance shown for periods prior to December
15, 2011 was calculated synthetically using the performance and the fees and expenses of the Investor Class. If the Institutional Class had been
available during the periods prior to December 15, 2011, the performance shown may have been different. Please refer to the Fund’s prospectus for
further details concerning historical performance.
The S&P 500® Index is the Standard & Poor’s composite index of 500 stocks, a widely recognized, unmanaged index of common stock prices.
The Russell 2000® Index measures the performance of the 2,000 smallest companies in the Russell 3000® Index, which is made up of 3,000 of the
biggest U.S. stocks.
The Russell 2000® Growth Index measures the performance of those Russell 2000 companies with higher forecasted growth values.
Morningstar Small Growth Category – Small-growth portfolios focus on faster-growing companies whose shares are at the lower end of the
market-capitalization range. These portfolios tend to favor companies up-and-coming industries or young firms in their early growth stages. Because
these businesses are fast-growing and often richly valued, their stocks tend to be volatile. Stocks in the bottom 10% of the capitalization of the U.S.
equity market are defined as smallcap. Growth is defined based on fast growth (high growth rates for earnings, sales, book value and cash flow) and
high valuations (high price ratios and low dividend yields).
You cannot invest directly in an index. Note: Diversification does not eliminate the risk of experiencing investment losses.
Annual Report | March 31, 2015
5
The Brown Capital Management Small Company Fund
Schedule of Investments
March 31, 2015
Shares
COMMON STOCKS ‐ 97.94% 4,939,691 1,350,344 12,404 573,814 2,357,520 4,615,448 839,899 2,105,553 1,183,678 820,815 736,183 210,926 1,610,055 671,005 2,923,118 2,650,693 968,140 1,164,141 406,444 775,447 996,548 2,297,114 1,935,376 2,608,142 2,835,726 2,784,456 1,901,432 1,039,920 1,705,518 1,837,113 1,133,343 764,168 2,923,149 570,857 1,321,202 2,551,846 2,267,916 2,670,694 6
Business Services ‐ 21.61% ACI Worldwide, Inc.(a) ANSYS, Inc.(a) Ellie Mae, Inc.(a) Guidewire Software, Inc.(a) (a)
MedAssets, Inc. NIC, Inc.(b) Nuance Communications, Inc.(a) (a)(b)
PROS Holdings, Inc. Tyler Technologies, Inc.(a) Consumer Related ‐ 2.21% Dolby Laboratories, Inc. ‐ Class A DTS, Inc.(a) (a)
Rovi Corp. Industrial Products & Systems ‐ 22.79% Balchem Corp.(b) CARBO Ceramics, Inc. Cognex Corp.(a) Diodes, Inc.(a)(b) (b)
Dynamic Materials Corp. FEI Co. FLIR Systems, Inc. (a)(b)
Geospace Technologies Corp. (a)
Proto Labs, Inc. Sun Hydraulics Corp.(b) Information/Knowledge Management ‐ 18.67% (b)
American Software, Inc. ‐ Class A (b)
Blackbaud, Inc. Manhattan Associates, Inc.(a) NetScout Systems, Inc.(a)(b) Quality Systems, Inc. (a)
SolarWinds, Inc. Vocera Communications, Inc.(a)(b) Medical/Health Care ‐ 28.69% Abaxis, Inc.(b) Bio‐Techne Corp. (a)
Bruker Corp. Cantel Medical Corp.(b) Cyberonics, Inc.(a) (a)
Incyte Corp., Ltd. Medidata Solutions, Inc.(a) (b)
Meridian Bioscience, Inc. (a)(b)
Quidel Corp. Value (Note 1)
$106,993,707
119,086,837
686,065
30,188,355
44,368,526
81,554,966
12,052,551
52,028,215
142,668,709
589,627,931
31,322,300
25,081,755
3,840,963
60,245,018
89,164,846
20,472,362
144,957,422
75,703,792
12,363,148
88,870,524
12,713,568
12,802,630
69,758,360
95,008,635
621,815,287
19,779,543
123,573,768
143,516,093
122,098,396
30,384,883
53,285,501
16,918,738
509,556,922
117,777,314
113,662,970
14,114,183
138,849,578
37,060,036
121,101,375
125,142,528
43,271,837
72,055,324
783,035,145
www.browncapital.com
The Brown Capital Management Small Company Fund
Schedule of Investments
March 31, 2015
Shares
COMMON STOCKS ‐ 97.94% (continued) 2,320,132 Value (Note 1)
Miscellaneous ‐ 3.97% Neogen Corp.(a)(b) $108,419,768
Total Common Stocks (Cost $1,395,503,538) 2,672,700,071
SHORT TERM INVESTMENTS ‐ 2.21% 41,231,210 19,045,582 Dreyfus Cash Management Institutional Shares, 0.03%(c) Fidelity Institutional Money Market Portfolio, 0.10%(c) 41,231,210
19,045,582
Total Short Term Investments (Cost $60,276,792) 60,276,792
Total Value of Investments (Cost $1,455,780,330) ‐ 100.15% Liabilities in Excess of Other Assets ‐ (0.15)% Net Assets ‐ 100.00% 2,732,976,863
(4,078,428)
$2,728,898,435
(a)
Non-income producing investment. Affiliated company - The Fund owns greater than 5% of the outstanding voting securities of this issuer. See Note 1 for more information. (c)
Represents 7 day effective yield at March 31, 2015. Common Abbreviations: Ltd. - Limited. For Fund compliance purposes, each Fund’s industry classifications refer to any one of the industry sub-classifications used by one or more widely
recognized market indexes, and/or as defined by each Fund's management. This definition may not apply for purposes of this report, which may
combine industry sub-classifications for reporting ease. Industries are shown as a percent of net assets. These industry classifications are unaudited.
(b)
See Notes to Financial Statements.
Summary of Investments by Sector Sector Business Services Consumer Related Industrial Products & Systems Information/Knowledge Management Medical/Health Care Miscellaneous Cash and Equivalents Liabilities in excess of other assets Total Annual Report | March 31, 2015
% of Net Assets 21.61% 2.21% 22.79% 18.67% 28.69% 3.97% 2.21% (0.15)% 100.00% Value $ 589,627,931 60,245,018 621,815,287 509,556,922 783,035,145 108,419,768 60,276,792 (4,078,428) $ 2,728,898,435 7
The Brown Capital Management International Equity Fund
Management Discussion of Fund Performance
March 31, 2015 (Unaudited)
The Brown Capital Management International Equity Fund – Investor and Institutional Classes Performance Your International Equity Fund outperformed the broad market as measured by the MSCI EAFE Index (Morgan Stanley Capital Index – Europe, Australia and Far East), and the MSCI World Index ex‐US (Morgan Stanly All Country World Index Except United States) for the fiscal year ending th
st
March 31, 2015. Over the same time period, your Fund ranked in the second quartile (29 percentile and 31 percentile for the institutional and investor classes, respectively) when compared to peers in Morningstar’s Foreign Large Blend Category (740 peers). While we are pleased by short‐term outperformance, your investment program focuses on a three to five year evaluation horizon. As seen in the table, your Fund outpaced the MSCI EAFE, MSCI ACWI ex US and the Morningstar Foreign Large Blend Category over these critical evaluation periods. As stated in the past, your Fund was re‐categorized by Morningstar to the Foreign Large Blend Category from the Foreign Large Growth Category in 2009. We include the Foreign Large Growth peer group in the table below only to note that Brown Capital Management is a growth manager across all offerings and that we remain mindful of the performance within this peer group. Peer Group Rankings reflect performance when compared to similarly managed funds as defined by rating agency, Morningstar. In these ratings
systems the top performer(s) is reflected in first percentile (1st Percentile) and the worst performer(s) in the one hundredth percentile (100th
Percentile). Actual numerical peer rankings unavailable via Morningstar only percentile outcomes.
EAFE – The MSCI EAFE International Gross Index (Europe, Australasia, Far East) is a free float-adjusted market capitalization index that is design
to measure the equity market performance of developed markets excluding the U.S. and Canada. You cannot invest directly into an index.
AC World (ex US) – The MSCI All Country World Index excluding the U.S. is a free-float-adjusted market capitalization weighted index that is
designed to measure the equity market performance of developed and emerging markets. You cannot invest directly into an index.
Morningstar Foreign Large-Blend Category – portfolios invest in a variety of big international stocks. Most of these portfolios divide their assets
among a dozen or more developed markets, including Japan, Britain, France, and Germany. These portfolios primarily invest in stocks that have
market caps in the top 70% of each economically integrated market (such as Europe or Asia ex-Japan). The blend style is assigned to portfolios
where neither growth nor value characteristics predominate. These portfolios typically will have less than 20% of assets invested in U.S. stocks.
Morningstar Foreign Large Growth Category – portfolios focus on high-priced growth stocks, mainly outside of the United States. Most of these
portfolios divide their assets among a dozen or more developed markets, including Japan, Britain, France, and Germany. These portfolios primarily
invest in stocks that have market caps in the top 70% of each economically integrated market (such as Europe or Asia ex-Japan). Growth is defined
based on fast growth (high growth rates for earnings, sales, book value, and cash flow) and high valuations (high price ratios and low dividend
yields). These portfolios typically will have less than 20% of assets invested in U.S. stocks yields).
International Equity Investing Your Brown Capital Management International Equity Fund investment philosophy is characterized by a growth approach to investing and employs a team‐based, bottom‐up, stock selection process that seeks to identify and invest in exceptional companies domiciled outside of the United States, across the capitalization range, while employing a three to five year evaluation horizon fostering a true long‐term investment orientation. The majority of your team’s ideas, about 70%, are generated internally. Most importantly, your team’s research process involves evaluating companies based on their growth potential and, more specifically, company specific risks. Pursuit of exceptional growth companies requires a genuine understanding of those characteristics that satisfy the criteria. This is particularly important given the large potential universe of prospective investments outside of the United States. While the team employs techniques that make the universe of eligible offerings manageable, they do not attempt to be “all things to all people.” Being benchmark agnostic affords them this freedom. They seek only a select group of companies that satisfies our exceptional company criteria. Those efforts include an in depth evaluation of the management, business strategy and competitive analysis. While your team is based in Baltimore, they dedicate significant time to visiting companies. Additionally, the firm’s proximity to New York City allows for investor meetings when these organizations visit the United States. Company analysis results in a summary report describing the investment thesis, earnings forecast and valuation. Part of that analysis includes, but is not limited to, regulatory, accounting, company, industry, country, macroeconomic, and currency risks. All factors are considered as the team takes the time needed to reach informed decisions given the long‐term, commitment made to the investment. Conversely, most sales are driven by a deterioration of the fundamentals that drive the original decisions. 8
www.browncapital.com
The Brown Capital Management International Equity Fund
Management Discussion of Fund Performance
March 31, 2015 (Unaudited)
Beyond an awareness of company specific risks, the team diversifies the portfolio with 40 to 70 holdings, limits individual country exposure to no more than 25% at cost, industries to no more than 20% at market and individual holdings to 5% at cost. The team is also mindful of your Fund’s geographic exposure and limits the portfolio to no more than 15% in emerging markets. Portfolio Review The past twelve months was a challenging period for US investors in foreign securities. The key issue was a strong US dollar, which reached a 12‐
year high against the euro and an 8‐year high relative to the Japanese yen during the year. This offset good returns of foreign securities in local currencies. For example Eurozone markets expressed in euros rose 21% (Euro Stoxx 50 Index) and the Japanese market in yen climbed 32% (Nikkei 225 Index). Despite this significant currency drag, your Fund was still fractionally positive for the fiscal year. Select companies contributing and detracting from performance over the fiscal year appear below as well as newly added companies and those sold, or acquired, out of your Fund to provide insights into the fundamental research driving the investment program. Leading Contributors Icon is a contract research organization (CRO) based in Ireland that conducts clinical trials for pharmaceutical and biotech companies worldwide. Icon shares returned 48% and contributed 161 basis points (bps)(1) to the Fund over the fiscal year. The company continues to make progress securing new customers as evidenced by bookings growth. Icon is also delivering better margins and profitability as a result of improving scale and operational efficiency. Icon’s strong financial position has allowed it to enhance returns by repurchasing shares while maintaining a debt‐free balance sheet. Our position is under review as position size has grown well above average. Man Group, based in the UK, is an alternative asset manager with $72 billion under management. The shares climbed 112.2% for the period, contributing 136 basis points to your Fund. Man Group has benefited from a performance turnaround in its managed futures product, “AHL,” steady client inflows, and increased corporate activity, notably the acquisition of Boston‐based Numeric Investors, which helps diversify the revenue base. We added to Man Group during the Fund year when market sentiment around the franchise was weak because we remained convinced of the franchise’s quality, supported by its global scale, strong distribution network, and cash surplus. Leading Detractors During the Fund’s calendar year the price of crude oil fell over 46% with West Texas Intermediate (WTI) crude selling at $57.31 per barrel at the end of March. As a result, our key detractors are both energy holdings. While we do not know the direction of oil prices in the short term, we are constructive on medium and long‐term price dynamics. This is based on growing demand from the emerging middle class in developing markets and rising finding, development and production costs. Sasol is a leader in gas‐to‐liquids technology and is based in South Africa. The stock fell 37% during the period as the price of oil declined, lowering revenue expectations. This cost your Fund 118 basis points. We met with CEO David Constable in New York in March. In spite of the negative oil price development, we remain positive on the strategy and long term growth prospects, particularly following final approval of the company’s new large‐scale project in Louisiana in October. We continue to hold the shares and feel comfortable with the Fund’s current weighting. Nabors is a Bermuda based oil‐services company and the largest land driller in North America. As an oil‐services company, Nabors is sensitive to crude oil prices and drillers’ capital expenditure budgets. The share price decline of 44% reflects investor expectations of lower day rates for Nabors’ rigs and an overall lower rig count, as customers delay or even scrap new exploration projects viable only at higher oil prices. Nabors detracted 113 basis points from performance. We continue to hold the shares and feel comfortable with the Fund’s current weighting. Companies Purchased During the period, we initiated positions in Qiagen (life sciences) based in the Netherlands, Checkpoint Software (information security) in Israel, and Shire PLC (specialty pharma) in Ireland. In our assessment, all three of the Fund’s new holdings are high quality growth companies with durable revenue streams, strong competitive profiles, and sound financial conditions. We look to build the new positions to normal weights opportunistically and as cash balances allow. (1)
Basis Point (bps)- A unit that is equal to 1/100th of 1% and is used to denote the change in a financial instrument.
Annual Report | March 31, 2015
9
The Brown Capital Management International Equity Fund
Management Discussion of Fund Performance
March 31, 2015 (Unaudited)
Companies Sold We eliminated Ping An, a China‐based financial institution. While Ping An has growth potential, we have decided to allocate capital elsewhere. We exited Esprit, a Hong Kong‐based apparel retailer, which sells the majority of its goods through wholesale and retail channels in Europe. The security was sold due to disappointing fundamentals. We also eliminated a residual position in Chaoda Modern Agriculture in China, which we also consider a fundamental disappointment. Finally, two holdings were acquired from the Fund: Goodpack, a Singapore logistics company, and Nobel Biocare a Swiss dental implant maker. Currency Considerations We continue to witness high levels of volatility in global currency markets. For example, toward the end of the Fund’s calendar year, we saw the Swiss National Bank unexpectedly end its peg to the euro, driving the Swiss franc up double‐digits and causing a publicly traded currency broker to fail overnight. We see ongoing central bank activism as a key driver of currency volatility. On our count, more than two dozen central banks outside the US had already cut interest rates by the end of 2014. Given this backdrop, clients increasingly ask why we choose not to hedge currencies. While it may seem appealing to simply eliminate short‐term currency movements from the portfolio, we believe over the long term, hedging is costly and would act as a drag on returns. First, as investors with a three to five year evaluation horizon, we believe the earnings power of holdings is the most significant factor behind longer term performance results, not currencies. Second as analysts, we work to understand the businesses we invest in, and our investment process includes an assessment of currency risks. Finally, we think that in owning securities denominated in a variety of currencies and operating in multiple end markets there are diversification benefits. Outlook While we do not know the direction of the markets going forward, we are confident that a well‐researched collection of quality growth companies will build significant value for our clients over time. The International Team seeks to invest in high‐quality growth companies with durable business franchises. We invest for the long term. Our investment process is characterized by direct, independent, fundamental research to construct a compact portfolio of 40 to 70 high‐quality growth companies with high‐return prospects located outside the United States. 10
www.browncapital.com
The Brown Capital Management International Equity Fund
March 31, 2015 (Unaudited)
Growth of a hypothetical $10,000 investment ‐ Investor Class Brown Capital Management Internaonal Equity Fund - Investor Class
MSCI All Country World Ex USA Index
MSCI EAFE Internaonal Gross Index
$20,000
$15,000
$10,000
$5,000
3/31/05
3/31/06
3/31/07
3/31/08
3/31/09
3/31/10
3/31/11
3/31/12
3/31/13
3/31/14
3/31/15
This graph assumes an initial investment of $10,000 at March 31, 2005. All dividends and distributions are reinvested. This graph depicts the
performance of The Brown Capital Management International Equity Fund (the “Fund”) versus the MSCI All Country World Ex USA Index and the
MSCI EAFE International Gross Index. It is important to note that the Fund is a professionally managed mutual fund while the index is not available
for investment and is unmanaged. The comparison is shown for illustrative purposes only.
Performance (as of March 31, 2015) MSCI EAFE TR USD
Average Annual Total Returns
MSCI All Country World Ex USA TR
1 Year
3 Year
5 Year
10 Year
Brown Capital Management Internaonal Equity Fund - Inv
The Brown Capital Management International Equity Fund ‐ Investor Class 0.40% 12.51% 6.67% 4.69% The Brown Capital Management International Equity Fund ‐ Institutional Class 0.70% 12.62% 6.74% 4.72% MSCI EAFE International Gross Index ‐0.48% 9.52% 6.64% 5.43% MSCI All Country World Ex USA Index ‐0.57% 6.89% 5.29% 5.93% Morningstar Foreign Large Blend Category ‐0.75% 7.87% 5.69% 5.00% Morningstar Foreign Large Growth Category 0.95% 6.30% 5.27% 5.20% IEF‐Investor Percentile Ranking vs Total Funds in M‐Star Foreign Large Blend Category 31/740 4/633 26/564 55/307 IEF‐Institutional Percentile Ranking vs Total Funds in M‐Star Foreign Large Blend Category 29/740 4/633 26/564 54/307 Since
Inception
5/28/99
Total
Annual
Fund
Operating
Expenses
Net Annual
Fund
Operating
Expenses
4.25% 3.37% 1.25% 4.27% 4.69% 5.35% N/A N/A 3.12% 1.00% N/A N/A The performance information quoted above represents past performance, which is not a guarantee of future results. Investment return and
principal value of an investment will fluctuate so that an investor’s shares, when redeemed, may be worth more or less than their original cost.
Current performance may be lower or higher than the performance data quoted. An investor may obtain performance data current to the most
recent month-end by visiting www.browncapital.com.
The expense ratios shown are from the Fund’s prospectus dated July 29, 2014. This number may vary from the expense ratio shown elsewhere in this
report because it is based on a different time period.
The graph and table do not reflect the deduction of taxes that a shareholder would pay on Fund distributions or the redemption of Fund shares.
Average annual total returns are historical in nature and measure net investment income and capital gain or loss from portfolio investments
assuming reinvestments of distributions.
Annual Report | March 31, 2015
11
The Brown Capital Management International Equity Fund
March 31, 2015 (Unaudited)
Investing in the securities of foreign companies generally involves greater risk than investing in larger, more established domestic companies.
Therefore, investments in the Fund may involve a greater degree of risk than investments in other mutual funds that invest in larger, more established
domestic companies.
The Institutional Class of the Fund commenced operations on August 1, 2014. The historical performance shown for periods prior to August 1, 2014
was calculated synthetically using the performance and the fees and expenses of the Investor Class. If the Institutional Class had been available
during the periods prior to August 1, 2014, the performance shown may have been different. Please refer to the Fund’s prospectus for further details
concerning historical performance.
The MSCI EAFE Index (Europe, Australasia, Far East) is a free float-adjusted market capitalization index that is designed to measure the equity
market performance of developed markets excluding the U.S. and Canada.
Morningstar Foreign Large Blend Category – Foreign large-blend portfolios invest in a variety of big international stocks. Most of these portfolios
divide their assets among a dozen or more developed markets, including Japan, Britain, France, and Germany. These portfolios primarily invest in
stocks that have market caps in the top 70% of each economically integrated market (such as Europe or Asia ex-Japan). The blend style is assigned
to portfolios where neither growth nor value characteristics predominate. These portfolios typically will have less than 20% of assets invested in
U.S. stocks.
Morningstar Foreign Large Growth Category – portfolios focus on high-priced growth stocks, mainly outside of the United States. Most of these
portfolios divide their assets among a dozen or more developed markets, including Japan, Britain, France, and Germany. These portfolios primarily
invest in stocks that have market caps in the top 70% of each economically integrated market (such as Europe or Asia ex-Japan). Growth is defined
based on fast growth (high growth rates for earnings, sales, book value, and cash flow) and high valuations (high price ratios and low dividend
yields). These portfolios typically will have less than 20% of assets invested in U.S. stocks.
The MSCI All Country World Index Ex USA Index is a market-capitalization-weighted index maintained by Morgan Stanley Capital International
(MSCI) and designed to provide a broad measure of stock performance throughout the world, with the exception of U.S.-based companies. The index
includes both developed and emerging markets.
You cannot invest directly in an index.
Note: Diversification does not eliminate the risk of experiencing investment losses.
12
www.browncapital.com
The Brown Capital Management International Equity Fund
Schedule of Investments
March 31, 2015
Shares
COMMON STOCKS ‐ 95.75% 5,923 13,694 11,443 8,479 8,097 4,431 14,150 3,726 2,220 2,471 7,241 3,212 362,000 84,000 6,060 9,425 2,781 2,430 234,268 4,533 2,286 3,720 18,400 11,900 Bermuda ‐ 2.82% Invesco, Ltd. Nabors Industries, Ltd. Canada ‐ 3.32% Canadian Natural Resources, Ltd. (a)
Dominion Diamond Corp. Denmark ‐ 2.90% Novo Nordisk A/S ‐ Class B Finland ‐ 1.32% Kone OYJ ‐ Class B France ‐ 6.29% Flamel Technologies SA(a)(b) Sanofi Societe BIC SA Germany ‐ 4.90% Bayerische Motoren Werke AG Carl Zeiss Meditec AG SAP SE Hong Kong ‐ 2.67% Kingdee International Software Group Co., Ltd.(a) Kingsoft Corp., Ltd. Ireland ‐ 12.96% DCC PLC ICON PLC(a) Paddy Power PLC Shire PLC Total Produce PLC Tyco International PLC Israel ‐ 2.81% (a)
Check Point Software Technologies, Ltd. (b)
Teva Pharmaceutical Industries, Ltd. Italy ‐ 3.52% Azimut Holding SpA Japan ‐ 11.08% Japan Tobacco, Inc. Annual Report | March 31, 2015
Value (Note 1)
$235,084
186,923
422,007
350,730
144,870
495,600
433,478
196,676
254,417
368,307
316,285
939,009
309,401
189,547
233,229
732,177
151,755
246,496
398,251
361,644
664,745
238,355
193,390
282,124
195,191
1,935,449
187,383
231,756
419,139
525,677
377,087
13
The Brown Capital Management International Equity Fund
Schedule of Investments
March 31, 2015
Shares
COMMON STOCKS ‐ 95.75% (continued) 18,700 12,400 44,000 18,590 3,359 11,787 11,305 148,424 7,939 5,693 2,432 136 87 4,056 1,631 674 4,139 51,264 10,073 10,378 141,673 321,080 33,239 32,884 Japan ‐ 11.08% (continued) Mitsubishi Estate Co., Ltd. Rakuten, Inc. Sapporo Holdings, Ltd. Yamaha Motor Co., Ltd. Mexico ‐ 2.10% Fomento Economico Mexicano SAB de CV(a)(b) Netherlands ‐ 4.46% (a)
QIAGEN NV Wolters Kluwer NV Singapore ‐ 1.07% UOB‐Kay Hian Holdings, Ltd. South Africa ‐ 1.81% (b)
Sasol, Ltd. Spain ‐ 1.64% Grifols SA Sweden ‐ 1.18% (c)
Millicom International Cellular SA Switzerland ‐ 12.16% Givaudan SA Lindt & Spruengli AG, Non‐Voting Nestle SA Roche Holding AG The Swatch Group AG Transocean, Ltd. United Kingdom ‐ 16.74% BAE Systems PLC Carnival Corp. Diageo PLC Man Group PLC Management Consulting Group PLC Reed Elsevier PLC UBM PLC Value (Note 1)
$434,543
219,030
174,628
449,812
1,655,100
314,066
297,032
369,534
666,566
160,607
270,244
244,734
176,212
246,586
466,871
306,349
449,960
285,815
60,719
1,816,300
398,096
481,892
286,265
428,302
76,206
571,465
258,047
2,500,273
Total Common Stocks (Cost $11,422,049) 14,301,565
SHORT TERM INVESTMENTS ‐ 3.99% 596,210 Dreyfus Cash Management Institutional Shares, 0.03%(d) Total Short Term Investments (Cost $596,210) 14
596,210
596,210
www.browncapital.com
The Brown Capital Management International Equity Fund
Schedule of Investments
March 31, 2015
Value (Note 1)
Total Value of Investments (Cost $12,018,259) ‐ 99.74% Other Assets in Excess of Liabilities ‐ 0.26% Net Assets ‐ 100.00% $14,897,775
38,418
$14,936,193
(a)
Non-income producing investment. American Depositary Receipt. (c)
Swedish Depositary Receipt. (d)
Represents 7 day effective yield at March 31, 2015. Common Abbreviations: AG - Aktiengesellschaft is a German term that refers to a corporation that is limited by shares, i.e., owned by shareholders. (Germany &
Switzerland) A/S - Aktieselskabis is a Danish term for a public limited liability corporation. (Denmark) Ltd. - Limited. NV - Naamloze Vennootschap is the Dutch term for a public limited liability corporation. (Netherlands) OYJ - Osakeyhtio is the Finnish equivalent of a limited company. (Finland) PLC - Public Limited Company. (Ireland & United Kingdom) SA - Generally designates corporations in various countries, mostly those employing the civil law. (France, Spain, Sweden, & Switzerland) SAB de CV - A variable capital company. (Mexico) SE - SE Regulation. A European Company which can operate on a Europe-wide basis and be governed by Community law directly applicable in all
Member States. (Germany) SpA - Societa` Per Azioni is an Italian shared company. (Italy) For Fund compliance purposes, each Fund’s industry classifications refer to any one of the industry sub-classifications used by one or more widely
recognized market indexes, and/or as defined by each Fund's management. This definition may not apply for purposes of this report, which may
combine industry sub-classifications for reporting ease. Industries are shown as a percent of net assets. These industry classifications are unaudited.
(b)
See Notes to Financial Statements.
Summary of Investments by Sector Sector Consumer Discretionary Consumer Staples Energy Financials Health Care Industrials Information Technology Materials Telecommunication Services Cash and Equivalents Other assets in excess of liabilities Total Annual Report | March 31, 2015
% of Net Assets 21.96% 14.78% 5.82% 11.94% 22.27% 8.22% 6.96% 2.62% 1.18% 3.99% 0.26% 100.00% $ $ Value 3,280,606 2,207,390 868,616 1,784,213 3,327,366 1,227,813 1,037,893 391,456 176,212 596,210 38,418 14,936,193 15
The Brown Capital Management Mid-Cap Fund
Management Discussion of Fund Performance
March 31, 2015 (Unaudited)
The Brown Capital Management Mid Cap Fund – Investor and Institutional Classes Performance Your Brown Capital Management Mid‐Cap Fund trailed the broad market as measured by the S&P 500® and the stylized index, the Russell Midcap GrowthTM, for the fiscal year ending March 31, 2015. Your Fund trailed the peer group average, as measured by the Morningstar Mid‐Cap Growth Category delivering results in the fourth quartile (88th and 89th percentile for the institutional and investors classes, respectively) out of 755 peers. While favorable annual outcomes are the preference of many, your investment program focuses on a three to five year evaluation horizon. As seen in the table, your Fund trailed the S&P 500®, Russell Midcap® Growth and the peer group over these critical time periods. Peer Group Rankings reflect performance when compared to similarly managed funds as defined by rating agency Morningstar. In this ratings
systems the top performer(s) is reflected in first percentile (1st Percentile) and the worst performer(s) in the one hundredth percentile (100th
Percentile). Actual numerical peer rankings unavailable via Morningstar only percentile outcomes.
S&P 500® – The S&P 500® Index is the Standard & Poor’s composite index of 500 stocks, a widely recognized, unmanaged index of common stock
prices. You cannot invest directly in an index.
The Russell Midcap® Growth Index measures the performance of those Russell Midcap companies with higher price-to-book ratios and higher
forecasted growth values. You cannot invest directly in an index.
Morningstar Mid-Cap Growth Category – Some mid-cap growth portfolios invest in stocks of all sizes, thus leading to a mid-cap profile, but others
focus on midsize companies. Mid-cap growth portfolios target U.S. firms that are projected to growth faster than other mid-cap stocks, therefore
commanding relatively higher prices. The U.S. mid-cap range for market capitalization typically falls between $1 billion-$8 billion and represents
20% of the total capitalization of the U.S. equity markets. Growth is defined based on fast growth (high growth rates for earnings, sales, book value,
and cash flow) and high valuations (high price ratios and low dividend yields).
Mid‐Cap Investing The Brown Capital Management Mid‐Cap Fund investment philosophy is driven by a growth approach to investing. Companies eligible for inclusion in the mid cap portfolio include, but are not limited to, companies that typically retain a capitalization range of most mid cap companies, demonstrate an ability to save, time, lives, money, headaches or offer consumers an exceptional value proposition and, most importantly, have the potential to become an exceptional larger company. Investment candidates identified for your Fund are subject to research effort that seeks to build an in‐depth knowledge of every company, as a business owner would, within a genuine long‐term framework. The analytical process includes a detailed quantitative analysis of financial information (construction of our own balance sheet, income statement, statement of cash flows and incorporating this information into our proprietary utilization model) as well as a qualitative review of the company (assessment of management and its ability to execute its growth strategy, sustainability and durability of the revenue stream, improving asset utilization, the prospect of profit margin expansion and other company specific criteria) that seeks to leverage the deep industry experience of team members. Your Fund is constructed being attentive to diversification with the long‐term in mind and, as a result, is often a long‐term holder of companies. Therefore, sales typically occur when fundamentals change adversely. Portfolio Review While your Fund is not meeting our expectations as a “stand out” long term offering, we believe it is important to provide perspectives reflective of the fundamental research driving these outcomes. Included are select contributors, detractors, newly added companies and others that were sold, or acquired, out of your Fund during the fiscal year. Leading Contributors Shire is a bio‐pharmaceutical company that focuses on attention deficit hyperactivity disorder, human genetic therapies and gastrointestinal diseases. Shire has had good success with several of its drugs. Based on both executed new launches and strong growth in certain core franchises, we anticipate Shire’s fundamentals to continue improving. Ulta Salon, Cosmetics & Fragrances, Inc. is a beauty retailer that provides one‐stop shopping for prestige mass market and salon products, and salon services in the U.S. The company has achieved several consecutive quarters of better than expected results. We still believe the company has ample room to grow more units in the U.S. 16
www.browncapital.com
The Brown Capital Management Mid-Cap Fund
Management Discussion of Fund Performance
March 31, 2015 (Unaudited)
Salix Pharmaceuticals, Ltd. is a specialty pharmaceutical company, which acquires and develops prescription drugs that treat gastrointestinal diseases. The significant stock price action during the quarter was driven mainly by the announcement of its acquisition by Valeant Pharmaceutical’s following two separate but unsuccessful attempts over the last twelve months by Allergan, Inc. and Actavis plc, respectively. Leading Detractors MasTec, Inc. is an infrastructure construction company which serves the energy, communications, and utility end markets. Even though the company achieved in‐line financial results for the last two quarters, the company’s stock price declined due to reductions in capital spending plans from communications customers, and lower oil prices, which increased the potential for delays of oil and gas pipeline projects. We eliminated our position in MasTec, Inc. in lieu of better investment ideas. Michael Kors Holdings, Ltd. is a designer of sportswear, accessories, footwear and apparel. The company had been growing at an unsustainable rate over the last few years and now has seen some slowing in its growth of sales and earnings. Moreover, the company’s stock price declined due to moderating comparable same store sales levels during the last few quarters. We continue to believe the company’s business model fits our investment program long‐term. Trimble Navigation Limited provides integrated positioning, wireless, and software technology solutions. Trimble is a leading provider of advanced location‐based solutions that maximize productivity and enhance profitability. The company applies technology to make field and mobile workers significantly more productive. The company has reported disappointing earnings for several quarters mainly due to exposure to construction and agricultural sectors. Companies Purchased Restoration Hardware Holdings, Inc. is a retailer in the high‐end home furnishings marketplace. The company should benefit over the long‐term from the demand for high‐end furniture, décor, lighting, outdoor and garden products. Polaris Industries, Inc. is a manufacturer and provider of off road vehicles, on road vehicles, and parts and service. The company should benefit from the vehicle demand both for professional and leisure usage over the long‐term. Biogen Inc. is a global biotech company, which develops markets and manufactures therapies for people living with neurological, autoimmune and hematologic disorders. Biogen’s products include drugs for the treatment of Multiple Sclerosis and Alzeheimers diseases. Celgene Inc. engages in the discovery, development and commercialization of innovative therapies designed to treat cancer and immune‐
inflammatory related diseases. Its cancer drugs have been use in several different types of cancer indications. Franklin Resources Inc. engages in global investment management with products in equity, fixed income and international services. MasterCard Incorporated is engaged in the global payments industry. It connects consumers, financial institutions, merchants, governments and business worldwide, enabling them to use electronic forms of payments instead of cash and checks. Buffalo Wild Wings, Inc. owns, operates and franchises restaurants with a wide variety of food items that cater to a sports loving experience. Companies Sold MedAssets, Inc. is a healthcare performance improvement company focused on helping provide financial and operational gains. MasTec, Inc. is an infrastructure construction company which serves the energy, communications, and utility end markets. Covance, Inc. is a provider of drug development services to the pharmaceutical, biotechnology and medical device industries. Allscripts Healthcare Solutions, Inc. delivers solutions that provide healthcare professionals with the information, insights and connectivity required to transform healthcare by improving the quality and efficiency of patient care. Carbo Ceramics, Inc. manufactures and supplies ceramic proppant and resin‐coated sand. Also, it provided fracture simulation software and fracture design and consulting services. Annual Report | March 31, 2015
17
The Brown Capital Management Mid-Cap Fund
Management Discussion of Fund Performance
March 31, 2015 (Unaudited)
Coach, Inc. engages in manufacturing of women’s handbags, belts, clothing, footwear, jewelry, luggage, watches and fragrances. Diodes, Incorporated is a global manufacturer and supplier of application specific standard products within the broad discrete, logic and analog semiconductor markets, serving the consumer electronics, computing, industrial and automotive markets. Elizabeth Arden, Inc. operates as a global beauty products company, which engages to sell fragrances, skin care and cosmetic products to retailers. General Cable Corporation engages in the development, design, manufacturing, marketing and distribution of copper, aluminum and fiber optic wire and cable products for use in the energy, industrial, construction, specialty and communication markets. Guess? Inc. designs, markets, distributes and licenses a lifestyle collection of contemporary apparel and accessories for men, women and children that reflect American lifestyle and European fashion trends. Meridian Biosciences, Inc. is a fully integrated life science company. The company develops, markets and distributes diagnostic test kits. Outlook The March Labor Department report came in below expectations due to sluggish business investment and tough winter weather across a significant part of the country. In addition, the substantial fall in oil prices coupled with the strong dollar has slowed spending in the energy sector while holding back consumer spending and construction. Nevertheless, we would not put too much emphasis on an economic report for one month. The unemployment rate is still at 5.5%. Also, hourly wages rose 0.3% for private sector workers in March, after a meager 0.1% rise in February. However, hours worked fell slightly, thus overall paychecks were left essentially flat. Moreover, the slow‐down in job creation raise the speculation on when the Federal Reserve will raise interest rates, above their near‐zero level, where they have remained since 2008. We do not try to predict in what month the Federal Reserve will raise interest rates; however, we expect it will be sometime in 2015. We do not believe the Federal Reserve wants to see more improvement in the labor market before it raises rates. Nevertheless, keep in mind that history tells us the following drive stock prices: (1) Price Earnings Ratio (P/E)(1) expanding, contracting, or remaining the same, and (2) Earnings Growth(2) with an added kicker, dividend yield.(3) In short, we are not expecting much in P/E expansion while earnings growth will probably more like single digit, with a 2% or so dividend yield. Thus we would not be surprised to see 2015 market returns below double‐digit, but better than most other investments. In summary, we believe that “exceptional growth companies” with the business models and unique competitive advantages that allow them to thrive over the long‐term, ultimately drive shareholder value. We are low‐turnover, long‐term investors. Our process of identifying and evaluating our portfolio companies involves extensive bottom‐up fundamental investment research which is conducted by our seasoned investment professionals. As a result, we draw our own investment conclusions and remain optimistic about the long‐term outperformance of our portfolio over various market cycles. (1)
Price-Earnings Ratio- A valuation of a company’s current share price compared to its per-share earnings.
(2)
Earnings Growth- The annual rate of growth of earnings from investments.
(3)
Dividend Yield- A financial ratio that shows how much a company pays out in dividends each year relative to its share price.
18
www.browncapital.com
The Brown Capital Management Mid-Cap Fund
March 31, 2015 (Unaudited)
Growth of a hypothetical $10,000 investment ‐ Investor Class $30,000
Brown Capital Management Mid-Cap Fund - Investor Class
S&P 500® Total Return Index
S&P MidCap 400® Index
Russell MidCap® Growth Index
$25,000
$20,000
$15,000
$10,000
$5,000
3/31/05
3/31/06
3/31/07
3/31/08
3/31/09
3/31/10
3/31/11
3/31/12
3/31/13
3/31/14
3/31/15
This graph assumes an initial investment of $10,000 at March 31, 2005. All dividends and distributions are reinvested. This graph depicts the performance of The Brown Capital Management Mid‐Cap Fund (the “Fund”) versus the S&P 500® Total Return Index, the S&P MidCap 400® Index and the Russell MidCap® Growth Index. It is important to note that the Fund is a professionally managed mutual fund while the indices are not available for investment and are unmanaged. The comparison is shown for illustrative purposes only. S&P Mid Cap 400 TR
Performance (as of March 31, 2015)
Russell MidCap Growth TR
S&P 500 Total Return Index
Total
Annual
Brown Capital Management Annual
Mid-Cap FundNet
- Inv
Brown Capital Management Mid‐Cap ‐ Investor Brown Capital Management Mid‐Cap ‐ Institutional S&P 500® Index S&P MidCap 400® Index Russell MidCap® Growth Morningstar Mid‐Cap Growth Category MCF‐Investor Percentile Ranking vs. Total Funds in M‐Star Mid Growth Category MCF‐Institutional Percentile Ranking vs. Total Funds in M‐Star Mid Growth Category 1 Year
5.60% 5.90% 12.73% 12.19% 15.56% 11.20% Average Annual Total Returns
3 Year
5 Year
11.71% 13.11% 12.06% 13.34% 16.11% 14.47% 17.03% 15.72% 17.41% 16.43% 14.95% 14.47% 10 Year
10.40% 10.50% 8.01% 10.32% 10.19% 9.17% Since
Inception
5/28/99
11.68% 11.77% N/A 12.68% 13.12% N/A Fund
Operating
Expenses
1.27% 1.02% Fund
Operating
Expenses
1.15% 0.90% 89/755 90/655 74/586 23/436 N/A 88/755 88/655 71/586 22/436 N/A The performance information quoted above represents past performance, which is not a guarantee of future results. Investment return and
principal value of an investment will fluctuate so that an investor’s shares, when redeemed, may be worth more or less than their original cost.
Current performance may be lower or higher than the performance data quoted. An investor may obtain performance data current to the most
recent month-end by visiting www.browncapital.com.
The expense ratios shown are from the Fund’s prospectus dated July 29, 2014. This number may vary from the expense ratio shown elsewhere in
this report because it is based on a different time period.
The graph and table do not reflect the deduction of taxes that a shareholder would pay on Fund distributions or the redemption of Fund shares.
Average annual total returns are historical in nature and measure net investment income and capital gain or loss from portfolio investments
assuming reinvestments of distributions.
Investing in the securities of mid-cap companies generally involves greater risk than investing in larger, more established companies. Therefore,
investments in the Fund may involve a greater degree of risk than investments in other mutual funds that seek capital growth by investing in larger,
more established companies.
Annual Report | March 31, 2015
19
The Brown Capital Management Mid-Cap Fund
March 31, 2015 (Unaudited)
The Institutional Class of the Fund commenced operations on December 15, 2011. The historical performance shown for periods prior to
December 15, 2011 was calculated synthetically using the performance and the fees and expenses of the Investor Class. If the Institutional Class had
been available during the periods prior to December 15, 2011, the performance shown may have been different. Please refer to the Fund’s prospectus
for further details concerning historical performance.
The S&P 500® Index is the Standard & Poor’s composite index of 500 stocks, a widely recognized, unmanaged index of common stock prices.
The S&P MidCap 400® Index measures stocks that have a total market capitalization that ranges from roughly $737 million to $11.8 billion dollars.
The Russell MidCap® Growth Index measures the performance of those Russell MidCap companies with higher price-to-book ratios and higher
forecasted growth values.
Morningstar Mid-Cap Growth Category – Some mid-cap growth portfolios invest in stocks of all sizes, thus leading to a mid-cap profile, but others
focus on midsize companies. Mid-cap growth portfolios target U.S. firms that are projected to grow faster than other mid-cap stocks, therefore
commanding relatively higher prices. The U.S. mid-cap range for market capitalization typically falls between $1 billion-$8 billion and represents
20% of the total capitalization of the U.S. equity markets. Growth is defined based on fast growth (high growth rates for earnings, sales, book value,
and cash flow) and high valuations (high price ratios and low dividend yields).
You cannot invest directly in an index.
Note: Diversification does not eliminate the risk of experiencing investment losses.
20
www.browncapital.com
The Brown Capital Management Mid-Cap Fund
Schedule of Investments
March 31, 2015
Shares
COMMON STOCKS ‐ 98.22% 33,892 5,432 30,267 46,474 33,843 613 12,431 94,855 22,510 48,896 32,441 23,270 11,686 33,755 43,659 30,611 61,221 47,465 6,528 21,686 10,500 22,304 29,717 13,249 12,975 12,414 20,288 20,286 20,530 94,771 9,805 41,136 18,869 39,073 10,799 Consumer Discretionary ‐ 31.50% BorgWarner, Inc. Buffalo Wild Wings, Inc.(a) Dick's Sporting Goods, Inc. lululemon athletica, Inc.(a) (a)
Michael Kors Holdings, Ltd. NVR, Inc.(a) Polaris Industries, Inc. PulteGroup, Inc. (a)
Restoration Hardware Holdings, Inc. Toll Brothers, Inc.(a) Tractor Supply Co. Ulta Salon Cosmetics & Fragrance, Inc.(a) Consumer Staples ‐ 2.03% Monster Beverage Corp.(a) Energy ‐ 3.67% Atwood Oceanics, Inc. Cameron International Corp.(a) Financial Services ‐ 11.10% Franklin Resources, Inc. Stifel Financial Corp.(a) T. Rowe Price Group, Inc. Health Care ‐ 21.18% Biogen, Inc.(a) (a)
Celgene Corp. Jazz Pharmaceuticals PLC(a) Myriad Genetics, Inc.(a) (a)
PAREXEL International Corp. (a)
Salix Pharmaceuticals, Ltd. Shire PLC(b) Waters Corp.(a) Industrials ‐ 11.12% FEI Co. JB Hunt Transport Services, Inc. MSC Industrial Direct Co. ‐ Class A Quanta Services, Inc.(a) Stericycle, Inc.(a) Information Technology ‐ 17.62% (a)
Akamai Technologies, Inc. (a)
ANSYS, Inc. Blackbaud, Inc. FactSet Research Systems, Inc. Annual Report | March 31, 2015
Value (Note 1)
$2,049,788
984,496
1,724,916
2,975,265
2,225,177
814,469
1,754,014
2,108,627
2,232,767
1,923,569
2,759,431
3,510,280
25,062,799
1,617,284
948,853
1,969,894
2,918,747
1,570,956
3,413,071
3,843,716
8,827,743
2,756,383
2,499,962
1,814,295
789,561
2,050,176
2,289,560
3,104,788
1,543,308
16,848,033
1,548,786
1,732,323
1,482,266
2,703,817
1,376,916
8,844,108
2,922,507
1,664,057
1,851,279
1,719,201
21
The Brown Capital Management Mid-Cap Fund
Schedule of Investments
March 31, 2015
Shares
COMMON STOCKS ‐ 98.22% (continued) 21,762 43,952 96,099 Value (Note 1)
Information Technology ‐ 17.62% (continued) MasterCard, Inc. ‐ Class A NetApp, Inc. Trimble Navigation, Ltd.(a) $1,880,019
1,558,538
2,421,695
14,017,296
Total Common Stocks (Cost $54,510,544) 78,136,010
SHORT TERM INVESTMENTS ‐ 0.30% 235,607 Dreyfus Cash Management Institutional Shares, 0.03%(c) 235,607
Total Short Term Investments (Cost $235,607) 235,607
Total Value of Investments (Cost $54,746,151) ‐ 98.52% Other Assets in Excess of Liabilities ‐ 1.48% Net Assets ‐ 100.00% 78,371,617
1,176,153
$79,547,770
(a)
Non-income producing investment. American Depositary Receipt. (c)
Represents 7 day effective yield at March 31, 2015. Common Abbreviations: Ltd. - Limited. PLC - Public Limited Company. (Ireland & United Kingdom) For Fund compliance purposes, each Fund’s industry classifications refer to any one of the industry sub-classifications used by one or more widely
recognized market indexes, and/or as defined by each Fund's management. This definition may not apply for purposes of this report, which may
combine industry sub-classifications for reporting ease. Industries are shown as a percent of net assets. These industry classifications are unaudited.
(b)
See Notes to Financial Statements.
Summary of Investments by Sector Sector Consumer Discretionary Consumer Staples Energy Financial Services Health Care Industrials Information Technology Cash and Equivalents Other assets in excess of liabilities Total % of Net Assets 31.50% 2.03% 3.67% 11.10% 21.18% 11.12% 17.62% 0.30% 1.48% 100.00% $ $ Value 25,062,799 1,617,284 2,918,747 8,827,743 16,848,033 8,844,108 14,017,296 235,607 1,176,153 79,547,770 22
www.browncapital.com
The Brown Capital Management Mutual Funds
Statements of Assets and Liabilities
March 31, 2015
Small Company
Fund
Assets: International Equity
Fund(a)
Unaffiliated Investments, at cost Affiliated Investments, at cost Unaffiliated Investments, at value (Note 1) Affiliated Investments, at value (Note 1) Total Investments, at value Foreign Cash, at value Receivables: Investments sold Fund shares sold Dividends, interest and reclaims, at value Prepaid expenses Due from Advisor Total Assets $ 800,126,363 655,653,967 $ 1,551,606,365 1,181,370,498 $ 2,732,976,863 – – 5,578,525 581,051 34,630 – 2,739,171,069 2,404,985 4,955,370 2,308,361 24,642 149 43,449 47,447 349,847 15,773 118,857 3,754 10,272,634 $ 2,728,898,435 $ $ $ Payables: Investments purchased Fund shares redeemed Accrued expenses: Advisory fees Administration fees Trustees' fees Custody fees Transfer agent fees 12b‐1 fees ‐ Investor Class Legal and audit fees Printing fees Other expenses Total Liabilities Net Assets Paid‐in capital Accumulated net investment income/(loss) Accumulated net realized gain/(loss) on investments, affiliated investments and foreign currency transactions Net unrealized appreciation on investments, affiliated investments and foreign currency translations Net Assets Investor Class: Net Asset Value, Maximum Offering Price and Redemption Price Per Share Net Assets Shares Outstanding, no par value (unlimited shares authorized) Institutional Class: Net Asset Value, Maximum Offering Price and Redemption Price Per Share Net Assets Shares Outstanding, no par value (unlimited shares authorized) – – – 1,941 149 1,667 2,697 341 14,273 146 2,057 23,271 636,929 29,111 36,288 1,275 149 1,618 5,257 5,104 14,273 3,356 816 734,176 14,936,193 $ 79,547,770 $ 1,357,872,093 $ (5,565,374) 14,322,767 $ 2,158 54,179,804 – (2,265,304) $ 1,277,196,533 $ 2,728,898,435 $ 75.13 $ 2,068,124,663 27,527,334 $ 75.66 $ 660,773,772 8,733,648 (a)
*
99,395,183 $ 1,742,500 2,876,572 14,936,193 $ 23,625,466 79,547,770 12.63 1,670,527 132,252 12.64 13,265,666 1,049,817 26.49 23,162,638 874,316 26.77 56,385,132 2,106,117 54,746,151 – 78,371,617 – 78,371,617 – 1,827,105 40,469 28,061 14,694 – 80,281,946 Net Assets Consist of: 12,018,259 $ – 14,897,775 $ – 14,897,775 $ 6,287 * – – 34,365 * 13,317 7,720 14,959,464 Liabilities: Mid-Cap Fund
$ $ $ $ $ $ $ $ The Fund began offering Institutional Class Shares on August 1, 2014. At Cost; $6,307 for Foreign Cash and $37,289 for dividends and reclaims. See Notes to Financial Statements.
Annual Report | March 31, 2015
23
The Brown Capital Management Mutual Funds
Statements of Operations For the Year Ended March 31, 2015 Small Company
Fund
Investment Income: Dividends Dividends from affiliated investments Foreign taxes withheld Total Investment Income $ Expenses: Advisory fees (Note 2) Administration fees (Note 2) Transfer agent fees (Note 2) Custody fees Registration fees 12b‐1 Fees ‐ Investor Class (Note 2) Legal fees (Note 2) Audit and tax preparation fees Trustees' fees and expenses Compliance services fees (Note 2) Printing fees Other expenses Total Expenses Expenses waived/reimbursed by Advisor ‐ Investor Class (Note 2) Expenses waived/reimbursed by Advisor ‐ Institutional Class (Note 2) Net Expenses Net Investment Income/(Loss) International Equity
Fund(a)
5,187,058 10,601,049 – 15,788,107 26,199,498 284,531 449,059 262,155 71,934 4,040,200 46,031 15,000 29,750 13,500 187,468 65,056 31,664,182 – – 31,664,182 (15,876,075) $ Mid-Cap Fund
235,696 $ – (24,379) 211,317 113,656 9,018 33,652 15,806 30,129 10,034 49,781 13,500 29,750 13,500 1,984 6,709 327,519 (49,629) (129,529) 148,361 62,956 486,651 – – 486,651 613,717 11,819 59,484 9,705 38,245 70,518 46,032 13,500 29,750 13,500 6,417 6,505 919,192 (37,578) (74,636) 806,978 (320,327) 293,847 – (6,265) (340,914) – (3,222) (56,554) 6,402 $ 6,726,962 – – (2,000,138) – – 4,726,824 4,406,497 Realized and Unrealized Gain/(Loss) on: Net realized gain from investments Net realized gain from affiliated investments Net realized loss from foreign currency transactions Net change in unrealized depreciation of investments Net change in unrealized appreciation of affiliated investments Net change in unrealized depreciation of foreign currency translations Net Realized and Unrealized Gain/(Loss) on Investments and Foreign Currencies Net Increase in Net Assets Resulting From Operations (a)
141,530,453 71,051,120 – (3,414,207) 36,577,320 – 245,744,686 $ 229,868,611 $ The Fund began offering Institutional Class Shares on August 1, 2014. See Notes to Financial Statements.
24
www.browncapital.com
The Brown Capital Management Mutual Funds
Statements of Changes in Net Assets
Small Company Fund
For the For the Year Ended Year Ended March 31, 2015
March 31, 2014
Operations: $ (15,876,075) $ (19,283,815) $ 62,956 $ 14,051 212,581,573 54,170,773 287,582 256,656 33,163,113 229,868,611 534,476,953 (344,136) 569,363,911 6,402 Net investment income/(loss) Net realized gain from investments, affiliated investments and foreign currency transactions Net change in unrealized appreciation/(depreciation) of investments, affiliated investments and foreign currency translations Net Increase in Net Assets Resulting from Operations International Equity Fund
For the For the Year Ended Year Ended March 31, 2014
March 31, 2015(a)
1,202,994 1,473,701 Distributions to Shareholders: (Note 4) Net investment income Investor Institutional Net realized gains from investment transactions Investor Institutional Net Decrease in Net Assets from Distributions (103,255,113) (32,436,915) (135,692,028) Capital Share Transactions: Shares sold Investor Institutional Reinvested dividends and distributions Investor Institutional Shares redeemed, net of redemption fees (Note 1) Investor Institutional Net Increase/(Decrease) in Net Assets Resulting from Capital Share Transactions Net Increase/(Decrease) in Net Assets 408,533,002 226,926,945 99,003,547 29,240,949 (802,266,300) (190,048,037) (228,609,894) (134,433,311) Net Assets: 463,637,064 7,163,967 986,935,487 7,131,213 1,876,396,259 7,804,980 $ 2,863,331,746 $ 14,936,193 $ (5,787,807) $ 2,158 Beginning of Year End of Year 2,863,331,746 $ 2,728,898,435 Accumulated Net Investment Income/(Loss) $ (5,565,374) Share Information: Investor Class: Shares sold Reinvested distributions Shares redeemed Net Increase/(Decrease) in Capital Shares Shares Outstanding, Beginning of Year Shares Outstanding, End of Year Institutional Class: Shares sold Reinvested distributions Shares redeemed Net Increase in Capital Shares Shares Outstanding, Beginning of Year Shares Outstanding, End of Year – (963) (99,270) – (38,193) – (37,687,409) – – (8,378,079) – – (46,065,488) (39,156) (99,270) 910,878,735 8,428,994 208,398 398,520,909 13,344,544 ‐ 36,089,381 890 64,998 14,577 – 7,089,853 (773,719,621) (14,449,298) (267,134) (115,222,193) (175,740) ‐ – – 6,262 1,380,693 6,424,287 $ 7,804,980 $ 5,739,473 1,416,360 (11,344,488) (4,188,655) 31,715,989 27,527,334 13,709,652 511,326 (11,289,751) 2,931,227 28,784,762 31,715,989 3,171,478 415,650 (2,653,926) 933,202 7,800,446 8,733,648 5,721,903 1,062,472 100,040 1,240 (1,631,643) (13,895) 4,190,300 1,049,817 3,610,146 – 7,800,446 1,049,817 (16,214) 664,042 76 (1,151,557) (487,439) 619,691 132,252 17,508 5,444 (23,862) (910) 620,601 619,691 – – – – – – See Notes to Financial Statements.
Annual Report | March 31, 2015
25
The Brown Capital Management Mutual Funds
Statements of Changes in Net Assets
Mid-Cap Fund
For the For the Year Ended Year Ended March 31, 2015
March 31, 2014
Operations: $ (320,327) 6,726,962 $ (315,722) 2,936,252 (2,000,138) 4,406,497 12,903,578 15,524,108 Net investment loss Net realized gain from investments Net change in unrealized appreciation/(depreciation) of investments Net Increase in Net Assets Resulting from Operations Distributions to Shareholders: (Note 4) Net realized gains from investment transactions Investor Institutional Net Decrease in Net Assets from Distributions – – – 7,563,754 8,844,279 8,928,537 13,923,678 1,697,912 – 3,433,315 – (15,282,123) (10,317,849) (8,554,873) (9,579,965) Capital Share Transactions: Shares sold Investor Institutional Reinvested dividends and distributions Investor Institutional Shares redeemed Investor Institutional Net Increase/(Decrease) in Net Assets Resulting from Capital Share Transactions Net Increase/(Decrease) in Net Assets (1,791,192) (3,669,095) (5,460,287) (2,213,478) (3,267,268) 2,870,143 18,394,251 64,420,787 $ 82,815,038 $ (95,372) Net Assets: Beginning of Year End of Year 82,815,038 $ 79,547,770 Accumulated Net Investment Loss $ – Share Information: Investor Class: Shares sold Reinvested distributions Shares redeemed Net Decrease in Capital Shares Shares Outstanding, Beginning of Year Shares Outstanding, End of Year Institutional Class: Shares sold Reinvested distributions Shares redeemed Net Increase in Capital Shares Shares Outstanding, Beginning of Year Shares Outstanding, End of Year (a)
287,518 68,658 (587,635) (231,459) 1,105,775 874,316 365,015 – (420,912) (55,897) 1,161,672 1,105,775 339,688 137,498 (327,641) 149,545 1,956,572 2,106,117 574,959 – (396,640) 178,319 1,778,253 1,956,572 The Fund began offering Institutional Class Shares on August 1, 2014. See Notes to Financial Statements.
26
www.browncapital.com
The Brown Capital Management Small Company Fund
Financial Highlights
For a share outstanding throughout each of the years presented.
For the Year Ended March 31, 2015
$ 72.39 (0.47) (b) 7.12 6.65 For the Year Ended March 31, 2014
$ 57.91 (0.54) (b) 16.22 15.68 For the Year Ended March 31, 2013
$ 49.32 (0.07) (b) 9.47 9.40 For the Year Ended March 31, 2011
$ 36.44 (0.23) 11.86 11.63 For the Year Ended March 31, 2012(a)
$ 47.88 (0.31) (b) 1.75 1.44 Investor Class
Net Asset Value, Beginning of Year Income/(Loss) from Investment Operations: Net Investment Loss Net Realized and Unrealized Gain on Investments Total from Investment Operations Less Distributions: Distributions (from capital gains) (3.91) (1.20) (0.81) – (0.19) Total Distributions (3.91) (1.20) (0.81) – (0.19) Net Asset Value, End of Year $ 75.13 $ 72.39 $ 57.91 $ 49.32 $ 47.88 Total Return(c) 9.59% 27.12% 19.36% 3.01% 31.98% Ratios/Supplemental Data: Net Assets, End of Year (000s) $ 2,068,125 $ 2,295,960 $ 1,666,796 $ 1,457,641 $ 1,178,279 Average Net Assets for the Year (000s) $ 2,020,100 $ 2,089,066 $ 1,391,562 $ 1,340,963 $ 854,095 1.25% (d) 1.25% (d) 1.27% (d) 1.21% (d) 1.19% Ratio of Expenses to Average Net Assets Ratio of Net Investment Loss to Average Net Assets (0.65%) (0.81%) (0.13%) (0.68%) (0.68%) Portfolio Turnover Rate 11% 5% 15% 21% 7% (a)
Prior to December 1, 2011 the Fund offered one class of shares, which was converted to Investor Shares on that date. (b)
Calculated using average shares method. (c)
Includes adjustments in accordance with accounting principles generally accepted in the United States of America and, consequently, the net
asset value for financial reporting purposes and the returns based upon those net asset values may differ from the net asset values and returns
for shareholder transactions. (d)
Includes 12b-1 Plan expenses, based upon the 12b-1 Plan adopted by the Fund on December 1, 2011. See Notes to Financial Statements.
Annual Report | March 31, 2015
27
The Brown Capital Management Small Company Fund
Financial Highlights
For a share outstanding throughout the period presented.
For the Year Ended March 31, 2015
$ 72.74 (0.32) (b) 7.15 6.83 For the Year Ended March 31, 2014
$ 58.06 (0.41) (b) 16.29 15.88 For the Year Ended March 31, 2013
$ 49.35 0.24 (b) 9.28 9.52 For the Period Ended March 31, 2012(a)
$ 43.19 (0.08) (b) 6.24 6.16 Institutional Class
Net Asset Value, Beginning of Period Income/(Loss) from Investment Operations: Net Investment Income/(Loss) Net Realized and Unrealized Gain on Investments Total from Investment Operations Less Distributions: Distributions (from capital gains) (3.91) (1.20) (0.81) – Total Distributions (3.91) (1.20) (0.81) – Net Asset Value, End of Period $ 75.66 $ 72.74 $ 58.06 $ 49.35 Total Return(c) 9.80% 27.40% 19.59% 14.26% (d) Ratios/Supplemental Data: Net Assets, End of Period (000s) $ 660,774 $ 567,372 $ 209,600 $ 5,465 Average Net Assets for the Period (000s) $ 599,850 $ 380,193 $ 85,751 $ 2,086 1.05% 1.05% 1.08% 1.21% (e)(f) Ratio of Expenses to Average Net Assets Ratio of Net Investment Income/(Loss) to Average Net Assets (0.45%) (0.60%) 0.47% (0.59%) (e) Portfolio Turnover Rate 11% 5% 15% 21% (d)(g) (a)
The Fund began offering Institutional Class Shares on December 15, 2011. (b)
Calculated using average shares method. (c)
Includes adjustments in accordance with accounting principles generally accepted in the United States of America and, consequently, the net
asset value for financial reporting purposes and the returns based upon those net asset values may differ from the net asset values and returns
for shareholder transactions. (d)
Not Annualized. (e)
Annualized. (f)
During the year ended March 31, 2012 the Fund had a contractual administrative agreement for a portion of the year with the previous
administrator in which the contractual fees were materially higher than the contractual fee arrangements with the current administrator. (g)
Portfolio turnover rate is calculated at the Fund level and represents the year ended March 31, 2012. See Notes to Financial Statements.
28
www.browncapital.com
The Brown Capital Management International Equity Fund
Financial Highlights
For a share outstanding throughout each of the years presented.
For the For the For the For the For the Year Ended Year Ended Year Ended Year Ended Year Ended March 31, 2015 March 31, 2014 March 31, 2013 March 31, 2012(a) March 31, 2011
$ 12.59 $ 10.35 $ 9.06 $ 10.02 $ 9.57 0.02 (b) 0.10 (b) 0.05 0.10 (b) 0.04 (b) Investor Class
Net Asset Value, Beginning of Year Income/(Loss) from Investment Operations: Net Investment Income Net Realized and Unrealized Gain/(Loss) on (0.05) 2.38 1.26 (0.88) 0.59 Investments Total from Investment Operations 0.05 2.40 1.36 (0.84) 0.64 Less Distributions: Dividends (from net investment income) (0.01) (0.16) (0.07) (0.12) (0.19) Total Distributions (0.01) (0.16) (0.07) (0.12) (0.19) – – – – Redemption Fees Added to Paid‐in Capital (Note 1) 0.00 (c) Net Asset Value, End of Year $ 12.63 $ 12.59 $ 10.35 $ 9.06 $ 10.02 Total Return(d) 0.40% 23.31% 15.03% (8.22%) 6.79% Ratios/Supplemental Data: Net Assets, End of Year (000s) $ 1,671 $ 7,805 $ 6,424 $ 9,758 $ 10,696 Average Net Assets for the Year (000s) $ 4,014 $ 6,959 $ 7,307 $ 10,017 $ 11,461 Ratio of Expenses to Average Net Assets Excluding Fee Waivers and Reimbursements 2.84% (e) 3.47% (e) 3.50% (e) 3.02% (e) 2.91% Ratio of Expenses to Average Net Assets Including Fee Waivers and Reimbursements 1.60% (e)(f) 2.00% (e) 2.00% (e) 2.00% (e) 2.00% Ratio of Net Investment Income to Average Net Assets 0.79% 0.20% 1.13% 0.45% 0.48% Portfolio Turnover Rate 12%
9%
10% 17%
28% (a)
Prior to December 1, 2011 the Fund offered one class of shares, which was converted to Investor Shares on that date. (b)
Calculated using average shares method. (c)
Less than $0.005 per share. (d)
Includes adjustments in accordance with accounting principles generally accepted in the United States of America and, consequently, the net
asset value for financial reporting purposes and the returns based upon those net asset values may differ from the net asset values and returns
for shareholder transactions. (e)
Includes 12b-1 Plan expenses, based upon the 12b-1 Plan adopted by the Fund on December 1, 2011. (f)
Effective June 30, 2014, the net expense limitation changed from 1.75% to 1.00%, excluding 12b-1 fees. See Notes to Financial Statements.
Annual Report | March 31, 2015
29
The Brown Capital Management International Equity Fund
Financial Highlights
For a share outstanding throughout the period presented.
For the Period Ended March 31, 2015(a)
$ 12.56 0.03 (b) 0.09 (c) 0.12 Institutional Class
Net Asset Value, Beginning of Period Income/(Loss) from Investment Operations: Net Investment Income Net Realized and Unrealized Gain on Investments Total from Investment Operations Less Distributions: Dividends (from net investment income) (0.04) Total Distributions (0.04) Net Asset Value, End of Period $ 12.64 Total Return(d) 0.94% (e) Ratios/Supplemental Data: Net Assets, End of Period (000s) $ 13,266 Average Net Assets for the Period (000s) $ 12,783 2.54% (f) Ratio of Expenses to Average Net Assets Excluding Fee Waivers and Reimbursements Ratio of Expenses to Average Net Assets Including Fee Waivers and Reimbursements 1.00% (f) Ratio of Net Investment Income to Average Net Assets 0.37% (f) Portfolio Turnover Rate 12% (e)(g) (a)
The Fund began offering Institutional Class Shares on August 1, 2014. (b)
Calculated using average shares method. (c)
The amount of net realized and unrealized gain on investment per share for the period ended March 31, 2015 does not accord with the amounts
in the Statements of Operations due to the timing of purchases and sales of Fund shares in relation to fluctuating market values. (d)
Includes adjustments in accordance with accounting principles generally accepted in the United States of America and, consequently, the net
asset value for financial reporting purposes and the returns based upon those net asset values may differ from the net asset values and returns
for shareholder transactions. (e)
Not Annualized. (f)
Annualized. (g)
Portfolio turnover rate is calculated at the Fund level and represents the year ended March 31, 2015. See Notes to Financial Statements.
30
www.browncapital.com
The Brown Capital Management Mid-Cap Fund
Financial Highlights
For a share outstanding throughout each of the years presented.
For the Year Ended March 31, 2015
$ 26.92 (0.15) (b) 1.53 1.38 For the Year Ended March 31, 2014
$ 21.87 (0.14) (b) 5.19 5.05 For the Year Ended March 31, 2013
$ 20.76 (0.06) (b) 1.52 1.46 For the Year Ended March 31, 2011
$ 15.71 (0.06) 4.81 4.75 For the Year Ended March 31, 2012(a)
$ 20.39 (0.10) (b) 0.49 0.39 Investor Class
Net Asset Value, Beginning of Year Income/(Loss) from Investment Operations: Net Investment Loss Net Realized and Unrealized Gain on Investments Total from Investment Operations Less Distributions: Distributions (from capital gains) (1.81) – (0.35) (0.02) (0.07) Total Distributions (1.81) – (0.35) (0.02) (0.07) Net Asset Value, End of Year $ 26.49 $ 26.92 $ 21.87 $ 20.76 $ 20.39 Total Return(c) 5.60% 23.09% 7.24% 1.94% 30.30% Ratios/Supplemental Data: Net Assets, End of Year (000s) $ 23,163 $ 29,763 $ 25,404 $ 36,400 $ 23,484 Average Net Assets for the Year (000s) $ 28,207 $ 28,217 $ 25,883 $ 30,165 $ 12,678 Ratio of Expenses to Average Net Assets Excluding Fee Waivers and Reimbursements 1.28% (d) 1.27% (d) 1.41% (d) 1.63% (d)(e) 2.03% Ratio of Expenses to Average Net Assets Including Fee Waivers and Reimbursements 1.15% (d) 1.15% (d) 1.15% (d) 1.25% (d) 1.30% Ratio of Net Investment Loss to Average Net Assets (0.57%) (0.58%) (0.32%) (0.52%) (0.54%) Portfolio Turnover Rate 41% 16% 29% 18% 38% (a)
Prior to December 1, 2011 the Fund offered one class of shares, which was converted to Investor Shares on that date. (b)
Calculated using average shares method. (c)
Includes adjustments in accordance with accounting principles generally accepted in the United States of America and, consequently, the net
asset value for financial reporting purposes and the returns based upon those net asset values may differ from the net asset values and returns
for shareholder transactions. (d)
Includes 12b-1 Plan expenses, based upon the 12b-1 Plan adopted by the Fund on December 1, 2011. (e)
During the year ended March 31, 2012 the Fund had a contractual administrative agreement for a portion of the year with the previous
administrator in which the contractual fees were materially higher than the contractual fee arrangements with the current administrator. See Notes to Financial Statements.
Annual Report | March 31, 2015
31
The Brown Capital Management Mid-Cap Fund
Financial Highlights
For a share outstanding throughout the period presented.
For the Year Ended March 31, 2015
$ 27.11 (0.08) (b) 1.55 1.47 For the Year Ended March 31, 2014
$ 21.94 (0.08) (b) 5.25 5.17 For the Year Ended March 31, 2013
$ 20.77 (0.01) (b) 1.53 1.52 For the Period Ended March 31, 2012(a)
$ 17.52 (0.01) (b) 3.28 3.27 Institutional Class
Net Asset Value, Beginning of Period Income/(Loss) from Investment Operations: Net Investment Loss Net Realized and Unrealized Gain on Investments Total from Investment Operations Less Distributions: Distributions (from capital gains) (1.81) – (0.35) (0.02) Total Distributions (1.81) – (0.35) (0.02) Net Asset Value, End of Period $ 26.77 $ 27.11 $ 21.94 $ 20.77 Total Return(c) 5.90% 23.56% 7.53% 18.70% (d) Ratios/Supplemental Data: Net Assets, End of Period (000s) $ 56,385 $ 53,052 $ 39,017 $ 5,948 Average Net Assets for the Period (000s) $ 53,622 $ 45,629 $ 28,187 $ 1,884 Ratio of Expenses to Average Net Assets Excluding Fee 1.04% 1.02% 1.15% 1.42% (e)(f) Waivers and Reimbursements Ratio of Expenses to Average Net Assets Including Fee Waivers and Reimbursements 0.90% 0.90% 0.90% 0.90% (e) Ratio of Net Investment Loss to Average Net Assets (0.30%) (0.33%) (0.03%) (0.12%) (e) Portfolio Turnover Rate 41% 16% 29% 18% (d)(g) (a)
The Fund began offering Institutional Class Shares on December 15, 2011. (b)
Calculated using average shares method. (c)
Includes adjustments in accordance with accounting principles generally accepted in the United States of America and, consequently, the net
asset value for financial reporting purposes and the returns based upon those net asset values may differ from the net asset values and returns
for shareholder transactions. (d)
Not Annualized. (e)
Annualized. (f)
During the year ended March 31, 2012 the Fund had a contractual administrative agreement for a portion of the year with the previous
administrator in which the contractual fees were materially higher than the contractual fee arrangements with the current administrator. (g)
Portfolio turnover rate is calculated at the Fund level and represents the year ended March 31, 2012. See Notes to Financial Statements.
32
www.browncapital.com
The Brown Capital Management Mutual Funds
Notes to Financial Statements
March 31, 2015
1. ORGANIZATION AND SIGNIFICANT ACCOUNTING POLICIES The Brown Capital Management Small Company Fund (“Small Company Fund”), The Brown Capital Management International Equity Fund (“International Equity Fund”), and The Brown Capital Management Mid‐Cap Fund (“Mid‐Cap Fund”) (each a “Fund” and collectively the “Funds”) are each a series portfolio of The Brown Capital Management Mutual Funds (the “Trust”). The Trust is a Delaware statutory trust and is registered under the Investment Company Act of 1940 (the “1940 Act”), as amended, as an open‐ended management investment company. Each of the Funds in this report are classified as diversified management investment companies as defined in the 1940 Act. The primary investment objective of the Small Company Fund is to seek long‐term capital appreciation. Current income is a secondary consideration in selecting portfolio investments. The Small Company Fund seeks to achieve its investment objective principally through investments in equity securities of those companies with operating revenues of $250 million or less at the time of initial investment. Prior to December 1, 2011 the Fund offered one class of shares. On that date the share class of the Fund was converted to Investor Shares. On December 15, 2011 the Fund began to offer Institutional Shares. The primary investment objective of the International Equity Fund is to seek long‐term capital appreciation. Current income is a secondary consideration in selecting portfolio investments. The International Equity Fund seeks to achieve its investment objective by investing in equity securities of non‐U.S. based companies. Prior to December 1, 2011 the Fund offered one class of shares. On that date the share class of the Fund was converted to Investor Shares. On August 1, 2014 the Fund began to offer Institutional Shares. The primary investment objective of the Mid‐Cap Fund is to seek long‐term capital appreciation. Current income is a secondary consideration in selecting portfolio investments. The Mid‐Cap Fund seeks to achieve its investment objective by investing in a portfolio of equity securities of companies whose market capitalizations qualify them to be considered “mid‐cap” companies. The Fund’s investment advisor considers a company to be a “mid‐cap” company if it has, at the time of purchase by the Fund, a market capitalization within the range of market values of issuers included in the Russell Midcap® Growth Index. Prior to December 1, 2011 the Fund offered one class of shares. On that date the share class of the Fund was converted to Investor Shares. On December 15, 2011 the Fund began to offer Institutional Shares. Income, expenses (other than distribution and service fees, which were only attributable to the Investor Shares), and realized and unrealized gains or losses on investments and foreign currencies were allocated to each class of shares based upon its relative net assets. The following accounting policies have been consistently followed by the Funds and are in conformity with accounting principles generally accepted in the United States of America (“GAAP”). Investment Valuation The Funds’ investments in securities are carried at value. Securities listed on an exchange or quoted on a national market system are valued at the last sales price as of 4:00 p.m. Eastern Time. Securities that are principally traded on the National Association of Securities Dealers Automated Quotation (“NASDAQ”) exchange are generally valued at the NASDAQ Official Closing Price (“NOCP”). Other securities that are traded in the domestic over‐the‐counter market and listed securities for which last sales price is available, are generally valued at the last sales price as of the valuation time. In the absence of sales and NOCP, such securities are valued at the most recent bid price. Securities and assets for which representative market quotations are not readily available or which cannot be accurately valued using the Funds’ normal pricing procedures are valued at fair value as determined in good faith under policies approved by the Trust’s Board of Trustees. Fair value pricing may be used, for example, in situations where (i) a security, such as a small‐cap stock, mid‐cap stock, or foreign security, is so thinly traded that there have been no transactions for that stock over an extended period of time or the validity of a market quotation received is questionable; (ii) an event occurs after the close of the exchange on which a portfolio security is principally traded that is likely to have changed the value of the security prior to a Fund’s net asset value calculation; (iii) the exchange on which the security is principally traded closes early; or (iv) trading of the particular portfolio security is halted during the day and does not resume prior to a Fund’s net asset value calculation. A security’s “fair value” price may differ from the price next available for that security using the Funds’ normal pricing procedures. Instruments with maturities of 60 days or less are valued at amortized cost, which approximates market value. Fair Value Measurement In accordance with GAAP, the Funds use a three‐tier hierarchy to establish classification of fair value measurements for disclosure purposes. Inputs refer broadly to the assumptions that market participants would use in pricing the asset or liability, including assumptions about risk. Inputs may be observable or unobservable. Observable inputs are inputs that reflect the assumptions market participants would use in pricing the asset or liability that are developed based on market data obtained from sources independent of the reporting entity. Unobservable inputs are inputs that reflect the reporting entity’s own assumptions about the assumptions market participants would use in pricing the asset or liability that are developed based on the best information available. Annual Report | March 31, 2015
33
The Brown Capital Management Mutual Funds
Notes to Financial Statements
March 31, 2015
Various inputs are used in determining the value of the Funds’ investments. These inputs are summarized in the three broad levels listed below: Level 1 – Unadjusted quoted prices in active markets for identical, unrestricted assets or liabilities that a fund has the ability to access at the measurement date; Level 2 – Quoted prices which are not active, quoted prices for similar assets or liabilities in active markets or inputs other than quoted prices that are observable (either directly or indirectly) for substantially the full term of the asset or liability; and Level 3 – Significant unobservable prices or inputs (including the fund’s own assumptions in determining the fair value of investments) where there is little or no market activity for the asset or liability at the measurement date. The availability of observable inputs can vary from security to security and is affected by a wide variety of factors, including, for example, the type of security, whether the security is new and not yet established in the marketplace, the liquidity of markets, and other characteristics particular to the security. To the extent that valuation is based on models or inputs that are less observable or unobservable in the market, the determination of fair value requires more judgment. Accordingly, the degree of judgment exercised in determining fair value is greatest for instruments categorized in Level 3. An investment’s level within the fair value hierarchy is based on the lowest level input, individually or in the aggregate, that is significant to fair value measurement. The valuation techniques used by the Funds to measure fair value during the year ended March 31, 2015 maximized the use of observable inputs and minimized the use of unobservable inputs. The inputs or methodology used for valuing securities are not necessarily an indication of the risk or liquidity associated with investing in those securities. The following is a summary of the inputs used in valuing the Funds’ assets as of March 31, 2015: Small Company Fund: Investments in Securities at Value*
Common Stocks Short Term Investments Total Valuation Inputs
Level 1
Level 2
$ 2,672,700,071 $ – $ 60,276,792 – $ 2,732,976,863 $ – $ Level 3
Total
– $ 2,672,700,071
– 60,276,792
– $ 2,732,976,863
International Equity Fund: Investments in Securities at Value*
Common Stocks Short Term Investments Total $ $ Valuation Inputs
Level 1
Level 2
14,301,565 $ – $ 596,210 – 14,897,775 $ – $ $ $ Valuation Inputs
Level 1
Level 2
78,136,010 $ – $ 235,607 – 78,371,617 $ – $ Level 3
– $ – – $ Total
14,301,565
596,210
14,897,775
– $ – – $ Total
78,136,010
235,607
78,371,617
Mid‐Cap Fund: Investments in Securities at Value*
Common Stocks Short Term Investments Total Level 3
* See Schedule of Investments for industry/country classifications It is the Funds’ policy to recognize transfers into and out of all levels at the end of the reporting period. There were no transfers among Levels 1, 2, and 3 during the year. 34
www.browncapital.com
The Brown Capital Management Mutual Funds
Notes to Financial Statements
March 31, 2015
The following is a reconciliation of the investments in which significant unobservable inputs (Level 3) were used in determining fair value: The Brown Capital Management International Equity Fund Investments
in Securities
at Value
Common Stocks TOTAL Balance as
of March 31,
2014
Realized
gain/(loss)
$24,109 $24,109 $(99,303) $(99,303) Change in unrealized
appreciation/(depreciation) Sales Proceeds
$76,765 $76,765 $(1,571) $(1,571) Net change in unrealized
appreciation/(depreciation)
included in the Statements of
Operations attributable to Level
Balance as of
3 investments held at
March 31, 2015
Purchases March 31, 2015
$– $– $– $– $– $– For the other Funds there were no securities classified as Level 3 securities during the period, thus, a reconciliation of assets in which significant unobservable inputs (Level 3) were used are not applicable for these Funds. Foreign Currency Translation (International Equity Fund) Portfolio securities and other assets and liabilities denominated in foreign currencies are translated into U.S. dollars based on the exchange rate of such currencies against U.S. dollars on the date of valuation. Purchases and sales of securities and income items denominated in foreign currencies are translated into U.S. dollars at the exchange rate in effect on the transaction date. The Fund does not separately report the effect of changes in foreign exchange rates from changes in market prices on securities held. Such changes are included in net realized and unrealized gain or loss from investments. Realized foreign exchange gains or losses arise from sales of foreign currencies, currency gains or losses realized between the trade and settlement dates on securities transactions and the difference between the recorded amounts of dividends, interest, and foreign taxes withheld, and the U.S. dollar equivalent of the amounts actually received or paid. Net unrealized foreign exchange gains and losses arise from changes in foreign exchange rates on foreign denominated assets and liabilities other than investments in securities held at the end of the reporting period. Affiliated Companies If a fund owns 5% or more of the outstanding voting securities, either directly or indirectly, of a particular issuer, the 1940 Act deems such an issuer to be an “affiliate” of the fund. As of and during the year ended March 31, 2015, the Small Company Fund owned 5% or more of the outstanding voting securities of the issuers identified in the table below and therefore those issuers are affiliates of that Fund for purposes of the 1940 Act. Realized
Share Balance at Market Value at
Share Balance
Gains
Sales
March 31, 2015
Security Name
at April 1, 2014
Purchases
March 31, 2015 Dividends
(Losses)
Abaxis Inc. 1,833,580 3,533 – 1,837,113 $117,777,314 $733,432 $ – (a)
Accelrys, Inc. 3,084,414 – 3,084,414 – – – 16,561,036 American Software Inc. (Cl A) 1,931,654 3,722 – 1,935,376 19,779,543 772,662 – Balchem Corp. 1,606,959 3,096 – 1,610,055 89,164,846 482,088 – Blackbaud Inc. 2,603,126 5,016 – 2,608,142 123,573,768 1,249,500 – Cantel Medical Corp. 3,035,101 5,622 117,574 2,923,149 138,849,578 282,456 2,493,407 Diodes Inc. 2,645,595 5,098 – 2,650,693 75,703,792 – – Dynamic Materials Corp. 966,278 1,862 – 968,140 12,363,148 154,679 – Geospace Technologies Corp. 999,964 775,447 999,964 775,447 12,802,630 – (39,037,840) Hittite Microwave Corp.(a) 1,583,705 – 1,583,705 – – 237,556 32,506,648 Measurement Specialties, Inc.(a) 1,100,177 – 1,100,177 – – – 81,032,098 Meridian Bioscience Inc. 2,263,554 4,362 – 2,267,916 43,271,837 1,810,843 – Neogen Corp. 2,315,670 4,462 – 2,320,132 108,419,768 – – Netscout Systems Inc. 3,399,114 5,355 620,013 2,784,456 122,098,396 – 9,373,207 NIC Inc. 4,542,371 73,077 – 4,615,448 81,554,966 1,552,629 – PROS Holdings 2,101,504 4,049 – 2,105,553 52,028,215 – – Quidel Corp. 2,076,143 594,551 – 2,670,694 72,055,324 – – Annual Report | March 31, 2015
35
The Brown Capital Management Mutual Funds
Notes to Financial Statements
March 31, 2015
Security Name
Share Balance
at April 1, 2014
Purchases
Share Balance at
March 31, 2015
Sales
Sun Hydraulics Corp. 2,292,696 4,418 – Vocera Communications Inc. 2,184,924 1,972,274 2,451,680 42,566,529 3,465,944 9,957,527 TOTAL (a)
Market Value at
March 31, 2015
Dividends
2,297,114 $ 95,008,635 $ 3,325,204 $ 1,705,518 16,918,738 – 36,074,946 $ 1,181,370,498 $10,601,049 $ Realized
Gains
(Losses)
– (31,877,436) 71,051,120 As of March 31, 2015 no longer an affiliate.
Investment Transactions and Investment Income Investment transactions are accounted for as of the date purchased or sold (trade date). Dividend income is recorded on the ex–dividend date. Certain dividends from foreign securities will be recorded as soon as the Trust is informed of the dividend if such information is obtained subsequent to the ex–dividend date. Interest income is recorded on the accrual basis and includes amortization of discounts and premiums. Gains and losses are determined on the high cost basis, which is the same basis used for federal income tax purposes. Expenses Each Fund bears expenses incurred specifically on its behalf, as well as a portion of general Trust expenses, which are allocated according to methods reviewed annually by the Trustees. Class specific expenses are charged directly to the class incurring the expense. Common expenses, which are not attributable to a specific class, are allocated daily to each class of shares based upon its proportionate share of total net assets of the Fund. Expenses not directly billed to a particular Fund are allocated proportionally among all Funds daily in relation to net assets of each Fund or another reasonable measurement. Fees provided under the distribution (Rule 12b‐1) and/or shareholder service plans for a particular class of the Funds’ are charged to the operations of such class. Dividend Distributions Each of the Funds may declare and distribute dividends from net investment income (if any) at least annually. Distributions from capital gains (if any) are generally declared and distributed annually. Dividends and distributions to shareholders are recorded on ex–date. Income and capital gain distributions are determined in accordance with income tax regulations which may differ from GAAP. Estimates The preparation of financial statements in conformity with GAAP requires management to make estimates and assumptions that affect the reported amounts of assets and liabilities and disclosure of contingent assets and liabilities at the date of the financial statements and the reported amounts of increases and decreases in the net assets from operations during the reported period. Actual results could differ from those estimates. Management believes the estimates and security valuations are appropriate; however, actual results may differ from those estimates, and the security valuations reflected in the financial statements may differ from the value the Funds ultimately realize upon sale of the securities. Federal Income Taxes No provision for income taxes is included in the accompanying financial statements, as each Fund intends to distribute to shareholders all taxable investment income and realized gains and otherwise comply with Subchapter M of the Internal Revenue Code of 1986, as amended, applicable to regulated investment companies. Fees on Redemptions The redemption fee is not a fee to finance sales or sales promotion expense, but is paid to the Funds to defray the costs of liquidating an investor and discouraging short term trading of the Funds’ shares. No redemption fee will be imposed on redemptions initiated by the Funds. During the year ended March 31, 2015, the International Equity Fund had redemption fees of $486. 36
www.browncapital.com
The Brown Capital Management Mutual Funds
Notes to Financial Statements
March 31, 2015
2. TRANSACTIONS WITH RELATED PARTIES AND OTHER SERVICE PROVIDERS Advisor Each Fund pays a monthly advisory fee to Brown Capital Management, LLC (the “Advisor”) based upon the average daily net assets of each Fund and is calculated at the following annual rates: Advisory Fees
Expense
Expense
Limitation Ratio
Limitation Ratio
Advisory
Investor Class
Fees Waived
Fund
Average Net Assets
Rate Institutional Class
Expenses Reimbursed
Small Company Fund On all assets 1.00% 1.25% 1.45% $ – $ – International Equity Fund(a) First $100 million 0.90% 1.00% 1.25% Over $100 million 0.75% 113,656 65,502 Mid‐Cap Fund On all assets 0.75% 0.90% 1.15% 112,214 – (a)
Effective June 30, 2014, the International Equity Fund pays a management fee of 0.90% on assets up to $100 million and 0.75% on assets over
$100 million. Prior to that time, the management fee was 1.00% on assets up to $100 million and 0.75% on assets over $100 million.
In the interest of limiting expenses of the Funds, the Advisor has entered into expense limitation agreements with the Trust, with respect to each of the Funds (“Expense Limitation Agreements”), pursuant to which the Advisor has agreed to waive or limit its fees and to assume other expenses so that the total annual operating expenses of the Funds (other than interest, taxes, brokerage commissions, acquired fund fees and expenses, other expenditures which are capitalized in accordance with generally accepted accounting principles, other extraordinary expenses not incurred in the ordinary course of each Fund’s business, and amounts, if any, payable under a Rule 12b–1 distribution plan) do not exceed certain limits, which are (at the time this report is being produced) for the Small Company Fund, the International Equity Fund and the Mid–Cap Fund, 1.25%, 1.00% and 0.90% of the average daily net assets of those Funds, respectively. Each of the Funds may, at a later date, reimburse the Advisor the management fees waived or limited and other expenses assumed and paid by the Advisor pursuant to the Expense Limitation Agreements during any of the previous three (3) fiscal years, provided that the particular Fund has reached a sufficient asset size to permit such reimbursement to be made without causing the total annual expense ratio of the particular Fund to exceed the percentage limits as described above. Consequently, no reimbursement by any of the Funds will be made unless: (i) the particular Fund’s assets exceed $20 million for the Small Company Fund and the International Equity Fund or $15 million for the Mid–Cap Fund; (ii) the particular Fund’s total annual expense ratio is less than the percentage described above; and (iii) the payment of such reimbursement has been approved by the Trustees on a quarterly basis. Fund
Expires March 31, 2016 Expires March 31, 2017 Expires March 31, 2018
International Equity Fund $ 109,688
$ 102,451 179,158 $ Mid‐Cap Fund 137,539
87,360 112,214 Administrator ALPS Fund Services, Inc. (“ALPS” and the “Administrator”) serves as the Trust’s administrator pursuant to an Administration, Bookkeeping and Pricing Services Agreement (“Administration Agreement”) with the Trust. As compensation for its services to the Trust, ALPS receives an annual administration fee. Compliance Services Watermark Solutions, LLC serves as the Trust’s Chief Compliance Officer pursuant to an agreement with the Trust. As compensation for its services to the Trust, Watermark Solutions, LLC receives an annual compliance services fee. ALPS provides services which assist the Trust’s Chief Compliance Officer in monitoring and testing the policies and procedures of the Trust in conjunction with requirements under Rule 38a–1 under the 1940 Act. ALPS is compensated under the Administration Agreement for these services. Transfer Agent ALPS serves as transfer, dividend paying, and shareholder servicing agent for the Funds pursuant to a Transfer Agency and Services Agreement. ALPS is compensated under this agreement for these services. Distributor ALPS Distributors, Inc. (the “Distributor”) serves as the Funds’ distributor. The Distributor acts as the principal underwriter of the Trust’s shares. Annual Report | March 31, 2015
37
The Brown Capital Management Mutual Funds
Notes to Financial Statements
March 31, 2015
12b‐1 Plan Each Fund has adopted, with respect to its Investor Class shares, a plan pursuant to Rule 12b‐1 under the 1940 Act (collectively, the “Plans”) under which each Fund may incur expenses related to distribution of its shares and for services provided to shareholders. Payments under a Plan are made to the Distributor, which uses them to pay distribution and shareholder service expenses on behalf of and as agent of the Fund. The amount payable by the Mid‐Cap Fund and the International Equity Fund under the Plan is 0.25% of average daily net assets for the year and 0.20% of average daily net assets for the Small Company Fund. The Plans are compensation plans, which means that payments are made to the Distributor regardless of 12b‐1 expenses actually incurred. Therefore, payments under a Plan may exceed distribution and shareholder service expenses incurred pursuant to the Plan, and the Distributor is permitted to return the excess to the Advisor. It is also possible that 12b‐1 expenses paid by the Advisor for a period will exceed the payments received by the Funds, in which case the Advisor may pay such excess expenses out of its own resources. The Plans require that the Distributor act in the Funds’ best interests in expending the payments it receives from the Funds and use payments solely for the purpose of paying distribution expenses on behalf of the Funds. The Funds’ Distributor verifies all payment amounts to be made to brokers that have properly executed dealer agreements with the Funds before such payments are made. Legal Counsel to the Trust The Law Offices of John H. Lively and Associates, Inc., a member firm of the 1940 Act Law GroupTM, serves as legal counsel to the Trust. John H. Lively, Secretary of the Trust, is the owner of The Law Offices of John H. Lively & Associates, Inc., but he receives no direct compensation from the Trust or the Funds for serving as an officer of the Trust. Certain Trustees and officers of the Trust are also employees and/or officers of the Advisor. 3. PURCHASES AND SALES OF INVESTMENT SECURITIES For the year ended March 31, 2015, the aggregate cost of purchases and proceeds from sales of investment securities, excluding short–term securities, are shown in the following table. Fund
Purchases of Securities
Proceeds From Sales of Securities
Small Company Fund $ 284,979,226
$ 598,381,140 International Equity Fund 8,227,486
1,413,281 Mid‐Cap Fund 32,803,703
41,465,704 4. FEDERAL INCOME TAX Distributions are determined in accordance with Federal income tax regulations, which may differ from GAAP, and, therefore, may differ significantly in amount or character from net investment income and realized gains for financial reporting purposes. Financial reporting records are adjusted for permanent book/tax differences to reflect tax character but are not adjusted for temporary differences. The Funds recognize the tax benefit or expenses of uncertain tax positions only when the position is “more likely than not” to be sustained assuming examination by tax authorities. Management reviewed the tax positions in the open tax years of 2012–2014 and as of and during the year ended March 31, 2015, and determined that the Funds do not have a liability for uncertain tax positions. The Funds recognize interest and penalties, if any, related to unrecognized tax benefits as income tax expense in the Statements of Operations. During the period, the Funds did not incur any interest or penalties. Reclassifications to paid‐in capital relate primarily to differing book/tax treatment of ordinary net investment losses net of short‐term capital gains. For the fiscal year ended March 31, 2015, the following reclassifications, which had no impact on results of operations or net assets, were recorded to reflect tax character: Increase/(Decrease)
Accumulated Net
Paid-in Capital
Net Investment Income Realized Gain/(Loss)
Small Company Fund $ (3,784,764)
$ 16,098,508 $ (12,313,744) International Equity Fund – (5,428) 5,428 Mid‐Cap Fund –
415,699 (415,699)
Included in the amounts reclassified to paid‐in capital was a net operating loss of $3,784,764 for Small Company Fund. 38
www.browncapital.com
The Brown Capital Management Mutual Funds
Notes to Financial Statements
March 31, 2015
At March 31, 2015, the tax–basis cost of investments were as follows: Gross unrealized appreciation (excess of value over tax cost) Gross unrealized depreciation (excess of tax cost over value) Net appreciation (depreciation) of foreign currency and derivatives Net unrealized appreciation Cost of investments for income tax purposes At March 31, 2015, the tax–basis components of net assets were as follows: Undistributed Ordinary Income Accumulated Capital Gain/(Losses) Unrealized Appreciation Other Cumulative Effect of Timing Differences Total Small Company Fund
$ 1,343,017,294
(79,906,224)
– $ 1,263,111,070
$ 1,469,865,793
Small Company Fund
$ – $
113,480,646
1,263,111,070
(5,565,374)
$ 1,371,026,342
$
International Equity
Fund
$ 3,559,530 $
(857,993) (2,944) $ 2,698,593 $
$ 12,196,238 $
International Equity
Fund
10,985 (2,096,152) 2,698,593 – 613,426 Mid-Cap Fund
24,800,137
(1,236,000)
– 23,564,137
54,807,480
Mid-Cap Fund
$
$
– 1,803,829
23,564,137
–
25,367,966
The difference between book–basis and tax–basis net unrealized appreciation (depreciation) is attributable to the deferral of losses from wash sales and mark to market treatment of passive foreign investment companies. Pursuant to federal income tax regulations applicable to investment companies, recognition of capital and ordinary losses on certain transactions is deferred until the subsequent tax year. As of March 31, 2015, there were no post‐October capital loss deferrals on any of the Brown Capital Funds. Small Company Fund, International Equity Fund and Mid‐Cap Fund, elect to defer to the period ending March 31, 2015, late year ordinary losses in the amounts of $5,565,374, $0, and $0, respectively. Capital Loss Carryforwards – Under the Regulated Investment Company Modernization Act of 2010 (“the Modernization Act”), net capital losses recognized in tax years beginning after December 22, 2010 may be carried forward indefinitely, and the character of the losses is retained as short‐term and/or long‐term. Under the law in effect prior to the Modernization Act, net capital losses were carried forward for eight years and treated as short‐term. As a transition rule, the Modernization Act requires that post‐enactment net capital losses be used before pre‐enactment net capital losses. Additionally, post‐enactment capital losses that are carried forward will retain their character as either short‐term or long‐term losses rather than being considered all short‐term as under previous law. Accumulated capital losses noted below represent pre‐enactment net capital loss carryforwards, as of March 31, 2015, that may be available to offset future realized capital gains and thereby reduce future taxable gains distributions. The following table shows the expiration dates of the pre‐enactment carryovers. Expiring in 2017
Expiring in 2018
Small Company Fund $ – $ – International Equity Fund 1,235,307 806,096 Mid‐Cap Fund – – Brown Capital Management International Equity Fund used capital loss carryovers in the amount of $279,526 during the period ended March 31, 2015. Brown Capital Management International Equity Fund had post‐enactment capital losses for long‐term in the amount of $54,749. Distributions during the fiscal year shown were characterized for tax purposes as follows: Small Company Fund
International Equity Fund
Mid-Cap Fund
Distributions Paid From:
2015
2014
2015
2014
2015
2014
Ordinary Income $ – $ 5,124,126
$ $ – 39,156 $ 99,270 $ 1,272,256
Long‐term capital gains 135,692,028
40,941,362
– – 4,188,031
– Total $ 135,692,028
$ 46,065,488
$ $ – 39,156 $ 99,270 $ 5,460,287
Annual Report | March 31, 2015
39
The Brown Capital Management Mutual Funds
Notes to Financial Statements
March 31, 2015
5. COMMITMENTS AND CONTINGENCIES Under the Funds’ organizational documents, their Officers and Trustees are indemnified against certain liabilities arising out of the performance of their duties to the Funds. In addition, in the normal course of business, the Funds enter into contracts with their vendors and others that provide for general indemnifications. The Funds’ maximum exposure under these arrangements is unknown, as this would involve future claims that may be made against the Funds. The Funds expect the risk of loss to be remote. 6. TRUSTEE AND OFFICER FEES Officers of the Trust, except the Chief Compliance Officer, Officers and Trustees who are interested persons of the Trust, will receive no salary or fees from the Funds for their services to the Trust. As of December 19, 2014, there were four Trustees, three of whom are not “interested persons” of the Trust within the meaning of that term under the 1940 Act (each, an “Independent Trustee”). Effective December 19, 2014, each Independent Trustee of the Trust receives a $29,000 annual retainer and a $1,500 per meeting fee. Prior to December 19, 2014, each Independent Trustee of the Trust received a $16,000 annual retainer and a $1,500 per meeting fee. All Trustees and officers are reimbursed for any out‐of‐pocket expenses incurred in connection with attendance at meetings. 7. SUBSEQUENT EVENTS The Funds evaluated subsequent events from March 31, 2015, the date of these financial statements, through the date these financial statements were issued and available. There were no subsequent events to report that would have a material impact on the Funds’ financial statements. 40
www.browncapital.com
The Brown Capital Management Mutual Funds
Report of Independent Registered Public Accounting Firm
To the Board of Trustees of Brown Capital Management Mutual Funds and the Shareholders of The Brown Capital Management Small Company Fund, The Brown Capital Management International Equity Fund, and The Brown Capital Management Mid‐Cap Fund We have audited the accompanying statements of assets and liabilities of The Brown Capital Management Small Company Fund, The Brown Capital Management International Equity Fund, and The Brown Capital Management Mid‐Cap Fund (the "Funds"), each a series of shares of beneficial interest in the Brown Capital Management Mutual Funds, including the schedules of investments, as of March 31, 2015, and the related statements of operations for the year then ended, the statements of changes in net assets for each of the years in the two‐year period then ended and the financial highlights for each of the years or periods in the five‐year period then ended. These financial statements and financial highlights are the responsibility of the Funds' management. Our responsibility is to express an opinion on these financial statements and financial highlights based on our audits. We conducted our audits in accordance with the standards of the Public Company Accounting Oversight Board (United States). Those standards require that we plan and perform the audits to obtain reasonable assurance about whether the financial statements and financial highlights are free of material misstatement. An audit includes examining, on a test basis, evidence supporting the amounts and disclosures in the financial statements. Our procedures included confirmation of securities owned as of March 31, 2015 by correspondence with the custodian and brokers. An audit also includes assessing the accounting principles used and significant estimates made by management, as well as evaluating the overall financial statement presentation. We believe that our audits provide a reasonable basis for our opinion. In our opinion, the financial statements and financial highlights referred to above present fairly, in all material respects, the financial position of The Brown Capital Management Small Company Fund, The Brown Capital Management International Equity Fund, and The Brown Capital Management Mid‐Cap Fund as of March 31, 2015, and the results of their operations for the year then ended, the changes in their net assets for each of the years in the two‐year period then ended and their financial highlights for each of the years or periods in the five‐year period then ended, in conformity with accounting principles generally accepted in the United States of America. BBD, LLP Philadelphia, Pennsylvania May 27, 2015 Annual Report | March 31, 2015
41
The Brown Capital Management Mutual Funds
Fund Expenses
March 31, 2015 (Unaudited)
As a shareholder of the Funds, you incur ongoing costs, including management fees and other fund expenses. This example is intended to help you understand your ongoing costs (in dollars) of investing in each Fund and to compare these costs with the ongoing costs of investing in other mutual funds. The example is based on an investment of $1,000 invested at the beginning of the period and held for the entire period as indicated below. Actual Expenses – The first line of the table below provides information about the actual account values and actual expenses. You may use the information in this line, together with the amount you invested, to estimate the expenses that you paid over the period. Simply divide your account value by $1,000 (for example, an $8,600 account value divided by $1,000 = 8.6), then multiply the result by the number in the first line under the heading entitled “Expenses Paid During Period” to estimate the expenses you paid on your account during this period. Hypothetical Example for Comparison Purposes – The second line of the table below provides information about hypothetical account values and hypothetical expenses based on each Fund’s actual expense ratio and an assumed annual rate of return of 5% before expenses, which is not each Fund’s actual return. The hypothetical account values and expenses may not be used to estimate the actual ending account balance or expenses you paid for the period. You may use this information to compare the ongoing costs of investing in each Fund and other funds by comparing these 5% hypothetical examples with the 5% hypothetical examples that appear in the shareholder reports of other funds. Expenses Paid During Ending Beginning Period Expense Account Value Account Value October 1, 2014 to
Ratio(a)
March 31, 2015(b)
March 31, 2015
October 1, 2014
Small Company Fund Investor Actual $ 1,141.20 1.26% 6.73 $ 1,000.00 $ Hypothetical (5% return before expenses) $
1,000.00
$
1,018.65
1.26% $
6.34 Institutional Actual $ 1,142.30 1.05% 5.66 $ 1,000.00 $ Hypothetical (5% return before expenses) $ 1,019.65 1.05% 5.34 $ 1,000.00 $ International Equity Fund Investor Actual $ 1,036.10 1.25% 6.35 $ 1,000.00 $ Hypothetical (5% return before expenses) $
1,000.00
$
1,018.70
1.25% $
6.29 Institutional 1.00% 5.08 Actual $ 1,038.40 $ $ 1,000.00 Hypothetical (5% return before expenses) $ 1,019.95 1.00% 5.04 $ 1,000.00 $ Mid‐Cap Fund Investor Actual $ 1,083.00 1.15% 5.97 $ 1,000.00 $ Hypothetical (5% return before expenses) $
1,000.00
$
1,019.20
1.15% $
5.79
Institutional Actual $ 1,084.20 0.90% 4.68 $ 1,000.00 $ Hypothetical (5% return before expenses) $ 1,020.44 0.90% 4.53 $ 1,000.00 $ (a)
Annualized, based on the Fund's most recent fiscal half-year expenses. (b)
Expenses are equal to the Fund's annualized expense ratio multiplied by the average account value over the period, multiplied by the number of
days in the most recent fiscal half-year (182), divided by 365. 42
www.browncapital.com
The Brown Capital Management Mutual Funds
Additional Information
March 31, 2015 (Unaudited)
1. PROXY VOTING POLICIES AND VOTING RECORD A copy of the Trust’s Proxy Voting and Disclosure Policy and the Advisor’s Proxy Voting and Disclosure Policy are included as Appendix A to the Funds’ Statement of Additional Information and are available, (1) without charge, upon request, by calling 1–800–773–3863 and (2) on the SEC’s website at http://ww.sec.gov. Information regarding how the Funds voted proxies relating to portfolio securities during the most recent 12–month period ended June 30 are available (1) without charge, upon request, by calling the Funds at the number above and (2) on the SEC’s website at http://www.sec.gov. 2. QUARTERLY PORTFOLIO HOLDINGS The Funds file their complete schedule of portfolio holdings with the SEC for the first and third quarters of each fiscal year on Form N–Q. The Funds’ Forms N–Q are available on the SEC’s website at http://www.sec.gov. You may review and make copies at the SEC’s Public Reference Room in Washington, D.C. Additionally, you may obtain copies of the Funds’ form N–Q by calling the Funds at 1–800–773–3863. Information on the operation of the Public Reference Room may be obtained by calling the SEC at 1–800–SEC–0330, (1–800–732–0330). 3. BOARD CONSIDERATIONS IN APPROVING THE RENEWAL OF THE ADVISORY AGREEMENT Brown Capital Management, LLC (“BCM” or “Advisor”) supervises the investments of The Brown Capital Management Small Company Fund, The Brown Capital Management International Equity Fund, and The Brown Capital Management Mid‐Cap Fund pursuant to an Investment Advisory Agreement (“Agreement”) between BCM and the Trust. At a meeting of the Trust’s Board of Trustees held on March 23, 2015, the Trustees unanimously approved the continuation of the Agreement. Counsel reviewed with the Board a memorandum from Counsel dated March 2, 2015 and addressed to the Trustees that summarized, among other things, the fiduciary duties and responsibilities of the Board in reviewing and approving the continuation of the Agreement for the Funds. Counsel discussed with the Independent Trustees the types of information and factors that should be considered by the Board in order to make an informed decision regarding the approval of the continuation of the Agreement. In deciding whether to approve the continuation of the Agreement between the Trust and BCM, with respect to the Small Company Fund, the International Equity Fund, and the Mid‐Cap Fund, the Trustees considered numerous factors, including: (i) the nature, extent, and quality of the services provided by BCM; (ii) the investment performance of the Funds and BCM; (iii) the costs of the services to be provided and profits to be realized by BCM from the relationship with the Funds; (iv) the extent to which economies of scale would be realized as the Funds grow and whether advisory fee levels reflect those economies of scale for the benefit of the Funds’ investors; (v) BCM’s practices regarding brokerage and portfolio transactions; and (vi) BCM’s practices regarding possible conflicts of interest. In assessing these factors and reaching its decisions, the Board took into consideration information furnished for the Board’s review and consideration throughout the year at regular Board meetings, as well as information specifically prepared and/or presented in connection with the annual renewal process, including information presented at the Meeting. The Board requested and was provided with information and reports relevant to the annual renewal of the Agreement, including: (i) reports regarding the services and support provided to the Funds and their shareholders by the Advisor; (ii) assessments of the investment performance of the Fund by personnel of the Advisor; (iii) commentary on the reasons for the performance; (iv) presentations addressing the Advisor’s investment philosophy, investment strategy, personnel and operations; (v) compliance and audit reports concerning the Funds and the Advisor; (vi) disclosure information contained in the registration statement of the Trust and the Form ADV of the Advisor; (vii) information on relevant developments in the mutual fund industry and how the Funds and/or the Advisor are responding to them; and (viii) a memorandum from Counsel that summarized the fiduciary duties and responsibilities of the Board in reviewing and approving the Agreement, including the material factors set forth above and the types of information included in each factor that should be considered by the Board in order to make an informed decision. The Board also requested and received various informational materials including, without limitation: (i) documents containing information about the Advisor, including financial information, a description of personnel and the services provided to the Funds, information on investment advice, performance, summaries of Fund expenses, compliance program, current legal matters, and other general information; (ii) comparative expense and performance information for other mutual funds with strategies similar to the Funds that was prepared by the Advisor and obtained from an independent third party ranking organization; (iii) the anticipated effect of size on the Funds’ performance and expenses; and (iv) benefits to be realized by the Advisor from its relationship with the Funds. The Board did not identify any particular information that was most relevant to its consideration to approve the Agreement and each Trustee may have afforded different weight to the various factors. Counsel noted that the continuation of the Agreement was discussed at a pre‐meeting of the Board held on March 17, 2015. Counsel and the Board recapped the discussions that had occurred in that earlier meeting. Nature, Extent and Quality of the Services Provided by the Advisor In considering the nature, extent, and quality of the services provided by the Advisor, the Trustees reviewed the responsibilities of the Advisor under the Agreement. The Trustees reviewed the services currently being provided by the Advisor to the Funds including, without limitation, the quality of its investment advisory services since each Fund’s commencement of operations (including research and recommendations with respect to portfolio securities); its procedures for formulating investment decisions and assuring compliance with each Fund’s investment objectives and limitations; and its efforts to promote the Funds and grow the Funds’ assets. The Trustees noted that certain employees of the Advisor served as Annual Report | March 31, 2015
43
The Brown Capital Management Mutual Funds
Additional Information
March 31, 2015 (Unaudited)
officers of the Trust, including as a principal executive officer and principal financial officer, without additional compensation. The Trustees considered the coordination of services for the Funds among the Advisor and the service providers and the Independent Trustees. The Trustees noted the quality of the Advisor’s personnel and the commitment to enhance its resources and systems; and the continued cooperation with the Independent Trustees and Counsel for the Funds. The Trustees evaluated the Advisor’s personnel, including the education and experience of its personnel. The Trustees noted the diligent and extensive process the Advisor conducts when selecting new employees, and particularly those that will serve on the portfolio management team. After reviewing the foregoing information and further information in the materials provided by the Advisor (including the Advisor’s Form ADV), the Board concluded that, in light of all the facts and circumstances, the nature, extent, and quality of the services provided by the Advisor were satisfactory and adequate for the Funds. Investment Performance of the Funds and the Advisor In considering the investment performance of the Funds and the Advisor, the Trustees compared the short and long‐term performance of each Fund with the performance of its benchmark index, or indices, as applicable, comparable funds with similar objectives and size managed by other investment advisors, and comparable peer group indices (e.g., Morningstar category averages). The Trustees also considered the consistency of the Advisor’s management of each Fund with its investment objective and policies. The Trustees observed that the Small Company Fund generally performed comparably to its peers during the short‐term and outperformed during longer‐term periods, and that it slightly underperformed the indices for the short‐term but outperformed for the longer‐term. The Trustees observed that the Mid‐Cap Fund underperformed its index for the quarter, 1, 3 and 5‐year periods and outperformed for the 10‐year period and generally underperformed its peers for all other periods observed except for the most recent year and the 10‐year period. The Trustees observed that the International Equity Fund had outperformed its peers for the 1, 3 and 5‐year periods and closely tracked its peers for the 10‐year period. The International Equity Fund outperformed its indices for the shorter‐term periods but not for the longer term and since inception periods. The Trustees noted that the performance of the Funds was generally lower than the performance of the composites representing separate accounts managed by the Advisor having the substantially similar strategies as the respective Funds although the Trustees noted the Advisor’s representation that the differences could be attributed to cash flows. Although not the determining factor in the Trustees’ considerations, this information assisted the Trustees in concluding to approve the Agreement by allowing them to measure how the Fund compares to other similar products and the markets generally. Generally, the performance data from the Peer Group was for periods ending December 31, 2014. After reviewing the investment performance of the Funds further, the Advisor’s experience managing the Funds and other advisory accounts, the Advisor’s historical investment performance, and other factors, the Board of Trustees concluded, in light of all the facts and circumstances, that the investment performance of each Fund and the Advisor was satisfactory. Costs of the Services to be Provided and Profits to be Realized by the Advisor In considering the costs of the services to be provided and profits to be realized by the Advisor from its relationship with the Funds, the Trustees considered the Advisor’s staffing, personnel, and methods of operating the Advisor’s compliance policies and procedures; the financial condition of the Advisor and the level of commitment to the Funds by the Advisor; the asset levels of the Funds; the overall expenses of the Funds in light of the expense limitation arrangements with the Advisor; and the nature and frequency of advisory fee payments. The Trustees reviewed the financial statements for the Advisor and considered the financial stability and profitability of the firm. The Trustees also considered potential benefits for the Advisor in managing the Funds, including the ability for the Advisor to place small accounts into the Funds. The Trustees then compared the fees and expenses of each Fund (including the management fee) to other funds comparable in terms of the type of fund, the nature of its investment strategy, its style of investment management, and its size, among other factors. With respect to the Small Company Fund, the Trustees determined that the management fee was higher than the category average, but the overall net expense ratio was below the category average. The Trustees expressed the view that the level of the expense ratio of the Small Company Fund was a reflection of the Advisor’s historical efforts to grow the Fund, as well as to manage the Fund in a manner that made it an attractive investment option. With respect to the Mid‐Cap Fund, the Trustees determined that the management fee and net expense ratio were generally comparable with the category average. With respect to the International Equity Fund, the Trustees determined that the management fee was higher than the category average, but not the highest in the category and the net expense ratio was below the category average. Although not the determining factor in the Trustees’ considerations, this information assisted the Trustees in concluding to approve the Agreement by allowing them to observe how the Funds compare to other similar products. The Trustees also considered the management fees of the Funds compared to the management fees paid by the Advisor to manage separate accounts with substantially similar strategies. Following this comparison and upon further consideration and discussion of the foregoing, the Board of Trustees concluded, in light of all the facts and circumstances, that the fees to be paid to the Advisor by each Fund were fair and reasonable in relation to the nature and quality of the services provided by the Advisor and that they reflected charges that were within a range of what could have been negotiated at arm’s length. Economies of Scale In considering the extent to which economies of scale would be realized as the Funds grow and whether advisory fee levels reflect those economies of scale for the benefit of the Funds’ investors, the Trustees considered that each Fund’s fee arrangements with the Advisor involved both the 44
www.browncapital.com
The Brown Capital Management Mutual Funds
Additional Information
March 31, 2015 (Unaudited)
management fee and an expense limitation arrangement. For each of the Small Company Fund and the Mid‐Cap Fund, the Trustees considered that, while the management fee would remain the same at all asset levels, the Fund’s shareholders benefited from economies of scale under the Funds’ agreements with service providers other than the Advisor. As a result, the Trustees concluded that the advisory fee of the Small Company Fund and the Mid‐Cap Fund did not reflect economies of scale. For the International Equity Fund, the Trustees noted that the Fund utilizes breakpoints in its advisory fee schedule and determined that the Fund’s shareholders would benefit from economies of scale as the Fund grows. The Trustees observed that at its low asset levels, the advisory fee of the International Equity Fund did not, at this time, actually reflect those economies of scale. The Trustees also considered that the Mid‐Cap and International Equity Funds would continue to benefit from their expense limitation arrangements until the Funds’ assets grew to a level where the Funds’ expenses fell below the cap set by the arrangement and the Advisor began receiving its full fee. The Trustees noted that the Small Company Fund was currently operating at very low expense levels and that, as a result, the expense limitation arrangement that was in place for that Fund did not actually provide any current benefits of economies of scale to the shareholders. Following further discussion of the Funds’ asset levels, expectations for growth, and fee levels, the Board of Trustees determined, in light of all the facts and circumstances, that each Fund’s fee arrangements were fair and reasonable in relation to the nature and quality of the services provided by the Advisor, and that each Fund’s expense limitation arrangement provided potential savings for the benefit of such Fund’s investors. Advisor’s Practices Regarding Possible Conflicts of Interest and Benefits to the Advisor In considering the Advisor’s practices regarding conflicts of interest, the Trustees evaluated the potential for conflicts of interest and considered such matters as the experience and ability of the advisory personnel assigned to each Fund; the basis for soft dollar payments with broker‐dealers, including any broker‐dealers affiliated with the Advisor; the basis of decisions to buy or sell securities for the Funds and the Advisor’s other accounts; the method for bunching portfolio securities transactions; and the substance and administration of the Advisor’s code of ethics. Following further consideration and discussion, the Board of Trustees indicated that the Advisor’s standards and practices relating to the identification and mitigation of possible conflicts of interests were satisfactory. The Board of Trustees considered that the Advisor may benefit from the Funds by being able to place a smaller account with or in the Funds. Based upon all of the foregoing considerations, the Board of Trustees, including a majority of the Trustees who are not parties to any investment advisory agreement between the Trust and its investment advisers or interested persons of any such party, voting separately, approved the Agreement upon the terms and for the compensation described therein. The Independent Trustees determined that they did not have any questions that needed to be raised outside of the presence of management prior to making their determinations on the renewal of the Agreement and, as such, did not break into executive session at this time. 4. TAX DESIGNATIONS The Brown Capital Management International Equity Fund designates the following as a percentage of taxable ordinary income distributions, or up to the maximum amount allowable, for the calendar year ended December 31, 2014: Qualified Dividend Income: 79.68% Dividend Received Deduction: 14.01% The Brown Capital Management Mid‐Cap Fund designates the following as a percentage of taxable ordinary income distributions, or up to the maximum amount allowable, for the calendar year ended December 31, 2014: Qualified Dividend Income: 36.39% Dividend Received Deduction: 35.42% In early 2015, if applicable, shareholders of record received this information for the distributions paid to them by the Fund during the calendar year 2014 via Form 1099. The Fund will notify shareholders in early 2016 of amounts paid to them by the Fund, if any, during the calendar year 2015. Pursuant to Section 852(b)(3) of the Internal Revenue Code, the Brown Capital Management Small Company Fund designated $135,692,028 as long‐term capital gain dividends. Brown Capital Management Mid‐Cap Fund designated $4,188,031 as long‐term capital gain dividends. The Brown Capital Management International Equity Fund designates foreign taxes paid in the amount of $19,604 and foreign source income in the amount of $228,977 for federal income tax purposes for the year ended March 31, 2015. Annual Report | March 31, 2015
45
The Brown Capital Management Mutual Funds
Additional Information
March 31, 2015 (Unaudited)
5. MATTERS SUBMITTED TO A VOTE OF SHAREHOLDERS At a Special Meeting of the Shareholders of the Brown Capital Management Mutual Funds, (the “Trust”), held on December 11, 2014, for the purpose of voting on the Proposal of election of four Trustees to the Board of Trustees of the Trust. Nominees: Keith A. Lee, James H. Speed, Jr., Louis G. Hutt, Jr., and Claude Z. Demby. A total of 39,529,155 shares of the Brown Capital Management Funds Trust were entitled to vote on the Proposal. A total of 19,764,578 shares constituted a quorum of voters for purposes of the Proposal. A total of 25,684,420 shares were voted, representing 64.98% of total shares. Keith A. Lee 25,350,244 Votes in favor 334,175 Votes withheld Votes in favor represented 98.70% of total votes James H. Speed, Jr. 25,306,278 Votes in favor 378,142 Votes withheld Votes in favor represented 98.53% of total votes Louis G. Hutt, Jr. 25,357,380 Votes in favor 327,039 Votes withheld Votes in favor represented 98.73% of total votes Claude Z. Demby 25,366,323 Votes in favor 318,096 Votes withheld Votes in favor represented 98.76% of total votes 46
www.browncapital.com
The Brown Capital Management Mutual Funds
Trustees and Officers
March 31, 2015 (Unaudited)
The Trustees are responsible for the management and supervision of the Funds. The Trustees set broad policies for the Funds and choose the Funds’ officers. The Trustees also approve all significant agreements between the Trust, on behalf of the Funds, and those companies that furnish services to the Funds; review performance of the Advisor and Funds; and oversee activities of the Funds. Generally, each Trustee and officer serves an indefinite term or until certain circumstances such as their resignation, death, or otherwise as specified in the Trust’s organizational documents. Any Trustee may be removed at a meeting of shareholders by a vote meeting the requirements of the Trust’s organizational documents. The Statement of Additional Information of the Funds includes additional information about the Trustees and officers and is available, without charge, upon request by calling the Funds toll‐free at 1‐877‐892‐4226. The address of each Trustee and officer, is 1201 N. Calvert Street, Baltimore, Maryland 21202. Name, Age,
And Address
Position(s) Held
with Fund/Trust
Length of Time
Served
Principal Occupation(s)
During Past 5 Years
Number of
Portfolios
in Fund
Complex
Overseen
by Trustee
Other Directorships
Held by Trustee During
Past 5 Years
Independent Trustees
James H. Speed, Jr., 61 Trustee, Chairman Since September 2002 President and CEO of NC Mutual Insurance Company (insurance company) since May 2003; President of Speed Financial Group, Inc. (consulting/private investments) from March 2000 to April 2003. 3 Independent Trustee of the following: Starboard Investment Trust for its 28 series; Hillman Capital Management Investment Trust for its one series; WST Investment Trust for its two series; and Centaur Mutual Funds for its one series (all registered investment companies). Member of Board of Directors of NC Mutual Life Insurance Company. Member of Board of Directors of M&F Bancorp and Investors Title Company. Previously, Independent Trustee of New Providence Investment Trust for its one series from 2009 to 2011 (registered investment company). Louis G. Hutt, Jr., 60 Trustee Since October 2014 Managing Member of The Hutt Co., LLC (certified public accountants) from 1983 to present; Managing Member of The Hutt Law Firm (from 1983 to present). 3 Member of Board of Trustees and Chair of Audit Committee of Washington University, St. Louis; Member of the Board of Directors, Advance Bank of Baltimore. Claude Z. Demby, 50 Trustee Since October 2014 President and CEO of Noël Group (international group of manufacturing businesses) from 2008 to present. 3 Chair Elect, Raleigh Chamber of Commerce; Chairman of the Board, Federal Reserve Bank of Richmond‐
Charlotte Branch; Director, Board of Advisors, Duke‐Raleigh Hospital; Director, Board of Advisors, Valour Academy Schools. Interested Trustees* Keith A. Lee, 54 Trustee; President and Principal Executive Officer, the Funds Trustee since June 2002; Vice President since 1992; Principal Executive Officer since 2002 President and Chief Operating Officer of Brown Capital Management, LLC (advisor of the Funds); previously Managing Director/Senior Portfolio Manager of Brown Capital Management, LLC. 3 None * Basis of Interestedness: Mr. Lee is an Interested Trustee because he is an officer of Brown Capital Management, LLC, the advisor of the Funds. Annual Report | March 31, 2015
47
The Brown Capital Management Mutual Funds
Trustees and Officers
Name, Age,
And Address
Position(s) Held
with Fund/Trust
Length of Time
Served
Principal Occupation(s)
During Past 5 Years
March 31, 2015 (Unaudited)
Number of
Portfolios
in Fund
Complex
Overseen
by Trustee
Other Directorships
Held by Trustee During
Past 5 Years
Other Officers
Robert Young, 45 Vice President
Since 2011
Managing Director/Co‐Director of Marketing, Brown Capital Management, LLC, April 1999 to present.
n/a
n/a
John H. Lively, 46 Secretary
Since 2011
Attorney, The Law Offices of John H. Lively & Associates, Inc. (law firm), March 2010 to present: Attorney, Husch Blackwell Sanders LLP (law firm), March 2007 to February 2010; Managing Attorney, Raymond James Financial (financial services), September 2005 to March 2007; Assistant General Counsel, AIM Investments (investment advisor), October 2000 to September 2005.
n/a
n/a
Cecil Flamer, 68 Treasurer, and Principal Financial Officer
Since 2011
Managing Director, Chief Administrative Officer, CPA, Brown Capital Management, LLC, July 2004 to present.
n/a
n/a
Julian G. Winters, 46
Chief Compliance Since 2004
Officer
Managing Member of Watermark Solutions, LLC (investment compliance and consulting) since March 2007.
n/a
n/a
48
www.browncapital.com
Must be accompanied or preceded by a prospectus.
Funds distributed by ALPS Distributors, Inc. 1290 Broadway, Suite 1100, Denver, CO 80203


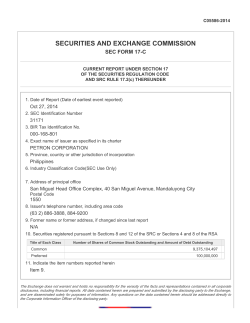
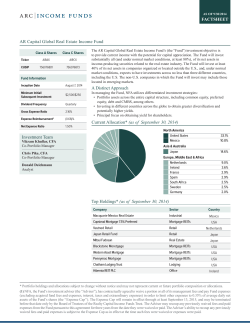

© Copyright 2026